Embed Size (px)
Citation preview
TREATMENT OF WATER USING HYBRID OZONATION-
MEMBRANE SYSTEM

FORMATION OF BROMATE AND OTHER BROMINATED DISINFECTION BYPRODUCTS DURING
THE TREATMENT OF WATERS USING A HYBRID OZONATION-MEMBRANE FILTRATION SYSTEM
By
MOHAMMADREZA MOSLEMI
B.Sc., M.Sc.
A Thesis Submitted to the School of Graduate Studies
in Partial Fulfillment of the Requirements for the
Degree Doctor of Philosophy
McMaster University
© Copyright by Mohammadreza Moslemi
August 2011
Doctor of Philosophy (2011) McMaster University
Civil Engineering Hamilton, Ontario
Title: Formation of Bromate and Other Brominated Disinfection
Byproducts during the Treatment of Waters Using a Hybrid
Ozonation-Membrane Filtration System
Author: Mohamamdreza Moslemi
M.Sc. (Sharif University of Technology)
B.Sc. (Sharif University of Technology)
Supervisor: Dr. Susan J. Masten
Number of Pages: xxiii, 181
ii
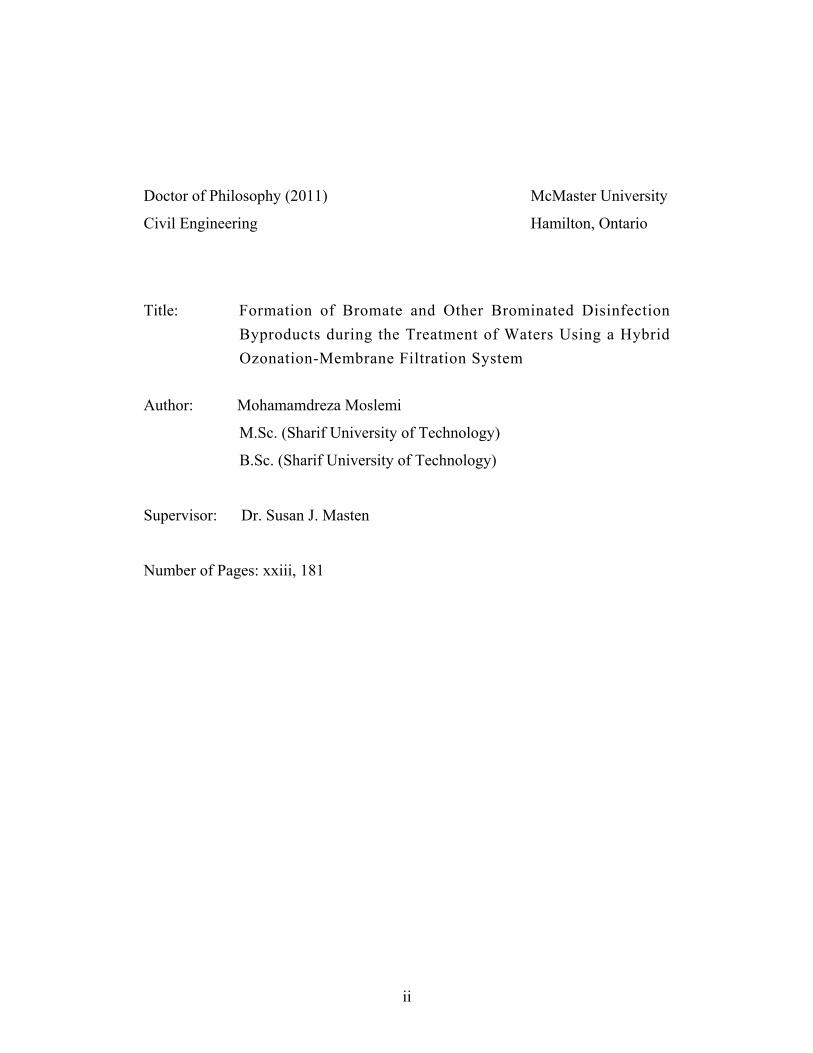
Abstract
In this research, ozone hydrodynamics and disinfection by-products formation in
a novel hybrid ozonation-ceramic membrane filtration system was studied to
minimize membrane fouling while also ensuring that the system meets regulatory
criteria for disinfection by-products. The influence of important operating
parameters including inlet ozone mass injection rate, initial bromide
concentration, membrane molecular weight cut off (MWCO), membrane coating,
hydroxyl radical scavenger (t-butanol), pH, and temperature on bromate
concentration in the absence and presence of natural organic matter (NOM) was
examined. Experiments were also conducted under various operating conditions
to investigate the formation of total trihalomethanes (TTHMs) and halo-acetic
acids (HAAs) in the water distribution system due to post chlorination. Moreover,
variations in the TOC, UV254, color and turbidity with respect to operating
parameters were monitored.
Bromate and TTHMs formation increased with increasing ozone mass
injection rate, and initial bromide concentration. An increase in the bromate
concentration was observed with decreasing membrane MWCO. Less bromate
and TTHM was formed with the coated membrane and t-butanol significantly
reduced bromate and TTHM formation. Bromate formation decreased
significantly with decreasing pH. Increasing the temperature resulted in enhanced
bromate formation. NOM exerted a favorable effect on bromate formation as the
iii

bromate concentration was observed to decrease as the NOM content was
increased.
Experimental results indicated that ozonation can greatly reduce color and
turbidity of water and can be used to overcome membrane fouling. Ensuring a
minimum ozone residual in the system enables the continuous treatment of water
at a relatively high permeate flux (up to 85% of the clean water flux) and
eliminates the need for membrane cleaning procedures.
An empirical model was developed to predict bromate formation in the hybrid
ozone- membrane system (R2=0.903). Theoretical models were developed to
estimate the rate of bromate formation and to describe the ozone mass transfer in a
hybrid system. In all cases, good correlation between the model predictions and the
experimental data was achieved.
iv
Acknowledgements
I would like to express my sincerest gratitude to those individuals who without
their help this work would not have been possible.
First and foremost, I would like to express my utmost gratitude to my research
supervisor, Dr. Susan J. Masten and also Dr. Simon H. Davies for their excellent
guidance, support, and patience through out my research. I am also extremely
thankful to the members of the supervisory committee, Dr. Sarah Dickson and Dr.
Carlos Filipe for their valuable guidance and kind supports throughout this
research work.
I wish to express my deep appreciation to Mrs. Anna Robertson, the supervisor
of the environmental lab, for her technical advice and assistance during the
experimental phases of this research.
I also acknowledge the financial support from the National Science
Foundation, the Natural Sciences and Engineering Research Council of Canada
and the Department of Civil Engineering at McMaster University.
Finally and most importantly, I am indebted to my family for their constant
support and encouragement. This thesis is dedicated to my parents, Simin and Ali,
for their unconditional love and support.
v
Table of Contents
Abstract iii
Acknowledgements v
Table of Contents vi
List of Tables x
List of Figures xii
List of Abbreviations xvi
Summary of Publications xix
Declaration of Academic Achievement xxi
1. Introduction 1
1.1. Drinking Water Treatment Methods 1
1.1.1. Conventional Methods 1
1.1.2. Advent of Membrane Technology 3
1.1.3. Fouling: Major Drawback 6
1.2. Hybrid Ozonation-Membrane System 9
1.2.1. Ozonation as a Solution to Fouling 9
1.2.2. Additional Benefits of Ozonation 11
1.3. Research Summary 13
1.3.1. Research Significance 13
1.3.2. Theory & Background 16
1.3.3. Historical Perspective 27
1.3.4. Strategies to Cope with BrO3- Formation 30
1.3.5. Objectives & Scope of Research 34
vi
2. Ozone Mass Transfer in a Recirculating Loop Semibatch Reactor Operated at High Pressure
38
2.1. Abstract 38
2.2. Introduction 39
2.3. Materials and Methods 42
2.3.1. Experimental Apparatus 42
2.3.2. Experimental Conditions 43
2.3.3. Analytical Methods 44
2.4. Determination of the Ozone Mass Transfer 45
2.5. Results and Discussion 48
2.5.1. Water Flow Rate 48
2.5.2. Inline Mixer 50
2.5.3. Inlet Ozone Gas Concentration 54
2.5.4. Inlet Gas Flow Rate 56
2.5.5. Temperature 58
2.5.9. pH 59
2.5.10. Mass Balance on Ozone 60
2.6. Conclusion 62
2.7. Acknowledgements 62
2.8. References 63
3. Bromate Formation in a Hybrid Ceramic Membrane Filtration – Ozonation
66
3.1. Abstract 66
3.2. Introduction 66
3.3. Materials and Methods 69
3.3.1. Experimental Setup 69
vii

3.3.2. Analytical Methods 72
3.3.4. Reagents 73
3.4. Results and Discussion 73
3.4.1. Effect of pH 74
3.4.2. Effect of Inlet Ozone Mass 75
3.4.3. Initial Bromide Concentration 78
3.4.5. Effect of MWCO 78
3.5. Bromate Formation Model 81
3.6. Acknowledgements 82
3.7. Supplemental Data 83
3.8. Supporting Documentation 84
3.9. References 86
4. Empirical Modeling of Bromate Formation during Drinking Water Treatment Using a Hybrid Membrane Filtration–Ozonation
90
4.1. Abstract 90
4.2. Introduction 91
4.3. Materials and Methods 94
4.4. Results and Discussion 95
4.4.1. The Role of the Hydroxyl Radical 95
4.4.2. Membrane Coating 97
4.4.3. Temperature 99
4.5. Empirical Model for Bromate Formation 100
4.6. Model Validation 102
4.7. Conclusion 104
4.8. Supporting Documentation 107
4.9. References 110
viii
5. Disinfection By-products Formation in the Presence of NOM in a Hybrid Ceramic Membrane Filtration – Ozonation
117
5.1. Abstract 117
5.2. Introduction 118
5.3. Materials and Methods 121
5.3.1. Experimental Setup 121
5.3.2. Analytical Methods 124
5.3.3. Reagents 127
5.4. Results and Discussion 128
5.4.1. Effect of Inlet Ozone Mass 129
5.4.2. Effect of Initial Bromide Concentration 132
5.4.3. Effect of NOM Concentration 134
5.4.4. Effect of Ph 136
5.4.5. Effect of OH Radical Scavengers 138
5.4.6. Effect of Membrane Coating 141
5.4.7. Effect of MWCO 145
5.4.8. Fouling 149
5.5. Empirical Bromate Model 151
5.6. References 154
6. Conclusions and Recommendations 158
6.1. Conclusions 158
6.2. Recommendations for Future Research 162
6.3. Implications of Research for Full-scale Operation 163
References 165
Appendix 178
ix

List of Tables
Chapter 1:
Table 1- Drinking water regulations and guidelines for DBPs.
15
Table 2- Reactions occurring during ozone self-decomposition.
21
Table 3- Reactions and rate constants involved in bromate formation via molecular ozone pathway.
24
Table 4- Reactions and rate constants involved in bromate formation via hydroxyl radical pathway.
26
Chapter 2:
Table 1- Dimensionless Henry’s law constants. 48
Table 2- Water flow rates versus flow regime. 49
Table 3- KLa values calculated by modelling experimental results at various water flow rates.
50
Table 4- KLa values calculated by modelling experimental results under various mixing conditions.
54
Table 5- KLa values calculated by modelling experimental results at various gaseous ozone concentrations.
56
Table 6- KLa values calculated by modelling experimental results at various inlet gas flow rates.
57
Table 7- Ozone uptake at various inlet gas flow rates. 58
Table 8- KLa values calculated by modelling experimental results at various temperatures.
59
Chapter 3:
Table 1- Steady state bromate concentration in the permeate under various operating conditions
74
Table 2- Steady state [BrO3-] at various MWCOs 79
x

Table 3- Retention time in the membrane for various MWCOs
80
Table 4- Rate constants for the formation of bromate in the hybrid ozonation-membrane system
82
Chapter 4:
Table 1- Steady state aqueous [O3] at various pH values. 98
Table S1- Steady state bromate concentration in the permeate under various operating conditions
110
Chapter 5:
Table 1- TTHMs concentrations in the permeate under various operating conditions.
128
Table 2- Effects of MWCO, [NOM] and O3 dosage on permeate flux.
150
xi

List of Figures
Chapter 1:
Fig. 1- Typical pore size of various membrane filtration processes.
5
Fig. 2- Permeate flux decline due to fouling. 8
Fig. 3- Bromate formation diagram during ozonation of Br- containing waters.
25
Chapter 2:
Fig. 1- Schematic of the experimental apparatus. 44
Fig. 2- Simplified control volume for modeling ozone mass transfer.
45
Fig. 3- Dissolved ozone concentration vs. time at various water flow rates.
50
Fig. 4- Dissolved ozone concentration versus time - The effect of inline mixer.
53
Fig. 5- Dissolved ozone concentration versus time at various gaseous ozone concentrations.
55
Fig. 6- Dissolved ozone concentration versus time at various inlet gas flow rates.
57
Fig. 7- Dissolved ozone concentration versus time at various temperatures.
59
Fig. 8- Dissolved ozone concentration versus time at various pH vales.
60
Chapter 3:
Fig. 1- Bromate formation - Molecular ozone and hydroxyl radical pathways.
69
Fig. 2- Schematic of the experimental setup. 70
Fig. 3- Bromate concentration in the permeate vs. time at various pH values.
75
xii
Fig. 4- Dissolved ozone concentration in the permeate vs. time at various inlet O3 mass rates.
76
Fig. 5- Bromate concentration in the permeate vs. time at various inlet O3 mass rates.
77
Fig. 6- Steady state bromate concentration in the permeate vs. steady state aqueous O3 concentration.
77
Fig. 7- Steady state bromate concentration in the permeate vs. initial bromide concentration.
78
Fig. 8- Steady state bromate concentration in the permeate vs. retention time in the membrane.
80
Fig. S1- Bromate concentration in the permeate vs. time at various initial bromide concentrations.
83
Fig. S2- Bromate concentration in the permeate vs. time at various MWCOs.
84
Chapter 4:
Fig. 1- Formation of bromate in aquatic systems. 92
Fig. 2- The effect of •OH scavenger on the steady state bromate and ozone concentrations in the permeate at various pHs.
96
Fig. 3- Steady state bromate concentration in the permeate vs. pH.
99
Fig. 4- Bromate concentration in the permeate vs. time at various temperatures.
100
Fig. 5- Predicted bromate concentration vs. observed values.
103
Fig. 6- Measured and simulated bromate concentrations vs. contact time.
104
Fig. 7- Measured and simulated bromate concentrations vs. contact time.
104
Fig. 8- Measured and simulated bromate concentrations vs. contact time.
105
Fig. 9- Measured and simulated bromate concentrations vs. contact time.
105
Fig. S1- The effect of •OH scavenger on the dissolved ozone concentration in the permeate vs. time at various pHs.
108
xiii

Fig. S2- The effect of •OH scavenger on the bromate concentration in the permeate vs. time at various pHs.
108
Fig. S3- Bromate concentration in permeate vs. time at various pH values.
109
Fig. S4 - Bromate concentration in the permeate vs. time in the presence of t-BuOH.
109
Chapter 5:
Fig. 1- Schematic of the experimental setup. 124
Fig. 2- Bromate concentration in the permeate vs. time at various inlet ozone mass injection rates.
130
Fig. 3- Percent reduction in the steady state DBPs concentration at various inlet ozone mass rates.
131
Fig. 4- Percent reduction at various inlet ozone mass rates. 131
Fig. 5- Bromate concentration in the permeate vs. time at various initial bromide concentrations.
133
Fig. 6- Percent reduction in DBPs concentration at various initial bromide concentrations.
133
Fig. 7- Bromate concentration in the permeate vs. time at various NOM concentrations.
135
Fig. 8- Percent reduction at various NOM concentrations. 135
Fig. 9- Bromate concentration in the permeate vs. time at various pHs.
137
Fig. 10- Percent reduction in DBPs concentration at various pHs.
137
Fig. 11- Percent reduction at various NOM concentrations. 138
Fig. 12- Bromate concentration in the permeate vs. time in the presence of scavenger.
140
Fig. 13- Percent reduction in DBPs concentration in the presence of scavenger.
140
Fig. 14- Percent reduction in the presence of scavenger. 141
xiv

Fig. 15- Bromate concentration in the permeate vs. time. The effect of membrane coating.
143
Fig. 16- Percent reduction in DBPs concentration. The effect of membrane coating.
144
Fig. 17- Percent reduction. The effect of membrane coating.
144
Fig. 18- Bromate concentration in the permeate vs. time using various MWCOs.
146
Fig. 19- Percent reduction in DBPs concentration using various MWCOs.
147
Fig. 20- Percent reduction using various MWCOs. 147
Fig. 21- Percent reduction in color using various MWCOs. 148
Fig. 22- Percent reduction in turbidity using various MWCOs.
148
Fig. 23- Percent reduction in UV254 using various MWCOs. 149
Fig. 24- Effect of ozone dosage on permeate flux. 151
Fig. 25- Predicted bromate concentration vs. observed values.
153
Fig. A1- Experimental apparatus: Hybrid ozoantion – membrane filtration.
178
Fig. A2- High-pressure stainless steel tank. 179
Fig. A3- Water coil inside the tank. 180
Fig. A4- Ceramic membranes (from left to right: one, three and seven channel).
181
xv

List of Abbreviations
Al2O3 Aluminum oxide
AOP Advanced oxidation process
bi Regression coefficients
Br- Bromide ion
BrO3- Bromate ion
C O3 concentration in the bulk water
CG Inlet O3 gas concentration
CHBr2Cl Dibromochloromethane (DBCM)
CHBr3 Bromoform (TBM)
CHBrCl2 Bromodichloromethane (BDCM)
CHCl3 Chloroform (TCM)
Cin Concentration of bromate in the inflow into the
CO32- Carbonate
CP Concentration of bromate in the permeate
CR Concentration of bromate in the retentate
Cs Aqueous O3 concentration at equilibrium with the inlet O3 gas concentration (CG)
Css Steady state ozone concentration in the reactor
DBPs Disinfection by-products
DDI Distilled deionized water
DOC Dissolved organic carbon
F Bleed flow rate
Fe Iron
Fe2O3 Iron oxide
H′ Dimensionless Henry’s law constant
H3PO4 Phosphoric acid
HAAs Halo acetic acids
xvi

HCO3- Bicarbonate
HO Hydroxyl
HO• Hydroxyl radicals
HOBr Hypobromous acid
J Steady state permeate flux
k First order rate constant
kD kilo Dalton
KLa Overall mass transfer coefficient
MCL Maximum contaminant level
MF Microfiltration
Mn Manganese
MWCO Molecular weight cut off
NaOH Sodium hydroxide
NF Nanofiltration
NOM Natural organic matter
O3 Ozone
OBr- Hypobromite ion
OH¯ Hydroxyl ion
PES Polyethersulfone
pKa Dissociation constant
PP Polypropylene
PS Polysulfone
PVDF Polyvinylidene fluoride
Q Flow rate
QB Bleed flow rate
Qin Inlet flow rate
QP Permeate flow rate
R Universal gas constant
xvii

Re Reynolds number
RO Reverse osmosis
SUVA Specific UV absorbance
t Time
T Water temperature
t-BuOH Tertiary butyl-alcohol
THMs Trihalomethanes
TiO2 Titanium dioxide
TMP Trans-membrane pressure
TOC Total organic carbon
UF Ultrafiltration
USEPA United States Environmental Protection Agency
UV Ultraviolet
UV254 UV absorbance at a wavelength of 254nm
V Total volume of water in the system
v Cross flow velocity
V0 Initial volume of water in the reactor
Vmp Total volume of the membrane
Vmp Porous volume
VP Total volume of the membrane pores
WHO The World Health Organization
Wm Weight of the membrane
ZrO2 Zirconium dioxide
θ Retention time in the membrane
ρ Density of the ceramic membrane material
τ Retention time in the entire system
xviii

Summary of Publications
This thesis consists of the following papers:
Paper I
Moslemi, M., Davies, H.S., Masten, S.J. (2010) Ozone Mass Transfer in a
Recirculating Loop Semibatch Reactor Operated at High Pressure. Journal of
Advanced Oxidation Technologies, 13 (1) 79-88.
Preface: In this article the effects of water flow rate, mixing, gaseous ozone
concentration, inlet gas flow rate, temperature, and pH on ozone hydrodynamics
in a recirculating loop semibatch reactor under high pressure is studied. A
mathematical model was also developed to describe the ozone mass transfer in the
corresponding reactor.
Paper II
Moslemi, M., Davies, H.S., Masten, S.J. (2011) Bromate Formation in a Hybrid
Ozonation – Ceramic Membrane Filtration System. Water Research, 45, 5529-5534.
Preface: In this paper the effect of pH, inlet ozone mass rate, initial bromide
concentration, and membrane molecular weight cut off (MWCO) on bromate
formation in a hybrid membrane filtration–ozonation reactor is discussed. A
model to estimate the rate of bromate formation was also developed.
xix

Paper III
Moslemi, M., Davies, H.S., Masten, S.J. Empirical Modeling of Bromate
Formation during Drinking Water Treatment Using a Hybrid Membrane Filtration
– Ozonation. Journal of Membrane Science, Submitted for publication, 2011.
Preface: The existing work studies the influence of the nature of the membrane
surface, hydroxyl radical scavengers, and temperature, on bromate formation in a
hybrid membrane filtration–ozonation reactor. An empirical model was also
developed using multiple linear regression method to predict bromate formation
in a hybrid ozone-ceramic membrane filtration system. The model, takes into
account the effects of important experimental variables including initial bromide
concentration, inlet ozone mass rate, pH, temperature, and reaction time.
Paper IV
Moslemi, M., Alpatova, A.A., Byun, S., Davies, H.S., Masten, S.J. Disinfection
By-products Formation in the Presence of NOM in a Hybrid Ceramic Membrane
Filtration – Ozonation. To be submitted for publication.
Preface: This research investigates the effect of pH, inlet ozone mass injection rate,
natural organic matter concentration, initial bromide concentration, membrane
coating, hydroxyl radical scavenger, and membrane molecular weight cut off on the
formation of disinfection by-products (including bromate, trihalomethanes, and
halo acetic acids) in a hybrid membrane filtration–ozonation reactor.
xx

Declaration of Academic Achievement
This thesis has been prepared in accordance with the regulations for a “Sandwich”
thesis format or as a compilation of papers stipulated by the Faculty of Graduate
Studies at McMaster University and has been co-authored.
Chapter 2: Ozone Mass Transfer in a Recirculating Loop Semibatch
Reactor Operated at High Pressure
M. Moslemi: Designed and constructed a bench-scale experimental apparatus;
conducted laboratory experiments and analysis the effects of water flow rate, mixing,
gaseous ozone concentration, inlet gas flow rate, temperature, and pH on ozone
hydrodynamics at high pressure; collected and analyzed data; developed a
mathematical model to describe the ozone mass transfer; prepared the journal paper.
Dr. S.J. Masten and Dr. S.H. Davies: Supervised the research work; reviewed
and revised the journal paper.
This work has been printed with written permission from the Journal of Advanced
Oxidation Technologies.
Chapter 3: Bromate Formation in a Hybrid Ozonation – Ceramic
Membrane Filtration System
M. Moslemi: Designed and constructed a bench-scale experimental apparatus;
conducted laboratory experiments and analysis to study the effect of pH, inlet ozone
mass rate, initial bromide concentration, and membrane molecular weight cut off on
xxi
bromate formation; collected and analyzed data; developed a model to estimate the rate
of bromate formation in the reactor tested; prepared the above named journal paper.
Dr. S.J. Masten and Dr. S.H. Davies: Supervised the research work; reviewed
and revised the journal paper.
Chapter 4: Empirical Modeling of Bromate Formation during Drinking Water
Treatment Using a Hybrid Membrane Filtration – Ozonation
M. Moslemi: Designed and constructed a bench-scale experimental apparatus;
conducted laboratory experiments and analysis to investigate the effect of the nature
of the membrane surface, hydroxyl radical scavengers, and temperature, on
bromate formation; collected and analyzed data; developed an empirical model to
predict bromate formation in a hybrid ozone-ceramic membrane filtration system;
prepared the journal paper.
Dr. S.J. Masten and Dr. S.H. Davies: Supervised the research work; reviewed
and revised the journal paper.
Chapter 5: Disinfection By-products Formation in the Presence of NOM
in a Hybrid Ceramic Membrane Filtration – Ozonation
M. Moslemi: Designed and constructed a bench-scale experimental apparatus;
conducted laboratory experiments and analysis to study the influence of pH, inlet
ozone mass injection rate, natural organic matter concentration, initial bromide
concentration, membrane coating, hydroxyl radical scavenger, and membrane
molecular weight cut off on the formation of disinfection by-products including
xxii

xxiii
bromate, trihalomethanes and halo acetic acids in a hybrid ozonation-membrane
system; collected and analyzed data; prepared the journal paper.
A.A. Alpatova and S. Byun: Measured TTHMs and HAAs in the samples which
they were provided.
Dr. S.J. Masten and Dr. S.H. Davies: Supervised the research work; reviewed
and revised the journal paper.
Ph.D. Thesis – M. Moslemi McMaster University – Civil Engineering
Chapter 1: Introduction
1.1. Drinking Water Treatment Methods
1.1.1. Conventional Methods
Various conventional treatment methods are available for water purification,
each being suitable for waters with a particular origin and type of contamination.
Therefore, a combination or series of methods is usually used to effectively treat
the water and meet the applicable water regulations. Common conventional water
treatment steps can be classified as follows [1]:
1- Screening
2- Coagulation/flocculation/sedimentation
3- Granular media filtration
4- Disinfection
Although conventional water treatment has high productivity, such methods are
associated with a number of drawbacks, which may in part limit their application.
Conventional methods, involving coagulation/flocculation, usually include
considerable amounts of chemical addition, which results in large volumes of
sludge, which must be further treated and disposed of. Chemical addition often
requires extensive safety precautions. In addition, these processes may be
insufficient to ensure compliance with the current and future rigorous standards,
especially when low quality water supplies are employed [2,3]. Moreover, finished
1

Ph.D. Thesis – M. Moslemi McMaster University – Civil Engineering
water quality obtained from these methods is largely subject to knowledge,
experience and judgment of the operators who are monitoring the treatment
process, which could bring about disasters as happened in Milwaukee in 1993.
The year of 1993 is considered to be a turning point in the recent history of
water treatment owing to the incident occurred in that year. Cryptosporidium
oocysts passed through the conventional treatment system (granular media filters)
in Milwaukee, Wisconsin. This incident in turn, caused over 400,000 illnesses and
almost 100 deaths. It was not long after that engineers and designers tried to
develop and employ more sophisticated water treatment methods, which can
prevent the repeat of such tragic incidents. Membrane filtration is one of the
processes that, due to its numerous advantages has attracted great attention since
1993 [1,4,5]. Membranes exclude and thus remove microorganisms and pollutants
according to their size and irrespective of raw water quality, and operator
judgment. Hence, a revolution in treatment strategies has been brought about by
the advent of membranes.
As the world’s population continues to increase and anthropogenic chemicals
are released into our water supplies, the quality of water continues to deteriorate,
leading to a reduction in the number of suitable drinking water supplies.
Population growth has also given rise to higher demands for safe drinking water.
At the same time, water quality regulations have been tightened and the public has
become both more knowledgeable and more discriminating regarding water
quality [6]. These facts have in turn emphasized the necessity for development of
2
Ph.D. Thesis – M. Moslemi McMaster University – Civil Engineering
safe and effective water treatment strategies, which has in turn made water
utilities use robust treatment methods such as membrane filtration.
1.1.2. Advent of Membrane Technology
Throughout the last century, membrane technology has been one of the most
important developments in the history of drinking water treatment since
chlorination and filtration. Microporous membranes were first patented in 1922
and their application was, until the 1950s, limited to laboratory investigations.
The first interest in the application of membranes for potable water treatment was
in the 1980s as drinking water facilities and regulators became increasingly
concerned about microbial contamination [6,7]. In the past 15 years, membrane
filtration has proved to be a safe and reliable technology offering high quality
drinking water that complies with the stringent regulatory requirements. Over the
same period, operational costs of membrane filtration utilities have dropped
significantly due to advances in technology and mass production of membranes,
which made membrane technology cost competitive with conventional treatment
methods [2].
The initial motivation to use membranes for water treatment was to remove
turbidity and microorganisms from raw water. Membranes are semi-permeable
and usually porous barriers, which are permeable to some constituents of the feed
stream (water) and almost impermeable to others (impurities), and hence they can
selectively exclude and remove impurities from raw water. The predominant
3
Ph.D. Thesis – M. Moslemi McMaster University – Civil Engineering
membrane filtration mechanism and driving force that are employed in water
industry are size exclusion and pressure, respectively.
Membranes have gained widespread applications in drinking water industry
including, disinfection and microorganisms removal, particle/turbidity removal,
desalination of sea/brackish water, water softening, color removal, and etc, which
can be accomplished through various types of pressure driven membrane
processes [8]:
- Microfiltration (MF) - Ultrafiltration (UF)
- Nanofiltration (NF) - Reverse osmosis (RO)
Due to different pore sizes and molecular weight cut off values (MWCO), various
membrane processes strain solutes of different sizes. Figure 1 indicates the typical
pore dimensions and operating conditions for the processes mentioned above.
Membranes used in water treatment applications can be fabricated from
various materials including polymers (such as polypropylene (PP), polysulfone
(PS), polyethersulfone (PES) and polyvinylidene fluoride (PVDF)), and inorganic
materials such as ceramics [9]. Owing to the various advantages offered by
pressure-driven membrane modules, their application in surface water treatment
has dramatically increased within the past few decades and a large number of
membrane filtration plants have been constructed during the last two decades.
Although at present, granular media filtration is the most widely used filtration
technology throughout the world, the intense development of membrane filtration
units is expected to continue [6].
4

Ph.D. Thesis – M. Moslemi McMaster University – Civil Engineering
Membrane filtration has several advantages that make it very suitable and
promising in terms of drinking water production [10-12]:
- Effective rejection/removal of impurities (suspended solids, turbidity,
microorganisms)
- High quality water production (complying with the strict drinking water
regulations)
- Less chemical reagent and disinfectant consumption (by avoiding
coagulation/flocculation step)
- Less waste production
Reverse osmosis
Nanofiltration
Ultrafiltration
Conventional filtration
Microfiltration
Pore size (m)
10-10 10-7 10-6 10-5 10-4 10-3 10-210-9 10-8
Ionic range Micron range Fine particle range
Macromolecular range
Coarse particle range
Fig. 1- Typical pore size of various membrane filtration processes. Adapted from [14].
5

Ph.D. Thesis – M. Moslemi McMaster University – Civil Engineering
- More compact construction (requiring smaller footprints)
- Easier operational control (having the capability to be automated)
In spite of all these advantages, membrane processes suffer from a major
drawback, which is dealt with in the following section.
1.1.3. Fouling: Major Drawback
One of the major challenges associated with the operation of membrane
filtration plants is dealing with the fouling problem, which is brought about by
natural organic matter (NOM) and some inorganic species present in the water
body [8,10,13].
Fouling is the adsorption or deposition of solute molecules (NOM) or
particulate material on the membrane surface or within the pores due to
electrostatic adsorption, hydrophobic interactions or van der Waals forces [14,15].
Larger particles, which are removed by sieving, will deposit on the membrane
surface and block the pores (surface cake formation), while smaller particles will
diffuse into the pores and attach to the walls, thus restricting or blocking the
pathways [16,17]. The typical fouling mechanisms are internal fouling (deposition
of NOM within the membrane pores) and or external fouling (deposition of NOM
on the membrane surface) [14]. Fouling can adversely affect the performance of
membrane systems in following ways:
- Decline in the permeate flux and concomitant drop in productivity
- Need for membrane cleaning and recovery followed by a pause in the operation
- Reduction in membrane lifetime due to successive cleaning and irreversible fouling
6
Ph.D. Thesis – M. Moslemi McMaster University – Civil Engineering
- Increase in energy consumption and operational costs
- Change in rejection of various ions
As it is depicted in Figure 2, as a result of fouling, the permeate flux drops
appreciably. Therefore, to maintain a constant flux and compensate for the fouling
effect, the operating pressure has to be continually increased.
The two strategies that are often employed in drinking water utilities to treat
fouled membranes include back-flushing and chemical cleaning [18]. The former
involves pushing clean water through the membrane in the reverse direction, from
the permeate-side to the feed-side, in order to dislodge foulants. The latter, includes
soaking the clogged membrane in chemical cleaning agents such as acids and bases
to detach and remove foulants from the membrane surface and pores. Because of
the cost, time loss and difficulty incurred by cleaning and or back-flushing of fouled
membranes in large filtration plants, it is preferable to find a way to prevent and
suppress membrane fouling. As an alternative method, ozonation has shown to be
very effective in terms of membrane fouling prevention and removal [19-22].
Considering the oxidative nature of ozone, it is necessary that membrane is made of
ozone resistant materials such as Teflon or ceramic. Hence, a hybrid
membrane/ozonation system, which will be subsequently discussed in more detail,
was proposed by Masten and colleagues [13].
7

Ph.D. Thesis – M. Moslemi McMaster University – Civil Engineering
Concentration polarization and initial rapid fouling
Slow long-term fouling
Time
Flux
Fig. 2- Permeate flux decline due to fouling. Adapted from [14].
In the following sections, incorporation of ozonation within the membrane
filtration system and the advantages and disadvantages that ozonation could bring
about will be addressed. Afterwards, the major defect of hybrid
ozonation/membrane systems, which is the formation of disinfection by-products
(DBPs) and measures to minimize it, will be discussed. Lastly, the proposed
research project, along with the supporting theories/hypotheses and also a
summary of the research progress made thus far will be presented.
8
Ph.D. Thesis – M. Moslemi McMaster University – Civil Engineering
1.2. Hybrid Ozonation-Membrane System
1.2.1. Ozonation as a Solution to Fouling
With most surface waters, NOM is the main cause of membrane fouling [17].
Coagulation/flocculation, which involves the addition of chemicals to enhance the
coagulation process, is typically used prior to membrane filtration to partially
remove NOM from raw water and thus suppress fouling. However, especially in
case of potable water production, due to health concerns it is desirable to avoid
chemical addition as far as possible. An alternative solution to eliminating or
reducing membrane clogging during filtration is the incorporation of ozonation
into the process.
Several research groups have demonstrated that the hybrid ozonation/membrane
system can considerably overcome fouling problems and achieve substantially
higher permeate fluxes, compared to conventional membrane filtration systems.
This method allows continuous operation and eliminates the need for cleaning or
back-flushing of fouled membranes [13,18-22].
Ozone is a strong oxidant that can oxidize and decompose much of the natural
organic matter present in surface waters [19,23]. In such a hybrid system, aqueous
ozone will react with NOM deposited on the membrane surface or attached to the
pores walls, resulting in a lessening of its bond with membrane surface.
Concomitantly, water stream inside the membrane module would flush away
partly dissociated foulants and thus recovering the permeable membrane surfaces
and the clean water permeate flux [19]. Considering the oxidizing nature of
9

Ph.D. Thesis – M. Moslemi McMaster University – Civil Engineering
ozone, employed membranes have to be reasonably ozone resistant. Polymeric
membranes that are commonly used in water treatment would rapidly erode out as
a result of ozonation.
Karnik et al., 2005 [13] proposed the use of ceramic tubular membranes, which
are made of metal oxides, such as alumina, titania and zirconia, and are believed
to be ozone resistant. Despite their higher price, ceramic membranes have several
advantages over polymeric membranes such as higher thermal, chemical and
mechanical durability, capability to withstand higher pressures and longer
lifetime. Besides that, the presence of various metal oxides in their structure could
catalytically promote ozone decomposition on the membrane surface to form
hydroxyl radicals (HO•). Hydroxyl radicals contain an unpaired electron, which
gives them unusually fast reactivity. •OH is a stronger oxidant than ozone and
hence can more effectively decompose natural organic matter and remove
foulants [24].
During their investigations, Karnik and associates [13] achieved up to about
100% permeate flux recovery in a hybrid ozonation/ceramic ultrafiltration
membrane system, which was operated as a cross-flow configuration under a
constant trans-membrane pressure (TMP). According to their experimental
results, after about 12 hr the permeate flux dropped to about 60% of the initial
value, on account of membrane fouling. Thereafter, gaseous ozone was injected
into the circulating water stream for a period of 2 hr. Soon after, permeate flux
started to recover, and eventually as a result of different ozone dosages various
10
Ph.D. Thesis – M. Moslemi McMaster University – Civil Engineering
enhancements in permeate flux were achieved. The greater the ozone
concentration, the greater the permeate flux recovery. It has been exhibited that,
by applying about 12.5 (g O3 /m3 gas) over a short course, up to approximately
100% flux recovery can be obtained.
In another set of experiments, Karnik et al. [13] compared the effect of
continuous ozonation (1.5 g/m3) with that of pure oxygenation at the same gas
injection flow rates. The results imply that flux enhancement is mainly due to the
oxidative effect of ozone and hydroxyl radicals (which are formed on the
membrane surface due to ozone decomposition), and not the scouring effect of
gas sparging. Moreover, they demonstrated that ozonation at reasonably low
dosages (1.5 g/m3) allows for continuous filtration without need for frequent
chemical cleaning and back-flushing, which is a great benefit of such hybrid
processes. Some other researchers including Schlichter et al. 2004, [22] and
Mozia et al. 2005 [21] also tried hybrid ozonation/membrane filtration systems.
Their findings confirm that by maintaining a minimum ozone concentration in the
water continuous operation at relatively high permeate fluxes (almost more than
90% of the initial flux) can be maintained and the need for other cleaning
procedures can be eliminated. Ozonation offers several side advantages that make
this method highly promising and effective in terms of potable water treatment.
1.2.2. Additional Benefits of Ozonation
The application of ozone in the water industry has increased dramatically both
in quantity and diversity since the first full scale installation of ozone for the
11
Ph.D. Thesis – M. Moslemi McMaster University – Civil Engineering
treatment of potable water in Nice, France (1906) [25-28]. Other than fouling
prevention, ozonation has a number of benefits [23,29-32]:
- Disinfection and thus a reduction in final disinfectant demand
- Oxidation of organic compounds, and removal of taste, odour, and color compounds
- Removal of the precursors of some chlorination by-products, including
trihalomethanes (THMs)
- The reduction of total organic carbon (TOC) levels by mineralization
- Aid to coagulation through transformation of NOM to smaller and more polar
compounds
- Oxidation and removal of Fe (II) and Mn (II)
Nevertheless, the hybrid ozonation/membrane filtration process, like all
ozonation processes suffers from a major drawback, which is the formation of
ozonation disinfection by-products (DBPs). Oxidation of organic and inorganic
compounds (present in water) through ozonation results in the formation of a
number of by-products some of which are believed to be carcinogenic, and could
exert adverse health effects [33]. Furthermore, albeit destruction of bacteria is
much more rapid and effective by ozonation than by chlorination, ozone is very
short-lived [34]. Therefore, it is not practical to maintain adequate ozone residuals
in the distribution system to prevent bacterial regrowth. Hence, a secondary and
long-lasting disinfectant such as chlorine still needs to be added to finished water
as the last disinfection step, which could, in part, react with ozonation products to
12
Ph.D. Thesis – M. Moslemi McMaster University – Civil Engineering
form new disinfection by-products [31]. This issue and the pertinent treatment
measures are elaborated in the following sections.
1.3. Research Summary
1.3.1. Research Significance
Chlorine and its derivatives have long been used to inactivate microorganisms
present in water and thus disinfect water. Due to the ease of its application, low
price and relatively high persistence and long lifetime, chlorine disinfectants have
gained widespread use for disinfection. However, chlorination can produce a
number of by-products including trihalomethanes (THMs) and halo-acetic acids
(HAAs) which can pose adverse health effects to humans [35]. The trihalomethane
which are major chlorination by-products were first discovered in 1973 [26].
As our general knowledge about water chemistry and properties of various water
constituents increased, the focus on drinking water safety and related standards
deepened. In the last century, noticeable developments in the drinking water quality
criteria and standards can be observed and water regulations have become more and
more stringent. In the 21st century, the main focus of various drinking water
regulations is on reducing microbial contamination and exposure to chemicals with
adverse health effects and considerable attention is paid to monitoring and
suppression of disinfection by-products that are identified as health concerns. The
major chlorination and ozonation DBPs that are regulated by most drinking water
guidelines are THMs, HAAs, bromate and chlorite.
13
Ph.D. Thesis – M. Moslemi McMaster University – Civil Engineering
During the last decade, several regulatory organizations have lowered or
established new maximum contaminant levels (MCLs) for DBPs. The MCLs for
some of the DBPs of concern, which are set by the World Health Organization
(WHO), Ontario Ministry of the Environment, Guidelines for Canadian Drinking
Water Quality, USEPA and European Union Regulations are presented in Table 1
[36-41]. In 1998, the U.S. EPA tightened the U.S. drinking water regulations by
enacting a set of new guidelines, Stage 1 Disinfectant/Disinfection By-products
Rule (D/DBP), concerning disinfection by-products, which was followed by another
rule, Stage 2 D/DBP, which was promulgated in 2000 [39,40].
Under the Stage 1 D/DBP Rule, the MCL for the combination of four
trihalomethanes [TTHMs: chloroform (TCM), bromodichloromethane (BDCM),
dibromochloromethane (DBCM), and bromoform (TBM)] was lowered and new
standards for five halo-acetic acids [HAA5: monochloroacetic acid (MCA),
dichloroacetic acid (DCA), trichloroacetic acid (TCA), monobromoacetic acid
(MBA), and dibromoacetic acid (DBA)], bromate, and chlorite were established.
According to this rule, conventional treatment plants are required to employ
enhanced coagulation process to achieve desired reduction in DBPs concentration
[39]. Stage 2 of these rules does not alter MCLs mentioned in the Stage 1 DBP
Rule. However, it obligates water treatment plants to assign new sampling locations
along the distribution system in order to monitor THMs and HAA5 concentrations
at the regions that are anticipated to contain the highest levels of DBPs [40].
14

Ph.D. Thesis – M. Moslemi McMaster University – Civil Engineering
While the formation of various bromine containing by-products in
conventional ozonation systems has been studied [66-68], the formation of such
disinfection by-products in a hybrid ozonation-membrane filtration has not been
previously investigated. Hence, it is crucial to study bromate formation under
various operating conditions in such hybrid systems. In this study, the effect of
pH, inlet ozone mass injection rate, initial bromide concentration, and membrane
molecular weight cut off on bromate formation in a membrane filtration–
ozonation system was investigated.
Table 1- Drinking water regulations and guidelines for DBPs.
MCL (mg/L)
TTHMs HAA5 Regulations/
Guidelines
Year
TCM BDCM DBCM TBM MCA DCA TCA MBA DBA
Bromate Chlorite
WHO Guidelines 2006 0.30 0.06 0.10 0.10 0.02 0.05 0.20 --- --- 0.01 0.70
Ontario Safe
Drinking Water Act
2002 0.10 --- 0.01 ---
Canadian Drinking
Water Quality
2010 0.10 0.08 0.01 1.00
USEPA, Stage 1
D/DBP Rule
1998 0.08 0.06 0.01 1.00
European Union
Regulations
1998 0.10 --- 0.01 ---
15
Ph.D. Thesis – M. Moslemi McMaster University – Civil Engineering
1.3.2. Theory & Background
DBPs are formed as a result of the reaction of disinfectants with DBP
precursors. The quality (type) and quantity of produced by-products depend on
water characteristics such as TOC, pH, temperature, alkalinity, NOM and bromide
content. Moreover, parameters such as disinfectant type and dosage and contact
time are determining factors. NOM commonly serves as the organic precursor and
bromide (Br-), and iodide (I-) act as important inorganic precursors [41,42].
The most frequently reported type of chlorination DBPs are THMs, with TCM
and BDCM as the first and second most dominant species, respectively. HAAs are
the second predominant group, with DCA and TCA being the first and second
most frequently occurring species [42]. Several strategies have been proposed to
minimize chlorination by-products formation, a summary of which is presented
below:
I- Removal of precursors to chlorination DBPs, which are known to be
dissolved NOM present in the water body. Strategies including activated carbon
adsorption, ion exchange or enhanced coagulation process can be employed prior
to chlorination to eliminate a portion of NOM and precursors [43-46]. However,
such methods are costly due to the large amount of adsorbent consumed or
coagulant required and also the large volumes of sludge produced during
coagulation.
II- Reduction in the chlorine dosage or detention time, which is usually
impractical, since a minimum chlorine residuals needs to be maintained in the
16

Ph.D. Thesis – M. Moslemi McMaster University – Civil Engineering
distribution system to prevent microbial regrowth along the pipeline. Therefore,
dosage and exposure time is, to a large extent, dictated by regulatory requirements
and water quality.
III- Removal of DBPs after formation. Air stripping can be used to eliminate semi-
volatile constituents such as THM from water. Activated carbon filters can also
remove these harmful compounds via adsorption. Reverse osmosis and or
nanofiltration are other methods by which by-products could be filtered out from
water. Nevertheless, these strategies are inefficient, since any remaining NOM will
react with residual chlorine along the distribution system to regenerate DBPs [46,47].
IV- The last and the most promising method is to use an alternative and less
troublesome disinfectant which can in part reduce the concentration of
chlorination DBP precursors and also the demand for primary disinfectant. Ozone,
which is known to be far stronger than common water disinfectants and can bring
about several side advantages (see Section 2.2) was introduced to be an excellent
alternative for water disinfection. Generally speaking, the ranking of various
water disinfectants with respect to their oxidizing strength can be expressed as
follows [6,33]:
HO• > O3 > H2O2 > HOCl > ClO2 > Cl2 > O2
However as mentioned earlier, ozone lacks an essential property which restricts
its application as a primary disinfectant. According to the rate constants reported in
the literature for the reaction of ozone with a variety of compounds, and depending
17

Ph.D. Thesis – M. Moslemi McMaster University – Civil Engineering
on the water quality, the half-life of ozone in aqueous solutions is short (mostly less
than one hour) [48-50]. Hence, due to lack of persistent ozone residuals, the need
for chlorination as a final disinfection step still persists [31]. Therefore, in the
context of studying DBP formation, the impact of ozonation/membrane filtration on
the precursors of chlorination DBPs needs to be evaluated.
The chemistry of ozone in aqueous solutions and its health effects are
complicated. Reactions with ozone are largely dose and pH dependent, and hence the
magnitude of by-products formed under various conditions will vary greatly.
Nevertheless, investigations indicate that ozonation by-products overall appear to be
less harmful compared to those produced during chlorination [25,26].
Ozone is an electrophile and has a high selectivity. Due to its dipolar structure,
ozone preferentially reacts with unsaturated bonds including double bonds and
activated aromatic systems and leads to a splitting of the bond. Therefore, the
presence of electron-donating groups favours oxidation by ozone, whereas
electron-withdrawing groups may exert an opposite effect. Ozone will react faster
with certain types of aromatic compounds, e.g. those carrying electron supplying
substituents such as the hydroxyl group. If there are no such substituents or if
electron withdrawing groups such as chlorine are present, the rate of ozonation is
much slower. In general, the ionized or dissociated forms of organic compounds
react much faster with ozone than the neutral (non-dissociated) forms [13,25,51].
The reaction of ozone with organic and inorganic compounds present in water
is a complicated process and happens via a series of chain reactions. In general,
18
Ph.D. Thesis – M. Moslemi McMaster University – Civil Engineering
these reactions proceed through two pathways, which are referred to as direct and
indirect reactions. In general, ozone reacts with NOM to form simpler compounds
with lower molecular weights and higher polarities. The importance of
distinguishing between the different ozonation pathways lies in the different types
of products that they may lead to [27]. As opposed to indirect reactions, the direct
reactions of ozone with organic compounds are usually selective reactions
happening at relatively slower rates. Generally speaking, the direct pathway is
important if the indirect pathway is inhibited [25,52]. Direct ozonation of
compound M can be stated by the following general equation:
M + O3 Products
Indirect reactions involve the contribution of secondary oxidants, which are
generated as a result of ozone decomposition [25,27,53]. The most important
secondary oxidants that are produced by ozone decomposition are hydroxyl
radicals (HO•), which are much stronger oxidants than ozone and react rapidly
and non-selectively with nearly all electron-rich organic compounds [52,54,55].
M + •OH Products
Ozone decomposition and hydroxyl radical formation proceed through a series
of reactions, which can be divided into two principal mechanisms:
I- Self-decomposition (Auto-decomposition):
19

Ph.D. Thesis – M. Moslemi McMaster University – Civil Engineering
Ozone self-decomposition occurs through a chain of complicated reactions and
initiators such as hydroxide ion (OH¯) can significantly contribute to this process
[56]. Ozone decomposition in pure water has been studied by several researchers
and so far numerous pathways have been presented, a collection of which is
presented in Table 2 [54,57-61]. The overall stoichiometry of the process, which
yields hydroxyl radicals, can be written as follows:
3O3 + OH¯ + H+ 2 •OH + 4O2
II- Solute-induced decomposition:
A variety of organic solutes including humic acids, alcohols and also inorganic
solutes such as ferrous ion (Fe2+) can react with O3 to initiate the ozone
decomposition process. Therefore, such compounds that can start the ozone
decomposition chain are referred to as initiators, and in general, the type and
concentration of NOM in natural waters can considerably influence the ozone
decomposition and its transformation into hydroxyl radicals. After the
decomposition process is initiated, •OH will be generated and the continuity and
speed of the process relies on the presence of promoters such as ozone molecule
itself that can convert •OH into highly selective O2-•. On the other hand, many
inorganic and organic substances including bicarbonate and carbonate can react
with hydroxyl radicals and thus remove them from the cyclic process. By such
mechanism these compounds will scavenge •OH and terminate the chain reaction.
20

Ph.D. Thesis – M. Moslemi McMaster University – Civil Engineering
21
Such compounds that act as obstacles to ozone decomposition are referred to as
chain inhibitors [58,60,62,63].
Table 2- Reactions occurring during ozone self-decomposition [64].

Ph.D. Thesis – M. Moslemi McMaster University – Civil Engineering
Humic substances are one of the main constituents of dissolved organic matter
in natural waters and are produced by decay and leaching of organic debris.
Ozone can break down humic substances, and transform them to non-humic
substances [26,27]. Humic substances are the most important precursors of
chlorination by-products. Therefore, by such mechanism ozone contributes to
destruction of the chlorination precursors and reduces the risk of THM and HAA
formation [32]. Hence, it is suggested that, ozonation can be employed to control
and suppress the formation of chlorination by-products. Nevertheless, the
ozonation mechanism is pH dependent and it is reported that ozone is more
effective for the removal of precursors at low pHs [26]. As pH decreases, the
concentration of OH- in water decreases. Considering that OH
- is a very important
initiator of ozone decay process, pH reduction will hinder ozone decomposition
and hence ozone becomes more stable at low pHs. As a result, less hydroxyl
radicals will be generated and in turn, the indirect pathway will be suppressed.
Usually under acidic conditions (pH less than about 4) the direct pathway is
dominant, while at pH greater than about 10 the indirect pathway is the governing
mechanism. At pH about 7 both direct and indirect pathways could be important
[25,61]. Moreover, because of the high reactivity of OH radicals, the oxidation of a
particular compound M by OH radicals will occur in competition with the oxidation
of all scavengers, such as carbonate (CO32-) and bicarbonate (HCO3
-). Therefore, the
presence of •OH scavengers can also favour the direct pathway [52,53,55].
22
Ph.D. Thesis – M. Moslemi McMaster University – Civil Engineering
Aside from the impact of ozone on DBPs formation during post chlorination,
ozone itself can produce a number of DBPs, some of which can be of health
concern. Ozonation DBPs can be divided into two principal categories:
I- Organic by-products: As a result of the reaction of ozone with natural
organic compounds, a number of organic by-products including aldehydes,
ketones, carboxylic acids, and alcohols are generated, some of which are
recognized to be mutagenic [108,109]. Humic substances, which consist of humic
acids and fulvic acids, are again the main precursors of ozonation organic DBPs.
Fulvic substances have generally lower aromatic contents and molecular weights
than humic substances. Hence, humic acids are believed to be more reactive with
ozone than are fulvic acids. In addition, the production of some chlorination DBPs
has reported to be relatively higher upon chlorination of humic fraction as
compared to that of fulvic fraction [10,42].
II- Inorganic by-products: Among the inorganic by-products of ozonation,
bromate (BrO3-), which is formed during the ozonation of bromide containing
waters, is the main constituent of concern [65], which, as stated before, has been
determined to be a human carcinogen and is regulated by drinking water
guidelines [37,66,67]. As it is shown in Table 3, molecular ozone can directly
react with bromide ion (Br-) present in natural waters via a number of steps to
form bromate ion [6,68,69], and the overall reaction of the process can be written
as follows:
O3 + Br- → BrO3-
23

Ph.D. Thesis – M. Moslemi McMaster University – Civil Engineering
24
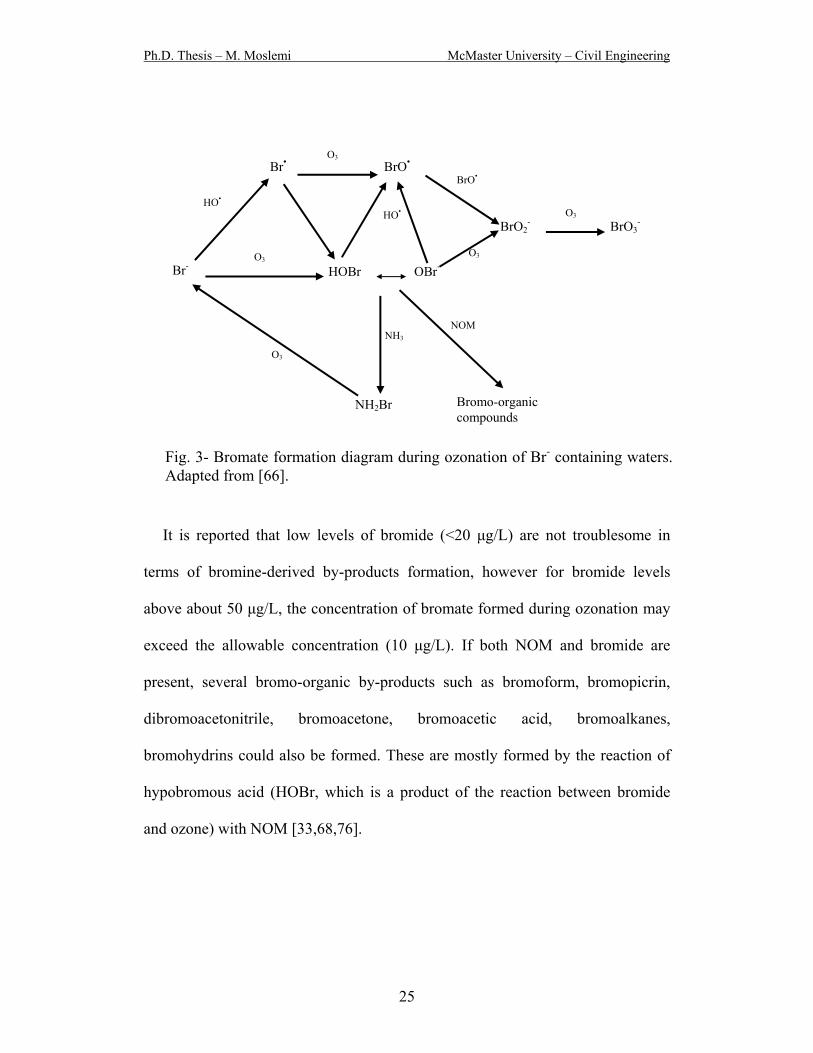
However, the actual mechanism is much more complicated and involves a
combination of series and parallel reactions, which include both direct and
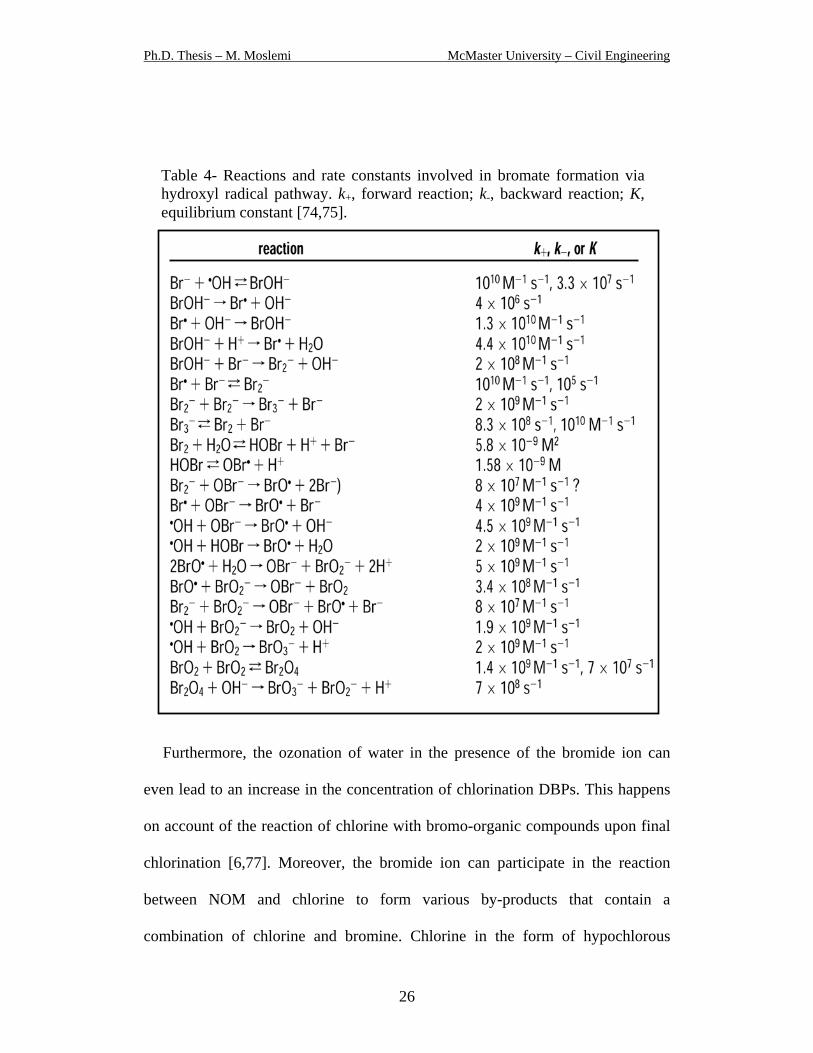
indirect ozonation pathways [42,59,62,70-72]. The reactions and the pertinent rate
constants for the hydroxyl radical pathway are presented in Table 4. von Gunten
et al., [66] also presented a diagram for bromate formation during the ozonation
of bromide containing waters. This diagram, which is shown in Figure 3, involves
both molecular ozone and hydroxyl radical reactions
Table 3- Reactions and rate constants involved in bromate formation via molecular ozone pathway [73].
Ph.D. Thesis – M. Moslemi McMaster University – Civil Engineering
Br• BrO•
It is reported that low levels of bromide (<20 μg/L) are not troublesome in
terms of bromine-derived by-products formation, however for bromide levels
above about 50 μg/L, the concentration of bromate formed during ozonation may
exceed the allowable concentration (10 μg/L). If both NOM and bromide are
present, several bromo-organic by-products such as bromoform, bromopicrin,
dibromoacetonitrile, bromoacetone, bromoacetic acid, bromoalkanes,
bromohydrins could also be formed. These are mostly formed by the reaction of
hypobromous acid (HOBr, which is a product of the reaction between bromide
and ozone) with NOM [33,68,76].
O3
Br- HOBr OBr-
BrO2- BrO3
-
HO•
HO•
O3
O3
O3
BrO•
Bromo-organic compounds
NH2Br
NOM NH3
O3
Fig. 3- Bromate formation diagram during ozonation of Br- containing waters. Adapted from [66].
25
Ph.D. Thesis – M. Moslemi McMaster University – Civil Engineering
26
Furthermore, the ozonation of water in the presence of the bromide ion can
even lead to an increase in the concentration of chlorination DBPs. This happens
on account of the reaction of chlorine with bromo-organic compounds upon final
chlorination [6,77]. Moreover, the bromide ion can participate in the reaction
between NOM and chlorine to form various by-products that contain a
combination of chlorine and bromine. Chlorine in the form of hypochlorous
Table 4- Reactions and rate constants involved in bromate formation via hydroxyl radical pathway. k+, forward reaction; k-, backward reaction; K, equilibrium constant [74,75].

Ph.D. Thesis – M. Moslemi McMaster University – Civil Engineering
acid/hypochlorite ion (HOCl/OCl-), can react with the bromide ion and oxidize it
to the hypobromous acid/hypobromite ion (HOBr/OBr-). Hypochlorous acid and
hypobromite acid will react collectively with NOM to form chlorinated DBPs,
including THMs, HAAs, haloketones, and chloropicrin [42].
So far, a brief summary regarding major disinfection by-products, their
formation mechanisms and governing factors has been presented. In the following
section, a brief review of the research that has been previously carried out on the
chlorination and ozonation DBPs and the respective findings are presented.
1.3.3. Historical perspective
Several researchers have investigated the ozonation process, pertinent
disinfection by-products, and the influence of various parameters and operational
conditions on the process. However, few studies on the hybrid ozonation/membrane
filtration with the aim of DBPs analysis have been carried out.
Karnik et al., 2005 [10] developed a hybrid ozonation and ceramic membrane
filtration system, for which they examined the removal of NOM and the
formation of DBPs. They achieved up to 50% reduction in the dissolved organic
carbon (DOC) concentration. Furthermore, they observed that humic substances,
which are the main precursor of chlorination by-products, were transformed to
non-humic substances, which are less reactive with chlorine. This resulted in the
reduction of TTHM and HAA formation by up to 80% and 65%, respectively.
They indicated that the hybrid ozonation/filtration system produced lower
27
Ph.D. Thesis – M. Moslemi McMaster University – Civil Engineering
concentrations of aldehydes, ketones, and ketoacids as compared to ozonation
alone. It was also reported that pH reduction can decrease the concentration of
TTHMs and HAAs formed following chlorination. Moreover, the concentration
of aldehydes and ketones decreased by about 50% as pH was lowered from 8.2 to
7.0.
In another investigation, Karnik et al., 2005 [78,79] used ceramic membranes
coated with iron oxide nanoparticles (Fe2O3). By taking advantage of catalytic
ozonation/membrane filtration, they were able to reduce the concentration of
dissolved organic carbon by more than 85%. In addition, the concentration of
chlorination by-products, including TTHMs and HAAs, were decreased by up to
90% and 85%, respectively. As compared to the results of their earlier work,
catalytic ozonation considerably improved the elimination efficiency of these two
harmful chlorination by-products. Furthermore, they reported that ozonation using
coated membrane can reduce the concentration of ozonation by-products
including aldehydes, ketones, and ketoacids by more than 50% as compared to
results obtained with the uncoated membranes. This implies the important role of
iron oxide in the removal of these compounds. They suggested that hydroxyl or
other radicals formed on the iron oxide coated membrane surface due to ozone
decomposition promoted the elimination of NOM, and therefore suppressed DBP
formation.
Kusakabe et al., [80] used an advanced oxidation process (AOP) including
ozonation/ultraviolet (UV) irradiation to study chlorination DBP formation. They
28
Ph.D. Thesis – M. Moslemi McMaster University – Civil Engineering
found that ozonation coupled with UV irradiation can more efficiently reduce the
potential for chlorination by-product formation as compared to that of ozonation
alone. This phenomenon was attributed to fast and non-selective oxidation of
dissolved organic compounds by hydroxyl radicals, which are formed by the
photochemical decomposition of ozone. These results were verified by other
researchers [81].
In another investigation, Chin et al., 2005 [82] used an advanced oxidation
process to remove precursors of chlorination DBPs from raw surface water. They
observed that the hybrid system is more effective than either ozonation or UV
treatment alone in terms of mineralization and removal of organic compounds.
Their experimental results exhibited that the ozonation/UV irradiation system
mineralized up to 50% of the total organic carbon (TOC) and also reduced the
formation potential for THMs and HAAs by about 80% and 70%, respectively.
The review of the previously accomplished research and the obtained results
reveals that, several investigations with the aim of control, suppression of the
formation of or the removal of chlorination and ozonation organic DBPs in
ozonation/membrane filtration configurations have been carried out and some
recommendations and strategies regarding minimization of such by-products have
been proposed. Among research conducted in this field, ceramic membrane owing
to its catalytic nature has shown very promising results in terms of ozonation
organic by-products and post chlorination by-product reduction. However, bromate
formation and minimization in such hybrid systems has not been extensively
29

Ph.D. Thesis – M. Moslemi McMaster University – Civil Engineering
studied and very few investigations in this regard have been carried out. Hence, it is
crucial to study DBP formation in hybrid membrane/ozonation systems.
1.3.4. Strategies to Cope with BrO3- Formation
Bromate forms via a complicated and multistage mechanism, which is initiated
by the direct reaction of ozone and bromide ion. The initial reaction is followed
by hydroxyl radical participation [62]. Therefore, both direct and indirect
pathways play roles. However, several researchers have pointed out that the
contribution of •OH is more profound compared to that of ozone. Referring to
Tables 3 and 4 the reaction rate constants (K) for the hydroxyl radical pathway are
appreciably greater than that of those involving molecular ozone, therefore it is
expected that the contribution of the indirect pathway is significant. It is reported
that almost 70% of bromate formation is through •OH mediated oxidation
reactions (the indirect pathway) and the remaining 30% depends on the direct
pathway [59,62].
The type and concentration of NOM present in the water, ozone dosage, pH,
and temperature can influence ozone stability and decay, and can therefore, also
affect the conversion of bromide to the bromate ion [65]. According to the scheme
shown in Figure 3, every process that can retard or interrupt any of intermediate
routes leading to bromate formation, can in fact assist to suppress its formation.
Based on such theory, various approaches can be employed to cope with this
water treatment side-product. These strategies can be classified into three main
categories, including Prevention, Suppression and Removal techniques:
30
Ph.D. Thesis – M. Moslemi McMaster University – Civil Engineering
I- Prevention: In dealing with environmental pollution, the wisest method is to
prevent environmental pollution from happening in the first place and to confine
the pollutant source. In the case of bromate, the essential precursor is the bromide
ion that can be introduced to drinking water supplies through salt water intrusion
and anthropogenic activities, such as coal mining [6,62,65,77] and hydrofracking.
This option, which leads to water resources quality management and control, is
outside of the scope of this research.
Another alternative that one may consider is the elimination of bromide from
target water before contacting with ozone. This can be accomplished by using
suitable adsorbents such as activated carbon and or ion exchange filters [45].
However, these methods are essentially impractical for most drinking waters.
Considering the very large volumes of water that are treated per day, a large
amount of activated carbon or resin would be required, which would be costly. In
addition, the competition among the ions present in water (including carbonate,
and bicarbonate ions which are normally available in water at much greater
concentrations than the bromide ion) for ion exchange sites reduces the efficiency
of bromide removal by activated carbon. Additionally, the disposal of the sludge
and brine that would be generated would add to this problem and cost. Moreover,
natural water includes a variety of ions and organic matter that may sorb to
reactive surfaces of adsorbents, and hence compete with bromide and interfere
with the adsorption/removal process. Therefore, this method does not seem to
provide an economical solution especially in the case of waters with a relatively
31
Ph.D. Thesis – M. Moslemi McMaster University – Civil Engineering
high bromide content, or with high concentrations of multivalent anions, which
would preferentially compete for sites on ion exchange resins and decrease the
efficacy of the process for bromide removal.
II- Suppression: In most cases, environmental engineers have to deal with
situations in which the environmental medium of concern is already contaminated
and aside from source control, actions have to be taken to rectify the existing
situation. Once bromide has entered a water body, the next priority is to minimize
and suppress bromate formation during ozonation practice. A brief summary of
methods in this category has been presented below:
- pH depression: The pKa of the reversible reaction between the hypobromite ion
and its conjugate acid [ HOBr ↔ OBr– ] is 8.8 at 20C. Therefore referring to Figure
3, at pHs lower than 8.8, equilibrium shifts toward left and the production of HOBr is
favoured. Hence, due to lack of OBr–, bromate formation will be slowed [68, 83].
In addition to this fact, as pH decreases, ozone stability in water increases and
less •OH is generated [33,75]. Given the fact that •OH plays a significant role in
the process of bromate formation, pH depression can effectively retard the
process. For the time being, pH reduction is one of the most reliable strategies for
controlling bromate formation, however this method is extremely costly, since pH
has to be increased again before pumping water into the distribution system, and it
is associated with the consumption of a large amount of acid and base. Moreover,
high doses of acid and base will increase the total dissolved solid (TDS)
concentration in the water [6].
32

Ph.D. Thesis – M. Moslemi McMaster University – Civil Engineering
- •OH scavenging (HCO3- , CO3
2-): By adding bicarbonate/carbonate to water,
the half-life of ozone can be increased. At concentrations of a few millimoles per
liter of bicarbonate, the decay rate of ozone can be decreased by about a factor of
ten or more and the stability of ozone can be increased. Scavengers can react with
hydroxyl radicals, eliminate them and thus slow down the bromate formation
through suppression of the hydroxyl radical pathway [52,53,55]. However, this
method requires high alkalinity, which limits its application.
- Ammonia dosing: As it is indicated in Figure 3, NH3 will act as a sink for HOBr
and will transform it back to Br-. By this mechanism, ammonia removes HOBr from
the cycle and in turn hinders the formation of OBr- and BrO•, which results in less
BrO3- generation [70,73,75,84]. Tanaka et al. 2002 [69] showed that ammonia in fact
induces a lag in bromate formation and as long as ammonia is still available, bromate
formation will be suppressed, indicating that the reaction of ammonia with HOBr is
very fast. This strategy also has a major drawback, which is the production of nitrite
(NO2-) that is formed as ozone reacts with ammonia. Nitrite can cause
methemoglobinemia, which can be fatal especially to infants [1].
- Multistage ozonation: This method might reduce bromate concentration, but
it brings about some additional troubles. Extra ozone contactors need to be built
and more land space is required, which increases installation costs.
III- Removal: The last option is to remove bromate after it is formed. Such
methods include:
33

Ph.D. Thesis – M. Moslemi McMaster University – Civil Engineering
- Activated carbon and ion exchange resin: Activated carbon and ion exchange
filters can be used to remove ions such as bromate from water [85,65]. However,
as explained earlier these methods have such drawbacks as high cost and
competition between the target ion and background electrolytes. As such, these
strategies are inefficient.
- Membrane filtration (RO / NF): Reverse osmosis and nanofiltration membranes
can effectively exclude the bromate ion from finished water, however their
application is unfavourable due to extensive membrane fouling and high costs
associated with elevated operating pressure required with these types of membranes.
- Chemical reduction: Reducing agents such as ferrous ion (Fe2+) can be added
to water to reduce bromate to bromide [33,42,86,87]. However, ferrous ion would
promptly react with ozone and produce the insoluble ferric hydroxide, Fe(OH)3,
which would deposit readily on the membrane surface and cause fouling
problems. Moreover, some portion of the Fe2+ may pass through filtration process
and cause aesthetic problems in the finished water.
1.3.5. Objectives & Scope of Research
As already discussed, several methods have been suggested in the literature to
cope with bromate formation during the ozonation process, however as a matter
of fact none of them are efficient or economically practical for large-scale
drinking water production. Therefore, the main objective of the proposed research
project is to investigate the effects of important operating parameters including
34

Ph.D. Thesis – M. Moslemi McMaster University – Civil Engineering
inlet ozone mass injection rate, initial bromide concentration, membrane
molecular weight cut off, membrane coating, hydroxyl radical scavenger, pH, and
temperature on the formation of bromate, and organic by-products including
TTHMs and HAAs. To achieve this goal, a hypothesis is suggested:
Ceramic membranes are made of a combination of metal oxides such as
titanium dioxide (TiO2) and iron oxide (Fe2O3), aluminum oxide (Al2O3) and
zirconium dioxide (ZrO2) that can act as catalysts to accelerate some chemical
reactions in aqueous solutions. It has been shown that ozonation in conjunction
with catalysts is more effective than ozonation or photocatalysis alone for
decomposition and mineralization and thus elimination of several types of organic
compounds [24,88]. A catalyst is defined as a substance which can act as a
support for chemical reactions to happen. Catalysts can exert orienting effects to
enable and accelerate the progress of a thermodynamically possible chemical
reaction [24,110]. It is believed that these metal oxides can facilitate and promote
ozone decomposition by catalytic reactions.
Catalytic decomposition of ozone occurs on the catalyst surface, and in case of
ceramic membrane that is the membrane surface and pore walls. As the ozone
decomposition rate increases, more hydroxyl radicals are produced. Hydroxyl
radicals are very strong oxidants and will react rapidly with natural organic
matter, which deposits on the membrane surface. By such mechanism, catalytic
ozonation will lead to the quick destruction and removal of NOM, and subsequent
elimination of foulants from membrane surfaces [79]. Due to greater efficiency of
35
Ph.D. Thesis – M. Moslemi McMaster University – Civil Engineering
the catalytic ozonation process, lower ozone dosages will solve fouling problems.
By applying less ozone, exposure to ozone will decrease which in turn results in
less bromate formation [62].
Another fact that is noteworthy is that •OH is very short-lived. The second
order rate constant for reaction of most of natural organic matter with •OH is on
the order of 1010 L/mole.sec. For neutral to slightly basic pHs and typical •OH
concentrations found in ozonation processes, this yields a half-life for •OH in the
range of 10-1 seconds [54,89]. Therefore, considering the diffusive and convective
rates in water, hydroxyl radicals that are generated on the membrane surface are
not expected to migrate very far from their origin. Therefore, they would react
with the most available and reactive species in their vicinity, which are believed
to be NOM attached to the membrane surface. Moreover, the catalyst will act as
an adsorbent and organic compounds will adsorb onto its surface [24]. Therefore,
due to the accumulation of NOM on the ceramic membrane surface (or catalyst
surface), its high concentration would increase the reaction rate with •OH as well
as that with dissolved ozone.
Another point to make here is that the bromide ion, which is water-soluble, is
likely to predominate in the bulk water, and not be sorbed to the membrane
surface. Therefore compared to NOM it is relatively less available to •OH, which
is produced on the surface. Nevertheless, ozone that exists in the bulk water can
react with coexisting bromide and produce bromate. However, as explained
earlier, only 30% of bromate formation happens through the ozone pathway and
36

Ph.D. Thesis – M. Moslemi McMaster University – Civil Engineering
the remaining is by the hydroxyl radical pathway. In addition, at regular natural
water pHs, the rate of ozone self-decomposition is much lower than the rate of
catalytic ozone decomposition. This implies that the majority of ozone
decomposition and •OH formation would occur on the catalytic membrane surface
rather than in the bulk water. Thereafter, the dominant portion of •OH that is
formed via catalytic decomposition will most likely react with NOM concentrated
near the membrane surface. By such a mechanism, •OH will be rapidly eliminated
from water and will be mostly made inaccessible to bromide ions in the bulk
water. This in all is believed to lead to a decrease in bromate formation in the
hybrid ozonation/membrane filtration system.
37
Ph.D. Thesis – M. Moslemi McMaster University – Civil Engineering
Chapter 2: Ozone Mass Transfer in a Recirculating Loop
Semibatch Reactor Operated at High Pressure
2.1. Abstract
The effects of water flow rate, mixing, gaseous ozone concentration, inlet gas
flow rate, temperature, and pH on ozone hydrodynamics at high pressure were
studied. Varying the cross flow rate had only a slight influence on the ozone mass
transfer rates, indicating that sufficient mixing in the reactor was attained at the
low flow rates used. The addition of an inline static mixer had a negligible effect
on aqueous ozone concentrations in the reactor, suggesting that mixing was
sufficient without the mixer. The dissolved ozone concentration increased with
increasing gaseous ozone concentration and with the inlet gas flow rate. The
dissolved ozone concentration decreased with increasing pH due to the greater
rate of ozone decomposition at higher pH. Increasing the temperature resulted in a
decrease in the ozone mass transfer. A model to describe the ozone mass transfer
was developed. Good agreement between the model predictions and the
experimental data was achieved.
Keywords: ozone, mass transfer, water treatment, ozonation, reactor design, gas
transfer model
38

Ph.D. Thesis – M. Moslemi McMaster University – Civil Engineering
2.2. Introduction
The application of ozone for drinking water treatment began with the first full
scale installation of an ozone system in Nice, France in 1906 and has increased
dramatically over the last two decades as the costs for ozone generation have
decreased and drinking water regulations have become more stringent (1-3).
Ozone is a strong oxidant that can oxidize and decompose much of the natural
organic matter present in surface waters (4, 5). This enables it to accomplish a
number of treatment objectives (6-9), including, the:
• disinfection and reduction in disinfectant demand
• oxidation of organic compounds, and removal of taste, odour, and color
compounds
• removal of the precursors of some chlorination by-products, including
trihalomethanes (THMs)
• reduction in total organic carbon (TOC) levels by mineralization
• improved performance of coagulation through the transformation of natural
organic matter (NOM) to smaller and more polar compounds, and
• oxidation of Fe(II) and Mn(II), allowing subsequent removal by precipitation.
In water treatment, ozone, commonly produced from air or oxygen gas, is
introduced to the ozone contactors in the gas phase. The mass transfer of ozone
gas to water plays a pivotal role in the effectiveness and performance of ozonation
systems. Several researchers have studied ozone mass transfer and the effect of
various operating parameters on the mass transfer coefficient of ozone (for
39

Ph.D. Thesis – M. Moslemi McMaster University – Civil Engineering
example, see (10-15)). Wu and Masten (16) developed a mathematical model for
the mass transfer of ozone in a semibatch reactor, which was successfully
employed to predict the ozone concentration profile in the reactor under various
conditions. Chen et al. (17) studied the effect of reactor conditions on the ozone
mass transfer coefficient for a hybrid ozonation-ceramic membrane system.
A number of researchers have combined ozonation with membrane filtration
for drinking water treatment. They have reported that ozonation can be used in
combination with membrane filtration in order to overcome fouling problems
resulting from the deposition of natural organic matter present in natural waters
on the membrane surface (18-22). In the hybrid ozonation-membrane system,
aqueous ozone will react with organic material deposited on the membrane
surface or attached to the pores walls, resulting in the degradation and removal of
foulants from the membrane surface. This method allows continuous operation
and eliminates the need for frequent membrane cleaning (5, 18-22). Karnik et al.
(21), along with other researchers, including Schlichter et al. (20) and Mozia et al.
(22), have demonstrated that maintaining a minimum aqueous ozone
concentration in a hybrid ozonation-membrane system, enables continuous
operation at relatively high permeate fluxes (more than 90% of the initial flux)
and eliminates the need for other cleaning procedures. Karnik et al. (21) achieved
nearly complete recovery of permeate flux using a hybrid ozonation/ceramic
ultrafiltration membrane system, which was operated in a cross-flow
configuration. Their experimental results suggest that flux enhancement is due
40
Ph.D. Thesis – M. Moslemi McMaster University – Civil Engineering
mainly to the oxidation of foulants by ozone and/or hydroxyl radicals (which are
formed on the membrane surface due to ozone decomposition), and not the
scouring effect of the gas bubbles.
Previous work on the hybrid ozonation-membrane system was conducted at
pressures much lower than those typically used in ultrafiltration systems (19-22).
In order to operate this system at pressures more typical of those used
commercially, a high pressure ozone generator was developed in conjunction with
Absolute Systems Inc., Canada. This is the first study of ozone mass transfer
using static mixing at high pressure. In order to simplify the mass balance
analysis, this study was conducted without the membrane filtration unit installed
in the system; however, the employed configuration can be used in conjunction
with membrane filtration in a cross-flow mode (21).
In the current study, the influence of operating parameters, including water flow
rate, gaseous ozone concentration, inlet gas flow rate, temperature, and pH, on the
ozone hydrodynamics were investigated. Moreover, the influence of inline static
mixing on the ozone concentration profile was also examined. Static mixers can
offer good mixing conditions with relatively low power demand. They are able to
provide turbulent flow, which is desirable in terms of mass transfer efficiency at
very low cross flow velocities (laminar flow regime). It has been shown by a
number of researchers that the application of static mixers in systems operating at
atmospheric pressures can enhance ozone dissolution in water and also improve the
efficiency of water/wastewater disinfection using ozonation (23-26).
41

Ph.D. Thesis – M. Moslemi McMaster University – Civil Engineering
2.3. Materials and Methods
2.3.1. Experimental Apparatus
A schematic of the semibatch reactor used in these experiments is illustrated in
Figure 1 (also see Fig. A1). The system was equipped with a high-pressure
stainless steel tank with the maximum capacity of 5 L (Fig. A2). The tank was
located in the recycle line to supply the system with the feed water. All tubing and
connections were either Teflon® or 316-stainless steel, both of which are ozone
resistant. Experiments were carried out at high pressure, and nitrogen gas was
used to initially pressurize the system, which was designed to withstand pressures
of up to 550 kPa (80 psi). A gear pump (Model 000-380, Micropump Inc., USA)
was used to circulate the water in the loop. The water inside the tank was mixed
as a result of the turbulence created by the jet of water recycled to the tank. The
data showed that mixing conditions in the reactor were consistently reproduced.
Gaseous ozone was generated by a corona discharge ozone generator
(Absolute Ozone AE15MC80P, Absolute System Inc., Canada) using pure
oxygen gas (99.999%) from a pressurized cylinder. The pressure in the cylinder
was sufficient to inject the ozone containing gas into the system. In all
experiments, ozonated gas was first vented to a catalytic ozone destruction
column until a constant ozone level in the inlet gas was obtained; afterwards, the
gas was diverted into the system using a 3-way valve. The inlet gas flow rate was
adjusted using a digital flow-controller (Model MC-500SCCM-D, Alicat
Scientific Inc., USA) and ozone gas was introduced to the loop using a Swagelok
42
Ph.D. Thesis – M. Moslemi McMaster University – Civil Engineering
Tee fitting (Model SS-400-3, Swagelok, USA). The water flow mixed the injected
gas and the feed water. A pressure regulator (Model KCB1F0A2A5P20000,
Swagelok, USA) was mounted on the recycle tank for safety reasons and to
regulate the pressure in the recirculation loop. Any off-gas from the system was
destroyed either by passing the off-gas into the catalytic destruction column or by
purging the off-gas through a potassium iodide (2% KI) solution.
A bleed line was installed in the recycle loop, which allowed for continuous
sampling of the water. The bleed flow rate was regulated at 5.0 mL/min by a
digital flow-controller (Model LC-50CCM-D, Alicat Scientific Inc., USA). To
evaluate the effect of turbulent mixing of the gas and water phases on the ozone
hydrodynamics, a number of experiments were carried out with and without a
static mixer (1/4-34-SS Static Mixer, Koflo Co., USA), which was placed in line.
A digital flow meter (Model L-5LPM-D, Alicat Scientific Inc., USA) and a digital
pressure gauge (Model 2074, Ashcroft Inc., USA) were placed in the loop in order
to monitor water flow rate and pressure within the system (see Figure 1).
2.3.2. Experimental Conditions
In these studies, the effect of water flow rate (in the loop), inlet ozone gas
concentration, temperature, pH, inlet gas flow rate, and mixing on the ozone
hydrodynamics was examined. The initial water volume in the tank was 3 L. Distilled
deionized water (DDI) was used in order to eliminate any interference exerted by
impurities existing in the natural water. The pressure in the tank was set to 207 kPa
(30 psi). In order to increase the stability of ozone, experiments were carried out
43

Ph.D. Thesis – M. Moslemi McMaster University – Civil Engineering
under acidic conditions (pH 3.0). To study the effect of pH on ozone mass transfer,
experiments were also conducted at pH 6.0 and 8.0. The pH was adjusted by the
addition of phosphoric acid (H3PO4) and/or sodium hydroxide (NaOH).
Experiments were carried out at least in duplicate.
O2
O3 generator O3 monitor O3 destruction Vent
F F
P P
Main tank
Inline mixer
P
P
Spectrophotometer
Sampling
F P
Relief valve
N2 Valve
Pump
Pressure gauge
Flow meter
F
Fig. 1- Schematic of the experimental apparatus.
2.3.3. Analytical Methods
The aqueous ozone concentration in the bleed water was continuously measured
using a UV/Vis spectrophotomer (Model 4054 LKB Biochrom, Pharmacia LKB
Biochrom Ltd., UK) at a wavelength of 254 nm (3). The ozone concentration was
calculated using Lambert-Beer’s law, using an extinction coefficient of 2950 M-1cm-1,
which was determined experimentally. The ozone concentration in the inlet gas was
44

Ph.D. Thesis – M. Moslemi McMaster University – Civil Engineering
continuously measured using a UV ozone monitor (Model 454H, Teledyne
Instruments, USA). pH was measured using a pH meter.
2.4. Determination of the Ozone Mass Transfer Coefficient
To calculate the mass transfer coefficients using experimental data, a
mathematical model was developed. Assuming that the system is a completely
mixed semibatch reactor and considering the control volume depicted in Figure 2,
the mass balance on ozone can be expressed as below:
kCVCQV)CC(aKdt
)CV(dsL −−−= (1)
where C = O3 concentration in the bulk water, mg/L; Cs = aqueous O3
concentration at equilibrium with the inlet O3 gas concentration (CG), mg/L; V =
total volume of water in the system, L; t = time, min; KLa = the overall mass
transfer coefficient, 1/min; Q = sampling flow rate, L/min; k = first order rate
constant for the loss of O3, 1/min (27).
Main tank
V, C
Inlet O3 gas , CG Off-gas
Q , C
Sampling
Fig. 2- Simplified control volume for modeling ozone mass transfer.
45
Ph.D. Thesis – M. Moslemi McMaster University – Civil Engineering
Since water is continuously leaving the system through the bleed line, the total
volume of water gradually decreases with time. Considering that the bleed flow
rate is constant throughout the experiments, the total volume of water at time, t,
can be obtained by the following equation:
(2)QtVV 0 −=
where V0 = initial volume of water in the reactor, L. Taking the derivatives of
both sides of Eq. 2 with respect to t yields:
Qdt
dV−= (3)
It also can be written: dt
dVC
dt
dCV
dt
)CV(d+= (4)
Substituting Eq. 3 into 4 results:
CQdt
dCV
dt
)CV(d−= (5)
After substituting and rearranging, Eq. 1 can be expressed as:
kC)CC(aK
dt
dCsL −−= (6)
dtkC)CC(aK
dC
sL
=−−
(7)
Integrating from both sides of Eq. 7 from C=0 to C and t=0 to t yields the
following mathematical model for the calculation of the dissolved ozone
concentration in the system as a function of time.
)e1(
kaK
aCKC t)kaK(
L
sL L +−−+
= (8)
46

Ph.D. Thesis – M. Moslemi McMaster University – Civil Engineering
At steady state, the ozone concentration in the system will not change with
time, thus, dC/dt=0. Hence, after substitution into Eq. 6, the steady state ozone
concentration in the reactor (Css) is given by Eq. 9. It is noteworthy that Css is in
fact the ozone concentration in the system when the ozone profile reaches a
plateau (see Figures 3 to 8):
kaK
aCKC
L
sLss += (9)
By combining Eq. 8 and 9 and after rearranging, the following expression is
obtained: t.aK)
CC
Cln(
C
CL
ss
ss
s
ss =− (10)
Cs can be calculated using the Henry’s law constant as a function of inlet
ozone gas concentration (CG):
'G
s H
CC = (11)
where H′ = dimensionless Henry’s law constant. The Henry’s law constants were
estimated using the empirical model proposed by Roth et al. (27), which is valid
over the temperature range of 3.5 to 60 C and the pH range of 0.65 to 10.2.
(12))T/2428exp(]OH[1084.3H 035.07 −×= −
where H = Henry’s law constant, atm/mole fraction; [OH-] = hydroxide
ion concentration, mole/L; and T = temperature, K. The Henry’s law constant can
be converted to a dimensionless constant using the following expression (28):
HRT
VH' = (13)
47

Ph.D. Thesis – M. Moslemi McMaster University – Civil Engineering
where V = the molar volume of the water, L/mole, and R = the universal gas
constant, 0.08205 (atm⋅L)/(mole⋅K). Table 1 shows the dimensionless Henry’s
law constants calculated using Eq. 12 and 13 for the various pH and temperature
values investigated in this paper.
Table 1- Dimensionless Henry’s law constants.
pH 3.0 6.0 8.0
Temperature (C ) 15 20 25 20 20
H′ 2.63 2.98 3.37 3.80 4.46
According to Eq. 10, KLa is the slope of the plot of against time.
The analysis of our experimental results verifies the existence of a linear
relationship as it is expressed by Eq. 10 (see R2 values in Tables 3 through 8).
)CC
Cln(
C
C ssss
−sss
2.5. Results and Discussion
2.5.1. Water Flow Rate
Experiments were conducted at water circulation flow rates of 0.17, 0.25, 0.5,
and 1.0 L/min. The Reynolds numbers were calculated for different water flow
rates. These were used to determine the flow regime in the membrane holder (see
Table 2). As the cross flow velocity of water in the membrane holder increased,
the flow regime changed from laminar to turbulent, which is expected to result in
better mixing and contact between the liquid phase (water) and the gas bubbles in
the system. Panda et al. (29) studied the impact of water flow rate on ozone mass
48

Ph.D. Thesis – M. Moslemi McMaster University – Civil Engineering
transfer in a tubular ozone reactor operated at relatively low pressure. They
observed that for Reynolds numbers in the range of 55 to 166, mass transfer
coefficients increase with increasing the circulation flow rate. Chen et al. (17) also
found that mass transfer coefficient increases with increasing water flow rate
inside a hybrid ozonation-membrane system operating at low pressure. However,
it can be seen from Figure 3 that the influence of water flow rate on the ozone
mass transfer rates within our experimental setup was relatively small. According
to calculated mass transfer coefficients listed in Table 3, little improvement in the
ozone mass transfer coefficients was obtained by increasing the circulation flow
rate. Statistical analysis using the F test with α=0.05 (level of significance) also
indicated that the mass transfer coefficients obtained at various water flow rates
were not statistically different (F=2.66 < critical value=4.07). This is consistent
with the fact that even at low flow rates, the degree of mixing is sufficient to
achieve optimal mass transfer.
Table 2- Water flow rates versus flow regime.
Q (L/min) 0.17 0.25 0.50 1.0
v (cm/sec) 10 15 30 60
Re 600 900 1800 3600
Flow regime Laminar Turbulent
Q: water flow rate ; v: cross flow velocity ; Re: Reynolds number
49

Ph.D. Thesis – M. Moslemi McMaster University – Civil Engineering
0
1
2
3
4
5
0 20 40 60 80 100Time (min)
[O3]
(mg/
L)
120
Q=1.0 L/minQ=0.5 L/minQ=0.25 L/minQ=0.17 L/min
Fig. 3- Dissolved ozone concentration vs. time at various water flow rates. With mixer, gaseous ozone concentration 10 mg/L, inlet gas flow rate 75 mL/min, temperature 20 C, pH 3.0, pressure 30 psi.
Table 3- KLa values calculated by modelling experimental results at various water flow rates.
Water flow rate (L/min) 0.17 0.25 0.50 1.00
KLa (1/min) 0.0317 0.0354 0.0360 0.0357
R2 0.97 0.98 0.99 0.98
Standard deviation 0.0019 0.0011 0.0018 0.0032
2.5.2. Inline Mixer
Inline static mixers have been shown to enhance gas transfer into water of
ozone (30) and other gases (31). However, the energy dissipation in these system
is significantly higher than in those without a mixer (31) resulting in higher
50
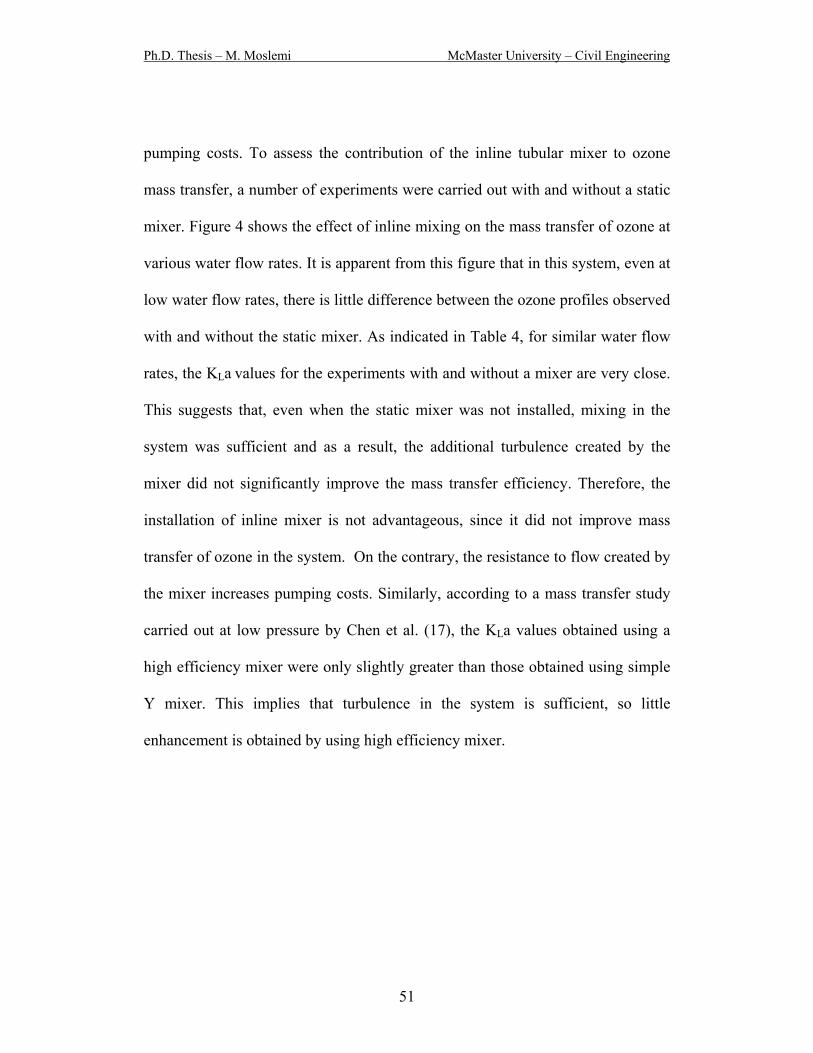
Ph.D. Thesis – M. Moslemi McMaster University – Civil Engineering
pumping costs. To assess the contribution of the inline tubular mixer to ozone
mass transfer, a number of experiments were carried out with and without a static
mixer. Figure 4 shows the effect of inline mixing on the mass transfer of ozone at
various water flow rates. It is apparent from this figure that in this system, even at
low water flow rates, there is little difference between the ozone profiles observed
with and without the static mixer. As indicated in Table 4, for similar water flow
rates, the KLa values for the experiments with and without a mixer are very close.
This suggests that, even when the static mixer was not installed, mixing in the
system was sufficient and as a result, the additional turbulence created by the
mixer did not significantly improve the mass transfer efficiency. Therefore, the
installation of inline mixer is not advantageous, since it did not improve mass
transfer of ozone in the system. On the contrary, the resistance to flow created by
the mixer increases pumping costs. Similarly, according to a mass transfer study
carried out at low pressure by Chen et al. (17), the KLa values obtained using a
high efficiency mixer were only slightly greater than those obtained using simple
Y mixer. This implies that turbulence in the system is sufficient, so little
enhancement is obtained by using high efficiency mixer.
51
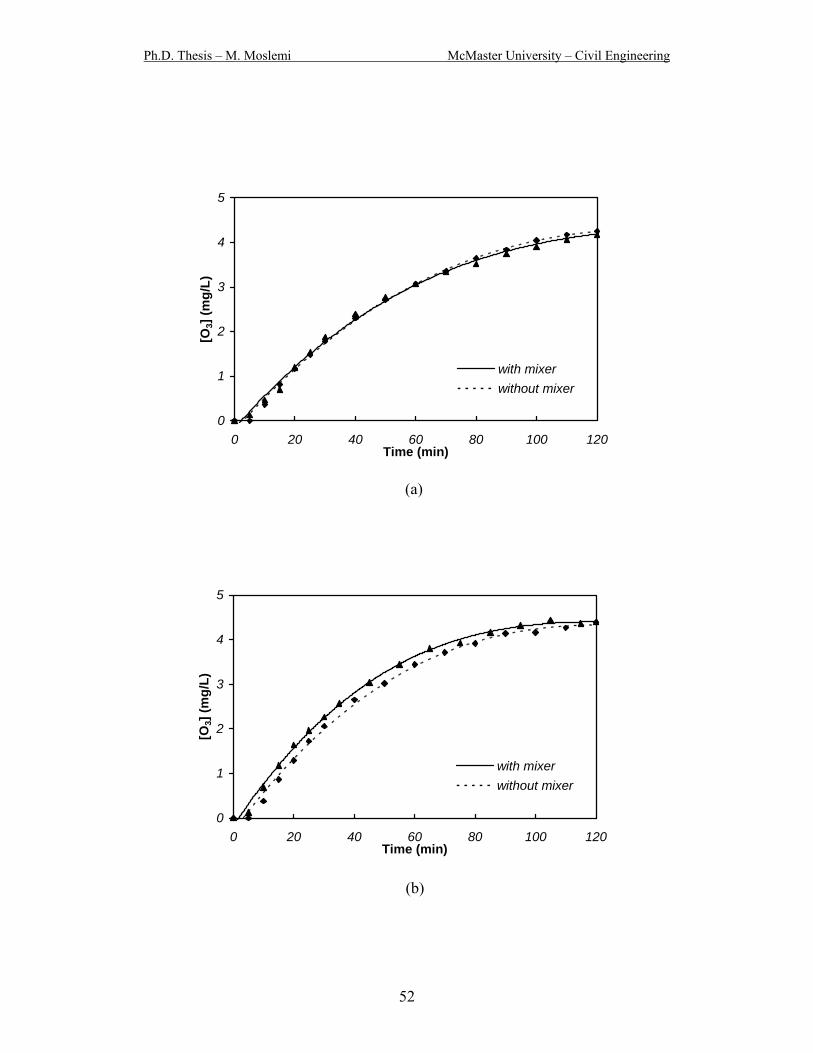
Ph.D. Thesis – M. Moslemi McMaster University – Civil Engineering
0
1
2
3
4
5
0 20 40 60 80 100 120Time (min)
[O3]
(mg/
L)
with mixerwithout mixer
(a)
0
1
2
3
4
5
0 20 40 60 80 100 120Time (min)
[O3]
(mg/
L)
with mixerwithout mixer
(b)
52

Ph.D. Thesis – M. Moslemi McMaster University – Civil Engineering
0
1
2
3
4
5
0 20 40 60 80 100 1Time (min)
[O3]
(mg/
L)
20
with mixerwithout mixer
(c)
0
1
2
3
4
5
0 20 40 60 80 100 120Time (min)
[O3]
(mg/
L)
with mixerwithout mixer
(d)
Fig. 4- Dissolved ozone concentration versus time - The effect of inline mixer. (a) Q=0.17 L/min ; (b) Q=0.25 L/min ; (c) Q=0.5 L/min ; (d) Q=1.0 L/min, gaseous ozone concentration 10 mg/L, inlet gas flow rate 75 mL/min, temperature 20 C, pH 3.0, pressure 30 psi.
53
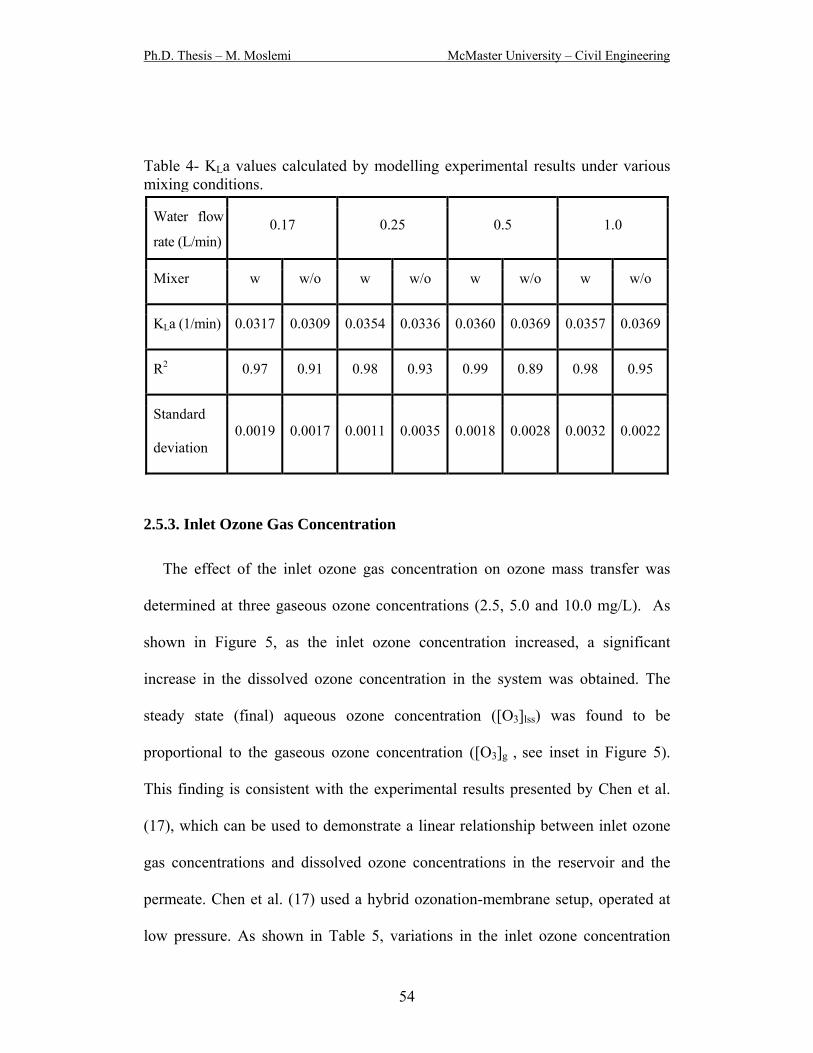
Ph.D. Thesis – M. Moslemi McMaster University – Civil Engineering
Table 4- KLa values calculated by modelling experimental results under various mixing conditions.
Water flow
rate (L/min) 0.17 0.25 0.5 1.0
Mixer w w/o w w/o w w/o w w/o
KLa (1/min) 0.0317 0.0309 0.0354 0.0336 0.0360 0.0369 0.0357 0.0369
R2 0.97 0.91 0.98 0.93 0.99 0.89 0.98 0.95
Standard
deviation 0.0019 0.0017 0.0011 0.0035 0.0018 0.0028 0.0032 0.0022
2.5.3. Inlet Ozone Gas Concentration
The effect of the inlet ozone gas concentration on ozone mass transfer was
determined at three gaseous ozone concentrations (2.5, 5.0 and 10.0 mg/L). As
shown in Figure 5, as the inlet ozone concentration increased, a significant
increase in the dissolved ozone concentration in the system was obtained. The
steady state (final) aqueous ozone concentration ([O3]lss) was found to be
proportional to the gaseous ozone concentration ([O3]g , see inset in Figure 5).
This finding is consistent with the experimental results presented by Chen et al.
(17), which can be used to demonstrate a linear relationship between inlet ozone
gas concentrations and dissolved ozone concentrations in the reservoir and the
permeate. Chen et al. (17) used a hybrid ozonation-membrane setup, operated at
low pressure. As shown in Table 5, variations in the inlet ozone concentration
54
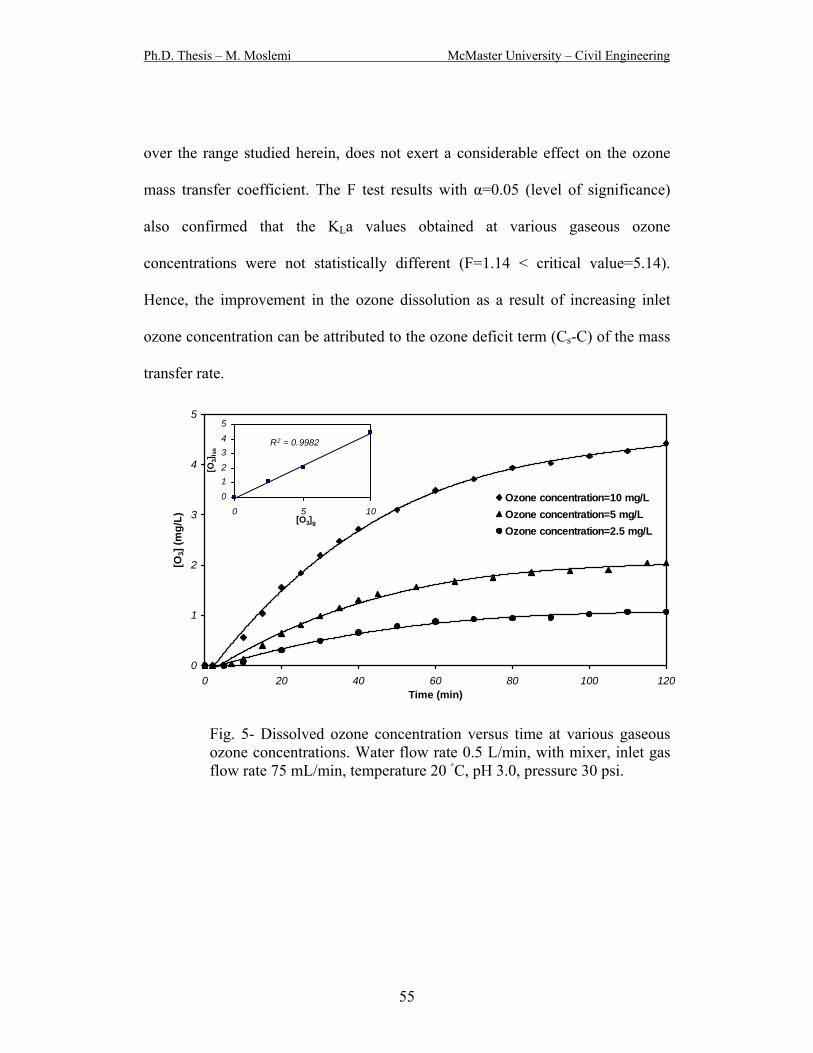
Ph.D. Thesis – M. Moslemi McMaster University – Civil Engineering
over the range studied herein, does not exert a considerable effect on the ozone
mass transfer coefficient. The F test results with α=0.05 (level of significance)
also confirmed that the KLa values obtained at various gaseous ozone
concentrations were not statistically different (F=1.14 < critical value=5.14).
Hence, the improvement in the ozone dissolution as a result of increasing inlet
ozone concentration can be attributed to the ozone deficit term (Cs-C) of the mass
transfer rate.
0
1
2
3
4
5
0 20 40 60 80 100 120Time (min)
[O3]
(mg/
L)
Ozone concentration=10 mg/LOzone concentration=5 mg/LOzone concentration=2.5 mg/L
R2 = 0.9982
0
12
34
5
0 5[O3]g
[O3] l
ss
10
Fig. 5- Dissolved ozone concentration versus time at various gaseous ozone concentrations. Water flow rate 0.5 L/min, with mixer, inlet gas flow rate 75 mL/min, temperature 20 C, pH 3.0, pressure 30 psi.
55
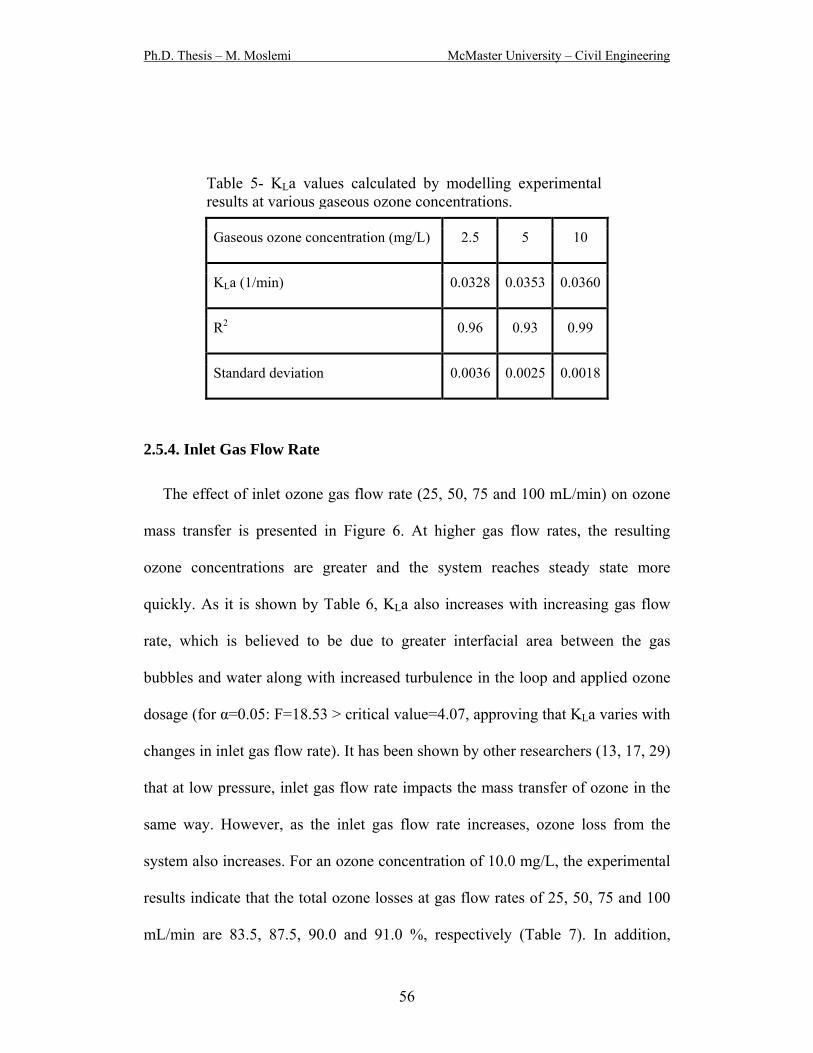
Ph.D. Thesis – M. Moslemi McMaster University – Civil Engineering
Table 5- KLa values calculated by modelling experimental results at various gaseous ozone concentrations.
Gaseous ozone concentration (mg/L) 2.5 5 10
KLa (1/min) 0.0328 0.0353 0.0360
R2 0.96 0.93 0.99
Standard deviation 0.0036 0.0025 0.0018
2.5.4. Inlet Gas Flow Rate
The effect of inlet ozone gas flow rate (25, 50, 75 and 100 mL/min) on ozone
mass transfer is presented in Figure 6. At higher gas flow rates, the resulting
ozone concentrations are greater and the system reaches steady state more
quickly. As it is shown by Table 6, KLa also increases with increasing gas flow
rate, which is believed to be due to greater interfacial area between the gas
bubbles and water along with increased turbulence in the loop and applied ozone
dosage (for α=0.05: F=18.53 > critical value=4.07, approving that KLa varies with
changes in inlet gas flow rate). It has been shown by other researchers (13, 17, 29)
that at low pressure, inlet gas flow rate impacts the mass transfer of ozone in the
same way. However, as the inlet gas flow rate increases, ozone loss from the
system also increases. For an ozone concentration of 10.0 mg/L, the experimental
results indicate that the total ozone losses at gas flow rates of 25, 50, 75 and 100
mL/min are 83.5, 87.5, 90.0 and 91.0 %, respectively (Table 7). In addition,
56
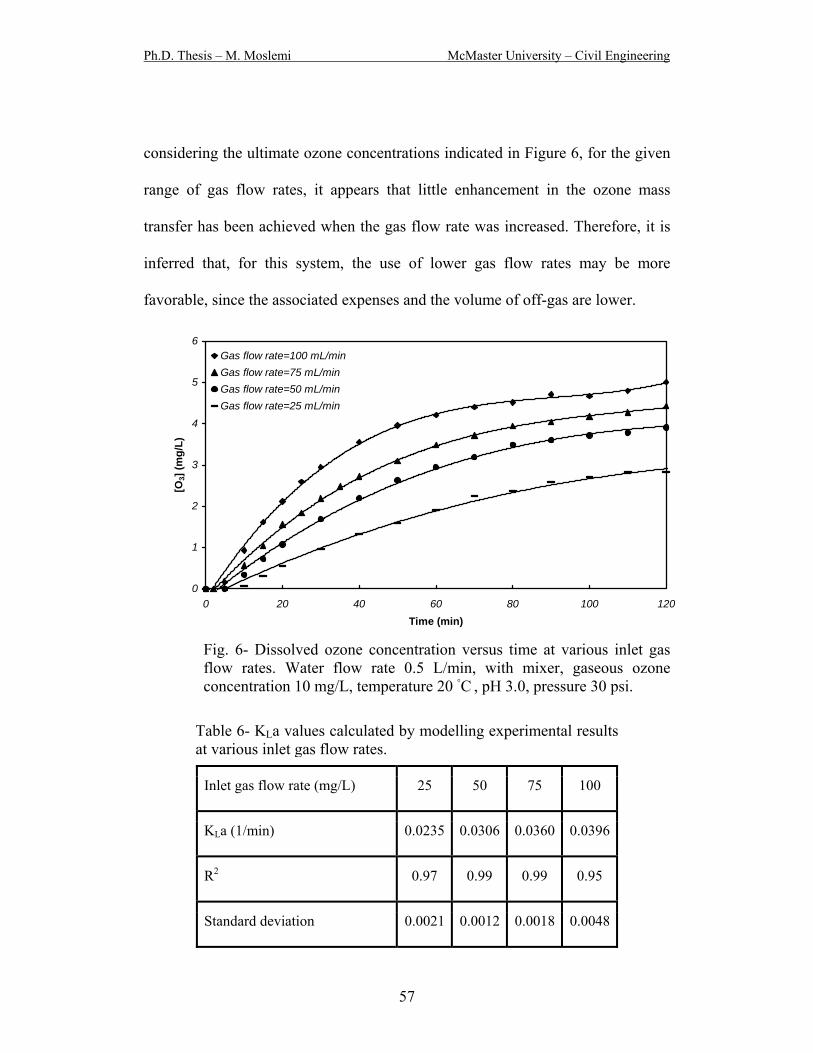
Ph.D. Thesis – M. Moslemi McMaster University – Civil Engineering
considering the ultimate ozone concentrations indicated in Figure 6, for the given
range of gas flow rates, it appears that little enhancement in the ozone mass
transfer has been achieved when the gas flow rate was increased. Therefore, it is
inferred that, for this system, the use of lower gas flow rates may be more
favorable, since the associated expenses and the volume of off-gas are lower.
0
1
2
3
4
5
6
0 20 40 60 80 100 120Time (min)
[O3]
(mg/
L)
Gas flow rate=100 mL/minGas flow rate=75 mL/minGas flow rate=50 mL/minGas flow rate=25 mL/min
Inlet gas flow rate (mg/L) 25 50 75 100
KLa (1/min) 0.0235 0.0306 0.0360 0.0396
R2 0.97 0.99 0.99 0.95
Standard deviation 0.0021 0.0012 0.0018 0.0048
Table 6- KLa values calculated by modelling experimental results at various inlet gas flow rates.
Fig. 6- Dissolved ozone concentration versus time at various inlet gas flow rates. Water flow rate 0.5 L/min, with mixer, gaseous ozone concentration 10 mg/L, temperature 20 C , pH 3.0, pressure 30 psi.
57
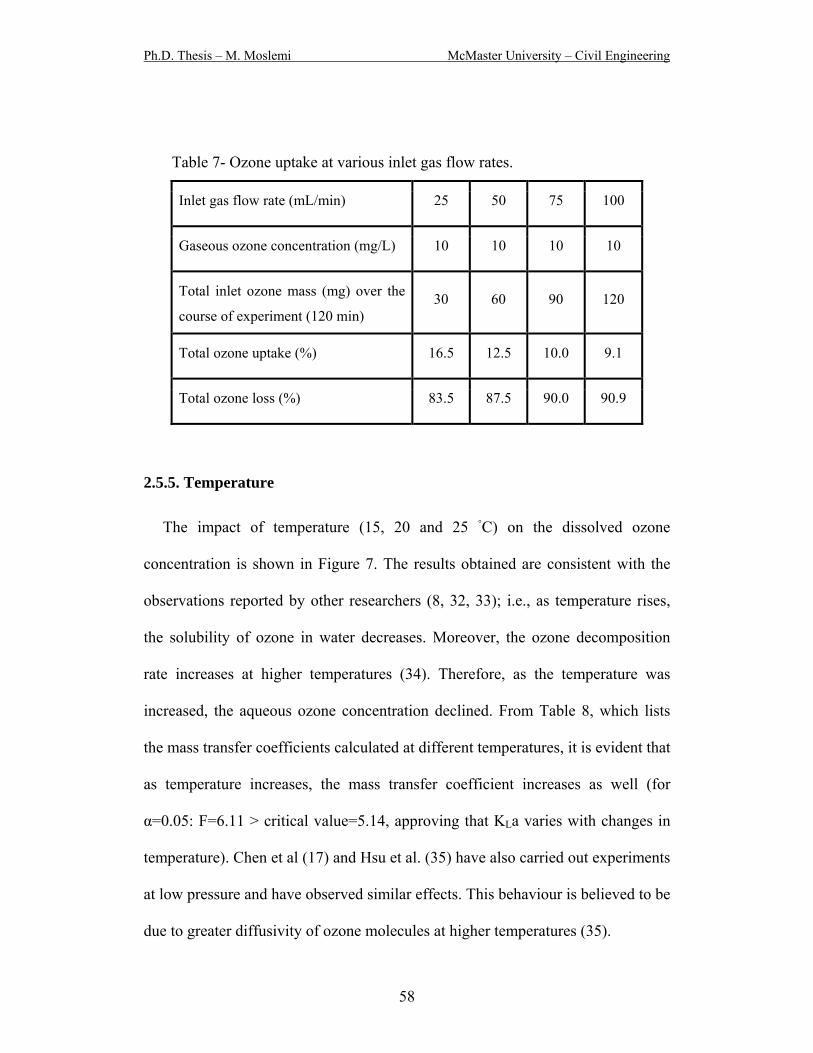
Ph.D. Thesis – M. Moslemi McMaster University – Civil Engineering
Table 7- Ozone uptake at various inlet gas flow rates.
Inlet gas flow rate (mL/min) 25 50 75 100
Gaseous ozone concentration (mg/L) 10 10 10 10
Total inlet ozone mass (mg) over the
course of experiment (120 min) 30 60 90 120
Total ozone uptake (%) 16.5 12.5 10.0 9.1
Total ozone loss (%) 83.5 87.5 90.0 90.9
2.5.5. Temperature
The impact of temperature (15, 20 and 25 C) on the dissolved ozone
concentration is shown in Figure 7. The results obtained are consistent with the
observations reported by other researchers (8, 32, 33); i.e., as temperature rises,
the solubility of ozone in water decreases. Moreover, the ozone decomposition
rate increases at higher temperatures (34). Therefore, as the temperature was
increased, the aqueous ozone concentration declined. From Table 8, which lists
the mass transfer coefficients calculated at different temperatures, it is evident that
as temperature increases, the mass transfer coefficient increases as well (for
α=0.05: F=6.11 > critical value=5.14, approving that KLa varies with changes in
temperature). Chen et al (17) and Hsu et al. (35) have also carried out experiments
at low pressure and have observed similar effects. This behaviour is believed to be
due to greater diffusivity of ozone molecules at higher temperatures (35).
58

Ph.D. Thesis – M. Moslemi McMaster University – Civil Engineering
0
1
2
3
4
5
6
0 20 40 60 80 100 120Time (min)
[O3]
(mg/
L)
Temp.=25Temp.=20Temp.=15
Fig. 7- Dissolved ozone concentration versus time at various temperatures. Water flow rate 0.5 L/min, with mixer, gaseous ozone concentration10 mg/L, inlet gas flow rate 75 mL/min, pH 3.0, pressure 30 psi.
Table 8- KLa values calculated by modelling experimental results at various temperatures.
Temperature (C ) 15 20 25
KLa (1/min) 0.0333 0.0360 0.0401
R2 0.94 0.99 0.95
Standard deviation 0.0010 0.0018 0.0036
2.5.9. pH
The mechanism for the decomposition of ozone is pH dependent and,
therefore, pH has a profound effect on ozone stability in aqueous solutions. Ozone
self-decomposition proceeds through reactions with initiators such as hydroxide
59

Ph.D. Thesis – M. Moslemi McMaster University – Civil Engineering
ions (36, 37). As the pH increases, the OH- concentration increases, which would
result in a higher rate of ozone decomposition. As can be seen from Figure 8, the
steady state dissolved ozone concentration decreases with pH, which is in
agreement with the experimental results presented in the literature (29, 34).
0
1
2
3
4
5
0 20 40 60 80 100 120Time (min)
[O3]
(mg/
L)
pH=8.0pH=6.0pH=3.0
Fig. 8- Dissolved ozone concentration versus time at various pH vales. Water flow rate 0.5 L/min, with mixer, gaseous ozone concentration 10 mg/L, input gas flow rate 75 mL/min, temperature 20 C, pressure 30 psi.
2.5.10. Mass Balance on Ozone
For the experiments at low pH, an analysis of the results shows that at the end
of the experiment only about 10 to 15% of the total mass of injected ozone is
dissolved in the water. The high ozone losses appear to be largely due to fugitive
losses of ozone through the pressure relief valve. These losses are due to the
degassing of oxygen as a result of its relatively low solubility in water. Also,
during the course of the experiment the dissolved ozone approaches the solubility
60

Ph.D. Thesis – M. Moslemi McMaster University – Civil Engineering
limit. Consequently, ozone losses in the latter part of the experiment are high, as
no additional ozone can dissolve in the water.
The overall mass transfer coefficient values found in this study are lower than
those measured by Chen et al. (17) in a similar system that was operated at lower
pressures. The fact that neither the use of a static inline mixer nor a higher cross
flow rate to increase turbulence greatly improved ozone mass transfer coefficient
suggests that mixing in the system is adequate. The low KLa values found reflect
the small size of the system, which is based upon the design used in our previous
membrane filtration studies (38). In this system, the residence time of the gas
bubbles in the injection loop is short (1- 4 s). This leads to poor mass transfer,
since as the water in the reservoir is not mixed the gas bubbles and water separate
in the reservoir. As discussed above, in the pressurized system, venting of the gas
to maintain constant pressure leads to significant ozone losses due to degassing,
thus reducing the overall mass transfer rate. Gas transfer would be expected to be
better in a larger system, as more effective mass transfer would occur in a larger
pressurization loop. Despite these limitations the study does show that, given the
size of the system, adequate mixing and mass transfer can be achieved using the
simple ozone injection technique employed in this study.
61
Ph.D. Thesis – M. Moslemi McMaster University – Civil Engineering
2.6. Conclusion
Good agreement was achieved between predictions from the model developed
to describe the mass transfer of ozone and the experimental results. Our results
show that, despite, the small size of the system, adequate mass transfer can be
achieved using a simple tee to inject the ozone gas into the pressurized water
stream. Moreover, the use of an inline static mixer did not greatly improve the
mass transfer of ozone. High cross flow rates also did not greatly improve ozone
mass transfer. It is believed that the simple tee inlet along with the hydraulic
mixing inside the system can achieve sufficient contact between ozone gas and
the water phase. The mass transfer of ozone increased slightly with temperature,
however, due to the lower solubility of ozone at higher temperature, the final
ozone concentration achieved decreased with increasing temperature. The
dissolved ozone concentration decreased with increasing pH. The final dissolved
ozone concentration was found to be proportional to the inlet ozone concentration.
2.7. Acknowledgements
The authors acknowledge the financial support of this work from the National
Science Foundation (Research Grant CBET-056828), the Natural Sciences and
Engineering Research Council of Canada (Discovery Grant 327560-2006 RGPIN)
and the Department of Civil Engineering at McMaster University.
62
Ph.D. Thesis – M. Moslemi McMaster University – Civil Engineering
2.8. References
(1) Gomella, C. J. AWWA 1972, 64, 39-46.
(2) Masschelein, W. J. Ozonization manual for water and wastewater treatment;
Wiley: New York, USA, 1982.
(3) Gottschalk, C.; Libra, J. A.; Saupe, A. Ozonation of water and waste water:
A practical guide to understanding ozone and its application; Wiley-VCH:
New York, USA, 2000.
(4) Rice, R. G.; Robson, C. M.; Miller, G. W.; Hill, A. G. J. AWWA 1981, 73, 44-57.
(5) You, S. H.; Tseng, D. H.; Hsu, W. C. Desalination 2007, 202, 224-230.
(6) Glaze, W. H. Environ. Sci. Technol. 1987, 21, 224-230.
(7) Chandrakanth, M. S.; Honeyman, B. D.; Amy, G. L. Colloids Surf. A:
Physiochem. Eng. Aspects 1996, 107, 321-342.
(8) Camel, V.; Bermond, A. Wat. Res. 1998, 32, 3208-3222.
(9) Peter, A.; von Gunten, U. Environ. Sci. Technol. 2007, 41, 626-631.
(10) Roustan, M.; Mallevialle, J.; Roques, H.; Jones, J. P. Ozone Sci. Eng. 1981,
2, 337–344.
(11) Ouederni, A.; Mora, J. C.; Bes, R. S. Ozone Sci. Eng. 1987, 9, 1-12.
(12) Laplanche, A.; Le Sauze, N.; Martin, G.; Langlais, B. Ozone Sci. Eng. 1991,
13, 535-558.
(13) Zhou, H.; Smith, D. W. Wat. Res. 2000, 34, 909-921.
(14) Kuosa, M.; Laari, A.; Kallas, J. Ozone Sci. Eng. 2004, 26, 277-286.
63

Ph.D. Thesis – M. Moslemi McMaster University – Civil Engineering
(15) Mitani, M. M.; Keller, A. A.; Sandall, O. C.; Rinker, R. G. Ozone Sci. Eng.
2005, 27, 45-51.
(16) Wu, J. J.; Masten, S. J. J. Environ. Eng. 2001, 127, 1089-1099.
(17) Chen, K. C.; Davies, S. H.; Masten, S. J. J. Adv. Oxid. Technol. 2007, 10, 287-296 .
(18) Park, Y. G. Desalination 2002, 147, 43-48.
(19) Schlichter, B.; Mavrov, V.; Chmiel, H. Desalination 2003, 156, 257-265.
(20) Schlichter, B.; Mavrov, V.; Chmiel, H. Desalination 2004, 168, 307-317.
(21) Karnik, B. S.; Davies, S. H. R.; Chen, K. C.; Jaglowski, D. R.; Baumann, M.
J.; Masten, S. J. Wat. Res. 2005, 39, 728-734.
(22) Mozia, S.; Tomaszewska, M.; Morawski, A. W. Desalination 2006, 190, 308-314.
(23) Grosz-Röll, F.; Bättig, J.; Moser, F. Fourth Eur. Conf. Mixing 1982, 225.
(24) Zhu, Q. Ozone Sci. Eng. 1991, 13, 313-328.
(25) Martin, N.; Benezet-Toulze, M.; Laplace, C.; Faivre, M.; Langlais, B. Ozone
Sci. Eng. 1992, 14, 391-405.
(26) Craik, S. A.; Smith, D. W.; Chandrakanth, M.; Belosevic, M. Wat. Res.
2003, 37, 3622-3631.
(27) Roth, J. A.; Sullivan, D. E. Ind. Eng. Chem. Fundam. 1981, 20, 137-140.
(28) Schwarzenbach, R. P.; Gschwend, P. M.; Imboden, D. M. Environmental
organic chemistry; Wiley: New Jersey, USA, 2003.
(29) Panda, K. K.; Mathews, A. P. J. Envron. Eng. 2008, 134, 860-869.
(30) Mysore, C.; Leparc, J.; Lake, R.; Agutter, P.; Prévost, M. Ozone Sci. Eng.
2004, 26, 207-215.
64

Ph.D. Thesis – M. Moslemi McMaster University – Civil Engineering
(31) Heyouni, A.; Roustan, M.; Do-Quang, Z. Chem. Eng. Sci. 2002, 57, 3325-3333.
(32) Rischbieter, E.; Stein, H.; Schumpe, A. J. Chem. Eng. Data. 2000, 45, 338-340.
(33) Guiza, M.; Ouederni, A.; Ratel, A. Ozone Sci. Eng. 2004, 26, 299-307.
(34) Sotelo, J. L.; Beltran, F. J.; Benitez, F. J.; Heredia, J. B. Wat. Res. 1989, 23,
1239-1246.
(35) Hsu, Y. C.; Chen, T. Y. ; Chen, J. H. ; Lay, C. W. Ind. Eng. Chem. Res.
2002, 41, 120-127.
(36) Tomiyasu, H.; Fukutomi, H.; Gordon, G. Inorg. Chem. 1985, 24, 2962-2966.
(37) Staehelin, J.; Hoigné, J. Environ. Sci. Technol. 1982, 16, 676-681.
(38) Kim, J.; Davies, S. H. R.; Baumann, M. J.; Tarabara, V. V.; Masten. S. J. J.
Membr. Sci. 2007, 311, 165-172.
65
Ph.D. Thesis – M. Moslemi McMaster University – Civil Engineering
Chapter 3: Bromate Formation in a Hybrid Ozonation – Ceramic
Membrane Filtration System
3.1. Abstract
The effect of pH, inlet ozone mass injection rate, initial bromide concentration,
and membrane molecular weight cut off (MWCO) on bromate formation in a
hybrid membrane filtration–ozonation reactor was studied. Decreasing the pH,
significantly reduced bromate formation. Bromate formation increased with
increasing inlet gaseous ozone mass injection rate, due to increase in dissolved
ozone concentrations. Greater initial bromide concentrations resulted in higher
bromate concentrations. An increase in the bromate concentration was observed
by reducing MWCO, which resulted in a concomitant increase in the retention
time in the system. A model to estimate the rate of bromate formation was
developed. Good correlation between the model simulation and the experimental
data was achieved.
Keywords: bromide, bromate, ozonation, ceramic membrane, water treatment,
modeling
3.2. Introduction
Ozonation has gained widespread use in drinking water treatment over the past
few decades (Gottschalk et al., 2000). Recently, a number of researchers have
shown that when ozonation is used in combination with membrane filtration,
66

Ph.D. Thesis – M. Moslemi McMaster University – Civil Engineering
problems of fouling resulting from the deposition of natural organic matter on the
membrane surface or within the membrane pores can be overcome (Van Geluwe
et al., 2011, Kim et al., 2010, Mozia et al., 2006; Karnik et al., 2005). In such
hybrid systems, aqueous ozone reacts with and degrades organic foulants
accumulated on the membrane surface, thereby decreasing fouling. In this
innovative method, ensuring a minimum dissolved ozone concentration enables
the continuous treatment of drinking water and eliminates or greatly reduces the
need for membrane cleaning procedures (Kim et al., 2009, You et al., 2007,
Mozia et al., 2006, Schlichter et al., 2003).
A major concern in the treatment of bromide-containing waters using
ozonation is the formation of brominated by-products (Siddiqui et al., 1995).
Bromate (BrO3-), an inorganic by-product of ozonation, is a human carcinogen,
and the United States Environmental Protection Agency (USEPA), the Ontario
(Canada) Safe Drinking Water Act, and the European Union have set the
maximum contaminant level (MCL) for bromate at 10 μg/L (Ontario drinking-
water quality standards, 2002; European Union, 1998; USEPA, 1998).
Bromate is formed by the reaction of molecular ozone with the bromide ion
(Br-), which is naturally present in many waters. The reactions involved are
complex and involve both molecular ozone and OH radicals, as shown in Figure 1
(Crittenden and Harza, 2005; Leqube et al., 2004; Pinkernell and von Gunten,
2001; Haag and Hoigné, 1983). Bromide ion reacts with molecular ozone to form
hypobromous acid (HOBr), which is at equilibrium with the hypobromite ion
67

Ph.D. Thesis – M. Moslemi McMaster University – Civil Engineering
(OBr-). Subsequently, the hypobromite ion reacts with ozone to form the bromite
ion, which further reacts with molecular ozone to form bromate. Bromide can also
react with the hydroxyl radical (•OH) to form the bromine radical, which then
reacts with molecular ozone in a complex set of reactions to form bromate. As
such, both direct and indirect pathways play a role in bromate formation; however
the rate constants for the reaction of hydroxyl radical with bromide are
appreciably greater than that of those involving molecular ozone and it has been
also shown that the contribution of •OH to bromate formation is more significant
compared to that of molecular ozone (Mizuno et al., 2004; von Gunten and
Oliveras, 1998). It is reported that in Milli-Q water, almost 70% of bromate
formation occurs through •OH mediated oxidation reactions and the remaining
30% depends on the molecular ozone reactions (Ozekin et al., 1998).
While the formation of various bromine containing by-products in
conventional ozonation systems has been studied (Haag and Hoigne, 1983;
Krasner et al., 1993; von Gunten and Pinkernell, 2000), the formation of such
disinfection by-products in a hybrid ozonation-membrane filtration has not been
previously investigated. Hence, it is crucial to study bromate formation under
various operating conditions in such hybrid systems. In this study, the effect of
pH, inlet ozone mass injection rate, initial bromide concentration, and membrane
molecular weight cut off on bromate formation in a membrane filtration–
ozonation system were investigated.
68

Ph.D. Thesis – M. Moslemi McMaster University – Civil Engineering
Br•
BrO•
3.3. Materials and Methods
3.3.1. Experimental Setup
Figure 2 illustrates the schematic of the reactor that was used in this study (also
Fig. A1). The system was designed to withstand pressures of up to 550 kPa (80
psi) and pressurized using nitrogen gas. The experimental apparatus was equipped
with two high-pressure stainless steel tanks with capacities of 5 and 8 liters (Fig.
A2). The smaller tank was located in the recycle line to supply the system with
the feed water. The second tank operated as reserve raw water supply to replace
the water lost from the system through permeation and bleeding and was
connected to the main tank through a solenoid valve (Type 6013, Bürkert Corp.,
USA ), which was programmed to maintain a constant water level in the main
tank. The total water volume and the pressure inside the reactor were maintained
at 1.5 L and 138 kPa (20 psi), respectively, throughout the experiments. All
equipment, tubing and connections were made of ozone resistant materials and
were either Teflon® or 316-stainless steel. Water was circulated in the loop at a
flow rate of 200 mL/min using a gear pump (Model 000-380, Micropump Inc.,
Br- HOBr/OBr-
BrO2- BrO3
-HO• HO•
O3
O3 O3
O3
Fig. 1- Bromate formation - Molecular ozone and hydroxyl radical pathways. Adapted from Pinkernell and von Gunten (2001).
69

Ph.D. Thesis – M. Moslemi McMaster University – Civil Engineering
USA). The water inside the tank was mixed as a result of the turbulence produced
by the jet of water as it was returned to the tank.
O2
O3 generator O3 monitor O3 destruction Vent
F F
P P
Feed tank Main tank P
P
F P
Bleed
F P
Retentate
N2 Valve
Pump
Pressure gauge
Flow meter
F
Permeate Bleed
Fig. 2- Schematic of the experimental setup.
Gaseous ozone was generated from pressurized oxygen gas (having a purity of
99.999%) using a corona discharge ozone generator (Absolute Ozone
AE15MC80P, Absolute System Inc., Edmonton, AB, Canada). The gaseous
ozone concentration was adjusted by varying the ozone generator’s voltage.
Ozone gas was injected into the water stream flowing in the recirculation loop
through a Swagelok Tee fitting (Model SS-400-3, Swagelok, USA). Ozone was
transferred from the gas phase to the aqueous phase, as a result of the hydraulic
mixing inside the reactor. The inlet gas flow rate was adjusted to the desired
values using a digital flow-controller (Model MC-500SCCM-D, Alicat Scientific
Inc., USA). Any gas exhausted from the system was destroyed by purging the gas
70
Ph.D. Thesis – M. Moslemi McMaster University – Civil Engineering
through a potassium iodide (2% KI) solution. A pressure regulator (Model
KCB1F0A2A5P20000, Swagelok, USA) was employed to monitor and regulate the
pressure in the recirculation loop. The water temperature was kept at 20 ± 0.1 ⁰C by
recycling water through a water coil which was installed inside the main tank
(Fig. A3). The temperature of the chilled water was controlled using a refrigerated
circulator bath (NESLAB RTE-10, Thermo Fisher Scientific, USA).
In these experiments, tubular ultrafiltration (UF) ceramic membranes (TAMI
No
the recycle loop to allow the retentate to be
sam
rth America, QC, Canada) with nominal molecular weight cut offs of 5, 8 and
15 kilodaltons (kD) were used (Fig. A4). UF membranes, rather than
nanofiltration (NF) membranes, were chosen because the desired flux can be
achieved at a lower operating pressure with a UF membrane, than with an NF
membrane. Ceramic membranes were used as they are ozone resistant. The active
length and the external diameter of the employed membranes were 25 cm and 10
mm, respectively. A stainless steel housing (TAMI North America, QC, Canada)
was used to hold the membrane.
A bleed line was installed in
pled. The bleed flow rate was set to 5.0 mL/min using a digital flow-
controller (Model LC-50CCM-D, Alicat Scientific Inc., USA). A digital flow
meter (Model L-5LPM-D, Alicat Scientific Inc., USA) and a digital pressure
gauge (Model 2074, Ashcroft Inc., USA) were mounted in the loop to monitor the
water flow rate and pressure within the system. The permeate flux was
continuously measured using a balance (Adventurer Pro, Ohaus Corporation,
71

Ph.D. Thesis – M. Moslemi McMaster University – Civil Engineering
USA). Temperature, pressure, and cross flow rate were continuously recorded
using a data acquisition system (LabView, National Instruments, USA).
3.3.2. Analytical Methods
ozone in the permeate and the retentate were
co
The concentrations of
ntinuously monitored by measuring the absorbance at a wavelength of 258 nm
using flow-through cells mounted in a UV/Vis spectrophotomer (Model 4054,
Pharmacia LKB, Biochrom Ltd., UK). The aqueous ozone concentration was then
determined using an extinction coefficient of 2900 M-1cm-1 (Hoigne and Bader,
1976). The inlet ozone gas concentration was also continuously measured using a
UV ozone monitor (Model 454H, Teledyne Instruments, USA). To quench further
ozone reactions, the residual dissolved ozone in the samples for bromide and
bromate analysis were purged by bubbling nitrogen gas through the sample for 2
minutes. Bromide and bromate concentrations in the samples were measured in
triplicate using an ion chromatograph, consisting of a high performance liquid
chromatography system (Model 230, Varian ProStar, USA) with an anion-
exchange column (IonPac AS23, Dionex Corp., USA) a guard column (IonPac
AG23, Dionex Corp., USA), an anion micromembrane suppressor (AMMS III -
4mm, Dionex Corp., USA) and a conductivity detector (CD25A, Dionex Corp.,
USA). The analysis was carried out in accordance with the method proposed by
Dionex (Application Note 184, Dionex Corp., USA). A solution of 4.5 mM
sodium carbonate (NaCO3) (99.5%, EMD, USA) and 0.8 mM sodium bicarbonate
(NaHCO3) (99.7%, Sigma-Aldrich, Germany) was used as the mobile phase. The
72

Ph.D. Thesis – M. Moslemi McMaster University – Civil Engineering
column flow rate was 1 mL/min. pH was measured using a pH meter (pHTestr 30,
Eutech Instruments, Illinois, USA).
3.3.4. Reagents
er (Milli-Q water with resistivity greater than 18 MΩ) was used
to
3.4. Results and Discussion
gas concentration, inlet ozone gas flow rate,
ini
Ultrapure wat
prepare all reagents and solutions. Milli-Q water was spiked with sodium
bromide (NaBr) to obtain the desired concentrations. Subsequently, the pH of
water was adjusted to the desired value by adding phosphoric acid (H3PO4)
(99.99%, Sigma-Aldrich, USA) and/or sodium hydroxide (NaOH) (98.0+%,
Fluka, Germany). The water was not buffered, since our experimental results
showed that the pH did not vary over the course of the experiment. Tertiary butyl
alcohol (Fisher Scientific, Germany) was used as hydroxyl radical scavenger.
Bromide and bromate standards were prepared using sodium bromide (99.995%
(metals basis), Fluka, Germany) and sodium bromate (NaBrO3) (99.7+%, Fisher
Scientific, USA).
The effects of pH, inlet ozone
tial bromide concentration, and membrane molecular weight cut off (MWCO)
on bromate formation were investigated. Steady state bromate concentrations
observed under various operating conditions are presented in Table 1.
Experiments were carried out at least in duplicate. All bromate concentrations
73

Ph.D. Thesis – M. Moslemi McMaster University – Civil Engineering
reported are averages of triplicate analyses within replicate experiments. In all
cases, the relative standard deviation for the measurement was less than 3.6%.
Table 1- Steady state bromate concentration in the permeate under various operating conditions
pH Inlet O3 mass injection rate
(mg/min)
Initial [Br-] (mg/L)
MWCO (kD)
Temperature (C)
Steady state [BrO3
-] (μM)
3 1.5 1.00 5 20 0.58
6 1.5 1.00 5 20 4.13
8 1.5 1.00 5 20 8.03
6 0.5 1.00 5 20 1.57
6 1.0 1.00 5 20 2.86
6 0.75 1.00 5 20 2.55
6 2.25 1.00 5 20 4.67
6 1.5 0.05 5 20 0.055
6 1.5 0.25 5 20 0.72
6 1.5 0.50 5 20 1.75
3.4.1. Effect of pH
As shown in Figure 3, the steady state concentration of bromate ion measured
in the permeate line at a reactor pH of 3.0 is significantly less then that observed
at pH 6.0 or 8.0. This is not surprising since the hydroxyl radical (•OH) is more
reactive with bromide than is the ozone molecule (von Gunten and Oliveras,
1998) and at low pH, the ozone molecule is more stable and the concentration of
hydroxyl radicals in the reactor would be expected to be less than that found at
higher pH (Pinkernell and von Gunten, 2001; von Gunten, 2003). Furthermore,
HOBr is much less reactive with ozone than is OBr- (Mizuno et al., 2004). The pKa
74

Ph.D. Thesis – M. Moslemi McMaster University – Civil Engineering
for the dissociation of hypobromous acid to hypobromite (HOBr ↔ OBr- + H+) is
8.8, so (Haag and Hoigne, 1983; Siddiqui and Amy, 1993) the concentration of
OBr- is low at low pH, hence the rate of formation of bromate is slower at low
pH. While pH reduction is an effective way to control bromate formation, doing
so is neither cost effective nor practical in terms of full scale drinking water
treatment (Crittenden and Harza, 2005).
0
1
2
3
4
5
6
7
8
9
10
0 30 60 90 120 150 180
Time (min)
[BrO
3- ] (m
icro
mol
e/L)
pH=8.0pH=6.0pH=3.0
Fig. 3- Bromate concentration in the permeate vs. time at various pH values. Membrane: 7 channel – 5 kD, inlet O3 mass injection rate: 1.5 mg/min, initial [Br-]: 1 mg/L, temperature: 20C, ionic strength: 512.5, 13.0 and 12.5 μM corresponding to pH 3, 6 and 8, respectively.
3.4.2. Effect of Inlet Ozone Mass Injection Rate
The effects of the inlet ozone mass injection rate (0.50, 0.75, 1.00, 1.50, 2.25
mg/min) on the dissolved ozone and bromate concentration are shown in Figures
75
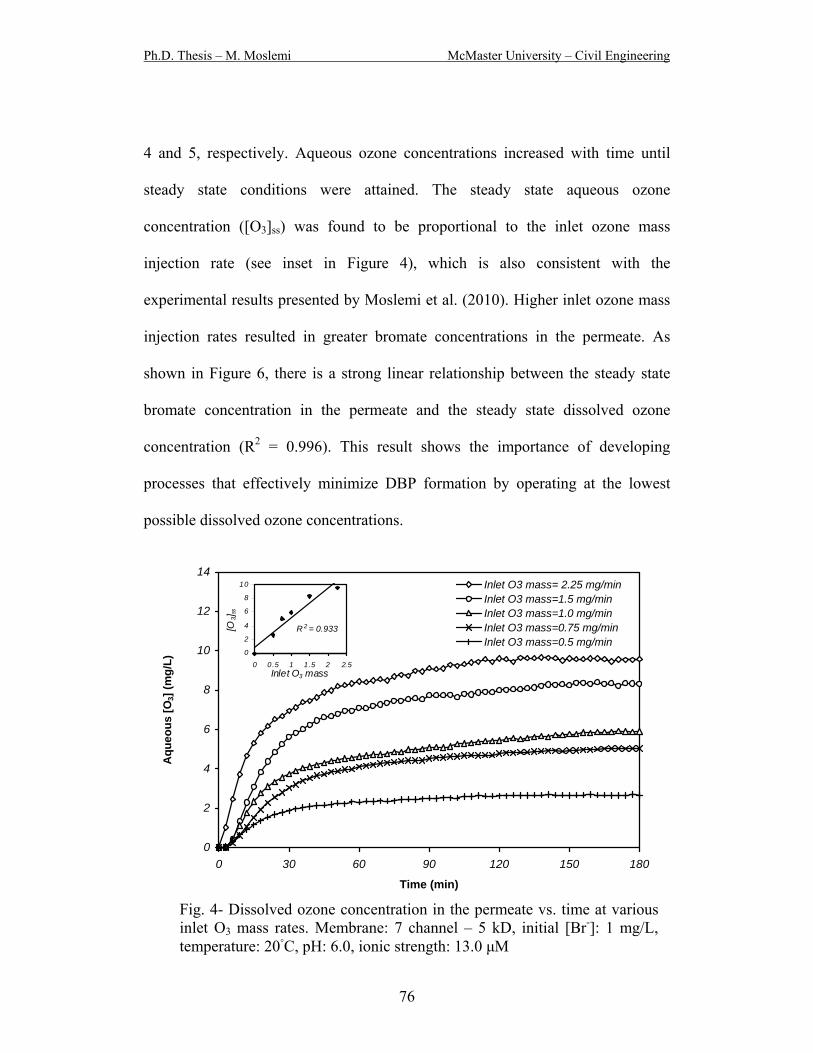
Ph.D. Thesis – M. Moslemi McMaster University – Civil Engineering
4 and 5, respectively. Aqueous ozone concentrations increased with time until
steady state conditions were attained. The steady state aqueous ozone
concentration ([O3]ss) was found to be proportional to the inlet ozone mass
injection rate (see inset in Figure 4), which is also consistent with the
experimental results presented by Moslemi et al. (2010). Higher inlet ozone mass
injection rates resulted in greater bromate concentrations in the permeate. As
shown in Figure 6, there is a strong linear relationship between the steady state
bromate concentration in the permeate and the steady state dissolved ozone
concentration (R2 = 0.996). This result shows the importance of developing
processes that effectively minimize DBP formation by operating at the lowest
possible dissolved ozone concentrations.
0
2
4
6
8
10
12
14
0 30 60 90 120 150 180
Time (min)
Aqu
eous
[O3]
(mg/
L)
Inlet O3 mass= 2.25 mg/minInlet O3 mass=1.5 mg/minInlet O3 mass=1.0 mg/minInlet O3 mass=0.75 mg/minInlet O3 mass=0.5 mg/min
R 2 = 0.933
0
2
4
6
8
10
0 0.5 1 1.5 2 2.5Inlet O3 mass
[O3] s
s
Fig. 4- Dissolved ozone concentration in the permeate vs. time at various inlet O3 mass rates. Membrane: 7 channel – 5 kD, initial [Br-]: 1 mg/L, temperature: 20C, pH: 6.0, ionic strength: 13.0 μM
76

Ph.D. Thesis – M. Moslemi McMaster University – Civil Engineering
0
1
2
3
4
5
0 30 60 90 120 150 180
Time (min)
[BrO
3- ] (m
icro
mol
e/L)
Inlet O3 mass=2.25 mg/minInlet O3 mass=1.5 mg/minInlet O3 mass=1.0 mg/minInlet O3 mass=0.75 mg/minInlet O3 mass= 0.5 mg/min
y = 0.480x + 0.114R2 = 0.996
0
1
2
3
4
5
0 1 2 3 4 5 6 7 8 9 10
Aqueous [O3]ss (mg/L)
[BrO
3- ] ss (
mic
rom
ole/
L)
Fig. 5- Bromate concentration in the permeate vs. time at various inlet O3
mass rates. Membrane: 7 channel – 5 kD, initial [Br-]: 1 mg/L, temperature: 20C, pH: 6.0, ionic strength: 13.0 μM
Fig. 6- Steady state bromate concentration in the permeate vs. steady state aqueous O3 concentration. Membrane: 7 channel – 5 kD, initial [Br-]: 1 mg/L, temperature: 20C, pH: 6.0, ionic strength: 13.0 μM
77

Ph.D. Thesis – M. Moslemi McMaster University – Civil Engineering
3.4.3. Initial Bromide Concentration
In another set of experiments, the initial bromide concentration was varied
(0.05, 0.25, 0.5 or 1.0 mg/L) (see Figure S1). As it is shown in Figure 7, there is a
strong correlation between the steady state bromate concentration in the permeate
and the initial bromide concentration in the feed solution (R2=0.992) indicating
that as more bromide ion was available to react with molecular ozone and/or
hydroxyl radicals, more bromate was produced.
y = 4.186x - 0.176R2 = 0.992
0
1
2
3
4
5
0 0.25 0.5 0.75 1
Initial [Br-] (mg/L)
[BrO
3- ] ss (
mic
rom
ole/
L)
Fig. 7- Steady state bromate concentration in the permeate vs. initial bromide concentration. Membrane: 7 channel – 5 kD, inlet O3 massinjection rate: 1.5 mg/min, temperature: 20C, pH: 6.0
3.4.5. Effect of MWCO
As presented in Table 2, lower bromate concentrations were observed with
membranes having higher MWCOs (also see Figure S2). The permeability of the
membranes tested increases with MWCO, so at a constant operating pressure, as
78
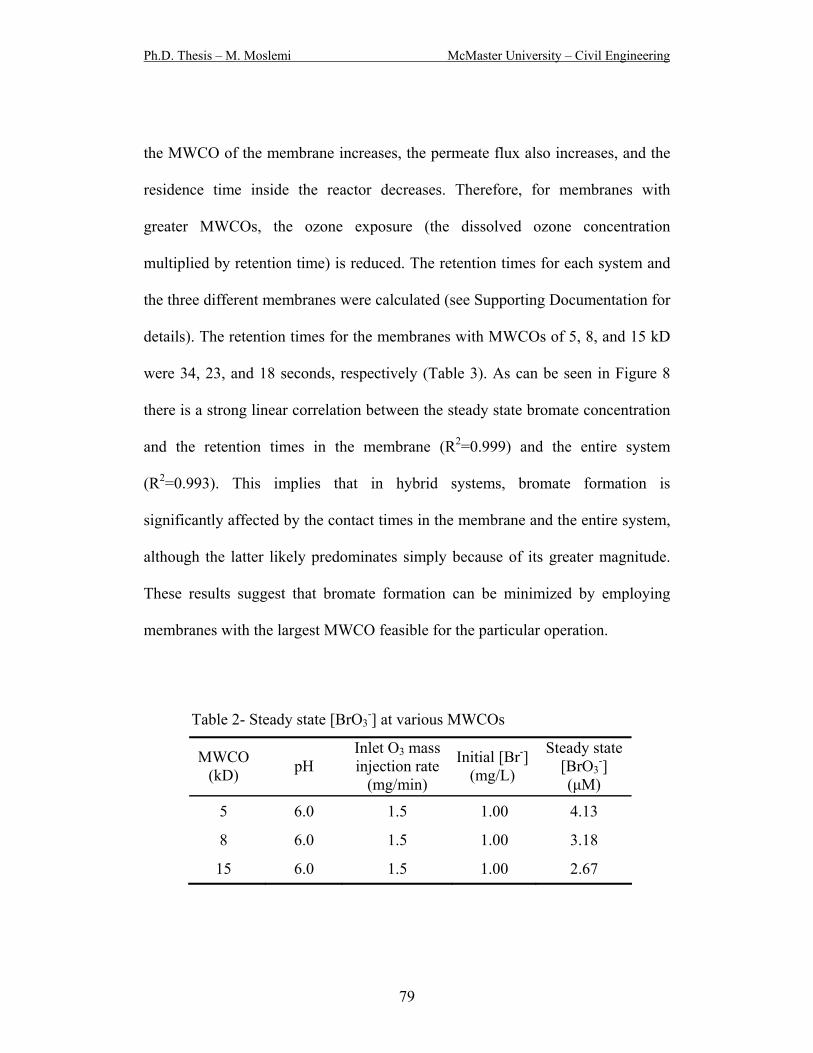
Ph.D. Thesis – M. Moslemi McMaster University – Civil Engineering
the MWCO of the membrane increases, the permeate flux also increases, and the
residence time inside the reactor decreases. Therefore, for membranes with
greater MWCOs, the ozone exposure (the dissolved ozone concentration
multiplied by retention time) is reduced. The retention times for each system and
the three different membranes were calculated (see Supporting Documentation for
details). The retention times for the membranes with MWCOs of 5, 8, and 15 kD
were 34, 23, and 18 seconds, respectively (Table 3). As can be seen in Figure 8
there is a strong linear correlation between the steady state bromate concentration
and the retention times in the membrane (R2=0.999) and the entire system
(R2=0.993). This implies that in hybrid systems, bromate formation is
significantly affected by the contact times in the membrane and the entire system,
although the latter likely predominates simply because of its greater magnitude.
These results suggest that bromate formation can be minimized by employing
membranes with the largest MWCO feasible for the particular operation.
Table 2- Steady state [BrO3-] at various MWCOs
MWCO
(kD) pH
Inlet O3 mass injection rate
(mg/min)
Initial [Br-] (mg/L)
Steady state [BrO3
-] (μM)
5 6.0 1.5 1.00 4.13
8 6.0 1.5 1.00 3.18
15 6.0 1.5 1.00 2.67
79
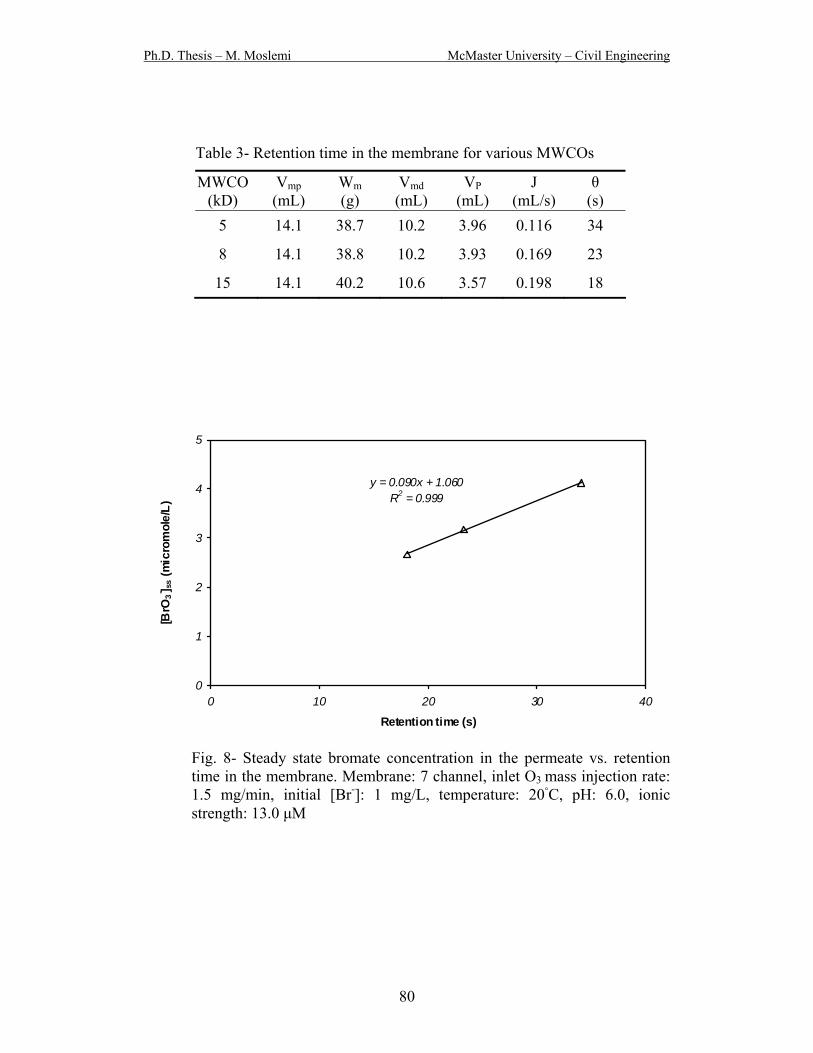
Ph.D. Thesis – M. Moslemi McMaster University – Civil Engineering
Table 3- Retention time in the membrane for various MWCOs
MWCO (kD)
Vmp
(mL) Wm
(g) Vmd
(mL)
VP
(mL)
J (mL/s)
θ (s)
5 14.1 38.7 10.2 3.96 0.116 34
8 14.1 38.8 10.2 3.93 0.169 23
15 14.1 40.2 10.6 3.57 0.198 18
y = 0.090x + 1.060R2 = 0.999
0
1
2
3
4
5
0 10 20 30 40
Retention time (s)
[BrO
3- ] ss (m
icro
mol
e/L)
Fig. 8- Steady state bromate concentration in the permeate vs. retention time in the membrane. Membrane: 7 channel, inlet O3 mass injection rate: 1.5 mg/min, initial [Br-]: 1 mg/L, temperature: 20C, pH: 6.0, ionic strength: 13.0 μM
80
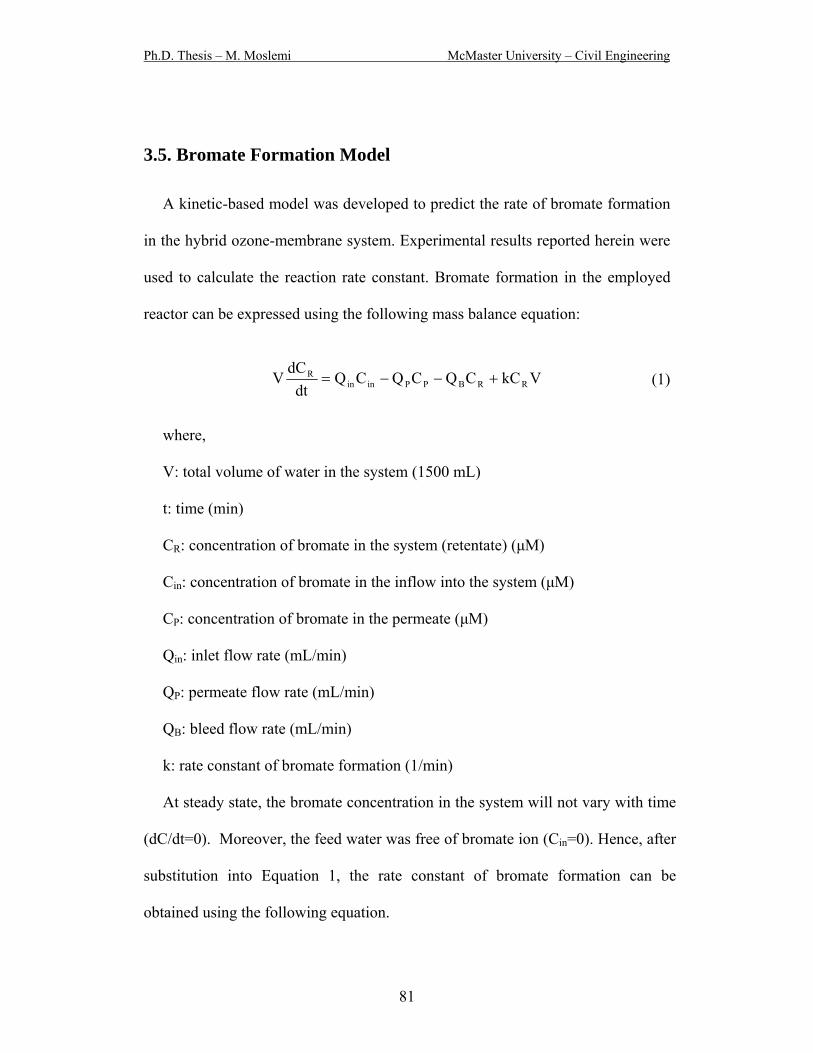
Ph.D. Thesis – M. Moslemi McMaster University – Civil Engineering
3.5. Bromate Formation Model
A kinetic-based model was developed to predict the rate of bromate formation
in the hybrid ozone-membrane system. Experimental results reported herein were
used to calculate the reaction rate constant. Bromate formation in the employed
reactor can be expressed using the following mass balance equation:
VkCCQCQCQdt
dCV RRBPPinin
R +−−= (1)
where,
V: total volume of water in the system (1500 mL)
t: time (min)
CR: concentration of bromate in the system (retentate) (μM)
Cin: concentration of bromate in the inflow into the system (μM)
CP: concentration of bromate in the permeate (μM)
Qin: inlet flow rate (mL/min)
QP: permeate flow rate (mL/min)
QB: bleed flow rate (mL/min)
k: rate constant of bromate formation (1/min)
At steady state, the bromate concentration in the system will not vary with time
(dC/dt=0). Moreover, the feed water was free of bromate ion (Cin=0). Hence, after
substitution into Equation 1, the rate constant of bromate formation can be
obtained using the following equation.
81

Ph.D. Thesis – M. Moslemi McMaster University – Civil Engineering
(2) VC
CQCQk
R
RBPP +=
Using Equation 2, the rate constants for the experiments with inlet ozone mass
injection rate were calculated (see Table 4). According to the results, rate constants
do not vary significantly as a result of variations in ozone mass injection rate.
Hence, one can assume similar bromate formation mechanism for all conditions
tested herein.
Table 4- Rate constants for the formation of bromate in the hybrid ozonation-membrane system
Inlet O3 mass (mg/min)
Rate constant (min-1)
Relative Standard deviation (%)
0.5 0.0061 4.8
0.75 0.0063 6.7
1.0 0.0064 2.4
1.5 0.0067 4.3
2.25 0.0068 5.6
3.6. Acknowledgements
The authors acknowledge financial support of this work from the National
Science Foundation Research (Grant No. CBET-0506828) and from the Natural
Sciences and Engineering Research Council of Canada Discovery Grant Program.
82
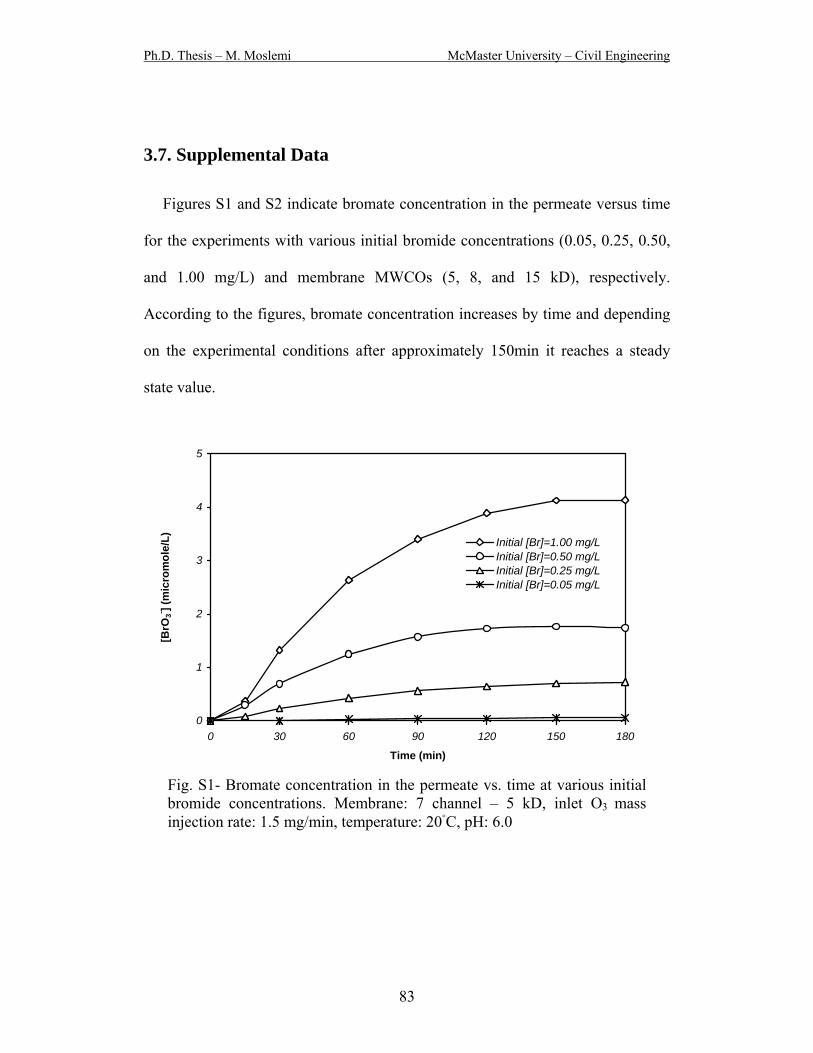
Ph.D. Thesis – M. Moslemi McMaster University – Civil Engineering
3.7. Supplemental Data
Figures S1 and S2 indicate bromate concentration in the permeate versus time
for the experiments with various initial bromide concentrations (0.05, 0.25, 0.50,
and 1.00 mg/L) and membrane MWCOs (5, 8, and 15 kD), respectively.
According to the figures, bromate concentration increases by time and depending
on the experimental conditions after approximately 150min it reaches a steady
state value.
0
1
2
3
4
5
0 30 60 90 120 150 180
Time (min)
[BrO
3- ] (m
icro
mol
e/L) Initial [Br]=1.00 mg/L
Initial [Br]=0.50 mg/LInitial [Br]=0.25 mg/LInitial [Br]=0.05 mg/L
Fig. S1- Bromate concentration in the permeate vs. time at various initial bromide concentrations. Membrane: 7 channel – 5 kD, inlet O3 mass injection rate: 1.5 mg/min, temperature: 20C, pH: 6.0
83

Ph.D. Thesis – M. Moslemi McMaster University – Civil Engineering
0
1
2
3
4
5
0 30 60 90 120 150 180
Time (min)
[BrO
3- ] (m
icro
mol
e/L)
MWCO=15 KD
MWCO=8 KD
MWCO=5 KD
Fig. S2- Bromate concentration in the permeate vs. time at various MWCOs. Membrane: 7 channel, inlet O3 mass injection rate: 1.5 mg/min, initial [Br-]: 1 mg/L, temperature: 20C, pH: 6.0, ionic strength: 13.0 μM
3.8. Supporting Documentation
The retention time in the membrane can be calculated by dividing the total
volume of the membrane pores by the permeate flux.
J
VP=θ (1)
where,
θ: the retention time in the membrane (s)
VP: the total volume of the membrane pores (mL)
J: the steady state permeate flux (mL/s)
84

Ph.D. Thesis – M. Moslemi McMaster University – Civil Engineering
To obtain VP, the dense volume of the membrane material (Vmd) has to be
subtracted from its porous volume (Vmp).
mdmpP VVV −= (2)
Vmp is equal to the total volume of the membrane (including channels), minus
the volume of the channels. The length (L) and the external diameter of the
tubular ceramic membranes (D) utilized in this research were 25cm and 1cm,
respectively. Membranes were composed of 7 channels with equivalent diameters
(d) of 0.2cm. Hence, Vmp can be obtained from the following formula:
4
dL7
4
DLV
22
mp π−π= (3)
Vmd can be estimated using the following formula:
ρ= m
md
WV
where,
Wm: the weight of the membrane (g)
ρ: the density of the ceramic membrane material, 3.8 g/mL
Values for the above terms are presented in Table 3.
The retention time in the entire system can be obtained from the following formula:
(4)
(5)FJ
V
+=τ
where,
τ: the retention time in the entire system (s)
V: the total volume of water in the reactor (mL)
85
Ph.D. Thesis – M. Moslemi McMaster University – Civil Engineering
F: the bleed flow rate (mL/s)
The total volume of water in the system and the bleed flow rate for the
experiments carried out in this study were maintained at 1500 mL and 5 mL/min,
respectively. Thus, the retention times in the entire system for the membranes
with MWCOs of 5, 8, and 15 kD were equal to 126, 99, and 89 minutes,
respectively.
3.9. References
Crittenden, J., Harza, M.W. (2005) Water treatment: Principles and design. 2nd ed.
MWH, John Wiley, New Jersey.
European Union (1998) Official Journal of the European Communities, L 330,
Council Directive 98/83/EC.
Gottschalk, C., Libra, J.A., Saupe, A. (2000) Ozonation of water and waste water:
A practical guide to understanding ozone and its application. Wiley-VCH:
New York.
Haag, W.R., Hoigne, J. (1983) Ozonation of bromide-containing waters: Kinetics of
formation of hypobromous acid and bromate. Environ. Sci. Technol. 17, 261-267.
Hoigne, J., Bader, H. (1976) The role of hydroxyl radical reactions in ozonation
processes in aqueous solutions. Water Res. 10, 377-386.
Karnik, B.S., Davies, S.H.R., Chen, K.C., Jaglowski, D.R., Baumann, M.J.,
Masten, S.J. (2005) Effects of ozonation on the permeate flux of
nanocrystalline ceramic membranes. Water Res. 39, 728-734.
86

Ph.D. Thesis – M. Moslemi McMaster University – Civil Engineering
Kim, J., Van der Bruggen, B. (2010) The use of nanoparticles in polymeric and
ceramic membrane structures: Review of manufacturing procedures and
performance improvement for water treatment. Environmental Pollution 158,
2335-2349.
Kim, J., Shan, W., Daview, S.R., Baumann, M.J., Masten, S.J., Tarabara, V.
(2009) Interactions of aqueous NOM with nanoscale TiO2: Implications for
ceramic membrane filtration-ozonation hybrid process. Environ. Sci. Technol.
43, 5488-5494.
Krasner, S.W., Glaze, W.H., Weinberg, H.S., Daniel, P.A., Najm, I.N. (1993)
Formation and control of bromate during ozonation of waters containing
bromide. J. AWWA 85, 73-81.
Legube, B., Parinet, B., Gelinet, K., Berne, F., Croue, J.P. (2004) Modeling of
bromate formation by ozonation of surface waters in drinking water treatment.
Water Res. 38, 2185-2195.
Mizuno, T., Yamada, H., Tsuno, H. (2004) Formation of bromate ion through a
radical pathway in a continuous flow reactor. Ozone Sci. Eng. 26, 573-584.
Moslemi, M., Davies, S.H., Masten, S.J. (2010) Ozone mass transfer in a
recirculating loop semibatch reactor operated at high pressure. Advanced
Oxidation Technol. 13, 79-88.
Mozia, S., Tomaszewska, M., Morawski, A.W. (2006) Application of an
ozonation-adsorption-ultrafiltration system for surface water treatment.
Desalination 190, 308-314.
87

Ph.D. Thesis – M. Moslemi McMaster University – Civil Engineering
Ontario drinking-water quality standards (2002) Safe Drinking Water Act,
Ontario regulation 169/03.
Ozekin, K., Westerhoff, P., Amy, G.L., Siqqiqui, M. (1998) Molecular ozone and radical
pathways of bromate formation during ozonation. J. Environ. Eng. 124, 456-462.
Pinkernell, U., von Gunten, U. (2001) Bromate minimization during ozonation:
Mechanistic considerations. Environ. Sci. Technol. 35, 2525-2531.
Schlichter, B., Mavrov, V., Chmiel, H. (2003) Study of a hybrid process
combining ozonation and membrane filtration - filtration of model solutions.
Desalination 156, 257-265.
Siddiqui, M.S., Amy, G.L. (1993) Factors affecting DBP formation during ozone-
bromide reactions. J. AWWA 85, 63-72.
Siddiqui, M.S., Amy, G.L., Rice, R.G. (1995) Bromate ion formation: A critical
review, J. AWWA 87, 58-70.
USEPA (1998) National primary drinking water regulations: Disinfection and
disinfection byproducts. Federal Register 63, 69390-69476
Van Geluwe, S., Braeken, L., Van der Bruggen, B. (2011) Ozone oxidation for
the alleviation of membrane fouling by natural organic matter: A review.
Water Res. 45, 3551-3570.
von Gunten, U., Oliveras, Y. (1998) Advanced oxidation of bromide-containing
waters: Bromate formation mechanisms. Environ. Sci. Technol. 32, 63-70.
88

Ph.D. Thesis – M. Moslemi McMaster University – Civil Engineering
von Gunten, U., Pinkernell, U. (2000) Ozonation of bromide-containing drinking
waters: a delicate balance between disinfection and bromate formation. Water
Sci. Technol. 41, 53-59.
von Gunten, U. (2003) Ozonation of drinking water: Part II. Disinfection and by-product
formation in presence of bromide, iodide or chlorine. Water Res. 37, 1469-1487.
You, S.H., Tseng, D.H., Hsu, W.C. (2007) Effect and mechanism of ultrafiltration
membrane fouling removal by ozonation. Desalination 202, 224-230.
89
Ph.D. Thesis – M. Moslemi McMaster University – Civil Engineering
Chapter 4: Empirical Modeling of Bromate Formation during
Drinking Water Treatment Using a Hybrid
Membrane Filtration–Ozonation
4.1. Abstract
The effect of the nature of the membrane surface, hydroxyl radical scavengers,
and temperature, on bromate formation in a hybrid membrane filtration–ozonation
reactor was studied. The presence of hydroxyl radical scavengers (tertiary butyl
alcohol, t-BuOH) suppressed the indirect bromate formation pathway and less
bromate was formed. The bromate concentration that resulted with the Mn oxide
coated membrane was less than that formed with the uncoated TiO2 membrane. As
the temperature was increased, bromate formation was enhanced, which was
attributed to greater reaction rates. An empirical model was also developed to
predict bromate formation in a hybrid ozone-ceramic membrane filtration system.
The model, which takes into account the effects of important experimental
variables including initial bromide concentration, inlet ozone mass injection rate,
pH, temperature, and reaction time, was generated using multiple linear regression
method with logarithmic transformations. The model indicated that bromate
formation was favoured at high bromide concentration, ozone dose, pH, and
temperature. Good correlation was achieved between the model predictions and the
experimental data.
Keywords: modeling, bromate, ozonation, ceramic membrane, water treatment
90
Ph.D. Thesis – M. Moslemi McMaster University – Civil Engineering
4.2. Introduction
Ozone is a more powerful disinfectant than chlorine or chlorine dioxide and it
is capable of inactivating resistant pathogens including Cryptosporidium oocysts
[1]. Ozone can oxidize many organic compounds; including those responsible for
taste, odour, and color, and the precursors of chlorination by-products, such as
chloroform. It can also reduce the concentration of total organic carbon (TOC)
through mineralization and aid in coagulation through the transformation of NOM
to smaller and more polar compounds [2]. Ozone can also effectively oxidize Fe
(II) and Mn (II) [2-6]. As a result, the application of ozone in the water industry
has increased dramatically since the first full scale installation of ozone for the
treatment of potable water in Nice, France in 1906 [7-10].
Recently, a number of researchers have combined ozonation with membrane
filtration to overcome fouling problems resulting from the deposition of natural
organic matter on the membrane surface or within the pores of membrane [11-15].
In such a hybrid process, dissolved ozone reacts with organic foulants blocking
membrane pores, thereby reducing the extent of membrane fouling. This greatly
reduces the need for membrane cleaning procedures and allows for continuous
operation of the treatment system [13,16,17].
Despite all of the advantages offered by ozonation processes, they have a
major drawback: the formation of bromate. Bromate ion (BrO3-) is formed during
the ozonation of bromide (Br-) containing waters. Bromate is a potential human
carcinogen and is regulated in drinking water [18-20]. The United States
91
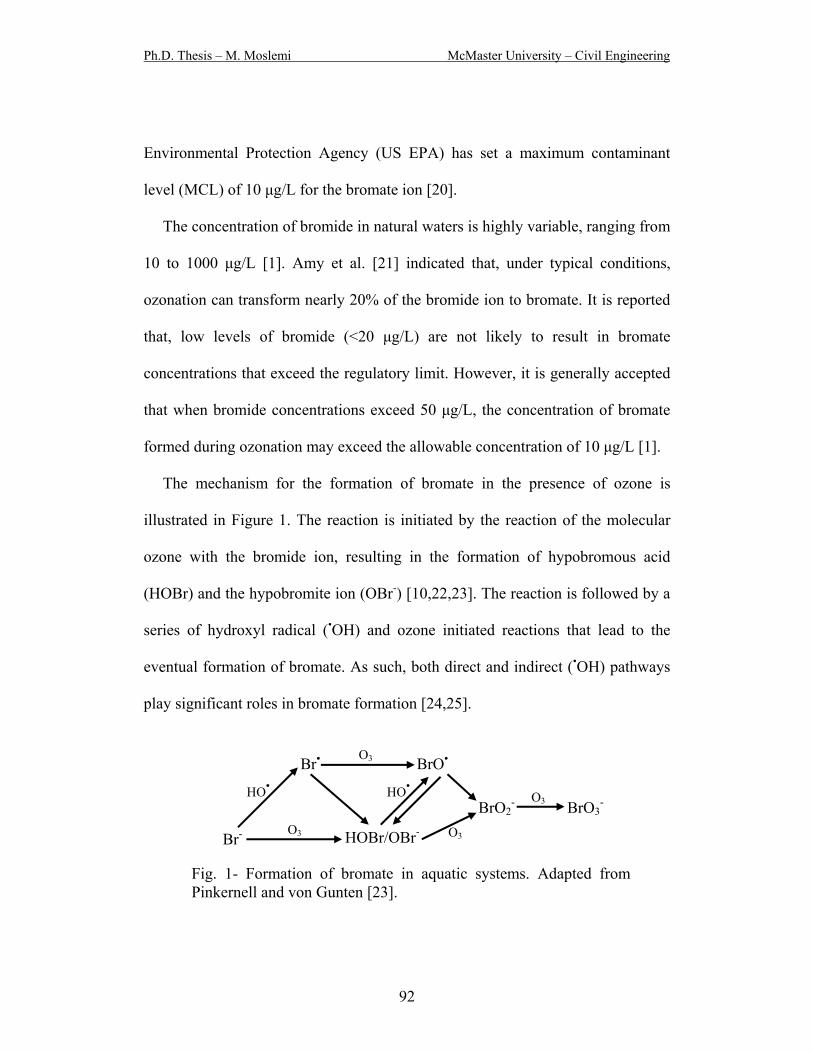
Ph.D. Thesis – M. Moslemi McMaster University – Civil Engineering
Environmental Protection Agency (US EPA) has set a maximum contaminant
level (MCL) of 10 μg/L for the bromate ion [20].
The concentration of bromide in natural waters is highly variable, ranging from
10 to 1000 μg/L [1]. Amy et al. [21] indicated that, under typical conditions,
ozonation can transform nearly 20% of the bromide ion to bromate. It is reported
that, low levels of bromide (<20 μg/L) are not likely to result in bromate
concentrations that exceed the regulatory limit. However, it is generally accepted
that when bromide concentrations exceed 50 μg/L, the concentration of bromate
formed during ozonation may exceed the allowable concentration of 10 μg/L [1].
The mechanism for the formation of bromate in the presence of ozone is
illustrated in Figure 1. The reaction is initiated by the reaction of the molecular
ozone with the bromide ion, resulting in the formation of hypobromous acid
(HOBr) and the hypobromite ion (OBr-) [10,22,23]. The reaction is followed by a
series of hydroxyl radical (•OH) and ozone initiated reactions that lead to the
eventual formation of bromate. As such, both direct and indirect (•OH) pathways
play significant roles in bromate formation [24,25].
Br-
Br• BrO•
HOBr/OBr-
BrO2- BrO3
-HO• HO•
O3
O3 O3
O3
Fig. 1- Formation of bromate in aquatic systems. Adapted from Pinkernell and von Gunten [23].
92
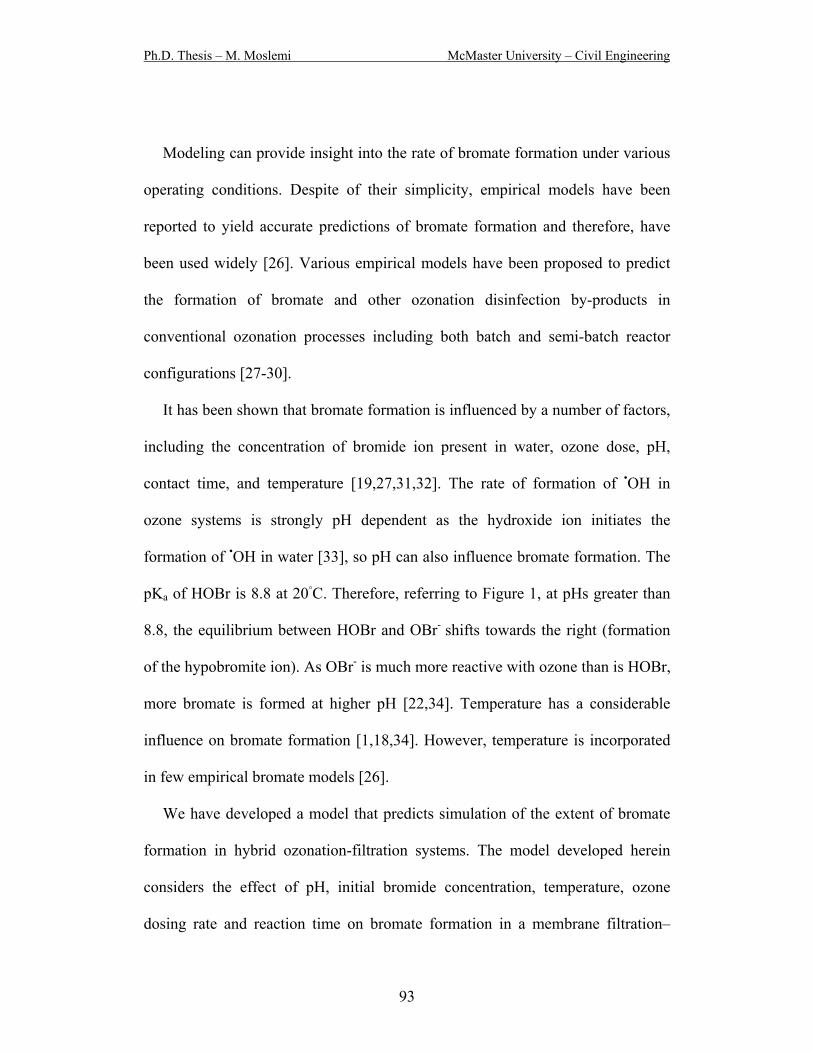
Ph.D. Thesis – M. Moslemi McMaster University – Civil Engineering
Modeling can provide insight into the rate of bromate formation under various
operating conditions. Despite of their simplicity, empirical models have been
reported to yield accurate predictions of bromate formation and therefore, have
been used widely [26]. Various empirical models have been proposed to predict
the formation of bromate and other ozonation disinfection by-products in
conventional ozonation processes including both batch and semi-batch reactor
configurations [27-30].
It has been shown that bromate formation is influenced by a number of factors,
including the concentration of bromide ion present in water, ozone dose, pH,
contact time, and temperature [19,27,31,32]. The rate of formation of •OH in
ozone systems is strongly pH dependent as the hydroxide ion initiates the
formation of •OH in water [33], so pH can also influence bromate formation. The
pKa of HOBr is 8.8 at 20C. Therefore, referring to Figure 1, at pHs greater than
8.8, the equilibrium between HOBr and OBr- shifts towards the right (formation
of the hypobromite ion). As OBr- is much more reactive with ozone than is HOBr,
more bromate is formed at higher pH [22,34]. Temperature has a considerable
influence on bromate formation [1,18,34]. However, temperature is incorporated
in few empirical bromate models [26].
We have developed a model that predicts simulation of the extent of bromate
formation in hybrid ozonation-filtration systems. The model developed herein
considers the effect of pH, initial bromide concentration, temperature, ozone
dosing rate and reaction time on bromate formation in a membrane filtration–
93

Ph.D. Thesis – M. Moslemi McMaster University – Civil Engineering
ozonation system. The influence of the type of membrane on bromate formation
was also investigated by comparing bromate formation using a commercial
ceramic membrane with a titanium oxide filtration layer and a membrane coated
manganese oxide (which catalyzes the decomposition of ozone). The importance
of hydroxyl radical formation in the system was investigated by adding the •OH
scavenger, tertiary butyl alcohol, to the system.
4.3. Materials and Methods
A recirculating loop semibatch reactor operated at high pressure was used to
carry out the experiments. Moslemi et al. [35] provides a complete description of
the experimental apparatus and methods used in this study. Experiments were
carried out to develop a database that documents the amount of bromate formed
as a function of initial bromide concentration, inlet ozone mass flow rate, pH,
temperature, and reaction time. To observe the influence of the operating
parameters on bromate formation and also in order to simplify the modeling
effort, only one parameter was varied at a time while other parameters were kept
constant.
The effects of t-butyl alcohol, a hydroxyl radical scavenger, membrane
coating, and temperature on bromate formation were investigated. Experiments
were carried out at least in duplicate. All bromate concentrations reported are the
average of triplicate analyses within experiments and the error bars in Figures 2
and 3 represent the standard deviations of the triplicate measurements.
94

Ph.D. Thesis – M. Moslemi McMaster University – Civil Engineering
4.4. Results and Discussion
4.4.1. The Role of the Hydroxyl Radical
To assess the contribution of hydroxyl radicals to bromate formation, a number
of experiments were carried out in the presence of t-BuOH, a hydroxyl radical
scavenger. t-BuOH is highly reactive towards hydroxyl radicals, but is essentially
unreactive with molecular ozone. As mentioned earlier, both direct and indirect
pathways play a role in bromate formation, however the rate constants for the
reaction of •OH with bromide are considerably greater than that of those involving
ozone. It has been reported that, as compared to the contribution of molecular
ozone, the contribution of •OH to bromate formation is more significant [24,25].
As shown in Figure 2, at pH 3.0, the addition of t-BuOH did not affect the
steady state dissolved ozone concentration in the permeate. However, at higher
pH values (6.0 and 8.0), the addition of t-BuOH considerably increased the
dissolved ozone concentration. This is not surprising, since at pH 3.0 ozone is
quite stable and the presence of t-BuOH has little effect on ozone stability and
subsequently on the dissolved ozone and OH radical concentrations [1,23]. At pH
6 and 8, the presence of t-BuOH has a pronounced effect on ozone concentration.
This is because the •OH is involved in the radical chain reaction which propagates
the ozone decomposition reaction initiated by the hydroxide ion. Figure 2 also
shows the effect of t-BuOH on the steady state bromate formation at pH values of
3.0, 6.0 and 8.0. It is apparent that regardless of pH, the addition of t-BuOH
suppresses bromate formation. This suggests that, the hydroxyl radical pathway
95
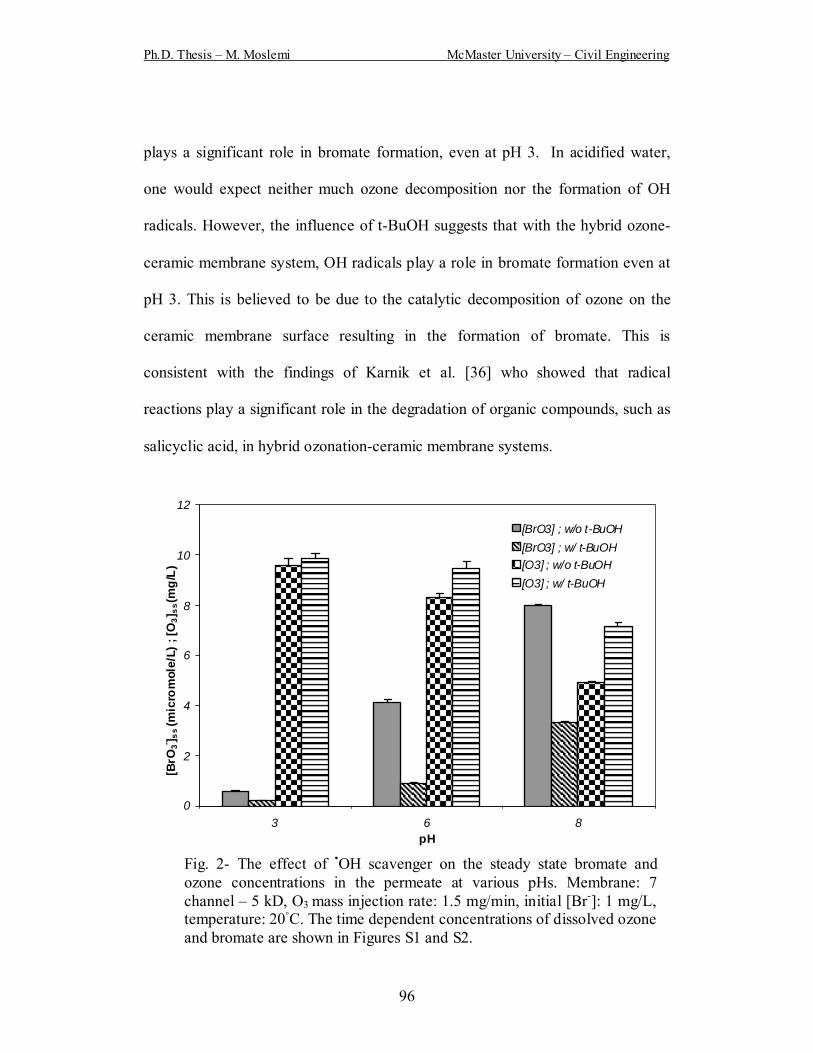
Ph.D. Thesis – M. Moslemi McMaster University – Civil Engineering
96
plays a significant role in bromate formation, even at pH 3. In acidified water,
one would expect neither much ozone decomposition nor the formation of OH
radicals. However, the influence of t-BuOH suggests that with the hybrid ozone-
ceramic membrane system, OH radicals play a role in bromate formation even at
pH 3. This is believed to be due to the catalytic decomposition of ozone on the
ceramic membrane surface resulting in the formation of bromate. This is
consistent with the findings of Karnik et al. [36] who showed that radical
reactions play a significant role in the degradation of organic compounds, such as
salicyclic acid, in hybrid ozonation-ceramic membrane systems.
0
2
4
6
8
10
12
3 6 8pH
[BrO
3- ] ss (
mic
rom
ole/
L) ;
[O3]
ss (m
g/L)
[BrO3] ; w/o t-BuOH[BrO3] ; w/ t-BuOH[O3] ; w/o t-BuOH[O3] ; w/ t-BuOH
Fig. 2- The effect of •OH scavenger on the steady state bromate and ozone concentrations in the permeate at various pHs. Membrane: 7 channel – 5 kD, O3 mass injection rate: 1.5 mg/min, initial [Br-]: 1 mg/L, temperature: 20C. The time dependent concentrations of dissolved ozone and bromate are shown in Figures S1 and S2.

Ph.D. Thesis – M. Moslemi McMaster University – Civil Engineering
4.4.2. Membrane Coating
To study the effect of coating the membrane with manganese oxide on bromate
formation, the performance of a 5 kD ceramic membrane, Inside Ceram (TAMI
North America, Saint-Laurent, Quebec), coated with 30 layers of manganese
oxide was compared with that of an uncoated membrane (see Corneal et al. [37]
for the membrane preparation method). Manganese oxide is a more efficient
catalyst of ozone decomposition than is titanium oxide (which is used in the
filtration layer of the Inside Ceram membranes) and, in the presence of ozone, the
Mn oxide coated membrane is more effective at controlling fouling on the
membrane surface than is the uncoated membrane [38]. As can be seen in Figure
3, regardless of the operating pH, the steady-state bromate concentration that
resulted with the coated membrane is less than that observed with the uncoated
membrane. This is consistent with the work of Camel and Bermond [6] who
showed that ozonation in the presence of heterogeneous catalysts reduced bromate
formation.
As shown in Table 1, at pH 3, the steady state dissolved ozone concentration
(the dissolved ozone concentration when it reaches a plateau, which was
estimated from the experimental data) that resulted when the coated membrane
was employed was 8% less than that observed with the uncoated membrane. At
pH values of 6.0 and 8.0, the corresponding reductions in dissolved ozone
concentrations were 23 and 25%, respectively. Thus, the coated membrane
enhanced ozone decomposition, which resulted in lower concentrations of
97

Ph.D. Thesis – M. Moslemi McMaster University – Civil Engineering
dissolved ozone. As it is shown in Figure 1, four reactions in the bromate
formation mechanism are dependent on the ozone concentration. Hence, the lower
concentration of bromate ion formed when the coated membrane was used in the
hybrid ozonation-membrane system may be a result of the lower ozone
concentration present in the system.
Figure 3 also shows that the presence of t-BuOH suppresses bromate formation
with both the coated and uncoated membranes. As t-BuOH scavenges hydroxyl
radicals, it will suppress the initial and intermediate steps of the bromate
formation mechanism (see Figure 1) and less bromate is formed.
Table 1- Steady state aqueous [O3] at various pH values.
Steady state aqueous [O3], (mg/L) pH
uncoated coated
3.0 9.6 8.8
6.0 8.3 6.4
8.0 4.9 3.7
Membrane: 7 channel – 5 kD, O3 mass injection rate: 1.5 mg/min, initial [Br-]: 1 mg/L, temperature: 20C.
98
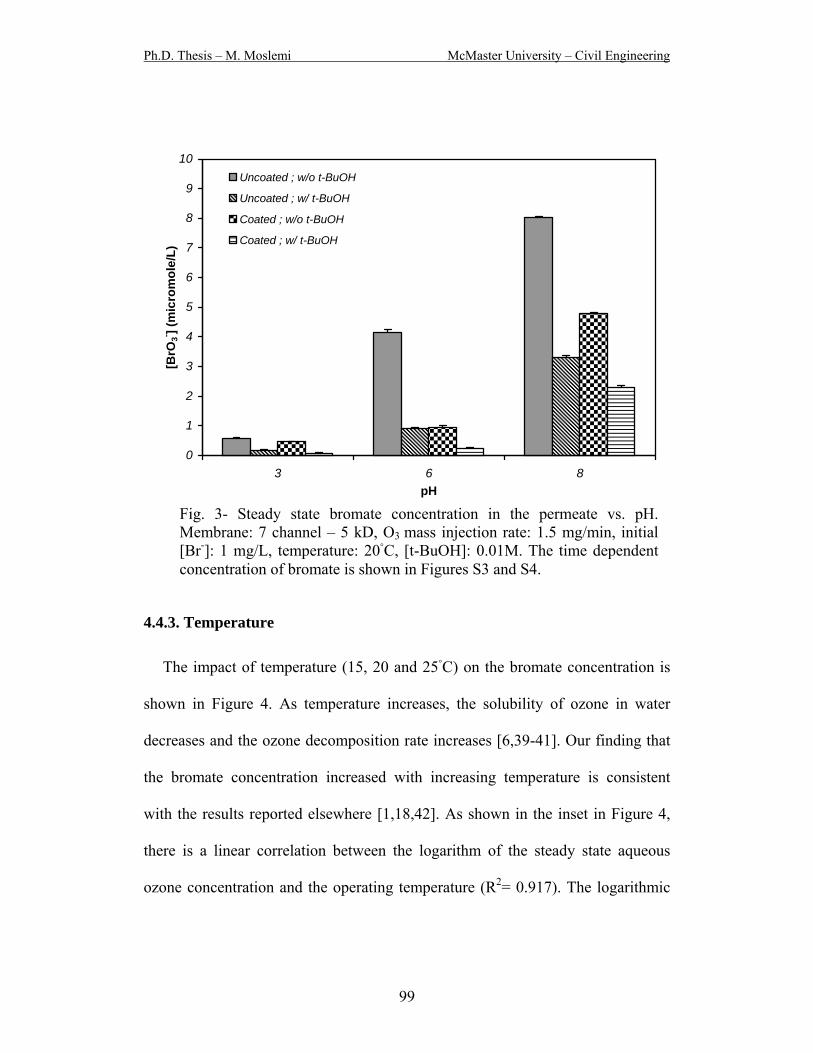
Ph.D. Thesis – M. Moslemi McMaster University – Civil Engineering
0
1
2
3
4
5
6
7
8
9
10
3 6 8pH
[BrO
3- ] (m
icro
mol
e/L)
Uncoated ; w/o t-BuOH
Uncoated ; w/ t-BuOH
Coated ; w/o t-BuOH
Coated ; w/ t-BuOH
Fig. 3- Steady state bromate concentration in the permeate vs. pH. Membrane: 7 channel – 5 kD, O3 mass injection rate: 1.5 mg/min, initial [Br-]: 1 mg/L, temperature: 20C, [t-BuOH]: 0.01M. The time dependent concentration of bromate is shown in Figures S3 and S4.
4.4.3. Temperature
The impact of temperature (15, 20 and 25C) on the bromate concentration is
shown in Figure 4. As temperature increases, the solubility of ozone in water
decreases and the ozone decomposition rate increases [6,39-41]. Our finding that
the bromate concentration increased with increasing temperature is consistent
with the results reported elsewhere [1,18,42]. As shown in the inset in Figure 4,
there is a linear correlation between the logarithm of the steady state aqueous
ozone concentration and the operating temperature (R2= 0.917). The logarithmic
99
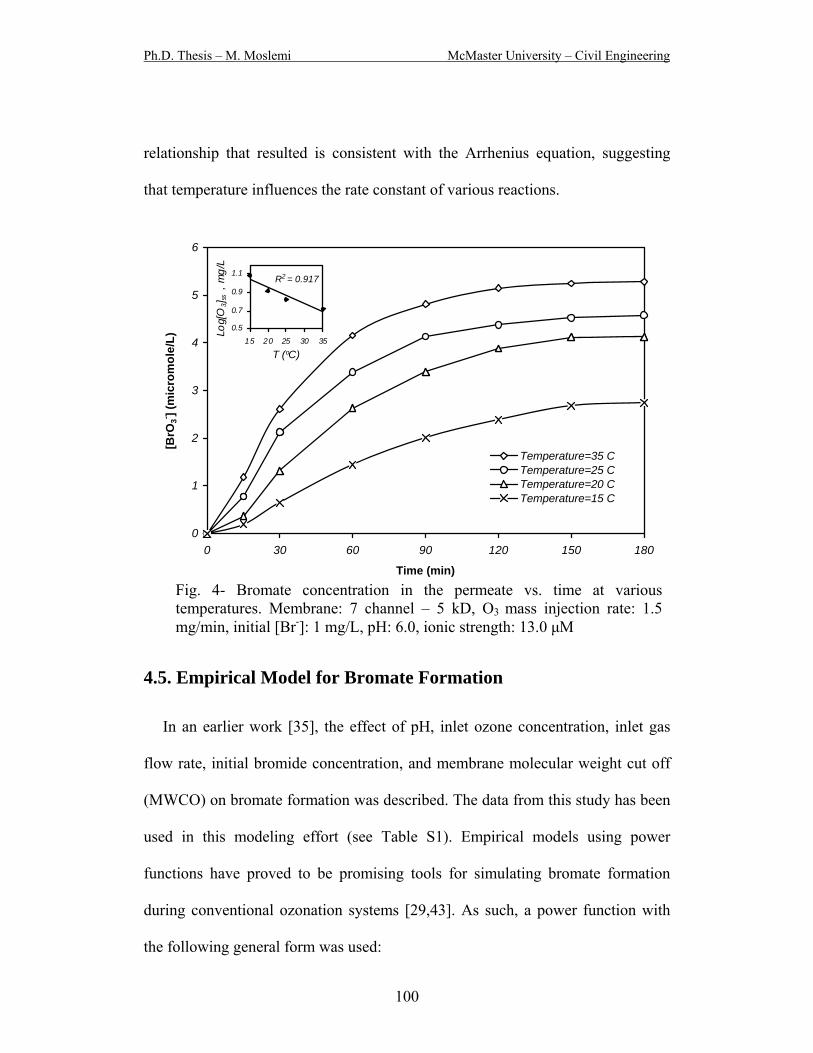
Ph.D. Thesis – M. Moslemi McMaster University – Civil Engineering
relationship that resulted is consistent with the Arrhenius equation, suggesting
that temperature influences the rate constant of various reactions.
0
1
2
3
4
5
6
0 30 60 90 120 150 180
Time (min)
[BrO
3- ] (m
icro
mol
e/L)
Temperature=35 CTemperature=25 CTemperature=20 CTemperature=15 C
R2 = 0.917
0.5
0.7
0.9
1.1
15 20 25 30 35
T (oC)
Log[
O3] s
s ,
mg/
L
Fig. 4- Bromate concentration in the permeate vs. time at various temperatures. Membrane: 7 channel – 5 kD, O3 mass injection rate: 1.5mg/min, initial [Br-]: 1 mg/L, pH: 6.0, ionic strength: 13.0 μM
4.5. Empirical Model for Bromate Formation
In an earlier work [35], the effect of pH, inlet ozone concentration, inlet gas
flow rate, initial bromide concentration, and membrane molecular weight cut off
(MWCO) on bromate formation was described. The data from this study has been
used in this modeling effort (see Table S1). Empirical models using power
functions have proved to be promising tools for simulating bromate formation
during conventional ozonation systems [29,43]. As such, a power function with
the following general form was used:
100

Ph.D. Thesis – M. Moslemi McMaster University – Civil Engineering
(1) 103
bb3 masO(]Br[10]BrO[ −− = 5432 bbbb )t()T()pH()rates
where,
[BrO3-] = bromate concentration (μg/L) in the permeate at time t
[Br-] = initial bromide concentration (μg/L) in the feed water, 50 ≤ [Br-] ≤ 1000
O3 mass rate = inlet gaseous ozone dose (mg/min), 0.5 ≤ O3 mass rate ≤ 2.25
pH = aqueous pH, 3.0 ≤ pH ≤ 8.0
T = water temperature (°C), 15 ≤ T ≤ 35
t = reaction time (min), 0 ≤ t ≤ 180
bi = regression coefficients
It should be noted that the coefficients in the model equation will vary
depending upon the water composition [44] and the reactor design and that the
empirical model developed is reactor specific and should only be used within the
boundary conditions stated herein. In order to use the linear regression method to
estimate model parameters, the power function was linearized using logarithmic
transformation. After logarithmic transformation, equation 1 can be written as:
(2) )tlog(b)Tlog(b)pHlog(b)ratemassOlog(b]Brlog[bb]BrOlog[ 54332103 +++++= −−
Two hundred and sixty three (263) data points were used to perform the
regression. Regression coefficients were determined by multiple linear regression
analysis of the experimental data using Excel. After substitution the following
empirical model is obtained. The standard error values for the coefficients [Br-],
O3 mass injection rate, pH, T, and t were determined to be 0.023, 0.050, 0.088,
0.113, and 0.022. The standard error of estimation was 0.129.
101

Ph.D. Thesis – M. Moslemi McMaster University – Civil Engineering
(3) 831.0195.1005.3927.03
430.183 )t()T()pH()ratemassO(]Br[10855.3]BrO[ −−− ×=
4.6. Model Validation
In order to validate the ability of the above model to predict bromate formation
in the hybrid system, the bromate concentrations predicted by the model for various
operating conditions were calculated using Equation 3. The sign of the coefficient
in Equation 3 indicates whether a particular variable exerts a positive or negative
influence on bromate formation. Hence, according to the model, bromate formation
is favoured at high bromide concentration, ozone dose, pH, and temperature. This is
consistent with the trends reported by Moslemi et al. [35].
Figure 5 shows the relationship between the observed bromate concentrations
and the predicted values. The dotted lines in this figure indicate the 95%
confidence intervals. Good agreement between the model predictions and
experimental results was achieved (R2=0.903). The slope of the regression line
was nearly one, which is indicative of a very good fit between the experimental
and predicted bromate concentrations. However, since the slope is greater than 1,
the model tends to slightly over-predict the bromate concentration at high
concentration and under predict at low concentration. Similarly, the model
proposed by Sohn et al. [32] overpredicted the bromate concentrations.
102
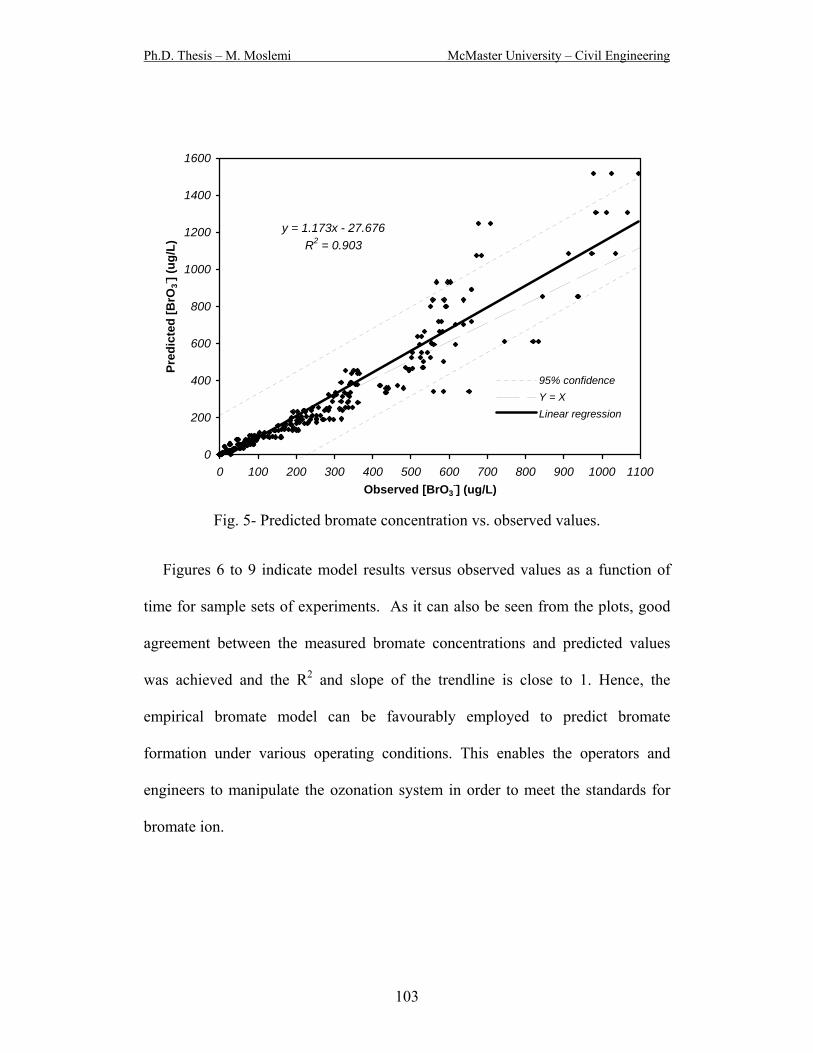
Ph.D. Thesis – M. Moslemi McMaster University – Civil Engineering
y = 1.173x - 27.676R2 = 0.903
0
200
400
600
800
1000
1200
1400
1600
0 100 200 300 400 500 600 700 800 900 1000 1100Observed [BrO3
-] (ug/L)
Pred
icte
d [B
rO3- ] (
ug/L
)
95% confidenceY = XLinear regression
Fig. 5- Predicted bromate concentration vs. observed values.
Figures 6 to 9 indicate model results versus observed values as a function of
time for sample sets of experiments. As it can also be seen from the plots, good
agreement between the measured bromate concentrations and predicted values
was achieved and the R2 and slope of the trendline is close to 1. Hence, the
empirical bromate model can be favourably employed to predict bromate
formation under various operating conditions. This enables the operators and
engineers to manipulate the ozonation system in order to meet the standards for
bromate ion.
103

Ph.D. Thesis – M. Moslemi McMaster University – Civil Engineering
0
100
200
300
400
500
0 30 60 90 120 150 180
Time (min)
[BrO
3- ] (ug
/L)
ObservedModel
y = 0.9422x + 1.5483R2 = 0.9845
0
50
100
150
200
250
0 50 100 150 200 250Observed [BrO3
-] (ug/L)
Pre
dict
ed [B
rO3- ] (
ug/L
)
0
5
10
15
20
25
30
0 30 60 90 120 150 180
Time (min)
[BrO
3- ] (ug
/L)
ObservedModel
Fig. 6- Measured and simulated bromate concentrations vs. contact time. [Br-]: 1000 μg/L, O3 mass injection rate: 0.5 mg/min, pH: 6.0, T: 20°C
y = 1.0327x + 0.1219R2 = 0.9868
0
1
2
3
4
5
6
7
8
0 1 2 3 4 5 6 7 8
Observed [BrO3-] (ug/L)
Pre
dict
ed [B
rO3- ] (
ug/L
)
Fig. 7- Measured and simulated bromate concentrations vs. contact time. [Br-]: 50 μg/L, O3 mass injection rate: 1.5 mg/min, pH: 6.0, T: 20°C
104
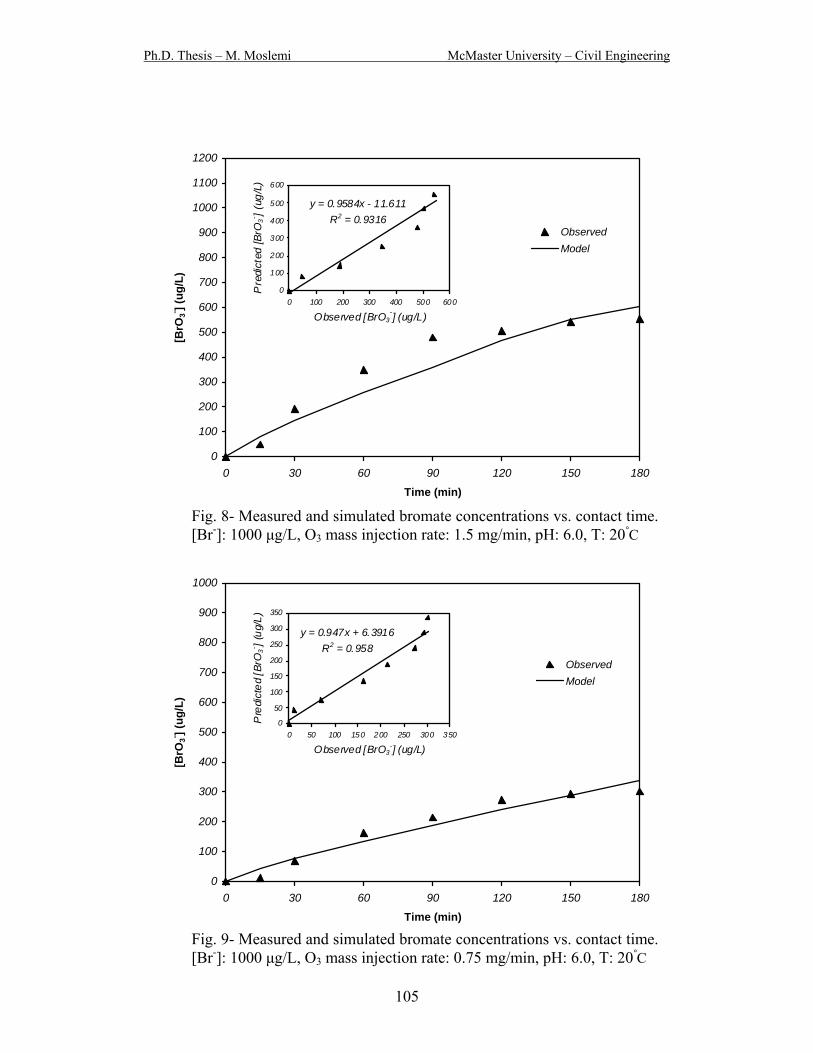
Ph.D. Thesis – M. Moslemi McMaster University – Civil Engineering
0
100
200
300
400
500
600
700
800
900
1000
1100
1200
0 30 60 90 120 150 180
Time (min)
[BrO
3- ] (ug
/L)
y = 0.9584x - 11.611R2 = 0.9316
0
100
200
300
400
500
600
0 100 200 300 400 500 600
Observed [BrO3-] (ug/L)
Pre
dict
ed [B
rO3- ] (
ug/L
)
ObservedModel
Fig. 8- Measured and simulated bromate concentrations vs. contact time. [Br-]: 1000 μg/L, O3 mass injection rate: 1.5 mg/min, pH: 6.0, T: 20°C
0
100
200
300
400
500
600
700
800
900
1000
0 30 60 90 120 150 180
Time (min)
[BrO
3- ] (ug
/L)
ObservedModel
y = 0.947x + 6.3916R2 = 0.958
0
50
100
150
200
250
300
350
0 50 100 150 200 250 300 350
Observed [BrO3-] (ug/L)
Pre
dict
ed [B
rO3- ] (
ug/L
)
Fig. 9- Measured and simulated bromate concentrations vs. contact time. [Br-]: 1000 μg/L, O3 mass injection rate: 0.75 mg/min, pH: 6.0, T: 20°C
105

Ph.D. Thesis – M. Moslemi McMaster University – Civil Engineering
4.7. Conclusion
Unlike empirical bromate models developed for conventional ozonation
processes [26,43], the model described herein demonstrates that the initial
bromide concentration plays a more significant role than does the ozone dose,
although increasing the ozone dose resulted in an increase in the steady state
bromate concentration [35].
The reduction in pH, ozone dose, and contact time can be used as strategies to
suppress bromate formation. However, the most practical bromate control
strategies would be to reduce the ozone dose or contact time. The contact time
may be decreased by increasing the operating pressure or by using coarser
membranes, which will also result in lower transmembrane pressures, decreased
energy costs, and increased the permeate flux. The choice of ozone dose and
contact time will be a compromise between the control of both fouling and
bromate concentrations. Karnik et al. [14], along with other researchers [13,16],
have shown that very low dissolved ozone concentrations (<0.3 mg/L) are needed
to maintain continuous operation of the hybrid ozonation-filtration system at a
relatively high permeate flux (more than 90% of the initial flux) without the need
for membrane cleaning. As mentioned earlier, ceramic membrane surfaces appear
to enhance ozone decomposition and hydroxyl radical formation. Hydroxyl
radicals are more efficient in terms of oxidation and the removal of ozone
resistant compounds and chlorination disinfection by-products precursors [5,6].
Therefore, besides fouling control, such hybrid processes can be effective in
106

Ph.D. Thesis – M. Moslemi McMaster University – Civil Engineering
reducing the concentration of final chlorination by-products and also inactivating
resistant pathogens.
4.8. Supporting Documentation
Dissolved ozone and bromate concentrations versus time for the experiments
carried out in the presence of hydroxyl radical scavenger (t-BuOH) are presented
in Figures S1 and S2, respectively. Figures S3 indicate the effect of membrane
coating on bromate formation at various pHs. The effect of hydroxyl radical
scavenger on bromate formation using coated and uncoated membranes is shown
in Figure S4. The following plots are representative of the data generated in the
replicate experiments. Table S1 summarizes the results of an earlier work [35]
including the effect of pH, inlet ozone concentration, inlet gas flow rate, initial
bromide concentration, and membrane molecular weight cut off on bromate
formation.
107
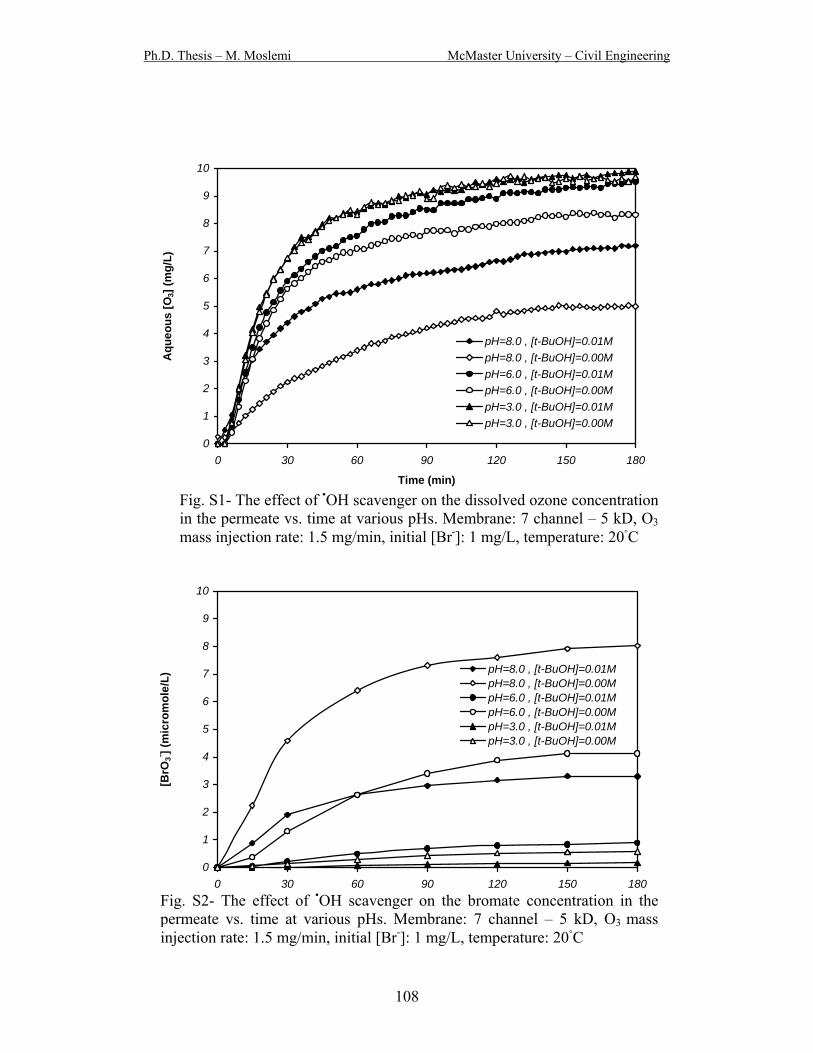
Ph.D. Thesis – M. Moslemi McMaster University – Civil Engineering
0
1
2
3
4
5
6
7
8
9
10
0 30 60 90 120 150 180
Time (min)
Aqu
eous
[O3]
(mg/
L)
pH=8.0 , [t-BuOH]=0.01MpH=8.0 , [t-BuOH]=0.00MpH=6.0 , [t-BuOH]=0.01MpH=6.0 , [t-BuOH]=0.00MpH=3.0 , [t-BuOH]=0.01MpH=3.0 , [t-BuOH]=0.00M
Fig. S1- The effect of •OH scavenger on the dissolved ozone concentration in the permeate vs. time at various pHs. Membrane: 7 channel – 5 kD, O3
mass injection rate: 1.5 mg/min, initial [Br-]: 1 mg/L, temperature: 20C
0
1
2
3
4
5
6
7
8
9
10
0 30 60 90 120 150 180
pH=8.0 , [t-BuOH]=0.01M
[BrO
3- ] (m
icro
mol
e/L) pH=8.0 , [t-BuOH]=0.00M
pH=6.0 , [t-BuOH]=0.01MpH=6.0 , [t-BuOH]=0.00MpH=3.0 , [t-BuOH]=0.01MpH=3.0 , [t-BuOH]=0.00M
Time (min)
Fig. S2- The effect of •OH scavenger on the bromate concentration in the permeate vs. time at various pHs. Membrane: 7 channel – 5 kD, O3 mass injection rate: 1.5 mg/min, initial [Br-]: 1 mg/L, temperature: 20C
108

Ph.D. Thesis – M. Moslemi McMaster University – Civil Engineering
0
1
2
3
4
5
6
7
8
9
10
0 30 60 90 120 150 180
Time (min)
[BrO
3- ] (m
icro
mol
e/L)
pH=8.0 CoatedpH=8.0 UncoatedpH=6.0 CoatedpH=6.0 UncoatedpH=3.0 CoatedpH=3.0 Uncoated
0
1
2
3
4
5
0 30 60 90 120 150 180
Time (min)
[BrO
3- ] (m
icro
mol
e/L)
pH=8.0 CoatedpH=8.0 UncoatedpH=6.0 CoatedpH=6.0 UncoatedpH=3.0 CoatedpH=3.0 Uncoated
Fig. S3- Bromate concentration in permeate vs. time at various pH values. The effect of membrane coating. Membrane: 7 channel – 5 kD, O3 mass injection rate: 1.5 mg/min, initial [Br-]: 1 mg/L, temperature: 20C, ionic strength: 512.5, 13.0 and 12.5 μM corresponding to pH 3, 6 and 8, respectively.
Fig. S4 - Bromate concentration in the permeate vs. time in the presence oft-BuOH. The effect of membrane coating. Membrane: 7 channel – 5 kD, O3
mass injection rate: 1.5 mg/min, initial [Br-]: 1 mg/L, temperature: 20C, [t-BuOH]: 0.01M
109
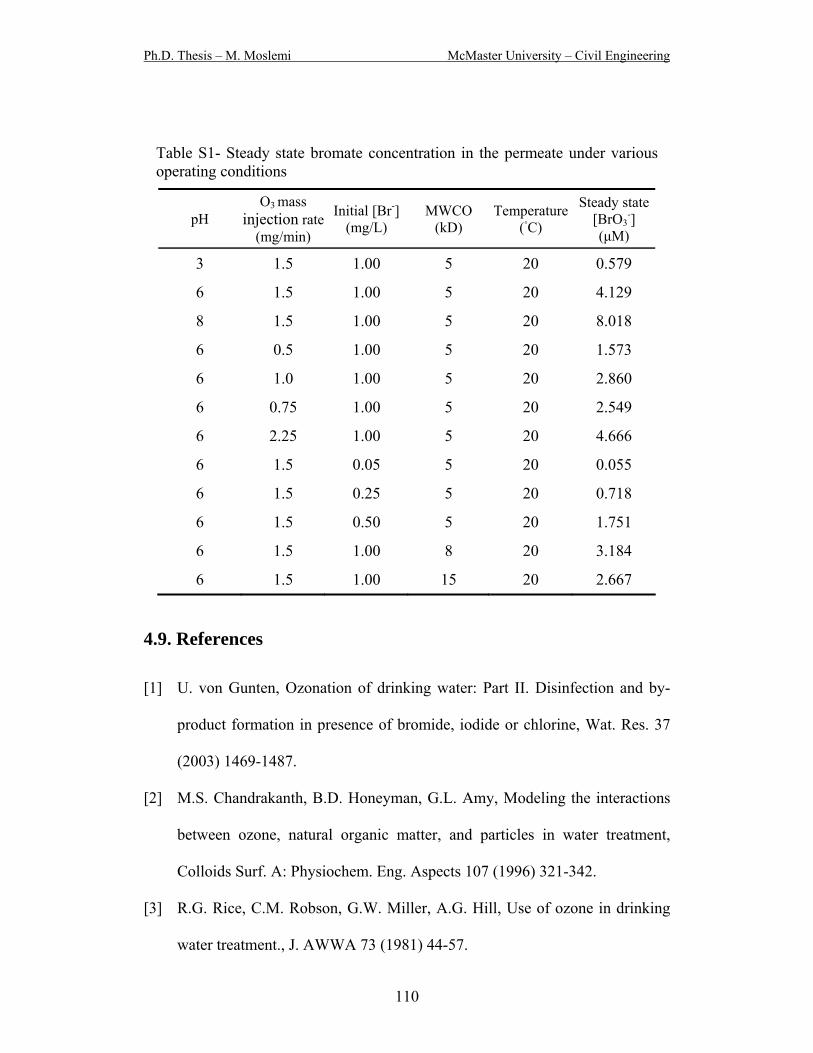
Ph.D. Thesis – M. Moslemi McMaster University – Civil Engineering
Table S1- Steady state bromate concentration in the permeate under various operating conditions
pH O3 mass
injection rate (mg/min)
Initial [Br-] (mg/L)
MWCO (kD)
Temperature(C)
Steady state [BrO3
-] (μM)
3 1.5 1.00 5 20 0.579
6 1.5 1.00 5 20 4.129
8 1.5 1.00 5 20 8.018
6 0.5 1.00 5 20 1.573
6 1.0 1.00 5 20 2.860
6 0.75 1.00 5 20 2.549
6 2.25 1.00 5 20 4.666
6 1.5 0.05 5 20 0.055
6 1.5 0.25 5 20 0.718
6 1.5 0.50 5 20 1.751
6 1.5 1.00 8 20 3.184
6 1.5 1.00 15 20 2.667
4.9. References
[1] U. von Gunten, Ozonation of drinking water: Part II. Disinfection and by-
product formation in presence of bromide, iodide or chlorine, Wat. Res. 37
(2003) 1469-1487.
[2] M.S. Chandrakanth, B.D. Honeyman, G.L. Amy, Modeling the interactions
between ozone, natural organic matter, and particles in water treatment,
Colloids Surf. A: Physiochem. Eng. Aspects 107 (1996) 321-342.
[3] R.G. Rice, C.M. Robson, G.W. Miller, A.G. Hill, Use of ozone in drinking
water treatment., J. AWWA 73 (1981) 44-57.
110
Ph.D. Thesis – M. Moslemi McMaster University – Civil Engineering
[4] W.H. Glaze, Drinking water treatment with ozone, Environ. Sci. Technol. 21
(1987) 224-230.
[5] A. Peter, U. von Gunten, Oxidation kinetics of selected taste and odour
compounds during ozonation of drinking water, Environ. Sci. Technol. 41
(2007) 626-631.
[6] V. Camel, A. Bermond, The use of ozone and associated oxidation processes
in drinking water treatment, Wat. Res. 32 (1998) 3208-3222.
[7] C. Gottschalk, J.A. Libra, A. Saupe, Ozonation of water and waste water: A
practical guide to understanding ozone and its application, Wiley-VCH, New
York, 2000.
[8] B. Langlais, D.A. Reckhow, D.R. Brink, Ozone in water treatment:
Application and engineering: Cooperative research report, AWWA Research
Foundation, Lewis Publishers, Michigan, 1991.
[9] C. Gomella, Ozone practice in France, J. AWWA 64 (1972) 39-46.
[10] J. Crittenden, M.W. Harza, Water treatment: Principles and design, second
ed. MWH, John Wiley, New Jersey, 2005.
[11] S. van Geluwe, L. Braeken, B. van der Bruggen, Ozone oxidation for the
alleviation of membrane fouling by natural organic matter: A review, Wat.
Res. 45 (2011) 3551-3570.
[12] J.W. Kim, W.Q. Shan, H.R. Davies, S.J. Masten, V.B. Tarabara, Interactions
of Aqueous NOM with Nanoscale TiO2: Implications for Ceramic
111

Ph.D. Thesis – M. Moslemi McMaster University – Civil Engineering
Membrane Filtration-Ozonation Hybrid Process, Environ. Sci. Technol 43
(2009) 5488-5494.
[13] S. Mozia, M. Tomaszewska, A.W. Morawski, Application of an ozonation-
adsorption-ultrafiltration system for surface water treatment, Desalination
190 (2006) 308-314.
[14] B.S. Karnik, S.H.R. Davies, K.C. Chen, D.R. Jaglowski, M.J. Baumann, S.J.
Masten, Effects of ozonation on the permeate flux of nanocrystalline
ceramic membranes, Wat. Res. 39 (2005) 728-734.
[15] Y.G. Park, Effect of ozonation for reducing membrane-fouling in the UF
membrane, Desalination 147 (2002) 43-48.
[16] B. Schlichter, V. Mavrov, H. Chmiel, Study of a hybrid process combining
ozonation and membrane filtration - filtration of model solutions,
Desalination 156 (2003) 257-265.
[17] S.H. You, D.H. Tseng, W.C. Hsu, Effect and mechanism of ultrafiltration
membrane fouling removal by ozonation, Desalination 202 (2007) 224-230.
[18] U. von Gunten, U. Pinkernell, Ozonation of bromide-containing drinking
waters: a delicate balance between disinfection and bromate formation, Wat.
Sci. Technol. 41 (2000) 53-59.
[19] S.W. Krasner, W.H. Glaze, H.S. Weinberg, P.A. Daniel, I.N. Najm,
Formation and control of bromate during ozonation of waters containing
bromide, J. AWWA 85 (1993) 73-81.
112
Ph.D. Thesis – M. Moslemi McMaster University – Civil Engineering
[20] USEPA, National primary drinking water regulations: Disinfection and
disinfection byproducts, Federal Register 63 (1998) 69390-69476.
[21] G.L. Amy et al., Bromate occurrence: National bromide survey, AWWARF
Report, Denver, 1993.
[22] W.R. Haag, J. Hoigne, Ozonation of bromide-containing waters: Kinetics of
formation of hypobromous acid and bromate, Environ. Sci. Technol. 17
(1983) 261-267.
[23] U. Pinkernell, U. von Gunten, Bromate minimization during ozonation:
Mechanistic considerations, Environ. Sci. Technol. 35 (2001) 2525-2531.
[24] U. von Gunten, Y. Oliveras, Advanced oxidation of bromide-containing
waters: Bromate formation mechanisms, Environ. Sci. Technol. 32 (1998)
63-70.
[25] T. Mizuno, H. Yamada, H. Tsuno, Formation of bromate ion through a
radical pathway in a continuous flow reactor, Ozone Sci. Eng. 26 (2004)
573-584.
[26] P. Jarvis, S.A. Parsons, R. Smith, Modeling bromate formation during
ozonation, Ozone Sci. Eng. 29 (2007) 429-442.
[27] R. Song, C. Donohoe, R. Minear, P. Westerhoff, K. Ozekin, G. Amy,
Empirical modeling of bromate formation during ozonation of bromide-
containing water, Wat. Res. 30 (1996) 1161-1168.
113

Ph.D. Thesis – M. Moslemi McMaster University – Civil Engineering
[28] M. Siddiqui, G. Amy, K. Ozekin, P. Westerhoff, Empirically and
theoretically-based models for predicting brominated ozonated by-products,
Ozone Sci. Eng. 16 (1994) 157-178.
[29] P. Jarvis, R. Smith, S.A. Parsons, A robust analysis of bromate formation
models, Water Practice Technol. 4 (2006) Vol 1.
[30] T. Mizuno, H. Tsuno, H. Yamada, A simple model to predict formation of
bromate ion and hypobromous acid/hypobromite ion through hydroxyl
radical pathway during ozonation, Ozone Sci. Eng. 29 (2007) 3-11.
[31] U. von Gunten, J. Hoigne, Factors controlling the formation of bromate
during ozonation of bromide containing waters, J. Water SRT-Aqua 41
(1992) 299–304.
[32] J. Sohn, G. Amy, J. Cho, Y. Lee, Y. Yoon, Disinfectant decay and
disinfection by-products formation model development: chlorination and
ozonation by-products, Wat. Res. 38 (2004) 2461–2478.
[33] J. Staehelin, J. Hoigne, Decomposition of ozone in water: Rate of initiation
by hydroxide ions and hydrogen peroxide, Environ. Sci. Technol. 16 (1982)
676-681.
[34] M.S. Siddiqui, G.L. Amy, Factors affecting DBP formation during ozone-
bromide reactions, J. AWWA 85 (1993) 63-72.
[35] M. Moslemi, S.H. Davies, S.J. Masten, Bromate Formation in a Hybrid
Ozonation – Ceramic Membrane Filtration System, Wat. Res. 45 (2011)
5529-5534.
114
Ph.D. Thesis – M. Moslemi McMaster University – Civil Engineering
[36] B.S. Karnik, S.H. Davies, M.J. Baumann, S.J. Masten, Use of salicylic acid
as a model compound to investigate hydroxyl radical reaction in ozonation-
membrane filtration hybrid process, Environ. Eng. Sci. 24 (2007) 852-860.
[37] L.M. Corneal, S.J. Masten, S.H.R. Davies, V.V. Tarabara, S. Byun, M.J.
Baumann, AFM, SEM and EDS characterization of manganese oxide coated
ceramic water filtration membranes, J. Mem. Sci. 360 (2010) 292-302.
[38] S. Byun, S.H. Davies, A.L. Alpatova, L.M. Corneal, M.J. Baumann, V.V.
Tarabara, S.J. Masten, Mn oxide coated catalytic membranes for a hybrid
ozonation-membrane filtration: Comparison of Ti, Fe and Mn oxide coated
membranes for water quality, Wat. Res. 45 (2011) 163-170.
[39] E. Rischbieter, H. Stein, A. Schumpe, Ozone solubilities in water and
aqueous salt solutions, J. Chem. Eng. Data. 45 (2000) 338-340.
[40] M. Guiza, A. Ouederni, A. Ratel, Decomposition of dissolved ozone in the
presence of activated carbon: An experimental study, Ozone Sci. Eng. 26
(2004) 299-307.
[41] J.L. Sotelo, F.J. Beltran, F.J. Benitez, J.B. Heredia, Henry's law constant for
the ozone-water system, Wat. Res. 23 (1989) 1239-1246.
[42] A. Driedger, E. Staub, U. Pinkernell, B. Marinas, W. Koster, U. von Gunten,
Inactivation of Bacillus Subtilis spores and formation of bromate during
ozonation, Wat. Res. 37 (2001) 2950-2960.
115

Ph.D. Thesis – M. Moslemi McMaster University – Civil Engineering
[43] R. Song, R. Minear, P. Westerhoff, G. Amy, Modeling and risk analysis of
bromate formation from ozonation of bromide-containing waters, Water Sci.
Technol. 34 (1996) 79-85.
[44] J.H. Kim, U. von Gunten, B.J. Marinas, Simultaneous prediction of
Cryptosporidium parvum oocyst inactivation and bromate formation during
ozonation of synthetic waters, Environ. Sci. Technol. 38 (2004) 2232-2241.
116
Ph.D. Thesis – M. Moslemi McMaster University – Civil Engineering
Chapter 5: Disinfection By-products Formation in the Presence
of NOM in a Hybrid Ceramic Membrane
Filtration – Ozonation
5.1. Abstract
The effect of pH, inlet ozone mass injection rate, natural organic matter (NOM)
concentration, initial bromide concentration, membrane coating, hydroxyl radical
scavenger, and membrane molecular weight cut off (MWCO) on the formation of
disinfection by-products (including bromate (BrO3-), chloroform (CHCl3),
bromoform (CHBr3), dichlorobromomethane (CHBrCl2), dibromochloromethane
(CHBr2Cl), and also the effect of inlet ozone mass injection rate on the formation
of halo acetic acids (HAAs) in a hybrid membrane filtration–ozonation reactor
treating bromide containing water was studied. Furthermore, variations in the
TOC, UV254, SUVA (specific UV absorbance), color and turbidity of water as
function of these parameters were investigated. Bromate formation increased with
increasing inlet gaseous ozone mass injection rate, and initial bromide
concentration. TTHMs (total trihalomethanes) formation favoured at high initial
bromide concentration. In the presence of NOM less bromate was formed. The
extent of bromate formation decreased with decreasing pH. The presence of
hydroxyl radical scavengers (tertiary butyl alcohol (t-BuOH)) significantly reduced
bromate and TTHM formation. The bromate and TTHM concentrations that were
observed with the Mn oxide coated membrane were less than that formed with the
117
Ph.D. Thesis – M. Moslemi McMaster University – Civil Engineering
uncoated TiO2 membrane. An increase in the bromate concentration was observed
with decreasing MWCO of the filtration membrane. Consistent with earlier work,
experimental results indicated that ozonation can be used to overcome membrane
fouling problem by maintaining a minimum dissolved ozone concentration in the
system. This allows for continuous operation of the hybrid ozonation-membrane
filtration system at a relatively high permeate flux as compared to the original
permeate flux obtained with pure water. An empirical model was also developed
using multiple linear regression method to estimate bromate formation in the
system as a function of bromide concentration, dissolved organic carbon (DOC)
concentration, inlet ozone mass injection rate, pH, and reaction time. Good
correlation was achieved between the model predictions and the experimental data.
According to the model, bromate formation was favoured as bromide
concentration, ozone mass injection rate, and pH increased. However, increase in
DOC exerted reverse effect on bromate formation.
Keywords: bromide, bromate, THMs, ozonation, ceramic membrane, modeling
5.2. Introduction
Pressure driven membrane filtration has recently gained increasing application
in drinking water treatment (Gottschalk et al., 2000, Schlichter et al., 2003).
However, such systems have a major disadvantage which is the fouling of the
membrane due to the deposition of organic material on the membrane and inside
the membrane. A solution to the fouling problem is to inject ozone into the
118

Ph.D. Thesis – M. Moslemi McMaster University – Civil Engineering
membrane filtration system. It has been shown that ozone is able to decompose
NOM species and remove them from the membrane surface and, as such, prevent
fouling (Van Geluwe et al., 2011, Kim et al., 2010, Mozia et al., 2006; Karnik et
al., 2005).
The incorporation of a strong oxidizer such as ozone into the water treatment
system can lead to the formation of disinfection by-products, some of which could
be of health concern to humans. For instance, the bromide ion (Br-) in drinking
water does not exert adverse health effects on human beings (Siddiqui et al.,
1995); however, the ozonation of bromide containing waters can result in the
formation of organic and inorganic by-products such as bromate, trihalomethanes
(THMs), and haloacetic acids (HAAs), which are potential carcinogens (Morris et
al., 1992) and are regulated in drinking water. The United States Environmental
Protection Agency (USEPA), the Ministry of the Environment (Ontario Safe
Drinking Water Act, Canada), and the European Union have set the maximum
contaminant level (MCL) for bromate at 0.01 mg/L. The MCL for TTHMs is
0.08, 0.1, and 0.1 as set by USEPA, the Ontario Ministry of the Environment, and
the European Union, respectively (Ontario drinking-water quality standards,
2002; European Union, 1998; USEPA, 1998). Although ozone is a much stronger
disinfectant than conventional disinfectants such as chlorine, it is very short-lived
(Evans, 1972). Therefore, in order to maintain residual disinfectant in the
distribution system a secondary and long-lasting disinfectant such as chlorine
119

Ph.D. Thesis – M. Moslemi McMaster University – Civil Engineering
needs to be eventually added to water, leading to the potential formation of
TTHMs and HAAs.
Bromate is formed through multistage reactions of molecular ozone and OH
radicals with the bromide ion (Leqube et al., 2004; Pinkernell and von Gunten,
2001) OH radicals are generated as a result of ozone decomposition in the
aqueous phase or on the solid surface. Both direct (involving molecular ozone)
and indirect (involving OH radicals) pathways play a role in bromate formation;
however the rate constants for the reaction of OH radicals with bromide are
considerably greater than that of ozone molecule and according to literature
(Mizuno et al., 2004; von Gunten and Oliveras, 1998) OH radicals contribute
more significantly to bromate formation than molecular ozone does. Bromide and
brominated compounds present in the ozonation system can react with NOM and
form bromo-organic by-products such as bromoform. Furthermore, in the post
chlorination step, chlorine can also react with NOM and brominated organic by-
products present in the ozonation system and contribute to the formation of
various forms of THMs and HAAs (Camel and Bermond, 1998).
Hence, it is crucial to study DBP formation during drinking water treatment of
bromide containing waters using ozonation systems. This study focuses on DBP
formation in hybrid ozonation-membrane filtration systems in the presence of
NOM and investigates the influence of important operating parameters including
pH, inlet ozone mass injection rate, NOM concentration, initial bromide
120
Ph.D. Thesis – M. Moslemi McMaster University – Civil Engineering
concentration, membrane coating, hydroxyl radical scavenger, and membrane
MWCO on DBP concentrations.
Moreover, an empirical model was generated to predict bromate formation in
hybrid ozonation-filtration systems. Power function with multiple linear regression
was used for the modeling purpose. This method has been widely used by
researchers (Mizuno et al., 2007; Jarvis et al., 2007; Sohn et al., 2004, Song et al.,
1996) for the modeling of DBPs formation in conventional ozonation systems and
satisfactory results have been reported. The independent variables used in the
model included bromide concentration, dissolved organic carbon concentration,
ozone mass injection rate, pH, and reaction time.
5.3. Materials and Methods
5.3.1. Experimental Setup
Figure 1 shows the schematic of the experimental apparatus used in this study
(also Fig. A1). The system was designed to withstand pressures of up to 550 kPa
(80 psi) and pressurized using nitrogen gas. The experimental apparatus was
equipped with two high-pressure stainless steel tanks with capacities of 5 and 8
liters (Fig. A2). The smaller tank was located in the recycle line to supply the
system with the feed water. The second tank operated as reserve raw water supply
to replace the water lost from the system through permeation and bleeding and
was connected to the main tank through a solenoid valve (Type 6013, Bürkert
Corp., USA ), which was programmed to maintain a constant water level in the
121

Ph.D. Thesis – M. Moslemi McMaster University – Civil Engineering
main tank. The total water volume and the pressure inside the reactor were
maintained at 1.5 L and 138 kPa (20 psi), respectively, throughout the
experiments. All equipment, tubing and connections were made of ozone resistant
materials and were either Teflon® or 316-stainless steel. Water was circulated in
the loop at a flow rate of 200 mL/min using a gear pump (Model 000-380,
Micropump Inc., USA). The water inside the tank was mixed as a result of the
turbulence produced by the jet of water as it was returned to the tank.
Gaseous ozone was generated from pressurized oxygen gas (having a purity of
99.999%) using a corona discharge ozone generator (Absolute Ozone
AE15MC80P, Absolute System Inc., Edmonton, AB, Canada). The gaseous
ozone concentration was adjusted by varying the ozone generator’s voltage.
Ozone gas was injected into the water stream flowing in the recirculation loop
through a Swagelok Tee fitting (Model SS-400-3, Swagelok, USA). Ozone was
transferred from the gas phase to the aqueous phase, as a result of the hydraulic
mixing inside the reactor. The inlet gas flow rate was adjusted to the desired
values using a digital flow-controller (Model MC-500SCCM-D, Alicat Scientific
Inc., USA). Any gas exhausted from the system was destroyed by purging the gas
through a potassium iodide (2% KI) solution. A pressure regulator (Model
KCB1F0A2A5P20000, Swagelok, USA) was employed to monitor and regulate the
pressure in the recirculation loop. The water temperature was kept at 20 ± 0.1 ⁰C by
recycling water through a water coil which was installed inside the main tank
122

Ph.D. Thesis – M. Moslemi McMaster University – Civil Engineering
(Fig. A3). The temperature of the chilled water was controlled using a refrigerated
circulator bath (NESLAB RTE-10, Thermo Fisher Scientific, USA).
In these experiments, tubular ultrafiltration (UF) ceramic membranes (TAMI
North America, QC, Canada) with nominal molecular weight cut offs of 5, 8 and
15 kilodaltons (kD) were used (Fig. A4). UF membranes, rather than
nanofiltration (NF) membranes, were chosen because the desired flux can be
achieved at a lower operating pressure with a UF membrane than with an NF
membrane. Ceramic membranes were used as they are ozone resistant. The active
length and the external diameter of the employed membranes were 25 cm and 10
mm, respectively. A stainless steel housing (TAMI North America, QC, Canada)
was used to hold the membrane.
A bleed line was installed in the recycle loop to allow the retentate to be
sampled. The bleed flow rate was set to 5.0 mL/min using a digital flow-
controller (Model LC-50CCM-D, Alicat Scientific Inc., USA). A digital flow
meter (Model L-5LPM-D, Alicat Scientific Inc., USA) and a digital pressure
gauge (Model 2074, Ashcroft Inc., USA) were mounted in the loop to monitor the
water flow rate and pressure within the system. The permeate flux was
continuously measured using a balance (Adventurer Pro, Ohaus Corporation,
USA). Temperature, pressure, and cross flow rate were continuously recorded
using a data acquisition system (LabView, National Instruments, USA).
123

Ph.D. Thesis – M. Moslemi McMaster University – Civil Engineering
O2
O3 generator O3 monitor O3 destruction Vent
F F
P P
Feed tank Main tank P
P
F P
Bleed
F P
Retentate
N2 Valve
Pump
Pressure gauge
Flow meter
F
UV/Vis Spectrophotometer
Permeate Bleed
Fig. 1- Schematic of the experimental setup.
5.3.2. Analytical Methods
The experiments were continued for 180 min, and samples were taken from
both permeate and retentate lines during the experiments. The concentrations of
aqueous ozone in the permeate and the retentate were measured using the indigo
colorimetric method 4500-O3 (Standard Methods, APHA). To quench further
ozone reactions, the residual dissolved ozone in the samples were immediately
purged by bubbling nitrogen gas through the sample for 2 minutes. Prior to
analysis, water samples were filtered through a 0.45 μm microfilter (Millipore). A
124

Ph.D. Thesis – M. Moslemi McMaster University – Civil Engineering
UV/Vis spectrophotomer (Model 4054, Pharmacia LKB, Biochrom Ltd., UK) was
used to measure the UV254 of the samples at a wavelength of 254 nm.
The TOC of the water samples was measured in triplicate using a TOC
analyzer (Model 1010 Analyzer, OI Analytical, College Station, TX). Color and
turbidity of the water samples were measured using a spectrophotometer (DR
2000, Hach Company, USA). pH was measured using a pH meter (pHTestr 30,
Eutech Instruments, Illinois, USA). The inlet ozone gas concentration was also
continuously measured using a UV ozone monitor (Model 454H, Teledyne
Instruments, USA).
Bromide and bromate concentrations in the samples were measured in
triplicate using an ion chromatograph, consisting of a high performance liquid
chromatography system (Model 230, Varian ProStar, USA) with an anion-
exchange column (IonPac AS23, Dionex Corp., USA) a guard column (IonPac
AG23, Dionex Corp., USA), an anion micromembrane suppressor (AMMS III -
4mm, Dionex Corp., USA) and a conductivity detector (CD25A, Dionex Corp.,
USA). The analysis was carried out in accordance with the method proposed by
Dionex (Application Note 184, Dionex Corp., USA). The solution of 4.5 mM
sodium carbonate (NaCO3) (99.5%, EMD, USA) and 0.8 mM sodium bicarbonate
(NaHCO3) (99.7%, Sigma-Aldrich, Germany) was used as the mobile phase. The
column flow rate was 1 mL/min.
Following the experiments, the simulated distribution system (SDS) THMs and
SDS HAAs was measured in order to simulate the formation of THMs and HAAs
125

Ph.D. Thesis – M. Moslemi McMaster University – Civil Engineering
in the drinking water distribution system. To this end, water samples were dosed
with chlorine at a concentration to achieve a residual chlorine in the range of 0.5-
2 mg/L after 48 hr incubation at room temperature. SDS THMs and SDS HAAs
were measured in triplicate in accordance with the oxidant demand method 2350
(Standard Methods, APHA) and EPA method 552.3 (USEPA, 2003), respectively.
A Perkin Elmer Autosystem gas chromatography machine (Perkin Elmer
Instruments, Shelton, CT) with an electron capture detector (ECD) and a 30 m
long x 0.25 mm ID, 1 μm DB-5ms column (J&W Scientific, Folsom, CA) was
employed to measure the concentration of chloroform, dichlorobromomethane,
dibromochloromethane, and bromoform in accordance with the method 5710
(Standard Methods, APHA). Hexane was used to extract these compounds from
water. An autosampler was used to inject 1 mL of sample onto the column.
Nitrogen at a flow rate of 12 mL/min was used as the carrier gas. The
temperatures of the injector and the detector were set to 275 °C and 350 °C,
respectively. The temperature of the oven was increased from 50 to 150 °C at a
rate of 10 °C/min.
The concentrations of monobromoacetic acid, monochloroacetic acid,
dichloroacetic acid, trichloroacetic acid, and dibromoacetic acid were measured
using the gas chromatography machine with a 30 m long x 0.32 mm ID, 3 μm
DB-1 column (J & W Scientific, Folosom, CA). The volume of the sample
injected onto the column was 5 mL. Nitrogen at a flow rate of 10 mL/min was
used as the carrier gas. The temperatures of the injector and the detector were set
126
Ph.D. Thesis – M. Moslemi McMaster University – Civil Engineering
to 200 °C and 260 °C, respectively. The temperature of the oven was set to 40 °C
for 15 min following which it was increased to 75 °C at a rate of 5 °C/min and
maintained at that temperature for 5 min.
5.3.3. Reagents
Ultrapure water (Milli-Q water with resistivity greater than 18 MΩ) was used
to prepare all reagents and solutions. Raw water was prepared by spiking Milli-Q
water with sodium bromide (NaBr) to obtain the desired concentrations. To attain
the desirable NOM concentration, Suwannee River NOM (1R101N RO isolation,
48.8% C (w/w), International Humic Substances Society, MN, USA) was added
to the raw water. Subsequently, the pH of the water was adjusted to the desired
value by adding phosphoric acid (H3PO4) (99.99%, Sigma-Aldrich, USA) and/or
sodium hydroxide (NaOH) (98.0+%, Fluka, Germany). The water was not
buffered, since our experimental results showed that the pH did not vary over the
course of the experiment. Tertiary butyl alcohol (Fisher Scientific, Germany) was
used as hydroxyl radical scavenger. Following preparation, the raw water was
stirred with a magnetic stirrer for 15 min. Bromide and bromate standards were
prepared using sodium bromide (99.995% (metals basis), Fluka, Germany) and
sodium bromate (NaBrO3) (99.7+%, Fisher Scientific, USA).
127

Ph.D. Thesis – M. Moslemi McMaster University – Civil Engineering
5.4. Results and Discussion
Experimental results presented herein indicate percent reduction in disinfection
by-products concentration and also TOC, UV254, SUVA, color and turbidity as a
result of treating the raw water in the hybrid ozonation-ceramic membrane
filtration system for 180 min as compared to the data obtained for raw water. In
all figures and tables the steady state concentrations in the permeate line were
used to calculate the percent reductions in various parameters. Experiments were
carried out at least in duplicate. Data reported are averages of triplicate analyses
within replicate experiments. Table 1 summarizes the TTHMs concentrations
observed in the permeate under various operating conditions.
Table 1- TTHMs concentrations in the permeate under various operating conditions.
MWCO
(kD) [NOM]
(mgC/L) pH
Inlet O3
mass injection
rate (mg/min)
[Br-]0
(mg/L) [CaCl2]0
(mM) [t-BuOH]0
(mM)
TTHMs t=0 min (ppb)
TTHMs t=180 min
(ppb)
5 10 6 1.5 1 1 0 379 204
5 10 6 1.0 1 1 0 315 256
5 10 6 0.5 1 1 0 329 251
5 10 6 0.25 1 1 0 314 257
5 10 6 0.5 0.25 1 0 234 126
5 10 8 0.5 1 1 0 527 411
5 10 6 0.5 1 1 1 462 266
5 10 6 1.5 1 1 1 479 184
5-coated 10 6 0.5 1 1 0 359 211
15 10 6 0.5 1 1 0 410 275
1 10 6 0.5 1 1 0 400 243
128

Ph.D. Thesis – M. Moslemi McMaster University – Civil Engineering
5.4.1. Effect of inlet ozone mass injection rate
The effects of the inlet ozone mass injection rate (0.25, 0.50, 1.00, 1.50
mg/min) on bromate concentrations are shown in Figure 2. The steady state
aqueous ozone concentration was found to be directly proportional to the inlet
ozone mass injection rate (see Chapter 3). As observed, increases in inlet ozone
mass injection rate resulted in greater bromate concentrations in the permeate. In
the presence of NOM a large portion of the dissolved ozone and hydroxyl radicals
present in water can be expected to react with NOM. Hence, less ozone and
hydroxyl radicals would be available to transform the bromide ion to bromate and
therefore in the presence of NOM, bromate formation is suppressed. Our
experimental results which verify this (see Figure 2), are consistent with the
findings of Siddiqui et al., 2005 who showed that in homogeneous systems the
presence of NOM suppressed bromate formation.
As shown in Figure 3, as a result of an increase in the inlet ozone mass
injection rate, only minor variations in the percent reductions in the
concentrations of CHCl3, CHBrCl2, and CHBr2Cl were observed. Unlike the other
DBPs studied, ozonation resulted in an increase in the concentration of
bromoform. However, increasing the inlet ozone mass injection rate resulted in
lower steady state concentrations of bromoform, although there was always an
increase in concentration with ozonation. This is believed to be due to the fact that
at greater inlet ozone mass injection rates, the majority of bromide ions present in
the water are transformed to bromate and hence fewer bromide ions are available
129
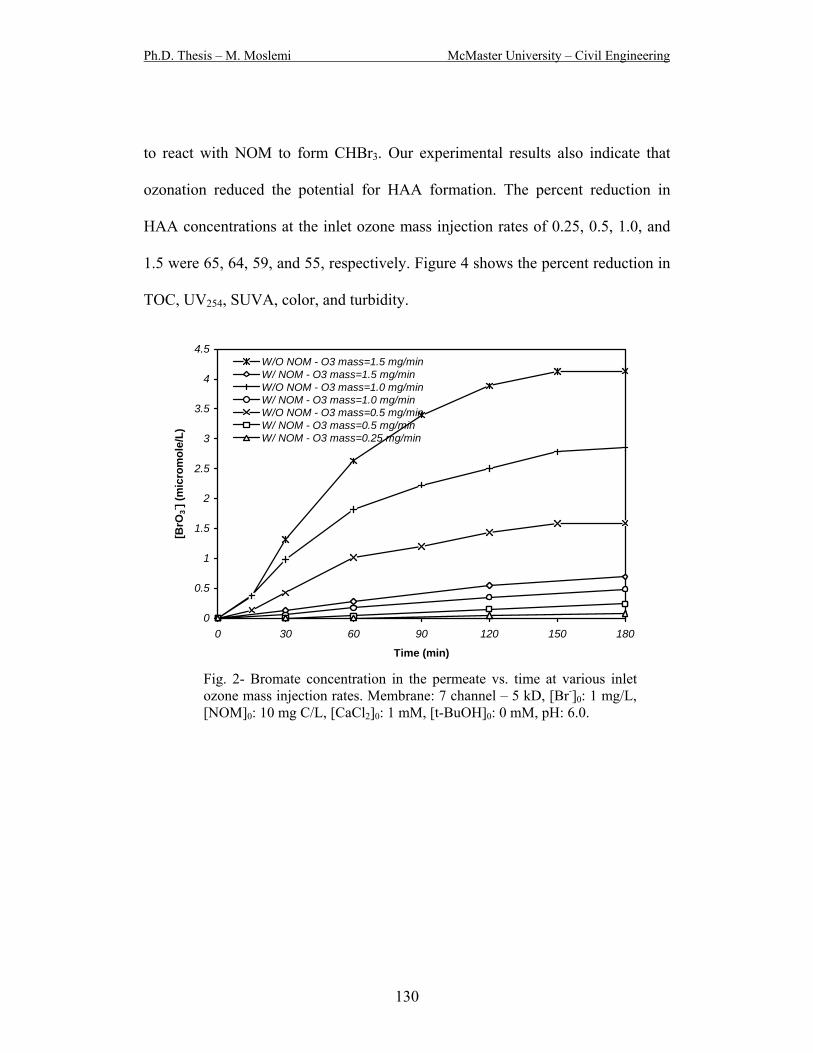
Ph.D. Thesis – M. Moslemi McMaster University – Civil Engineering
to react with NOM to form CHBr3. Our experimental results also indicate that
ozonation reduced the potential for HAA formation. The percent reduction in
HAA concentrations at the inlet ozone mass injection rates of 0.25, 0.5, 1.0, and
1.5 were 65, 64, 59, and 55, respectively. Figure 4 shows the percent reduction in
TOC, UV254, SUVA, color, and turbidity.
0
0.5
1
1.5
2
2.5
3
3.5
4
4.5
0 30 60 90 120 150 180
Time (min)
[BrO
3- ] (m
icro
mol
e/L)
W/O NOM - O3 mass=1.5 mg/minW/ NOM - O3 mass=1.5 mg/minW/O NOM - O3 mass=1.0 mg/minW/ NOM - O3 mass=1.0 mg/minW/O NOM - O3 mass=0.5 mg/minW/ NOM - O3 mass=0.5 mg/minW/ NOM - O3 mass=0.25 mg/min
Fig. 2- Bromate concentration in the permeate vs. time at various inlet ozone mass injection rates. Membrane: 7 channel – 5 kD, [Br-]0: 1 mg/L, [NOM]0: 10 mg C/L, [CaCl2]0: 1 mM, [t-BuOH]0: 0 mM, pH: 6.0.
130

Ph.D. Thesis – M. Moslemi McMaster University – Civil Engineering
-300
-250
-200
-150
-100
-50
0
50
100
150
CHCl3 CHBrCl2 CHBr2Cl CHBr3 TTHMs
% R
educ
tion
O3 mass= 1.5 mg/minO3 mass= 1.0 mg/minO3 mass= 0.5 mg/minO3 mass= 0.25 mg/min
Fig. 3- Percent reduction in the steady state DBPs concentration at various inlet ozone mass injection rates. Membrane: 7 channel – 5 kD, [Br-]0: 1 mg/L, [NOM] 0: 10 mg C/L, [CaCl2] 0: 1 mM, [t-BuOH] 0: 0 mM, pH: 6.0.
0
20
40
60
80
100
120
TOC UV254 SUVA Color Turbidity
% R
educ
tion
O3 mass= 1.5 mg/minO3 mass= 1.0 mg/minO3 mass= 0.5 mg/minO3 mass= 0.25 mg/min
Fig. 4- Percent reduction at various inlet ozone mass rates. Membrane: 7 channel – 5 kD, [Br-]0: 1 mg/L, [NOM]0: 10 mg C/L, [CaCl2]0: 1 mM, [t-BuOH]0: 0 mM, pH: 6.0.
131
Ph.D. Thesis – M. Moslemi McMaster University – Civil Engineering
5.4.2. Effect of Initial Bromide Concentration
In another set of experiments, the influence of the initial bromide concentration
on DBP formation was studied. As it is shown in Figure 5, as the initial bromide
concentration was increased from 0.25 to 1.0 mg/L, the concentration of bromate
ion increased as well, indicating that as more bromide ion was available to react
with molecular ozone and/or hydroxyl radicals, more bromate was produced. This
finding is consistent with the results reported by Moslemi et al., 2011 who studied
the effect of the initial bromide concentration on bromate formation in the
absence of NOM. As shown in Figure 6, the concentration of TTHMs formed was
increased. As the initial bromide ion was reduced, less bromide would be
available to participate in the reactions leading to THM formation. The steady
state ozone concentrations in the permeate for the experiments with the initial
bromide concentrations of 0.25 and 1.0 mg/L were equal to 0.81 and 0.72 mg/L,
respectively.
132

Ph.D. Thesis – M. Moslemi McMaster University – Civil Engineering
0
0.5
1
1.5
2
0 30 60 90 120 150 180Time (min)
[BrO
3- ] (m
icro
mol
e/L)
[Br-]=1.0 mg/L[Br-]=0.25 mg/L
Fig. 5- Bromate concentration in the permeate vs. time at various initial bromide
concentrations. Membrane: 7 channel – 5 kD, inlet O3 mass injection rate: 0.5 mg/min, [NOM]0: 10 mg C/L, [CaCl2]0: 1 mM, [t-BuOH]0: 0 mM, pH: 6.0.
-300
-250
-200
-150
-100
-50
0
50
100
150
CHCl3 CHBrCl2 CHBr2Cl CHBr3 TTHMs
% R
educ
tion
Initial [Br-]= 1.0 mg/L
Initial [Br-]= 0.25 mg/L
Fig. 6- Percent reduction in DBPs concentration at various initial bromide
concentrations. Membrane: 7 channel – 5 kD, inlet O3 mass injection rate: 0.5 mg/min, [NOM]0: 10 mg C/L, [CaCl2]0: 1 mM, [t-BuOH]0: 0 mM, pH: 6.0.
133

Ph.D. Thesis – M. Moslemi McMaster University – Civil Engineering
5.4.3. Effect of NOM Concentration
The effect of NOM concentration (1, 5, and 10 mg C/L) on disinfection by-
product formation and other water quality parameters was investigated. The
reaction of ozone with NOM is faster than the reaction of ozone with bromide ion
(Siddiqui et al., 1995). As mentioned earlier, as the concentration of NOM is
increased fewer ozone and OH radicals are available in the solution to react with
the bromide ion to form bromate. NOM also reacts with the bromide ion and thus
reduces the potential for bromate formation (Westerhoff et al., 1998). Our
experimental results also confirm this (see Figure 7): as the NOM concentration
was increased less bromate ion was formed. Westerhoff et al., 1998 and Siddiqui
et al., 1993 also reported that less bromate was formed in the presence of NOM.
As shown in Figure 8, as the NOM concentration increased from 1 to 5 mgC/L,
greater reductions in UV254, SUVA and color were achieved. However the extent
to which turbidity was reduced did not vary with inlet ozone mass injection rate,
however, at all NOM concentrations, essentially 100% of the turbidity was
removed. Ozone acts as an aid to coagulation of NOM through transformation of
NOM to smaller and more polar compounds (Chandrakanth et al., 1996), which is
believed to explain the reduction in water turbidity achieved in the presence of
ozone. Also at NOM concentration equal to 1 mgC/L, an increase in the TOC
after treating water using ozone-membrane system was observed. This might be
due to more complete oxidation of NOM by ozone at lower NOM concentration,
134

Ph.D. Thesis – M. Moslemi McMaster University – Civil Engineering
which would produce lower molecular weight organics, which would likely pass
more easily through membrane pores and result in TOC increase in the permeate.
0
0.5
1
1.5
2
2.5
3
0 30 60 90 120 150 180
Time (min)
[BrO
3- ] (m
icro
mol
e/L)
[NOM]=10 mg C/L
[NOM]=5 mg C/L
[NOM]=1 mg C/L
[NOM]=0 mg C/L
-60
-40
-20
0
20
40
60
80
100
120
TOC UV254 SUVA Color Turbidity
% R
educ
tion
[NOM]= 10 mg C/L[NOM]= 5 mg C/L[NOM]= 1 mg C/L
Fig. 7- Bromate concentration in the permeate vs. time at various NOM concentrations. Membrane: 7 channel – 5 kD, inlet O3 mass injection rate: 0.5 mg/min, [Br-]0: 1 mg/L, [CaCl2]0: 1 mM, [t-BuOH]0: 0 mM, pH: 6.0.
Fig. 8- Percent reduction at various NOM concentrations. Membrane: 7 channel – 5 kD, inlet O3 mass injection rate: 0.5 mg/min, [Br-]0: 1 mg/L, [CaCl2]0: 1 mM, [t-BuOH]0: 0 mM, pH: 6.0.
135
Ph.D. Thesis – M. Moslemi McMaster University – Civil Engineering
5.4.4. Effect of pH
As shown in Figure 9, in the presence of NOM and regardless of pH, a
significant reduction in the concentration of bromate is observed as compared to the
concentration of bromate in the absence of NOM. Moreover, the concentration of
bromate at pH 6.0 is considerably less then that observed at pH 8.0. At lower pH,
ozone is more stable and the concentration of hydroxyl radicals in the reactor would
be expected to be less than that found at higher pH (Pinkernell and von Gunten,
2001; von Gunten, 2003). Moreover, as an intermediate step in the bromate
formation mechanism, hypobromite (OBr-) reacts with ozone molecule. OBr- is at
equilibrium with hypobromous acid (HOBr ↔ OBr- + H+). As pH decreases the
equilibrium shifts towards the left and the concentration of HOBr increases.
HOBr is much less reactive with ozone than is OBr- (Mizuno et al., 2004). Hence,
at low pH the rate of formation of bromate is slower and less bromate is observed.
Figure 10 represents the percent reduction in the DBP concentrations as a
function of pH. Reduction in pH, reduced the formation of some of the
trihalomathanes while it increased the concentration of some others and the
concentration of TTHMs more or less remained the same. Hence, no specific
trend for the effect of pH on the formation of trihalomethanes was observed. The
influence of pH on the water quality parameters is shown in Figure 11. Again, no
substantial variation in these parameters as a result of pH depression was
observed.
136

Ph.D. Thesis – M. Moslemi McMaster University – Civil Engineering
0
1
2
3
4
5
6
7
8
9
0 30 60 90 120 150 180
Time (min)
[BrO
3- ] (m
icro
mol
e/L)
pH=8.0, [NOM]=10 mgC/LpH=8.0, W/O NOMpH=6.0, [NOM]=10 mgC/LpH=6.0, W/O NOM
Fig. 9- Bromate concentration in the permeate vs. time at various pHs.
Membrane: 7 channel – 5 kD, inlet O3 mass injection rate: 0.5 mg/min, [Br-]0: 1 mg/L, [CaCl2]0: 1 mM, [t-BuOH]0: 0 mM.
-250
-200
-150
-100
-50
0
50
100
CHCl3 CHBrCl2 CHBr2Cl CHBr3 TTHMs
% R
educ
tion
pH=8.0
pH= 6.0
Fig. 10- Percent reduction in DBPs concentration at various pHs. Membrane: 7 channel – 5 kD, inlet O3 mass injection rate: 0.5 mg/min, [Br-]0: 1 mg/L, [NOM]0: 10 mg C/L, [CaCl2]0: 1 mM, [t-BuOH]0: 0 mM.
137
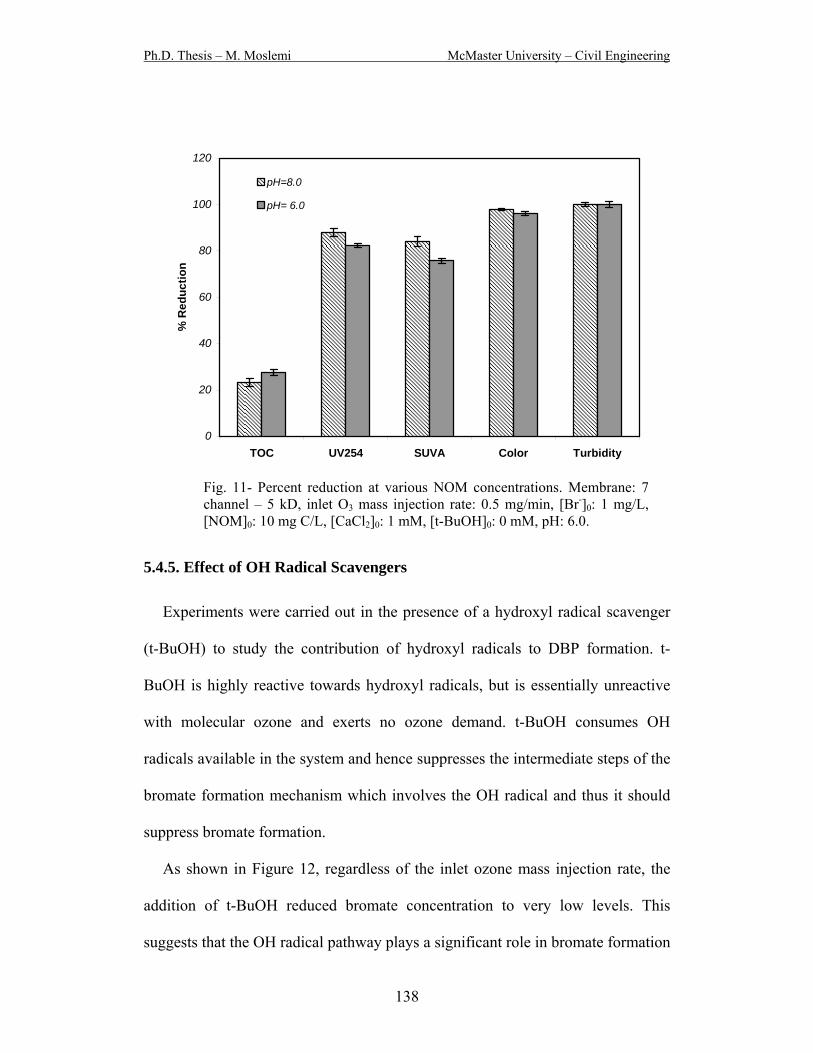
Ph.D. Thesis – M. Moslemi McMaster University – Civil Engineering
0
20
40
60
80
100
120
TOC UV254 SUVA Color Turbidity
% R
educ
tion
pH=8.0
pH= 6.0
Fig. 11- Percent reduction at various NOM concentrations. Membrane: 7 channel – 5 kD, inlet O3 mass injection rate: 0.5 mg/min, [Br-]0: 1 mg/L, [NOM]0: 10 mg C/L, [CaCl2]0: 1 mM, [t-BuOH]0: 0 mM, pH: 6.0.
5.4.5. Effect of OH Radical Scavengers
Experiments were carried out in the presence of a hydroxyl radical scavenger
(t-BuOH) to study the contribution of hydroxyl radicals to DBP formation. t-
BuOH is highly reactive towards hydroxyl radicals, but is essentially unreactive
with molecular ozone and exerts no ozone demand. t-BuOH consumes OH
radicals available in the system and hence suppresses the intermediate steps of the
bromate formation mechanism which involves the OH radical and thus it should
suppress bromate formation.
As shown in Figure 12, regardless of the inlet ozone mass injection rate, the
addition of t-BuOH reduced bromate concentration to very low levels. This
suggests that the OH radical pathway plays a significant role in bromate formation
138

Ph.D. Thesis – M. Moslemi McMaster University – Civil Engineering
in the hybrid ozonation membrane system. In the absence of NOM, in the
presence of t-BuOH, the concentration of bromate was significantly reduced (see
Chapter 4). It is noteworthy that experiments were also repeated in the presence of
bicarbonate (70 mM), which is a hydroxyl radical scavenger as well. Bicarbonate
also resulted in bromate suppression; however we were unable to quantify
bromate concentrations in the presence of bicarbonate because of co-elution of
peaks. Siddiqui et al., 1995 achieved up to 93% reduction in bromate formation
using OH radical scavengers.
As shown in Figure 13, the addition of OH radical scavengers reduced TTHMs
concentration. However, less reduction was observed in TOC in the presence of
the scavenger (see Figure 14). An explanation for this is reduced ozone
decomposition and OH radical formation in the presence of scavengers. OH is a
much stronger NOM oxidized and suppression of the formation of OH radicals
results in reduced TOC removal.
139

Ph.D. Thesis – M. Moslemi McMaster University – Civil Engineering
0
0.5
1
1.5
2
0 30 60 90 120 150 180Time (min)
[BrO
3- ] (m
icro
mol
e/L)
[t-BuOH]=1 mM, O3 mass=1.5 mg/min[t-BuOH]=1 mM, O3 mass=0.5 mg/min[t-BuOH]=0 mM, O3 mass=1.5 mg/min[t-BuOH]=0 mM, O3 mass=0.5 mg/min
Fig. 12- Bromate concentration in the permeate vs. time in the presence of scavenger. Membrane: 7 channel – 5 kD, [Br-]0: 1 mg/L, [NOM]0: 10 mg C/L, [CaCl2]0: 1 mM, pH: 6.0.
-250
-200
-150
-100
-50
0
50
100
CHCl3 CHBrCl2 CHBr2Cl CHBr3 TTHMs
% R
educ
tion
[t-BuOH]= 1 mM, O3 mass= 1.5 mg/min[t-BuOH]= 1 mM, O3 mass= 0.5 mg/min[t-BuOH]= 0 mM, O3 mass= 0.5 mg/min
Fig. 13- Percent reduction in DBP concentrations in the presence of scavenger. Membrane: 7 channel – 5 kD, [Br-]0: 1 mg/L, [NOM]0: 10 mg C/L, [CaCl2]0: 1 mM, pH: 6.0.
140

Ph.D. Thesis – M. Moslemi McMaster University – Civil Engineering
0
20
40
60
80
100
120
TOC UV254 SUVA Color Turbidity
% R
educ
tion
[t-BuOH]= 1 mM, [O3]= 30 mg/L[t-BuOH]= 1 mM, [O3]= 10 mg/L[t-BuOH]= 0 mM, [O3]= 10 mg/L
Fig. 14- Percent reduction in the presence of scavenger. Membrane: 7 channel – 5 kD, inlet O3 mass injection rate: 0.5 mg/min, [Br-]0: 1 mg/L, [NOM]0: 10 mg C/L, [CaCl2]0: 1 mM, pH: 6.0.
5.4.6. Effect of Membrane Coating
To study the effect of the manganese oxide coating on bromate formation, the
performance of a 5 kD ceramic membrane, Inside Ceram (TAMI North America,
Saint-Laurent, Quebec), coated with 30 layers of manganese oxide was compared
with that of an uncoated membrane (see Corneal et al. (35) for the membrane
preparation method). Manganese oxide is shown to be a more powerful catalyst of
ozone decomposition than is titanium oxide (which is used in the fabrication of
the Inside Ceram membranes) and the manganese oxide coated membrane is more
effective at controlling fouling of the membrane in a hybrid ozonation-membrane
system than is the uncoated membrane (36). As can be seen in Figure 15, the
141
Ph.D. Thesis – M. Moslemi McMaster University – Civil Engineering
bromate concentration that was observed using the coated membrane is less than
that observed with the uncoated membrane. Camel et al. (6) also showed that
ozonation in the presence of heterogeneous catalysts reduced bromate formation.
As shown in our earlier work (see Chapter 4) the coated membrane enhanced
ozone decomposition, and resulted in lower concentrations of dissolved ozone.
Hence, the lower concentration of bromate ion formed when the coated membrane
was used in the hybrid ozonation-membrane system may be due to the lower
ozone concentration available in the system.
The coated membrane also shows promising results in terms of controlling the
formation of other disinfection by-products. As it can be seen in Figure 16, the
coated membrane resulted in greater reductions in the DBPs, including CHCl3,
CHBr3, CHBrCl2, CHBr2Cl and TTHMs. In both cases, the steady state
concentrations of these DBPs in system are greater than the regulatory limits
proposed by drinking water guidelines. The TTHMs concentration in the
permeate using uncoated and coated membranes were 251 and 211 μg/L, whereas
as mentioned above, the MCLs proposed by USEPA, the Ontario Ministry of the
Environment, and the European Union are 80, 100, and 100 μg/L, respectively.
However, the NOM concentration and also the bromide concentration that are
observed in the natural waters in many cases are expected to be lower than the
values used in the current study and the concentration of the DBPs resulting from
the ozonation of natural waters might be within the regulatory limits.
142

Ph.D. Thesis – M. Moslemi McMaster University – Civil Engineering
As shown in Figure 17 a greater TOC removal was achieved using the
uncoated membrane. An explanation for this results, is the more effective
decomposition of NOM in the presence of the catalyst which breaks down NOM
to lower molecular weight species which would pass through the membrane pores
and result in an increase in the TOC in the permeate line. Gracia et al., 1996 also
showed that in the presence of metal ions, the oxidation of organic compounds
was promoted and the TOC removal obtained as a result of ozonation in the
presence of a metal oxide was significantly greater than with ozone alone.
0
0.5
1
1.5
2
2.5
3
0 30 60 90 120 150 180
Time (min)
[BrO
3- ] (m
icro
mol
e/L)
Coated
Uncoated
Fig. 15- Bromate concentration in the permeate vs. time. The effect of membrane coating. Membrane: 7 channel – 5 kD, inlet O3 mass injection rate: 0.5 mg/min, [Br-]0: 1 mg/L, [NOM]0: 10 mg C/L, [CaCl2]0: 1 mM, [t-BuOH]0: 0 mM, pH: 6.0.
143

Ph.D. Thesis – M. Moslemi McMaster University – Civil Engineering
-300
-250
-200
-150
-100
-50
0
50
100
150
CHCl3 CHBrCl2 CHBr2Cl CHBr3 TTHMs
% R
educ
tion
Coated
Uncoated
0
20
40
60
80
100
120
TOC UV254 SUVA Color Turbidity
% R
educ
tion
Coated
Uncoated
Fig. 16- Percent reduction in DBPs concentration. The effect of membrane coating. Membrane: 7 channel – 5 kD, inlet O3 mass injection rate: 0.5 mg/min, [Br-]0: 1 mg/L, [NOM] 0: 10 mg C/L, [CaCl2] 0: 1 mM, [t-BuOH] 0: 0 mM, pH: 6.0.
Fig. 17- Percent reduction. The effect of membrane coating. Membrane: 7 channel – 5 kD, inlet O3 mass injection rate: 0.5 mg/min, [Br-]0: 1 mg/L, [NOM]0: 10 mg C/L, [CaCl2]0: 1 mM, [t-BuOH]0: 0 mM, pH: 6.0.
144
Ph.D. Thesis – M. Moslemi McMaster University – Civil Engineering
5.4.7. Effect of MWCO
As presented in Figure 18, lower bromate concentrations were observed using
membranes with greater MWCOs. The permeability of the membranes increases
with MWCO, so at a constant operating pressure, as the MWCO of the membrane
increases, the permeate flux also increases, and subsequently the contact time in
the reactor decreases. The retention times in the system for the membranes with
MWCOs of 5, 8, and 15 kD were equal to 126, 99, and 89 minutes, respectively.
As a result, for membranes with higher MWCOs, the ozone exposure is reduced
and less bromate is formed. Our earlier work (Moslemi et al., 2011) also indicated
that, in the absence of NOM, increasing the MWCO of the membrane reduced
bromate formation in the hybrid system.
Figure 19 shows percent reduction in DBPs concentrations at various
MWCOs. As shown in Figure 20, a greater reduction in TOC, UV254, and SUVA
with membranes having lower MWCOs is achieved. This is due to the fact that
finer membranes are more effective in filtering and removing NOM from water.
Also as mentioned above, greater ozone exposure with membranes having lower
MWCOs allows for more complete oxidation of NOM which subsequently results
in greater reduction in the parameters studied. As indicated in Figures 21 to 23,
membrane filtration-ozonation system is able to reduce the color, turbidity and
UV254 of the raw water tested. After 30 min a significant reduction in these
parameters was obtained. It is also evident from these figures that ozonation was
145
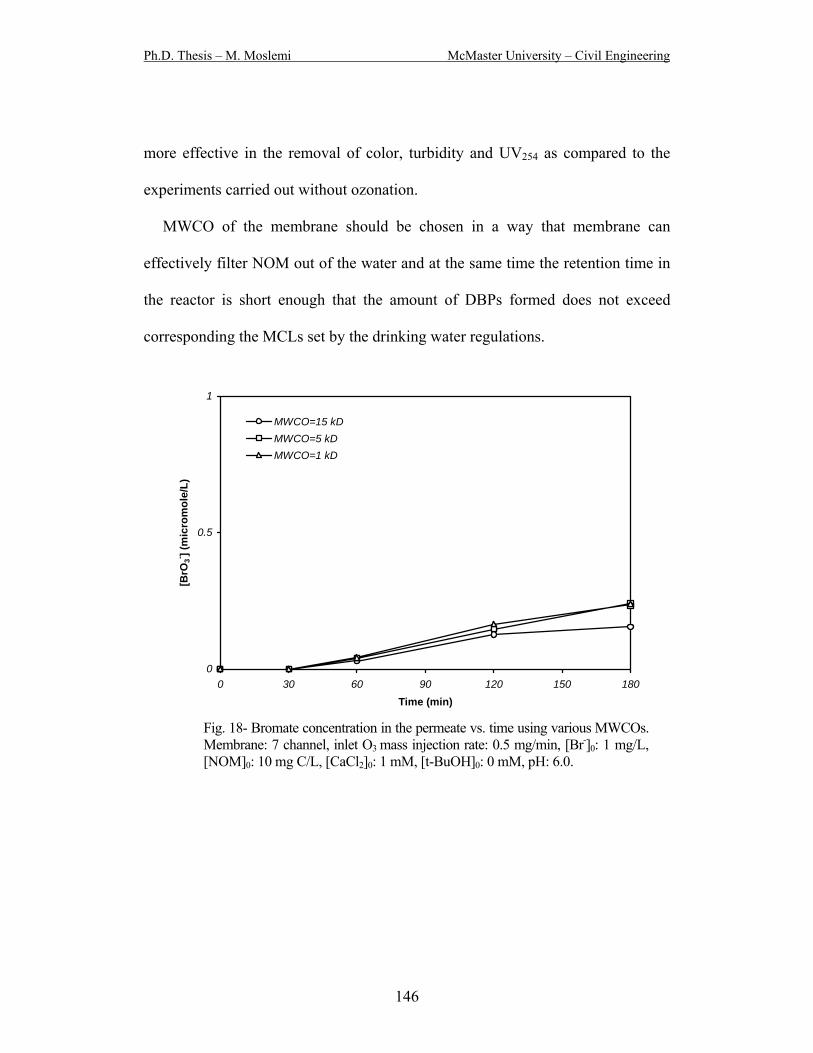
Ph.D. Thesis – M. Moslemi McMaster University – Civil Engineering
more effective in the removal of color, turbidity and UV254 as compared to the
experiments carried out without ozonation.
MWCO of the membrane should be chosen in a way that membrane can
effectively filter NOM out of the water and at the same time the retention time in
the reactor is short enough that the amount of DBPs formed does not exceed
corresponding the MCLs set by the drinking water regulations.
0
0.5
1
0 30 60 90 120 150 180Time (min)
[BrO
3- ] (m
icro
mol
e/L)
MWCO=15 kDMWCO=5 kDMWCO=1 kD
Fig. 18- Bromate concentration in the permeate vs. time using various MWCOs. Membrane: 7 channel, inlet O3 mass injection rate: 0.5 mg/min, [Br-]0: 1 mg/L, [NOM]0: 10 mg C/L, [CaCl2]0: 1 mM, [t-BuOH]0: 0 mM, pH: 6.0.
146
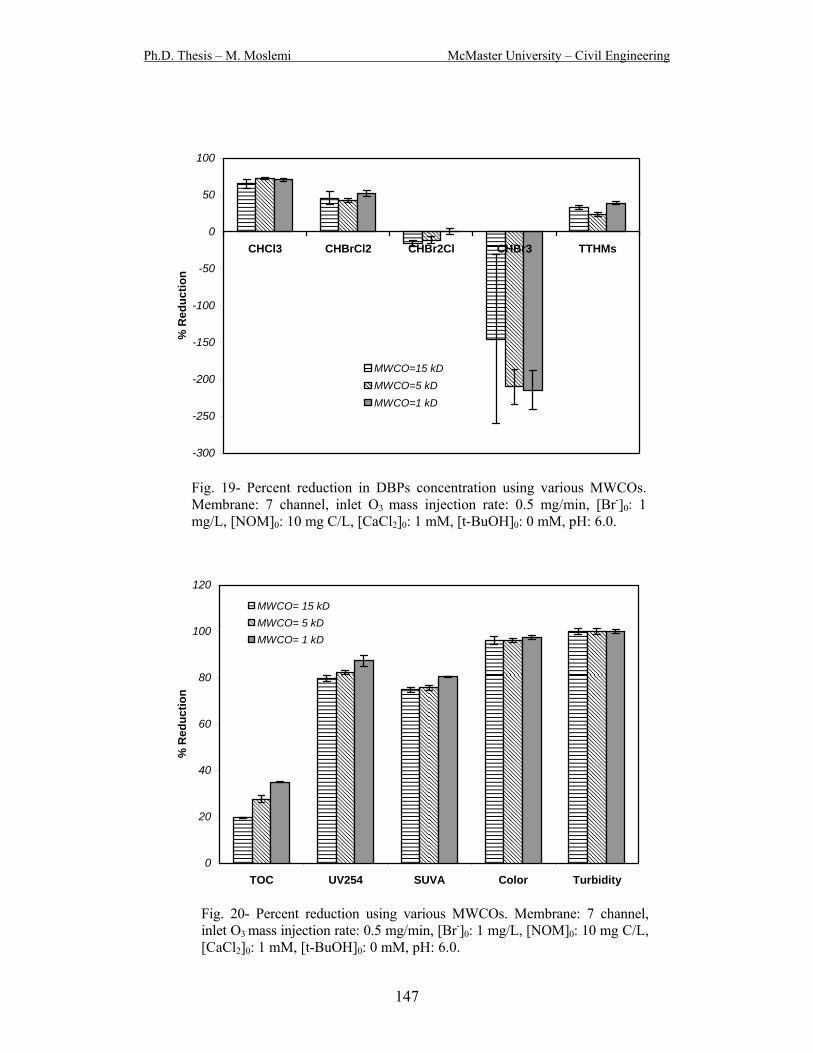
Ph.D. Thesis – M. Moslemi McMaster University – Civil Engineering
-300
-250
-200
-150
-100
-50
0
50
100
CHCl3 CHBrCl2 CHBr2Cl CHBr3 TTHMs
% R
educ
tion
MWCO=15 kDMWCO=5 kDMWCO=1 kD
Fig. 19- Percent reduction in DBPs concentration using various MWCOs.
Membrane: 7 channel, inlet O3 mass injection rate: 0.5 mg/min, [Br-]0: 1 mg/L, [NOM]0: 10 mg C/L, [CaCl2]0: 1 mM, [t-BuOH]0: 0 mM, pH: 6.0.
0
20
40
60
80
100
120
TOC UV254 SUVA Color Turbidity
% R
educ
tion
MWCO= 15 kDMWCO= 5 kDMWCO= 1 kD
Fig. 20- Percent reduction using various MWCOs. Membrane: 7 channel, inlet O3 mass injection rate: 0.5 mg/min, [Br-]0: 1 mg/L, [NOM]0: 10 mg C/L, [CaCl2]0: 1 mM, [t-BuOH]0: 0 mM, pH: 6.0.
147
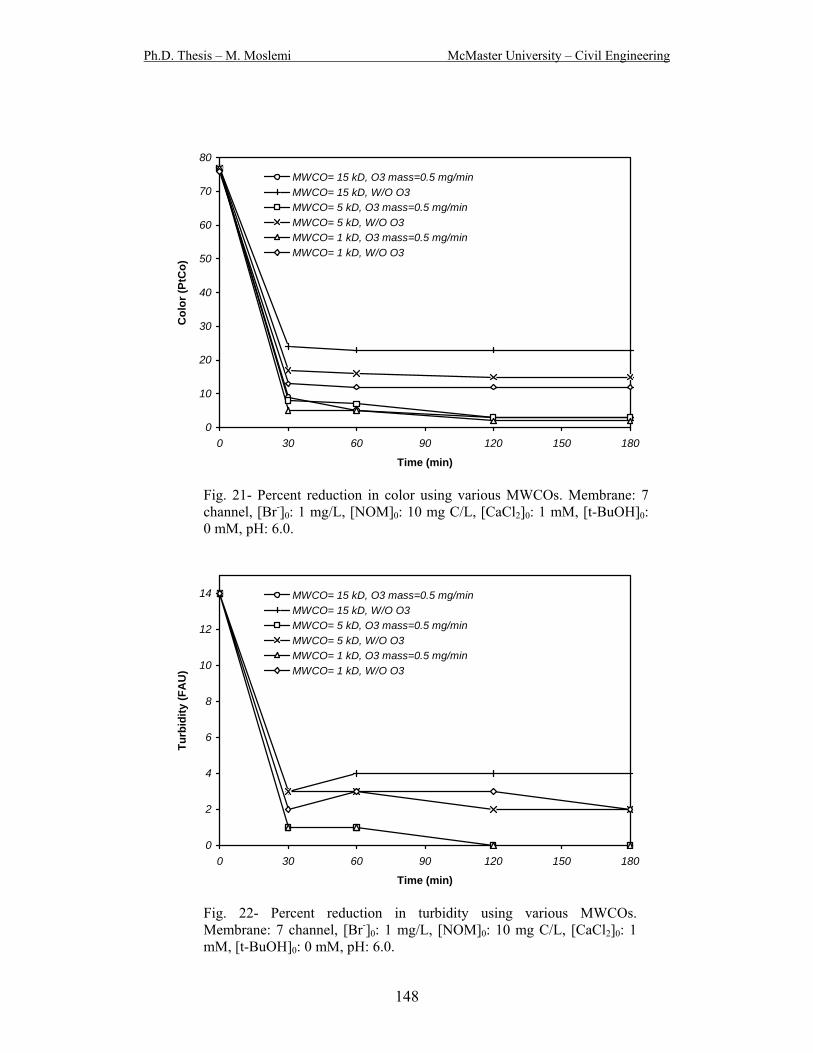
Ph.D. Thesis – M. Moslemi McMaster University – Civil Engineering
0
10
20
30
40
50
60
70
80
0 30 60 90 120 150 180
Time (min)
Col
or (P
tCo)
MWCO= 15 kD, O3 mass=0.5 mg/minMWCO= 15 kD, W/O O3MWCO= 5 kD, O3 mass=0.5 mg/minMWCO= 5 kD, W/O O3MWCO= 1 kD, O3 mass=0.5 mg/minMWCO= 1 kD, W/O O3
Fig. 21- Percent reduction in color using various MWCOs. Membrane: 7
channel, [Br-]0: 1 mg/L, [NOM]0: 10 mg C/L, [CaCl2]0: 1 mM, [t-BuOH]0: 0 mM, pH: 6.0.
0
2
4
6
8
10
12
14
0 30 60 90 120 150 180
Time (min)
Turb
idity
(FA
U)
MWCO= 15 kD, O3 mass=0.5 mg/minMWCO= 15 kD, W/O O3MWCO= 5 kD, O3 mass=0.5 mg/minMWCO= 5 kD, W/O O3MWCO= 1 kD, O3 mass=0.5 mg/minMWCO= 1 kD, W/O O3
Fig. 22- Percent reduction in turbidity using various MWCOs.
Membrane: 7 channel, [Br-]0: 1 mg/L, [NOM]0: 10 mg C/L, [CaCl2]0: 1 mM, [t-BuOH]0: 0 mM, pH: 6.0.
148

Ph.D. Thesis – M. Moslemi McMaster University – Civil Engineering
0
0.1
0.2
0.3
0.4
0 30 60 90 120 150 180
Time (min)
UV 2
54 (A
bs)
MWCO= 15 kD, O3 mass=0.5 mg/minMWCO= 15 kD, W/O O3MWCO= 5 kD, O3 mass=0.5 mg/minMWCO= 5 kD, W/O O3MWCO= 1 kD, O3 mass=0.5 mg/minMWCO= 1 kD, W/O O3
Fig. 23- Percent reduction in UV254 using various MWCOs. Membrane: 7
channel, [Br-]0: 1 mg/L, [NOM]0: 10 mg C/L, [CaCl2]0: 1 mM, [t-BuOH]0: 0 mM, pH: 6.0.
5.4.8. Fouling
A series of experiments was conducted to study fouling of the ceramic
membrane by NOM present in the water and to investigate the influence of
ozonation on membrane fouling. Table 2, lists the steady state permeate flux and
residual ozone observed for the experiments with varying MWCOs and NOM
concentrations. As shown in Figure 24, in the experiment with pure oxygen,
permeate flux quickly dropped and after 180 min it reduced to about 50% of the
initial permeate flux.
Our earlier work (Moslemi et al., 2011, Moslemi et al., 2010) indicated that in
the hybrid ozonation-membrane system, dissolved ozone concentration was
linearly proportional to the ozone mass injection rate. Based on the experimental
149
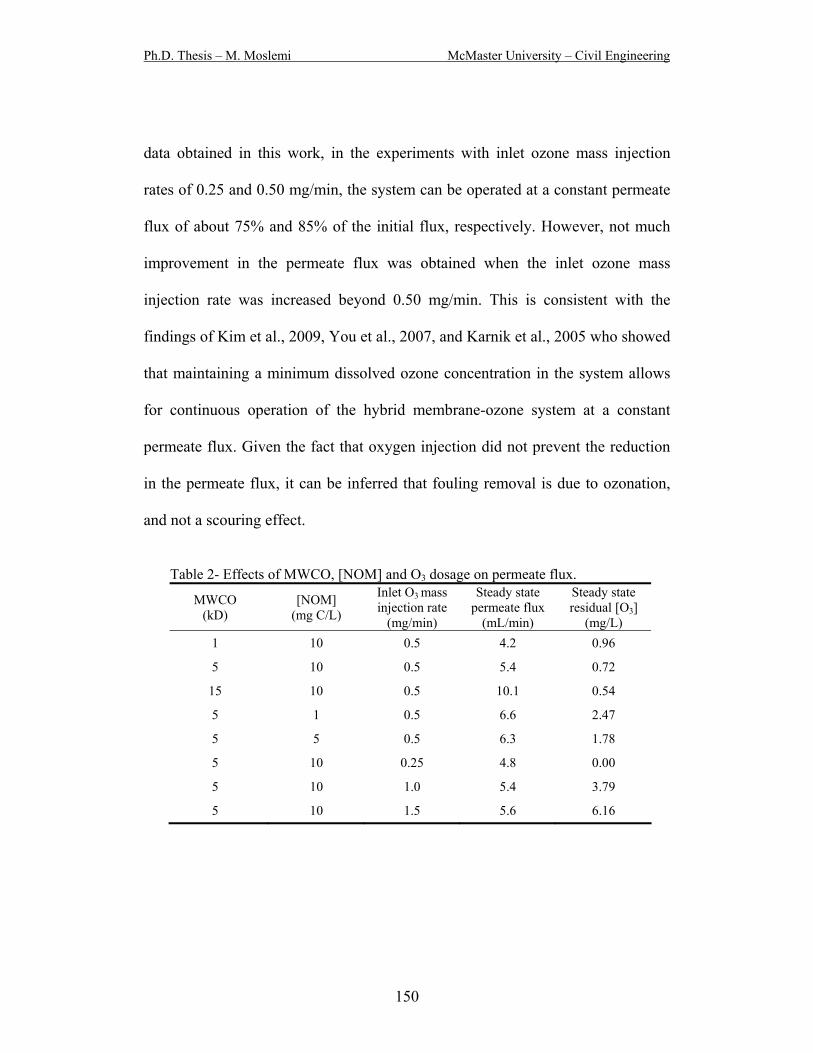
Ph.D. Thesis – M. Moslemi McMaster University – Civil Engineering
data obtained in this work, in the experiments with inlet ozone mass injection
rates of 0.25 and 0.50 mg/min, the system can be operated at a constant permeate
flux of about 75% and 85% of the initial flux, respectively. However, not much
improvement in the permeate flux was obtained when the inlet ozone mass
injection rate was increased beyond 0.50 mg/min. This is consistent with the
findings of Kim et al., 2009, You et al., 2007, and Karnik et al., 2005 who showed
that maintaining a minimum dissolved ozone concentration in the system allows
for continuous operation of the hybrid membrane-ozone system at a constant
permeate flux. Given the fact that oxygen injection did not prevent the reduction
in the permeate flux, it can be inferred that fouling removal is due to ozonation,
and not a scouring effect.
Table 2- Effects of MWCO, [NOM] and O3 dosage on permeate flux.
MWCO (kD)
[NOM]
(mg C/L)
Inlet O3 massinjection rate
(mg/min)
Steady state permeate flux
(mL/min)
Steady state residual [O3]
(mg/L)
1 10 0.5 4.2 0.96
5 10 0.5 5.4 0.72
15 10 0.5 10.1 0.54
5 1 0.5 6.6 2.47
5 5 0.5 6.3 1.78
5 10 0.25 4.8 0.00
5 10 1.0 5.4 3.79
5 10 1.5 5.6 6.16
150

Ph.D. Thesis – M. Moslemi McMaster University – Civil Engineering
0
0.1
0.2
0.3
0.4
0.5
0.6
0.7
0.8
0.9
1
0 30 60 90 120 150 180Time (min)
Nor
mal
ized
per
mea
te fl
ux
O3 mass=1.5 mg/minO3 mass=1.0 mg/minO3 mass=0.5 mg/minO3 mass=0.25 mg/minPure O2
Fig. 24- Effect of ozone dosage on permeate flux. Membrane: 7 channel
– 5 kD, [Br-]0: 1 mg/L, [NOM]0: 10 mg C/L, inlet gas flow rate: 50 mL/min, [CaCl2]0: 1 mM, [t-BuOH]0: 0 mM, pH: 6.0.
5.5. Empirical Bromate Model
A power function with the following general form was used for modeling.
543210 bbb3
bbb3 )t()pH()ratemassO(]DOC[]Br[10]BrO[ −− = (1)
where,
[BrO3-] = bromate concentration in the permeate at time t, μg/L
[Br-] = bromide concentration in the feed water, 250 ≤ [Br-] ≤ 1000 μg/L
[DOC] = dissolved organic carbon concentration in the feed water, 1 ≤ [DOC] ≤
10 mgC/L
O3 mass rate = inlet ozone mass injection rate, 0.25 ≤ O3 mass rate ≤ 1.50 mg/min
151
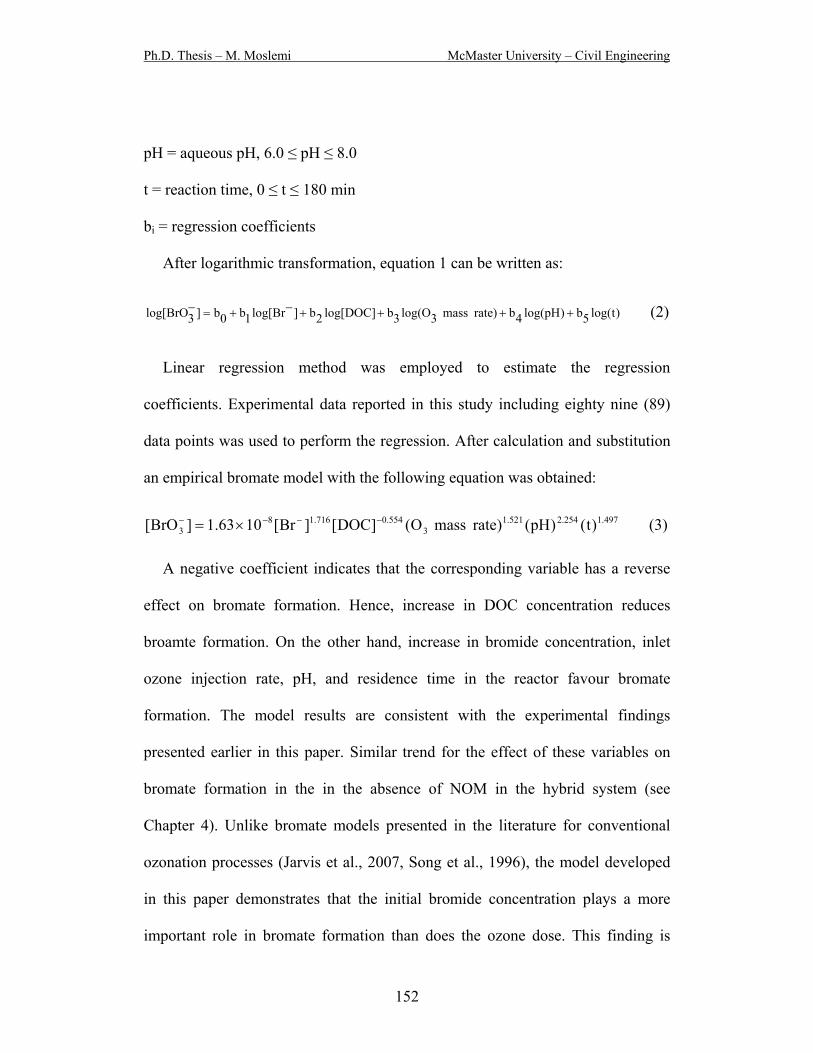
Ph.D. Thesis – M. Moslemi McMaster University – Civil Engineering
pH = aqueous pH, 6.0 ≤ pH ≤ 8.0
t = reaction time, 0 ≤ t ≤ 180 min
bi = regression coefficients
After logarithmic transformation, equation 1 can be written as:
)tlog(5b)pHlog(4b)ratemass3Olog(3b]DOClog[2b]Brlog[1b0b]3BrOlog[ ++++−+=− (2)
Linear regression method was employed to estimate the regression
coefficients. Experimental data reported in this study including eighty nine (89)
data points was used to perform the regression. After calculation and substitution
an empirical bromate model with the following equation was obtained:
497.1254.2521.13
554.0716.183 )t()pH()ratemassO(]DOC[]Br[1063.1]BrO[ −−−− ×= (3)
A negative coefficient indicates that the corresponding variable has a reverse
effect on bromate formation. Hence, increase in DOC concentration reduces
broamte formation. On the other hand, increase in bromide concentration, inlet
ozone injection rate, pH, and residence time in the reactor favour bromate
formation. The model results are consistent with the experimental findings
presented earlier in this paper. Similar trend for the effect of these variables on
bromate formation in the in the absence of NOM in the hybrid system (see
Chapter 4). Unlike bromate models presented in the literature for conventional
ozonation processes (Jarvis et al., 2007, Song et al., 1996), the model developed
in this paper demonstrates that the initial bromide concentration plays a more
important role in bromate formation than does the ozone dose. This finding is
152

Ph.D. Thesis – M. Moslemi McMaster University – Civil Engineering
consistent with the empirical model proposed for bromate formation in the hybrid
system in the absence of NOM (see Chapter 4).
In order to validate the ability of the above model in simulating bromate
formation, the predicted bromate concentrations were plotted against observed
values in Figure 25. Model was able to satisfactorily predict bromate
concentration in the system (R2=0.815). The slope of the regression line (0.916) is
close to 1 meaning that the model and experimental results are very close but
since it is smaller than 1 the model tends to slightly under-predict the bromate
concentration.
y = 0.916x + 0.525R2 = 0.815
0
20
40
60
80
100
0 20 40 60 80 100 120Observed [BrO3
-] (ug/L)
Pred
icte
d [B
rO3- ] (
ug/L
)
y = x95% confidenceLinear regression
Fig. 25- Predicted bromate concentration vs. observed values.
153
Ph.D. Thesis – M. Moslemi McMaster University – Civil Engineering
5.6. References
APHA (2005) Standard methods for the examination of water and wastewater. 21st ed.
Byun, S., Davies, S.H., Alpatova, A.L., Corneal, L.M., Baumann, M.J., Tarabara,
V.V., Masten, S.J. (2011) Mn oxide coated catalytic membranes for a hybrid
ozonation-membrane filtration: Comparison of Ti, Fe and Mn oxide coated
membranes for water quality. Wat. Res. 45, 163-170.
Camel, V., Bermond, A. (1998) The use of ozone and associated oxidation
processes in drinking water treatment. Water Res. 32, 3208-3222.
Chandrakanth, M.S.; Honeyman, B.D.; Amy, G.L. (1996) Modeling the
interactions between ozone, natural organic matter, and particles in water
treatment. Colloids Surf. A: Physiochem. Eng. Aspects 107, 321-342.
Corneal, L.M., Masten, S.J., Davies, S.H.R., Tarabara, V.V., Byun, S., Baumann,
M.J. (2010) AFM, SEM and EDS characterization of manganese oxide coated
ceramic water filtration membranes. J. Mem. Sci. 360, 292-302.
European Union (1998) Official Journal of the European Communities, L 330,
Council Directive 98/83/EC.
Evans F.L. (1972) Ozone in water and wastewater treatment. Ann Arbor Science
Publishers, Michigan.
Gottschalk, C., Libra, J.A., Saupe, A. (2000) Ozonation of water and waste
water: A practical guide to understanding ozone and its application. Wiley-
VCH: New York. Gracia, R., Aragues, J.L., Ovelleiro, J.L. (1996) Study of the catalytic ozonation
of humic substances in water and their ozonation byproducts. Ozone Sci. Eng.
18, 195-208.
154

Ph.D. Thesis – M. Moslemi McMaster University – Civil Engineering
Jarvis, P., Parsons, S.A., Smith, R. (2007) Modeling bromate formation during
ozonation. Ozone Sci. Eng. 29, 429-442.
Karnik, B.S., Davies, S.H.R., Chen, K.C., Jaglowski, D.R., Baumann, M.J.,
Masten, S.J. (2005) Effects of ozonation on the permeate flux of
nanocrystalline ceramic membranes. Water Res. 39, 728-734.
Kim, J., Shan, W., Daview, S.R., Baumann, M.J., Masten, S.J., Tarabara, V.
(2009) Interactions of aqueous NOM with nanoscale TiO2: Implications for
ceramic membrane filtration-ozonation hybrid process. Environ. Sci. Technol.
43, 5488-5494.
Kim, J., Van der Bruggen, B. (2010) The use of nanoparticles in polymeric and
ceramic membrane structures: Review of manufacturing procedures and
performance improvement for water treatment. Environmental Pollution 158,
2335-2349.
Legube, B., Parinet, B., Gelinet, K., Berne, F., Croue, J.P. (2004) Modeling of
bromate formation by ozonation of surface waters in drinking water treatment.
Water Res. 38, 2185-2195.
Mizuno, T., Yamada, H., Tsuno, H. (2004) Formation of bromate ion through a
radical pathway in a continuous flow reactor. Ozone Sci. Eng. 26, 573-584.
Mizuno, T., Tsuno, H., Yamada, H. (2007) A simple model to predict formation
of bromate ion and hypobromous acid/hypobromite ion through hydroxyl
radical pathway during ozonation. Ozone Sci. Eng. 29, 3-11.
155
Ph.D. Thesis – M. Moslemi McMaster University – Civil Engineering
Morris, R.D., Audet, A.M., Angelillo, I.F., Chalmers, T.C., Mosteller, F. (1992)
Chlorination, chlorination by-products, and cancer: A metaanalysis, Am. J.
Public. Health 82, 955-963.
Moslemi, M., Davies, S.H., Masten, S.J. (2010). Ozone mass transfer in a
recirculating loop semibatch reactor operated at high pressure. Adv. Oxidation
Technol. 13, 79-88
Moslemi, M., Davies, S.H., Masten, S.J. (2011) Bromate formation in a hybrid
ozonation-ceramic membrane filtration system, Water Res. 45, 5529-5534.
Mozia, S., Tomaszewska, M., Morawski, A.W. (2006) Application of an
ozonation-adsorption-ultrafiltration system for surface water treatment.
Desalination 190, 308-314.
Ontario drinking-water quality standards (2002) Safe Drinking Water Act,
Ontario regulation 169/03.
Pinkernell, U., von Gunten, U. (2001) Bromate minimization during ozonation:
Mechanistic considerations. Environ. Sci. Technol. 35, 2525-2531.
Schlichter, B., Mavrov, V., Chmiel, H. (2003) Study of a hybrid process
combining ozonation and membrane filtration - filtration of model solutions.
Desalination 156, 257-265.
Siddiqui, M.S., Amy, G.L. (1993) Factors affecting DBP formation during ozone-
bromide reactions. J. AWWA 85, 63-72.
Siddiqui, M.S., Amy, G.L., Rice, R.G. (1995) Bromate ion formation: A critical
review, J. AWWA 87, 58-70.
156

Ph.D. Thesis – M. Moslemi McMaster University – Civil Engineering
Sohn, J., Amy, G., Cho, J., Lee, Y., Yoon, Y. (2004) Disinfectant decay and
disinfection by-products formation model development: chlorination and
ozonation by-products. Wat. Res. 38, 2461–2478.
Song, R., Donohoe, C., Minear, R., Westerhoff, P., Ozekin, K., Amy, G. (1996)
Empirical modeling of bromate formation during ozonation of bromide-
containing water. Wat. Res. 30, 1161-1168.
USEPA (1998) National primary drinking water regulations: Disinfection and
disinfection byproducts. Federal Register 63, 69390-69476.
USEPA (2003) Determination of haloacetic acids and dalapon in drinking water
by liquide-liquid microextraction, derivatization, and gas chromatography with
electron capture detection, 815-B-03-002.
Van Geluwe, S., Braeken, L., Van der Bruggen, B. (2011) Ozone oxidation for
the alleviation of membrane fouling by natural organic matter: A review.
Water Res. 45, 3551-3570.
von Gunten, U., Oliveras, Y. (1998) Advanced oxidation of bromide-containing
waters: Bromate formation mechanisms. Environ. Sci. Technol. 32, 63-70.
Westerhoff, P., Song, R., Amy, G., Minear, R. (1998) NOM’s role in bromine and
bromate formation during ozonation. AWWA 89, 82-94.
You, S.H., Tseng, D.H., Hsu, W.C. (2007) Effect and mechanism of ultrafiltration
membrane fouling removal by ozonation. Desalination 202, 224-230.
157

Ph.D. Thesis – M. Moslemi McMaster University – Civil Engineering
Chapter 6: Conclusions and Recommendations
6.1. Conclusions
The mass transfer of ozone gas to water plays a pivotal role in the performance
and efficacy of ozonation systems. As a preliminary step, the effects of water flow
rate, mixing, gaseous ozone concentration, inlet gas flow rate, temperature, and
pH on ozone hydrodynamics in a recirculating loop semibatch reactor operated at
high pressure were studied. Variations in the water cross flow rate only slightly
affected the ozone mass transfer rates, suggesting that sufficient mixing in the
reactor was achieved at the low flow rates used. The addition of an inline static
mixer had a negligible effect on aqueous ozone concentrations in the reactor,
indicating that mixing was sufficient without the mixer and adequate mass
transfer can be achieved using a simple tee to inject the ozone gas into the
pressurized water stream. The dissolved ozone concentration increased with
increasing gaseous ozone concentration and with the inlet gas flow rate. The final
dissolved ozone concentration was found to be proportional to the inlet ozone
concentration. The dissolved ozone concentration decreased with increasing pH
due to the greater rate of ozone decomposition at higher pH. The mass transfer of
ozone increased slightly with temperature, however, due to the lower solubility of
ozone at higher temperature, the final ozone concentration achieved decreased
with increasing temperature. A model to describe the ozone mass transfer was
158
Ph.D. Thesis – M. Moslemi McMaster University – Civil Engineering
developed. Good agreement between the model predictions and the experimental
data was achieved.
The aim of the second phase of the experiments was to study the formation of
bromate in the hybrid ozonation-membrane filtration system in the absence of
natural organic matter (NOM). To achieve this goal the effects of important
variables including pH, inlet ozone mass injection rate, initial bromide
concentration, membrane molecular weight cut off (MWCO), the nature of the
membrane surface (coating), hydroxyl radical scavengers, and temperature on
bromate formation in a hybrid membrane filtration–ozonation reactor was studied.
According to our experimental findings, decreasing the pH, significantly reduced
bromate formation. Bromate formation increased with increasing inlet gaseous
ozone mass injection rate, due to increase in dissolved ozone concentrations.
Greater initial bromide concentrations resulted in higher bromate concentrations.
An increase in the bromate concentration was observed by reducing MWCO,
which resulted in a concomitant increase in the retention time in the system.
Presence of hydroxyl radical scavengers (tertiary butyl alcohol) suppressed the
indirect bromate formation pathway and less bromate was formed, suggesting
that, the hydroxyl radical pathway plays a significant role in bromate formation.
The Mn oxide coated membrane enhanced ozone decomposition, which resulted
in lower concentrations of dissolved ozone. The bromate concentration that
resulted with the coated membrane was less than that formed with the uncoated
159

Ph.D. Thesis – M. Moslemi McMaster University – Civil Engineering
TiO2 membrane. As the temperature was increased, bromate formation was
enhanced, which was attributed to greater reaction rates.
In order to simulate bromate formation in the hybrid system, a kinetic-based
model was developed. Good correlation between the model simulation and the
experimental data was achieved. An empirical model was also developed to
predict bromate formation in the hybrid system. The model was generated using
multiple linear regression method with logarithmic transformations and takes into
account the effects of important experimental variables including initial bromide
concentration, inlet ozone mass injection rate, pH, temperature, and reaction time.
Good correlation was achieved between the model predictions and the
experimental data (R2=0.903). Modeling results indicated that bromate formation
was favoured at high bromide concentration, ozone dose, pH, and temperature.
In the final phase of research, formation of bromate and organic disinfection
by-products in the presence of NOM was investigated. To this end, the effect of
pH, inlet ozone mass injection rate, NOM concentration, initial bromide
concentration, membrane coating, hydroxyl radical scavenger, and membrane
MWCO on the formation of disinfection by-products including bromate, total
trihalomethanes (TTHMs), and halo-acetic acids (HAAs) in the hybrid system
was studied. Furthermore, variations in the TOC, UV254, SUVA, color and
turbidity of water as function of these parameters were investigated. Bromate and
TTHMs formation increased with increasing inlet gaseous ozone mass injection
rate, and initial bromide concentration. In the presence of NOM less bromate was
160
Ph.D. Thesis – M. Moslemi McMaster University – Civil Engineering
formed. The extent of bromate formation decreased with decreasing pH. The
presence of tertiary butyl alcohol significantly reduced bromate and TTHM
formation. The bromate and TTHM concentrations that were observed with the
Mn oxide coated membrane were less than that formed with the uncoated TiO2
membrane. An increase in the bromate concentration was observed with
decreasing MWCO of the filtration membrane.
An empirical model using multiple linear regression method was developed to
predict bromate formation in the presence of NOM. The variables included in the
model consist of bromide concentration, dissolved organic carbon concentration,
ozone mass injection rate, pH, and reaction time. Good correlation was achieved
between the model predictions and the experimental data (R2=0.815). According
to this model, bromate formation was favoured at high bromide concentration,
ozone mass injection rate, and pH. However, bromate formation reduced as
dissolved carbon concentration was increased.
Experimental results also indicated that ozonation can be used to overcome
membrane fouling problem by maintaining a minimum dissolved ozone
concentration is the system. This allows for continuous operation of the hybrid
ozonation-membrane filtration system at a relatively high permeate flux as
compared to the original permeate flux obtained with pure water.
161
Ph.D. Thesis – M. Moslemi McMaster University – Civil Engineering
6.2. Recommendations for Future Research
In order to enhance the understanding of disinfection by-product formation in
the hybrid ozonation–membrane system, the following are suggested for future
research:
1. Optimization of the hybrid ozonation-membrane filtration system.
Experimental results indicated that for a gaseous ozone concentration of
10.0 mg/L, the total ozone losses from the system at gas flow rates of
25, 50, 75 and 100 mL/min were 83.5, 87.5, 90.0 and 91.0 %,
respectively. Given the high ozone loss from the experimental setup,
efforts should be made to optimize the ozone hydrodynamics in the
hybrid system in order to make the most of the ozone mass delivered to
the system.
2. Duplication of the experiments using natural water source. Model water
made with Suwannee River NOM was used in the existing research.
Given the fact that
3. type and nature of NOM can play role in DBP formation, it is
recommended that complementary experiments to be conducted using
natural waters containing various concentrations and types of organic
materials.
4. Expanding the theoretical and empirical bromate formation models
developed in this research to account for a wider range of independent
variables.
162
Ph.D. Thesis – M. Moslemi McMaster University – Civil Engineering
5. Modeling trihalomethane and halo-acetic acids formation in the hybrid
ozonation-ceramic filtration system treating bromide containing waters.
6. Studying the effect of ammonia on DBP formation in the hybrid
ozonation-membrane reactor. Ammonia has been reported to reduce
bromate formation in conventional ozonation systems [70,73,75].
7. Investigation of the effect of Mn oxides particles on DBP formation in
the hybrid system and compare the results with the results obtained in
this research using the Mn oxide coated membrane.
6.3. Implications of Research for Full-scale Operation
Ceramic membranes owing to their catalytic nature have shown very promising
results in terms of oxidation and removal of organic foulants from the membrane
surface. Ceramic membranes are made of a combination of metal oxides such as
titanium dioxide, iron oxide, aluminum oxide and zirconium dioxide and, hence,
they are catalytic in nature. Experimental results also indicated that in the presence
of metal oxides less bromate and TTHM was formed. Therefore, ceramic
membranes can be used to reduce disinfection by-products formation in the
treatment of bromide containing waters using ozonation processes.
Since ceramic membranes are not commercially available right now, their major
drawback is the high initial cost associated with the purchase of the membranes.
However, ceramic membranes are physically more durable and long lasting as
compared to polymeric membranes and in the long run the use of ceramic
163

Ph.D. Thesis – M. Moslemi McMaster University – Civil Engineering
membranes could be more economical than the use of polymeric membranes.
Moreover, using ceramic membranes, the inlet ozone dosage can be lowered.
Ceramic membranes are believed to promote ozone decomposition and thereby
enhance the formation of hydroxyl radicals. Hydroxyl radicals are much stronger
oxidants than ozone and can more effectively oxidize and remove foulants.
Therefore, it is expected that in the presence of ceramic membrane less ozone
dosage is required to overcome membrane fouling and hence the ozone dose can be
reduced. Lowering the ozone dosage reduces the cost of the treatment process.
Therefore, it is believed that advantages offered by ceramic membranes justify the
high initial cost associated with their installation.
164

Ph.D. Thesis – M. Moslemi McMaster University – Civil Engineering
References
[1] M. L. Davis, S. J. Masten, Principles of environmental engineering and
science, (2004) McGraw-Hill, New York.
[2] P. Hillis, Membrane technology in water and wastewater treatment, (2000)
Royal Scociety of Chemistry, Cambridge.
[3] T. Chaiket, P. C. Singer, A. Miles, M. Moran, C. Pallotta, Effectiveness of
coagulation, ozonation, and biofiltration in controlling DBPs, J. AWWA 94
(2002) 12: 81-95.
[4] G. F. Craun, S. A. Hubbs, F. Frost, R. L. Calderon, S. H. Via, Waterborne
outbreaks of cryptosporidiosis, J. AWWA 90 (1998) 9: 81-91.
[5] USEPA, National primary drinking water regulations: Interim enhanced
surface water treatment, Federal Register 63 (1998) 241: 69478-69521.
[6] J. Crittenden, M. W. Harza (firm), Water treatment: Principles and design,
2nd ed. (2005) MWH, John Wiley, New Jersey.
[7] G. Belfort, R. H. Davis, A. L. Zydney, Behavior of suspensions and
macromolecular solutions in crossflow microfiltration, J. Membr. Sci. 96
(1994) 1-58.
[8] AWWA membrane technology research committee, Membrane processes in
potable water treatment, J. AWWA 84 (1992) 1: 59-67.
[9] AWWA membrane technology research committee, Membrane processes, J.
AWWA 90 (1998) 6: 91-105.
165

Ph.D. Thesis – M. Moslemi McMaster University – Civil Engineering
[10] B. S. Karnik, S.H. Davies, M.J. Baumann, S.J. Masten, The effect of
combined ozonation and filtration on disinfection by-product formation,
Wat. Res. 39 (2005) 2839-2850.
[11] C. T. Cleveland, Big advantages in membrane filtration, J. AWWA 91
(1999) 6: 10.
[12] S. Nakatsuka, I. Nakate, T. Miyano, Drinking water treatment by using
ultrafiltration hollow fiber membranes, Desalination 106 (1996) 1-3: 55-61.
[13] B. S. Karnik, S. H. R. Davies, K. C. Chen, D. R. Jaglowski, M. J. Baumann,
S. J. Masten, Effects of ozonation on the permeate flux of nanocrystalline
ceramic membranes, Wat. Res. 39 (2005) 728-734.
[14] R. Ghosh, Protein bioseparation using ultrafiltration, (2003) Imperial
College Press, London.
[15] C. Jucker, M. M. Clark, Adsorption of aquatic humic substances on
hydrophobic ultrafiltration membranes, J. Membr. Sci. 97 (1994) 37-52.
[16] C. Combe, E. Molis, P. Lucas, R. Riley, M. M. Clark, The effect of CA
membrane properties on adsorptive fouling by humic acid, J. Membr. Sci.
154 (1999) 73-87.
[17] W. Yuan, A. L. Zydney, Humic acid fouling during ultrafiltration, Environ.
Sci. Technol. 34 (2000) 5043-5050.
[18] B. Schlichter, V. Mavrov, H. Chmiel, Study of a hybrid process combining
ozonation and membrane filtration - filtration of model solutions,
Desalination 156 (2003) 257-265.
166

Ph.D. Thesis – M. Moslemi McMaster University – Civil Engineering
[19] S. H. You, D. H. Tseng, W. C. Hsu, Effect and mechanism of ultrafiltration
membrane fouling removal by ozonation, Desalination, 202 (2007) 224-230.
[20] Y. G. Park, Effect of ozonation for reducing membrane-fouling in the UF
membrane, Desalination 147 (2002) 43-48.
[21] S. Mozia, M. Tomaszewska, A. W. Morawski, Application of an ozonation-
adsorption-ultrafiltration system for surface water treatment, Desalination
190 (2006) 308-314.
[22] B. Schlichter, V. Mavrov, H. Chmiel, Study of a hybrid process combining
ozonation and microfiltration/ultrafiltration for drinking water production
from surface water, Desalination 168 (2004) 307-317.
[23] R. G. Rice, C. M. Robson, G. W. Miller, A. G. Hill, Use of ozone in
drinking water treatment, J. AWWA 73 (1981) 1: 44-57.
[24] B. Legube, N. K. V. Leitner, Catalytic ozonation: a promising advanced
ozidation technology for water treatment, Catal. Today 53 (1999) 61-72.
[25] C. Gottschalk, J. A. Libra, A. Saupe, Ozonation of water and waste water:
A practical guide to understanding ozone and its application, (2000) Wiley-
VCH, New York.
[26] B. Langlais, D. A. Reckhow, D. R. Brink, Ozone in water treatment:
Application and engineering: Cooperative research report, (1991) AWWA
Research Foundation, Lewis Publishers, Michigan.
[27] W. J. Masschelein, Ozonization manual for water and wastewater treatment,
(1982) Wiley, New York.
167
Ph.D. Thesis – M. Moslemi McMaster University – Civil Engineering
[28] C. Gomella, Ozone practice in France, J. AWWA 64 (1972) 1:39-46.
[29] M. S. Chandrakanth, B. D. Honeyman, G. L. Amy, Modeling the
interactions between ozone, natural organic matter, and particles in water
treatment, Colloids Surf. A: Physiochem. Eng. Aspects 107 (1996) 321-342.
[30] A. Peter, U. von Gunten, Oxidation kinetics of selected taste and odor
compounds during ozonation of drinking water, Environ. Sci. Technol. 41
(2007) 626-631.
[31] V. Camel, A. Bermond, The use of ozone and associated oxidation
processes in drinking water treatment, Wat. Res. 32 (1998) 11: 3208-3222.
[32] W. H. Glaze, Drinking water treatment with ozone, Environ. Sci. Technol.
21 (1987) 3: 224-230.
[33] U. von Gunten, Ozonation of drinking water: Part II. Disinfection and by-
product formation in presence of bromide, iodide or chlorine, Wat. Res. 37
(2003) 1469-1487.
[34] F. L. Evans III, Ozone in water and wastewater treatment, (1972) Ann
Arbor Science Publishers, Michigan.
[35] R. D. Morris, A. M. Audet, I. F. Angelillo, T. C. Chalmers, F. Mosteller,
Chlorination, chlorination by-products, and cancer: A metaanalysis, Am. J.
Public Health 82 (1992) 7: 955-963.
[36] EU, Official journal of European Communities, L 330 (1998) Council
Directive 98/83/EC.
168

Ph.D. Thesis – M. Moslemi McMaster University – Civil Engineering
[37] WHO, Guidelines for drinking-water quality, Vol. 1, Recommendations,
3rd ed. (2006) World Health Organization (Electronic version).
[38] Ontario drinking-water quality standards, Safe drinking water act, (2002)
Ontario regulation 169/03 (Electronic version).
[39] USEPA, National primary drinking water regulations: Disinfection and
disinfection byproducts, Federal Register 63 (1998) 241: 69390-69476.
[40] USEPA, Stage 2 microbial and disinfection byproducts federal advisory
committee agreement in principle, Federal Register 65 (2000) 251:
83015-83024.
[41] Canada. Environmental Health Directorate, A one-year survey of halogenated
disinfection by-products in the distribution system of treatment plants, (1996)
Environmental Health Directorate, Health Protection Branch, Ottawa.
[42] G. L. Amy, R. Bull, G. F. Craun, G. Craun, Disifnection and disinfectant
by-products, (2000) WHO, Geneva.
[43] P. H. S. Kim, J. M. Symons, Using anion exchange resins to remove THM
precursors, J. AWWA 83 (1991) 12: 61-68.
[44] J. C. Crittenden, D. W. Hand, H. Arora, B. W. Lykins, Design consideration
for GAC treatment of organic chemicals, J. AWWA 79 (1987) 1: 74-82.
[45] T. H. Boyer, P. C. Singer, Bench-scale testing of a magnetic ion exchange
resin for removal of disinfection by-product precursors, Wat. Res. 39 (2005)
1265-1276.
169

Ph.D. Thesis – M. Moslemi McMaster University – Civil Engineering
[46] M. Fielding, M. Farrimond, Disinfection by-products in drinking water:
current issues, (1999) Royal Society of Chemistry, Cambridge.
[47] S. D. Faust, O. M. Aly, Chemistry of water treatment, (1983) Butterworths,
Boston.
[48] J. Hoigne, H. Bader, Rate constants of reactions of ozone with organic and
inorganic compounds in water-I : Non-dissociating organic compounds,
Wat. Res. 17 (1983) 173-183.
[49] J. Hoigne, H. Bader, Rate constants of reactions of ozone with organic and
inorganic compounds in water-II : Dissociating organic compounds, J.
AWWA 17 (1983) 185-194.
[50] J. Hoigne, H. Bader, W. R. Haag, J. Staehelin, Rate constants of reactions
of ozone with organic and inorganic compounds in water-III. Inorganic
compounds and radicals, Wat. Res. 19 (1985) 8: 993-1004.
[51] U. von Gunten, Ozonation of drinking water: Part I. Oxidation kinetics and
product formation, Wat. Res. 37 (2003) 1443-1467.
[52] D. A. Reckhow, B. Legube, P. C. Singer, The ozonation of organic halide
precursors: effect of bicarbonate, Wat. Res. 20 (1986) 8: 987-998.
[53] J. Hoigne, H. Bader, Ozonation of water: Role of hydroxyl radicals as
oxidizing intermediate, Sci. 190 (1975) 4216: 782-784.
[54] G. V. Buxton, C. L. Greenstock, W. P. Helman, A. B. Ross, Critical review
of rate constants for reactions of hydrated electrons, hydrogen atoms and
170
Ph.D. Thesis – M. Moslemi McMaster University – Civil Engineering
hydroxyl radicals (•OH/ •O-) in aqueous solution, J. Phys. Chem. Ref. Data
17 (1988) 2: 513-886.
[55] J. Hoigne, H. Bader, The role of hydroxyl radical reactions in ozonation
processes in aqueous solutions, Wat. Res. 10 (1976) 377-386.
[56] J. J. McCarthy, C. H. Smith, A review of ozone and its application to
domestic wastewater treatment, J. AWWA 66 (1974) 12: 718-725.
[57] J. Staehelin, J. Hoigne, Decomposition of ozone in water: Rate of initiation
by hydroxide ions and hydrogen peroxide, Environ. Sci. Technol. 16 (1982)
16: 676-681.
[58] R. E. Buhler, J. Staehelin, J. Hoigne, Ozone decomposition in water studied
by pulse radiolysis. 1. HO2/O2- and HO3/O3
- as intermediates, J. Phys.
Chem. 88 (1984) 2560-2564.
[59] P. Westerhoff, R. Song, G. Amy, R. Minear, Numerical kinetic models for
bromide oxidation to bromine and bromate, Wat. Res., 32 (1998) 5: 1687-1699.
[60] H. Tomiyasu, H. Fukutomi, G. Gordon, Kinetics and mechanism of ozone
decomposition in basic aqueous solution, Inorg. Chem. 24 (1985) 19: 2962-2966.
[61] J. Staehelin, R. E. Buler, J. Hoigne, Ozone decomposition in water studied
by pulse radiolysis. 2. OH and HO4 as chain intermediates, J. Phys. Chem.
88 (1984) 5999-6004.
[62] U. von Gunten, J. Hoigne, Bromate formation during ozonation of bromide
containing waters: interaction of ozone and hydroxyl radical reactions,
Environ. Sci. Technol. 28 (1994) 1234-1242.
171
Ph.D. Thesis – M. Moslemi McMaster University – Civil Engineering
[63] J. Staehelin, J. Hoigne, Decomposition of ozone in water in the presence of
organic solutes acting as promoters and inhibitors of radical chain reactions,
Environ. Sci. Technol. 19 (1985) 12: 1206-1213.
[64] T. Mizuno, H. Tsuno, H. Yamada, Effect of inorganic carbon on ozone self-
decomposition, Ozone Sci. Eng. 29 (2007) 31-40.
[65] M. S. Siddiqui, G. L. Amy, R. G. Rice, Bromate ion formation: A critical
review, J. AWWA 87 (1995) 10: 58-70.
[66] U. von Gunten, U. Pinkernell, Ozonation of bromide-containing drinking
waters: a delicate balance between disinfection and bromate formation,
Wat. Sci. Technol. 41 (2000) 7: 53-59.
[67] S. W. Krasner, W. H. Glaze, H. S. Weinberg, P. A. Daniel, I. N. Najm,
Formation and control of bromate during ozonation of waters containing
bromide, J. AWWA 85 (1993) 1: 73-81.
[68] W. R. Haag, J. Hoigne, Ozonation of bromide-containing waters: Kinetics
of formation of hypobromous acid and bromate, Environ. Sci. Technol. 17
(1983) 17: 261-267.
[69] J. Tanaka, M. Matsumura, Kinetic studies of removal of ammonia from
seawater by ozonation, J. Chem. Technol. Biotechnol. 77 (2002) 649-656.
[70] R. Song, P. Westerhoff, R. Minear, G. Amy, Bromate minimization during
ozonarion, J. AWWA 89 (1997) 6: 69-78.
172

Ph.D. Thesis – M. Moslemi McMaster University – Civil Engineering
[71] T. Mizuno, H. Yamada, H. Tsuno, Formation of bromate ion through a
radical pathway in a continuous flow reactor, Ozone Sci. Eng. 26 (2004)
573-584.
[72] B. Legube, B. Parinet, K. Gelinet, F. Berne, J. P. Croue, Modeling of
bromate formation by ozonation of surface waters in drinking water
treatment, Wat. Res. 38 (2004) 2185-2195.
[73] F. Berne, G. Chasson, B. Legube, Effect of addition of ammonia on the
bromate formation during ozonation, Ozone Sci. Eng. 26 (2004) 267-276.
[74] U. von Gunten, Y. Oliveras, Advanced oxidation of bromide-containing waters:
Bromate formation mechanisms, Environ. Sci. Technol. 32 (1998) 63-70.
[75] U. Pinkernell, U. von Gunten, Bromate minimization during ozonation:
Mechanistic considerations, Environ. Sci. Technol. 35 (2001) 2525-2531.
[76] P. Westerhoff, R. Song, G. Amy, R. Minear, NOM's role in bromine and
bromate formation during ozonation, J. AWWA 89 (1998) 11: 82-94.
[77] S. W. Krasner, M. J. Sclimenti, E. G. Means, Quality degradation:
Implications for DBP formation, J. AWWA 86 (1994) 6: 34-47.
[78] B. S. Karnik, M. J. Baumann, S. J. Masten, S. H. Davies, AFM and SEM
characterization of iron oxide coated ceramic membranes, J. Mater. Sci. 41
(2006) 6861-6870.
[79] B. S. Karnik, S. H. Davies, M. J. Baumann, S. J. Masten, Fabrication of
catalytic membranes for the treatment of drinking water using combined
ozonation and ultrafiltration, Environ. Sci. Technol. 39 (2005) 7656-7661.
173
Ph.D. Thesis – M. Moslemi McMaster University – Civil Engineering
[80] K. Kusakabe, S. Aso, J. I. Hayashi, K. Isomura, S. Morooka, Decomposition
of humic acid and reduction of trihalomethane formation potential in water by
ozone with u.v. irradiation, Wat. Res. 24 (1990) 6: 781-785.
[81] H. Arai, M. Arai, A. Sakumoto, Exhaustive degradation of humic acid in water
by simultaneous application of radiation and ozone, 20 (1986) 7: 885-891.
[82] A. Chin, P. R. Berube, Removal of disinfection by-product precursors with
ozone-UV advanced oxidation process, Wat. Res. 39 (2005) 2136-2144.
[83] M. S. Siddiqui, G. L. Amy, Factors affecting DBP formation during ozone-
bromide reactions, J. AWWA 85 (1993) 1: 63-72.
[84] R. Hofmann, R. C. Andrews, Ammoniacal bromamines: a review of their
influence on bromate formation during ozonation, Wat. Res. 35 (2001) 3: 599-604.
[85] M. L. Bao, O. Griffini, D. Santianni, K. Barbieri, D. Burrini, F. Pantani,
Removal of bromate ion from water using granular activated carbon, Wat.
Res. 33 (1999) 2959-2970.
[86] R. D. Letterman, Water quality and treatment: A handbook of community
water supplies, 5th ed. (1999) AWWA, McGraw-Hill, New York.
[87] M. Siqqiqui, G. Amy, K. Ozekin, W. Zhai, P. Westerhoff, Alternative
strategies for removing bromate, J. AWWA 86 (1994) 10: 81-96.
[88] I. Ilisz, A. Bokros, A. Dombi, TiO2-based heterogeneous photocatalytic water
Treatment combined with ozonation, Ozone Sci. Eng. 26 (2004) 585-594.
174
Ph.D. Thesis – M. Moslemi McMaster University – Civil Engineering
[89] E. M. Aieta, K. M. Reagan, J. S. Lang, L. McReynolds, J. W. Kang, W. H.
Glaze, Advanced oxidation process for treating groundwater contaminated
with TCE and PCE: Laboratory studies, J. AWWA 81 (1988) 5: 64-72.
[90] P. L. Clech, E. K. Lee, V. Chen, Hybrid photocatalysis/membrane treatment
for surface waters containing low concentrations of natural organic matters,
Wat. Res. 40 (2006) 323-330.
[91] A. Mills, S. K. Lee, A web-based overview of semiconductor
photochemistry-current commercial applications, J. Photochem. Photobiol.
A: Chem. 152 (2002) 233-247.
[92] D. Robert, S. Malato, Solar photocatalysis: a clean process for water
detoxification, Sci. Total Environ. 291 (2002) 85-97.
[93] R. P. Schwarzenbach, P. M. Gschwend, D. M. Imboden, Environmental
organic chemistry, 2nd ed. (2003) Wiley, New Jersey.
[94] G. Wittmann, I. Horvath, A. Dombi, UV-induced decomposition of ozone
and hydrogen peroxide in the aqueous phase at pH 2-7, Ozone Sci. Eng. 24
(2002) 281-291.
[95] Y. Zhang, J. C. Crittenden, D. W. Hand, D. L. Perram, Fixed-bed
photocatalysis for solar decontamination of water, Environ. Sci. Technol. 28
(1994) 435-442.
[96] Z. Bukhari, F. Abrams, M. LeChevallier, Using ultraviolet light for
disinfection of finished water, Wat. Sci. Technol. 50 (2004) 1: 173-178.
175
Ph.D. Thesis – M. Moslemi McMaster University – Civil Engineering
[97] D. E. Huffman, A. Gennaccaro, J. B. Rose, B. W. Dussert, Low- and
medium-pressure UV inactivation of microsporidia Encephalitozoon
intestinalis, Wat. Res. 26 (2002) 3161-3164.
[98] N. H. Phillip, E. Gurten, V. Diyamandoglu, Transformation of bromine
species during decomposition of bromate under UV light from low pressure
mercury vapor lamps, Ozone Sci. Eng. 28 (2006) 217-228.
[99] A. Mills, A. Gelghazi, D. Rodman, Bromate removal from drinking water
by semiconductor photocatalysis, Wat. Res. 30 (1996) 9: 1973-1978.
[100] A. Mills, G. Meadows, Heterogeneous redox catalysis: A novel route for
removing bromate ions from water, Wat. Res. 29 (1995) 9: 2181-2185.
[101] J. J. Wu, S. J. Masten, Mass transfer of ozone in semibatch stirred reactor, J.
Environ. Eng. 127 (2001) 12: 1089-1099.
[102] M. R. Wiesner, S. Chellam, Mass transport consideration for pressure
driven membrane processes, J. AWWA 84 (1992) 1: 88-95.
[103] J. L. Sotelo, F. J. Beltran, F. J. Benitez, J. B. Heredia, Henry's law constant
for the ozone-water system, Wat. Res. 23 (1989) 10: 1239-1246.
[104] F. J. Rivas, F. J. Beltran, M. Carbajo, O. Gimeno, Homogeneous catalyzed ozone
decomposition in the presence of Co (II), Ozone Sci. Eng. 25 (2003) 261-271.
[105] M. D. Gurol, P. C. Singer, Kinetics of ozone decomposition: A dynamic
approach, Environ. Sci. Technol. 16 (1982) 7: 377-383.
[106] D. Grasso, W. J. Weber, Mathematical interpretation of aqueous-phase
ozone decomposition rates, J. Environ. Eng. 115 (1989) 3: 541-559.
176

Ph.D. Thesis – M. Moslemi McMaster University – Civil Engineering
[107] S. W. Hermanowicz, W. D. Bellamy, L. C. Fung, Variability of ozone
reaction kinetics in batch and continuous flow reactors, Wat. Res. 33 (1999)
9: 2130-2138.
[108] H. Matsuda, Y. Ose, T. Sato, H. Nagase, H. Kito, K. Sumida, Mutagenicity from
ozonation of humic substances, Sci. Total Environ. 117/118 (1992) 521-529.
[109] H. Matsuda, T. Sato, H. Nagase, Y. Ose, H. Kito, K. Sumida, Aldehydes as
mutagens formed by ozonation of humic substances, Sci. Total Environ.
114 (1992) 205-213.
[110] V. Fontanier, V. Farines, J. Albet, S. Baig, J. Molinier, Oxidation of organic
pollutants of water to mineralization by catalytic ozonation, Ozone Sci.
Eng. 27 (2005) 115-128.
177

Ph.D. Thesis – M. Moslemi McMaster University – Civil Engineering
Appendix
Fig. A1- Experimental apparatus: Hybrid ozoantion – membrane filtration.
178

Ph.D. Thesis – M. Moslemi McMaster University – Civil Engineering
Fig. A2- High-pressure stainless steel tank.
179
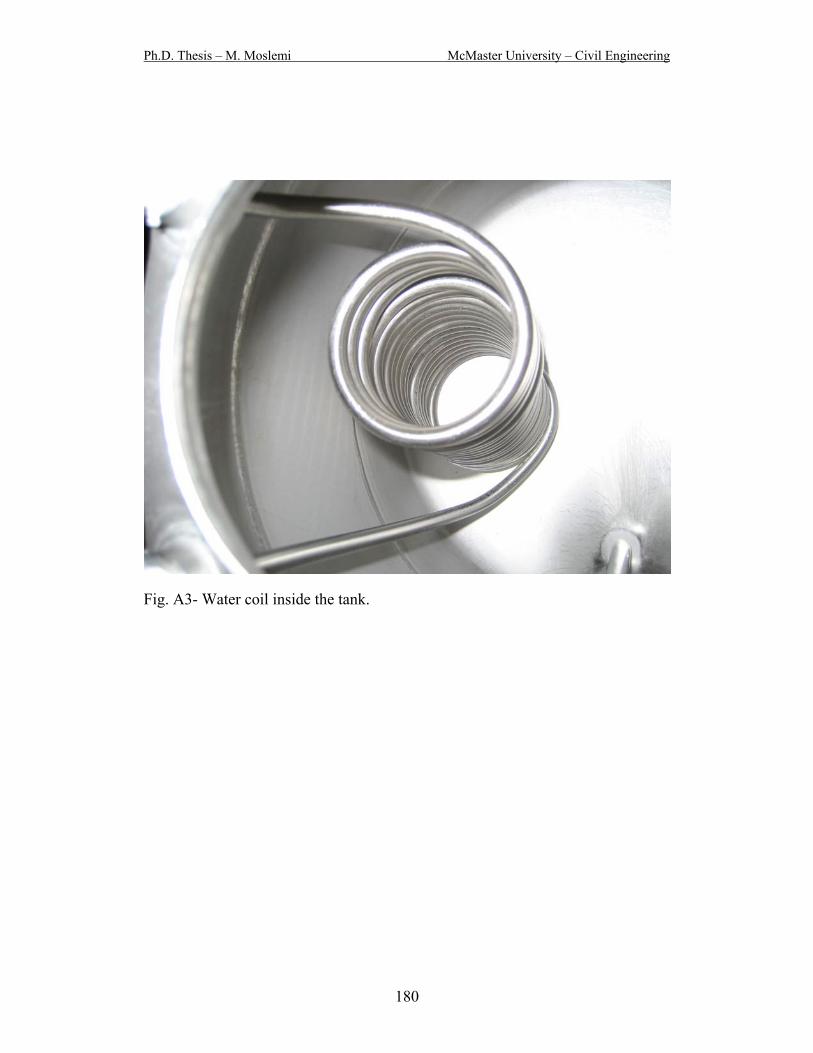
Ph.D. Thesis – M. Moslemi McMaster University – Civil Engineering
Fig. A3- Water coil inside the tank.
180
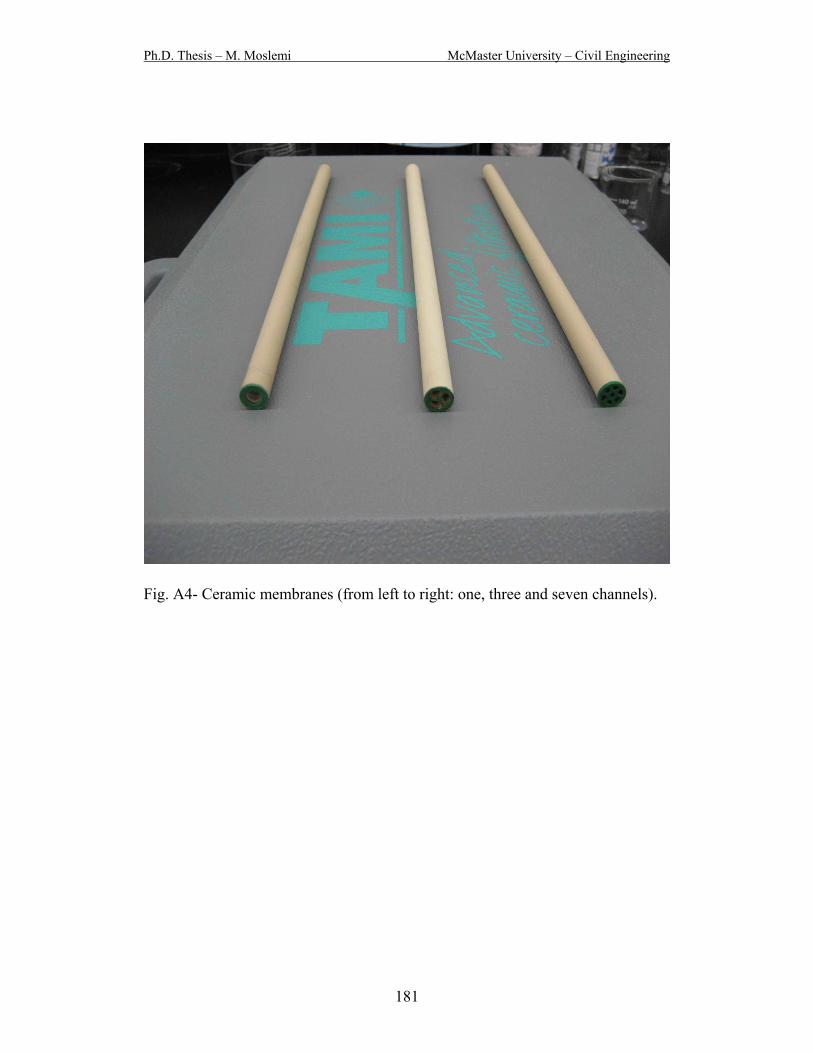
Ph.D. Thesis – M. Moslemi McMaster University – Civil Engineering
Fig. A4- Ceramic membranes (from left to right: one, three and seven channels).
181