Embed Size (px)
Citation preview
Treatment of relative permeabilities forapplication in hydrocarbon reservoirsimulation modelA. Feigl
REVIEW
Measurements of relative permeabilities and their analysis and modification by means of appropriaterelative permeability models represent one of the bases for development and verification of reservoirsimulation models. It requires careful selection of these curves providing that a statistically sufficientlyrelevant groups of similar curves are available for the selected reservoir or for individual rock types withinthe same reservoir. In order to be able to correctly apply these curves in reservoir simulations, previousknowledge of all reservoir rock parameters is required, i.e. porosity, absolute and effective permeability,saturation, etc. Objective of the paper is to present procedures of relative permeability curve measurementsand analysis methods of data experimentally obtained from different models which describe such data, to beable to apply them with high degree of quality in numerical reservoir simulations. In that regard, the finalpart of the paper through a concrete example shows the procedure of relative permeability data analysis andtheir processing for application in hydrocarbon reservoir model construction.
Key words: hydrocarbon reservoir, reservoir model, relative permeability, numerical simulation,rock type
1. INTRODUCTION
In several chapters the paper briefly presents datasources for obtaining of relative permeability curves andtechniques for measurement and analysis of these data.Interpretation and modification of such curves by meansof relative permeability models with the objective to con-tinue using them within the scope of construction of inte-grated hydrocarbon reservoir model is also described. Inthe process care was taken that the ultimate shape of in-dividual sets of relative permeability curves is in agree-ment with relevant parameters that characterizeparticular reservoir rock types within uniform and heter-ogeneous hydrocarbon reservoirs. Processing of relativepermeability data within the scope of measurements onsix reservoir rock samples from different parts of thesame hydrocarbon reservoir is presented in tabular formand as diagram with the objective to confirm it.
2. SOURCES OF RELATIVEPERMEABILITY DATA
There are different techniques and methods for mea-surement of relative permeabilities and their ratios. Outof the following methods briefly presented in further text,the first is based on measurement of field productiondata and on direct calculation of relative permeability ra-tios from them and others are performed in the labora-tory through experiments on reservoir rock samples, i.e.cores.
2.1. Production measurements
Here is presented a short derivation which refers to ob-taining of relative permeabilities from production data.6
On the basis of production data it is possible to calculate
the ratios of effective and relative permeabilities applyingthe Darcy's law on radial flow. Providing PVT ratios of flu-ids are known, it is possible to define the ratio of free anddissolved gas at different pressures in total gas produc-tion according to the following equation:
Produced gas = free gas + petroleum gas
i.e.:
Rp = R + Rs (1)
In accordance with equation (1) and applying the ratiosfrom equations for gas and oil radial flow:
Rk
k
B
BRp
rg
ro
o
g
o
g
� ��
�(2)
equation (2) can be adjusted for calculation of gas andoil relative permeability ratios:
� �k
kR R
B
B
rg
ro
p s
g
o
g
o
� ��
�(3)
oil saturation which corresponds to this ratio of relativepermeabilities is determined according to materialbalance:
� �SN
N
B
BSo
p o
oi
wi� ��
�
� �1 1 (4)
which corresponds to total saturation with fluids ac-cording to equation (5):
� �S S SN N
N
B
BL w wi
p
p
o
oi
� � ���
�
� �
�
� 1 (5)
NAFTA 62 (7-8) 233-243 (2011) 233
Following this calculation, dependence between krg/kro,from equation (3), and SL, from equation (5), is plottedon the log-lin diagram with krg/kro on logarithmic scale.Values krg/kro can be used to verify the accuracy of relativepermeability obtained on the basis of empirical, i.e. labo-ratory procedures.5
2.2. Laboratory measurements on cores
Laboratory measurements of relative permeabilities canbe categorized into three major groups: unsteady-stateand steady-state measurements performed directly oncores, and indirect through measurement of capillarypressures on cores. It is important to note that the men-tioned measurement techniques are performed on differ-ent laboratory apparatuses.6 The main differences inapproach and in measurement techniques between thesemethods will be mentioned in further text.
2.2.1. Unsteady-state methods
Unsteady-state relative permeability measurements canbe performed faster than steady-state measurements,but mathematical description of such measurements ismuch more complex.6 A combination of Darcy's law andequation that defines capillary pressure in differentialform, which takes into consideration the gravity effect, isused for computation of fractional flow of water in thefluid at the outlet end of the core, often called the frac-tional water flow equation with gravity effects.5,6 A variantof this equation will be presented here for the horizontalflow case at negligible capillary pressure, and such con-ditions are considered satisfied when this measurementmethod is used:
S S f Qw av w o w, � � �2 (6)
Qw and Sw,av can be measured during the experiment,and fo2 can be determined from the slope of the curve fordependence between Qw and Sw,av. According to the defi-nition:
fq
q qo
o
o w
2 ��
(7)
From the combination of this equation and Darcy's lawit follows that:
fk
k
oo ro
w rw
2
1
1�
��
�
//
(8)
Since viscosities �o and �w are known, the ratio of rela-tive permeabilities kro/krw can be determined from equa-tion (8). A similar expression can be derived in case of oildisplacement by gas.
When performing experiments for determination of rel-ative permeability according to unsteady-state measure-ment method, attention should be paid to the following:
1. Pressure gradient through the core must besufficiently high to minimize capillary effects;
2. Pressure difference through the core must besufficiently low in comparison with total workingpressure to make the impact of compressibilitynegligible;
3. Core must be homogeneous; and
4. During the experiment, pressure and fluid propertiesmust be maintained at constant level.
The method is most frequently used to determine effec-tive (relative) permeabilities kw/ko, kg/ko and kg/kw.
2.2.2. Steady-state methods
Several different methods and authors, who conductedtests on cores applying the steady-state method are men-tioned.6 The main assumption of the steady-state methodis that a fixed ratio of fluid (e.g. water and oil) is injectedthrough the core until the equilibrium between satura-tion and pressure is achieved. After the equilibrium isachieved, flow velocities of the two phases are recordedand saturation is measured. The procedure is repeateduntil the equilibrium at higher flow velocity of the secondphase is reached, and the data at new saturation valueare obtained. The procedure is repeated at higher andhigher saturation values until a sufficient number ofpoints are obtained for generation of relative permeabil-ity curves. Besides the measurement of saturation byweighing, there are faster and simpler alternatives, suchas measurement of core’s electrical resistance, in addi-tion to other methods.
When using steady-state relative permeability measure-ment methods, primary concern is elimination or at leastreduction of saturation gradient, caused by impact ofcapillary pressure at the outlet end of the core, in Englishoriginal quoted as outflow boundary effect, or abbrevi-ated as end-effect. It is achieved in several ways, whichconstitute one of the main differences between thesteady-state measurement methods.6 Abbreviated termend-effect is common in the Croatian practice and will beused in further text.
2.2.3. Indirect capillary pressure curvemeasurement methods
Procedures used for calculation of relative permeabilitiesfrom capillary pressure measurement data are based ondrainage processes where the non-wettable phase (gas)displaces the wettable phase (oil or water).6 Because ofthat these test are limited to reservoirs where productionregime is based on the process which proceeds in thedrainage direction of flow. Although such methods aregenerally not preferred for generation of relative perme-ability curves, they are still used in cases when core sam-ple is too small for flow test, but sufficient for injection ofmercury. They are also used for cores with too low per-meability for flow tests, or in cases when the capillarypressure is measured but the core is no longer availablefor flow tests.
Process of injection of mercury as a non-wettable phaseinto the previously drained core is usual for indirect ob-tainment of relative permeability curves through capil-lary pressure measurement. Mercury is injected inmeasured quantities and at increasing pressures. Usu-ally approximately 20 points of measurement of valuepairs (Pc, SHg) are needed to obtain the complete capillarypressure curve needed for calculation of relative perme-ability curves. Several authors developed similar equa-tions for calculation of relative permeability curves.6
Equations generated by combining Burdin's and
234 NAFTA 62 (7-8) 233-243 (2011)
A. FEIGL TREATMENT OF RELATIVE PERMEABILITIES FOR APPLICATION...
Purcell's equation for wettable and non-wettable phaseare shown here:
kS S
S
dS P
dS Prwt
L wi
wi
w cS
S
w cS
wi
L
wi
��
�
�
�
�
�
�1
2 2
21
/
/(9)
kS S
S
dS P
dS Prnwt
L L
wi
w cS
w cS
L
wi
��
�
�
�
�
�
�1
2 21
21
/
/(10)
Derivation of these equations is explained and shownin the book by Amyx et all.2
2.2.4. Centrifuge methods
After uniform saturation of reservoir rock samples withone or two fluids (for example oil and water), they areloaded into core holders in an automatic centrifuge.6
During centrifuging fluids are expelled from the core andcollected into see-trough containers connected to coreholders. During centrifugation produced quantities of in-dividual fluids are measured. Works which, together withderivations, specify equations needed for calculation ofrelative permeability curves from measurement resultsobtained by centrifuge methods are listed in references ofHonarpour et all.6
Although centrifuge methods are not often used, theyhave certain advantages over steady-state methods, i.e.they are much faster. Besides, centrifuge measurementsare not accompanied by viscous fingering, which can oc-cur during unsteady-state measurement methods. Onthe other hand, centrifuge methods are affected by thecapillary end-effect problem, and there is no possibilityto define the relative permeability of displacing phase(e.g. water).6
3. RELATIVE PERMEABILITYMODELS
Over many years experimental relative permeabilitycurve measurements made on cores in the laboratorieshave created a need to describe these physical processesby equations.6 Based on knowledge of physical pro-cesses, measured parameters which affect the course ofexperiments, and applying mathematical and statisticalmethods with the aid of computers, numerous authorsdeveloped different equations. These equations whichdescribe physical processes of flow through the core, andthus the actual flow in the hydrocarbon reservoir, areknown as relative permeability models. Basic classifica-tions of these models are based on the following:
1. Do they refer to measurement of two-phase orthree-phase flow processes, i.e. do the correspondingequations describe the two-phase or three-phaserelative permeability curves;
2. Which combination of two-phase fluids is the subjectof testing (oil-water, gas-oil or gas-water);
3. Which experimental methods are used and underwhich p, T conditions (laboratory or formationconditions) to obtain the relative permeabilitycurves, later on used as basis for description of theprocess by means of relative permeability models;
4. What is the value of interfacial tension and wettability,i.e. wetting angle, of the system where the flowprocess occurs;
5. In which direction is the flow measured: in drainageor imbibition direction;
6. On which lithological type of core is the testperformed: carbonate rock, consolidated orunconsolidated sandstones, dolomites, conglomera-tes, fractured rocks, etc.; and
7. On which theoretical foundations and calculationmethods is the obtained relation based: on physicallaws, statistical-empirical relation or a combinationof the first two.
The last seventh point leads to the following classifica-tion, which includes the largest number of relative per-meability models:
1. Capillary models, which are based on the assumptionthat porous medium consists of a bundle of capillarytubes of different diameters, whose length is biggerthan the length of the core sample (with presence oftortuosity effect);
2. Statistical models, described similarly to capillarymodels as a bundle of capillary tubes with randomdistribution of different diameters. These models aredescribed by a large number of thin sectionsperpendicular to the direction of capillary tubes.Sequence and distribution of these sections isconsidered accidental;
3. Empirical models, based on empirically obtainedrelations which describe experimentally determinedrelative permeabilities; and
4. Network models, most often based on modelling offluid flow through the porous medium by means of anetwork of electrical resistors used as an analogmodel. Mathematical models, used to simulate theflow through the core on computers, can be classifiedinto this group.
The complexity of multiphase flow through the porousmedium and different shortcomings of measurementmethods (e.g. disregarding of end-effect or ignoring ofhysteresis effect) result in only approximate equations ofrelative permeability curves. Three different relative per-meability models, well known and often used in worldpractice are described in further text. Among them thefirst two are also used as models for three-phase relativepermeability curves.
3.1. Corey correlation
The work of Corey et all describing the measurement andinterpretation of three-phase relative permeabilities isamong the first important studies in this sphere.4 Thework is often quoted in literature and particularly appre-ciated since he took into consideration both end-effectand hysteresis effect in his experiments. In his work rela-tive permeability curves are shown on ternary diagrams,which were a great novelty at the time of publication.Three different ternary diagrams show the curves ofequal three-phase relative permeabilities, i.e. isopermsfor oil, water and gas. Isoperms for water and gas are
TREATMENT OF RELATIVE PERMEABILITIES FOR APPLICATION... A. FEIGL
NAFTA 62 (7-8) 233-243 (2011) 235
shown as straight lines, analogous to equal saturationlines. Isoperms for oil were calculated according to thefollowing equation:
� �
� �� �k
S S
SS S Sro
L w
Lr
w L Lr��
�� �
3
41
2 (11)
Equation derivation (11) is presented and explained inoriginal Corey's manuscript.4 According to ternary dia-gram for oil, Fig. 4 in that manuscript, it is evident thatisoperms, calculated according to equation (11), are ingood agreement with points of experimentally measuredvalues of relative permeabilities to oil, kro. Corey's work isa practical method for calculation of permeability to oiland water in a three-phase system based on measuredrelative permeabilities to gas.
3.2. Stone correlation
Stone defined a method for estimating three-phase rela-tive permeability based on statistical probability model.11
The data required for calculation of relative permeabilityto oil, kro, are two sets of two-phase relativepermeabilities in water-oil systems with values of krw andkrow, and in gas-oil systems with values of krg and krog.Hysteresis effects were taken into consideration as muchas possible using appropriate two-phase data. The mainassumption of Stone's method is that relative permeabil-ity for wettable phase (water) and relative permeabilityfor non-wettable phase (gas) are functions only of ownvalues for water and gas saturations. At the same time,relative permeability for average or transitionalwettability phase (to oil) has much more complex behav-iour, and statistical probability model is used with sets oftwo-phase data for prediction. Equations (12) and (13)show normalized saturations with fluids defined by treat-ing irreducible water saturation, Swir, and residual oil sat-uration, Sor, as saturations that represent immobilefluids:
SS S
S So
o or
wir or
* ��
� �1for So � Sor (12)
and:
SS S
S Sw
w wir
wir or
* ��
� �1for Sw � Swir (13)
Attention should be paid to the fact that:
SS
S Sg
g
wir or
* �� �1
(14)
and:
S S Sg w o
* * *� � �1 (15)
At normalized oil saturation So* = 100%, kro is also
100%, but decrease of So* (by increasing water and/or gas
saturation) results in decrease of kro which exceeds thedecrease of So
*. �w is defined as a factor for multiplicationwith So
* to eliminate the disproportion in decrease be-tween kro and So
* due to the presence of mobile water,and introduces the assumption that �w is only a functionof water saturation. Factor �g = �g(Sg
*) is defined in a sim-ilar way. It is assumed that combinations of oil-water and
gas-water flow are mutually independent events, andequation (16) can be defined as a relation between rela-tive permeability to oil and normalized saturation withoil as follows:
k Sro o w g� � �* � � (16)
Values of factor �w, which is a function of water satura-tion, are obtained from experimental measurements ofkrow values by inserting into equation (16) that �g = 1and Sg
* = 0. When �w is derived from thus modified equa-tion (16) we obtain:
�wrow
w
k
S�
�1 * (from two-phase data) (17)
It is assumed that in equation (17) krow is only a func-tion of water saturation, as it is defined in two-phase ex-periments. Equation for factor �g can be derived in asimilar manner as a function of Sg
* from experimentallydetermined krog values:
�g
rog
g
k
S�
�1 * (from two-phase data) (18)
Equations from (12) to (18) define relative permeabilityto oil in a three-phase system. The assumption on identi-cal microscopic distributions of fluid in the environmentof two-phase interfaces is the basis for the assumptionthat factor �w is only a function of water saturation, and �g
is only a function of gas saturation. Likewise, the as-sumption that water and gas are spatially separatedleads us to the assumption that dependence of oil flow onwater or gas are two mutually independent phenomena.Due to that, probability theory is linked to the assump-tion that probability of oil flow blockage by water, gas orboth fluids is equal to the product of these factors, �w·�g,and kro was so defined in equation (16). This probabilitymodel was verified on experimental data from previouslypublished works of renowned authors in that sphere(Corey, Dalton and Saraf) confirming good agreementwith measured values.11
Besides the previously described article, later on Stonepublished another work in which he revised the resultspresented in the first paper.12 In that work he gave a newequation, known as three-phase relative permeability es-timation equation, based on channel flow theory:
� � � � � �k k k k k k kro row rw rog rg rw rg� � � � � � (19)
A derivation of that equation is given in the same work,as well as the theoretical basis for explanations. The fol-lowing explanation is needed to clarify obtaining of datarequired for insertion into this equation and their use internary diagram plotting. If calculated values of Sw and Sg
in a three-phase system are given, then Sw is used to ob-tain krw and krow values from the two-phase water-oilsystem; Sg is used to obtain krg and krog values from thetwo-phase gas-oil system. Relative permeabilities to gasand oil, krg and krw, are directly inserted into athree-phase system, while three-phase relative perme-ability to oil, kro, is calculated according to equation(19). In the later work Stone explained that he improved
236 NAFTA 62 (7-8) 233-243 (2011)
A. FEIGL TREATMENT OF RELATIVE PERMEABILITIES FOR APPLICATION...
his probability model given in the previous work. Rela-tive permeabilities predicted by this model are in betteragreement with experimental data. To confirm it, he ap-plied again the data of the same authors (Corey, Daltonand Saraf).12 In this work he also used residual oil satu-ration data, Sor, and compared it against the data givenby Holmgren and Morse to additionally verify validity ofequation (19).12
3.3. Chierici correlation
In his work Chierici used 4- and 5-parameter equationsto obtain relative permeability curves of gas-oil system indrainage direction, and water-oil system in imbibition di-rection.3 As the author notes, these curves are in goodagreement with experimental data, particularly in initialand end points, better than Corey’s model and polyno-mial approximation. The main characteristics ofChierici's model that some of the parameters used in thatmodel have a physical meaning, the others can be deter-mined by non-linear regression on the experimental datapoints and adjusted to represent pseudorelative perme-ability curves. In the following equations are symbolsused by Chierici in his work.3
For gas-oil drainage he proposed the following equa-tions:
k ero
A R gL
�� � (20)
and:
k erg
B R gM
�� � �
(21)
where A, B, L and M are positive numbers, and Rg isnormalized saturation according to equation:
RS S
S Sg
g gc
iw g
��
� �1(22)
where:
Sg - Sgc = 0 for Sg�Sgc
Equations (20) and (21) are 4-parameter equations inwhich empirical coefficients A, L, Sgc and Siw are used todetermine functional dependence kro(So), and empiricalcoefficients B, M, Sgc and Siw are used to determine func-tional dependence krg(Sg). Only Sgc and Siw have a physi-cal meaning. The values of empirical coefficients A, L, B
and M are determined by nonlinear regression on thesets of experimental data points. It was confirmed inpractice that it is better not to apply the regression pro-cess to obtain coefficients A, L, B and M directly to equa-tions (20) and (21), but to their logarithmic forms:
� � �lnk A Rro g
L (23)
� � � �lnk B Rrg g
M (24)
The following equations for water-oil imbibition havebeen found to reproduce very well the experimentally de-termined relative permeability curves, including their be-haviour at the initial and end points:
k ero
A R wL* � � � (25)
k erw
B R wM* � � � �
(26)
where A, B, L and M are positive numbers, while:
RS S
S Sw
w iw
or w
��
� �1(27)
� �k
k
k Srw
rw
rw or
* � (28)
and
� �k
k
k Sro
ro
ro iw
* � (29)
Equations (25) and (26) are 5-parameter equations,where empirical coefficients A, L, Siw, Sor and kro(Siw) areused to calculate the functional dependence kro(So), andempirical coefficients B, M, Siw, Sor and krw(Sor) to calcu-late the functional dependence krw(Sw). Out of these coef-ficients only Siw, Sor, kro(Siw) and krw(Sor) have a physicalmeaning, and for statistically homogeneous reservoirzones their values can be evaluated by using correlations.The values of empirical coefficients A,L, B and M are de-termined by nonlinear regression on the sets of experi-mental data points. In this case, as in the previous one,equations (25) and (26) are used in logarithmic form toachieve better matching of curves and measured points.This is particularly important for achievement of goodmatching near the initial and end points of curves, wherepreviously used methods did not succeed to sufficientlyapproach the measured points.3
4. DATA PROCESSING PRIOR TOINPUT INTO RESERVOIR MODEL
Prior to input of relative permeability data into the hydro-carbon reservoir simulation model, particular attentionshould be paid to analysis and selection of curves ob-tained on the basis of laboratory measurements. If a suf-ficient number of correctly measured and analysedcurves are available for the relevant heterogeneous reser-voir, we can continue with their statistical analysis. Fol-lowing is an example which shows the processing ofrelative permeability data.
4.1. Summary of core measurements
Laboratory measurements of oil-water system relativepermeabilities were performed on six core samples. Thecored rock was consolidated sandstone and all samplesbelonged to the same reservoir, i.e. had the same or simi-lar lithology, as explained in further text. Measurementswere carried out applying the porous plate technique,from the previously described steady-state core mea-surement methods. The samples were restored to theiroriginal condition under vacuum with purified mineraloil of 20 mPa·s viscosity. Each sample was placed into ahydraulic core holder and saturated with oil until alltrapped gas was eliminated (these measurements werepreceded by gas-oil system relative permeability mea-surements). Effective permeability to oil was again mea-sured afterwards. Measurements were performed bydisplacing oil with synthesised brine, whose physicalproperties are equal or very similar to actual formationwater. Incremental volumes of produced oil and waterwere recorded as a function of time and experiments
TREATMENT OF RELATIVE PERMEABILITIES FOR APPLICATION... A. FEIGL
NAFTA 62 (7-8) 233-243 (2011) 237
were discontinued after the krw/kro ratio exceeded 100. Itwas followed by measurement of effective permeability towater. Tables 1 to 6 show experimentally obtained coredata.
4.2. Average curves from laboratory data
The practical use of non-linear regression method ap-plied to the measured data in order to obtain average rel-
ative permeability curves will be briefly presented below.The well known previously presented Sigmund andMcCaffery10 relative permeability data processingmethod, often used in addition to other three describedmethods, as another high-quality relative permeabilitymodel confirmed in practice, was used to obtain the aver-age functional dependence of our data. In continuationall shown nomenclature is in agreement with symbols
238 NAFTA 62 (7-8) 233-243 (2011)
A. FEIGL TREATMENT OF RELATIVE PERMEABILITIES FOR APPLICATION...
Sw
�parts of unit�Sw
N
�parts of unit�krow=krow
N
�parts of unit�(krow
N)av
�parts of unit�krw
�parts of unit�krw
N
�parts of unit�(krwN)av
�parts of unit�
0.153 0.000 1.000 0 1.000 0 0.000 0 0.000 0 0.000 0
0.233 0.168 0.425 0 0.419 8 0.088 0 0.162 7 0.140 9
0.291 0.290 0.231 0 0.203 3 0.130 0 0.240 3 0.256 5
0.364 0.443 0.095 0 0.071 9 0.227 0 0.419 6 0.409 0
0.386 0.489 0.065 0 0.051 4 0.270 0 0.499 1 0.456 1
0.406 0.532 0.049 0 0.037 6 0.305 0 0.563 8 0.499 3
0.434 0.590 0.032 0 0.024 4 0.351 0 0.648 8 0.560 3
0.466 0.658 0.022 0 0.015 2 0.410 0 0.757 9 0.630 8
0.527 0.786 0.008 2 0.006 8 0.491 0 0.907 6 0.767 2
0.552 0.838 0.005 0 0.004 8 0.518 0 0.957 5 0.823 7
0.578 0.893 0.003 1 0.003 1 0.540 0 0.998 2 0.882 9
0.629 1.000 0.000 0 0.000 0 0.541 0 1.000 0 1.000 0
Table 1. Relative and normalized relative permeability data for sample No. 1 depending on water saturation and normalizedwater saturation7
Sw
�parts of unit�Sw
N
�parts of unit�krow=krow
N
�parts of unit�(krow
N)av
�parts of unit�krw
�parts of unit�krw
N
�parts of unit�(krwN)av
�parts of unit�
0.178 0.000 1.000 0 1.000 0 0.000 0 0.000 0 0.000 0
0.305 0.381 0.085 0 0.111 2 0.116 0 0.666 7 0.346 7
0.392 0.643 0.025 0 0.016 8 0.132 0 0.758 6 0.615 1
0.433 0.766 0.011 0 0.007 6 0.144 0 0.827 6 0.745 8
0.468 0.871 0.003 4 0.003 8 0.157 0 0.902 3 0.859 0
0.490 0.937 0.000 88 0.001 8 0.171 0 0.982 8 0.930 9
0.511 1.000 0.000 0 0.000 0 0.174 0 1.000 0 1.000 0
Table 2. Relative and normalized relative permeability data for sample No. 2 depending on water saturation and normalizedwater saturation7
Sw
�parts of unit�Sw
N
�parts of unit�krow=krow
N
�parts of unit�(krow
N)av
�parts of unit�krw
�parts of unit�krw
N
�parts of unit�(krwN)av
�parts of unit�
0.069 0.000 1.000 0 1.000 0 0.000 0 0.000 0 0.000 0
0.236 0.300 0.184 0 0.190 9 0.082 0 0.148 3 0.266 1
0.296 0.408 0.101 0 0.092 7 0.129 0 0.233 3 0.372 9
0.338 0.483 0.063 0 0.053 9 0.187 0 0.338 2 0.449 4
0.364 0.530 0.044 0 0.038 2 0.231 0 0.417 7 0.497 3
0.390 0.576 0.035 0 0.027 0 0.283 0 0.511 8 0.545 7
0.431 0.650 0.024 0 0.016 0 0.346 0 0.625 7 0.622 8
0.544 0.853 0.006 0 0.004 4 0.463 0 0.837 3 0.839 4
0.579 0.916 0.003 0 0.002 5 0.507 0 0.916 8 0.907 7
0.626 1.000 0.000 0 0.000 0 0.553 0 1.000 0 1.000 0
Table 3. Relative and normalized relative permeability data for sample No. 3 depending on water saturation and normalizedwater saturation7
TREATMENT OF RELATIVE PERMEABILITIES FOR APPLICATION... A. FEIGL
NAFTA 62 (7-8) 233-243 (2011) 239
Sw
�parts of unit�Sw
N
�parts of unit�krow=krow
N
�parts of unit�(krow
N)av
�parts of unit�krw
�parts of unit�krw
N
�parts of unit�(krwN)av
�parts of unit�
0.122 0.000 1.000 0 1.000 0 0.000 0 0.000 0 0.000 0
0.184 0.160 0.211 0 0.438 6 0.244 0 0.366 9 0.133 7
0.190 0.176 0.189 0 0.402 1 0.251 0 0.377 4 0.147 9
0.252 0.336 0.102 0 0.151 0 0.305 0 0.458 6 0.301 5
0.366 0.630 0.026 0 0.018 3 0.419 0 0.630 1 0.602 4
0.405 0.731 0.012 0 0.009 4 0.476 0 0.715 8 0.709 0
0.437 0.814 0.005 7 0.005 7 0.522 0 0.785 0 0.797 5
0.461 0.876 0.002 9 0.003 6 0.569 0 0.855 6 0.864 6
0.470 0.899 0.002 3 0.002 9 0.583 0 0.876 7 0.889 8
0.509 1.000 0.000 0 0.000 0 0.665 0 1.000 0 1.000 0
Table 4. Relative and normalized relative permeability data for sample No. 4 depending on water saturation and normalizedwater saturation7
Sw
�parts of unit�Sw
N
�parts of unit�krow=krow
N
�parts of unit�(krow
N)av
�parts of unit�krw
�parts of unit�krw
N
�parts of unit�(krwN)av
�parts of unit�
0.112 0.000 1.000 0 1.000 0 0.000 0 0.000 0 0.000 0
0.209 0.299 0.221 0 0.191 5 0.157 0 0.219 3 0.005 7
0.222 0.340 0.168 0 0.147 5 0.201 0 0.280 7 0.008 4
0.246 0.414 0.110 0 0.088 9 0.240 0 0.335 2 0.017 4
0.283 0.528 0.062 0 0.038 7 0.322 0 0.449 7 0.049 0
0.315 0.627 0.032 0 0.018 8 0.398 0 0.555 9 0.107 3
0.333 0.682 0.019 0 0.012 9 0.450 0 0.628 5 0.159 8
0.353 0.744 0.011 0 0.008 7 0.502 0 0.701 1 0.241 0
0.377 0.818 0.005 6 0.005 5 0.576 0 0.804 5 0.379 3
0.402 0.895 0.002 5 0.003 1 0.648 0 0.905 0 0.585 3
0.417 0.941 0.001 2 0.001 7 0.683 0 0.953 9 0.746 5
0.436 1.000 0.000 0 0.000 0 0.716 0 1.000 0 1.000 0
Table 5. Relative and normalized relative permeability data for sample No. 5 depending on water saturation and normalizedwater saturation7
Sw
�parts of unit�Sw
N
�parts of unit�krow=krow
N
�parts of unit�(krow
N)av
�parts of unit�krw
�parts of unit�krw
N
�parts of unit�(krwN)av
�parts of unit�
0.103 0.000 1.000 0 1.000 0 0.000 0 0.000 0 0.000 0
0.178 0.182 0.290 0 0.388 0 0.092 0 0.146 0 0.153 8
0.198 0.231 0.212 0 0.292 6 0.140 0 0.222 2 0.199 4
0.235 0.320 0.125 0 0.167 2 0.171 0 0.271 4 0.286 3
0.293 0.461 0.045 0 0.063 2 0.233 0 0.369 8 0.427 2
0.367 0.641 0.019 0 0.017 0 0.333 0 0.528 6 0.613 2
0.430 0.794 0.007 3 0.006 4 0.430 0 0.682 5 0.775 7
0.472 0.896 0.002 9 0.003 1 0.501 0 0.795 2 0.885 9
0.495 0.951 0.001 2 0.001 4 0.539 0 0.855 6 0.946 8
0.515 1.000 0.000 0 0.000 0 0.630 0 1.000 0 1.000 0
Table 6. Relative and normalized relative permeability data for sample No. 6 depending on water saturation and normalizedwater saturation7
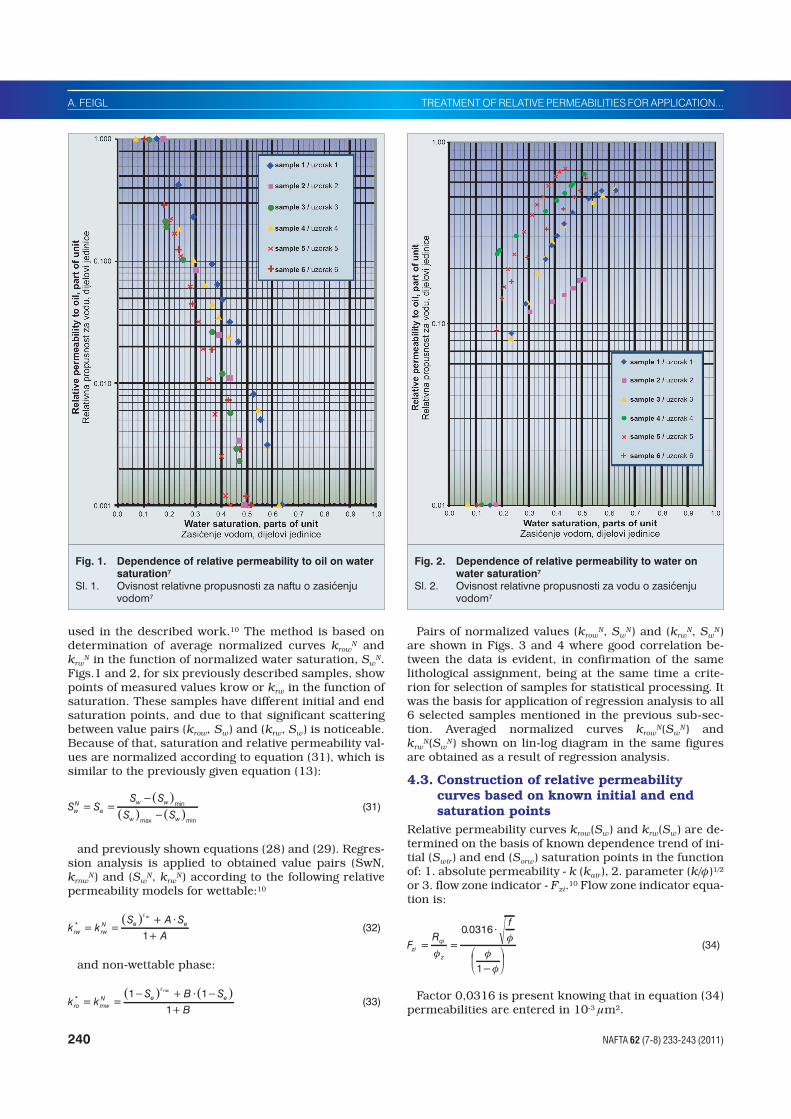
used in the described work.10 The method is based ondetermination of average normalized curves krow
N andkrw
N in the function of normalized water saturation, SwN.
Figs.1 and 2, for six previously described samples, showpoints of measured values krow or krw in the function ofsaturation. These samples have different initial and endsaturation points, and due to that significant scatteringbetween value pairs (krow, Sw) and (krw, Sw) is noticeable.Because of that, saturation and relative permeability val-ues are normalized according to equation (31), which issimilar to the previously given equation (13):
� �
� � � �S S
S S
S Sw
N
e
w w
w w
� ��
�min
max min
(31)
and previously shown equations (28) and (29). Regres-sion analysis is applied to obtained value pairs (SwN,krnw
N) and (SwN, krw
N) according to the following relativepermeability models for wettable:10
� �k k
S A S
Arw rw
N e e
w
* � �� �
�
�
1(32)
and non-wettable phase:
� � � �k k
S B S
Bro rnw
N e e
nw
* � �� � � �
�
1 1
1
�
(33)
Pairs of normalized values (krowN, Sw
N) and (krwN, Sw
N)are shown in Figs. 3 and 4 where good correlation be-tween the data is evident, in confirmation of the samelithological assignment, being at the same time a crite-rion for selection of samples for statistical processing. Itwas the basis for application of regression analysis to all6 selected samples mentioned in the previous sub-sec-tion. Averaged normalized curves krow
N(SwN) and
krwN(Sw
N) shown on lin-log diagram in the same figuresare obtained as a result of regression analysis.
4.3. Construction of relative permeabilitycurves based on known initial and endsaturation points
Relative permeability curves krow(Sw) and krw(Sw) are de-termined on the basis of known dependence trend of ini-tial (Swir) and end (Sorw) saturation points in the functionof: 1. absolute permeability - k (kair), 2. parameter (k/�)1/2
or 3. flow zone indicator - Fzi.10 Flow zone indicator equa-tion is:
FR
f
zi
qi
z
� �
�
�
�
�
� �
�
�
�
0 0316
1
.(34)
Factor 0,0316 is present knowing that in equation (34)permeabilities are entered in 10-3 �m2.
240 NAFTA 62 (7-8) 233-243 (2011)
A. FEIGL TREATMENT OF RELATIVE PERMEABILITIES FOR APPLICATION...
Fig. 1. Dependence of relative permeability to oil on watersaturation7
Sl. 1. Ovisnost relativne propusnosti za naftu o zasiæenjuvodom7
Fig. 2. Dependence of relative permeability to water onwater saturation7
Sl. 2. Ovisnost relativne propusnosti za vodu o zasiæenjuvodom7
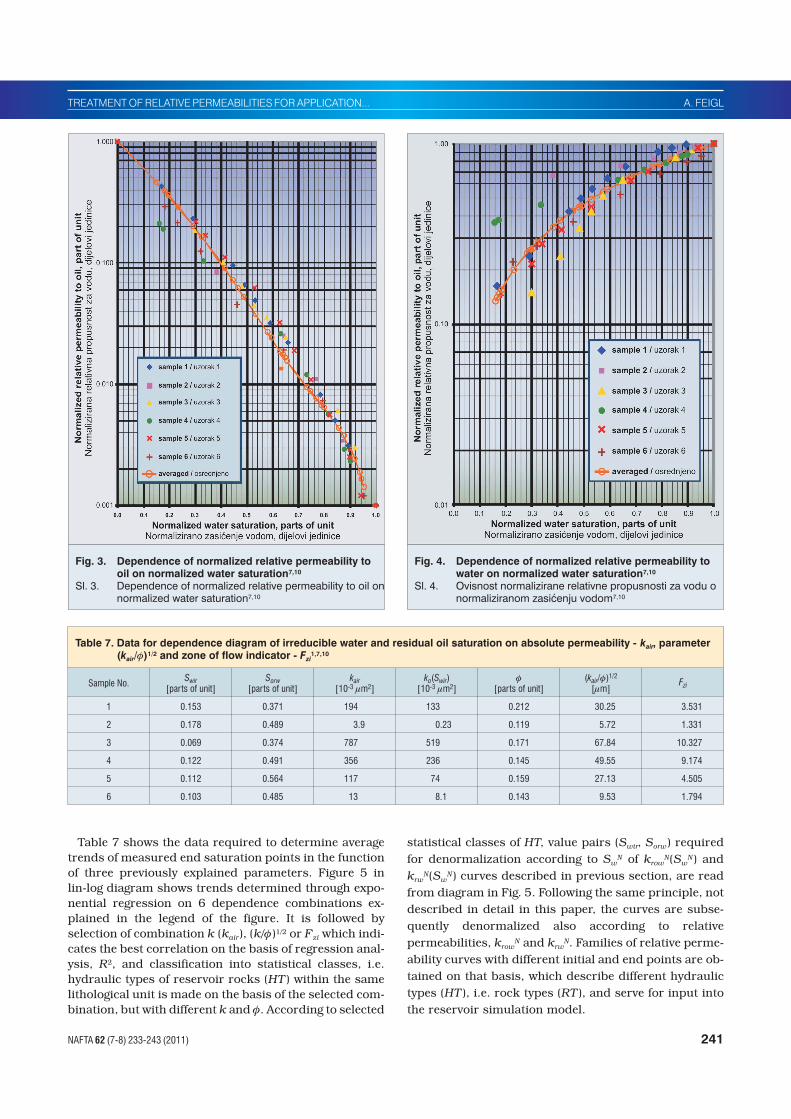
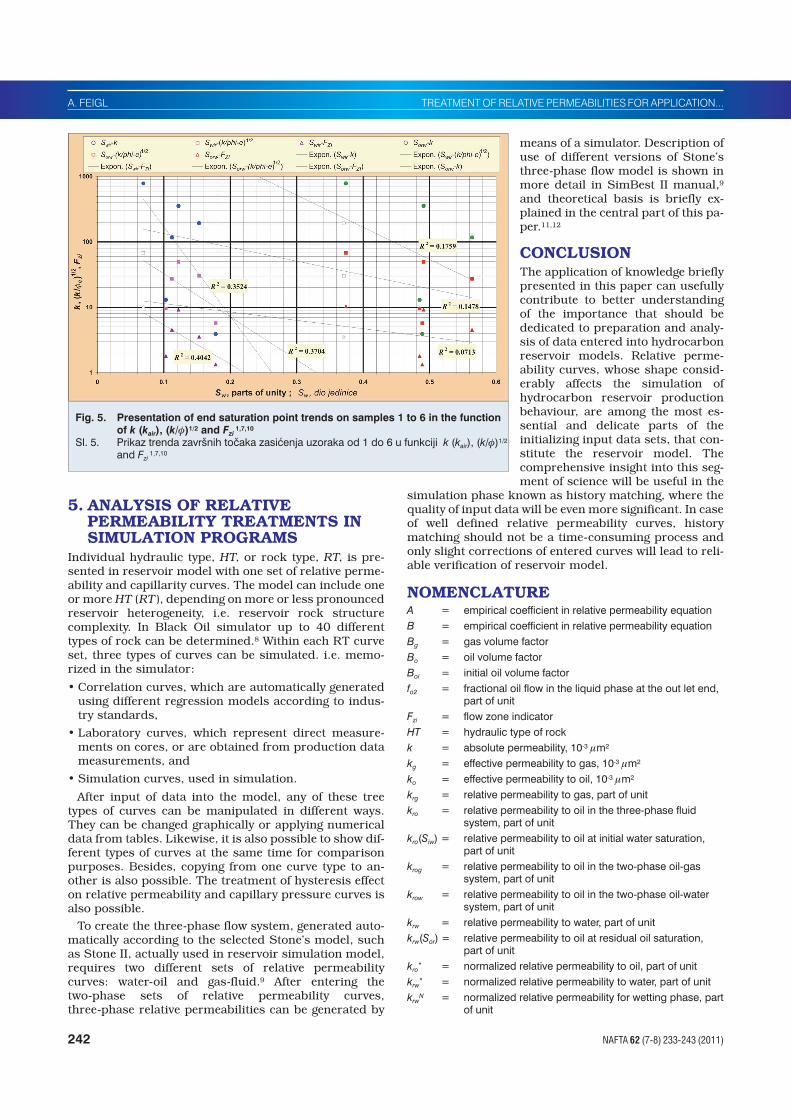
Table 7 shows the data required to determine average
trends of measured end saturation points in the function
of three previously explained parameters. Figure 5 in
lin-log diagram shows trends determined through expo-
nential regression on 6 dependence combinations ex-
plained in the legend of the figure. It is followed by
selection of combination k (kair), (k/�)1/2 or Fzi which indi-
cates the best correlation on the basis of regression anal-
ysis, R2, and classification into statistical classes, i.e.
hydraulic types of reservoir rocks (HT) within the same
lithological unit is made on the basis of the selected com-
bination, but with different k and �. According to selected
statistical classes of HT, value pairs (Swir, Sorw) required
for denormalization according to SwN of krow
N(SwN) and
krwN(Sw
N) curves described in previous section, are read
from diagram in Fig. 5. Following the same principle, not
described in detail in this paper, the curves are subse-
quently denormalized also according to relative
permeabilities, krowN and krw
N. Families of relative perme-
ability curves with different initial and end points are ob-
tained on that basis, which describe different hydraulic
types (HT), i.e. rock types (RT), and serve for input into
the reservoir simulation model.
TREATMENT OF RELATIVE PERMEABILITIES FOR APPLICATION... A. FEIGL
NAFTA 62 (7-8) 233-243 (2011) 241
Fig. 3. Dependence of normalized relative permeability tooil on normalized water saturation7,10
Sl. 3. Dependence of normalized relative permeability to oil onnormalized water saturation7,10
Fig. 4. Dependence of normalized relative permeability towater on normalized water saturation7,10
Sl. 4. Ovisnost normalizirane relativne propusnosti za vodu onormaliziranom zasiæenju vodom7,10
Sample No.Swir
�parts of unit�Sorw
�parts of unit�kair
�10-3 �m2�ko(Swir)
�10-3 �m2��
�parts of unit�(kair/�)1/2
��m�Fzi
1 0.153 0.371 194 133 0.212 30.25 3.531
2 0.178 0.489 3.9 0.23 0.119 5.72 1.331
3 0.069 0.374 787 519 0.171 67.84 10.327
4 0.122 0.491 356 236 0.145 49.55 9.174
5 0.112 0.564 117 74 0.159 27.13 4.505
6 0.103 0.485 13 8.1 0.143 9.53 1.794
Table 7. Data for dependence diagram of irreducible water and residual oil saturation on absolute permeability - kair, parameter(kair/�)1/2 and zone of flow indicator - Fzi
1,7,10
5. ANALYSIS OF RELATIVEPERMEABILITY TREATMENTS INSIMULATION PROGRAMS
Individual hydraulic type, HT, or rock type, RT, is pre-sented in reservoir model with one set of relative perme-ability and capillarity curves. The model can include oneor more HT (RT), depending on more or less pronouncedreservoir heterogeneity, i.e. reservoir rock structurecomplexity. In Black Oil simulator up to 40 differenttypes of rock can be determined.8 Within each RT curveset, three types of curves can be simulated. i.e. memo-rized in the simulator:
• Correlation curves, which are automatically generatedusing different regression models according to indus-try standards,
• Laboratory curves, which represent direct measure-ments on cores, or are obtained from production datameasurements, and
• Simulation curves, used in simulation.
After input of data into the model, any of these treetypes of curves can be manipulated in different ways.They can be changed graphically or applying numericaldata from tables. Likewise, it is also possible to show dif-ferent types of curves at the same time for comparisonpurposes. Besides, copying from one curve type to an-other is also possible. The treatment of hysteresis effecton relative permeability and capillary pressure curves isalso possible.
To create the three-phase flow system, generated auto-matically according to the selected Stone’s model, suchas Stone II, actually used in reservoir simulation model,requires two different sets of relative permeabilitycurves: water-oil and gas-fluid.9 After entering thetwo-phase sets of relative permeability curves,three-phase relative permeabilities can be generated by
means of a simulator. Description ofuse of different versions of Stone’sthree-phase flow model is shown inmore detail in SimBest II manual,9
and theoretical basis is briefly ex-plained in the central part of this pa-per.11,12
CONCLUSIONThe application of knowledge brieflypresented in this paper can usefullycontribute to better understandingof the importance that should bededicated to preparation and analy-sis of data entered into hydrocarbonreservoir models. Relative perme-ability curves, whose shape consid-erably affects the simulation ofhydrocarbon reservoir productionbehaviour, are among the most es-sential and delicate parts of theinitializing input data sets, that con-stitute the reservoir model. Thecomprehensive insight into this seg-ment of science will be useful in the
simulation phase known as history matching, where thequality of input data will be even more significant. In caseof well defined relative permeability curves, historymatching should not be a time-consuming process andonly slight corrections of entered curves will lead to reli-able verification of reservoir model.
NOMENCLATUREA = empirical coefficient in relative permeability equation
B = empirical coefficient in relative permeability equation
Bg = gas volume factor
Bo = oil volume factor
Boi = initial oil volume factor
fo2 = fractional oil flow in the liquid phase at the out let end,part of unit
Fzi = flow zone indicator
HT = hydraulic type of rock
k = absolute permeability, 10-3 �m2
kg = effective permeability to gas, 10-3 �m2
ko = effective permeability to oil, 10-3 �m2
krg = relative permeability to gas, part of unit
kro = relative permeability to oil in the three-phase fluidsystem, part of unit
kro(Siw) = relative permeability to oil at initial water saturation,part of unit
krog = relative permeability to oil in the two-phase oil-gassystem, part of unit
krow = relative permeability to oil in the two-phase oil-watersystem, part of unit
krw = relative permeability to water, part of unit
krw(Sor) = relative permeability to oil at residual oil saturation,part of unit
kro* = normalized relative permeability to oil, part of unit
krw* = normalized relative permeability to water, part of unit
krwN = normalized relative permeability for wetting phase, part
of unit
242 NAFTA 62 (7-8) 233-243 (2011)
A. FEIGL TREATMENT OF RELATIVE PERMEABILITIES FOR APPLICATION...
Fig. 5. Presentation of end saturation point trends on samples 1 to 6 in the functionof k (kair), (k/�)1/2 and Fzi
1,7,10
Sl. 5. Prikaz trenda završnih toèaka zasiæenja uzoraka od 1 do 6 u funkciji k (kair), (k/�)1/2
and Fzi1,7,10
krnwN = normalized relative permeability for non-wetting phase,
part of unitL = empirical coefficient in relative permeability equationM = empirical coefficient in relative permeability equationN = initial oil reserves, m3
Np = produced oil quantity, m3
Pc = capillary pressure, Paqo = oil quantity in the flow, cm3/sqw = water quantity in the flow, cm3/sQw = cumulative injected water quantity, 1/(pore volume)R = free gas and oil ratioRg = normalized gas saturation, part of unitRp = total produced gas and oil ratioRqi = reservoir quality index, �mRs = dissolved (petroleum) gas and oil ratioRT = rock typeRw = normalized water saturation, part of unitSe = normalized wetting phase saturation, part of unitSg = gas saturation, part of unitSgc = critical gas saturation, part of unitSg
* = normalized gas saturation, part of unitSiw = initial water saturation, part of unitSL = liquid phase saturation, part of unitSLr = residual liquid phase saturation, part of unitSo = oil saturation, part of unitSor = residual oil saturation, part of unitSorw = residual oil saturation in two-phase oil-water system,
part of unitSo
* = normalized oil saturation, part of unitSw = water or wetting phase saturation, part of unitSw,av = average water saturation, part of unitSw2 = water saturation at the out let end, part of unitSwi = initial water saturation, part of unitSwir = irreducible water saturation, part of unitSw
* = normalized water saturation, part of unitSw
N = normalized wetting phase saturation, part of unit(Sw)max = maximal wetting phase saturation, part of unit(Sw)min = minimal wetting phase saturation, part of unit�g = factor which takes into consideration oil blockage by
gas�w = factor which takes into consideration oil blockage by
water�w = parameter in equation for relative permeability of
wettable phase�nw = parameter in equation for relative permeability of
non-wettable phase�g = gas viscosity, mPa·s�o = oil viscosity, mPa·s�w = water viscosity, mPa·s� = porosity, part of unit�z = pore volume and grain volume ratio
REFERENCES1. Amaefule, J. O., Altunbay, M., Tiab, D., Kersey, D. G. & Keelan, D. K.: “En-
hanced Reservoir Description: Using Core and Log Data to Identify Hydraulic(Flow) Units and Predict Permeability in Uncored Intervals/Wells”, SPE 26436,1993.
2. Amyx, J. W., Bass, D. M. Jr. & Whiting, R. L.: “Petroleum Reservoir Engineer-ing”, McGraw-Hill Book Company, New York, Toronto, London, 1960.
3. Chierici, G. L.: “Novel Relations for Drainage and Imbibition RelativePermeabilities”, Society of Petroleum Engineers Journal (June 1984) 275.
4. Corey, A. T., Rathjens, C. H., Henderson, J. H. & Wyllie, M. R. J.:“Three-Phase Relative Permeability”, Trans. AIME 207 (1956) 349.
5. Craft, B. C. & Hawkins, M. F.: “Applied Petroleum Reservoir Engineering”,Prentice-Hall, Inc., Englewood Cliffs, N.J., 1959.
6. Honarpour, M., Koederitz, L. & Harvey, A. H.: “Relative Permeability of Petro-leum Reservoirs”, CRC Press, Boca Raton, Florida, 1987.
7. Hy-Tech Petroleum Laboratories Ltd.: „Service Proposal for Field ''A'' Core Anal-ysis“, Geotech, Calgary, Alberta, Canada.
8. Scientific Software - Intercomp, Inc.: “Petroleum Workbench, Black Oil Refer-ence Manual”, Release Date: May 1992, Reference Manual Version: 1.4
9. Scientific Software - Intercomp, Inc.: “SimBest II User Guide”, Release Date:November 24, 1993, User Guide Version: 3.21.
10. Sigmund, P. M. & McCaffery, F. G.: “An Improved Unsteady-State Procedure forDetermining the Relative-Permeability Characteristics of Heterogeneous PorousMedia”, Society of Petroleum Engineers Journal (Feb. 1979) 15.
11. Stone, H. L.: “Probability Model for Estimating Three-Phase Relative Permeabil-ity”, Journal of Petroleum Technology (Feb. 1970) 214.
12. Stone, H. L.: “Estimation of Three-Phase Relative Permeability and Residual OilData”, The Journal of Canadian Petroleum Technology (Oct.-Dec. 1973) 53.
�
Author:
Alan Feigl, Reservoir Engineering Expert, INA Industrija nafte d.d.Oil & Gas Exploration and Production, Field Engineering & Operations SectorReservoir Monitoring & Surveillance Department Reservoir Engineering BU,Šubiæeva 29, 10000 Zagreb, CroatiaTel.: + 385 1 459-2282Fax: + 385 1 459-2224E-mail: [email protected]
TREATMENT OF RELATIVE PERMEABILITIES FOR APPLICATION... A. FEIGL
NAFTA 62 (7-8) 233-243 (2011) 243