Embed Size (px)
Citation preview

University of Rhode Island University of Rhode Island
DigitalCommons@URI DigitalCommons@URI
Open Access Dissertations
1987
Treatment of Refinery Wastewaters Using Various Modified Treatment of Refinery Wastewaters Using Various Modified
Activated Sludge Process Activated Sludge Process
Saleh Mohammed Al-Muzaini University of Rhode Island
Follow this and additional works at: https://digitalcommons.uri.edu/oa_diss
Recommended Citation Recommended Citation Al-Muzaini, Saleh Mohammed, "Treatment of Refinery Wastewaters Using Various Modified Activated Sludge Process" (1987). Open Access Dissertations. Paper 552. https://digitalcommons.uri.edu/oa_diss/552
This Dissertation is brought to you for free and open access by DigitalCommons@URI. It has been accepted for inclusion in Open Access Dissertations by an authorized administrator of DigitalCommons@URI. For more information, please contact [email protected].

'
TREATMENT OF REFINERY WASTEWATERS USING VARIOUS MODIFIED
ACTIVATED SLUDGE PROCESSES
BY
SALEH MOHAMMED AL-MUZAINI
A DISSERTATION SUBMITTED IN PARTIAL FULFILLMENT OF THE
REQUIREMENTS FOR THE DEGREE OF
DOCTOR OF PHILOSOPHY
IN
CIVIL AND ENVIRONMENTAL ENGINEERING
UNIVERSITY OF RHODE ISLAND
1987

'
Approved:
DOCTOR OF PHILOSOPHY DISSERTATION
OF
SALEH MOHAMMED AL-MUZAINI
Dissertation Committee
Major Pr of es so r __ L~""-"--/j?_--~-~-..41-~_'Zu _ _:._ ____ _
~it4if;ll
UNIVERSITY OF RHODE ISLAND
1987
Schoo 1

ABSTRACT
Biological prosesses for treating refinery industry
wastewater for re-use were studied. A pilot-scale
biological reactor was constructed to simulate the
activated sludge treatment process.
Actual refinery industry wastewater collected from a
regional refinery and spiked with additions of selected
priority organics was fed at a rate of 1.3 liters/hour
into a 6'-liter pilot plant having a hydraulic retention
time of 4 hours. Activated sludge (AS) which was
augmented by additions of powdered activated carbon (PAC)
at dosages of 10, 50 and 120 mg/L was evaluated. The AS
process removed 70-80% of the B005 , COO and TDC. With the
addition of PAC, removal efficiencies of the indicator
compounds rose to 80-95%. The sludge physical parameters
and kinetic constants were determined with and without the
addition of PAC to the AS.
PAC additions to the AS increased the amount of
biomass in the reactor. Volatile compounds (benzene,
chloroform, ethylbenzene, toluene, m-xylene and o-xylene)
were removed from the reactor by volatilization which
o c c u r r e d fr om a i r st r i pp i n g . PAC alone (without AS) was
primarily responsible for removing base and acid/neutral
extractabl e compounds (2,4-dimethylphenol, fluorene,
naphthalene and pyrene).

ACKNOWLEDGMENTS
This investigation was supported by a grant from the
Kuwait Environmental Protection Council and the Kuwait
Institute for Scientific Research.
The author wishes to extend his appreciation to his
advisor, Or. Leon Thiem and to Or. Raymond Wright and Or.
' . William Wright for their assistance. Al so the author
would like to thank Sam Huston for his help in bringing
wastewater from Pennsylvania to Rhode Isl and, George
Huston for assistance with the mechanical apparatus and to
my family for their understanding.
i i i

TABLE OF CONTENTS
Page
ABSTRACT......................................... ii
ACKNOWLEDGEMENTS................................. iii
TABLE OF CONTE NT S.... . . . . . . . . . . . . . . . . . . . . . . . . . . . . iv
LI ST OF FI GU RES. . . . . . . . . . . . . . . . . . . . . . . . . . . . . . . . . . viii
LIST OF TABLES................................... xii
GLOSSARY......................................... xix
1 • I N T "O D U C T I 0 N
1.1 Shuaiba Industrial Area Site Description. 1
1.1.1 Existing Water Quality . .. .. .. . . . .. ... 6
1.1.2 Present Wastewater Treatment.......... 7
1. 2 Objectives..... . . . . . . . . . . . . . . . . . . . . . . . . . 11
2. LITERATURE REVIEW
2.1 Activated Sludge Treatment Processes.... 12
2.2 Addition of Powdered Activated Carbon To Improve Activated Sludge Treatment............................... 14
2.3 Priority Pollutants..................... 29
2.4 Air Stripping........................... 32
2.5 Industrial Wastewater Reclamation and Reuse................................... 33
3. EXPERIMENTAL PROCEDURE
3 . 1 E q u i pm e n t . . . . . . . . . . . . . . . . . . . . . . . . . . . . . . . 4 0
3. 2 Experimental Steps...................... 43
3.3 Sampling Procedure...................... 51
i v

3.4 Analytical Methods...................... 53
3 . 4 . 1 Sam pl e Pre par at i on . • • . . . . • • • . . • . . . 5 4
3.5 Seeding Refinery Industry Wastewater.... 62
3.6 Start-up of the Biological Pilot Plant.. 62
4. CHARACTERIZATION OF THE STANDARD REFINERY WASTEWATER
4.1 Data Collection......................... 64
4.2 Selection of Priority Pollutants........ 66
5. PRIORITY ORGANICS REMOVAL PROCESSES
5.1 Activated Sludge •.••..••••..•...••••..• 71
' 5.2 Integrated Powdered Activated Carbon (PAC) and Activated Sludge (AS)......... 73
5.3 Air Stripping and Adsorption............ 75
5.4 Integrated Powdered Activated Carbon (PAC) in the Absence of Activated Sludge........................ 76
6. BIOLOGICAL ANALYSIS
6.1 Initial Biomass Seeding................. 78
6.2 Biological Model •••....•••••••••..•.•••. 86
6.3 Biokinetic Constants.................... 90
6.4 Determination of Kinetic Coefficients.. . 93
6.5 Microscopic Analysis of Activated Sludge
6.5.1 Materials and Methods............ 94
6.6 Biogrowth on Powdered Activated Carbon (PAC) . . . . . . . . . . . . . . . . . . . . . . . . . . . . 9 4
6.6.1 Materials and Methods............ 95
7. RESULTS
7.1 Description and Evaluation of Biokinetic Constants.................... 98
v

7. 2 Experiment 1: Activated Sludge Treatment Process....................... 102
7.3 Experiment 2: Activated Sludge with Powdered Activated Carbon............... 123
7.4 Evaluation of Biological Growth in Experiments 1 and 2..................... 175
7.4.1 Light Microscopic Analysis....... 175
7.4.2 Scanning Electron Microscopic Analysis......................... 186
7.5 Experiment 3: Air Stripping Process.... 193
7.6 Experiment 4: PAC without Activated Sludge.................................. 194
' 8. CONCLUSIONS.................................. 210
9. RECOMMENDATIONS.............................. 211
10. REFERENCES................................... 212
11. APPENDICES................................... 220
Appendix 1: A List of Priority Pollutants... 221
Appendix 2: Experiment 1: Figures for Bio-Kinetic Constants........ 227
Appendix 3: Experiment 1: Figures for Priority Pollutants Removal.......... 252
Appendix 4: Experiment 2: Figures for Priority Pollutants Removal, PAC = 10, 50 and 120 mg/L............. 257
Appendix 5: Modification of Purgeable Halocarbons Method 601.......... 270
Appendix 6: Modification of Volatile Aromatics Method 602............ 275
v i

Appendix 7: Water analysis in the Shuaiba Industrial Area................. 280
'
v i i

Figure 1 .1
Figurel.2
Figure 3.1.1
Figure 3.1.2
Figure 3.1.3
Figure 3.1.4
' Figure 5.1
Figure 6.1.1
Figure 6.1.2
Figure 6.1.3
Figure 6.1.4
Figure 6.1.5
Figure 6.2.1
Figure 7.2.1
Figure 7.2.2
Figure 7.2.3
Figure 7.3.1
LIST OF FIGURES
Location of the Shuaiba Industrial Area with Respect to Kuwait City and Arabian Gulf .••...•••.••...••.
Shuaiba Industrial Area .•....••....
Schematic diagram of the Integrated PAC/AS Pilot Plant •••••..•..•...•••
Schematic of the Holding Tank and Filters ........................... .
Schematic Diagram of the Experimental Clarifier Unit •...•...
Schematic Diagram of the Weir Inside the Clarifier ...•.•...•..•••
Experimental Steps .•••••..•••••..••
Suspended Solids Concentration in
2
3
41
42
44
45
72
the Reactor Unit................... 79
Aeration Tank Suspended Sol ids Concentration During Activated Sludge Phase....................... 81
Areation Tank Suspended Solids, During PAC/AS Phase................ 83
Clarifier Suspended Solids Effluent During Activated Sludge Phase...... 84
Clarifier Suspended Solids Effluent During PAC/AS Phase................ 85
Complete Mix Activated Sludge Model 87
BOD 5 Removal by Activated Sludge... 110
TOC Removal by Activated Sludge.... 111
COD Removal by Activated Sludge.... 113
BOD5 Removal by Activated Sludge and Powdered Activated Carbon, PAC = 10 mg/L.......................... 143
v i i i

Figure 7.3.2
Figure 7.3.3
Figure 7.3.4
Figure 7.3.5
Figure 7.3.6
F i g u r e 7 .'3 . 7
Figure 7.3.8
Figure 7.3.9
BOD5 Removal by Activated Sludge and Powaered Activated Carbon PAC = 50 mg/L............................... 144
BOD5 Removal by Activated Sludge and Powaered Activated Carbon PAC = 120 mg/L............................... 145
Effect of Sludge Age on BOD 5 Removal
COD Removal by Activated Sludge and Powdered Activated Carbon PAC = 10
146
mg/L ............................... 148
COD Removal by Activated Sludge and Powdered Activated Carbon PAC = 50 mg/L............................... 149
COD Removal by Activated Sludge and Po wd ere d Ac t i v ate d Car b on PAC = 120 mg/L........................... 150
Effect of Sludge Age on COD Removal
TOC Removal by Activated Sludge and Powdered Activated Carbon PAC = 10
151
mg/L............................... 152
Figure 7.3.10 TOC Removal by Activated Sludge and Powdered Activated Carbon PAC = 50 mg/L............................... 153
Figure 7.3.11 TOC Removal by Activated Sludge and Powdered Activated Carbon PAC = 120 mg/L........................... 154
Figure 7.3.12 Effect of Sludge Age on TOC Removal 155
Figure 7.4.1.1 Photomicrograph of protozoa in a raw aerated wastewater (160X). 177
Figure 7.4.1.2 Photomicrograph of filamentous floe (bacteria) in the activated sludge (160X)..... . ................. 178
Figure 7.4.1.3 Photomicrograph of filamentous microorganisms (bacteria) in the activated sludge (160x) ..•.....•.... 180
i x

Figure 7.4.1.4 Photomicrograph of a ciliate microorganism in the activated sludge ( 160X)...................... 181
Figure 7.4.1.5 Photomicrograph of a ciliate in the activated sludge (160 X).......... 182
Figure 7.4.1.6 Photomicrograph of a rotifier in the activated sludge (160X) ........ 183
Figure 7.4.1.7 Photomicrograph of dispersed bacteria in the activated sludge ( l60X).............................. 184
Figure 7.4.1.8 Changing Microorganism Population in the Aeration tank............... 185
Figure 7.4.2.1 Scanning electron micrograph of the , surface of virgin PAC particles
without biological growth.......... 187
Figure 7.4.2.2 Scanning electron micrograph of PAC particles exposed to refinery industry wastewater for 44 days (rod-shaped bacteria were attached, PAC dosage 120 mg/L, sludge age 3 days)................. 189
Figure 7.4.2.3 Scanning electron micrograph of PAC particles exposed to refinery industry wastewater for 44 days (rod-shaped bacteria are present in the wastewater, PAC dosage 120 mg/L, sludge age 3 days)............ 190
Figure 7.4.2.4 Scanning electron micrograph of PAC particles exposed to refinery industry wastewater for 56 days in a c om p 1 e t e m i x e d r e a c to r , ( r o d -shaped bacteria are growing on the PAC particles, PAC dosage 120 mg/L sludge age 12 days)................ 191
Figure 7.4.2.5 Scanning electron micrograph of PAC particles exposed to refinery industry wastewater for 56 days in a complete mixed reactor with 120 mg/L of carbon, (rod-shaped bacteria are growing on PAC particles)......................... 192
x

Figure 7.6.1 A comparison of COD Removal by PAC and PAC/AS.......................... 200
F i g u r e 7 . 6 . 2 A c om pa r i so n o f T 0 C Rem o v a l by PA C and PAC/AS.......................... 201
Figure 7.6.3 2,4-Dimethylphenol Removal by Powdered Activated Carbon........... 205
F i g u r e 7 . 6 . 4 F l u ore n e Remo v al by Po wd ere d Activated Carbon.................... 206
Figure 7.6.5 Naphthalene Removal by Powdered Activated Carbon.................... 207
Figure 7.6.6 Pyrene Removal by Powdered Activated Carbon. . . . . . . . . . . . . . . . . . . . . . . . . . . . . . 208
'
xi

Table l.l
Table 1.1.1
Table 1.1.2
Table 3.1.1
Table 3.2.1
Table 3.4,.2
Table 3.2.3
Table 3.3.1
LIST OF TABLES
Key to Shuaiba Industrial Area ............. . 4
Industrial Wastewater Flows and Pollution Loads in the SIA (Source: Ref. No. 58).. .... 8
Recommended Ambient Marine Environment Quality Criteria for Inshore Waters Around Shuaiba (Source: Ref. No. 58) ....... 10
Physical Properties of the BL type of Powdered Activated Carbon (Calgon Corporation, Pittsburgh, PA) ................ 46
Operating Conditions of the Biological Pilot Plant ................................. 48
Characteristics of the Refinery Industry Wastewater .................................. 49
Chemical Composition of the Refinery Industry Wastewater Treated by the Pilot Pl ant....................................... 50
Sampling and Analytical Work Schedule for th e Bi o l o g i c al Tr e a tm en t Pi l o t Pl an t . . . . . . . . i; 2
Table 3.4.1.1 Tekmar Model LSC-2 Conditions for Analysis of Purgeable Organic Compounds .............. 55
Table 3.4.1.2 Gas Chromatographic Conditions for photoionization Detection (PIO) ............. 56
Table 3.4.1.3 Gas Chromatographic Conditions for Hall Electrolytic Detention (HALL) ............... 57
Table 3.4.1.4 Gas Chromatographic Conditions for Flame
Table 4.1.1
Table 4.1.2
Table 4.1.3
Ionization Detection (FID) .................. 58
Results of Analysis for the Composite Sam pl es From the KNPC - API Separator and PIC Plant B ................................. 65
Extractable Organic Compounds Found in KNPC API Effluent ............................... 67
Halocarbon and Aromatic Compound Concentrations Found in Wastewater of KNPC API Separator Effluent...................... 68
xi i

Table 4.2.1 Chemical and Physical Characteristics of Selected Priority Organic Pollutants ..•..... 70
Tab 1 e 7. 1 . 1 Biokinetic Constants for the Modified Activated Sludge Pilot Pl ant • . • . • . . . . • . . . . . 99
Table 7. 1 .2 Typical Values for Biokinetic Constants for the Activated Sludge at 20°c (Ref. no. 48) ..................................... 100
Table 7.2.1 Biological Treatment of Refinery Industry Wastewater by Activated Sludge, Sludge Age (9 ) = 3 days, (All concentrations are in mg7L)....................................... 103
Table 7.2.2 Biological Treatment of Refinery Industry Wastewater by Activated Sludge, Sludge Age (Q ) = 6 days, (All concentrations are in
' mg7L) ...••••...••••••........•...•...•.•..••• 104
Table 7.2.3 Biological Treatment of Refinery Industry Wastewater by Activated Sludge, Sludge Age (9) = 9 days, (All concentrations are in mg7L)....................................... 105
Table 7.2.4 Biological Treatment of Refinery Industry Wastewater by Activated Sludge. Sludge Age (9 ) =12 days, (All concentrations are in mg7L)....................................... 106
Table 7.2.5 Activated Sludge Performance in Experiment 1 Sludge Age (Qc) = 3 days .........•...•.... 108
Table 7.2.6 Activated Sludge Performance in Experiment 1 Sludge Age (Qc) = 6 days ..•••.•.••.•....•. 108
Table 7.2.7 Activated Sludge Performance in Experiment 1 Sludge Age (Be)= 9 days ..••.•...•••...... 109
Table 7.2.8 Activated Sludge Performance in Experiment 1 Sludge Age (Qc) = 12 days ..•.•............ 109
Table 7. 2. 9 Priority Pollutants Rem ova 1 by Activated Sludge, Sludge Age (Be) = 3 days .. .......... 114
Table 7. 2. 1 0 Priority Pollutants Remov a 1 by Activated Sludge, Sludge age (Sc) = 6 days ............ 115
Table 7.2.11 Priority Pollutants Remov a 1 by Activated Sludge, Sludge Age ( 8 c) = 9 days ............ 116
xii i

Table 7.2. 12
Table 7.2.13
Table 7.2. 14
Table 7.2.15
Table 7.2.16
Table 7.3.1
\
Table 7.3.2
Table 7.3.3
Table 7.3.4
Table 7.3.5
Table 7.3.6
Table 7.3.7
Table 7.3.8
Priority Pollutants Removal by Activated Sludge, Sludge Age (Sc) = 12 days .......... .
Volatile Organics Removal by Activated Sludge Treatment, Sludge Age (Sc)= 3 days ....................................... .
Volatile Organics Removal by Activated Sludge Treatment, Sludge Age (Sc) = 6 days ..
Volatile Organics Removal by Activated Sludge Treatment, Sludge Age (Sc)= 9 days ..
Volatile Organics Removal by Activated Sludge Treatment, Sludge Age (Sc)= 12 days.
Activated Sludge and PAC Performances in Experiment 2 when 0 = 3 days and PAC = 10 mg/L, All Concentralions are in mg/L ....... .
Activated Sludge and PAC Performances in Experiment 2 when S = 6 days and PAC = 10 mg/L, All Concentralions are in mg/L ....... .
Activated Sludge and PAC Performances in Experiment 2 when 8 = 9 days and PAC = 10 mg/L, All Concentrations are in mg/L ....... .
Activated Sludge and PAC Performances in Experiment 2 when 8 = 12 days and PAC = 10 mg/L, All Concentrations are in mg/L ....... .
Activated Sludge and PAC Performances in Experiment 2 when 8 = 3 days and PAC = 50 mg/L, All Concentralions are in mg/L ....... .
Activated Sludge and PAC Performances in Experiment 2 when Be = 6 days and
PAC= 50 mg/L, all Concentrations are in mg IL ....................................... .
Activated Sludge and PAC Performances in Experiment 2 when G = 9 days and PAC = 50 mg/L, All Concentrations are in mg/L ....... .
Activated Sludge and PAC Performances in Experiment 2 when Q = 12 days and PAC = 50 mg/L, All Concentrations are in mg/L ....... .
xiv
117
118
119
120
121
124
125
126
127
128
129
130
131

Table 7 • 3 • 9 Activated Sludge and PAC Performances in Experiment 2 when a = 3 days and PAC = 1 20 mg/L, A 1 1 Concentra~ions are in mg/L ........ 132
Tab 1 e 7.3.10 Activated Sludge and PAC Performances in Experiment 2 when a = 6 days and PAC = 120 mg/L, A 11 Concentra~ions are i n mg/ L. ....... 133
Table 7. 3. 11 Activated Sludge and PAC Performances in Experiment 2 when e = 9 days and PAC = 120 mg/L, A 11 Concentrations are in mg IL •••••••• 134
Table 7.3.12 Activated Sludge and PAC Performances in Experiment 2 when Q = 1 2 days and PAC = 120 mg/L, A 11 Concentrations are in mg/L ........ 135
Table 7. 3 .13 BOD5 , COD, and TOC Rem ova 1 s in Experiment 2 when Be = 3 days and PAC = 1 0 mg I L . ......... 137
' Table 7.3.14 BOD 5 , COD and TOC Removals in Experiment 2 when Qc = 6 days and PAC = 1 0 mg IL •••••••••• 137
Table 7. 3. 15 BOD 5 , COD and TOC Removals in Experiment 2 when Qc = 9 days and PAC = 1 0 mg IL •••••••••• 138
Table 7.3.16 BOD 5 , COD and TOC Removals in Experiment 2 when Sc = 1 2 days and PAC = 1 0 mg I L ••••••••• 138
Table 7.3.17 BOD 5 , COD and TOC Removals in Experiment 2 when Qc = 3 days and PAC = 50 mg IL •••••••••• 139
Table 7. 3. 18 BOD 5 , COD and TOC Removals in Experiment 2 when Qc = 6 days and PAC = 50 mg IL •••••••••• 139
Table 7.3.19 BOD 5 , COD and TOC Removals in Experiment 2 when ec = 9 days and PAC = 50 mg IL •••••••••• 140
Table 7. 3. 20 BOD 5 , COD and TOC Removals in Experiment 2 when Qc = 1 2 days and PAC = 50 mg/L ......... 140
Table 7.3.21 BOD5 , COD and TOC Removals in Experiment 2 when Qc = 3 days and PAC = 120 mg/L ......... 141
Table 7.3.22 BOD 5 , COD and TOC Removals i n Experiment 2 when Qc = 6 days and PAC = 120 mg/L ......... 141
Table 7. 3. 23 BOD 5 , COD and TOC Removals in Experiment 2 when Qc = 9 days and PAC = 120 mg IL ••••••••• 142
Table 7.3.24 BOD 5 , COD and TOC Removals i n Experiment 2 when Qc = 1 2 days and PAC = 120 mg/L ........ 142
xv

Table 7.3.25 Priority Pollutants Removal, Experiment 2 when Be = 3 days and PAC = 10 mg IL .•....•..• 156
Tab 1 e 7. 3. 26 Priority Pollutants Removal, Experiment 2 when '6c = 6 days and PAC = 10 mg IL .•........ 156
Table 7. 3. 27 Priority Pollutants Removal, Ex per imen t 2 when Be = 9 days and PAC = 10 mg IL ••........ 157
Table 7. 3. 28 Priority Pollutants Removal, Experiment 2 when Be = 1 2 days and PAC = 10 mg/ L ......•.. 157
Table 7.3.29 Priority Pollutants Removal, Experiment 2 when Be = 3 days and PAC = 50 mg IL ....•..... 15 8
Table 7.3.30 Priority Pollutants Removal, Experiment 2 when Be = 6 days and PAC = 50 mg IL .....•.... 158
\
Table 7 . 3 • 3 1 Priority Pollutants Removal, Experiment 2 when Be = 9 days and PAC = 50 mg IL .....•••.. 159
Table 7.3.32 Priority Pollutants Removal, Experiment 2 when Be = 1 2 days and PAC = 50 mg/ L ......... 159
Table 7.3.33 Priority Pollutants Removal, Experiment 2 when Sc = 3 days and PAC = 120 mg/ L ......... 160
Tab 1 e 7.3.34 Priority Pollutants Removal, Experiment 2 when Be = 6 days and PAC = 120 mg/ L .•....... 160
Table 7.3.35 Priority Pollutants Removal, Experiment 2 when QC = 9 days and PAC = 120 mg IL . ........ 161
Table 7.3.36 Priority Pollutants Removal, Ex per imen t 2 when Oc = 1 2 days and PAC = 1 20 mg/L ........ 161
Table 7. 3. 37 Volatile Organics Removal, Experiment 2 when QC = 3 days, PAC = 10 mg IL •••••••••••••••••• 163
Table 7. 3. 38 Volatile Organics Removal, Experiment 2 when Sc = 6 days, PAC = 10 mg IL ..•...•.......•... 164
Table 7. 3. 39 Volatile Organics Removal, Experiment 2 when Be = 9 days, PAC = 10 mg IL . .......... · · · · · · · 165
Table 7. 3. 40 Volatile Organics Removal, Experiment 2 when Be = 1 2 days, PAC = 1 0 mg IL ................. 166
Table 7.3.41 Volatile Organics Removal, Experiment 2 when Sc = 3 days, PAC = 50 mg IL . ................. 167
xvi

Table 7.3.42 Volatile Organics Removal, Experiment 2 when Be= 6 days, PAC= 50 mg/L .................. 168
Table 7.3.43 Volatile Organics Removal, Experiment 2 when Qc = 9 days, PAC= 50 mg/L .................. 169
Table 7.3.44 Volatile Organics Removal, Experiment 2 when Qc = 12 days, PAC= 50 mg/L ................. 170
Table 7.3.45 Volatile Organics Removal, Experiment 2 when Qc = 3 days, PAC= 120 mg/L ................. 171
Table 7.3.46 Volatile Organics Removal, Experiment 2 when Qc = 6 days, PAC= 120 mg/L ................. 172
Table 7.3.47 Volatile Organics Removal, Experiment 2 when Be = 9 days, PAC= 120 mg/L ................. 173
Table 7.3"48 Volatile Organics Removal Experiment 2 when Qc = 12 days, PAC= 120 mg/L ............... 174
Table 7.5. 1 Percent Stripping of Volatile Compounds in Nonbiological system, Experiment 3, air flow rate = 300 ml/min/L......................... 195
Table 7.5.2 Percent Stripping of Volatile Compounds in Nonbiological system, Experiment 3, air flow rate = 400 ml/min/L......................... 196
Table 7.5.3 Percent Stripping of Volatile Compounds in Nonbiological System, Experiment 3, air flow rate = 500 ml/min/L......................... 197
Table 7.6.1 COD and TOC Removal Efficiencies in Experiment 4, When PAC= 10 mg/L ............ 199
Table 7.6.2 COD and TOC Removal Efficiencies in Experiment 4, When PAC= 50 mg/L ............ 199
Table 7.6.3 COD and TOC Removal Efficiencies in
Tab 1 e 7 . 6 . 4
Table 7.6.5
Experiment 4, When PAC= 120 mg/L ........... 199
Priority Organic Pollutants• Removal Efficiencies in Experiment 4, when PAC = 10 mg/L........................................ 203
Priority Organic Pollutants• Removal Efficiencies in Experiment 4, when PAC = 50 mg/L........................................ 203
xvii

Table 7.6.6
Table 7.6.7
Table 7.6.8
Table 7. 6. 9
'
Priority Organic Pollutants' Removal Efficiencies in Experiment 4, when PAC = 120 mg/L........................................ 204
Volatile Compounds Removal Efficiencies in Experiment 4, when PAC = l 0 mg IL •..•.••••.•• 204
Volatile Compounds Removal Efficiencies i n Experiment 4, when PAC = 50 mg IL ••••••••••.. 209
Volatile Compounds Removal Efficiencies i n Experiment 4, when PAC = 120 mg IL ..••..•.... 209
xvi ii

GLOSSARY
AAS Atomic adsorption spectrophotometry
AS Activated Sludge
API American Petroleum Institute
soo 5 Biochemical oxygen demand, mg/L
C Equilibrium carbon concentration, mg/L
CI Influent carbon concentration, mg/L
COD Chemical oxygen demand, mg/L
o Oa\ly carbon dosage, mg/L
DOC Dissolved organic carbon, mg/L
Efft Effluent, concentration, ug/L
Effy Efficiency of the system
EPA U.S. Environmental Protection Agency
EPC Kuwait Environmental Protection Council
EPC Environmental Protection Center
GC Gas Chromatography
GPM Gallon per minute, GPM
HOT Hydraulic detention time, hours
HRT Hydraulic retention time, hours
Inft Influent, concentration, ug/L
k Maximum rate of substrate utilization, day-1
kd Endogenous decay coeffic i ent, day-1
Ks Half velocity constant, mg/L of B005 or COD
KNPC Kuwait National Petroleum Company
MGO Million gallons per day, MGD
xix

MLSS
MLVSS
N
PAC
pH
PIC
Q
s
Se
Sa
SAA
SEM
SIA
SRT
Mixed liquor suspended solids, mg/L
Mixed liquor volatile suspended solids, mg/L
Number of reactors
Powdered activated carbon
Reciprocal of the Logarithm of the Hydrogen Ion Concentration
Petroleum Industrial Companies
Flow rate, L/hr
Effluent flow rate, L/hr
Influent flow rate, L/hr
' Return flow rate, L/hr
Under flow rate, L/hr
Sludge wasting flow rate, L/hr
Net growth rate of biomass, mg/L
Rate of bacterial growth, mg/L day
Substrate utilization rate, mg/L
Substrate concentration, mg/L
Effluent substrate concentration, mg/L
Influent substrate concentration, mg/L
Shuaiba Area Authority
Scanning Electron Microscopy
Sh u a i b a Ind us tr i al Are a
Sludge retention time, days
Return cell concentration, mg/L
Underflow substrate concentration, mg/L
Suspended solids concentration, mg/L
xx

t
TDS
TKN
TOC
TSS /
u
u
u
v
vss
w
x
Number of days
Total dissolved solids, mg/L
Total Kjeldahl nitrogen
Total organic carbon, mg/L
Total suspended solids, mg/L
Net specific growth rate, day-1
Specific growth rate, day-1
Specific substrate utilization rate, gm/gm-day
Maximum specific growth rate, day-1
Volume, L
' Volatile suspended solids, mg/L
Weight of carbon, mg
Concentration of cells, mg/L
Biomass concentration in the effluent, mg/L
Biomass concentration in the influent, mg/L
Return cell concentration, mg/L
Biomass concentration in the underflow, mg/L
Wasting cell concentration, mg/L
Maximum growth yield, mg VSS/mg-BOD 5 or COD
Sludge age, days
Hydraulic retention time, hours
xxi

1. INTRODUCTION
The Shuaiba Industrial Area (SIA) is Kuwait's first
and largest industrial complex and one of the largest
industrial areas in the Arabian Gulf. It produces about 6
MGD of refinery industry wastewater which is discharged
directly to the Arabian Gulf without extensive treatment.
' 1.1 Shuaiba Industrial Area Site Description
Shuaiba Industrial Area (SIA) is located about 50 km
south of Kuwait City, Kuwait as shown in Figure 1.1. The
total area of SIA (both its Eastern and Western Sectors)
is about 22.98 million sq. meters. This study focuses
1.2 presents the only on the Eastern Sector. Figure
Shuabia Industrial Area. The Eastern sector of the SIA
has twelve major industries, including a petrochemical
company, two refineries, two desalination power pl ants, a
melamine company, an industrial gas corporation, a paper
products company, two steam electricity generating
stations in addition to several other industries. The key
to Figure 1.2, which represents the industry locations, is
pr es ented in Table 1.1.
'
,
N
+
,/ /
I I
I
I I
I I
. --------
' I
I
I I
I I
I I
I
, r ' ' I
I I
I
' I I
-----------
,,,, ... ------------... --
KUWAIT
------ ... , \ \
\ \
\ \ I
' I I
I I \
' ' \ ..... _ ... ------
Figure 1.1 Location of the Shuaiba Industrial Area with Respect to Kuwait City and Arabian Gulf
2

\
... - H i Ahmadi Oil ..ic KOC Outlet t
Refiperh- - N .. -
Arabian Gulf
Expressway
S.A.A. Buildings ~
Industries IIID M. E. W .•
Figure 1.2 Shuaiba Industrial Area
3

Table 1.1 Key to Shuaiba Industrial Area
Key No. Description
EASTERN SECTION
1 - S.A.A. Buildings 2 - Barge Harbour 3 - Cooling Water Intakes and Pumping Station A,B,C 4 - Environment Protection Center 5 - Shuaiba Harbour Expansion Project 6 - Minis\ry of Electricity and Water 7 - Shuaiba North Power and Water Production Station 8 - Shuaiba South Power and Water Production Station 9 - K.N.P.C. (Shuaiba Refinery) 10- K.N.P.C. (Lube Oil Blending Plant) 11- P.I.C. (Fertilizer Division, Plant A) 12- P.I.C. (Fertilizer Division, Plant B) 13- Kuwait Cement Company 14- Shuaiba Paper Products Company S.A.K. 15- Packaging and Plastic Industries Company. 16- Dresser (Kuwait) S.A.K. 17- KREMENCO 18- Kuwait Petrochemical Products Co.
(Sulphur Factory) 19- United Fisheries of Kuwait Co. Corporation 20- Kuwait Industrial Gases Corporation 21- Refrigeration and Oxygen Co. Ltd. 22- Kuwait Melamine Industries Company 23- Proposed Site of Aromatics Project Plant 24- Proposed Site of Olefins Project Plant 25- Salt & Chlorine Division 26- Shuaiba Post Office 27- Industrial Medical Centre
4

Table 1.1 (continued) Key to Shuaiba Industrial Area
Key No. Description
28-29-30-31 -32-33-34-35-36-3 7 -38-39-40 -41-42-43-44-45-46-47-
WESTERN SECTION
The Gulf Paper Manufacturing Co. N. I. C. ( Sand Quarry) N.I.C. Lime Products Factory Kuwait Insulating Material Manufacturing Co. Kuwait Asbestos & Plastic Industries (N.I.C) Sanitary Ware Company Kuwait Precast System Co. Real Estate Con. and Fabrication Co. Kirby Building Systems, Kuwait. Al-Rabiah International Contracting Co. Kuwait Gypsum Manufacturing & Trading Co. Kuwait Blanket Manufacturing Co. Kuwait Chemical Manufacturing Company Gulf Glass Manufacturing Co. National Automotive Manufacturing & Trading Co. The Kuwait-Italian Steel Structures Co. Kuwait Lube Oil Co. The Kuwait Desalination Plants Fabrication Co. Kuwait Oil Tanker Company Kuwait Silicone Products Company
5

1.1.1 Existing Water Quality
Most of the industries in SIA are located near the
shore of the Arabian Gulf, and discharge their wastewater
directly into the Gulf after partial treatment or without
any treatment. The pollutants remain in the water and
because the seawater intakes of the two desalination
plants (7A and 8A in Figure 1.2) are close to the outlet
of these industries (B, C, D, and E in Figure 1.2), the
' pollutants may enter the water intakes of the desalination
plants.
The inshore water of SIA is very shallow. The water
depth offshore of SIA averages about 5 meters within 1 km
from the coast line. Thus, most discharged pollutants are
not well mixed or diluted with sea water (58).
The discharged industrial wastewaters in the SIA
inshore water are diluted with seawater from the cooling
water from the pumping stations. The concentration of
pollutants in the wastewater will be affected by mixing
with seawater in that the concentrations are reduced but
the mass loading of the organic pollutants will not be
reduced.
The main pollutants discharged by the existing
industries in the SIA include the following: a high
concentration of ammonia, heavy metals such as chromium,
highly-colored wastes; large amounts o f oil and grease;
6

urea, hydrogen sulfate; high temperature; and toxic
organic chemicals. The measured and calculated values of
the main pollutants are summarized in Table 1.1.1.
1.1.2 Present Wastewater Treatment
Presently, each plant in the SIA has its own on-site
treatment plant. The industrial wastewater treatment in
the PIC consists of 1) a hydrolyzer to purify the high
ammonia and urea, 2) neutralizing pits for neutralizing
' and mixing operations, and 3) oil skimmer units. The
hydrolyzer treats the wastewater efficiently, except
during a plant shutdown when the raw wastewater is
diverted to the neutralizing pit, to the forest, or as
overflow to the sea. The chemical and surface drain
waters are diluted with the seawater used in cooling and
then mixed with refinery industry wastewater. This
mixture then goes directly to the Gulf. The main
contaminants are oil, NH 3 , COO and urea.
At the KNPC refinery, the wastewater is collected in
different drainage basins. The ammonia wastewater drain
collects the wastewater contaminated with high ammonia and
diverts it to the ammonical water treatment process. The
sour water (with a high concentration of hydrogen sulfate)
is collected and routed to the sour stripping unit, where
the pre-treated water goes to the oil separator known as
7

Table 1.1.1 Iroustrial Wilstewlter Flew; ard R:>llution L.oa1s in tile SIA. (~ll"Ce: ~f. tti. 58).
~a Mlet ~iete f!Nf!!NIJe Rl 11 ut i Oil L.oajl' R:>int Irdustry ( /h) (kg/d)
l'9< fJN CID TSS TI<N lTea tt14N Oi 1 ¥ Cr T~ ~
D 00 31 15 100 1500 lllXl 50 700 3 0 0.4 32 9.4
B PIC (~ Srface CTain) 70 50 :m - (!I>) 10 70 4 0 0.6 29 8.8
E PIC (Chmical crain B) 70 70 500 - (400) <J) :m 31 0 0.2 8) 8.8
E PIC ( ltlrtll 9.rface
' CTain B) 70 20 700 - (400) 28) <1) 0 0 0.1 25 8.5
E PICA Srface CTain <J) 25 llXl - (100) <1) 50 210 0 tr <1) 6.5
E l<1« (API) - 150 111Xl ( 1!1)) (D>) 0 200 4!I) 8) 1.6 55 10.0
c KOC (LFG ~) 20
c KOC (LFG ~) Oily water 8) 50 l<m - 0 0 7 0 tr <1) 7.5
G KOC & LFG ltlrtll (Chmical crain) 10 5 50 - 0 0 3 0.1 0 33 7.6
H KOC + LFG ltlrtll Zore (Oily water Effl1.e1t) 50 21 600 - (al) 0 al 30 2 tr 39 8.2
F PIC (Neutral izirg Pit Effl1.e1t) !I) 50 400 0 3700 3:m 400 35 0 tr li6 8.8
*ASsumrg IM)(111J11 irah.cbon ( ) Est'mated value
tr " trace
8

the API. The surface drain effluent is also routed in the
API. The overflow of this pit is diluted with cooling sea
water and then routed to the Gulf. The main contaminants
of this effluent are high COO, NH 3 , H2s, oil and organic
compounds.
However, the effluent of the National Refinery at
Mina Abdullah has no affect on the Arabian Gulf water
quality, because this wastewater is routed into lagoons
located in the desert. There is no data on the lagoon
water qua,ity.
Industrial wastewater from Kuwait Oil Refinery is
collected in settling tanks, the effluent is diluted with
cooling seawater and then routed to the sea. Effluent
from the chemical sump is treated similarly. The main
pollutants here are oil, organics, COO and heavy metals.
The Mel amine industry's wastewater consists of cooling
tower effluent and boiler blowdown discharge into the
drainage system. The main pollutants are NH 3 , TKN and
TS S.
With the present high concentrations of contaminants
in the effluents and the high rate of wastewater produced
and discharged into the Gulf, it appears without a doubt
that the present treatment is not efficient nor is it
s u ff i c i en t to meet th e rec om mend e d st and a rd s s e t by th e
SIA authority as shown in Table 1.1.2. Laboratory
analyses have indicated that the wastewater carried high
9

Tcble 1.1.2 l'ecannerde:l Arbient 19-ine Envirament ()Jality 0-it.eria fer Inshcre waters Arourt! 9luaiba, (S>tree: lef. ~. 58).
[)!sircble Maxtrun/Mini-Enviramental l1lJ11 nresro 1 d Value Hilzard Value
Par areter
RI 8.0 5.5 to 9.0 Di ssolve:l ll<ygen 5.4 RJTI 2.0 RJTI coo 2.0 RJTI 4.0 RJTI
~l H)<lrtr 2.0 RJTI 4.0 RJTI ~t deb!ctcble 0.5 RJTI (as in
Cartai ..et.er bu 1 k) Rlenol ics O.C!i RJTI 0.10 RJTI D!t.ergents O.C!i ~ 0.20 RJTI (as in
Typical r.orcentratiai fer ~51.re:l Effluents
RJTI
3.67 21.0.00
SJl li\ides (~S) O.OC!i ~ 0.01 sulli\ide iai) Anbiacal tro- 0.02 ~ 0.20 to 0.50 RJTI
!J!fl (~/~.i) (as ammiun iai) 3.~ ()( idi se:I Ni tn:gen 0.'1> RJTI O.!ll RJTI Total Ni b"cgen 0.50 ~ 1.ll RJTI Iragaiics 0.001 RJTI 0.02 RJTI
Rlos!ilates Cyaiide ~t deb!ctcb 1 e 0.01 RJTI Alkyl 0.0001 RJTI fit!rcll"y Total 0. CIXll RJTI fit!rcll"y Arsenic 0.01 RJTI O.C!i RJTI catniun 0.001 to 0.01 RJTI 0.03 RJTI L.eCKi 0.01 RJTI O.C!i RJTI 0.025 Chraniun O.C!i ~ 0.10 RJTI 1.20 ~ 0.001 to 0.01 RJTI O.C!i RJTI O.C!i2 Zinc 0.001 to 0.10 ~ 0.10 RJTI Irai O.C!i RJTI O.ll RJTI 1.25 '9-gin!se 0.02 ~ 0.10 RJTI Nickel 0.002 ~ 0.10 RJTI 0.02 C.Olifam 100 14WH.. 2!XXI 14WH.. Bacteria
~ = rrost p-d>cble rurt>er
10

levels of ammonia, oil, H2S, urea, organic compounds,
inorganic compounds and suspended solids. Presently these
pollutants can have adverse effects on marine life. Some
of these pollutants are carried into the desalination
power plants due to the close proximity of the power plant
intakes to the industry outlets. Treating high levels of
pollutants with seawater dilution is not a solution to the
pro bl em. There are now pl ans to improve the present
situation and lower pollutant loads by improving the
' pr i mar y tr ea tm en t pl an ts , b u t s i n c e th e w a stew a t er fl ow s
will also increase, the net improvement in water quality
will not be significant. Therefore, this study was
initiated to investigate methods of treating priority
pollutants found in SIA refinery industry wastewater using
a powdered activated carbon with activated sludge as a
second a r y treatm en t.
1.2 Objectives
1. To investigate the application of activated
sludge (AS) with powdered activated carbon (PAC) additions
to treat a refinery industry wastewater by bio-removal of
both conventional and priority pollutants.
2. To determine the biological kinetic constants in
terms of Boo5 , COD and TOC for the activated sludge and for
the activated sludge with addition of PAC at different
carbon dosages.
11

2. LITERATURE REVIEW
2.1 Activated Sludge Treatment Processes
Extensive studies on activated sludge (AS) treatment
of refinery industry wastewater have demonstrated that
organic pollutants could be removed by converting most
organic pollutants to more stable inorganic forms such as
co 2 and ~O or to cellular masses.
Stover et al. (64) investigated the fate and the
treatability of specific organic compounds such as
benzene, phenol, 1,2-dichloroethane, 1,2-dichloropropane
and tetrachloroethane found in a complex industrial
wastewater. An activated sludge reactor was used to treat
a synthetic wastewater containing specific organic
c om po u n d s i n d i v id u al l y or i n v a r i o us comb i n at i on s . They
found that the removal efficiencies were high for all
compounds investigated. Compounds such as l ,2-
dichloroethane, 1,2-dichloropropane, and tetrachloroethane
were stripped from the biological reactor.
However, Kincannon et al. (39) have shown that in
addition to those compounds, benzene, methylchloride and
1,2-dichlorobenzene were completely stripped under
identical conditions without a biological treatment.
12

Tr av e r s e t a l . ( 6 9 ) i n v e s t i g a t e d a c om p l e t e l y m i x e d
activated sludge reactor fed with an industrial wastewater
containing a high concentration of fat and specifically to
study its performance at different concentrations of
dissolved oxygen (DO). They concluded that the fat
present in the influent of wastewater will be degraded
rapidly at higher DO concentrations (up to 4.0 mg/L) and
the s l u d g e con ta i n e d few f i l amen to us mi c r o organ i sm s and
low fat content and settled readily.
Shau~ et al. (56) studied the removal of azo dyes
fr om w a stew a t er s u s i n g an a c t i v ate d s l u d g e pr o c e s s . Th e y
showed that dyes in wastewater could be removed both by
adsorption onto biological sludge solids and by biological
degradation.
However, Reitano (54) reported that activated sludge
removed about 40-80% of the COD where COD in the feed was
in the range of 500 to 50 mg/L and that microorganisms
could grow in concentrations of phenol of up to 200 mg/L.
Gallagher et al. (26) discussed an activated sludge
pilot plant for treating a pretreated gasification
condensate containing high COD, phenols, and ammonia. The
treated wastewater could be used as cooling tower makeup.
They showed that an activated sludge pilot pl ant process
with a higher sludge retention time (SRT) (20 to 30 days)
was more stable and produced the highest quality effluent.
In addition, there was a reduction in biodegradable
13

organics in the range of 99% to 100%. To obtain removal
of thiocyanate, cyanide and ammonia in the wastewater
required a long SRT (>20 days) combined with an increase
in the hydraulic retention time to 3 days.
Lovett et al. (44) have shown that an industrial
wastewater with high phosphorus could be effectively
treated by an activated sludge process using sludge ages
from 5 - 20 days. The effluent produced was low in
phosphorus and total Kjeldahl '
nitrogen (TKN). They
suggest further that feeding wastewater reactors
continuously produced high effluent COD removal (>98%).
2.2 Addition of Powdered Activated Carbon To Improve Activated Sludge Treatment
For many years PAC was little used in chemical plants
to remove suspended sol ids, organic compounds, col or and
odors because there was insufficient information about
carbon design units and operating conditions. Also, there
was no wel 1-defined method to regenerate the carbon for
reuse. Presently, new design methods and different ways
of applying carbon have resulted in an increased use of
carbon materials in wastewater and chemical plants (6, 50,
71, 75).
W h e n a c t i v a t e d c a r b o n c om e s i n c o n t a c t w i t h o r g an i c
materials in wastewater, it removes compounds selectively
by a comb i n at i on of ad so r pt i on of 1 es s po 1 a r mo 1 e cu 1 es ,
straining of the larger suspended particles and deposition
14

of colloidal material on the exterior surface of the
activated carbon . Removal of soluble organic compounds
depends on diffusion of the dissolved particles onto the
carbon surfaces. For colloidal particles, internal
diffusion is important. Ad so r pt i on , i n g en er a 1 , i s a
result of forces of attraction at the surface of a
particle that cause soluble organic materials to be
attracted and held on the surface. The activated carbon
has a large surface area per unit weight, which makes it
an effici~nt adsorptive material. In a wastewater plant,
activated carbon is used as a tertiary process following a
conventional secondary treatment unit. The efficiency of
carbon adsorption in wastewater plants will depend first
of all on the quality and quantity of the waste to be
treated (13, 52).
Activated carbon can be classified into two groups:
powdered and granular. Powdered activated carbon is
produced by activating pieces of wood, charcoal, coconut
shells and peats.
PAC has several advantages over granular carbon:
1. Lower capital costs. PAC requires less valves, piping, or columns.
2. Greater ability than GAC to control hydrogen sulfide gas.
3. Minimal pretreatment cost.
Activated carbon has been shown to remove chemical
compounds present in waters and wastewaters which exhibit
15

toxic, carcinogenic, mutagenic or teratogenic properties.
Previous studies have shown that addition of PAC to
an activated sludge system not only improved the system's
removal of organic pollutants, but increased the
efficiency of the AS processes (17, 37). The studies have
also shown that in addition PAC will:
1. improve BOD and COD removals despite high organic loading,
2. adsorb toxic materials present in the waste without biological treatment,
3. ~educe color, foam and detergents from reactor and clarifier effluents,
4. improve solids settling in reactors as well as in clarifier effluents,
5. perform better over a wide range of organic and hydraulic 1 oads,
6. improve plant operation efficiencies and save on capital investments because no additional equipment is needed, and,
7. reduce phosphorus concentrations.
During the aerobic oxidation, PAC adsorbs the organic
pollutants dissolved in the waste stream. The adsorbed
pollutants are degraded when they come in contact with
biological organisms as follows:
Organic Pollutant+ Bacteria+ o2 ~co2 + H2o + cells.
It has been proven that some organic pollutants
present in a receiving water are potentially dangerous to
human and animal life. It is very important to gather
16

information and data on the biodegradability and chemical
physical treatabil ity of these organic pollutants.
Traditional treatment processes cannot meet the
requirements for removal of all of the 129 organic
c om po u n d s ( s e e A p p e n d i x 1 ) , b u t ad d i t i o n s o f PA C t o t h e A S
reactor were found to reduce influent 1 evel s of BOD, COD,
TOC and several priority organics such as benzene,
ethylbenzene and toluene.
Weber, (79) reported that there is little information
on the treatability of all of the priority pollutants
present in the highly complex mixtures of organic
compounds in refinery industry wastewater.
Adam (1) showed that additions of powdered carbon to
a conventional activated sludge treatment system with an
average BOD of 1,700 mg/L and a COD of 3,200 mg/L
increased COD removal by 25% and BOD removal by 20% during
a two-month study. Another test that Adams conducted was
at a municipal plant receiving about 70% of its industrial
flow from a textile dyeing and finishing mill. A primary
clarification tank effluent and a trickling filter
effluent were directed to a contact stabilization basin.
The BOD of the influent varied between 90 and 350 ug/L.
Powdered activated carbon was added at a dose of 20 to 25
ug/L based on the influent flow rate. After five months
of operation, BOD removals increased from about 70 % to
90%, and the solids settling improved.
17

De John et al. (15) have evaluated PAC (Hydrodarco)
added to AS systems to treat four refinery wastewaters.
They reported for the first experiment that BOO reduction
was 82% and BOD removal reached about 90-95% when the
carbon concentration reached 1,800-2,000 mg/L within the
AS reactor. For their second experiment, they used a 12
MGD flow with TOC concentrations in the range of 100-1,000
mg/ L. Carbon added at a dose of 100 mg/L produced a 20%
reduction in the roe in the wastewater; however, when the
' carbon dosage was increased to 500 mg/L the effluent BOD
reached to 30 mg/L. Their third experiment was conducted
at a 2.5 MGD plant treating a 550 mg/L COD refinery
wastewater in a two-stage conventional activated sludge
system. Carbon was added at the rate of 200 mg/L over a
six-week period. Effluent sol ids and COD removal
increased to 40% and BOD removal increased by as much as
90%. Their fourth experiment was conducted at a 2 MGD
plant treating refinery wastewater with a wide range of pH
fluctuations. A PAC level of 400 mg/L was added and
maintained daily. They reported that there was
improvement in the BOO, COO, and SS removals, which
reached the 90-95% range and the plant was able to meet
the 30 mg/L BOD e f fluent standard.
Leipzig et al. (43) investigated treatment of the
Salsbury (South Africa) Industry wastewater in five bench
scal e laboratory experiments, including (1) AS, (2) a
18

carbon adsorption column, (3) PAC, (4) macroreticular
resin adsorption and (5) solvent extraction. After a
five-month study, they determined that when PAC was added
to an activated sludge reactor with a HRT of 2 or 3 days,
there was no difference in the performance. A daily
carbon dosage of 167 mg/L added to a 2-day HRT reactor
with a mixed liquor activated carbon concentration of 5000
mg/L not only allowed nitrification to occur but provided
an increase in TOC and color removal were 80% and 60%,
' respectively.
Ferguson et al. (21) tested the addition of carbon to
two activated sludge studies of batch and continuous-flow
processes. A COD supplement was added to increase the COD
concentration in the influent to about 200 mg/L.
Hydrodarco H powdered activated carbon was used. From the
batch study, they concluded that even when PAC in the
reactor carbon was at a concentration of 90 mg/L there was
poor removal of trichlorophenol. For their continuous
study they found that a carbon dosage of 50 to 100 mg/L
gave better performance than a unit that was receiving 95
mg/L of trichlorophenol with PAC of 150 mg/L. The sludge
retention time had an effect on effluent quality. SRT
values between 7 and 12 days were found to yield the
highest effluent quality and increased trichlorophenol
removal with a PAC dosage of 50 mg/L; at a carbon dosage
of 150 mg/L, trichlorophenol was complete ly removed.
19

Chao et al. (8) developed three completely mixed,
continuous flow, activated sludge reactors. The
wastewater feed consisted of 75% coke-plant wastewater and
25% sanitary wastewater. Five PAC doses (200, 300, 500,
700 and 1,000 mg/L) were investigated with two HRT's.
PAC added at a dose of 300 mg/L combined with shorter
HRT's increased COO removals. They reported that addition
of PAC at a dose of 300 mg/L not only improved cyanide
removal but also reduced the sensitivity to fluctuations
' in the feed. They also pointed out that neither cyanide
nor thiocyanate in the wastewater was adsorbable on the
PAC.
OeWalle et al. (16) found that PAC dosages of 0, 50,
300, and 1,000 mg/L to a plug-flow activated sludge unit
and to units maintained at sludge ages of 3,5,10 and 15
days would increase the percentage removal of organic
matter. They reported that COO removal tended to be
independent of sludge age.
Janeczek et al. (37) investigated the effect of PAC
additions to six AS processes at doses of 250, 500, 1 ,000,
2,500 and 5 ,000 mg/L for treating coal gasification
wastewater diluted to one-quarter strength, at which BOO,
COO and TOC were 2,000, 4,425 and 2,000 mg/L, respectively
and pH was between 7.8 and 7.9. The major organic
constituent was phenol. They reported that 97% of the COO
was removed by PAC and 52% of the COO was removed by a
20

biological unit. Also 98% of phenol was removed by
biological treatment but adding PAC increased its removal
to about 99.99%.
Heath (34) concluded that adding PAC to a 30 to 40
MGD DuPont plant with a complex chemical wastewater
removed over 96% of the BOD and over 80% of the DOC.
Heath added that the plant achieved a solids concentration
removal of about 40% in the clarifier. Organic removals
increased at a carbon dose of 120 ppm and higher sludge
' ages ( 2 0 to 60 days) . A 1 so 90 - 95 % of the volatile
organics and acid-extractable compounds were removed but
base/neutral com pounds were not removed. He a 1 so showed
that PAC could be regenerated successfully in a multiple
heath regeneration furnace.
Adams (2) studied the addition of powdered activated
carbon to a 1 MGD municipal plant treating about 70%
industrial wastewater from a textile dyeing and finishing
mill. The influent BOD ranged from 90 mg/L to 350 mg/L,
averaging 150 mg/L. The effluent sol ids and col or
averaged 26 mg/L and 248 APHA units respectively before
carbon was added. The HRT was about 2.2 hours. Ad ams
found that BOD removals were increased from 72 to 89% with
an increase in the carbon dose from 20 to 25 mg/L. Also,
adding PAC at an average rate of 19 mg/L increased solids
settling by 20%. An equilibrium carbon dosage of 500 mg/L
reduced the color from 670 to 320 APHA. Ad ams ind i cat ed
21

that PAC could be regenerated using a wet air oxidation
with reasonable losses of 6% to 30%.
Flynn et al. (22) examined three bench-scale
treatment units using industrial wastewater. Two units
operated as PAC units and the third one was a biological
unit. The PAC units were operated at different sludge
ages (8.5 and 9.2 days). Flynn et al. concluded that
effluent quality improved with a sludge age of 9.2 days
and/or increasing carbon dose to 150 mg/L. In addition, a
' high sludge age (9.2 days) and low carbon dose (124 mg/L)
produced an effluent similar to that from a unit operated
at a lower sludge age (8.5 days) and a higher carbon dose
(150 mg/L).
Flynn (23) tested a theoretical steady state model
which incorporated the additions of PAC to an activated
sludge process treating a wastewater containing heavy
metals, dissolved dyes and organic compounds. Three
separate tests were conducted with carbon dosages of 50,
150, and 650 mg/L at sludge ages of between 8.5 and 9
days. He concluded that BOD removal could be successfully
modeled using a conventional kinetic approach.
Osantowski (51) et al. conducted PAC/AS studies to
treat a raw pharmaceutical wastewater with a high COD, for
83 days. The HRT's and SRT's were 3 days and 10 days,
respectively. For the first test 208 and 827 mg/L of PAC
were added; in the second test, 496 and 1520 mg/L of PAC
22

were used. The tests showed that PAC additions improved
the removal of COD to about 90% but had no affect on the
soluble CBOD (S-CBOD) of the effluent.
Heath (35) reported that PAC was added to a 40 MGD
industrial wastewater treatment plant. The performance of
the PAC exceeded expectations for BOD and color removal
which were measured as 96% and 68% respectively. Removal
of DOC and toxic and hazardous substances were also high.
Also, operation at a sludge age of over 25 days reduced
' the required PAC dose from more than 170 mg/L to 120 mg/L.
Heath found that the PAC could be regenerated with an 80%
yield and a recovery of 63% of its virgin carbon
properties.
Heath (36) discussed a 40 MGD plant which used the
DuPont PACT process to treat an industrial wastewater from
a variety of sources, to produce an effluent with the
quality that could be achieved from secondary/tertiary
treatment processes. The PACT process has been able to
achieve a higher degree of treatment than could be
obtained with a conventional actived sludge system. The
influent had a soluble BOD of 280 mg/L, a DOC of 205 mg/L,
a TDS of 2000-5000 mg/L and a TSS of 258 mg/L. The PAC
process used only 150 mg/L of carbon at a 8-day sludge
age; it gave a BOD removal of over 95% and increased DOC
removal from 62% to 85%. Both color and foam
concentrations were reduced and sludge settling was
23

improved. Volatile organics such as benzene or chloroform
and toluene and acid extractabl es such as 2-chl orophenol
and phenol were removed, but base/neutral compounds (1,2
dichlorobenzene, and 2,6 dinitrotoluene) were removed with
less success. Also, some heavy metals were removed.
McKay et al. (47) investigated the adsorptive
capacity of PAC (Filtrasorb) for a number of pollutants
(phenol, chlorophenol, dodecylhydrogen sulphate salt,
me r c u r i c i o n s , a n d c h r om i c i o n s ) i n an a q u e o u s s o l u t i on •
The Langm~ir constants (mg/g) have been determined and
they were 213 for phenol, 434 for chl orophenol and 361 for
dodecylhydrogen sulphate, 138 for mercuric ions, and 35
for chromic ions. Tests showed that the carbon capacities
were particle size dependent and that differences in
adsorptive capacities were linked to the solute-adsorbent
bonding.
Garcia-Orozco et al. (27) investigated eight reaction
units operated for 4 weeks at sludge ages of between 4 and
12 days. Carbon was added at 70 mg/L to the first four
reactors and no carbon was added to the other four.
4,6 dinitro-0-Cresol (ONOC), a priority pollutant was
increased in concentration from O to 27 mg/L during the 4
weeks that the experiment was performed. TOC
concentrations of the influent changed from 650 to 27
mg/L. A second carbon dose of 175 mg/L was added after 4
weeks. The test results showed that the assumptions on
24

which the overall removal model was based were
satisfactory (operational parameter, carbon dosage and
sludge age) and they did represent the behavior of the
PAC/AS process. The biodegradation rate coefficient, Kb,
increased, but Y decreased, based on TOC concentrations.
carbon adsorption and biodegradation were the two
mechanisms responsible for the DNOC removal.
Stensel et al. (62) studied the removal of organics
fr om a re f i n er y w a s t e w a t er u s i n g an 8 O O - g a 1 1 on a er at i on
tank in a pilot plant with a liquid retention time of 14.3
' hours. The feed to the aeration tank was 1 gallon per
mi n u t e ( g pm) . They evaluated three processes for the
removal of organics: filtration-activated carbon,
biological treatment, and biological-filtration-activated
carbon treatment. The design parameters for PAC were bed
depth or contact time and organic loading. Stensel et al.
showed that to maintain effluent quality at a COD of about
37 mg/L the operating time should be increased. Also,
effluent from the biological treatment process had a
higher organic loading due to poor adsorption of organics,
but the activated carbon adsorption increased with
increasing molecular weight and decreased with decreasing
aqueous solubility and polarity.
Stenstrom et al. (63) investigated whether carbon
additions would produce high effluent quality. Three
experimental phases were conducted using five reactors.
Four reactors were operated at a sludge age of 20 days and
25

were fed with 100 mg of carbon per 1 iter of wastewater
feed. One reactor was left as a control. Tests showed
that improvement in the effluent quality of the carbon-fed
units over the non-carbon-fed unit ranged from 65% for
soluble organics to 95% for phenolics. A carbon
concentration of 200 mg/L yielded a high effluent quality.
Stenstrom et al. al so concluded that 1 ess carbon added at
a 60-day sludge age was the same as a high concentration
of carbon added at a 30-day sludge age.
' Flynn et al. (24) demonstrated that adding powdered
activated carbon (65% Nuchar SA and 35% Hydrodarco C) to a
40 MGD aerator tank seeded with an industrial activated
sludge yielded a 77% BOD removal. Increasing sludge age
and temperature reduced the effluent's dissolved organic
carbon (DOC) concentrations from 70 to 30 mg/L and reduced
the effluent's BOD from 30 to 8. 4 mg/L. Changing the
c a r b on d o s e fr om 1 9 O to 1 2 5 mg I L w o r s e n e d the q u a 1 i t y of
the plant effluent slightly; DOC went from 28.6 to 40.3
mg/Land BOD went from 9.6 to 18.8 mg/L. A low carbon
dose (80 mg/L) with a long sludge age (29 days) produced
an effluent quality equivalent to that of the PAC process
(157 mg/L carbon and 7.3 days sludge age). Therefore,
Flynn et al. concluded that a PAC process with a low
carbon dose and a long sludge age would produce a high
quality effluent.
Grabowski (27) described an agreement between a
26

municipal wastewater facility and Sun's Marcus Hook
Refinery Co. in Oelcora, PA, in which Oelcora would treat
Hook Refinery wastewater as a joint treatment. Oelcora
had a secondary treatment plant, consisting of an
activated sludge basin, a clarifier and a disinfection
unit (chlorination). Grabowski indicated that, utilizing
joint treatment, the Hook refinery would be able to
control the organic pollutants in their final effluent.
W a l 1 a~ e e t a 1 . ( 7 4 ) d i s c u s s e d a 5 O g pm pi l o t pl an t
using a solids-contact treatment, which operated for 24
hours per day to remove soluble organics from wastewater
by add i n g PAC. They concluded that treatment with a PAC
addition could remove more organic compounds than a
single-stage treatment could. In a carbon system, a
b i o l o g i c a 1 tr e a tm en t w a s r e s po n s i b 1 e for rem o v a 1 of more
than 5 O % of the sol u bl e organ i cs . Al so , i n a s y st em w i th
less organics, the inorganic coagulant pretreatment could
reduce the organic loading and in some cases eliminate the
need for carbon additions.
Specchia et al. (60) reported that adding Norit SA-5
PAC at a concentration of 0.2 to O.l gm/L to a 500-m/l
Warburg-type respirometer fed with wastewater from a
cotton and synthetic cloth dye-works helped to increase
the removal efficiency for COD from 55.8 to 75.6% and
increased BOD removals from 78 to 98.5% Also, the
nitri f ication - denitrification capacity of the sy s tem was
27

increased. Adding PAC reduced bacteria growth and
increased the biological removal rates. Data collected
from the experiment were used to calculate the biological
oxidation constants.
Kincannon et al. (39) conducted two experimental
studies on both non-biological and biological activated
sludge systems. They used a 3-1 iter activated sludge
reactor with a 3.23-liter settling clarifier. The
activated sludge system was operated at SRTs of 2,4 and 6
' days and an HRT of 8 hours. 1,2 - dichloropropane,
methylene chloride, benzene, ethylacetate, 1,2-
dichloroethane, phenol and 1,2-dichlorobenzene was added
to a synthetic wastewater. It was shown that all
compounds were stripped except phenol. Higher removal
efficiencies were achieved based on BOD and TOC.
Frohlich et al. (25) assessed the use of biophysical
treatment technology to treat effluents from both the
pharmaceutical and fine organic chemicals industries. The
BOD and TOC of the influent were about 7 ,470 and 14,970
mg/L respectively. The system showed higher removals of
COD, BOD, color, odor and nitrogen.
Zimpro (33) showed that addition of PAC in an
activated sludge treatment would improve BOO removal from
58% to 97% and COD removal from 58% to 97%, but the
suspended solids removal increased from 73% to 91%. Color
was also reduced by between 150 to 500 APHA units. ln the
28

industrial sector, however, PAC reduced TDC and color by
93 and 98% while a biological treatment removed only 67
and 27%, respectively.
2.3 Priority Pollutants
Specific organic compounds found in wastewaters are
known as "priority pollutants". In the literature,
investigators were concerned with defining better
analytical methods for measuring and making assessments on
the pres~nce of these chemical compounds. Keith et al.
(38) summarized the steps taken by U.S. EPA to develop a
program for the priority pollutants in order to establish
effluent limitations as well as guidelines. In the
program, there were 129 priority pollutants. Each compound
was analyzed to determine a monitoring level in the
industrial discharges.
Chapman et al. (9) investigated the fate and the
effects of the 129 priority pollutants in the environment
based on their chemical behavior. They suggested that
selection of individual priority pollutants for a
mo n i t o r i n g p r o g r am s h o u 1 d b e b a s e d o n t h e i r an t i c i p a t e d
fate and their effects in the environment.
Kincannon et al. (40) studied two mechanisms for
removal of toxic priority pollutants. A 3-liter,
activated sludge, completely mixed reactor was used with a
3.23-liter settling compartment. The reactor was fed with
29

a synthetic wastewater with a BOD between 250 and 300
mg/L. The activated sludge system was operated at 3
sludge ages (2, 4 and 6 days). The 2-liter batch reactor
had a mean residence time of 3 days. Kincannon found that
nitrogen compounds, phenols and oxygenated compounds were
removed by biodegradation. Aromatic compounds were
removed by a combination of stripping and biodegration.
Halogenated hydrocarbons were removed only by stripping.
The study also indicated that a completely mixed reactor
had bettEr removal of priority pollutants than a batch
reactor. Kincannon et al. also found that the larger the
Henry's Law Constant the smaller the concentration of the
priority pollutants in the final effluent.
Weber et al. (79) studied the effectiveness of three
types of PAC added to a completely mixed flow bioreactor
which contained the organic compound, Lindane. All three
types of PAC removed about 96% of the Lindane at a carbon
dosage of 30 mg/L. However, increases in both sludge age
(from 0.25 to 15 days) and retention time did not increase
either COD removal or the Lindane concentration. Weber et
al. concluded that removal of priority pollutant compounds
depends entirely on their chemical properties.
Tabak et al. (66) presented protocols to study
biodegradation of organic priority pollutants. In his
program a GC instrument was adapted as a tool to identify
the organic priority compounds. Total and dissolved
30

organic carbon analytical procedures were outlined.
Unger et al. (70) explained that percentage removals
of priority pollutants and heavy metals vary significantly
among wastewater plants. Metal and organic removals
ranged from 32 to 81% and from 52 to 87%, respectively.
percentage removal of priority organics or heavy metals
vary from plant to plant and even from sample to sample.
The activated sludge process showed better removal for
heavy metals such as Cr, Cu, Hg, and Zn. The study
suggested\ that removal treatments should be planned on a
plant-by-plant basis.
Tabak et al. (65) studied the biodegradability of
114 organic priority compounds using a static-culture
flask screening process. It contained 5 mg of yeast
extract per liter of a synthetic medium with a 5 and 10
mg/L compound concentration. A 7-day static incubation
period at 25°c was used. Three weekly subcultures were
done with the addition of domestic wastewater as a
microbial source. To test the biodegradability, DOC and
TOC were determined for each compound. Results showed
that priority pollutants did not degrade under static
culture conditions and therefore a new methodology should
be developed.
Baller, et al. (5) explained the approach which had
been taken by EPA to develop methods to measure
hydrocarbon and chlorinated organic solvents in wastewater
31

down to a concentration of 1 ug/L. These methods are
reliable in qualifying water-insoluble volatile organic
compounds at a concentration as low as 0.5 ug/L.
Thomas et al (68) discussed EPA methods for
analyzing priority pollutants in water by chromatography
and chromatography/mass spectrometry (GC/MS). They also
described sampling, storage, apparatus, sample preparation
and gas chromatography analysis.
2.4 Air Stripping
' Air Stripping methods have been used by petrochemical
companies to treat wastewaters containing high
concentrations of volatile compounds. Studies showed that
for wastes containing volatile organic compounds, air
stripping is a sufficient method of removal.
Engelbrecht et al. (17) studied stripping kinetics
for acetone and butanone (methyl ethyl ketone) compounds
using an 8.0-liter aeration tank at various air flow
rates. Removals of acetone and butanone by air stripping
could be described as first order kinetics. They
concluded that the inorganics in wastewater required for
the biological treatment processes would have no effect on
stripability of the volatile compounds. The unit air flow
rate Ka, varies linearly with air flow.
Gaudy et al. (28) reported that first order stripping
kinetics cannot be applied to all volatile compounds in
all experimental conditions. The variables that most
32

affect the overall transfer coefficient, Ka, are
temperature, air flow, and tank geometry.
Gaudy et al. (29) investigated volatile organic
compounds in a 28.3-liter activated sludge tank at various
air flow rates starting with 100 ml/min/L and increasing
to 1200 ml/min/L. They concluded that joint mechanisms
(air stripping and biological processes) were fairly good
to predict kinetic constants. However, kinetic constants
have no Effect on the removal by either stripping or
biological processes. Removals by either air stripping or
biological methods were entirely dependent on the
processes.
2.5 Industrial Wastewater Reclamation and Reuse
For years, many countries in the world have begun to
reuse domestic and wastewater. The role of using
reclaimed wastewater will increase in the future as
drinkable water becomes scarce and expensive.
Wastewater is a valuable source and could be used when
treated and managed properly.
Lauer et al. (42) explained that reused wastewater
for potable water may become economically feasible with
de v el o pm en t of water treatment processes . In Denver ,
Colorado, a 1-MGD demonstration plant has been in
operation for 3 years. The demonstration plant
incorporated the following units: lime clarification,
33

recarbonation, filtration, selective ion exchange, first
stage carbon adsorption, reverse osmosis, air stripping,
ozonation and chlorine dioxide disinfection. Ion exchange
and carbon regeneration furnaces were also included.
Treated wastewater was used directly to irrigate
landscapes and part of the water was used by the city for
nonpotable uses. The project will be run for 5 years to
study its performance. Upon completion, the authority
will be able to answer many questions related to future
w a t e r r e u.s e .
Vuuren et al. (73) studied water reclaimed from a
pond which had received a secondary effluent from a
treatment plant. The pond water was treated by an algae
separation unit and then by an active carbon adsorption
unit. In 1976, an ammonia removal was implementated. They
reported that the reclamation plant operated for a short
period totaling 200 days and contributed about 1000
million liters of reclaimed water to the water supply
network. Chemical and microbial analysis were done and
strict monitoring was applied at all times.
DeBoer (14) explored the idea of using wastewater for
reuse. Presently techniques are becoming available to
convert wastewater to water safe for irrigation or to
potable water. The public has still negative opinions on
reused water. He stressed that the benefits of using a
wastewater program are becoming known to the public. In
34

Arizona, for example, without reused water programs,
growth would be 1 irilited due to water shortages. In
California, ground water aquifiers are already recharged
with wastewater and no health effects have been observed
on the public who used the reclaimed water.
Bruvold (7) conducted a public survey about using
reclaimed wastewater as either drinking water or for
nonpotabl e purposes. From the results of the survey he
suggested that the best way to achieve public acceptance
would be through the news media, lectures and advertising. \
Most of the public believed that the technology exists to
treat wastewater sufficiently for potable reuse; however,
they opposed the use of reclaimed water for drinking but
for other purposes it would be acceptable.
Goff et al. (31) reviewed the construction of the 5
MGD wastewater reclamation facility for the city of
Chandler, Arizona. A new water supply was needed;
therefore, reuse of the municipal wastewater was being
considered as a source to meet rapid growth in the
community. Investigations were conducted to determine the
most feasible way to use the reclaimed water. The plan
was to reuse the reclaimed water for a golf course, a
greenbelt area, as well as for residential and commercial
development.
Crook (12) discussed water reuse in California within
the past few years. California encouraged such uses as
35

irrigation. Irrigation accounted for approximately 80% of
the total quantity of wastewater reclaimed. Health
criterias were established for various uses including
irrigation, impoundments, and groundwater recharge.
Corssmit (11) reported on financing plans and price
schedules for reused water. For the reuse project to be
successful, four feasibility tests should be fol 1 owed:
(1) the technical aspects of the project should be
under st o o'd ; ( 2 ) t h e pr o j e c t m u s t be e c o no m i c a 1 1 y
desirable in term of costs and benefits; (3) the
revenues must exceed the total cost; and (4) public
opinion should accept the reuse project. Corssmit al so
pointed out that a market analysis should be done to make
sure that there are demands for reused water. Mc C 1 u re
(46) believed that the technology exists to develop and to
produce high-quality reused water from either municipal
sewage plants or from industrial wastes. Several
industries tried successfully to reuse their cooling water
for inside purposes. A steel mill and plating industry
utilized significant amounts of potable water during their
normal processes. 80% of this water could be reclaimed
with an on-site treatment. Of course, depending on the
characteristics of the wastewater, recommended steps would
be added to make the water satisfactory for reuse.
Nellor et al. (49) evaluated the effects on human
36

health from using groundwater recharged with municipal
wastewater. Before being recharged into the groundwater,
the wastewater was blended with stormwater and river
water. Nell or et al. estimated that the wastewater-pl ant
produced about 250,000 acre- ft of water each year, of
which 67,500 acre-ft were reused and the remainder was
discharged to the ocean. Replenished water did not show
any measurable adverse effects on either groundwater
quality or the health of the people ingesting the
' reclaimed water.
Shannon et al. (55) explained that Odessa City,
Texas relies completely on Colorado municipal water for
its main water supply. The watewater pl ant provides
approximately 40 MGD, however, the amount will be
increased in the future. There are two water reclamation
plants, a conventional activated sludge plant, and an
oxidation-ditch activated sludge plant. Both of these
plants discharged their treatment wastewater into
landscapes where water either evaporates or percolates
into the groundwater. A local industrial company uses
secondary effluent for fire protection and cooling tower
makeup, after the water is pre-treated by lime
clarification, filtration and zeolite softeners. Shannon
et al. indicated that the future pl an was to reuse the
municipal wastewater for either landscaping, irrigation or
recharging ground-water.
37

C o r n e i 1 1 e ( 1 0 ) presented a master pl an for
wastewater reuse at Chino Hills Area, California. With
t h e a r e a e x p a n d i n g s o f a s t , a w a t e r c o n s e r v a t i o n pr o g r am
will be implemented to reduce the water supply requirement
by 20% from normal usage. Therefore, the main objective
was to maximize the use of reclaimed wastewater in order
to make up for the 20% reduction in the water supply. The
secondary treatment effluent disinfected with chlorine
reclaimed water was used only for restricted landscape
irrigatio~. For a densely populated area, he recommended
that the quality of secondary effluent should be
equivalent to a tertiary discharge. He claimed that
reused water in 1 ieu of potable water is currently
economically attractive.
Culp et al. (13) explained that desalination plants
provide coastal areas with the main supply of fresh
drinking water. However, sea water contains about 3.5%
d i s so 1 v e d s a 1 ts p 1 us a con s id er ab 1 e am o u n t of or g an i c
matter over 35 times as much foreign matter as secondary
tr e a tm e n t p 1 an t e f f 1 u e n t s c o n t a i n . F o r t h i s r e a s o n a n d
others, investments in desalination plants exceed the cost
for a wastewater reclamation plant. They pointed out that
t h e b e n e f i t s fr om w a t e r r e u s e a r e n o t o n 1 y t o r e u s e th e
water but al so to control pollution.
Most of the studies to date have concentrated on the
removal of specific priority organics which were added to
38

a synthetic waste. In addition many studies were
constructed on a bench-scale and involved batch reactors.
Of the studies using pilot-scale reactors, none
investigated the compounds that were studied in this
dissertation. All of the AS operating parameters utilized
in this study simulate those in a full-scale operation and
the priority pollutants selected for this study (benzene,
chloroform, 2,4-dimethylphenol, ethylbenzene, fluorene,
naphthalene, pyrene, toluene, m-xyl ene, and o-xyl ene) are
those foood in an actual refinery waste. A study such as
this fills a significant gap in the literature on refinery
industry wastewater treatment.
39

3. EXPERIMENTAL PROCEDURE
3 . l E qui pm en t
The schematic of the PAC/ AS pi 1 ot pl ant utilized in
this study is shown in Figure 3.1.1. The pilot plant was
manufactured by the Virtis Co. and it consists of 1) a 6-
1 i ter Pyrex glass reactor fitted with an air-tight
stainless steel cover to prevent the escape of gasses, 2)
a feed pu~p operated at 1.3 L/hr, 3) a 120-L feed storage
tank also with an air-tight cover, 4) a PAC slurry pump,
5) a clarifier pump, 6) a clarifier with a settling
compartment volume of 2 liters and 7) an effluent
receiving tank. A 120-L holding tank with a turbine
impeller mixer rotating at 50 rpm was used for the feed
storage tank. To minimize the space in the holding tank,
a floating plate was placed inside on the wastewater
surface to keep the volatile organic compounds from
escaping. The feed holding tank was air sealed (Figure
3.1.2). Two filters were connected to the effluent of the
holding tank and they were in series. The first filter
consisted of a chemical addition section and filtering
fiberglass material. The second filter consisted of only
a filtering fiberglass material.
40

.,. ,_.
BASE TANK ACID TANK
NUTRIENTS TANK
MIXING RATE CONTROL AND RPM DISPlA Y.
PRESSURE GAUGE
COOLING WATER TANK
HEATING&
COOLING SYSTEM
EFFLUENT
SLUDGE SAMPLE
EFF SAMPLE
SLUDGE WASTING
PAC SLURRY TANK
Figure 3.1.1 Schematic diagram of the Integrated PAC/ AS Pilot Plant

MIXER
FEED FROM DRUM A
'
EFFLUENT
STAND
FLOATING PLATE
--+-- HOLDING TANK
Figure 3.1.2 Schematic of the Holding Tank and Filters
42

The pilot plant was equipped with continuous
monitoring and control devices for pH, temperature, air
pressure, dissolved oxygen, agitation system, cooling
unit, and acid and base control. The pilot pl ant
c 1 a r i f i er w a s f ab r i c ate d fr om a one - 1 i t e r f u n n e 1 - sh a p e d
g 1 ass tan k ( 1 O 0 s 1 ope , 1 O cm d i am et er , 6 8 cm h i g h ) , a s
shown in Figures 3.1.3 and 3.1.4.
PAC, manufactured by the Calgon Corporation,
Pittsburg~, PA was used for this study. It has a maximum
of 75% of the particles passing through a 325-mesh screen.
A BL type PAC recommended by the carbon manufacturer was
selected for this study. The specifications for PAC were
provided by the manufacturer (Table 3.1.1).
3.2 Experimental Steps
The experimental phases were run at 3, 6, 9 and 12
days sludge age (Sc) These values are typical for
con v e n t i on a 1 tr e a tm en t pr o c e s s e s . Th e c h a r a c t er i st i c s of
the refinery industry wastewater (physical and chemical
parameters and organic loadings) were determined; they
were identical to a discharged wastewater from a complex
industrial area.
43

'
Influent ----.i 00. 10.8 cm --i,
ID 10.0cm --H
T 22cm
' j
T 11cm
10'
-...i---- Internal Pipe
Internal SCraper
45cm
--11--1 cm
Figure 3.1.3 Schematic Diagram of the Experimental Clarifier Unit
44

'
1.Scm
'------- 6.Scm-------i .. 1 10 cm -------------<-
---! f-- 0.5 cm
J_ I 2.Scm
6i-:- l ~
-i 1 .Scm~
Figure 3.1.4 Schematic Diagram of the Weir Inside the Clarifier (not to scale)
45

Table 3.1.l Physical Properties of the BL Type of Powdered Activated Carbon (Calgon Corporation, Pittsburgh, PA)
specifications Carbon Type
Manufacturer
Base Material
Total Surface Area {N2BET Method), m2/g
' Apparent Density (bulk density, dense packing), glee
Real Density He (displacement), g/cc
Pore Volume (within particle), g/cc
Specific Heat at loo 0 c Iodine Number, minimum, mg/g
Molasses Number, Minimum
Ash, maximum, wt%
Moisture, maximum as packed, wt%
*Wet Screen Analysis, minus 325 U.S. Mesh%
* U.S. Sieve Series; opening of 44 microns.
46
BL
Calgon
Bituminous
1000-1100
0. 5 1
2. 1 0
0.90
0.25
1000
230
8.5
2
65.75
Co a 1

The hydraulic retention time (9=V/Q) in the aeration
tank was designed to be around 4 hours. The clarifier
effluent flow rate was approximately 20 ml/min (l .2 L/hr)
and the recycling flow rate was about 0.10 L/hr. The
design operating conditions of the biological pilot plant
are listed in Table 3.2.1.
The temperature of the reactor was kept at 24°c for
all experimental phases and the pH was between 6.80 to
7.20. The air flow rate was kept at 2.0 L/hr which
yielded , a concentration of dissolved oxygen in the
aeration tank in the range of 5 to 6 mg/L. The mixed
liquor suspended solids (MLSS) concentration was in the
range of 2,000 to 3,500 mg/L, and the mixed 1 iquor
volatile suspended sol ids (MLVSS) was about 1 ,500 to 3,000
mg/L. Sol ids were waste from the waste 1 ine in order to
allow a more positive control of the sludge age than could
be achieved by wasting from the reactor. During the test
period 10, 50 and 120 mg/L of PAC were added to the
influent. To make up for PAC lost along with the waste
sludge, clarifier effluent and aeration tank samples,
fresh PAC was added to the influent feed line once per
day. The characteristic of the refinery industry
watewater feed to the biological pilot plant was given in
Tables 3.2.2 and 3.2.3.
47

Table 3.2.1 Pl ant
Operating Conditions of the Biological Pilot
Reactor
Volume Hydraulic retention time, HRT Air flow rate pH Dissolved Oxygen (DO) Flow rate
'
Agitation rate Air pressure Temperature PAC dosages
Holding Tank Volume Mixing rate Fl ow rate
Clarifier Volume Length Sh ape Top opening OD, ID Lower Opening
48
5. 10 L 4.0 hr. 1.5 L/hr 6-8 5-6 mg/L 1.3 L/hr 100-300 rpm 3.0 psi 2 4° c 10, 50, 120 mg/L
110 L 50 rpm 1.3 L/hr
2. 5 L 67 cm cone 10.8, 10.0 cm 1 cm

Table 3.2.2 Characteristics of the Refinery Industry Wastewater
par ame te r number Range Me an of low-high Value
samples ug/L
Temperature 60 23-24 24°c pH 60 7.17-7.50 7.24 DO 60 4.5-6 5. 0 BOD 5 56 93-329 237.0 COD 60 160-588 457.0 TOC ' 60 35-847 27 2. 0 TSS 56 2000-3750 114.0 vss 56 5-185 105.0 NH 3 56 15-70 40.0 N0 2 56 0.01-0.10 0.05 NO 56 0.54-1.94 0.91 Or~hophosphate 56 0.14-2.20 1. 43 Tot al Phosphate 56 0.10-0.46 0.28 Chloride 3 206-260 260.0 Oil and Grease 56 3-191 191. 0
49
Unit
pH units mg/ L mg/L mg/L mg/ L mg/L mg/ L mg/L mg/L mg/l mg/L mg/ L mg/L mg/ L

Table 3.2.3 Chemical Composition of the Refinery Industry Wastewater Treated by the Pilot Plant
Parameter
Acid Extractables
2,4-Dimethylphenol
number of
samples
6
Base-Neutral Extractables
Bis (2-ethylhexyl) phthalate 6 Fluorene 6 Naphthalene 7 Pyrene 5
Volatile Organics
Benzene 4 Chloroform 4 Ethyl benzene 4 Toluene 4 m-Xylene 4 o-Xylene 4
Range 1 ow - high
ug/L
13-1,880
10-750 20-1,746 33-6,933 27-33
620-3,696 1,260-1,952
60-520 460-3,500 310-1,120 460-1,260
50
Mean Concentration
ug/L
452
767 354
1,358 32
2,074 1, 725
300 1,699
695 857

3.3 Sampling Procedure
Samples for analyses (Table 3.3.1) were collected
every 24 hours for 5 days for phase I and 3 days for
phases II, Ill, and IV, for a continuous steady-state
experiment. Composite samples were taken from the
influent feed tank and the clarifier effluent. The sample
containers were kept cool until the day of analysis.
Composite samples of wasted mixed liquor were obtained
from the wasting line before the daily volume of waste was
measured ~nd discarded. The contents of the holding tank,
the aeration tank and the clarifier unit were mixed
uniformly and completely before taking the sample.
Parameters such as temperature, pH, air flow, and
dissolved oxygen levels in the aeration tank were read
directly from the pilot plant unit. Samples for mixed
liquor and suspended solid were analyzed immediately after
sampling. Boo 5 , COO, TSS, and VSS were determined.
Additional samples for analyses such as TOC, chloride,
nutrients (nitrogen and phosphate), and oil and grease
were done in the laboratory.
Microorganism growth and population dynamics were
ex am i n e d by b o t h 1 i g h t m i c r o s c o p e s an d s c an n i n g e 1 e c t r o n
microscopes (SEM). After changes in the parameters of
each run, a period of three to four days was needed for
51

Table 3.3.1 Sampling and Analytical Work Schedule for the Biological Treatment Pilot Pl ant
Parameter
Temperature
pH
Air Flow
Fl ow Rate
00
BOD5
coo TOC
'
Suspended Sol id
Volatile (MLVSS/VSS)
Fixed (TSS)
Nitrogen
NH3
N02
N03
Oil I Grease
Total Phosphate
Orthophosphate
Organics
Volatile
Acid/Base Extractable
Influent
x x x
x x
x
x
x
x
x
x
x x x
x
x
Sampling Location
Reactor Effluent Frequency
x
x
x
x x
52
x
x
x
x
x
x x x x x
x
x
x
Daily
Daily
Daily
Daily
Daily
3 times/week
3 times/week
3 times/week
3 times/week
3 times/week
3 times/week
3 times/week
3 times/week
3 times/week
3 times/week
3 times / week
Daily
Daily

the biomass to reach steady-state conditions.
3.4 Analytical Methods
Selected priority organic compounds were analyzed
according to the instructions given in the Federal
Register (37, 81, 82). All other analyses were performed
according to the Standard Methods for the Examination
of Water and Wastewater (61).
TOC ~as measured using a TOC Model 700 analyzer made
by O. I. Corporation. Ammonia was determined by the
acidimetric method. Nitrite (N0 2) was measured using the
diazotization method. Nitrate (N0 3) concentrations were
determined by the bucine method. The stannous chloride
method was used for both total phosphate and soluble
orthophosphate. Chloride was measured by the argenometric
method. Oil and grease method in the Standard Methods was
modi f i e d a s fol l ow s : A l 5 O - m l s am pl e w a s c o l l e c t e d and
actified to pH 2 or lower using 5 ml of concentrated HCl.
The acidified sample was transferred to a separatory
funnel and the sample container was washed with 10 ml of
trichloro-trifluoro-ethane as a solvent, the wash liquid
was then al so transferred to the separatory funnel. Then
the separatory funnel was shaken vigorously for 2 minutes
and allowed to stand for 10 minutes or longer, so that
the organic layers separated after excess gas venting.
53

The separatory layer was drained off through a funnel
containing clean filter paper and the solution was
collected in a distillation flask. Then the sample was
extracted twice with 10 ml of solvent and the extractable
materials were transferred to the distillation flask. The
filter paper was washed with 10 to 20 ml of solvent and
the washable liquid was transferred into the distillation
flask. The distillation flask was placed in a water bath
at 10°c for 15 minutes. The fl ask was then put in a '
desicator to cool for 30 minutes and was weighed.
The procedure for extracting the samples (base/neutral
and acid extractables) and determining the selected
priority organic pollutants are discussed in the following
sections.
3.4.1 Sample Preparation
EPA base/neutrals and acid method 625 (72) describes
the determination of organic compounds that are soluble
and able to be measured by gas chromatography. Methylene
chloride was used as a solvent to extract the dissolved
organic compounds at a selected pH. The extract was dried
and concentrated to a volume of 1 ml and analyzed by GC.
The chromatographic conditions were modified for measuring
the organic compounds at their concentrations in the
refinery industry wastewater. (Tables 3.4.1.1, 3.4.1.2,
3.4.1.3, 3.4.1.4).
54

Table 3.4.1.1 Tekmar Model LSC-2 Conditions for Analysis of Purgeable Organic Compounds
Furnace
Trap mater i a 1
Sample size
Times
Temperature readouts
Purge pressure
Purge fl ow rate
Bake temperature
Range ambient to 350°. Rise time 200°c/min
Tenax (Silica Gel/charcoal, 12" x 1/8")
5 ml, medium porosity glass frits including 3-way manual valve for sample load, unload, front drain.
Purge 15 min, Ory purge on timer set on 11. oesorb 4.0 min. Bake 7 min
Auto positions
20 psi
40 ml /min
55

Table 3.4.1.2 Gas Chromatographic Conditions for Photoionization Detection (PIO)
Initial temperature
Final temperature
programming rate
Initial hold
Final hold
Detector temperature
Injectio~ temperature
Carrier gas, He
Column
56
45°c
200 OC
a°C/min
3 min
15 min
250°C
200°C
40 ml/min
60180 Carbopack B 1% SP 1000 Glass

Table 3.4.1.3 Gas Chromatographic Conditions for Hall Electrolytic Detection (HALL)
Initial temperature
Final temperature
Pr og r am rate
Initial hold
Detector temperature
Injection temperature
Final hol~
Carrier gas, He
Reactor gas, H2
Co 1 um n
57
45°c
200°c
s°C/min
3 min
15 min
40 ml/min
50 ml/min
60/80 Carbopack B 1% SP 1000, Glass

Table 3.4.1.4 Gas Chromatographic Conditions for Flame Ionization Detection (FID)
Initial temperature
Final temperature
Pr og r am rate
Initial hold
' Detector temperature
Injection temperature
Carrier gas, He
Reaction gas, Air
Reactor gas, H2
Mode
Column
58
2 min
50 ml/min
0.2 l/min
50 ml/ min
Splitless
20m x 0.23 mm ID SE-54 fused silica capillary, custom made

The extraction procedure was as follows: The
base/neutrals and acid extractable samples were collected
from the influent and effluent at sample points in the
biological pilot plant. Each 150 ml sample was collected
and poured into a 250-ml separatory funnel. The pH of the
sample was adjusted to above pH 11 by adding 1 ml of 10 N
sodium hydroxide (NaOH). The sample was extracted three
times with 10 ml of methylene chloride each time. The
' extracted sample in the separatory funnel was shaken for
two minutes each time with periodic venting to release
excess pressure produced by gases in the funnel. At 1 east
10 minutes was allowed each time for the organic layer to
separate from the water phase. The combined methylene
chloride extracts contained the base/neutral extractables.
The combined extract was poured through a drying column
containing about 10 cm of anhydrous so di um sulfate, and
then the extract was collected in the K-D concentrator.
One or two clean boiling stones were added into the K-D
concentrator and then the extract was pl aced into the
prewetted Snyder Column. The K-D apparatus was pl aced in
a hot water bath at 65-70°C and the concentrator tube was
immersed in the hot water. The K-D apparatus was removed
from the water bath when the apparent volume of the
extract reached 1 ml . The apparatus was left to drain for
at least 10 minutes. The Snyder Column was removed from
59

the lower part. The lower flask with the concentrator tub
was rinsed with to 2 ml of methylene chloride. The
concentrated liquid was collected in a 1 ml vial and was
ready to be injected to the GC instrument. The pH of the
aqueous layer left from the base/neutral extraction was
readjusted to less than 2 by addition of approximately 1
ml of sulfuric acid {l+l) The aqueous phase was
extracted three times with 10 ml of methlylene chloride
each time. The combined extracts contained the acid
extractab~es and were then treated in exactly the same way
as the base/neutral extractables.
To estimate the amount of powdered activated carbon
PAC present in the MLVSS the following procedure was
utilized by the Zimpro Inc. Laboratory, Wisconsin (82).
The procedure is applicable only to the wastewater
carbon/biomass from an integrated powdered PAC and AS
process. The procedure is known as nitric acid digestion
and it yields an estimate of PAC in a carbon/biomass
slurry. The determination of biomass and carbon was done
by comparing the VSS of a nitric acid digested sample with
the normal VSS and finding the ratio between activated
carbon and biomass solid. The procedure for biomass
determination in a nitric acid digestion sample was as
follows:
60

1. Run normal suspended sol ids tests using a 10 ml
sample, dry it at 6oo 0 c for one hour, then measure the
suspended ash.
2. To another 10 ml aliqout of the sample, add 20 ml of
concentrated nitric acid.
3. Heat the acidified sample to just under boiling.
4. Continue heating until the sample volume has been
reduced to approximately 10 ml.
5. Cool the sample to room temperature. ' 6. Determine the suspended solids and ash on the digested
sample.
7. Calculate the results.
8. The carbon and biomass concentrations could be
determined as follows:
Carbon, g/L = C-D 0.95
Biomass, g/L = A-(B +Carbon)
where
A = No rm a 1 suspended solids, g/L
B = Normal suspended ash, g/L
c = Nitric acid treated suspended
D = Nitric acid treated suspended
0.95 = Carbon factor
61
solids, g/L
ash, g/L

3,5 Seeding Refinery Industrial Wastewater
Initially, refinery industry wastewater was seeded
with seed organisms obtained from the South Kingstown
Wastewater Treatment plant in Narragansett, Rhode Island.
Five ml of clarifier activated sludge was obtained and
acclimated to the refinery industry wastewater. The
suspended solid concentration in the clarifier was in the
r a n g e o f 2 ~ 0 0 0 - 3 , 0 0 0 m g I L . Am m o n i a , s u 1 f a t e [ ( N H 4 ) 2 S 0 4 ]
and potassium phosphate [ K2 H P0 4] were added as N and P
nutrient sources. The refinery industry wastewater was
fed directly into the seeded activated sludge aeration
tank continuously. Parameters such as pH, temperature,
dissolved oxygen and nutrient concentrations were kept
constant. The biological pilot plant required between 4
and 5 weeks to reach a MLSS concentration of 2,200 mg/L.
3.6 Start-up of the Biological Pilot Plant
The biological pilot plant was operated continuously
after being seeded, and achieved the steady-state
conditions based on the MLVSS and MLSS . measurements. To
keep the concentration of priority organic compounds in
the holding tank high enough to be detected by a GC
instrument, organic materials had to be added and
dissolved uniformly in the feed tank. Two filters were
connected to the effluent of the feed tank in order to
62

trap any suspended particles and organic materials from
getting into the aeration reactor tank. The hydraulic
retention time (HRT), and sludge age (SA) or sludge
retention time (SRT) of the biological pilot plant were
controlled at 4 hours and 3, 6, 9, 12, days respectively.
Daily wasting of mixed liquor was performed once per day
through the wasting sludge point to control the sludge
age. PAC was added directly to the aeration tank. The
concentration of PAC was calculated based on the required ' PAC concentration in the mixed liquor.
63

4. CHARACTERIZATION OF THE STANDARD REFINERY WASTEWATER
4,l Data Collection
During the summer of 1985, a study was conducted in
the Shuaiba Industrial Area (SIA) to determine the
chemical composition, flow rates, and discharge points for
industries in the SIA (67). The Kuwait National Petroleum
Company Refinery (KNPC) and the Petrochemical Industrial
Companies (PIC) plants A and B are considered the major
' sources of wastewater discharged directly into the Arabian
Gulf. Composite samples were collected from the Shuaiba
Industrial Area at the discharge points at a location
prior to mixing with seawater. These samples were
analyzed for BOD 5 , COD, nitrates, nitrites, ammonia, pH,
phenol, oil and grease, and selected heavy metals such as
chromium (Cr+6), copper (Cu), iron (Fe), lead (Pb), and
nickel (Ni). The analyses were conducted according to
Standard Methods (61). The results of these analysis are
presented in Table 4.1.1.
The hydraulic flow survey showed that the mean daily
flow to the KNPC API separator was about 960 gpm, but the
flow to the PIC neutralizing basin was approximately 63
gpm. There was no change in the pattern of the wastewater
flow at night or during the weekends in both the operation
of the KNPC Refinery and PIC Fertilizer Company, Plant B.
Chemical analyses of grab composite samples were made
64

Table 4.1.1 Results of Analysis for the Composite Samples Fran the KNPC-API Separator and PIC Pl ant B.
parameter
NH3-N
N03-H
N02-N
Phenol
COD
BOD5
'
Qi l and Grease
Sulphides
Fe
cr+6
Pb
Cu
Ni
Samp 1 e NllTiber (Date) l 2 3
(6/4/85) (6/17/85) (6/30/85)
3.35
0.38
0 .13
0.62
375.7
320
3 .13
0.026
0.026
3.25
592.2
100
2.60 150
3.42 0.078
l .39 0.88
0.084 l .88
0.019 0.032
0.084 0.041
0.022
65
2.85
0.003
0.010
4.91
132. 2
95
3.89
1.50
1.63
0.024
0.031
0 .017
Average Concentration
(mg/L)
3 .11
0 .14
0.055
2.97
367.0
210
82
2.46
1.25
l. 20
0.025
0.052
0.020

every other week over a one-month period. The results of
these analyses are presented in Table 4.1.1, on page 65.
The composite samples were also analyzed for their
organic priority pollutant composition. The analyses were
conducted according to the USA Environmental Protection
Agency Method No. 601 for purgeable halocarbons, Method
No. 602 for purgeable aromatics (19, 20) and Method No.
625, for dissolved organic compounds. A GC was used to
measure the concentrations of dissolved organic
pollutants~ The results are presented in Tables 4.1.2 and
4 .1. 3.
4.2 Selection of Priority Pollutants
According to the regulatory agency (Kuwait
Environmental Protection Council), there are several
factors which should be considered to determine the
selection of priority pollutants. These factors are as
follows: (l) toxicity in the water, (2) presence in the
water, (3) highest concentration in the water,
(4) frequency of occurance, and (5) effects on human and
aquatic life.
Sam pl es were
pollutants. For
pollutants, GC-MS
poll utan ts. The
collected from SIA and analyzed for
the determination of the organic
was used to identify the priority
analyses showed that the following
compounds were present:
66

Table 4.1.2 Extractable Organic Compounds Found in KNPC AP! Effluent
Compound Average Extractable Concentration Fraction ug/L
Naphthalene 1 21 . 0 Base/Neutral
2,4-0imenthyl Phenol 5 0. 4 Acid/Neutral
Phenol 25.2 Acid/Neutral
Fluorene ' 16. 0 Base/Neutral
Pyrene 1 0 . 0 Base/Neutral
Chrysene 6. 0 Base/ Neutral
Bis (2 - Ethyl Hexyl) 1 0. 0 Base/Neutral Phthalate
67

Table· 4.1.3 Halocarbon and Aromatic Compound Concentrations Found in Wastewater of KNPC API Separator Effluent.
Compound Concentration ( ug IL)
Chloroform 7 40
Benzene 560
Toluene 660
Ethyl benzene 120
Xylene 5 00
68

benzene, bis (2-ethylhexyl) phthalate, chloroform,
chrysene, 2,4-dimethylphenol, ethylbenzene, fluorene,
naphthalene, pyrene, and xylene. A list of all organic
priority pollutants found in SIA is given in Tables 4.1.2
and 4.1.3.
The selection of organic priority compounds for this
study was not only based on the relative toxicity, but on
their presence in the SIA discharge wastewater. Taking
into account the utilization of seawater for drinking '
water after desalination, the following priority
pollutants were selected for this study: benzene,
chloroform, 2,4-dimethylphenol, ethylbenzene, fluorene,
naphthalene, pyrene, toluene, and xylene. Table 4. 2. 1
shows the different chemical and physical characteristics
of the selected compounds. Several wastewater
characteristics were also identified including BOD 5 , COD,
TOC, TSS, nitrogen, and pH.
69

Table 4.2.1 ChMlcal and Physlcal Charecterl1tlc1 of Selected Priority Organic Pollutants
Coopound N- Benzene Chlorofor• 2,4-01 .. thy I Ethyl- Fluorene Naphatha I ene Pyrene Toluene Xylene phenol benzene
For•ula C6H6 CtCI} C8H180 C8H10 C1}H10 C10H8 C16H10 C7H8 CHf6H6CH}
• .. 0 I ¢'"' "'""' O:P 00 [8 0 €) ... Structure ·---· 6 ,
I • "' Molecular Weight 78.12 119.38 122.20 106.16 116.20 128.20 202.}0 92.1} 106.20
Bol I Ing Point, 0 c 80.10 61. 70 210.90 1.56.20 29}-295 218 }9} 110.60 144
Metting Point, °c 5.5 -6}.5 27-28 -94.9 116-117 80 150 -95 -25.2
Vapor Pressure 95.2 150.5 0.062 7 7.1X10⁻⁴ 0.087 2.5X10⁻⁶ 28. 7 10
at 20°c, Pv (torr> (25°Cl <20°C> (25°> (20°Cl (25°C> <25°C> <20°C>
So I ub 111 ty In •at er 1. 78 x 1 o} 8,20 x 10} 590 152 1.69 }1. 7 o. n 5}4.8 Insoluble
s.1 (Pf'M) (25°C> (20°C> (25°> (20°C> <25°Cl (25°C> <25°C> (25°C>
Henry's La• 5,5X 10} 2,88 x 10-} 1.1x10⁻⁵ 6.6 x 10-} 6,4 x 10⁻⁵ 4.6 x 10⁻⁴ 5, 1 x 10⁻⁶ 6,66X10-} 6. 12 x 10-}
-.J Constant (at011 M} /me>
0 2.2 x 10} Octano I /•ater 1}5 91 200 1,5 x 10⁴ 1.95 x 10} 8.0 x 10⁴ 620 Not Aval fable
Un It less
Ion I zatlon Constant pK-NER pK-ffER 10,60 pK-NER pK-NER pK-NER pK-NER pK-NER Not Aval fable
Rearatlon Rate Ratio 0.574 o.58} NAV 0,489 NAV NAV NAV 0,526 NAV
KV/KV
Note: NAV •not appllcable for calculatlng the rate constant for volatlzatlon
pK-NER • pKa or pKr Is not envlron..ntal ly relevant for fate of ch-feels

5. PRIORITY ORGANICS REMOVAL PROCESSES
To study the treatabil ity and the fate of each
selected organic compound in the industry refinery
wastewater treatment process, each characteristic of each
compound should be known as presented in Table 4.2.1.
Some of these selected organic compounds will be affected
by stripQing, '
biological and adsorption oxidation
processes.
A series of experiments was designed to investigate
the removal of the selected priority pollutants as shown
in Figure 5 .1
5.1 Activated Sludge
The first experiment was to use AS for biological
oxidation and to evaluate the effectiveness of the
activated sludge in reducing organic pollutant
concentrations in the refinery industry wastewater.
Initially, the activated sludge was acclimated to the
refinery industry wastewater, and the acclimation period
took approximately 4 to 5 weeks. The AS reactor was
operat ed at an HRT of 4 hours. The steady-state condition
was judged to have been reached when the effluent
substrate concentration became steady over a long period.
71

-....J
N
© I ®
~
ACTIVATED SLUOOE
AND POWDERED
EXPERIMENT
FLOW CHART ..
I
~ AIR STRIPPING
I
8, •ld 8c•6d 8,•9d 8c•l2d I ACTIVATED CARBON I 1.6 U min 2.0 Umin 2.6 L/mln
I
I ec· ld i o,... m rl-?.,, . ...., PAC ' AC AC • PAC
,::.~L 120 mg/L • PAC 12C 111g/L PAC 12& mg/L PAC 120 mg/L PAC PAC &O mg/L PAC 110 mg/L PAC 60 lllg/L
10 mgtl 10 mg/L 10 mgJL 10 mg/L
Figure 5.1 Experimental Steps
I ©
I POWDERED ACTIVATED
CARBON
J PAC 12~-';;g/L PAC 60 mg/L
10 mg/ L

The aeration reactor tank was continuously fed with
wastewater at a rate of 1.3 l/h and contained total
suspended solids of 114 mg/l. In the aeration reactor
tank, the DO was maintained at 5.0 mg/l, and the pH was
kept between 6.80 to 7.20 by adding either 0.25 H2so 4 or
o.5 N NaOH to the mixed liquor. The 9c was kept at 3, 6,
9 and 12 days. For each run, Sc was controlled by wasting
a suitable volume of mixed liquor from the sludge wasting
line once per day.
' Data of interest were collected and
an a 1 y z e d fr om th e i n fl u e n t , e ff 1 u en t , a er at i on tan k and
mixed liquor for a period of approximately 5 weeks.
The biological treatment process was examined by
determining the removal of BOD5 , COD, TOC and selected
priority organic compounds. Experimental parameters of
the pilot plant such as DO, pH, temperature, and sludge
retention time (SRT) were measured and recorded.
Micros cop i c ex am i n at i on of the a c ti v ate d s 1 u d g e was
carried out several times each week to observe changes in
the concentration and species of microorganisms.
5 . 2 In t e g r a t e d Po wd er e d Ac t i v ate d Carbo n ( PAC) and Activated Sludge (AS)
In this experiment, PAC in a slurry form was
introduced into the aeration tank over a period of about
two days to reach a constant level for each dosage.
73

The amount of carbon that was added to the reactor
was calculated as follows:
w = 0 t v N
where
w i s the weight
N i s the number
D i s the d a i1 y
t i s the number
v i s the • o 1 um e
Once the
of carbon, i n mg;
of reactors;
carbon dosage, in mg/L;
of days un t i1 the next s amp 1 e i s taken, and
of the reactor, i n L/reac tor.
carbon reaches the aeration tan k , i t s
concentration increases until equilibrium is reached. The
equilibrium carbon concentration in the aeration tank can
be calculated, assuming a constant proportion of carbon
and s 1 u d g e i n a 11 streams a s f o 11 ow s :
c =
The PAC experiments investigated 3 carbon dosages
(10, 50, and 120 mg/l) at 4 mean cell residence times (3,
6, 9 and 12 days). The HRT time was held constant at 4
hours. A suitable amount of PAC was added once per day to
maintain a constant PAC concentration in the system since
some PAC was lost in the excess sludge wasting, the
clarifier effluent, and the recycling line. The effect of
74

each dosage of PAC on the activated sludge biomass and the
percentage removal of the selected priority organic
pollutants was investigated. Biological growth occurring
on PAC was observed. Table 3.3.1 shows the frequency of
s amp l in g .
days.
This experiment was run for approximately 60
PAC additions increased the stability of the aeration
tank mixed liquor, increased the MLSS concentration, and
improved the clarifier effluent quality.
' 5.3 Air Stripping and Adsorption
A third experiment was conducted to evaluate the
stripping and adsorption characteristics of the selected
priority pollutants in the absence of biological activity.
This part of the study used the same biological pilot
plant. Initially, the aeration tank and clarifier unit
were cleaned, then the reactor tank and clarifier
compartment were filled with distilled water. The
refinery industry wastewater was pumped from the feed tank
to the aeration tank, at a rate of 1.3 l/h to provide a
HRT of 4 hours in the activated sludge reactor. The
temperature of the reactor was kept at 23°c and the pH at
6.8. The air flow rate was maintained at 2 l/h. It took
about two days for the distilled water to be completely
replaced by refinery industry wastewater, as determined by
measuring the TOC level as a function of time. The
75

experiment was run at air flow rates of 1.5, 2.0, and 2.5
l/hr to observe the stripability of the selected organic
compounds, determined by measuring TOC and COD as a
function of time and air flow rates. Influent and
effluent samples were collected over a 15-day period for
analysis. After this experiment was completed, the
refinery industry wastewater in the reactor was analyzed
to identify the remaining organics
5.4 Integrated Powdered Activated Carbon (PAC) in the Abs'ence of Activated Sludge
In th i s exp er i men t, the amounts of TO C , COD and
selected priority organic pollutants removed in the
activated sludge experiment above were compared with the
amounts due to adsorption onto PAC. Th e 6 - L p i 1 o t p 1 an t
reactor was filled with the refinery industry wastewater
to the 5.2-L mark and no activated sludge was added. Then
the refinery industry wastewater was pumped continuously
at a flow rate of 1.3 l/h. The experimental conditions
were the same as in the second experiment, but no biomass
was added. PAC was added at 10, 50 and 120 mg/l, the same
concentration as in the second experiment. The pilot
plant was operated for 24 hours; then samples were
collected for COD, TOC and selected priority organic
pollutant analysis. The experiments lasted for two weeks.
76

6. BIOLOGICAL ANALYSIS
Activated sludge is a mixed biological culture
composed mostly of bacteria, protozoans, rotifers and
fungi. Bacteria are mostly responsible for degrading the
dissolved organic matter in the wastewater to microbial
cell tiss~e and oxidized end products (mainly co 2 and
water). However, the protozoans and rotifers are
responsible for removing the dispersed bacteria, which
have not settled.
The general formulas describing aerobic processes in
the AS reactor tank are as follows:
Oxidation
Bi om a s s + O 2 + Or g an i c m a t t e r ~ C O 2 + N H 3 + e n d pr o d u c t (COHNS) + Energy
Synthesis
COHNS + Bacteria + Energy
Respiration
77

To produce the desired effluent quality, the
temperature, the reactor basin volume, and the MLSS
concentration must be adjusted and carefully controlled to
achieve high BOD 5 and TOC removal.
Also, with refinery industry wastewater entering the
reactor tank, the potential exists for inhibition of the
AS processes. Heavy metals such as cadmium, chromium,
copper, lead, nickel, and zinc react with microorganisms '
and inhibit their metabolism. Organic compounds also can
be toxic to the AS.
In addition, any nutritional deficiency will affect
bacterial growth. Therefore, it is important that the
concentration of nutrients in the feed line be checked and
adjusted if necessary.
6.1 Initial Biomass Seeding
The activated sludge was acclimated in the pilot
plant by using a mixed liquor seed from the South
Kingstown Wastewater Treatment Facility, as described in
Section 3.5 of this report. The contents of the mixed
liquor seed and of samples of the AS were measured as the
MLSS and the MLVSS. The AS was sampled every three days
after seeding and these are graphed in Figure 6.1.1.
In the first three days after seeding, the MLSS and
the MLVSS concentration dropped from 2,000 (in the seed)
to 380 mg/l and from 1,800 (in the seed) to 250 mg/l
78

.. en 2500 0 -_J
0 I o MLSS , en 0
2000 I- • MLVSS
w 0 z ~_J 1500
en' :'.) o> en E
-...J ~ 1000
a:: 0 :'.)
0 - 500 _J
0 w x 0 -~ 0 3 6 9 12 15 18 21 24 27 30 33 36
ACCLIMATION TIME, days Figure 6.1.1 Suspended Solids Concentration in Unit the Reactor

respectively, (Figure 6.1.1). By day 6 after seeding,
MLSS and MLVSS increased due to accumulation of bacteria.
Between day 6 and day 24, the concentrations of both MLSS
and MLVSS gradually increased to a steady concentration.
Then both MLSS and MLVSS rose to peak values of 2,200 mg/L
(day 31) and 1,500 mg/L (day 31), respectively.
After 31 days of operation, the system became
acclimated to the refinery waste. The build up of MLSS
' and MLVSS from days 31 to 64 is shown in Figure 6. 1 .2;
during the activated sludge phase MLSS and MLVSS decreased
slightly and then increased fairly steadily.
80

CJ) 5000 0 -~ 0 CJ)
0 4000 w 0 z w a.. _J 3000 (!)'-. ::> Cl
CJ) E 00 2000 .....
0:: 0 ::> 0 - 1000 _J
0 w x 0 -~
o MLSS ,
• MLVSS
0 a
o-0
31 36 41 46 51 56 61 66
DAYS OF OPE RAT I ON Figure 6.1.2 Aeration Tank Suspended Solids Concentration During Activated Sludge Phase

During the addition of PAC to the AS, the MLSS and
MLVSS concentrations in the reactor appeared to increase
as sludge age increased for each experiment (Figure
6.1.3). Moreover, a higher concentration of PAC in the
reactor may increase the population and the mass of
mi c r o organ i sm s .
The TSS and VSS in the clarifier effluent were
plotted against the day of operation for 31 to 64 (the AS
period; Fi~ure 6.1.4) and for days 64 to 125 (the PAC/AS
period; Figure 6.1.5). The concentration of both TSS and
vss increased as the sludge age increased, but not
d r am a t i c a 1 1 y , t h e p e a k T S S 1 e v e 1 w a s 1 1 0 m g I 1 o n d a y 6 1 ,
during the activated sludge phase, while TSS reached a
peak of 210 mg/l on day 83. This fluctuation in the
effluent suspended solids probably occurred as a result of
malfunctioning of the internal scraper for the clarifier
unit. On the average both the TSS and VSS for the
clarifier effluent were maintained between 30 and 60 mg/l.
No solids were removed from the system during the first 30
days of operation, except those solids lost from the
clarifier effluent unit. During the next two experiments,
however, solids were wasted from the sludge wasting point;
the amount of wasted sludge depended on the sludge age
being maintained in the reactor.
82

0 ..>
.. z 0
I - ... ~ o MLSS <( 0::: 5000 t- • MLVSS ~ z w u 4000 z 0.....1 u, 3000 (/) O' oE -_J
0 2000
(/)
1000 0 w 0 z w a_ 0 i--~--~--~~--~---~--~--~~--~--~--~~---~----(/)
:::::> (/)
67 72 77 82 87 92 97 102 107 112 117
DAYS OF OPERATION
Figure 6.1.3 Areation Tank Suspended Solids During PAC/ AS Phase
122

<X> · ~
~ 1201-=-::~~~~~~~~~~~~~~~~~~~~~ o TSS
• vss <t er .,__ z w u z 8_J ' Cf) ca
oE
100
80
60
_J 0 (/) 40
0 w 0 z w CL (/)
::> (/)
20
Ot--~----..~~---....~~--.--~~-,--~~-.-~~-r--~---.r--~-i
31 36 41 46 51 56 61 66 71
DAYS OF OPERATION Figure 6.1.4 Clarifier Suspended Solids Effluent During Activated Sludge Phase

.. z 0 220 -
240l .. .... OTSS
<t •VSS a:: ....
z w 200 u Z...J o, UC' 160
00 en E (Jl
0 _J 120 0 en
80 0 w 0 z 40 w Cl. en 0 :::> en 67 72 77 82 87 92 97 102 107 112 117 122 127
DAYS OF OPERATION Figure 6 .1. 5 Claifier Suspended Solids Effluent During PAC/AS Phase

6.2 Biological Model
To c om e u p w i t h a m o d e 1 to d e s c r i b e th e b i o 1 o g i c a 1
growth in the AS under the conditions of complete mixing,
a typical scheme (shown in Figure 6.2.1) was examined.
The influent feed from a holding tank entered the aeration
tank and mixed with the recycled sludge from the
clarifier. The microorganisms were provided with refinery
industry wastewater as a substrate source. The pH was
kept in the range of 6.8 to 7.2 and the temperature was ' kept at 24°c. The dissolved oxygen concentration was in
the range of 5-6 mg/L and nutrients were added as needed.
Th e h yd r a u 1 i c r e t e n t i o n t i m e ( H RT ) w a s k e pt a t 4 h o u r s ;
wh i ch e stab 1 i shed a ML SS 1 eve 1 of 1 5 0 O t o 2 O O 0 mg IL ( 7 7) .
Biological activity in the reactor tank reduced the BOD 5
concentration, resulting in an increase in bacterial cell
numbers (or MLVSS) in the reactor. The solids in the
clarifier unit were concentrated in the bottom of the
clarifier. A fraction of the solids were recycled to the
reactor as a return sludge to keep a constant
concentration of MLSS in the reactor. Another fraction
was wasted from the system each day from the clarifier
underflow to maintain a sludge age of 3,6,9, and 12 days.
A mass balance for the biomass in the entire system
can be written as:
86

0.,Xo So INFLUENT
'
,------------1 I REACTOfll CLARIFll!fll I I I I I I I I I I
v.s.x
RETURN SLUDGE
+ Q, .x.s
I o,,x,,s, I
I I L ___ SYS!§.~~~~-______ _J
o..x •. s. EFFLUENT .
Ou,Xu,S.. SLUDGE
WASTING
Figure 6.2.1 Complete Mix Activated Sludge Model
87

Accumulation of biomass in the system
In fl ow of = biomass to
the system
Outflow of Net growth biomass from + of biomass the system the system
dX V Of
The equation for the biomass is:
(6.2.1)
Assuming that the biomass concentration in the influent is
zero and that a steady-state condition (dX/dt=O) is ' reached in the reactor, then Equation 6.2.1 becomes
0 =
or
r~ is an expression defined by Metcalf (48):
=
by definition, then the above equation becomes
1 V (Qe Xe + Ow Xw) = - Yrsu - kdX
Dividing both sides of Equation 6.2.4 by X yields
Since 1
= -x
88
(6.2.2)
(6.2.3)
(6.2.4)
(6.2.5)
(6.2.6)

By definition, then Equation 6.2.5 becomes
1 1J
c =
This equation can be rearranged to yield
vx (Q x + Q x )
e e w w
(6.2.7)
(6.2.8)
However, the biomass in the effluent is very small
compared to the biomass at other points in the system.
Th ere fore ,,
vx (6.2.9) Q x
w w
where Qc is called the mean cell residence time or sludge
age.
Another important parameter in the design and
operation of the reactor is the efficiency, defined as:
( s Eff y =
0 s )
e x 100% (6.2.10)
89

6.3 Biokinetic Constants
are
In a biological system where all environmental
provided the bacteria will increase in number.
needs
The
growth rate can be expressed as: (6.3.l)
dX = rg = uX
dt
Metcalf (48) showed that there are relationships
between substrate nutrients for the microorganisms to
grow. In a continuous culture, however, the growth of
microorgan\sms can be limited to show the limiting effect
of nutrients on substrate.
as follows:
u =
This growth can be described
(6.3.2)
When the activated sludge was operated under steady
conditions, the biological growth rate equaled the rate of
b i om a s s l o s s e s i n t h e e f fl u e n t a n d w a s t e s l u d g e . I f U i s
inserted as the symbol for specific substrate utilization,
-rsulX, in Equation 6.2.6 the equation becomes a
(6.3.3) = YU
At steady state conditions, the substrate utilization
rate, rsu• and the specific substrate utilization rate, U,
are constants and could be defined as:
So - Se =
Qh (6.3.4)
90

Thus,
u = = (6.3.5)
Substituting for U in Equation 6.3.3
yields
1 y (So-Se) kd
(6.3.6) =
QC eh x ' 1 (So-Se)
Plotting against one obtains a straight 1 in e Sc eh x
with slope Y and intercept kd.
The term um in Equation 6.3.2 can be defined as:
(6.3.7) Um = kV
If the value of u from Equation 6.3.1 is substituted
in Equation 6.3.2, the resulting expression for the rate
of growth is
(6.3.8)
Metcalf (48) showed that because of the quantity of
new cells produced for a given substrate, the following
relationships have been developed between the rate of
substrate utilization and the rate of growth as follows:
(6.3.9)
91

The terms rg in Equation 6.3.8 is substituted in
Equation 6.3.9; the rate of substrate utilization can be
defined as follows:
Um x s (6.3.10) rsu = -
y (Ks + S)
In Equation 6.3.10 the term um/ y i s replaced by the
term k ' and s equals to Se; then
(6.3.11)
Substituthng:
for rsu in Equation 6.3.11 gives
= (6.3.12)
Dividing both sides by x yields
So - Se k Se (6.3.13) =
9hX Ks + Se
Taking the inverse of Equation 6.3.13 gives
Qh x = +
So - Se
or
Qh x 1 1 = +
So - Se k k (6.3.14)
1 By plotting v s • one obtains a straight line
92

with slope Ks 1
and intercept k k
6.4 Determination of Kinetic Coefficients.
The value of the kinetic coefficient k, the maximum
rate of substrate u t i 1 i z a t i o n per u n i t mass of
microorganisms (day - 1 ) ; Ks, the half-velocity constant
(mg/L of BO D5 or COD or T 0 C) ; k d , the endogenous decay
' (day- 1 ) c o e f f i c i e n t , and y , the maximum y i e 1 d
coeffiencient (day -1) were determined for both the AS
experiment and the experiment in which PAC was added to
the AS. The procedure was to operate the reactor at
different MLVSS concentrations in the range of 1500 - 3000
mg/Lat several sludge ages (3, 6, 9, and 12 days) under
steady-state conditions. Temperature, pH, dissolved
oxygen concentration and 9 were held constant throughout
the experiments. The average values of 1) flow rates (Q),
2) influent BOD5 , COD and TOC as S0 , 3) effluent BOD 5 , COD
and TOC and as Se, and 4) the concentrations of the
biomass in the reactor as X were determined through
frequent measurements. From the data obtained, the sludge
age (Qc) was calculated by Equation 6.2.9 and U values
were ob ta i n ed by E qua ti on 6 • 3. 5 . By substituting these
values into Equations 6.3.6, and 6.3.14 the biokinetic
constants were determined.
93

6.5 Microscopic Analysis of Activated Sludge
6.5.1 Materials and Methods
A Zeiss photomicroscope was used at a magnification
level of 160X and a phase contrast of 40X/l .25 to examine
AS samples for the presence of microorganisms either
attached to other cells or as free swimmers in the
solution. Five samples (each about 2 ml) were collected
di rec t l y fr om the reactor and pl aced i n 5 ml t e st tube s .
rt was important to fill each test tube less than halfway '
to allow adequate air space. Immediately after
collection, the sample was analyzed, beginning with 160X
phase contrast microscopy, which requires only a small
volume of sample(< l ml). Each sample was pl aced on a
glass slide and covered with a thin glass cover; no
special preparation such as staining was required.
The sample was examined at a magnification of 160X for
the types, relative amounts, and growth of microorganisms
in the AS. No attempt was made in this study to estimate
the total number or the sizes of each microorganism.
6.6 Biogrowth on Powdered Activated Carbon (PAC)
The PAC surfaces are excellent sites for
microorganisms to grow on. The PAC surfaces enrich the
concentration of organic compounds as well as provide
94

excellent places for microorganisms to be protected from
fluid shear forces. As reported in previous studies, (30,
41, 80), biological growth on PAC improved the removal
efficiency of organic compounds found in refinery industry
wastewater. Thus, microorganisms in the reactor can
oxidize certain organic compounds on the surfaces of PAC
particles and this reduces the organic concentrations and
the organic loading on the carbon. Formation of a biofilm
on the carbon particles may affect the adsorption rate; ' therefore , the b i om as s may a c t as a b arr i er and , i n the
end, reduce the transport rate of dissolved organics to
the carbon surface (81). Scanning electron microscopy
(SEM) was used as a tool to examine the carbon particles
and to observe the relationships between the PAC and the
attached growth. Thus, one could observe the type of
organisms and the attachment structures that the organisms
could build on the carbon particles (82).
6.6.l Materials and Methods
In this experiment, PAC type BL (Calgon Corporation)
was used. (For more information, see Table 3.1.1). PAC
was added to the reactor in a slurry form. Carbon
particle samples were collected directly from the reactor
under conditions of complete mixing. At the time of
s am p 1 e c o 1 1 e c t i on , th e r e a c tor h ad PAC co n c en tr at i on s of
50 and 120 mg/L . No samples were collected for PAC
95

particles at a reactor concentrations of 10 mg/L, because
the biogrowth mass on the PAC particles was not abundant.
After collection, the carbon samples were removed and
fixed, as described below.
The col 1 ec ted samples were fixed and prepared for
scanning electron microscopy (30, 41, 80) The PAC
particles were immersed for two hours in 2 ml of a 70:30
mixture of 2.5% glutaraldehyde and pH 7.3 buffer solution.
The carbon' samples were then transferred into 0. 1 M sodium
phosphate buffer (pH 7.3) for one hour. Excess buffer
solution was removed from the PAC particle samples, but a
small amount was left to cover the specimen; the sample
was then kept in a refrigerator at 4°c until the next
step, fixation.
resuspended in 2%
phosphate buffer
The carbon particle samples were
smium oxide (Os0 4 ) in O.l M sodium
rl 7.3) for 3 hours. Then the PAC
particles were washed five time with ethanol (50, 70, 80,
90 and 100%). Sam p 1 e s were d r i e d i n a l : 1 1 O O % e th an o 1
amyl acetate solution and stored for 24 hours in
am y l a c e t a t e •
A DCP - L critical point dryer was used to dry the
fixed samples. Then the PAC particles were mounted on
aluminum stubs and coated with gold to increase the
conductivity of the biological materials. The PAC
Par t i c 1 e s am p 1 e s we r e e x am i n e d i n a s c an n i n g e 1 e c tr o n
microscope at 20-25 KV with a resolution of 10 nm. For
96

control samples (virgin carbon), the fixation, dehydration
and drying steps were eliminated; the carbon particle
samples were glued to the stubs and then coated with gold
(about 2nm thick) before SEM.
\
97

7. RE SUL TS
7 .1 Description and Evaluation of Biokinetic Constants
using the data from the reactor, plots were made to
determine the biokinetic constants of the refinery
industry wastewater. '
The biokinetic constants were defined in terms of
BOD 5 , COD and TOC. Each constant was obtained for the
first two experiments with AS alone at first and then with
the addition of PAC to the AS. The linearization of the
experimental data collected is presented in Figures A.2.1
- A.2.24 in Appendix 2. The data were scattered around
the best-fit line. This scattering of the data is typical
of this type of analysis. The lines were drawn using the
1 east square method. The straight-line analysis yielded
k, Ks, kd and Y according to Equations 6.3.6 and 6.3.14.
Table 7 .1.1 presents the biokinetic constants in
terms of BOD5 , COD and TOC, which are considered to be the
substrate concentration in the reactor. The MLVSS are used
as a measure of microbial solids concentrations. The
values of the biokinetic constants for the wastewater
(Table 7.1.1) were different from typical values (Table
7.1.2).
98

Table 7.1 .1 Biokinetic Constants for the Modified Activated Sludge Pilot Pl ant
constant Un its PAC Concentrations
(mg/L) coo
k day-1 0 2 2. 40 10 2 2.50 50 0.65 1.33
120 0.82 1.80 '
Ks mg/L B005 0 75 80 or coo 10 13 40
50 15 89 120 33 4
kd day-1 0 0. 42 o. 46 10 0 .14 o. 20 50 0.22 0.46
120 0. 28 0.04
y mg VSS per mg BO~ or
c 0 0 1.00 0.62 10 1.00 0.33 50 2.50 0.80
120 1.2 0.60
99
TOC
0 .18 1.0 0.75 0.64
7.2 24.0 30.0 16.0
0.59 0. 15 0.32 0.34
0.86 0.83 0.80 1.00

Table 7.1 .2 Typical Values for Biokinetic Constants for the Activated Sludge at 20°c (Ref no. 48).
constant Units Range Typical Value
k day-1 2-10 5.0
Ks mg/L BOD5 25-100 60 mg/L COD 15-70 40
kd day- 1 0.04-0.075 0.06
y m~ VSS/mg BOD5 0. 4 -0 .8 0.6 m VSS/mg COD 0. 25-0. 4 0.4
100

The AS res u l ts for k measurements fa l l s outs i de the
range. Ks tend to fall within the range of literature and
the values for kd and Y are higher than typical values.
The high value of Y suggests high rates of sludge
production. As can be observed in Table 7.1.l, biokinetic
c 0 n s t an t s c an d i f f e r fr om t y p i c al v al u e s f or t w o po s s i b l e
reasons; l) the biokinetic constant values depend on the
type of wastewater, and 2) the values of the biokinetic
constants'depend entirely on the operating conditions of
the reactor, such as temperature, sludge age and carbon
dosages (24).
PAC present in the reactor has an effect on the value
of the biokinetic constants. The presence of PAC can
reduce the concentration of the AS; therefore, the kinetic
values calculated with PAC would be less than the typical
literature values for AS without PAC additions. Also, the
biomass activity which occurs in the PAC pores is
control led by the substrate mass transfer into the pores
( 6 0) •
101

7 .2 Experiment 1: Activated Sludge Treatment Process
A series of experiments were carried out at sludge
ages of 3, 6, 9 and 12 days. Each experiment lasted at
least 5 days under steady state conditions. The hydraulic
retention time (HRT) was kept at 4 hours for the duration
of the test program. Ammonium sulfate and potassium
phosphate were added as nutrient sources (N and P).
Experiment 1 was conducted at a sludge age (Ge) of 3
days. Ta1'le 7.2.l summarizes the biological treatment
experimental findings when the MLSS was about 2,198 mg/L
and the ML VS S w a s ab o u t l , 3 O O m g I L . O th er p a r am e t er s s u c h
as NH 3 , N0 2 , N0 3 phosphate and oil/grease were determined.
Biological parameters were also determined for sludge
ages of 6, 9, and 12 days, (Tables 7.2.2-4, respectively).
These data show increases in the MLVSS and MLSS
concentrations as the sludge age increases. This is due to
1) increases in the activity of the biomass in the reactor
and 2) the fact that the amount of wasted sludge was less
than at a 3-day sludge age.
102

Tcble 7 .2. l BiolCX]ical Trea1rnent of !Efinery Iffiustry Waste\-.ater by ktivata:i SllP.Je, SlLClge Pge (0c) = 3 days (All corcertratioos ere in ITYJ/L)
SJ~rdoo Sol ids N-13 ~ NO:l Total ()'tho- Oil ard ~ease Fhosittate Fhosittate
-1~ ~- t-1..VSS tUS vss TSS Inft Efft Inft Efft Inft Efft Inft Efft Inft Efft Inft Efft
8/31 1 1,520 2,1~ 5 (i() 35 30 O.a:l 0.07 0.54 o.~ 3.0 0.17 2.a:l 1. 2'2 191 127 I-'
0 911 2 1,420 2,584 5 8 43 32 0.32 0.03 0.61 0.16 2.0 0.04 1.79 O.fi6 28 6 w
912 3 1,560 2,492 28 50 30 20 o. ;:B 0.02 O.a:l 0.07 3.0 0.02 2.44 0.43 33 7
913 4 1,300 2,370 9 10 24 8 0.46 0.02 1.32 0.38 0.94 0.67 0.27 0.20 61 15
914 5 1,300 2,1~ 5 18 30 7 a. ill 0.02 0.50 O.CE 0.2'2 O.a:l 1.50 0.15 81 8

...... C> ~
Table 7 .2.2 BiolOJical Treatment of !Efinery Iroustry waste\tiit.er by Pctivata:i SlilDJe, Slt.OJe ~ (Sc) = 6 days (All coocmtraioos ere in rng/L).
9J1Erda:1 9Jl ids ~3 ~ N°-3 Total FhosP'lat.e
()'tho- Qi l aro Q"ease FhosP'lat.e
1~ t-b. t1..VSS M...SS vss TSS Inft Efft In ft Efft Inft Efft Inft Efft Inft Efft Inft Efft
9/11 6 1,020 1,918 30 50 15 3 o.~ 0.13 0.77 o.~ 3.~ 0.58 1.88 0.27 52 30
9/12 7 1,620 2,640 40 50 20 8 0.40 0.10 0.11 0.20 3.76 0.40 1.32 0.32 54 46
9/13 8 1,120 2,250 40 48 23 10 0.50 0.16 0.32 0.00 3.11 0.04 0.10 0.01 68 61
9/14 9 1,480 2,674 30 56 32 21 0.60 0.14 1.49 0.65 3.25 0.62 0.46 0.38 65 28
9/15 10 1,5% 2,840 30 50 32 17 0.70 0.10 3.18 0.04 3.07 0.72 0.16 0.00 116 71

.. Table 7 .2.3 Biolcgical Treatment of !Efinery .Irriustry Wastevater by ktivata:I SllliJe, SllliJe Pge (Ge) = 9 days
(All concentratioos ere in mg/L).
Su~rda:l Sl l ids ttl3 N°'z N0:3 Total ()'tho- Oil ard Q"ease RlosJilate RlosJilate
1~ It>. M...VSS M...SS vss TSS Inft Eff t In ft Efft Inft Efft Inft Eff t In ft Efft Inft Efft
- 9120 11 1,500 2.~ 20 ~ 44 30 0.00 0
0.04 1.al O.fi8 1.35 0.70 0.14 0.12 ~ 21 (JI
9/21 12 1,760 3,000 30 40 40 33 0.18 0.04 0.16 0.02 4.62 0.76 2.64 1.~ 50 19
9/22 13 1,500 3,300 15 35 15 3 0.12 0.02 0.00 0.16 4.14 0.28 2.64 1.14 92 it)
9123 14 1,540 3,460 5 20 20 1 0.16 0.02 0.40 0.03 3.16 0.01 1.18 1.51 15 3
9/24 15 1,640 2,220 5 15 10 1 O.al 0.14 1.36 0.72 5.~ 0.48 3.ro 1.00 62 27

.. Table 7 .2.4 BiolCXJical Trea1rnent of !Efinery Irdustry Waste.....ater by Jlctivatro Sll.d]e, Sll.d]e /lge (Qc) = 12 days
(All corx:entraioos a--e in mg/L).
SuJErdw s:>l ids ~ ~ N~ Total ()'tho- Qi l ard Q"ease fblsrflate fblsrflate
1~ tt>. t1..VSS t1..SS vss TSS Inft Efft In ft Efft Inft Efft Inft Efft Inft Efft Inft Eff t
...... 9129 16 1,580 1,000 50 100 13 1 O.t6 0.20 1.12 O.fiO 3.14 0.07 1.50 0.52 15 2 C>
°' 9130 17 1,596 1,850 50 110 11 0 0.36 0.01 0.57 0.48 3.63 0.65 2.40 1.18 63 3J
10/1 18 1,920 1,940 5 20 12 1 O.fiO 0.04 1.04 O.fiO 1.52 0.01 1.fiO 0.42 10 3
10/2 19 1,960 2,672 28 50 50 34 0.36 0.04 0.77 0.39 2.21 0.35 1.53 0.44 18 1
10/3 20 2,040 2,890 50 81 43 42 0.04 0.02 1.10 0.50 1.12 0.10 1.47 O.:ll 45 12

Tables 7.2.5-8 show the calculated results of
experiment 1. The BOD5 concentration in the effluent was
in the average of 24 mg/L, giving a reduction in Boo5 of
about 80%. Figure 7.2.l shows the variation in the
influent and effluent BOD5 concentrati ans throughout the
test period. In general, the reduction in soo5 was about
80%. Even though the experiment was run at different
sludge ages, the reduction in the Boo5 concentration was
almost the same. This demonstrated that typical biological '
treatment will remove approximately 80% soo 5 for this
waste. A greater reduction would be seen if the influent
soo 5 concentration was consistent during the test period.
The variation in the feed composition will affect the
biomass activities to reduce soo5 concentration. However
if the feed composition was low, the percent of soo 5
removal would be high, and all substrate utilization would
occur in the reactor. Another factor which can contribute
to lower soo5 removals is the oxygen demand exerted by
high concentrations of organic pollutants.
Figure 7.2.2 shows the changes in the strength of TOC
throughout the test period. The decline in TOC strength
could be a result of concentration reduction in chemical
c om po u n d s i n the st o red i n d u s tr i a 1 w a stew a t er . As c an b e
seen from the results shown in Tables 7.2.5-8, biological
treatment could achieve as high as 80% reduction with a
TOC concentration in the effluent of less than 25 rng/L.
107

Table 7. 2.5 Activated Sludge Performance in Ex per imen t 1 Sludge Age ( Qc) = 3 days
BOD5 COD TOC
Run In ft Efft Ef f y In ft Ef ft Ef f y In ft Efft Ef f y No. (mg/L) (mg/L) (%) (mg/L) (mg/L) (%) (mg/L) (mg/L) (%)
160 88 45 356 90 75 47 15 68
2 183 22 88 329 78 76 39 15 62
3 150 ?J 82 522 100 80 50 18 64
4 160 22 86 380 80 79 48 13 73
5 147 21 86 313 52 83 41 14 66
Table 7.2.6 Activated Sludge Performance in Experiment 1 Sludge Age (8c) = 6 days
BOD5 COD TOC
Run In ft Efft Effy In ft Efft Effy In ft Efft Effy No. (mg/L) (mg/ L) (%) (mg/L) (mg/L) (%) (mg/L) (mg/L) (%)
6 200 25 88 353 81 77 38 16 58
7 142 26 82 290 78 73 54 25 54
8 144 20 86 386 70 82 53 21 60
9 121 15 88 333 60 82 49 13 74
10 126 10 92 288 61 79 56 25 55
108

Table 7.2.7 Activated Sludge Performance in Experiment 1 Sludge Age (9c) = 9 days
BOD5 COD TOC
Run In ft Ef ft Ef f y In ft Efft Ef f y In ft Efft Eff y No. (mg/ L) (mg/L) (%) (mg/L) (mg/L) (%) (mg/L) (mg/l) (%)
11 82 11 87 292 58 80 45 12 73
12 100 20 80 310 71 77 30 11 63
' 13 135 16 88 354 79 78 31 11 65
14 173 16 91 294 60 80 42 10 76
15 151 15 90 300 67 78 62 15 76
Table 7 .2.8 Activated Sludge Performance in Experiment 1 Sludge Age (Qc) = 12 days
BOD5 COD TOC
Run In ft Ef ft Ef f y In ft Efft Ef f y In ft Efft Ef f y No. (mg/L) (mg/L) (%) (mg/L) (mg/L) (%) (mg/ L) (mg/L) (%)
16 203 19 90 360 .50 89 40 9 78
17 170 15 91 328 54 84 42 10 76
18 139 15 89 353 48 86 53 12 77
19 140 16 89 337 50 85 40 9 78
20 148 10 93 372 48 87 40 10 83
109

300 SLUDGE AGE
I I 8 =9 DAYS I 8= 12 DAYS _J ~ec=3 DAYS I Bc=6 DAYS c I C
' 250 I O"
E I .. ... '
z 200 0 -r-<( 0:: 150 r-z ....... w .......
C> u z 100 0 u
IO
0 50 0 I EFFLUENT m
0 31 36 41 46 51 56 61 66 ...
DAYS OF OPERATION
Figure 7.2.1 BOD5 Removal b y Activated Sludge

SLUDGE AGE
_J ~c=3 DAYS I 8c=6 DAYS : 8c= 9 DAYS : 8c= 12 DAYS
' 100 I I I O'
E I I .. I .. I
z 80 I I I 0 I I I -~ I I I 0:: . 60 I I
"' ..,_ INFLUENT · - I
z t--' w t--' u t--' z 40
0 u u 0
20 I EFFLUENT
..,_
0 . 31 36 4 1 46 5 1 56 61 66
DAYS OF OPERATION Figu re 7 .2.2 TOC Remov a l by Activat e d Sludge

Figure 7.2.3 illustrates the variation in the
influent and effluent COD concentration throughout the
activated sludge experiment. Tables 7.2.5-8 present COD
concentrations through the AS experiments at various
sludge ages (3,6,9 and 12 days) respectively. The table
shows that the reduction in COD concentration ranged from
70% to 89%. With this level of reduction, the effluent
concentration is still above 50 mg/L which is
. ' unsatisfactory. The reason would be the changes in the
strength of the feed as a result of combined chemical and
biological oxidation of the stored wastewater.
Tables 7.2.9-12 show the priority pollutants removal
by AS treatment. With a high concentration of organic
compounds in the feed flow, the AS treatment was able to
remove on the average for 2,4-dimethylphenol, fluorene,
naphthalene and pyrene are 90%, 77%, 68% and 67%,
respectively. The reduction in the priority during
various sludge ages were shown in Appendix 3. These data
showed that the effluent quality remained almost steady
even though the system was not being fed at constant
effluent concentration.
Tables 7.2.13-16 present data on the priority
pollutants removed by AS treatment at various sludge ages
(3,6,9, and 12 days), respectively. These pollutants are
benzene, chloroform, ethyl benzene, toluene, m-xyl ene and
1-12

,_. ,_. w
_J
' en E .. z 0 -~ a::: 1-z w u. z 0 u 0 0 u
SLUDGE AGE 600 I
8c=3 DAYS I 8c=6 DAYS ; 8c= 9 DAYS
500
400
300
200
100
I I I I
INFLUENT I I I I I I
EFFLUENT I
I . I
I I I I
,
8c=12 DAYS
0 r-~-.~..__.--~----r--J.-~.,...-~---r-1-~...,.-~---1 31 36 41 46 51 56 61 66
OAYS OF OPERATION
Figure 7.2.3 COD Removal by Activated Sludge

Table 7.2.9 Priority Pollutants Removal by Activated Sludge, Sludge Age (Sc)= 3 days ,.
2,4-Dimethlphenol Fluorene Naphthalene J:1.rene
Date Run Inft Efft Eff y Inft Ef ft Eff y In ft Efft Effy In ft Efft Eff y 1986 No. ( ug/ L) ( ug/ L) (%) (ug/L) (ug/L) (%) (ug/L) (ug/L) (%) (ug/L) (ug/L) (%)
8/31 l 570 27 95 139 30 78 33 19 42 27 ND >63 ...... ...... 911 2 533 33 94 133 10 92 300 11 96 28 ND >64 ~
9/2 3 100 33 67 20 ND >50 40 20 50 20 ND >50
9/3 4 260 27 90 40 10 75 40 9 78 24 ND >58
9/4 5 267 20 92 27 11 60 92 18 80 26 ND >62
ND= None detectable, detectability >10 ug/L

Table 7 .2.10 Priority Pollutants Removal by Activated Sludge, Sludge Age (Sc) = 6 days
2,4-Dimethlphenol Fluorene Naphtha 1 ene ..!2_rene
Date Run In ft Ef ft Eff y In ft Efft Ef f y In ft Efft Eff y In ft Efft Eff y 1986 No. ( ug/L) ( ug/L) (%) (ug/L) (ug/L) (%) ( ug I L ) ( ug I L ) ( % ) (ug/L) (ug/L) (%)
9/11 6 1,887 300 84 67 10 85 300 10 97 30 10 67 ......
9112 ...... 7 333 27 92 27 ND >63 198 ND >97 27 11 60 (..11
9113 8 334 73 78 53 ND >81 1,000 33 97 27 12 56
9114 9 1 ,667 266 84 33 13 61 133 10 92 29 10 66
9115 10 867 133 85 37 12 68 200 33 84 30 12 60
ND= tt>ne detectable, detectability >10 ug/L

Table 7.2.10 Priority Pollutants Removal by Activated Sludge, Sludge Age (Sc)= 6 days
2,4-Dimethlphenol Fluorene Naphthalene _!2rene
Date Run In ft Efft Ef f y In ft Ef ft Eff y In ft Efft Effy In ft Efft Ef f y 1986 No. { ug/ L) ( ug/L) (%) (ug/L) (ug/L) (%) (ug/L) (ug/L) (%) ( ug I L ) ( ug I L ) ( % )
9/11 6 l ,887 300 84 67 10 85 300 10 97 30 10 67 - 9112 27 92 27 ND >63 198 ND >97 11 - 7 333 27 60 <.Tl
9113 8 334 73 78 53 ND >81 1,000 33 97 27 12 56
9114 9 1,667 266 84 33 13 61 133 10 92 29 10 66
9115 10 867 133 85 37 12 68 200 33 84 30 12 60
ND= t-Dne detectable, detectability >10 ug/L

Table 7.2.11 Priority Pollutants Removal by Activated Sludge, Slud~e Age (Be)= 9 days
2,4-Dimethlphenol Fluorene -- Naphthalene _!1rene
Date Run In ft Efft Eff y In ft Efft Eff y In ft Efft Ef f y In ft Efft Eff y 1986 No. ( ug/L) ( ug IL) (%) (ug/L) (ug/L) (%) (ug/L) (ug/L) (%) (ug/L) (ug/L) (%)
9/20 11 1 , 140 73 94 35 17 51 147 20 86 13 ND >30 ...... ...... °' 9/21 12 440 20 95 133 24 82 280 21 93 32 13 60
9/22 13 387 27 93 153 17 89 280 23 92 32 13 60
9/23 14 1,000 33 97 80 13 84 200 23 89 13 ND >20
9/24 15 1 ,090 146 87 167 23 86 1 ,200 127 89 12 ND >17
ND = None detectable, detectability >10 ug/L

Table 7.2.12 Priority Pollutants Removal by Activated Sludge, Slut1ge Age (Qc) = 12 days
2,4-0imethlphenol Fluorene Naphthalene ..!2'._rene
Date Run In ft Efft Eff y In ft Efft Ef f y In ft Efft Effy In ft Efft Effy 1986 No. ( ug/L) ( ug/ L) (%) (ug/L) (ug/L) (%) (ug/L) (ug/L) (%) (ug/L) (ug/L) (%)
9/29 16 547 25 95 17 4 40 77 933 33 96 41 14 66
...... 9130 17 404 27 93 207 40 81 l ,533 27 98 27 12 56
...... -....I
10/l 18 217 17 92 247 41 83 1,867 33 98 27 15 44
10/2 19 492 24 94 400 23 94 l ,867 27 99 110 13 88
10/3 20 613 33 95 320 40 88 2,268 43 98 100 14 80

Table 7 .2.13 Volatile ()'gc¥1ics ltin01al by ktivaterl SlLdge Trea1ment, Slu:1ge fJge (~) ;; 3 days
~ene 01l<rofCl1Tl Ethyl benzene Toluene n.-Xylene er Xylene
[)ate IUl In ft Efft Effy Inft Efft Eff y Inft Efft Effy Inft Efft Effy Inft Efft Effy Inft Efft Eff y 1986 ~. (tg/L) (tg/L) (%) (tg/L) (tg/L) (%) ( tg/L) ( tg/L) (%) (tg/L) (tg/L) (%) ( tg/L) ( tg/L) (%) (tg/L) (tg/L) (%)
8/31 1 1,Lm ND >99 ~ 30 97 125 ND >92 LOO ND >95 530 ND >~ 720 t{) >99
...... 9/1 2 330 t{) >97 460 25 95 10 t{) ND 220 t{) >98 640 t{) >98 500 t{) >~ ...... co
9/2 3 640 ND >~ 730 60 92 00 ND >88 620 t{) >~ 200 ND >~ 370 t{) >'JI
9/3 4 980 ND >99 1,440 80 94 250 t{) >~ 1,000 t() >99 400 t() >98 560 t() >~
9/4 5 1,956 20 100 1,691 120 93 460 ND >~ 1,767 65 >~ 700 t{) >99 ~ t{) >99
ND= t-bne detectable, detectt>ility >10 tg/L

Table 7.2.14 Volatile ()'ganics Jenoval by flctivata::t Slui]e Treatnent, Slui]e f(_Je (Etl = 6 days
~ene Ollcrofoon Ethyl benzene Toltene ~Xylene o-Xylene
l)i te IUl In ft Efft Eff y Inft Efft Effy Inft Efft Effy Inft Efft Effy Inft Efft Effy Inft Efft Effy . 1986 tt>. (LIJ/L) (LIJ/L) (%) (LIJ/L) (LIJ/L) (%) (LIJ/L) (LIJ/L) (%) (LIJ/L) (LIJ/L) (%) (LIJ/L) (LIJ/L) (%) (LIJ/L) (LIJ/L) (%)
9/11 6 1,761 ND >99 1,%2 ND >99 210 ND >% 1,2<.E ti) >99 600 ti) >~ 780 ti) >99
,_. 9112 7 120 ND >92 1,000 tf) >99 100 t{) >~ 120 t{) >92 300 t{) >97 200 t{) >% ,_. l.O 9/13 8 %() ND >99 1,718 40 ~ 300 ND >97 910 ND >99 500 t{) >~ 610 t{) >~
9/14 9 840 ND >99 1,624 180 89 300 t{) >97 870 t{) >99 500 t{) >~ 630 t{) >~
9/15 10 1,1]) ND >99 1,780 70 96 410 ND >~ l,2itl t{) >99 ~ ti) >99 1322 t{) >99
ND= tt>ne detec~le, detec~ility >10 LIJ/L

Table 7 .2.15 Volatile ()'ganics !eroJal by Jlctivata:l Shdge Trea1rnent, Sl~e f{Je (Ser= 9 days
lEnzene Ollcrofonn E t.h l'. l benzene Tohene m-Xl'.lene o-Xylene
~te ~ Jnft Efft Eff y Jnft Efft Eff y Jnft Efft Effy Jnft Efft Effy Jnft Efft Effy Jnft Efft. Effy . 1986 ~. (Lg/L) (Lg/L) (%) (Lg/L) (llJ/L) (%) (Lg/L) (Lg/L) (%) (Lg/L) (Lg/L) (%) (Lg/L) (llJ/L) (%) (Lg/L) (Lg/L) (%)
9120 11 620 ND >~ 1,7ffi 158 91 fl() ND >83 4fiO t{) >~ 310 t{) ><JI 4fiO tf) >~
...... 9/21 12 8~ ND >99 1,212 10 99 220 t{) >95 640 ND >~ 360 t{) >97 4fiO tf) >~ N 0 9/22 13 210 ND >95 1,744 00 95 fl() t{) >83 120 ND >92 100 tf) >~ 10 tf) ND
9/23 14 247 t{) >96 2,072 66 <JI ~ tf) >99 233 t{) >96 1,097 tf) >99 1,475 tf) >99
9/24 15 709 ND >99 1,877 ND >99 640 ND >~ 616 tf) >~ 7fi0 tf) >99 ~ tf) >99
ND= ~ne detecta:>le, detecta:>il ity >10 Lg/L

Table 7.2.16 \tllatile (Tgaiics Jenoval by Jlctivata:l Slujge Treatment, Slujge Pge (Be)= 12 days ..
~ene Ollcrofonn Ethyl benzene Toluene m-Xylene a-Xylene
Date IUl Inft Efft Eff y Inft Efft Effy Inft Efft Effy Inft Efft Effy Inft Efft Effy Inft Efft Effy 1986 t«>. (t.g/L) (t.g/L) (%) (t.g/L) (t.g/L) (%) (t.g/L) (t.g/L) (%) (t.g/L) (t.g/L) (%) (t.g/L) (t.g/L) (%) (t.g/L) (t.g/L) (%)
t--' 91'29 16 2,219 ND >99 1,<})4 <}) 95 408 ND >~ 1,550 t{) >99 750 t{) >99 930 t{) >99 N t--'
9130 17 1,976 t{) >99 2,054 300 ffi 500 t{) >98 1,450 t{) >99 920 t{) >99 1,000 t{) >99
1011 18 1,620 ND >99 2,043 00 % 600 ND >99 1,3«) t{) >99 1;337 t{) >99 1,520 t{) >99
10/2 19 970 ND >99 1,834 10 99 820 t{) >99 480 t{) >~ 750 t{) >99 1,040 t{) >99
10/3 20 4<}) ND >98 1,637 40 98 220 ND >95 400 ND >~ 340 t{) >97 440 t{) >98
ND= t«>re detectable, detectability >10 t.g/L

o-xylene. These compounds found to be air stripped from
the reactor by the air f 1 ow ( Section 7. 5) . There were no
increases in the percentage removals of the volatile due
to the AS.
'
122

7. 3 Experiment 2: Activated Sludge with Powdered Activated Carbon
To enhance the AS process, PAC was added to the
reactor tank in various concentrations over a period of 5
weeks. The PAC concentrations that were maintained in the
AS reactor were 10, 50, and 120 mg/L.
The additions of PAC into the reactor resulted in
c h a n g e s i n t h e M L V S S c o n c e n tr a t i o n fr om t h o s e me a s u r e d i n
the AS process without PAC (experiment 1).
results are '
shown in Tables 7.3.1-12. A 11
The MLVSS
add i ti on s of
PAC resulted in increases in the MLVSS from those measured
for the AS without PAC. At a gc of 3 days, and PAC
concentrations of 10 mg/L, 50 mg/L, and 120 mg/L there was
an initial increase in the MLVSS concentration up to a PAC
concentration of 50 mg/L and a slight decrease at 120
mg/L. For all of the other 9c values (6, 9, and 12 days)
and all PAC concentrations, the MLVSS at first increased
over the AS values and then showed a decrease as the PAC
concentrations increased.
The concentrations of selected nutrients (nitrogen
and phosphorus) in the influent and effluent were
measured three times per week and these values are
presented in Tables 7.3.1-12. The influent concentrations
of the nutrients were high enough to satisfy the biomass
requirements as reported in reference (75).
Oil and grease concentrations in the influent and
123

Table 7 .3.1 ktivatro Sh.dge ard me A:!rfCl1TliflCes in Bq::eriment 2 \'then E\: = 3 days ard me = 10 rrg/L, All Corc01tratioos ere in rrg/L. "
SJs~rda:i ~lids ~3 ~ N°-3 Total ()'tho- Oil PhosP,ate PhosP,ate aoo Grease -- - - -
r::Bte 1W ~oc:tor Effluent
1986 ~. M...VSS M...SS VSS TSS Inft Efft Inft Efft Inft Efft Inft Efft Inft Efft Inft Efft ,.__. N ~
10/16 21 1 ,500 2, 100 11 85 54 43 0.()5 0.01 1.52 0.28 0.25 0.()5 0.14 0.04 29 9
10117 22 1,600 2,700 20 90 30 24 0.04 0.03 0.78 0.20 0.42 0.18 0.22 0.18 29 10
10118 23 l ,740 2,032 11 100 51 41 0.02 0.01 1.04 1.02 0.42 0.()5 0.16 0.14 29 10

Tcble 7 .3.2 Jlctivatro SI Ldge am Fr\C Ferfonn<rlces in Exia-tnent 2 W'len E\: = p days and Fr\C = 10 ng/L, All Corcentratioos <re in f11J/l.
9Js1Erda:1 ~lids f'li3 ~ N°.J Total ()'tho- Oil Phos~ate Phos~ate and Grease -- - - -
Dite Im IE~ta Effluent
1986 t«l. t-1..VSS t-l.SS VSS TSS Inft Efft Inft Efft Inft Efft Inft Efft I11ft Efft Inft Efft
...... 10/20 24 2,220 3,CXXl 12 ffi 37 30 0.00 0.01 0.48 0.06 0.14 0.07 0.12 0.06 62 4) N (J1
10121 25 2,920 3,314 15 30 51 44 0.10 0.03 0.07 0.01 0.30 0.01 0.28 0.09 115 14
10/22 26 2,800 3,6~ 35 64 fl() 30 0.07 0.04 0.36 0.12 1.0 0.03 0.31 0.12 ffi 4

Table 7 .3.3 Activate::! Sl u:ige tni F¥\C Fe-fonn<n:es in ExjErl'nent 2 \tilen 8c: = 9 days ard F¥\C = 10 ITTJ/L, All Corcffitratioos ere in ITTJ/L. .. ~!Erd~ ~lids ~3 ~ N~ Total ()'tho- Oil
PhosP'late PhosP'late and Grease - - -rute !W IE~tcr EfflL101t
1986 No. t-t.VSS K.SS VSS TSS Inft Efft Inft Efft Inft Efft Inft Efft Inft Efft Inft Efft
10126 27 3,00J 3,ax:l 11 ffi 70 50 0.11 0.03 1.94 l.q) 1.0 0.02 0.24 0.00 47 19 ...... N O'I 10/27 28 3,750 3,700 5 lffi 64 50 0.16 0.02 2.0 1.20 0.60 0.16 0.29 0.19 43 9
10/28 29 3,020 3,270 15 ffi 33 23 0.13 0.02 2.17 2.04 0.28 0.14 0.14 0.10 55 28

Tcble 7 .3.4 Activata:l Sll.dge ard F¥\C ~rfonnillCes in Exr.erinent 2 \tilen 9c: = 12 days ard F¥\C = 10 rrg/L, All r.orx:entratioos a--e in rrg/L. ..
&is~rda:1 ~lids tfi3 NO.z N°-3 Total ()'tho- Oil PhosJ)'late PhosJ]'late ard Grease -- - - -
[)lt.e ~ ~a::: tor Effluent
1986 t-b. M...VSS M...SS VSS TSS Inft Efft Inft Efft Inft Efft Inft Efft Inft Efft Inft Efft
...- 11/l 30 3,022 3,540 91 210 22 16 0.02 0.01 2.92 0.61 1.41 0.16 0.14 0.10 55 28 N -....J
1112 31 2,922 3,620 35 44 17 13 O.ffi 0.01 2.0 0.40 0.38 0.07 0.24 0.22 102 99
11/3 32 2,4l0 3,326 5 125 21 17 0.04 0.02 0.73 0.52 0.34 0.28 0.3) 0.18 35 11

Table 7 .3.5 ktivat.a:l Slldge ard F¥\C ~rfoomn:es in txp:!dnent 2 \'hen E\; = 3 days and F¥\C = 50 ITTJ/L, All Qm:entratioos <re in RYJ/L. ,
Susp:!rdoo ~lids ~3 N°'l Nl3 Total ()'tho- Oil Phos(ilate Phos(ilate ard Grease -- - - -
[Bte IUl ie<l:tcr Effluent
1986 tt>. K..VSS t1..SS VSS TSS Inft Efft Inft Efft Inft Efft Inft Efft Inft Efft Inft Efft
~ 11/5 33 2,800 2,920 20 ffi 26 N
22 0.72 0.52 4.16 2.56 1.78 0.l() 0.09 O.ffi ffi 37 CX>
11/6 34 2,520 2,660 47 150 28 20 0.18 0.12 2.24 l.04 1.26 0.12 0.20 0.09 43 32
11/7 35 2,334 2,000 45 lffi 24 19 1.0 0.11 1.68 1.28 0.22 0.02 0.18 0.10 14J 44

Table 7 .3.6 ktivat.00 Sh.dge and R\C FerfonnillCe in Exi:a-inent 2 Wien ~ = 6 days and R\C = 50 lllJ/L, All Cbrcentratioos ere in rrYJ/L. ,
Sus~rdoo S>l ids tfl3 N°'z N~ Total er tho- Oil PhosP'late PhosP'late and Grease -- - - -
i:nte ~ ~cr::tcr Effluent
1986 r-b • t-1.. vss t1.SS VSS TSS Inft Efft Inft Efft Inft Efft Inft Efft Inft Efft Inft Efft
11/10 36 2,440 2,920 5 25 26 22 1.0 0.24 1.92 0.16 La> 0.10 O.a> 0.16 61 25 ...... N l.O
11/11 37 2,140 3, 168 20 21 29 22 0.40 0.34 1.60 0.80 1.25 0.17 0.30 0.23 91 49
11112 38 2,2.:11 3,300 10 22 26 24 o.ro o.44 1.92 l.ro 1.ro 0.12 0.24 0.10 21 16

Table 7.3.7 fctivat.a:t Sh.dge <rd R\C F€rfCl1TlillCes in E>q:.ertnent 2 'fllen E\: = 9 days aro R\C = 50 rrg/L, All Coocentratioos ere in ~/L. ,.
SJs~rded ~1 ids ~3 N~ N°-3 Total ()'tho- Oil PhosJilate PhosJilate aro Grease -- - - -
03.te IUl reoct.a Effluent
1986 It> • It. vss It.SS VSS TSS Inft Efft Inft Efft Inft Efft Inft Efft Inft Efft Inft Efft
...... 11/16 39 3, 160 3,636 100 160 35 10 0.13 0.10 2.0 O.al 1.12 0.11 0.34 0.10 53 18 w 0
11/17 40 2,200 2,760 al 80 33 22 0.16 0.14 1.8 0.60 1.28 0.14 0.48 0.15 40 37
11/18 41 2,440 3,134 10 70 24 11 0.16 0.12 2.43 1.71 1.43 0.4J 0.48 0.24 92 42

....... w .......
Table 7 .3.8 h:tivata:i Shlige aro ~C Ferforma1Ce in Ex~dnent 2 Wien E\; = 12 days am ~C = 50 ng/L, All Corx:entratioos ere in m;:i/L. ..
~s~rrla:J ~lids tfl3 N~ N£3 Total er tho- Oil Phosiflate Phosiflate and Grease -- - - -
[):lte rw Jeoctcr Effluent
1986 No. t-1..VSS K.SS VSS TSS Inft Efft Inft Efft Inft Efft Inft Efft Inft Efft Inft Efft
11/21 42 3,020 3,568 35 40 29 18 2.15 1.52 2.24 2.00 1.26 0.18 O.al 0.10 92 ()
11/21 43 2,480 3,274 30 36 30 20 3.10 l.41 2.08 l.44 1.14 0.08 0.62 0.10 "' 19
11/23 44 2,140 3,676 59 60 102 83 2.10 l.ff> 2.64 2.48 1.44 0.83 0.62 0.15 14 11

Tcble 7 .3.9 Jll:tivat.00 Slt.dge am PAC ~rfCl1Tltn:es in ExJ:Eriment 2 W'len ~ = 3 days ard PAC = 120 ng/L, All Cbrcmtratioos ere in nYJ/L. ,
SlsJ:Erdoo ~lids ~3 NCl.z N~ Total ()'tho- Oil Phosrfiat.e Phosrfiat.e ard Grease -- - - -
[)it.e ~ ie<l:Ur Efflt101t
1986 ~. K..VSS It.SS VSS TSS Inft Eff t Inft Efft Inft Ef ft Inft Efft Inft Efft Inft Efft
-11/26 45 2,00) 2,754 24 45 77 70 1. t:B 0.18 2.62 2.06 1.32 0. al 0.77 0.08 28 20
...... w N
11127 46 2,380 2,620 3 5 74 62 1.04 0.11 1.68 0.36 1.42 0.40 0.96 0.16 58 13
11/28 47 2,2ro 3,788 5 18 57 39 1.84 0.08 3.76 1.4) 1.:E 0.34 O.ffi 0.15 27 21

Table 7 .3.10 Jll::tivata:l Shdge ard 1¥\C Ferf()1T)CllCes in ExJEr1nent 2 vilen 9c: = 6 days ard 1¥\C = 120 JTg/L, All CDocentratioos ere in JTg/L. ..
~~rdoo ~lids ~3 ND.z N°.J Total er tho- Oil PhosP,ate PhosP,ate and Grease -- - - -
Dite ~ !Eoctcr Effluent
1986 ~. K.VSS K.SS VSS TSS Inft Efft Inft Efft Inft Efft Inft Efft Inft Efft Inft Efft
..... 1211 48 2,200 2,700 15 20 54 30 1.00 0.00 2.72 1.00 2.54 0.48 1.00 0.10 27 21 w w
12/3 49 2, 100 2,400 5 80 31 20 0.52 0.13 3.4 0.75 2.58 0.56 1.0 0.18 23 8
12/4 50 2,axl 2,450 5 20 31 20 2 • .:tl 0.07 2.~ 1.00 2.fi6 0.58 0.94 0.00 31 14

...... w ~
Tct>le 7 .3.11 Activatat Sll.dge ard PAC FerfCl1Tlaices in E>q:er1nent 2 W'len f\:; = 9 days ard PAC= 120 rtg/L, All Qm::entratioos ere in 111J/l. ,
SJsi::erda:t S:>l ids ~3 ~ N°-3 Total CT tho- Oil Fllosjilate Fllosjilate ard Grease -- - - -
Olte ~ ieoctcr EfflUEJlt
1986 rt>. t1..VSS K.SS VSS TSS Inft Efft Inft Efft Inft Efft Inft Efft Inft Efft Inft Efft
12n 51 1,000 2,350 5 10 34 16 0.00 0.22 3.52 2.16 2.itl 0.56 l .itl 0.15 25 17
12/8 52 1,894 2,400 12 20 25 14 0.12 0.10 2.40 1.20 1.5 0.64 o.92 o.~ 17 12
12/9 53 2,200 2,648 5 15 24 11 0.32 0.(13 2.24 0.92 1.48 0.44 0.24 0.10 15 10

T<Dle 7 .3.12 Pctivat.00 Sll.dge ard PAC FerformC11Ces in ExjErtralt 2 W'len 9c = 12 days and PAC= 120 ng/L, All O:m::mtratioos ere in nYJ/L. ,
-SlsJEn:loo ~lids tfi3 N~ N~ Total lrthcr Oil
PhosJi'late Phosi:nate and Grease -- - - -[)}te IUl ieoctcr EfflUEJ1t
1986 No. t-\.VSS t1.SS VSS TSS Inft Efft Inft Efft Inft Efft Inft Efft Inft Efft Inft Efft
12112 54 2,lm 2,L1Xl 15 2B 21 8 0.12 o.~ 3.44 1.66 1.58 o.44 l.2> 0.()5 21 15 ..... w U"I
12/13 55 2,100 2,500 11 40 24 7 0.12 o.o9 3.76 2.00 2.25 o.~ 0.91 0.06 21 10
12115 56 2,694 2,q)O 5 40 26 11 0.34 0.26 4.00 3.04 2.79 0.35 0.91 0.07 27 26

effluent were al so measured 3 times each week and are
reported in Tables 7.3.1-12. The influent oil and grease
concentrations were below the levels found to be toxic
(100 mg/L) by other researchers (75).
BOD5 removals were enhanced by PAC additions. The
PAC concentration present in the AS reactor did not appear
to effect the percentage removals of BOD 5 . A
concentration of 10 mg/L of PAC enhanced BOD 5 removals
within the AS reactors about as well as a PAC
' concentration of 50 or 120 mg/L. With the exception of a
PAC concentration of 10 mg/L which showed a slight
improvement in BOD5 removals as 9c increased, there was no
significant increase in the removal percentages as 9c was
increased to 12 days. This data is presented in Tables
7.3.13-24. The influent and effluent concentrations versus
day of operation are plotted in Figures 7.3.1-7.3.3. The
effluent percentage removals versus Qc are plotted in
Figure 7. 3. 4.
COD removals were improved, compared to AS, by the
additions of all concentrations of PAC. With the
exception of Qc equal to 3 days, the highest percentage
removals were at a PAC concentration of 10 mg/L. For all
9c values, the lowest percentage removals of COD occurred
at a PAC concentration of 50 mg/L. As 9c increased, the
percentage removals of COD increased, with the exception
of a PAC concentration of 120 mg/L, in which case there
136
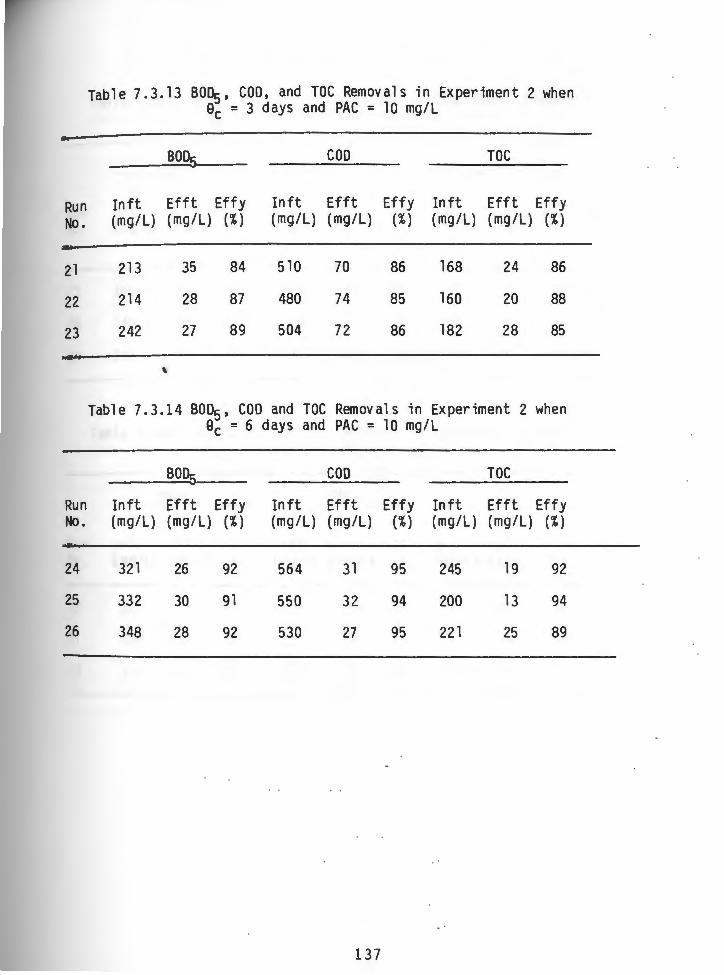
Table 7.3.13 BO~, COD, and TOC Removals in Experiment 2 when Elc = 3 days and PAC = 1 O mg/L
B005 coo TOC
Run In ft Efft Ef f y In ft Efft Effy In ft Ef ft Ef f y No. (mg/L) (mg/L) (%) (mg/L) (mg/L) (%) (mg/L) (mg/L) (%)
21 213 35 84 510 70 86 168 24 86
22 214 28 87 480 74 85 160 20 88
23 242 27 89 504 72 86 182 28 85
' Table 7.3.14 B005 , COD and TOC Removals in Experiment 2 when
ec = 6 days and PAC = 10 mg/L
B005 COD TOC
Run In ft Efft Ef f y In ft Ef ft Ef f y In ft Ef ft Ef f y No. (mg/L) (mg/L) (%) (mg/L) (mg/L) (%) (mg/L) (mg/L) (%)
24 321 26 92 564 31 95 245 19 92
25 332 30 91 550 32 94 200 13 94
26 348 28 92 530 27 95 221 25 89
137

Table 7.3.15 BO~, COD and TOC Removals in Experiment 2 when Sc = 9 days and PAC = 10 mg/L
COD TOC
Run Inft Efft Effy Inft Efft Effy Inft Efft Effy No . (mg IL) (mg IL) ( % ) (mg IL) (mg IL) ( % ) (mg IL) (mg IL) ( % )
27
28
29
Run No.
30
31
32
350
340
345 '
22
20
24
94
94
93
550
548
552
Table 7.3.16 BOD5, COD and TOC Sc = 12 days and
BOD5
In ft Efft Ef f y In ft (mg/L) (mg/L) (%) (mg/L)
320 21 93 478
300 18 94 420
344 24 93 488
30
26
20
95
95
96
170
180
184
16
17
18
91
91
90
Removals in Experiment 2 when PAC = 10 mg/L
COD TOC
Eff t Effy In ft Ef ft Eff y (mg/L) (%) (mg/L) (mg/L) (%)
20 96 151 17 89
15 96 144 14 90
25 95 158 14 91
138

Run No.
33
34
35
Table 7.3.17 BO[_)s, COD and TOC Removals in Experiment 2 when ec = 3 days and PAC = 50 mg/L
BOD5 COD TOC
In ft Efft Ef f y In ft Ef ft Eff y In ft Ef ft Ef f y (mg/l) (mg/L) (%) (mg/L) (mg/L) (%) (mg/L) (mg/L) (%)
305 29 90 976 210 79 847 36 96
304 29 90 416 100 76 135 28 79
302 22 93 776 200 74 119 29 76
'
Table 7.3.18 BOD5, COD and TOC Removals in Experiment 2 when 9c = 6 days and PAC = 50 mg/L
COD TOC
Run Inft Ef ft Eff y Inft Efft Eff y Inft Efft Eff y No. (mg/L) (mg/L) (%) (mg/L)(mg/L) (%) (mg/L) (mg/L) (%)
36
37
38
320
213
248
29
25
10
87
88
96
796 192 76
516 160 69
488 100 80
139
554
123
127
45
21
18
83
83
86
'
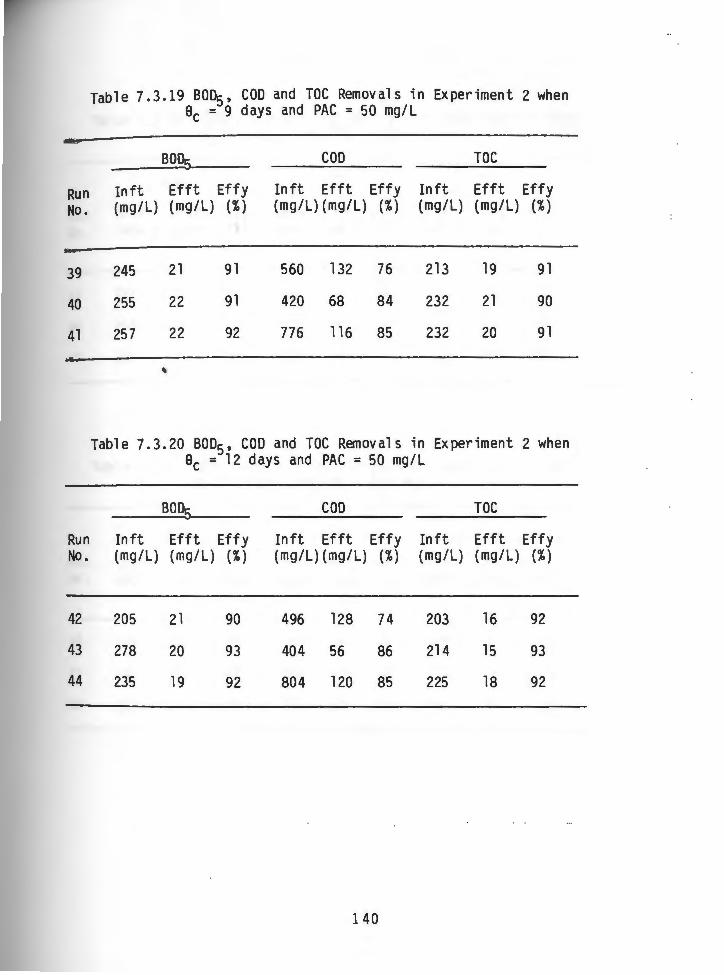
Table 7.3.19 BO%, COD and TOC Removals in Experiment 2 when Be = 9 days and PAC = 50 mg/L
___ B_O_D5, __ _ COD TOC
Run Inft Efft Effy Inft Efft Effy Inft Efft Effy No . (mg IL) (mg IL) ( % ) (mg IL) (mg IL) ( % ) (mg IL) (mg IL) ( % )
39
40
41
245
255
257
'
21
22
22
91
91
92
560 132 76
420 68 84
776 116 85
213
232
232
19
21
20
91
90
91
Table 7.3.20 BOD5, COD and TOC Removals in Experiment 2 when Be = 12 days and PAC = 50 mg/L
so95, __ COD TOC
Run Inft Efft Effy Inft Efft Effy Inft Efft Effy No. (mg/L) (mg/L) (%) (mg/L)(mg/L) (%) (mg/L) (mg/L) (%)
42
43
44
205
278
235
21
20
19
90
93
92
496 128 7 4
404 56 86
804 120 85
140
203
214
225
16
15
18
92
93
92

Table 7.3.21 BOD5, COD and TOC Removals in Experiment 2 when Sc = 3 days and PAC = 120 mg/L
___ B_O_D5 __ _ COD TOC
Run Inft Efft Effy Inft Efft Effy Inft Efft Effy No. (mg/L) (mg/l) (%) (mg/L)(mg/L) (%) (mg/L) (mg/L) (%)
45
46
47
292
255
300
26
30
28 '
91
88
91
360 30
540 50
624 70
92
91
89
191
205
260
13
17
20
93
92
92
Table 7.3.22 BOD5, COD and TOC REmovals in Experiment 2 when 8c = 6 days and PAC = 120 mg/L
BOD5 COD TOC
Run Inft Efft Eff y Inft Efft Eff y Inft Efft Eff y No . (mg IL) (mg IL) ( % ) (mg IL) (mg IL) ( % ) (mg IL) (mg IL) ( % )
48
49
50
295
249
222
30
24
21
90
90
91
360 35
356 25
515 60
141
90
93
88
188
184
188
17
13
15
91
93
92

Table 7.3.23 BODs, COD and TOC Removals in Experiment 2 when Sc = 9 days and PAC = 120 mg/L
___ B_O__,D5 __ _ COD TOC
Run Inft Efft Effy Inft Efft Effy Inft Efft Effy No. (mg/L) (mg/L) (%) (mg/L) (mg/L) (%) (mg/L) (mg/L) (%)
51
52
53
216
24
214
18
15
27
'
92
93
88
283 35
440 42
388 37
88
90
90
193
174
103
14
13
9
93
93
91
Table 7.3.24 BOD5, COD and TOC Removals in Experiment 2 when Sc = 12 days and PAC = 120 mg/L
___ B_O~D5 __ _ COD TOC
Run Inft Efft Eff y Inft Efft Eff y Inft Efft Eff y No. (mg/L) ( mg/L) (%) (mg/L )( mg/L) (%) (mg/ L) ( mg/L) (%)
54
55
56
200
195
205
18
16
20
91
92
90
348 33
380 32
352 34
91
92
90
142
157
159
158
9
11
10
94
93
94

SLUDGE AGE 600 .
I 8c=6 DAYS I Be= 9 DAYS I 8c=\2 DAYS _J ~ec=3 DAYS
1
' soo I I I Cl
,. I I E I I I .. I z 400 I I
0 I I I -I- I <{ - I a:: 300 I I I- INFLUENT I I ...... z
""" w I I w u I z 200 I 0 I I u
I I er 100 I I 0 I CD EFFLUENT I I I
I I 0 .
78 80 82 84 86 88 90 92 94
DAYS OF OPERATION
Figure 7.3.1 BO~ Removal by Activated Activated Carbon PAC=lO mg/ L
Sludge and Powdered

SLUDGE AGE
_J 8c=3 DAYS i 8c=6 DAYS I Be= 9 DAYS \ Bc=\2 DAYS
' 500 r : I I C' I I E ,
I I .. z 400 I I 0 I I -r- INFLUENT I I <{
I 0:: 300 I r- I I z -- ......._ w u 200 z
"' 0 "' u d1 100 0
I EFFLUENT .en
0 100 102 104 106 108 110 112 114 116
DAYS OF OPERATION Figure 7.3.2 BO~ Removal by Activated Sludge and Powdered Activated Carbon PAC=50 mg/ L

SLUDGE AGE I
_J ~8c=3 DAYS i Be =6 DAYS I Bc=9DAYS I Bc=\2 DAYS
' 500 1 I Ol ,,
I E I .. I
I z 400 I 0 I I -J- INFLUENT I I <( 0:: 300 I J- I z I ...... w I +=-
I (JI u - -z 200 I 0 I u I 01.£) I I 0
100 I I
CD EFFLUENT I I I
0 122 124 126 128 130 132 134 136 138
DAYS OF OPERATION
Figure 7.3.3 B01:3 Removal by Activated Activated Carbon PAC=120 mg/ L
Sludge and Powdered

...... ttS ::> 0
= (') Q) - ~
! ! ! 011')
(1,1 0 - IQ
c 111 - 0 -111 Q)
O'\ 0 ~
111 - Cl)
> Q)
< O'\ at 0 'O
1111 * ;I
......
• < Ul
I ~
Iii i 0
t~ I! .... +J
~ u Q)
• 0. <l • ~ ~
i:.J ..,
"'2'
rt'\ • !"
(') Q)
i..
8 .. a .. 0 llO ;I • • • .... O'\ - -~ (I.,
1009 'lVAOllla ~N~M ~N~l~~~
146

was essentially no change in the percentage removals as 9c
was increased. AS can be seen that no change observed in
the COD percent removal as Qc increased from 6 days to 12
days, at a PAC concentration of 10 mg/L. These data are
presented in Tables 7.3.13-24. The influent and effluent
concentrations versus day of operation are plotted in
Figures 7.3.5-7 and COD percentage removals versus Qc are
plotted in Figure 7.3.8.
TOC percentage removals were increased, in
comparison 'to AS, by the additions of all concentrations
of PAC. The highest TOC percentage removals occurred at a
PAC concentration of 120 mg/L for all Be values. In
general, TOC percentage removals increased with an
increase in Sc for all PAC concentrations with the
exception of a PAC concentration of 10 mg/L. These data
are presented in Tables 7.3.13-24, influent and effluent
TOC concentrations versus days of operation are plotted in
Figures 7.3.9-11, and effluent percentage removals versus
Sc are plotted in Figure 7.3.12.
Removals of priority organic pollutants (2,4
dimethyl phenol, fl uorene, naphthalene and pyrene) were
investigated for various PAC reactor concentrations and
sludge ages. Data for this experiment are presented in
Tables 7.3.25-36 and plotted in Figures A.4.1-12.
The additions of PAC to the AS reactor resulted in a
slight enhancement of 2,4 dimethyl phenol removals at the
147

SLUDGE AGE 1200
I I I _J ec=3 DAYS I 8c=6 DAYS I 8c= 9 DAYS I Bc=\2 DAYS
' I I o> 1000 I I E .. I I .. I I z 800 I I I 0 I I I -r- I I I <{
0:: 600 I I I r- .... - . . . - .... - -z I · W I ,_. u I ~
400 I CX> z I 0 I u I 0 I I
200 0 I I u EFFLUENT
I I I
0 . 78 80 82 84 86 88 90 92 94
DAYS OF OPERATION Figure 7.3 .5 COD Removal by Activated Activated Carbon PAC=lO mg/L
Sludge and Powdered

SLUDGE AGE I Be =6 DAYS I 8 =·9 DAYS \ 8c=l2 DAYS 8c=3 DAYS I
_J c
' 1000 f : Cl I .. E ~ I z 800
0 I -.._ I <(
0:: 600 I . .._ z w u 400 z 0 u . EFFLUENT
I
0 200 0 u
0 100 102 104 106 108 110 112 114 116
DAYS OF OPERATION
Fig~re 7.3.6 COD Removal by Activated Activated Carbon PAC=SO mg/ L Sludge and Powdered

SLUDGE AGE
I 8c=6 DAY~ I . Be= 9 DAYS \ 8c=\2 DAYS
_J ~c=30AYS I
' 1000 I I I ())
I .. I E I I I ... I z 800 I I 0 I I I -
I- INFLUENT I I I <( 0:: 600 I . I I I- A: I z
...... w .... I (JI u 0 z 400
0 u 0 200 0 u LEFFLUENT
0 122 124 126 128 130 132 134 136 138
DAYS OF OPERATION Figure 7.3.7 COD Removal by Activated Activated Carbon PAC=120 mg/L
Sludge and Powdered

0 0 (.) 100
...J
~ 0
~ a: tz LM (.) a: LM Q..
70
e ACTIVATED SLUDGE
o 10 mQ/L POWDERED CARBON/ACTIVATED SLUDGE
60 ·~o H H II
6120 H H
4 5 6 7 8 9 10 11 12 13
SLUDGE AGE, DAYS
Figure 7.3.8 Effect of Sludge Age on COD Removal
151

SLUDGE AGE 300
I I I
1 8c=3 DAYS 8c =6 DAYS I 8c= 9 DAYS I 8c=\2 DAYS _J I
' 250 Ol
E .. z 200 0 -r-<I et: 150 r-z w ...... u f.]'I
100 N z 0 u u 50 I 0 EFFLUENT r-
0 78 80 82 84 86 88 90 92 94
DAYS OF OPERATION
Figure 7.3 .9 TOC Removal by Activated Sludge and Powdered Activated Carbon PAC=lO mg/ L

SLUDGE AGE
I BC =6 DAYS I Be= 9 DAYS I Bc=\2 DAYS _J
ec=3 DAYS I
' 1000 r : Cl
E I ,
.. I z 800 0 I -r I <l a:: 600 I r z I w
,_. u 400 I
(JI z INFLUENT I w 0 u u g
200
EFFLUENT 0--
0 100 102 104 106 108 110 112 114 116
DAYS OF OPERATION Figure 7.3.lOTOC Removal by Activated Activated Carbon PAC=50 mg/L
Sludge and Powdered

1200 I SLUDGE AGE
I Be= 9 DAYS _J I ec=3 DAYS i Be =6 DAYS I 8c=12 DAYS I ..
' Ol 1000 E ~INFLU~NT .. z
800 0 -._. <! a:: 600 ._.
...... z (J'1 w ~
u z 400 0 u u 200 0 ._.
EFFLUENT l _J'
0 122 124 126 128 130 132 134 136 138
DAYS OF OPERATION Figure 7.3.llTOC Removal by Activated Activated Carbon PAC=l20 mg/ L Sludge and Powdered

u 0 ~ 100
90
80
70
60
•ACTIVATED SLUDGE o 10 m<JIL POWDERED CARSON/ACTIVATED SLUDGE •~o If II II II N
6120" " " "
4 5 6 7 8 9 10 11 12 13
SLUDGE AGE, DAYS Figure 7 . 3.12 Effect of Sludge Age on TOC Removal
155

T~le 7 .3.25 Priority ~llutants Jero.tal, Ex~r-inent 2 v.hen Sc = 3 days ard PPC = 10 nYJ/L
2,4-DirrethtlP,enol Flucrene NaP'lthalene
~ Jnft Efft Effy Jnft Efft Effy Jnft Efft Effy t(>. (Lg/L) (LfJ/L) ( %) (tg/L) (tg/L) (%) (tg/L) (tg/L) (%)
21 87 27 69 33 16 52 107 27 75
22 133 10 92 23 17 26 240 21 92
23 933 33 ~ HE 13 88 467 27 94
'
ND= None detecta:>le, detecta:>ility >10 tg/L
Tct>le 7 .3.26 A--iority ~11 utirlts Jeoo.ial, Ex!B'iment 2 W1ffi 9c = 6 days ard PAC = 10 rrg/L
2,4-Dirretht1P,eno1 Flucrene NaP'lthalene
~ Jnft Efft Effy Jnft Efft Effy Jnft Efft Effy t(>. (Lg/L) (tg/L) ( %) (tg/L) (LIJ/L) (%) (LIJ/L) (tg/L) (%)
24 560 166 70 200 32 86 947 33 g/
25 2, 112 113 g) 145 10 93 933 28 <l3
26 2,848 140 g) 93 39 58 733 19 84
156
Pyrene
Jnft Efft Effy (tg/L) (tg/L) (%)
27 20 26
ND ND ~
87 12 ffi
Pyrene
Jnft Efft Effy (Lg/L) (tg/L) (%)
27 20 26
39 13 67
30 26 13

Tcble 7 .3.ZI ~iority FOllutants 16T1<Nal, Ex~rirrent 2 W'len Sc = 9 days and PAC = 10 rtYJ/L
2,4-DilrethylP,enol Fluorene NaP'lthalene Pyrene
~ Inft Efft Effy Inft Efft Effy Inft Efft Effy Inft Efft Effy N'.>. (t.g/L) (t.g/L) ( %) (t.g/L) (t.g/L) (%) (t.g/L) (t.g/L) (%) (tg/L) (t.g/L) (%)
27 1,974 112 94 300 37 88 1,500 27 ~ 105 17 84
28 1 ,840 33 ~ 493 130 74 1 ,rol 01 93 260 ZI ~
29 168 13 92 200 13 35 93 ZI 71 32 20 38
'
Tcble 7.3.28 ~iority Fbllutants 16T1<Nal, Ex~tnent 2 W'len Sc= 12 days and PAC = 10 rtYJ/L
2,4'-Dilreth~lP,enol Fluorene NaP'ltalene Pyrene
IW Inft Efft Effy Inft Efft Effy Inft Efft Effy Inft Efft Effy N'.>. (t.g/l) (t.g/L) ( %) (t.g/l) (t.g/L) (%) (t.g/l) (t.g/l) (%) ( t.g/l) ( t.g/l) (%)
30 3,&57 27 99 233 ZI 88 733 fl6 91 28 20 29
31 2, 113 40 ~ 140 32 77 '2b7 'OJ ~ ZI 19 30
32 1 ,700 33 ~ 207 40 81 1 ,;ro 47 ~ ZI 20 26
157

Tcble 7.3.29 Priority Fbllutants !e'ncNal, ExJErill'a1t v.hen ec = 3 days ard PAC= 50 ~/L
2,4-0irrethy1P,eno1 Flua-ene Nai:hthalene
~ Jnft Efft Effy Inft Efft Effy Inft Efft Effy Inft Efft Effy ~. (llJ/L) (llJ/L) ( %) (llJ/L) (llJ/L) (%) (llJ/L) (llJ/L) (%) (llJ/L) (llJ/L) (%)
33 9,933 140 99
34 1,500 32 ~
' 35 5,333 00 99
279 57 00 7,fJJJ 493 94
167 35 79 1,200 33 97
128 10 92 ffi3 «:) 95
ND = None detectable, detecti:>ility >10 tg/L
47
27
20 57
10 63
t{) NO ND
Tcble 7 .3.30 Pricrity Fbll utillts Jene>1al, ExJErirnelt 2 vi1el1 9c = 6 days ard PAC = 50 ~/L
2,4-Dirrethy1P,eno1 Flua-ene Nai:Tithalene Pyrene
~ Inft Efft Effy Inft Efft Effy Inft Efft Effy Inft Efft Effy ~. (llJ/L) (llJ/L) ( %) (llJ/L) (llJ/L) (%) (llJ/L) (llJ/L) (%) (llJ/L) (llJ/L) (%)
36 4,772 lJ 99 33 ND >70 1, 172 53 95 41 ND >76
JI 9,065 20 99 48 ND >79 «) 13 68 ND NO ND
38 8,720 12 99 147 57 61 1 ,()X) 227 77 27 ND >63
ND = None detectt>le, detectability >10 UJ/L
158

TciJle 7 .3.31 ~iority Fbllutants !enoval' E>q::erinent 2 Wien ec = 9 days and PAC = 50 rng/L
2 , 4-Dirreth y 1 pieno 1 Flucrene Naitithalene Pyrene
fW Inft Efft Effy Inft Efft Effy Inft Efft Effy Inft Efft Effy tt>. (llJ/L) (llJ/L) ( %) (t.g/L) (llJ/L) (%) (t.g/L) (t.g/L) (%) (t.g/L) (llJ/L) (%)
39 7 ,553 433 94 33 ND > 70 733 LU3 72 31 15 52
40 3,000 253 92 47 ND >79 Z/9 NJ >% 22 t{) >55
41 6,660 33' 99 533 ND ~ 733 158 78 27 ND >63
TciJle 7 .3.32 ~iority Fbllutants lenoval, ExJErinent 2 Wien Be = 12 days and P~ = 50 rng/L
2,4-Dirrethylpienol Flucrene Pyrene
~ Inft Efft Effy Inft Efft Effy Inft Efft Effy Inft Efft Effy tt>. (llJ/L) (t.g/L) ( %) (t.g/L) (t.g/L) (%) (t.g/L) (t.g/L) (%) (t.g/L) (t.g/L) (%)
42 7 ,847 12 99 140 40 71 500 27 q;
43 2,845 23 99 251 13 9'j 373 15 %
44 746 92 88 'NI 20 93 261 13 q;
159
16
17
39
10 38
14 18
15 62

T~le 7.3.33 Priority ~llutants !erolal, ExIB'iment 2 \tilen Sc= 3 days ard PAC = 120 nYJ/L
2,4-Dimethylµ,enol Flucrene NaP"tthalene Pyrene
~ Jnft Efft Effy Inft Efft Effy Inft Efft Effy Inft Efft Effy t«J, (t.g/L) (t.g/L) ( %) (t.g/L) (t.g/L) (%) (t.g/L) (t.g/L) (%) (t.g/L) (t.g/L) (%)
45 7 ,<E3 10 99 167 ND >94 533 17 <:JI 10 ND
46 7 ,'83 13 99 207 13 94 920 53 94 20
47 2,093 27 99 340 ND >97 4,fi67 27 99 40 12 70
NO = t«)ne detec~le, detec~il ity >10 tg/L
T~le 7.3.34 Pricrity Polluta'lts len01al, ExjB'lne1t 2 \tilen Sc= 6 days ard PAC = 120 nYJ/L
2,4-Dirrethylµ,enol Flucrene Pyrene
~ Inft Efft Effy Inft Efft Effy Inft Efft Effy Inft Efft Effy It>. (t.g/L) (t.g/L) ( %) (t.g/L) (t.g/L) (%) (t.g/L) (t.g/L) (%) (t.g/L) (t.g/L) (%)
48 3,300 160 <:JI 113 ND >91 933 ND >99
49 6,747 387 94 167 10 94 733 t{) >99
50 5 ,693 ND >99 120 12 ~ 733 20 <:JI
ND= t«)ne detec~le, detec~ility >10 tg/L
160
10
13
27
ND
t{) >23
ND >63

Tcble 7 .3.35 Priority R>llutants lerolal, ExjEriment 2 Wien Sc = 9 days and PAC = 120 mg/L
2,4-0irrethyli:J'lenol FlOO"ene N<lP'lthalene Pyrene
~ Inft Efft Effy Inft Efft Effy Inft Efft Effy Inft Efft Effy rt>. (LIJ/L) (LIJ/L) ( %) (UJ/L) (UJ/L) (%) (UJ/L) (UJ/L) (%) (LIJ/L) (UJ/L) (%)
51 6,473 17 99 153 ND >93 733 47 94 17 ND >44
52 4, 187 17 99 73 t{) >ffi 293 16 C£ 87 ND >77
53 3,'£3 33' 99 207 13 94 257 13 C£ 13 ND >23
ND= None detectable, detectability >10 UJ/L
Tcble 7 .3.36 Pricrity Pollutillts !enC11al, Exi:a"iment 2 W'lei 9c = 12 days and PAC = 120 mg/L
2,4-Din'Ethlli:J'lenol Flucrene N<lP'lthalene Pyrene
IUI Inft Efft Effy Inft Efft Effy Inft Efft Effy Inft Efft Effy rt>. (LIJ/L) (LIJ/L) ( %) (UJ/L) (LIJ/L) (%) (UJ/L) (UJ/L) (%) ( Lg/L) ( Lg/L) (%)
54 6,613 327 C£ 133 20 85 293 17 94 27 ND >63
55 5,200 33 99 67 17 75 200 ND >95 27 12 56
56 11,361 fi57 94 47 ND >79 2,lfil 127 C£ 33 11 61
ND= None detectable, detectability >10 UJ/L
161

50 and 120 mg/L PAC concentrations at all sludge ages over
the removals obtained from the AS alone. There appeared
to be no advantages in terms of 2,4 dimethyl phenol
removals to maintaining a long 9c with the exception of a
PAC concentration of 10 mg/L.
Fluorene percentage removals could only be increased
over that resulting from AS alone by a PAC concentration
of 120 mg/L in the AS reactor. There appeared to be no
trend which could be observed of percentage removals of
fl u o r e n e v ~r s u s e c .
As was the case for fluorene, the percentage removals
of naphthalene only showed an enhancement over the AS
rem o v a 1 s at a PAC c once n tr at i on of 1 2 O mg I L . Ch an g e s i n
9c did not appear to improve the percentage removals of
napthalene.
No percentage removal trends in terms of PAC
concentrations and Sc values could be observed for pyrene.
The results of the study on the removals of the
volatile compounds (benzene, chloroform, ethylbenzene,
toluene, m-xylene and o-xylene) are presented in Tables
7.3.37-48. Since these compounds were studied in section
7.5 and found to be air stripped from the reactor by the
air flow, there were no increases expected and no
increases observed in the percentage removals of the
volatile compounds due to the addition of PAC to the AS
reactor.
162

.......
°' w
Tcille 7.3.37 Volatile ()'gillies le'noval, ExJ:Eriment 2 W1en Be = 3 days, PAC= 10 rrg/L ,
~~ene Oll<rofonn Ethylre~ene Toluene t+Xylene 0-Xylene
~n Inft Efft Eff y In~ Efft Eff y Inft Efft Eff y Inft Efft Eff y In~ Efft Eff y Inft Efft Effy tt>. (ug/L) (ug/L) (%)(ug/L) (ug/L) (%) (ug/L) (ug/L) (%) (ug/L) (ug/L) (%) (ug/L) (ug/L) (%) (ug/L) (ug/L) (%)
21 4,367 t{) >99 2,692 500 81 1,333 t{) >99 2,~3 NO >99 1483 t{) >99 3,4~ t{) >99
22 3,300 20 99 2,503 277 89 630 30 95 2,183 18 99 940 NO >99 4~ t{) >~
23 3,065 t{) >99 2,439 512 00 1,040 ND >99 4,000 NO >99 1,251 t{) >99 2,750 t{) >99
ND= tt>ne det.ectcille, det.ect<bility >10 ug/L

, Toole 7 .3.38 Volatile ()'gcriics lencNal, Ex~r1nent 2 W'len Qc = 6 days, PAC= 10 111J/L
~ene Olloroform Ethyl benzene Toluene M-XJ:lene (}-Xylene
RLn Inft Efft Effy Inft Ef ft Eff y Inft Efft Effy Inft Efft Effy Inft Efft Effy Inft Efft Effy It>. (llJ/L) (llJ/L) ('.t){Lg/L) (llJ/L) (%) (llJ/L) (llJ/L) (%) (llJ/L) (llJ/L) (%) (llJ/L) (llJ/L) (%) (llJ/ L) (llJ/L) (%)
t--'
O'I ~ 24 4,379 ND >99 2,593 ~ CJ! 1, 125 ND >99 2,003 ND 100 3,274 ND 100 4,442 ND >99
25 4,216 ND >99 2,445 325 87 1,578 ND >99 3,9'.>0 ND 100 2,863 ND 100 5,001 ND >99
26 3,941 ND >99 2,5~ 325 87 1,656 ND >99 3,067 ND 100 700 ND 100 1 ,ffi9 ND >99
ND= ltlne detectable, detectability >10 Lg/L

Tcble 7.3.39 Volatile <rgcnics len0v1al, E>q:~riment 2, W'len &c = 9 days, PAC= 10 ITTJ/L
,
~ene O'llcrofonn Et.hylbenzene Toluene t+Xylene 0-Xylene
~ Inft Efft Eff y Inft Efft Effy Inft Efft Effy Inft Efft Effy Inft Efft Effy Inft Efft Effy t-t>. (i.g/L) (i.g/L) (%)(i.g/L) (i.g/L) (%) (i.g/L) (i.g/L) (%) (i.g/L) (i.g/L) (%) ( i.g/L) ( i.g/L) (%) (i.g/L) (i.g/L) (%)
27 2,430 ND >99 2,145 130 94 1,027 ND >99 1,600 ND >99 660 ND >!E ~ t{) >99 ...... O'I (J'I
28 1,600 t{) >99 1,442 20 99 938 t{) >99 1,500 t{) >99 630 t{) >~ 700 t{) >99
29 2,011 ND >99 1,929 24! 88 l~ t{) >~ 1,142 ND >99 5fi0 ND >!E 1, 130 ND >99
ND= t-t>ne detectcble, detectability >10 i.g/L

.......
°' °'
Tcble 7.3.40 Volatile O"gcriics Jeoo.ial, Ex~rinent 2, W'len 9c = 12 days, PAC= 10 rrg/L ,.
~nzene Ollcrofcnn Ethyl benzene Toluene t+Xylene 0-Xylene
!lln Inft Efft Effy Inft Efft Eff y Inft Efft Effy Inft Efft Effy Inft Efft Effy Inft Efft Effy It> • ( t.g/L) ( t.g/L) (% )( t.g/L) ( t.g/L) (%) ( ug/L) ( t.g/L) (%) ( t.g/L) ( t.g/L) (%) ( t.g/L) ( t.g/L) (%) ( t.g/L) ( t.g/L) (%)
30 3,397 t{) >99 2,~ 45 98 440 t{) >98 2,733 t{) 100 1,326 t{) >99 1,784 t{) >99
31 2,516 ND >99 2,185 190 91 lfiO 30 81 1,743 30 100 330 120 64 l ,lfiO ND >99
32 2,284 t{) >99 2, 178 40 ~ 110 t{) >91 ~ t{) >99 fl() t{) >83 40 t{) >75
ND= t«>ne detectcble, detectcbility >10 ug/L

..... O'I --..I
Toole 7.3.41 Volatile ()"gaiics lencNal, ExJErtnent 2, Wien 8c = 3 days, F¥\C = 50 rrg/L ,
lfnzene Ollcrof()111 E t.h y 1 benzene Toluene M-Xylene 0-Xylene
Ru1 Inft Efft Effy Inft Efft Effy Inft Efft Effy Inft Efft Effy Inft Efft Effy Inft Efft Effy tt>. (t.g/L) (t.g/L) (%)(t.g/L) (t.g/L) (%) (t.g/L) (t.g/L) (%) (t.g/L) (t.g/L) (%) (t.g/L) (t.g/L) (%) (t.g/L) (t.g/L) (%)
33 3, 487 NO >99 1 , 950 18 99 392 NO >97 2, 283 NO >99 500 tfl >~ 1 ,020 NO >99
34 2,919 t{) >99 1,995 t{) 99 200 t{) >95 1,967 t{) >99 850 t{) >99 1,470 t{) >99
35 910 NO >99 1,795 10 99 10 t{) NO 300 NO >97 418 t'4l >~ 200 tfl >96
NO = tt>ne detect.cble, detect.cbil ity >10 t.g/L

~
°' CX>
Table 7.3.42 Volatile ()"g<r'lics lenoval, Exr:Er1nent 2 \'.hen 9c = 6 days, PAC= 50 ITTJ/L ,
!Enzene OllorofCl1Tl Et.hylbenzene Toluene t+Xylene 0-Xylene
14.m Inft Efft Eff y Inft Efft Eff y Inft Efft Eff y Inft Efft Effy Inft Efft Eff y Inft Efft Effy ltl. (ug/L) (ug/L) (%)(ug/L) (ug/L) (%) (ug/L) (ug/L) (%) (ug/L) (ug/L) (%) (ug/L) (ug/L) (%) (ug/L) (ug/L) (%)
36 2,708 ND >99 2, 106 22 99 378 NO >W 1,600 ND >99 413 ND >~ 800 ND >99
37 2 ,005 ND >99 2 ,005 00 ~ 660 ND >~ l ,917 ND >99 700 ND >99 l , ax> ND >99
38 3,065 ND >99 2, 132 21 99 6~ ND >99 2,283 ND >99 1,233 ND >99 2, 171 ND >99
ND = ttine detectable, detectii>il ity >10 ug/L
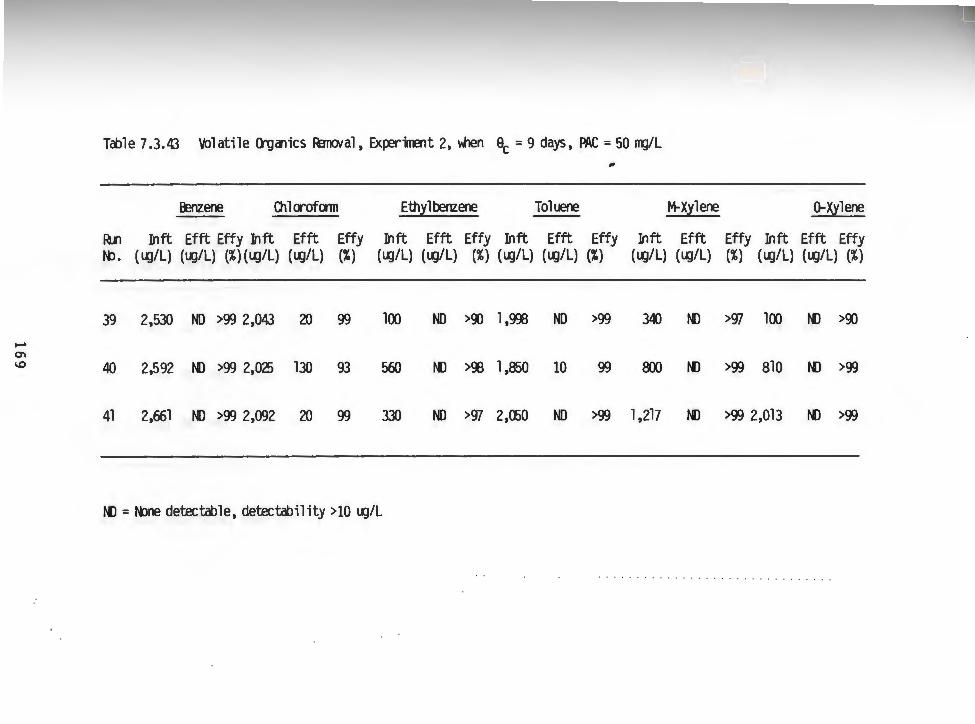
-O'> \0
T<i>le 7.3.43 Volatile ()'g<11ics lenoval, 8qErilrent 2, Wien Be= 9 days, PAC= 50 ITTJ/L ..
~ene Ollcrofcrm Ethyl berrzene Toluene M-Xylene ~Xylene
1U1 Inft Efft Effy Inft Efft Effy Inft Efft Effy Inft Efft Effy Inft Efft Effy Inft Efft Effy It>. (llJ/L) (llJ/L) (%)(l1J/L) (llJ/L) (%) (llJ/L) (llJ/L) (%) (llJ/L) (llJ/L) (%) (llJ/L) (llJ/L) (%) (llJ/ L) (llJ/L) (%)
39 2,530 ND >99 2,043 20 99 100 ND >~ l , 9'l3 ND >99 340 t{) >97 100 t'I) >~
40 2,592 t'I) >99 2,025 130 93 5flO ND >~ l ,850 10 99 800 t'I) >99 810 t'I) >99
41 2,fX51 ff) >99 2,092 20 99 330 ND >97 2,ffiO ND >99 1,217 ND >99 2,013 t'll >99
ND= tt>ne detectable, detectability >10 llJ/L

...... -....J C>
Table 7 .3.44 Volatile O"gaiics FerK>val, txJ:Eriment 2, vilen 9c = 12 days, PAC= 50 ITTJ/L ,
!Blzene Clllorofoon Ethyl benzene Toluene M-Xylene 0-Xylene
IUl Inft Efft Effy Inft Efft Effy Inft Efft Effy Inft Efft Effy Inft Efft Effy Inft Efft Effy tti. (i.g/L) (i.g/L) (%) (i.g/L) (i.g/L) (%) (i.g/L) (i.g/L) (%) (i.g/L) (i.g/L) (%) (i.g/L) (i.g/L) (%) (i.g/L) (i.g/L) (%)
42 l ,411 ID 99 l ,000 10 99 470 ND >~ 740 t{) >99 719 t{) >99 1 it) t{) >93
43 144 t{) >93 1,912 ID 99 178 t{) >94 9ID t{) >99 500 t{) >~ l ,040 t{) >99
44 l , 160 ND >99 1,823 ID 99 50 t{) >00 583 NO >~ 340 tf> >fJ/ 7ID t{) >99
NO= ttine detec~le, detec~ility >10 i.g/L

-........ -
Table 7.3.45 Volatile ()'ga'lics Jero.ial, 8qErilrent 2 \'.hen Be= 3 days, PAC= 120 JTg/L
.. ~ene Ollcrofcrni Ethyl benzene Toluene t+Xylene 0-Xylene
~n Inft Efft Eff y Inft Efft Eff y Inft Ef ft Eff y Inft Efft Eff y Inft Efft Eff y In~ Efft Eff y It>. (ug/L) (ug/L) (%)(ug/L) (ug/L) (%) (ug/L) (ug/L) (%) (ug/L) (ug/L) (%) (ug/L) (ug/L) (%) (ug/L) (ug/L) (%)
45 1,719 ND >99 2, 145 tll >99 200 t{) >% 1 ,383 t{) >99 648 t{) >SS 1,240 t{) >99
46 1,1~ ND >99 l ,~ ND >99 300 ND >97 l ,020 ND >99 400 t{) >SS 848 t{) >99
47 2,741 t{) >99 2,426 30 99 300 t{) >W 1,600 t{) >99 620 t'f) >98 8~ t'f) >99
tll = lt>ne detectct>le, detectcbil ity >10 ug/L

....... -.J N
Table 7.3.46 Volatile O"giYlics !erolal, E>q:er"Vrent 2, vilen 8c = 6 days, FY\C = 120 rrg/L ,
~ene OllcrofCl1Tl Ethyl!Enzene Toluene M-Xylene 0-Xylene
Rtll Inft Efft Effy Inft Efft Effy Inft Efft Effy Inft Efft Effy Inft Efft Effy Inft Efft Effy It>. (i.g/L) (i.g/L) (%)(i.g/L) (i.g/L) (%) (i.g/L) (i.g/L) (%) (i.g/L) (i.g/L) (%) (i.g/L) (i.g/L) (%) (i.g/L) (i.g/L) (%)
48 %0 ND >99 2,~9 ND >99 120 ND >92 270 f'I) >% 40 t{) >75 110 ND >%
49 l ,816 t{) >99 2,229 10 99 122 t{) >92 970 t{) >99 410 t{) >~ 550 t{) >~
50 2,430 ND >99 2,345 38 ~ 140 ND >93 1,360 t'4) >99 750 ND >99 850 t{) >99
t-ll = t«>ne detectable, detectability >10 ll:J/L

....... -....J w
Tcble 7 .3.47 Volatile (Tg<Jlics lel'lolal, E>q:eriment 2, W'len 0c = 9 days, PAC= la! rrg/L I#
falzene Chlcrofcrm Ethyl benzene Toluene t+Xylene (}-Xylene
~ Inft Efft Effy Inft Efft Effy Inft Efft Effy Inft Efft Effy Inft Efft Effy Inft Efft Effy ~. (tg/L) (tg/L) (%)(tg/L) (tg/L) (%) (tg/L) (tg/L) (%) (tg/L) (tg/L) (%) (tg/L) (tg/L) (%) (tg/L) (tg/L) (%)
51 1,573 ND >99 2,4~ 78 97 482 ND >~ 740 ND >99 500 ND >~ 2al t{) >~
52 810 ND >99 1,926 ND >99 al ND >50 280 ND >96 260 ND >96 410 ND >~
53 810 ND >99 1,924 ND >99 50 ND >80 383 ND ><JI l~ ND >~ 2itl ND >96
ND= ~ne detectcble, detectcbility >10 Lg/L

....... -...J
~
Table 7.3.48 Volatile ()'gaiics Jero.ial, Ex~rirent 2, \'llen 9c = 12 days, PA~= 120 ng/L
~ene Ollorofcrm Ethyl benzene Toluene t+Xylene 0-Xylene
~ Inft Efft Effy Inft Efft Effy Inft Efft Effy Inft Efft Effy Inft Efft Effy Inft Efft Effy tt>. (t.g/L) (t.g/L) (%)(t.g/L) (t.g/L) (%) (t.g/L) (t.g/L) (%) (t.g/L) (t.g/L) (%) (t.g/L) (t.g/L) (%) (t.g/L) (t.g/L) (%)
54 1,020 ND >99 2, 180 fiO 97 50 10 80 383 ND ><JI 325 tfl ><JI 520 tfl >!E
55 940 t{) >99 2,253 10 99 30 t{) >67 385 t{) >97 220 t{) >95 280 t{) >%
56 2,238 ND >99 2,283 fiO <JI 300 ND ><JI 1, 417 ND >97 1,040 t{) >99 1 ,658 ND >99
ND= tt>ne det.ectcble, det.ectcbility >10 t.g/L

7. 4 Evaluation of Biological Growth in Experiments 1 and 2
7.4.1 Light Microscopic Analysis
One important method for determining the viability of
and any visible changes in the AS microbial population is
an examination by use of a light microscope. Throughout
the duration of this study, daily samples of the AS
biomass were collected from the reactor and immediately
viewed under the light microscope.
Chron'>logical observations of the AS biomass were
used by several researchers to document the acclimation
period that is typically required for industrial
bi o 1 og i c a 1 treatment processes . Reitano (54) in a study
to measure the potential of the AS process to treat a
refinery waste, utilized a periodic microscopic
examination of the biomass to determine the length of the
acclimation phase for the bacteria.
The AS biomass utilized in each of of the experiments
was originally collected from the South Kingstown Waste
Treatment Facility (SKWTF) prior to the start of this
study. An initial observation of this biomass immediately
after collection revealed a diverse population of
microorganisms typical of those found in a domestic AS
including bacteria, rotifers, algae, fungi and ciliates.
The AS biomass collected from the SKWTF was
transferred into the pilot-scale reactor and fed with the
175

industrial refinery wastewater. After 24 hours of
operation there was a decrease in the AS biomass
p 0 pu1 at i on den s i t y fr om an i n i ti a 1 ML VS S c on c en tr at i on i n
the range of 1,800 mg/L to approximately 250 mg/L MLVSS.
An examination under the light microscope after 24 hours
of operation revealed a high percentage of protozoa
followed by ciliates and bacteria.
A photomicrograph of the AS sample which was examined
on day 2 of operation is shown in Figure 7.4.1.1. This
photomicr~graph represents a typical microorganism
population consisting primarily of protozoa. By
themselves, protozoa consume bacteria and suspended
organic matter and thus do not directly metabolize the
dissolved organic fraction.
After two weeks of operation the MLVSS showed a
s 1 i g ht i n crease fr om 1 , 5 2 O to 1 , 5 9 6 mg IL. Dur i n g th i s
operational time the biomass was in a period of
acclimation with an apparant mass balance between the
dying microorganisms and the acclimated organisms. Not
only was there a slight change in the total mass of
microorganisms, but there was also a rearrangement in the
types of microorganisms. A decrease in the number of
protozoa and a corresponding increase in both the number
of ciliates and the bacteria in the AS sludge was noted.
Examples of the typical microorganisms present after two
weeks of operation are shown in Figures 7. 4.1. 2 through
176

Figure 7.4.1.1 Photomicrograph of protozoa in a raw aerated wastewater (160X)
177

Figure 7.4.1.2 Photomicrograph of filamentous floe (bacteria) in the activated sludge (160X)
178

7.4.1.5. The relative increase in the numbers of bacteria
is a positive sign that acclimation of the system was
occurring.
Rotifers started to appear after the third week of
operation. The reappearance and increase of the rotifers
was an additional indication of the acclimation of the AS
to the industrial refinery wastewater. The MLVSS
concentration also showed an increase from 1,580 mg/L to
2,040 mg/L in the period between week 2 and week 3. A
photomicrograph of a rotifer in the activated sludge is
shown in Figure 7.4.1.6.
Acclimation of the AS biomass was reached
approximately at the end of the fourth week. This was
confirmed by both a relative increase in the bacteria, as
we 1 1 a s a 1 e v e 1 i n g off i n the ML VS S con c en tr at i on . Si n c e
the bacteria are the species responsible for the
metabolism and removal of the dissolved organics, a
biomass with a high relative concentration of bacteria is
necessary for dissolved organics removal. A
p ho tom i c r o g r a p h of th e d i s per s e d b a c t e r i a ob s e r v e d at th e
end of the fourth week is shown in Figure 7.4.1.7.
A summary of the changes in the population of the
microorganisms is illustrated in Figure 7.4.1.8. The
mi croorganism population in the AS did not change
substantially after the acclimation period which occurred
approximately 31 days from the start-up of the AS reactor.
17 9

Figure 7.4.1.3 Photomicrograph of filamentous microorganisms (bacteria) i n th e activated sl udge (l60X)
180

Figure 7.4.l.4 Photomicrograph of a ciliate microorganism in the activated sludge (l60X)
181

Figure 7.4.1.5 Photomicrograph of a ciliate in the activated sludge (160X)
182
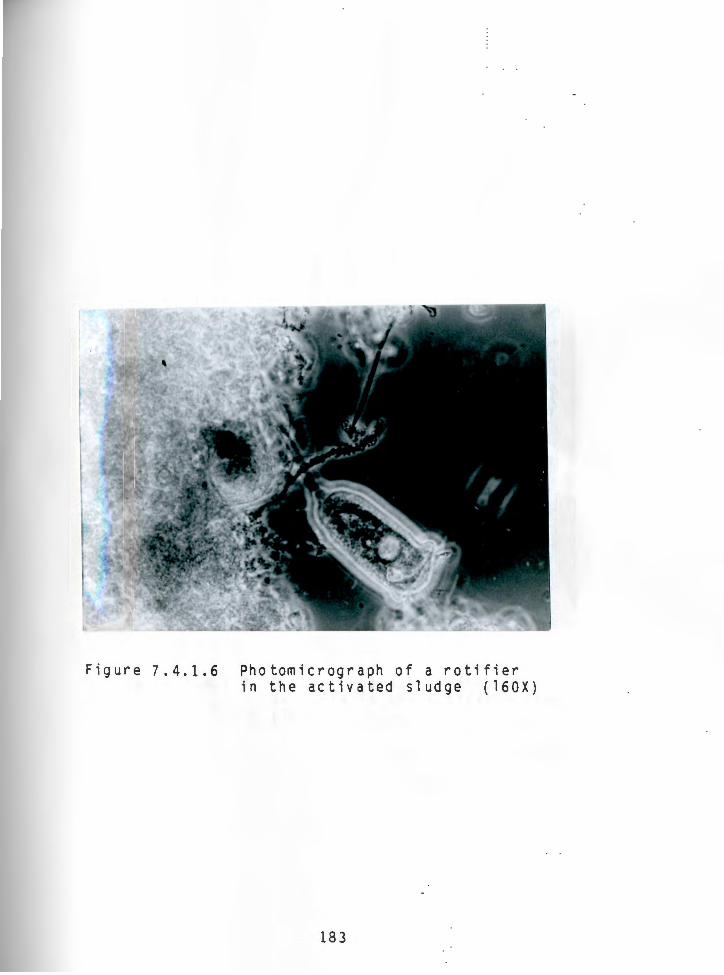
Figure 7.4.1.6 Photomicrograph of a ratifier in the activated sludge ( 160X)
183

Figure 7.4.l.7 Photomicrograph of dispersed bacteria in the activated sludge (160x)
18 4

...... CX> (.Tl
(/) (.)
~ < z >-0
z 0 ._ < -' ::::> a. 0 a.
Cl ~ Q w w 0)
ACCLIMATION PERIOD
';¥:: ij
CILIATES -G
~·# ~
.[j ROTIFER
PROTOZOA ~ lJ
0 7 14 21 28
Q w > w f 0 < > .... :; iii < .... Cl)
-STEADY-STATE CONDITIONS
;:t:k, I -;~ ~ I
I I ,
BACTERIA ~ I u
' I -.-<!£- ~ I
I -.
~~ ~ I
35 42 49 56 63 70 77
DAYS FROM START-UP
139
Figure 7.4.1.8 Changing Microorganism Population in the Aeration Tank

7.4.2 Scanning Electron Microscopic Analysis
When PAC has been added to the AS, an
additional dissolved organic removal mechanism,
adsorption, occurs in conjunction with biological
oxidation. Not only does the PAC adsorb dissolved
organics, but the high surface area of the carbon is an
ideal site for fixed film bacteria to adhere to.
Microscopic analysis using a light microscope is
sufficient for observing the relative population dynamics
which occu~ within the AS. However, to observe the
interactions between bacteria and PAC, very high
magnifications, on the order of 25,000 X, are necessary.
These magnifications are only possible through the use of
a scanning electron microscope.
A series of PAC/ AS samples were collected such that
bacterial growth on the PAC could be observed at various
operation times. Increases in bacterial growth on the PAC
could then be noted.
A SEM photomicrograph of the virgin carbon was taken
to provide a control which would show carbon surfaces
which were free from bacterial growth. Such a
photomicrograph is presented in Figure 7.4.2.1 and
illustrates the angular nature of the carbon surface.
186

Figure 7.4.2.1 Scanning electron micrograph of the surface of virgin PAC particles without biological growth
187

The first SEM observation of a sample of the PAC that
was in contact with the AS was taken after 44 days of
operation. At the time the PAC/AS sample was collected,
the PAC concentration in the AS reactor was equal to 120
mg/Land 9c was equal to 3 days. Two photomicrographs
were taken of the same PAC/AS sample using magnifications
of 3,000 and 5,000 X. At a magnification of 3,000 X
(Figure 7.4.2.2) a variety of microorganisms are shown to
be attached to the surfaces of the PAC. Also visible in
this photomicrograph are PAC surfaces which are free of
micro organ i sm s . At the h i g her mag n i f i cat i on of 5 , 0 0 0 X
(Figure 7.4.2.3) several rod shaped bacteria are shown
which are attached to the PAC surfaces.
After a period of 56 days of operation another sample
was withdrawn from the AS reactor and examined under the
SEM. The operating conditions within the AS reactor when
this sample was withdrawn were the same as the preceding
sample except for a 9c equal to 12 days. An overall
photomicrograph of the PAC/AS at a magnification of 3,000
X is reproduced in Figure 7. 4. 2. 4. The PAC within this
photomicrograph is completely covered with a layer of rod
shaped bacteria. When the magnification was increased to
25,000 X (Figure 7.4.2.5) the attachment of the individual
rod-shaped bacteria to the PAC surface could be seen. It
appears from this photomicrograph that not al 1 of the PAC
surface is covered with bacteria, which means that some of
188

Figure 7.4.2.2 Scanning electron micrograph of PAC particles exposed to refinery industry wastewater for 44 days (rod-shaped bacteria were attached, PAC dosage 120 mg/l, sludge age 3 days).
18 9

Figur e 7. 4. 2. 3 Scanning electron micrograph of PAC particles exposed to refinery industry wastewater for 44 days (rod-shaped bacteria are present in the wastewater, PAC dosage 120 mg /l ; sludge age 3 days).
190
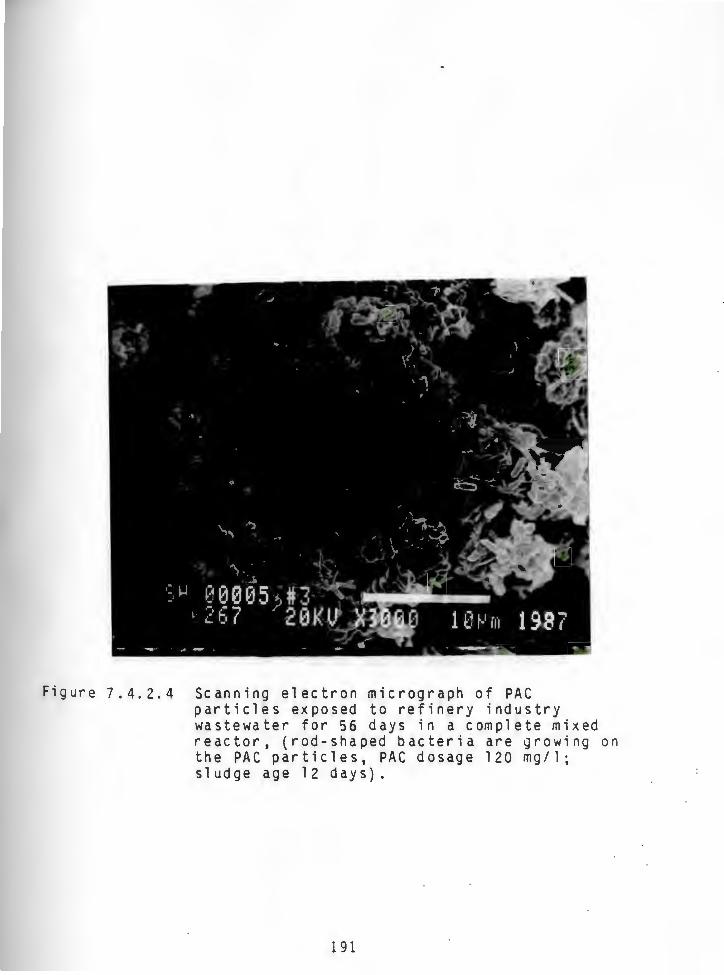
Figure 7.4 .2.4 Scanning electron micrograph of PAC particles exposed to refinery industry wastewater for 56 days in a complete mixed reactor, (rod-shaped bacteria are growing on the PAC particles, PAC dosage 120 mg/l; sludge age 12 days).
191

Figure 7.4.2.5 Scanning electron micrograph of PAC particles exposed to refinery industry wastewater for 56 days in complete mixed reactor, with 120 mg/L of carbon, (rodshaped bacteria are growing on PAC particles).
192

the PAC surfaces were available for adsorption.
7.5 Experiment 3: Air Stripping Process
Within the conventional AS treatment process several
dissolved organic removal mechanisms operate. The two
major removal mechanisms are biological oxidation and air
stripping. Air stripping can occur as dissolved organics
are transferred from the 1 iquid phase to the vapor phase
during the aeration process. '
Experiment 3 was conducted
in order to measure the potential air stripping of the
following six compounds: benzene, chloroform,
ethylbenzene, toluene, m-xylene and o-xylene. Each of
these compounds is categorized as a volatile organic
compound by the US EPA.
Three separate air flow rates were studied: 300,
400, and 500 ml/min/L. Each of these flow rates
corresponded to the typical pilot plant air flow rates
that were utilized during this study to maintain the
dissolved oxygen concentration within the optimal range of
5 to 6 mg/L.
A wide range of concentrations for each of the six
organic compounds was studied: benzene 360-1,903 ug/L,
chloroform 1,673-2,383 ug/L, ethylbenzene 20-340 ug/L,
toluene 100-1,433 ug/L, m-xylene 40-740 ug/L, and o-xylene
65-670 ug/L. The results of these experiments are
193

presented in Tables 7.5.1 to 7.5.3. With the exception of
the concentration of the chloroform effluent at a flow
rate of 400 ml/min/L of 50 ug/L, all other effluent
concentrations were below 10 ug/L which was the detection
limit for each of the volatile organics.
The air stripping results that were reported above
are s i mi 1 a r to a study by Ki n c an non et a 1 • ( 4 0 ) i n wh i ch
they observed that for an influent which consisted of a
mixed industrial wastewater the volatile compounds which
' have Henry's Law Constants 1 arger than 103 atom-m3/mol e
a r e st r i pp e d fr om th e A S r e a c tor . He n r y ' s Law Con st an t s
for benzene is 5.5 X 10³ atom-m3/mole, whereas the other
volatile compounds have constants in the range of 10-3
atom-m3/mole. Thus benzene is more easily stripped than
the other volatile compounds that were studied.
7.6 Experiment 4: PAC Without Activated Sludge
The purpose of experiment 4 was to quantify the
removals of each of the compounds previously studied, with
the exception of B00 5 , which would result only from
adsorption by the PAC present in the reactor. In order to
accomplish this, the pilot plant was operated exactly as
it was for the previous experiments except for the
elimination of the biomass in the reactor. The PAC
concentration in the reactor was maintained at 10 mg/L, 50
194

........ l.O (.}l
Toole 7 .5.1 ~rcent Striwing of VOl atile f.anix>urds in tt>rbiolCJJical Systan, Ex1Er1nent 3, air flow rate = 300 ml/min/L.
,
Benzene Ol l crof Cl'lTl Ethyl benzene Toluene M-Xylene 0-Xylene
llln Inft Efft Effy Inft Efft Effy Inft Efft Effy Inft Efft Effy Inft Efft Eff y Inft Efft Eff y rt>. (ug/L) (ug/L) (%)(ug/L) (ug/L) (%) (ug/L) (ug/L) (%) (ug/L) (ug/L) (%) (ug/L) (ug/L) (%) (ug/L) (ug/L) (%)
57 1 ,ro:> t{) >99 2,383 t{) >99 318 t{) ><J/ 1 ,350 t{) >99 440 t{) >~ 584 t{) >~
58 1 ,006 ND >99 2,339 ND >99 330 ND >97 1 ,383 ND >99 3fil t{) ><J/ 270 ND >~
59 1 , ~3 - t{) >99 2,353 t{) >99 318 t{) ><J/ 1 , 400 t{) >99 4flO t{) >~ 670 t{) >99
ND= tt>nedetectcble, detectcbility >10 ug/L

...... \.0 O'I
Tcble 7.5.2 Fercent striwing of Volatile r.cmi:ourds in t«>rbiola;iical Systan, Ex~riment 3, air flow rate = 400 ml/min/L.
,
!Slzene Ollcrofoon Ethyl benzene Toluene M-Xylene ~Xylene
llln Inft Efft Eff y Inft Efft Eff y Inft Efft Eff y Inft Efft Eff y Inft Efft Eff y Inft Efft Eff y t«>. (ug/L) (ug/L) {'.t){ug/L) (ug/L) (%) (ug/L) (ug/L) (%) (ug/L) (ug/L) (%) (ug/L) (ug/L) (%) (ug/L) (ug/L) (%)
60 l ,7<JJ NJ >99 2,295 NJ >99 340 t{) >'I/ l • 433 NJ >99 530 NJ >~ 3<JJ NJ ><JI
61 1,774 ND >99 2,299 ND >99 340 ND >97 l ,383 ND >'II 700 ND >'II 7 40 NJ ><JI
62 440 NJ >99 2,341 50 ~ 20 NJ >50 100 NJ ><JJ 70 NJ >86 00 NJ >00
ND= t(lne detectcble, detectcbility >10 ug/L

...... l.O -..
Table 7 .5.3 Fercent striwing of Volatile CanJX>urds in l'tlrt>iol cgical Systen, ExJEr1nent 3, Wien air flow rate 500 ml/min/L. ,
!Slzene Ollc:rofcnn Et.hylbenzene Toluene M-Xylene 0-Xylene
Rm Inft Efft Effy Inft Efft Eff y Inft Efft Eff y Inft Efft Effy Inft Efft Effy Inft Efft Effy l'tl. (ug/L) (LKJ/L) (%)(ug/L) (ug/L) (%) (ug/L) (ug/L) (%) (ug/L) (ug/L) (%) (LKJ/L) (LKJ/L) (%) (ug/L) (ug/L) (%)
63 340 t{) ><JI l ,784 t{) >99 100 t{) >94 160 t{) >94 60 t{) >83 00 t{) >00
64 360 ND ><JI 1,673 ND >99 ND ND ND 182 ND >95 ~ ND >89 150 ND >93
65 360 t{) ><JI l ,781 t{) >99 20 t{) >50 200 t{) >95 40 t{) > 75 65 t{) >ffi
ND= l'tlne detectcble, detect<bility >10 ug/L

mg/L and 120 mg/L during each individual phase of the
investigation. At each PAC concentration, the influent
and effluent concentrations of all previously studied
compounds were measured.
As the concentration of the PAC in the reactor was
increased from 10 mg/1 to 50 mg/L and finally to 120 mg/L
the COD removals increased from approximately 56% up to a
maximum of 83% (Tables 7.6.1-3 and Figure 7.6.1).
However, when these COD removals are compared to the
' removals which resulted from the combination of AS and
PAC, which averaged about 87% and were similar at al 1 PAC
dosages , i t co u 1 d be no t e d that fr om a PAC con c en tr at i on
of 10 mg/L up to a PAC concentration of 120 mg/L the
percentage removal imp.rovement was constant.
TOC removals were measured and the results are
presented in tabular form in Tables 7.6.1-3 and in
graphical form in Figure 7.6.2. The curve which depicts
the influence of various dosages of PAC on the TOC
removals showed a dependence on the PAC reactor
concentration as the TOC removals increased from 43% at a
PAC concentration of 10 mg/L up to 76% for a PAC
concentration of 120 mg/L. A similar but less pronounced
trend was evident for the PAC/AS system in that removals
increased from 82% with no additions of PAC up to 90% at
the highest PAC reactor concentration.
198

Table 7.6.1 COO and TOC Removal Efficiencies in Experiment 4, When PAC = 10 mg/L.
oate Oay coo TOC 1986 No. In ft Efft Eff y In ft Efft Effy
(mg/L) (mg/L) (%) (mg/L) (mg/L) (%)
12/20 66 419 134 68 25 13 48 12121 67 1,000 518 48 336 157 53 12/22 68 549 257 53 33 33 28
' Table 7.6.2 C 00 and TOC Removal Efficiencies in Experiment 4,
When PAC ·= 50 mg/L.
Date Oay coo TOC 1986 No. In ft Efft Effy In ft Efft Effy
(mg/L) (mg/L) (%) (mg/L) (mg/L) (%)
12123 69 584 104 82 56 14 75 12/24 70 588 100 83 39 12 69 12125 71 592 77 87 48 15 69
Table 7.6.3 COO and TOC Removal Efficiencies in Experiment 4, When PAC = 120 mg/L.
Date Oay coo TOC 1986 No. In ft Efft Effy In ft Efft Effy
(mg/L) (mg/L) (%) (mg/L) (mg/L) (%)
12/26 72 552 100 82 37 9 76 12/27 73 552 104 81 28 17 40 12/28 74 524 80 85 25 22 12
199

100
90 0
8 0 IO J < 70 > i eo I ~
IO z
¥ ' r .tO
~ 30 z
~ IO ~ 0 llO I WACTIVAlB> CAMON/ACTIVATED SL~ ...
10 ll PIO • && M:rWAWD CAWlN
0 0 10 20 • ... IO IO 70 ., IO 100 110 120
C.tMO.. DOeA•, Mell
Figure 7.6.1 A Comparison of COD Removal by PAC
and PAC/AS
200

100
90 (.)
0
0 ... 80 J < > 10
i eo I ... IO z w
¥ 40 f ... • a ! 20 ~ IL N. IL 0
"' 10 ~ "° • 0
0 10 • • 40 .. • 19 IO 80 100 110 120
CAMC* DO•-·· 11181L Figure 7.6.2 A Comparison of TOC Removal by PAC
and PAC/AS
201

Removal of the remaining priority organic pollutants
(2,4 dimethylphenol, fluorene, napthalene and pyrene) by
adsorption was studied and the results are presented in
Tables 7.6.4-6 and Figures 7.6.3-6. The influent
concentrations of 2,4 dimethyl phenol, fluorene, naphthalene
and pyrene ranged from 1,040-9,707 ug/L, 80-533 ug/L, 100-
4,093 ug/L, and 13-113 ug/L, respectively. Due to the
extreme variability of the influent organic concentration
there did not appear to be a correlation between the PAC
concentration in the reactor and the effluent
concentration. The compound 2,4 dimethylphenol effluent
concentration appeared to be relatively insensitive to
wide swings in the influent concentration, whereas the
effluent concentrations of the other compounds appeared to
somewhat track the highest variations in the influent
concentrations.
The adsorption of the priority organic compounds that
were previously studied was investigated. The percentage
removals of each of the volatile compounds (benzene,
chloroform, ethylbenzene, toluene, m-xylene and o-xylene)
during this experiment ranged from a low of 67% for
ethylbenzene to greater than 90% for each of the other
compounds (Tables 7.6.7-9). This was due to the fact that
th e v o 1 a t i 1 e c om po u n d s a r e ea s i 1 y a i r s tr i p p e d u n d er t he
operating conditions which exist in the reactor as shown
in section 7.5.
202

Table 7 .6.4 Priority ()'g<11ic R:>llutants' rero.ial Efficiencies in ExJErilrent 4', \then PAC= 10 ng/L.
ll:lte Illy 2,4,-DinEthrtlp,enol Flucrene Nar.titha l ene ~ 1~ ~. Inft Et Effy Inft Efft Eff y Inft Efft Eff y Inft Eff y (tg/L) (tg/L) (%) (tg/L) (tg/L) (%) ( tg/L) ( tg/L) (%) (tg/L) (tg/L) (%)
12/20 66 1,006 93 q) 100 ND >~ 1,axl 70 94 t{) ND ND 12/21 67 9,707 100 ~ 80 20 75 4,093 373 91 f'I) f'I) t{)
12/22 68 1,040 47 q) 533 13 ~ 1,ffi7 233 00 113 20 82 N 0 w
ND= ~ne det.ectcble, det.ectcbility >10 tg/L
Tit>le 7.6.5 Priority ()'g<11ic R:>llutants' rero.ial Efficiencies in Exr.er1nent 4, W\en F¥\C = 50 ng/L.
ll:lt.e Illy 2,4,-DinE~lP,enol Flucrene Nar.titha l ene Inft ~ 1~ ~. Jilft Ef Effy Inft Efft Eff y Inft Efft Effy Effy
(tg/L) (tg/L) (%) (tg/L) (tg/L) (%) (tg/L) (tg/L) (%) (tg/L) (tg/L) (%)
12/23 69 4,924 253 q) 111 3 w 1,267 25 ~ 13 t{) >23 12/24 70 4,920 153 97 187 13 93 533 87 84 ND ND ~ 12/25 71 4,506 33 99 220 49 78 573 120 77 t{) ND ND
ND= ~ne det.ectcble, det.ectcbility >10 tg/L

Table 7.6.6 Friority ()'gillie ~llutants' ltiro.ial Efficiencies in Exi:Eriment 4, W'len PAC= 120 ng/L. ..
~te ~y 2,4,-Dine~l~enol Flucrene N~thalene ~ 1~ It>. Jnft Ef Etty Jnft Efft Effy Jnft Efft Effy Jnft Effy (llJ/L) (llJ/L) (%) (llJ/L) (llJ/L) (%) ( llJ/L) ( llJ/L) (%) (llJ/L) (llJ/L) (%)
12/26 72 7 ,440 13 99 187 ND >~ (ffi 23 % ND ND ND 12/27 73 4,936 15 99 132 ND >92 933 8 99 NO ND ND 12/28 74 4,930 27 99 107 ND >91 100 24 ~ ND ND ND
N C> ~ ND= tt>ne detecta>le, detectitlility >10 llJ/L
Table 7.6.7 Volatile Canp:>urds ltiro.ial Efficiencies in Exi:Ednent 4, W'len PAC= 10 ng/L.
Benzene OllcrofC11T1 Ethyl benzene - Toluene M-Xylene 0-Xylene
~te ~ Jnft Efft Eff y Jnft Efft Eff y Jnft Efft Effy Jnft Efft Effy Jnft Efft Effy Jnft Efft Effy 1~ It>. (llJ/L) (llJ/L) (%)(llJ/L) (llJ/L) (%) (llJ/L) (llJ/L) (%) (llJ/L) (llJ/L) (%) (llJ/L) (llJ/L) (%) (llJ/L) (llJ/L) (%)
12/20 fi6 1,320 ND >99 2,1~ ND >99 50 ND >00 700 ND >99 120 ND >92 24) ND >% 12121 67 1,383 ND >99 2,239 ND >99 60 ND >83 640 ND >98 100 ND >94 240 ND >~ 12/22 68 2,092 ND >99 2,~ ~ % 560 ND >~ 3,ff,7 ND >99 1,076 ND >99 000 ND >99
ND = tt>ne de tee ta> le, de tee ta> il i ty > 10 t.g/L

PAC CONCENTRATION IN PAC/AS REACTOR _, 12000 I PAC - 10 mgll
I PAC - 50mgll
I ....... I I PAC - 120 mgll
g 11000
z I I ... 0 10000 .,_ <( a: 9000 .,_ z w 8000 (.) z 0 7000 (.) _, 0 8000 z
N w 0 J: 5000 (JI a. _,
>- 4000 J: .,_ ~ 3000
~ 2000 C\I
1000 EFFLUENT
ob:: 161 154 155 188 167 1S8 159 160 161
DAYS OF OPERATION 7.6.3 2,4-Dimethylphenol Removal by Powdered Activated Carbon

PAC CONCENTRATION IN PAC/AS REACTOR 600 I
PAC - 10 mgll I
PAC - 50 mgll I
I I PAC - 120 mgll
500~ I I
1\ I ... I I
500 ...J ....... g450 z 0 400 ~ ~ 350 ~
ffi 300 L INFLUENT
N ()
0 z °' 0 250
()
w z 200
~ 0 150 :::> ...J LL 100
:~ENT 153 154 155 158 1151 158 159 160 161
DAYS OF OPERATION 7.6.4 Fluorene Removal by Powdered Activated Carbon

PAC CONCENTRATION IN PAC/ AS REACTTOR
PAC - 10 mg/L PAC - 50 mg/L .
PAC - 120 mg/L I I
I ""
I I I I I
...J 5000 -Q :s .. z 0 ~ c 4000
a: .... L I \ INFLUENT z w 0 z 3000
N 0 0 0 -...J
w z w ...J 2000 c ~ :c A. c z 1000
EFFLUENT
0 1153 164 165 156 157 158 159 160 16!
DAYS OF OPERATION
7.6.5 Naphthalene Removal by Powdered Activated Carbon


Table 7.6.8 Volatile Conix>urds Jero.tal Efficiencies in ExJErirrent 4, Wien PAC= 50 nYJ/L .
!Enzene 01lcrof<l111 Ethyl benzene ..
Toluene M-Xylene (}.Xylene
Date ~ Inft Efft Effy Inft Efft Eff y Inft Efft Effy Inft Efft Effy Inft Efft Effy Inft Efft Eff y l<B5 ttJ. (tg/L) (tg/L) (%)(i.g/L) (tg/L) (%) (tg/L) (tg/L) (%) (tg/L) (tg/L) (%) (tg/L) (tg/L) (%) (tg/L) (tg/L) (%)
12/23 69 3,503 ND >99 3,003 500 84 160 ND >94 2,517 ND >99 730 ND >99 890 ND >99 12124 70 2,951 ND >99 2,688 301 89 160 ND >94 2,133 ND >99 560 ND >~ 800 ND >99 12/25 71 659 ND >~ 2 ,505 360 as 30 ND >67 510 ND >~ 560 ND >~ 370 ND >99
N
~ TIDle 7.6.9 Volatile Conix>t.rds Jero.tal Efficiencies in ExJEr1nent 4, Wien ~C = lal nYJ/L.
!Enzene 01lcrof<l111 Ethyl benzene Toluene M-Xylene (}.Xylene
Date ~ Inft Efft Effy Inft Ef ft Eff y Inft Efft Effy Inft Ef ft Eff y Inft Efft Effy Inft Efft Effy l<B5 ttJ. (tg/L) (tg/L) (%)(tg/L) (tg/L) (%) (tg/L) (tg/L) (%) (tg/L) (tg/L) (%) (tg/L) (tg/L) (%) (tg/L) (t.g/L) (%)
12/26 72 2,735 ND >99 2,679 570 100 190 ND >~ 2,(XX) ND >99 1,183 ND >99 1,fi63 ND >99 12/27 73 2,279 ND >99 2,597 00 100 30 ND >67 1,660 ND >99 865 ND >99 1,440 ND >99 12/28 74 1,638 ND >99 2,544 224 100 30 ND >67 1,133 ND >99 643 ND >~ 650 ND >~
ND = ttine detect.ab 1 e, detect.ability > 10 l1J/L

8. CONCLUSIONS
1. Activated sludge biomass that has been collected from
a municipal wastewater treatment facility can be
acclimated in a period of 31 days to treat a refinery
industrial wastewater.
2. various
a c c 1 i m a t i o'n
stages in the activated sludge biomass
period could be identified by a periodic
microscopic examination of the microorganism population.
3. PAC provided a favorable site for the attachment of
bacteria.
4. The conventional pollutants (B00 5 , COO and TOC) which
are present in a refinery industrial wastewater can be
removed by the activated sludge process and this removal
can be enhanced by PAC additions to the AS reactor.
5. Priority organic compounds (2,4 dimethyl phenol,
fluorene, naphthalene and pyrene) were removed by the AS
process, PAC additions to the AS reactor improved
percentage removals with the exception of pyrene.
6. Volatile organic compounds (benzene, chloroform,
ethyl benzene, toluene, m-xyl ene and o-xyl ene) were air
stripped from the reactor.
210

9. RECOMMENDATIONS
1. Since concentrations of oil and grease greater than
were investigated in this study could be present in a
refinery industrial influent especially during API
separator upset periods, the effects of these high oil and
grease levels on the activity of the biomass should be
' investigated.
2. An investigation should be conducted on the effects of
maintaining a DO concentration in the AS reactor in the
range of 2 mg/L.
3. It is possible that if a PAC/AS scheme were to be
con s tr u c t e d i n Ku w a i t to tr eat the w a s t e w a t er s fr om th e
SIA petrochemical complex, a significant fraction of the
total flow would consist of sanitary wastewater. Possible
effects of the additions of the sanitary wastewaters
should be investigated.
211

10. REFERENCES
1. Adams, Alan D., "Po'ttdered Carbon: Is it Really That Good?," Water Waste Eng., Vol. 121, No. B, March 1974, pp. B8-Bll.
2. Adams, Alan D., "Improving Activated Sludge Treatment with PoYKiered Activated Carbon-Textiles," Presented at the 6th Mid-Atlantic Industrial Waste Conference, University of Delaware, November 15, 1973, pp. 269-283.
3. Al khatib, Eid A., " Pilot Pl ant Study For the Treatment of Shuaiba Industrial Area Wastewater In Kuwait," Master Thesis, State University of New York at Buffalo, 1982.
4. "Aquatic Fate Process Data for Organic Priority Pollutants, "Final' Report, EPA 440/4-81-014 Environmental Protection Agency.
5. Bellar, T.A., and Lichtenberg, J.J., "Determining Volatile Organics at Microgram per Liter by Gas Chrcxnatography." J AWWA. Vol. 66, December 1974 . pp. 739-744.
6. Benefield, Larry D., Judkins, Joseph J., and Weand, Barron L., Process Chemistry For Water and Wastewater Treatment, Prentice-Hall Inc., Englewood Cliffs, New Jersey, 1982.
7. Bruvold, William H., "Obtaining Public Support for Reuse Water," Journal AWWA Vol. 77, July, 1985, pp. 72-83.
8. Chao, Yu M., and Shieh, Wen K., "PAC-Activated Sludge Treatment of Coke-Pl ant Wastewater," 40th Annual Purdue Industrial Waste Conference, Purdue University, May 14-15, 1985.
9. Chapnan, Peter M., Rcxnberg, G. Patrick, and Vigers, Gary A., "Design of Monitoring Studies for Priority Pollutants," Journal WPCF, Vol. 54, No. 1, March 1982, pp. 292-297.
10. Corneille, Richard, "Master Planning a Water Reuse System," Journal WPCF, Vol. 57, No. 3 March 1985, pp. 207-212.
11. Corsmit, C.W.," Paying for Reuse Water," Journal AWWA, Vol. 77, July 1985, pp. 78-83.
12. Crook, James, " Water Reuse in California," Journal AWWA, Vol. 77 July 1985, pp. 60-71.
212

13. Culp, Russell L., Wesner, George M., and Culp Gordon L., Handbook of Advanced Wastewater Treatment, Van Nostrand Reinhold Company, New York, 1978.
14. OeBoer, Jon, "Water Reuse: The Second Time Around," Journal AWWA, Vol. 77, July 1985, page 51.
15. DeJohn, Paschal B., and Adams, Alan D., "Treatment of Oil Refinery Wastewater with Granular and Po~ered Activated Carbon," Proceeding of 30th Industrial Waste Conference, Ann Arbor Sci., Ann Arbor, Michigan, 1975, pp. 216-231.
16. DeWalle, Foppe B., and Chian, Edward S., "Biological Regeneration of Powdered Activated Carbon Added to Activated Sludge Units," Water Research Vol. 11, 1977, pp. 439-446.
17. Engelbrecht, R.S., Gaudy, A.F., and Cederstrand, J.M., "Diffu~ed Air Stripping of Volatile Waste Components of Petro-Chemical Wastes," Journal WPCF, Vol. 33, No. 2, February, 1961, pp. 127-135.
18. Environmental Protection Agency, "Federal Register," Vol. 45, No. 231, November 28, 1980.
19. Federal Register, "Method 601-Purgeable Halocarbons," Vol. 49, No. 209, Friday, October 26, 1984, pp. 29-39.
20. Federal Register, "Method 602-Purgeable Aromatics," Vol. 49, No. 209 Friday, October 26, 1984, pp. 40-48.
21. Ferguson, John F., Oeay, George F., Merrill, M. Steve, and Benedict, Arthur H., "Po't.dered Activated Carbon Biological Treatment: Low Detention Time Process." Proceeding of the 31th Industrial Waste Conference, Purdue University, Ann Arbor Sci, Ann Arbor, Michigan, 1976, pp. 468-478.
22. Flynn, Brian P., Robertaccio, Francis L. and Barry, Louis T., "Truth or Consequence: Biological Fouling and Other Considerations in the Po't.dered Activated Carbon-Activated Sludge System," Proceeding of 31th Purdue Waste Conference, Purdue University, Ann Arbor Science, Ann Arbor Michigan, 1976, pp. 855-862.
23. Flynn, Brian P., "A Model for the Po't.dered Activated CarbonActivated Sludge Treatment system," Proceeding of 30th Industrial Waste Conference, Ann Arbor Science, Ann Arbor, Michigan, 1975, pp. 233-252.
213

24. Flynn, Brian P., and Stadnik, John G., "Start-up of the Powdered Activated Carbon-Activated Sludge Treatment System," Journal WPCF Vol. 51, No. 2 February, 1979, pp. 358-368.
25. Frohlich, Gerhard et al., "Performance of a Biophysical Treatment Process on a High Strength Industrial Waste," 31st Annual Purdue Industrial Waste Conference, May, 1976.
26. Gallagher, John R., and Mayer, Gale G., "Process Performance of Pilot-Scale Activated Sludge Treatment of Pretreated Coal Gasification Wastewater," 40th Annual Purdue Industrial Waste Conference, Purdue University, May 14-15, 1985.
27. Garcia-Orozco, Jorge H., Fuentes, Hector R., and Eckenfelder, W. Wesley, "Modeling and Performanced of the Activated Sludge-Po~ered Activated Carbon Process in the Preserke of 4,6 - Dinitro-o-cresol." Journal WPCF, Vol. 58, No. 4, April, 1986, pp. 320-325.
28. Gaudy, A.F., and Englebrecht, R.S., "The Stripping of Volatile Compounds," Proceedings of the Fifteenth Industrial Waste Conference, Extention Series No. 106, Purdue University, May 3, 4, and 5, 1960, pp. 224-234.
29. Gaudy, A.F., Turner, B.G. and Pusztaszeri S., "Biological Treatment of Volatile Waste Components." Journal WPCF, Vol. 35, No. 1, January 1963, pp. 75-93.
30. Ghannot.JTI, M., Thomson, M., Bownan, W., and Al-Khalil S., "Mode of Action of the Antimicrobical Compound 5-Bromo 5 nitro - 1,3 dioxane (Bronidox)," Folia Microbiologica, Vol 31, 1986, pp. 19-31.
31. Goff, James D. ,and Busch Paul L., "Reel aiming Desert Lands through Water Reuse," Journal AWWA Vol. 77, July 1985, pp. 84-87.
32. Grabowski, Theodore M., and Vogt, Kenneth L., "A Cooperative Effort Between Publicly Owned Treatment Works and Industrial Users Concerning Industrial Wastewater Management," Sun Refining and Marketing Company, Marcus Hook , Pa. , 1986 •
33. Hammer, Mark J., Water and Wastewater Technology, Second Edition, John Wiley & SOns, New York, 1986.
34. Heath, Harry W., " The PACT Process to Treat 40 MGD of Industr i al wastewater-Updated, II E. I. du Pont de Nemours & Company, Deepwater, NJ, 1986.
214

35. Heath, Harry W., "Full-Scale Demonstration of Industrial Wastewater Treatment Utilizing Ou Pont's PACT Process, " EPA - 600/52-81-159, Environmental Protection Agency, Dec. 1981 .
36. Heath, Harry W., "Update on the PACT Process", E. I. du Pont de Nemours & Canpany, Inc., Deepwater, New Jersey, 1986.
37. Janeczek, Joseph, and Lamb, James C., " Treatabil ity of a Gasification Wastewater Using the Powdered Activated Carbon/Activated Sludge Process," Proceedings of 37th Industrial Purdue Waste Conference, Purdue University, Ann Arbor Sci., Ann Arbor, Michigan, 1983, pp. 397-505.
38. Keith, Larry H., and Teilliard, William A., "Priority Pollutants I - A Perspective View," Environmental Science and Technology Vol. 13, No. 4, April 1979, pp. 416-423.
39. Kincannhn, Don F., Stover, Enons L. and Chung, Yu-Ping, "Biological Treatment of Organic Compounds Found in Industrial Aquaeous Effluent, " Presented at American Chemical Society, National Meeting, Atlanta Ga., March 29,- April 3, 1981.
40. Kincannon, Don F., Stover, Enos L., Nichols, Virgil, and Medley, David, "Removal Mechanisms for Toxic Priority Pollutants," Journal WPCF, Vol 55, No. 2, February 1983, pp. 157-163.
41. Lafrance, P., and Villessot M., "Bacterial Growth on Granular Activated Carbon, An Examinatt ion by Scanning Electron Microscopy." Water Resources, Vo. 17, No. 10, 1983, pp. 1467-1470.
42. Lauer, William C., Rogers, Stephen E. and Ray, Jean M., "The Current Status of Denver's Potable Water Reuse Project," Journal AWWA, Vol. 77, July 1984, pp. 52-59.
43. Leipzig, N.A., and Hockenbury, M.R., "Po'ltdered Activated Carbon/ Activated Sludge Treatment of Chemical Production Wastewaters," Proceedings of the 34th Industrial Waste Conference, Purdue University, Ann Arbor Sci., Ann Arbor, Michigan, 1979, pp. 195-205.
44. Lovett, O.A., Travers, S.M., and Davey, K.R., "Activated Sludge Treatment of Abattoir Wastewater - I, " Water Resources, Vol 18, No. 4, 1984, pp. 429-434.
45. Mahmud, Zahib, and Thanh, Nguyen Cong, "Biological Treatment of Refinery Wastes," Proceedings of the 33rd Industrial Waste Conference, Purdue University, Ann Arbor Sci, Michigan, 1979, pp. 515-526.
215

46. McClue, A.F., "Industrial Wastewater Recovery and Reuse," Journal AWWA, Vol. 66, April 1976, pp. 240-253.
47, McKay, G., Bino, M.J., and Althamemi, A.R., "The Adsorption of various Pollutants from Aqueous Solutions onto Activated Carbon," Water Resources, Vol 19, No. 4, 1985, pp. 491-495.
48. Metcalf and Eddy, Wastewater Engineering Treatment Disposal Reuse, McGraw-Hill Book Company, New York 1979.
49. Nell or, Margaret H., Baird, Rodger B., and Snyth, John R., "Health Effects of Indirect Potable Water Reuse, " Journal AWWA, Vol. 77, July 1985, pp. 88-96.
50. Nyer, Evan K.," Groundwater Treatment Technology," Van Nostrand Reinhold Company, New York, 1986.
' 51. Osantowski, R., Dempsey, Clyde R., and Kenneth, A. Dostal,
"Enhanced COD Removal from Pharmaceutical Wastwater Using PO\~ered Activated Carbon Addition to the Activated Sludge System," 40th Annual Purdue Industrial Waste Conference, Purdue University, May 14-16, 1985.
52. Perrich, Jerry R., "Activated Carbon Adsorption for Wastewater Treatment." CRC Press, Florida 1981.
53. "PO\..dered Carbon: Right Combination at Right Time." Reactor Journal, No. 57, A Zimpro, Inc. publication, June 1986, pp. 5-6.
54. Reitano, A.J., "Start-up and Operation of a Refinery Activated Sludge Plant," Proceeding of the 36th Industrial Waste Conference, Purdue University, Ann Arbor, Sci, Michigan, 1982, pp. 310-319.
55. Shannon, J. Dan, Derrington Bob, and Varma, Ashok, "Multipurpose Wastewater Reuse." Journal WPCF, Vol. 58, No. 11, November 1986, pp. 1039-1049.
56. Shaul, Glen M., Dempsey, Clyde R., and Dostal, Kenneth A., "Removal of AZO Dyes by Activated Sludge Process," 40th Annual Purdue Industrial Waste Conference, May 14-16, 1985.
57. Schroeder, Edward D., Water and Wastewater Treatment, McGraw-Hill, New York, 1977.
58. Shuaiba Area Authority," Assessment of Industrial Wastewater Pollution at Shuaiba Industrial Area," SAA, Kuwait, 1983.
216

59, Shuaiba Area Authority," Directory of Information and Regulations," Shuaiba, State of Kuwait, 1980.
60. Specchia, V., and Gianetto, A., "Po~ered Activated Carbon In An Activated Sludge Treatment Pl ant," Water Resources Vol. 18, No. 2 1984, pp. 133-137.
61. "Standard Methods for the Examination of Water and Wastewater WPCF, Sixteenth Edition, 1985.
62. Stensel, H.D., Shell, Gerald L., and Don, Newton, "Biological and Carbon Adsorption Treatment of a Refinery Wastewater," Industrial Waste Conference Purdue Un. Proceedings, Volume 28, Purdue University, Indiana, 1973.
63. Stenstrcxn, Michael K., and Grieves, Colin G., "Enhancement of Oil Refinery Activated Sludge By Addition of Po~ered Activated Carbon," Proceeding of the 32nd Industrial Waste 'Conference, Purdue University, Lafayette, Indiana 1977.
64. Stover, Enos L., and Kincannon, Don F., " Biological Treatability of Specific Organic Compounds found in Chemical Industry Wastewaters," Journal of WPCF, Volume 55, No. l, January 1983, pp. 97-109.
65. Tabak, Henery, H., Quave, Stephen A., Mashni, Charles I., and Barth, Edwin F., "Biodegradability Studies with Organic Priority Pollutant Ccxnpounds." Journal WPCF, Vol. 53, No. 10, October 1981, pp. 1503 - 1518.
66. Tabak, Henery H., Quave, Stephen A., Mashni, Charles I., Barth, Edwin F., "Biodegradability Studies for Predicting the Environmentatl Fate of Organic Priority Pollutants," Presented at 94th Annual Association of Official Analytical Chemists {AOAC) Meeting, Arlington, Virginia, October 20-23, 1980.
67. Thiem, Leon, Al-Muzaini, Saleh, and Alkhatib, E., "Ultimate Treatment of SIA Wastewaters for Reuse," Progress Report, February 1986.
68 . Th om a s , Q . V . , St o r k , J . R . a n d L am m e r t , S . L . , " Th e Chrcxnatographic and GC/MS Analysis of Organic Priority Poll utan ts in Water, " Journal of chrcxnatographic Science, Vol. 18, November, 1980, pp. 583 - 593.
69. Travers, S.M., and Lovett, D.A., "Activated Sludge Treatment of Abattoir Wastewater - II," Water Resource, Vol. 18, No. 4, 1984, pp. 435-439.
217

10. Unger, Michael T., and Claff, Roger E., "Evaluation of Percent Removal Variability for Priority Pollutants in DOTWS, " 40th Purdue Industrial Waste Conference, Purdue University, Indiana, May 14-18, 1985.
71. United States Environmental Protection Agency," Carbon Adsorption Isotherms for Toxic Organics," EPA - 600/8-80-023, Cincinnati, Ohio, April 1980.
7 2. U.S. Env i rormental Pro tee t ion Agency," Base/Neutrals and Acids Methods 625," US Environmental Monitoring and Support laboratory, Cincinnati, Ohio, July 1982.
73. vuuren, L.R.J., Clayton, A.J. and Post, D.C., "Current Status of Water Reel amation at Windhoek, " Journal WPCF, Vol. 52, No. 4, April 1980, pp. 661-671.
74. Wallace, Richard N., and Burns, Don E., "Factors Affecting Powder'ed Carbon Treatment of a Municipal Wastewater," Journal WPCF, Vol. 48, No. 3 March 1976, pp. 511-519.
75. "Wastewater Treatment Pl ant Design", Water Pollution Control Federation, Second Printing, Washington, D.C. 1982.
76. Water Pollution Control Federation, "Water Reuse, Manual of Practice SM-3 Systems Management," Washington D.C., 1983.
77. Water Pollution Control Federation," Wastewater Treatment Plant Design," WPCF, Washington, D.C., 1982.
78. Water Pollution Control Federation, "Industrial Wastewater Control Program For Municipal Agencies," WPCF, Washington D. C., 1982.
79. Weber, Walter J., Corfis, Nora H., and Jones, Bruce E., "Removal of Priority Pollutants in Integrated Activated Sludge-Activated Carbon Treatment Systems," Journal WPCF, Vol. 55, No. 4, April 1983, pp. 369-376.
80. Weber, Walter J., Pirbazari, Massoud, and Melson, Gail L., "Biological Growth on Activated Carbon: An Investigation by Scanning Electron Microscopy," American Chemical Society, Vol. 12, No. 7, July 1978, pp. 817-819.
81. Weber, Walter J., "Potential Mechanisms for Removal of Humic Acids Fran Water By Activated Carbon," Ann Arbor Science, Michigan, 1980, pp. 317-336.
82. Wells, Oliver C., Scanning Electron Microscopy, McGrawHill Book Co., New York, 1974.
218

83. Zimpro Inc., "Biomass Determination - Nitric Acid Digestion Method," Zimpro Inc., Wisconsin, 1985.
'
219

' APPENDICES
220

' Appendix 1 ·
A List of Priority Pollutants
221

Priority Pollutant Compounds
Compound Name Mole Wt
l . 2. 3. 4. 5 . 6.
7. 8 . 9.
*acenaphthene *acrolein *acryl onitril e *benzene *benzidine *carbon tetrachloride (tetrachloromethane)
154 56 53 78
184 154
*Chlorinated benzenes chlorobenzene
(other than dichlorobenzenes)
l ,2,4-trichlorobenzene hexac~lorobenzene
1 l 3 181
*chlorinated ethanes (including l ,2-dichloroethane, l ,l ,-thr1chloroethane and hexachloroethane)
10. 1,2-dichloroethane 99 11. 1,1,1-trichloroethane 133 12. hexachloroethane 237 13. 1,1-dichlorethane 99 14. 1, 1,2-trichloroethane 133 15. 1,1,2,2-tetrachloroethane 168 16. chloroethane 65
*Chloroalkyl ethers (chloromethyl, chloroethyl and mixed ethers)
17. bix(chloromethyl) ether 18. bix (2-chloroethyl) ether 137 19. 2-chloroethyl vinyl ether (mixed)
*chlorinated naphthalene 20. 2-chloronaphthalene 163
21. 2 2. 23. 2 4.
*chlorinated phenols (other than those listed elsewhere; includes trichlorophenols and chlorinated cresols) 2,4,6-trichlorophenol 197 parachlorometa cresol *chloroform (trichloromethane) 119 *2-chlorophenol 129
*Specific compounds and chemical classes as listed in original Consent Decree
222

*dishlorobenzenes 25. l ,2-d1chlorobenzene 26. 1,3-dichlorobenzene 27. 1 ,4-di chl orobenzene
*Dichlorobenzidine 28. 3,3-d1chlorobenz1dine
147 147 147
*Dichloroethylenes (1 ,1-dichloroethylene and 1 ,2-d1chloroethylene) 97
29 1 ,1-dichloroethylene 97 30. 1,2-trans-dichloroethylene 97 31, *2,4-dichlorophenol 163
*Dichloropropane and dichloropropene 32. 1,2-dichloropropane 113 33. 1,2-dichloropropylene (1,3-dichloropropene) 111 34. *2,4-dimethylphenol 122
' *Dinitrotoluene
35. 2,4-dinitrotoluene 182 36. 2,6,dinitrotoluene 182 37. *l,2-diphenylhydrazine 184 38. *ethylbenzene 106 39. *Fluoranthene 202
*Haloethers (other than those listed elsewhere) 40. 4-chlorophenyl phenyl ether 41. 4-bromophenyl phenyl ther 42. bis (2-chloroisopropyl) ether 43. bis (2-chloroethoxy)methane
*Halomethanes (other than those listed elsewhere) 44. Methylene chloride (dichloromethane) 85 45. methy chloride (chloromethane 50 46. methybromide (bromomethane) 95 47. bromoform(tribromomethane) 253 48. dichlorobromomethane 164 49. trichlorofluoromethane 139 50. dichlorodifloromethane 121 5 1 . ch 1 or o di b r om om ethane 2 O 8 52. *hexachlorobutadene 261 53. *hexachlorocyclopentadiene 273 54. *isophorone 138 55. *naphthalene 128 56. *nitrobenzene 123
*Specific compounds and chemical classes as listed in original Consent Decree
223

*Nitrophenols (including 2,4-dinitrophenol and din1trocresol)
57. 2-nitrophenol 139 58. 4-nitrophenol 139 59. *2,4-dinitrophenol 184 60. 4,6-dinitro-o-cresol 198
*Nitrosamines 6 1 . N - n i tr o sod 1 me thy 1 am i n e 7 4 62. N-nitrosodiphenylamine 198 63. N-nitrosodi-n-propylamine 130 64. *pentachlorophenol 266 65. *phenol 94
*Phth~late esters 66. bis (2-ethylhexyl) phthalate 67. butyl benzyl phthalate 310 68. di-n-butyl phthalate 69. Oi-n-octyl phthalate 70. diethyl phthalate 71. dimethyl phthalate
*polynuclear aromatic hydrocarbons 72. benzo(a)anthracene (1 ,2-benzathracene) 243 73. benzo(a) pyrene (3,4-benzopyrene) 74. 3,4-benzofluoranthene 75. benzo(k)fluoranthene (11,120 benzofluoranthene) 76. chrysene 228 77. acenaphthylene 152 78. anthracene 178 79. benzo(ghi)perylene (1 ,12-benzoperylene) 80. fluorene 166 81. phenanthrene 178 82. dibenzo(a,h)anthracene (1 ,2,5,6-dibenzanthracene) 83. ideno (l ,2,3-cd) pyrene (2,3-o-phenylenepyrene) 84. pyrene 202 85. *tetrrachloroethylene 166 86. *toluene 92 87. *trichloroethylene 132 88. *vinyl chloride (chloroethylene) 63
*Specific compoiunds and chemical classes as listed in original Consent Decree
224

Pesticides and Metabolities 89. *aldr1n 365 90. *dieldrin 381 91. *chlordane (technical mixture & metabolities) 410
*DDt and methabolities 92. 4,4-DDT 93. 4,4-DDE (p,p-DDX) 94. 4,4-DDD (p,p-TDE)
*endosulfan and metabolities 95. a-endosulfan-Alpha 96. b-endosulfan-Beta 97. endosulfan sulfate
*endrtn and metabolities 98. endrin 99. endrin aldehyde
*heptachlor and metabolities 100. heptachlor 101. heptachlor epoxide
l 0 2. l 0 3. l 0 4. l 0 5.
l 0 6. l 0 7. 108. l 0 9 • l l 0 . 111 . l l 2. 113. l l 4. l 15 . 116. l l 7 . 118. 119. l 20.
*hexachlorocyclohexane (al insomers) a-BHC-Alpha b-BHC-Beta r-BHC (lindane)-Gamma g- BHC-Del ta *polychlorinated biphenyls (PCBs) PCB-1242 (Archlor 1242) PCB-1254 (Arochlor 1254) PCB-1221 (Arochlor 1221) PCB-1232 (Arochlor 1232) PCB-1248 (Arochlor 1248) PCB-;260 (Arochlor 1260) PCVB-1016 (Arochlor 1016) *Toxaphene *Antimony *Arsenic *Asbestos *Beryllium *Cadmium *Cadmium *Copper
(Total) (Total) (Fibrous) (Total) (Total) (Total) (Tot al
*Specific compounds and chemical classes as listed in original Consent Decree
225
381
373 394
291 291 291 291

121. *Cyanide (Total) 122. *Lead (Total) 123. *Mercury (Total) 124. *Nickel (Total) 125. *Selenium (Total) 126. *Silver (Total) 127. *Thallium (Total) 128. *Zinc (Total) 129. *2,3,7,8 - tetrachlorodibenzo-p-dioxin (TCDD)
*Spec i f i c compound s and ch em i c al c l ass e s a s l i st e d i n original Consent Decree
'
226

' Appendix 2
Experiment 1: Figures for Bio-Kinetic Constants
227

'
~ 9P ·c-s--.>1 iee
228
0
0 Cl 0 Ill
co 0 0
<D 0 0
• 0 0
('lol 0 0
g 0
0
c 0
u ·.-I .µ OJ c
•.-I ~ I
0 •.-I Ill
N . .:i:

N N l.O
... I
>-• ,, .
'8 ...... ...
1.2
1.0
0.8
0.8
0.4
0.2
0.0
-0.~
-0.4
-0.8
,
0.0 0.1 0.2 0.3 0.4 0.5 0.6 0.7
<S.-S.)/0h . day - 1
A.2.2 Bio-kinetic Constants Evaluation,BOD
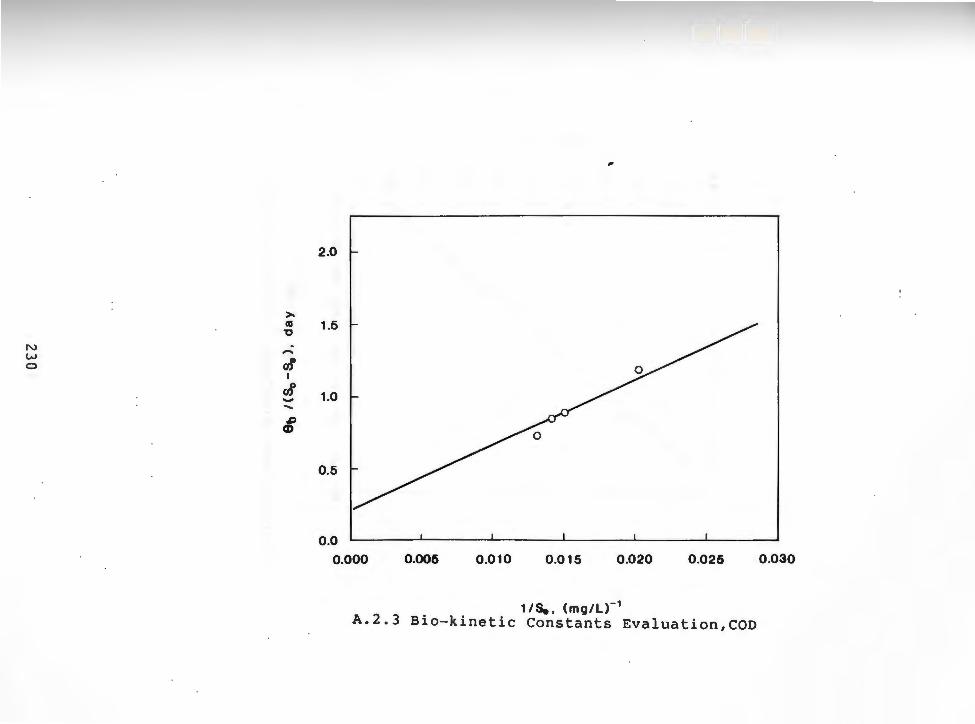
>-al 'O . .......
ur N w C>
I
uf ...... ..... .&;
a>
2.0
1.5
1.0
0.5
0.0
0.000 0.006
,
0.010 0.015 0.020 0 .025
1 /S.. (mg/L)-1
A.2.3 Bio-kinetic Constants Evaluation,COD
0.030

0.1
0.5
0.-4
' - 0.3 I
>-• 0.2 ~
" 0.1 -.,... 0.0
-0.1
-0.2
-0.3
-0.-4
0.2 o.• o.e o.a 1.0 1.2 1.-4 1.1 1.1
<S.-S.)10tr. day-1
A.2.4 Bio-kinetic Constants Evaluation,COD
231

N w N
>. al 'C
-,.. ur I
rJ ....... ...... ~
a>
,
18
14
12
10
8 t •
8
4
2
0
0.00 0.02 0 .04 0 .08 0.08 0.10 0.12
1 /S., (mg/L)- 1
A.2.5 Bio-kinetic Constants Evaluation, TOC

o.e
0.5
0.4'
0.3
0.2
>-• 0.1 'O
c8 o.o ...... ...
-0.1
-0.2
-0.3
-0.4'
-0.5
0.02 0.06 0.10 0.14 0.18 0.22
(So-S.)10h , day-1
A.2.6 Bio-kinetic Constants Evaluation,TOC
233

0 0
'° 0
..:i
........
0 O" e
0 rl II
co u 0 < . ci ~
Ul
' .µ -8
I c: .... tO ..J 0 - .µ
O' Ul E c: .._ 0 - u
• <A u 0 -.... ci ...,
<II c: .... ~
N I 0 · o 0 ....
'° r-N
0 0 <
N .. 0 0
.<wp ·c-.-~>1 ·'fa
234

N w <.n
-I >-• 'O
--Cl ..... -
2.4'
2.0
1.1
1.2
0.1
0.4'
0.0
-o.•
-o.a
-1.2
..
0.0 0.2 o.• 0.6 0.8 1.0 1.2
<So-S.)10h , day-1
A.2.8 Bio-kinetic Constants, PAC=lO rng/L,BOD

N w
°'
>-t1I
"O
-....... c3
I I
c3 ...... -.c CD
,
1.8
1.6
1.4
1.2,
1.0
0 .8
0.6
0.4
0.2
0.0
0 .00 0 .01 0.02 0.03 0.04 0 .06 0.06
1 /S., (mg/L)- 1
A.2.9 Bio-kinetic Constants, PAC=lO mg/ L,COD

0.6 ,
0.5
0.4
- 0.3 I
>. tU
"O 0.2 -" (]) 0.1 .....
N w ........
0.0
-0.1
-0.2
-0.3 0.1 0 .3 0.5 0.7 0 .9 1.1 1.3 1.5 1.7
(So -S.) I 6h , day -1
A.2.10 Bio-kinetic Constants, PAC•lO mg/L,COD

..... q 0
u g 0 E-1
0 ~
" "' s ~ 0 0 .-I
II u
' - ~ I ll< ..... ..J
~ -QI Ill 0 e .j.J .._ c: . ltS
" .j.J - Ill
Cf) - c: q 0 0 u
u ·~ .j.J
<"1 Q)
q c: ·~ 0 .!lo: I
0 ·~ Ill -0 .-I
0 .-I
N
~
8 0 - 0
~8p '( -S-°9)1 ~
238

N w l.O
-I >. as
"O
u CD ..... ,...
0 .8
0 .7
0 .6
0 .5
0.4
0.3
0.2
0 .1
0.0
-0.1
-0.2
,
o.o 0 .1 0 .2 0.3 0.4 0.5 0.6
<So - S.)leh , day _,
A.2.12 Bio-kinetic Constants, PAC=lO mg/L,TOC
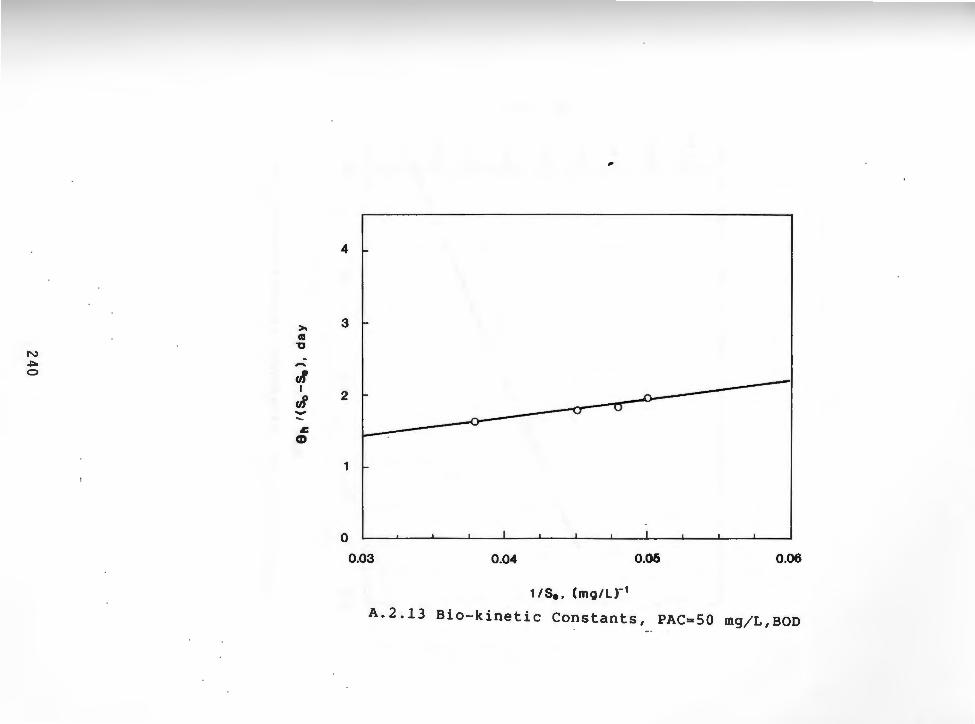
>-CG
"C N +:> ...... 0 cl
I
cl ..... -c CD
4
3
2
0
0.03 0.04
..
0.05 0.06
11s •• (mg1Lr1
A.2.13 Bio-kinetic Constants, PAC=SO mg/L,BOD

0.8
0.7
0.8
0.5 '
- 0.-i I
>-as
"O 0.3
" ...... 0.2 ... 0.1
0.0
-0.1
-0.2 0.-i 0.5 0.8 0.7 0.8
<S.-S.)19h . da y - 1
A.2.14 Bio-kinetic Constant s , PAC=SO mg/ L,BOD
241

'
• C'I 0 ao co • - - - 0 0 0
~ep ' ("S- °S)/ 49
242
-
-
....,
....,
__,
C'I 0 0 0
0
0 0
°' 8 0
a 0
,.._
8 0
~ 0
~ 0
0 0 u ..:I
" O'I e
0 l.O
• u < -I Cl. .....
-I ..... Cl II)
E .µ
-- c:: - ttS
~ .µ II) ..... c:: - 0 u u ..... .µ Q)
c:: ..... ~
I 0 ..... ca l.O r-1
N . <

N
""' w
... I >. al ,, .
ti ..... .,..
0.9
0.8
0.7
0.6
0.5
0.4
0.3
0.2
0.1
0.0
- 0.1
-0.2
I ...
0.0 0.2 0.4 0.8 0.8 1.0 1.2 1.4 1.6 1.8 2.0 2.2 2:4
<So - S.)/0h • day-1
A.2.16 Bio-kinetic Constants, PACmSO mg/ L,COD

N ~ ~
>-al "t:I .
" • "' I 0
"' .._, ...... .r.
CD
..
: t 6 I-
5 I-
4 I-
3 I-
2 ~ -Q_
1 [ 0 ' ' I I I I I I I I I
0.03 0.CM 0.05 0.06
1 /S. I (mg/L)-1
A.2.17 Bio-kinetic Constants, PAC=50 mg/L,TOC

0.7
.. 0.8
0.5
.. 0.4 I
>-• "O 0.3 -
" 0.2 ...... ....
N 0.1 ~ (.)'1
0.0
-0.1
-0.2
0.1 0.2 0.3 0.4 0.5 0.1 0.7 0.1
<s.-s. )/ 9h • d• y-1
A.2.18 BIO-kinetic Constants, PAC=SO mg/ L,TOC

0 0 CQ
~ ~ 0 " °' e
0 N .-t II u < ii.
~ Ul .. .µ 0 I c= ......
l '° .µ Ul c= . 0
' u
- u •M .µ (1)
~ c=
·M
0 ~ I
0 ·M CQ
°' .-t
N . <
s l') N
0
~•P ·c •s - °S)t 4 e
2-4 6
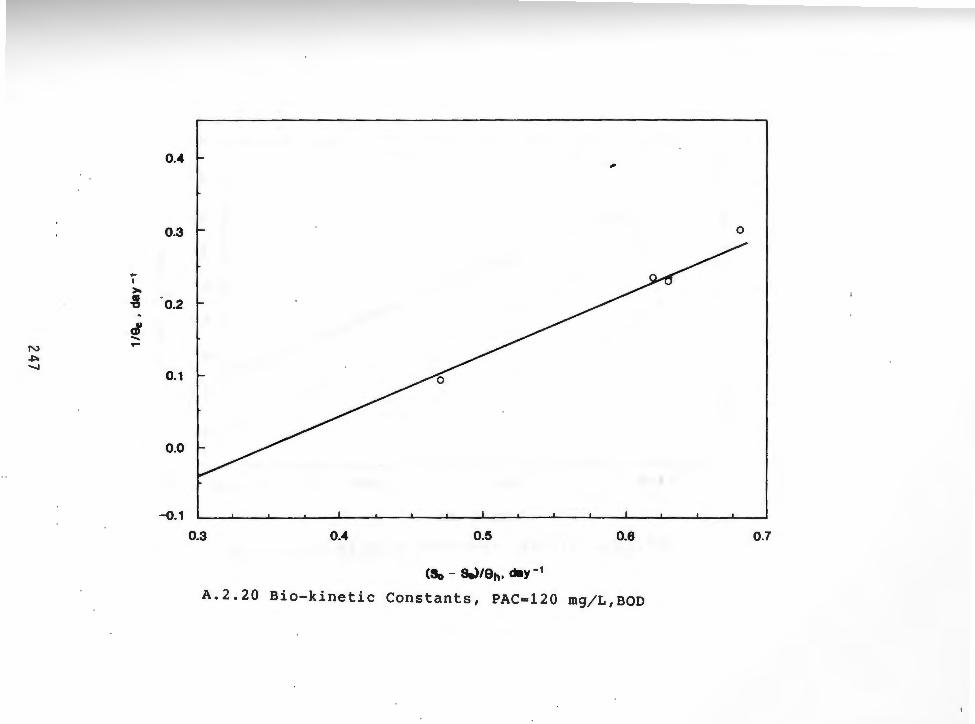
0.4
0.0
-0.1
0.3 0.4
""
0.5 0.6
cs., - s.>1eh. dlly-1
A.2.20 Bio-kinetic Constants, PAC=120 mg/L,BOD
0.7

1.8
I , UJ
1.4
>- 1.2
~ ,...;
1.0 rA I
0.8
" ..... N .... ~
.t::. o.e o:> CI>
0.4
0.2
o.o 0 .01 • 0 .02 0.03 0.04
1/S. • (mlJ/l)-1
A.2.21 Bio- kinetic Constants, PAC=120 mg/L,COD

N .$:>o l.O
-I >-Clll 't:I .
u a> ...... ...
o.e
0.5 ·
0.4
0.3
0.2
0.1
0.0
- 0.1
,
0.6 0.7 0.8 0.9 1.0 1.1 1.2 1.3
(So - S.)/9h· day - 1
A.2.22 Bio- kinetic Cons t ants, PAC=l20 rng/ L, COD

N (.}l
0
.. I
>o
-8 . ~ -...
o.e
O.~
0.4
0.3
0.2
0.1
0.0
-0.1.
-0.2
-0.3 0.2 0.3 0.4 .0.5 0.6 0.7
<S. - 9-)19tJ, <My -1
A.2.23 Bio-kinetic Constants, PAC=120 mg/L,TOC

,
4
>-as 3 "O
...... • CJ)
I
~ ...., 2 N -(Jl &. ....... Q)
1
0
0 .04 0.05 0.06 0.07 0.08 0.09 0.10 0.11
1 /Se • (mg/L) - 1
A.2.24 Bio-kinetic Constants, PAC-120 mg/L,TOC

Appendix 3
' Experiment 1: Figures for Priority Pollutants Removal
252
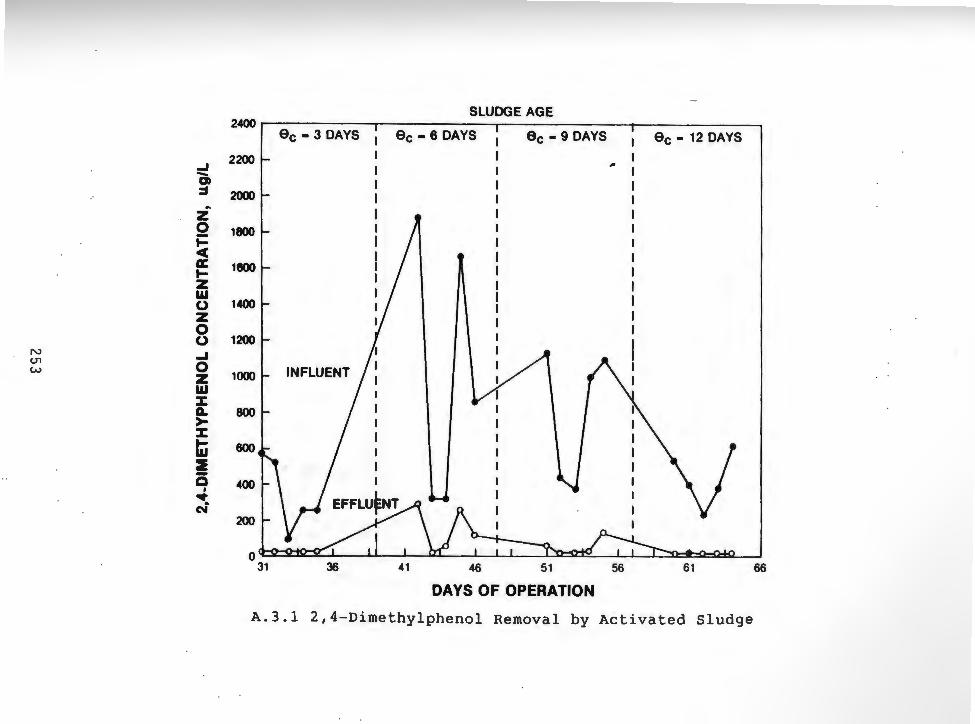
N U"I w
SLUDGE AGE 2400r--~~~~~-r~~~~~~-r~~~~~~~--~~~~~~~
_, 2200 -CJ) ~ 2000
z Q 1800 ~ c( a: 1900 ~ z w 0 1400 z 0 0 1200 ..... 0 z 1000 w %: ICL 800 > %: ti 600 ~ 0
I 400 ... N'
200
0c - 3 DAYS 0c - 6 DAYS 0c - 9 DAYS 0c - 12 DAYS
,,.
INFLUENT
0~ al a at' a 1 a :D>-o+d' , a~ I 31 36 41 46 51 56 61 66
DAYS OF OPERATION
A.3.1 2,4-Dimethylphenol Removal by Activated Sludge

..
SLUDGE AGE
0c - 3 DAYS I
0c - 6 DAYS I
0c - 9 DAYS 0c - 12 DAYS I I I I
""
I I I I I
!500 -' -CJ) :s .. z 0 400
~ a: t-z w 300
N u (.]1 z ~ 0
u w z 200 a: 0 ::> -' I\ INFLUENT IL
100
~, - . ~· I O ii !~1111 I I
31 36 41 46 51 56 61 66
DAYS OF OPERATION
A.3.2 Fluorene Removal by Activated Sludge

SLUDGE AGE 2400 I
0c - 3 DAYS I
0c - 6 DAYS I
0c - 9 DAYS 0c - 12 DAYS I I I I
2200
...I 200() I . ' I ""' -ca :s
a · 1800 z 0 i== c(
1600
a: ~ 1400 z w 0
1200 z 0 0
N w 1000 U1 z (.l1 w
.J 800 c( :c ~ 600 :c ~ c( z 400
200
Olk::: 36 41 46 51 56 61 66
DAYS OF OPERATION
A.3.3 Naphthalene Removal by Activated Sludge

SLUDGE AGE 120 I
0c - 3 DAYS I
0c - 6 DAYS I
0c - 9 DAYS 0c - 12 DAYS I I I I . .
110
100 . ' I I I I -...I - 90 at :s ~ z 80
0 i==
70 c( m: ... z 60 w 0 z 50 0
N 0 ()1
O"I w 40 z w I INFLUENT m:
30 > A.
20
·:L:z=T 36 41 46 51 56 61 66
DAYS OF OPERATION
A.3.4 Pyrene Removal by Activated Sludge

Appendix 4
Experiment 2: Figures for Priority Pollutants Removal
PAC- 10, 50, and 120 mg/L
'
257
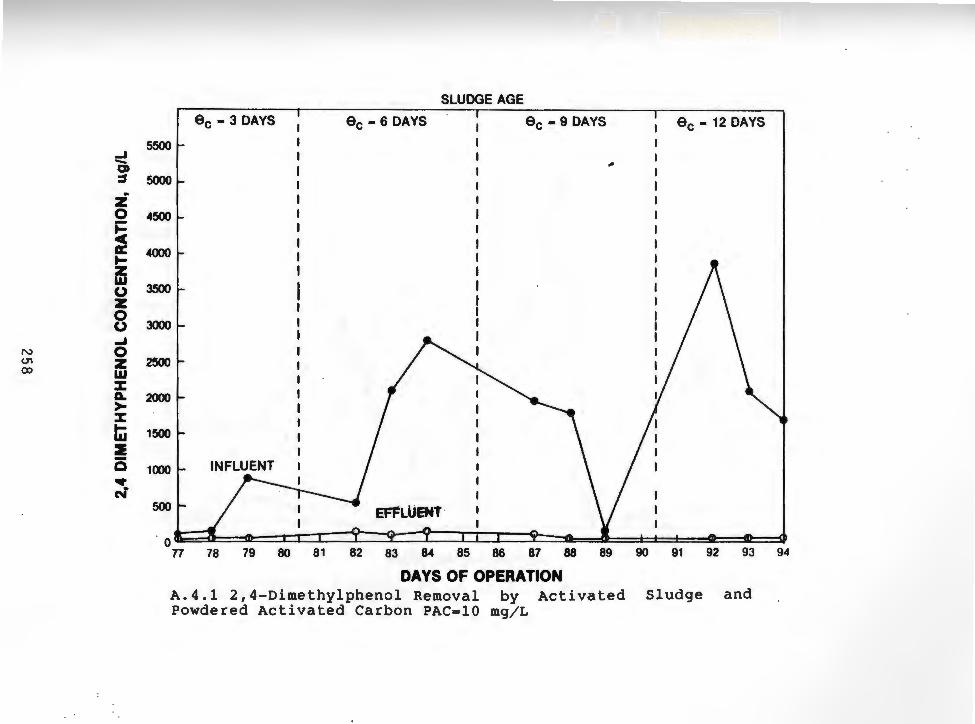
SLUDGE AGE
9c - 3 DAYS I
9c - 6 DAYS I
9c - 9 DAYS .
9c - 12 DAYS I
I I I
5500 _, - I , CJ) ~ 5000 .. z 0 4500 ~
~ 4000 ... z w 3500 0 z
0 0 3000 _,
N 0 ui z 2500 00 w
::J: ~ 2000 > ::J:
ti 1500 ::E Q 1000 ~ .. C'I
~' '-I - EFJ!LUENT · I
"""?-- ~ at: I I I n 78 79 80 81 82 83 84 85 86 87 88 89 90 91 92 93 94
DAYS OF OPERATION A.4.1 2,4- Dimethylphenol Removal by Powdered Activated Carbon PAC• lO mg/ L
Act i vated Sludge and

500 r-_, -O> ~ ~ z
0 400
~ a: .... z w 300 (,) z 0 (,)
N w (J"1 z 200 l.O -a:
0 ::> _, u.
100
SLUDGE AGE
0c - 3 DAYS 0c - 6 DAYS 0c - 9 DAYS 0c - 12 DAYS
I . ,
78 79 80 81 82 83 84 85 86 87 88 89 90 91 92 93 94
DAYS OF OPERATION A.4.2 Fluorene Removal by Activated Sl udge and Powde red Activated Carbon PAC• lO mg/ L

SLUDGE AGE
9c - 3 DAYS I
9c - 6 DAYS I
9c - 9 DAYS .
Sc - 12 DAYS I I I I I _,
:t I I I - I I , I Q
~ I I I .. I I I z 0 t=: 1600 c( a: t-
1400 z w 0 z 1200 0 0
N w 1000 °' C> z w _,
800 c( %: t-
600 %: A. c( z 400
200
0 r ~EFF~UEN~ n 78 79 80 81 82 83 84 85 86 87 88 89 90 91 92 93 94
DAYS OF OPERATION A.4.3 Naphthalene Removal by Activated Sludge Activated Carbon PAC=lO rng/L
and Powdered
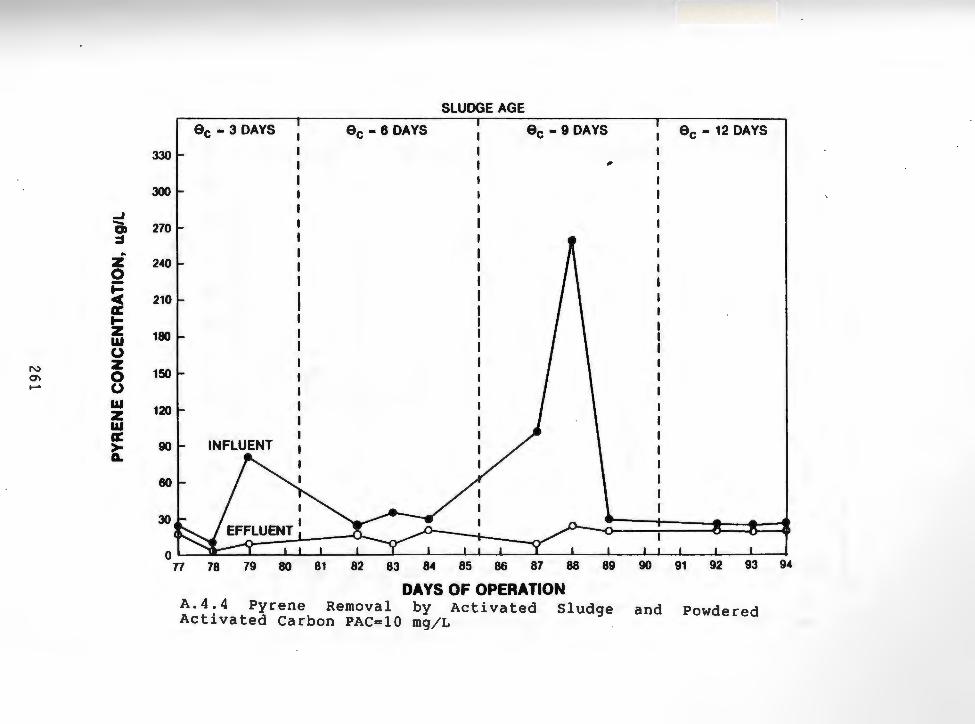
_, -a» ~ .. z
0 t= c( ~ ~ z w 0
N z O'I 0 ...... 0
w z w ~ > a.
SLUDGE AGE
0c - 3 DAYS 0c - 6 DAYS 0c - 9 DAYS .
0c - 12 DAYS I I I
3301 I I I I ,,.
I I 300
270
240
210
180
150
120
90
60
30
0~UEN1T: ~ I : ~ I ~ ~ , I I I I I
78 79 80 81 82 83 84 85 86 87 88 89 90 91 92 93
DAYS OF OPERATION A.4.4 Pyrene Removal by Activated Sludge and Powdered Activated Carbon PAC=lO mg/L
94

DA VS OF OPERATION A.4.5 2,4-Dimethylphenol Removal by Activated Sludge and Powdered Activated Carbon PAC=50 mg/ L
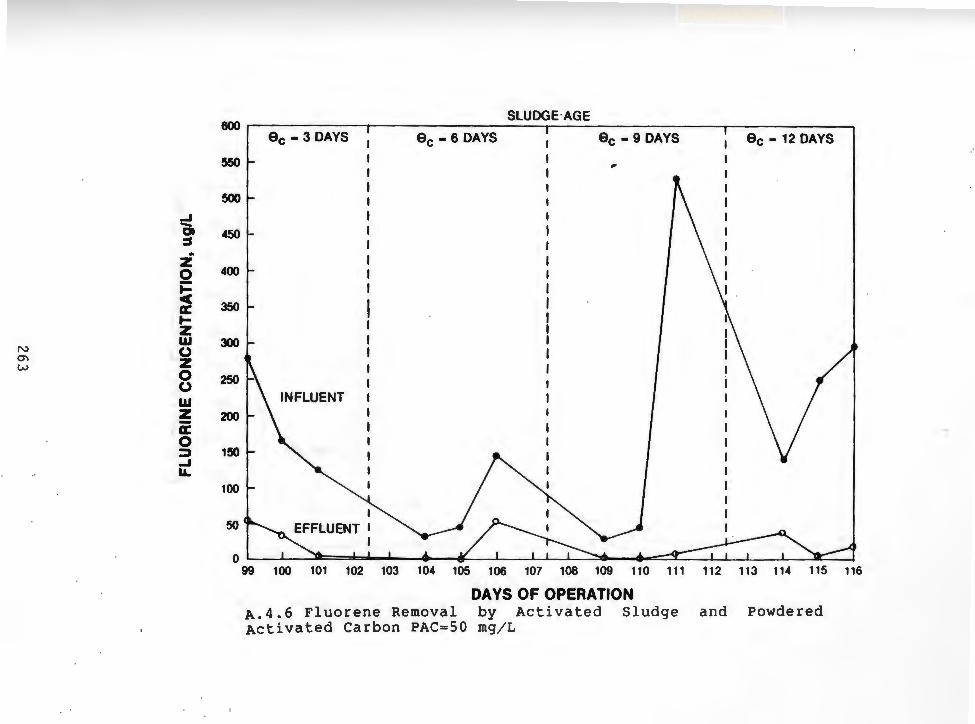
_, -a> :s .. z 0
~ a: ~ z w
N (.) CTI z w
0 (.)
w z -a: 0 ::> _, &&..
SLUDGE·AGE 600
0c - 3 DAYS 0c - 6 DAYS 0c - 9 DAYS .
0c - 12 DAYS I I I
'"°I I I I ""
I I 500
450
400
350
300
250
200
1!50
100
50
0
I \ INFLUENT
99 100 101 102 103 104 105 106 107 108 109 110 111 112 113 114 115
DAYS OF OPERATION A.4.6 Fluorene Removal by Activated Sludge and Powdered Activated Carbon PAC=50 mg/L
116

N O'I .p.
8800
-' 8000 Q :s z 0
~ a: tz w u z 0 u w z w -' c % t% A. c z
7200
6400
!5600
4800
4000
3200
2400
1600
l!IOO
SLUDGE AGE
9c - 3 DAYS 9c - 6 DAYS 9c - 9 DAYS 9c - 12 DAYS
,
INFLUENT
0 1 "'. · -;-· · · • • • " ~ , , , ~ ---+ =t , , , , ,e =:a
99 100 101 102 103 104 105 106 107 108 109 110 111 112 113 114 115 116
DA VS OF OPERATION A.4.7 Naphthalene Removal by Activated Sludge and Powdered Activated Carbon PAC=SO rng/L

_. -Q :s ~ z
0 t= c( a: t-z w
N (.) O"I z ()l
0 (.)
w z w a: > a..
SLUDGE AGE 60
9c - 3 DAYS I 9c - 6 DAYS I 9c - 9 DAYS I 9c - 12 DAYS .. , I I I , I I
50
. 45
40
35
30
25
20
15
10
5 r- \. I
EFFLUENT I
ol I r I) 99 100 101 102 103 104 105 106 107 108 109 110 111 112 113 114 115
DAYS OF OPERATION A.4.8 Pyrene Removal by Activated Sludge and Powdered Activated Carbon PAC=50 mg/L
116

...J -Q
=' ~ z
0 ~ ..: a: .... z w u z 0 u
N ...J °' 0 °' z
w :J: 0. > :J: ti :I c • N
SLUDGE AGE
9c - 3 DAYS I 9c - 6 DAYS I 9c - 9 DAYS I 9c - 12 DAYS I
11000 I I I ""
10000
9000
8000
7000
6000
5000
4000
3000
2000
1000
01 EFFLUENT t
121 122 123 124 125 126 127 128 129 130 131 132 133 134 135 136 137
DAYS OF OPERATION AA9 A.4.9 2,4-Dimethylphenol Removal by Activated Sludge and
Powdered Activated Carbon PAC=l20 mg/ L
138

N O'I -....J
SLUDGE AGE 38()..--~~~~~-r~~~~~~~~~-r-~~~~~~~~---.-~~~~~~~
0c - 3 DAYS 0c - 6 DAYS 0c - 9 DAYS 0c - 12 DAYS
330
.. 300 _,
a 210 ::s .. z 0
~ IE: .... z w 0 z 0 0 w z -IE: 0 ::> _, LL
240
210
INFLUENT 180
150
120
90
60
30 EFFLUENT
O~. I I I ~ I I I • ~!I I I J- J 121 122 123 124 125 126 127 128 129 130 131 132 133 134 135 136 137 138
DAYS OF OPERATION A.4.10 Fluorene Removal by Activated Sludge and Powdered Activated Carbon PAC=120

N
°' co
_, -a> ::::s
z 0
~ a: 1-z w () z 0 ()
w z w ._, c( :c 1-:c Q. c( z
SLUDGE AGE 4800.--~~~~~-1"~~~~~~~~~---..~~~~~~~~~---..~~~~~~--.
9c - 3 DAYS 9c - 6 DAYS 9c - 9 DAYS 9c - 12 DAYS
4400
.. 4000
3600
3200
2800
2400
2000
1600
1200
800
400
EFFLUENT 0 4 I I I I I I t • I I I I • I I I I • di,.........---)
121 122 123 124 125 126 127 128 129 130 131 132 133 134 135 136 137 138
DAYS OF OPERATION A.4.11 Naphthalene Removal by Activated Sludge and Powdered Activated Carbon PAC•l20 mg/L

N O'I \D
SLUDGE AGE ao.--~~~~~-r~~~~~~~~~----..~~~~~~~~~-.-~~~~~~~
9c - 3 DAYS 9c - 6 DAYS 9c - 9 DAYS 9c - 12 DAYS
55
50 , _, -CJ) . 45 :s .. z 0
~ a: .... z w u z 0 u w z w a: ~
INFLUENT
40
35
30
25
20
15
10
5 EFFLUENT
0 ~ .~ l I I • • • I I I 1J e • I I I ~ 121 122 123 124 125 126 127 128 129 130 131 132 133 134 135 136 137 138
DAYS OF OPERATION
A.4.12 Pyrene Removal by Activated Sludge and Powdered Activated Carbon PAC=120 mg/L

' Appendix 5
Modification of Purgeable Halocarbons Method 601
270

Method for Purgeable Halocarbons
This method is a modification of the EPA Test Method
No. 601.
Compounds Determined by this Method
1. Chloroform
' Method Summary
A 5 ml water sample is purged with helium gas at
ambient temperature. Concentrations of halocarbons in
water greater than 10 ug/L can be detected using gas
chromatography. The halocarbons in the resulting vapor are
trapped on a sorbent trap. After purging is completed,
the trap is heated and backflushed with inert gas to
absorb the halocarbons and transporting them to a GC
column where they are separated and analyzed with a Hall
detector.
Apparatus and Materials
- Tekmar LSC-2 purgeable unit
- Tracor 565 with 700A Hall Electrolytic Conductivity Detector
- GC Column - 1% SP-1000 on Carbopack B (60/80 mesh), 8 feet glass
271

- Three state tr a p : Ten ax I Si l i c a gel I Ch arc o al s (12" x 1/8")
- Distilled water
Standard Preparation
Stock standards are prepared at the beginning of the
test. Positive confirmation for the standard was made by
spiking the GC.
Each standard is prepared as follows: A 10 ml ground
glass sto~pered volumetric flash is filled to about 9.8 ml
of methanol and allowed to stand unstoppered for 10
minutes before weighing to the nearest 0.1 mg. A 100 ul
syringe is used to add 2-3 drops of each liquid standard
to the methanol. The drops must not contact the neck of
the flask. The flask is reweighed, diluted to volume.
Secondary dilution of each stock of 1/10 in distilled
water is made. Working standards are prepared by adding 1
ml of the stock solution to 100 ml of distilled water.
Dilutions of secondary solution are prepared yielding
standards around 10 ug/L or higher. Working standard are
stored in 40 ml teflon lined screw cap vials until used on
the same day.
Sam pl i ng
Samples are collected in triplicate in 40 ml screw cap
vials with teflon lines septa. The vials are filled so
272

that no headspace remains. Then, samples are refrigerated
in the laboratory.
Standard and Sample Analysis
A 5 ml syringe is filled with sample and the sample
is then loaded into the Tekmar sampler. The s am p 1 e i s
p u r g e d at r o om t em p e r at u re for 1 5 m i nu t e s w i th h e l i um a t
40 ml/min, then desorbed at 200°c for 4 minutes with
helium at 30 ml/min. The trap is baked at 1ao 0 c for 7
' minutes. The GC conditions for HALL are the following:
Initial temperature 45°c
Final temperature 200°c
Program rate
Initial hold
Detector temperature
Injection temperature
Final hold
Carrier gas, He
Reaction gas, H2
External Standard Quantitation
a 0 ctmin
3 min.
200°C
200°C
15 min.
40 ml/min
50 ml/min
Compounds are quantitated by comparing sample peak
areas and standard peak areas. Peaks are identified by
retention time.
273

Quality Control
1. A method blank is run every day to make the system is
free of interferences.
2. Standards are run for Retention Times to evaluate
laboratory data quality.
3. EPA Quality Control Check Samples are run to insure
the accuracy of our analytical system.
'
27 4

' Appendix 6
Modification of Volatile
Aromatics Method 602
275

Method for Volatile Aromatics
This method is a modification of the EPA Test Method No.
602.
Compound Determined by this Method
1. Benzene
2. Ethyl benzene
' 3 . Toluene
4. M-Xylene
5. 0-Xylene
Method Summary
A 5 ml water sample is purged with helium at ambient
temperature. The aromatics in the resulting vapor are
trapped on a sorbent trap. The trap was rapidly heated
and backflushed, desorbing the aromatics and transporting
them to a GC column where the were separated and analyzed
with a PIO. Concentrations of volatile aromatics in
wastewater greater than 10 ug/L can be detected at ambient
temperature. Initially positive samples were confirmed by
GC/MS. Positive confirmation for sample was made by
spiking the GC as wel 1.
276

Apparatus and Materials
- Tekmar Model LSC-2
- Tracor Model No. 565 with Photoionization Detector (PIO)
- GC Column - 1% SP-1000 on Carbopack B (60/80 mesh), 8 feet glass
- Three state trap: Tenax/Silica gel/Charcoals (12" x 1/8")
- Organic Free water
Standard Preparation
Stoc:'k standards are prepared. A 10 ml ground glass-
stoppered volumetric flask is filled with 9.8 ml of
methanol and all owed to stand unstoppered for 10 minutes
or until all alcohol wetted surfaces have dried before
weighing to the nearest 0.1 mg. A 100 ul syringe is used
to add 3 drops of each liquid standard to the methanol.
The drops must not contact the neck of the fl ask. The
flask is re-weighed, diluted to volume, stoppered and
mixed by inverting the flask several times. The
concentration calculated in ug/uL or in gm/ml. Stock
standard solutions transferred into a Teflon-sealed screw-
cap bottle and stored in the freezer. A secondary dilution
of stock solution is prepared. Dilution standards are
prepared by adding 1000 ul of stock solution to 100 ml of
distilled water. Working standards are prepared and
stored in a 100 ml or in a 50 ml flask until used on the
same day.
277

Sampling
Samples are collected in triplicate in 40 ml screw
cap vials with teflon lined septa. The vials are filled
so that no headspace remains.
Standard and Sample Analysis
5 ml syringe is filled with sample and then loaded
into the Tekmar sampler. The sample is purged at room
temperature for 15 minutes with helium at 40 ml/min., then
' desorbed 200°c for 4 minutes with helium at 40 ml/min.
Then the trap is baked at 18o 0 c for 7 minutes. The
sampler is rinsed with distilled water. The GC conditions
for PIO are the following:
Initial temperature
Final temperature
Program rate
Initial hold
Detector temperature
Injection temperature
Final hold
Carrier gas, He
Detector
278
45°c
200°c
a0 ctmin
3 min.
15 min.
40 ml/min
PIO

External Standard Quantitation
Peaks are identified by retention time. Compounds
are quantified by comparing peak area and daily run
standard peak areas. All sample > 10 ug/L} are
identified and their concentrations are determined and
recorded.
Quality Control
1. A method blank is run every day to make sure that the
s y s ~em i s fr e e o f i n t e r f e r e n c e s .
2. Standards are run for retention times to allow
detection of any potential problems.
3. EPA Quality control check samples are run to insure
the accuracy of our analytical system.
27 9

Appendix 7
Water Analysis in the Shuaiba Industrial Area
'
280

Analysis of Cooling Seawater at the Shuaiba Industrial Area. (Source: Ref. No. 59).
Parameter
Neutral Electrical Conductivity micranhos at 20°c
Total Dissolved Solids (TDS), ppm pH Free Causticity, ppm as NaoH Total 11 11
Total Alkalinity, ppm as Caco3 Total Chlorides, ppm as CL Total Sulph~tes, ppm as so4 Total Hardness, ppm as Caco3 Peranent Hardness, ppm as Caco3 Temporary Hardness, ppm as Caco3 Calcium Hardness, ppm as Ca++ Magnesium Hardness, ppm as Mg++ To ta 1 Free and Canb i ned Arrmon i ac a 1 Nitrogen, ppm NH3 Total Si 1 ica Soluble and Suspended, ppm as Si02 Phosphate, ppm as P04 Chlorine, ppm as CL2 (after Chlorination)
3 Tota 1 Iron, ppm as Fe + Sodium, ppm as Na+ Critical Temgerature of Cooling
Seawater, C Free Carbon Dioxide, ppm co2
281
Concentration
70,000-72,500 44,400-45,985
8.6-9.0 Nil
Less than 5 130-140
21 ,500-22,630 3,100-3,300 8 '400-8 '500 8 ,300-8 ,400
100-500 500-500
1,740-1,760
0.5-10.0
5-50
2.5
32

Drinking Water Analysis, Shuaiba Power and Water production Plants. (Source: Ref. No. 59).
Parameter Concentration
pH 7-8.5
TDS 500 mg/L
Chloride 150-200 mg/L
Sulphate 200-280 mg/L
Total Hardness 100-120 mg/L '
Total Iron 0.01-0.30 mg/L
Residual Chlorine 0.5 mg/L
Fluoride 0.7-1 mg/L
as CaC03
Conductivity 700-850 micromhos/cm
282

Analysis of Distilled Water Production By Shuaiba Power and Water Production Plants (Source: Ref. No. 59).
Concentrations (ppm) Parameter Normal Maximum
Neutral Electrical Conductivity in micr001hos at 20°c 5.0 50.0
Calculated Total Dissolved Solids (TDS) (Based on 0.60 ppm/umhos) 3.0
' pH
Free Causticity as NaOH
Total Causticity as NaOH
Total Chloride as Cl-
Total Alkalinity as Caco3
Total Sulphate as so4
Total Hardness as Caco3
Free Carbon Dioxide as co2
Tota 1 Iron
Silica as Si02
Total Anmoni acal Nitrogen (Free and Saline) as NH3
6.8-7.0
ND
ND
2.0
Trace
II
II
0 .10
0.05
0.05
0.02
283
30.0
9.0
ND
4.0
20.0
10.0
5.0
10.0
0. 10
0 .10
0 .10
2.0