Embed Size (px)
Citation preview
TREATMENT OF PALM OIL MILL EFFLUENT USING COMBINATION OF
MICROBIAL FUEL CELL AND ANAEROBIC MEMBRANE BIOREACTOR
KONG HONG FENG
A project report submitted in partial fulfillment of the requirements for the award
of the degree of Bachelor of Engineering (Hons.) Environmental Engineering
Faculty of Engineering and Green Technology
Universiti Tunku Abdul Rahman
May 2017
II
DECLARATION
I hereby declare that this project report is based on my original work except for citation
and quotations which have been duly acknowledged. I also declare that it has not been
previously and concurrently submitted for any other degree or award at UTAR or other
institutions.
Signature : ________________________
Name : Kong Hong Feng
ID No. : 12AGB02201
Date : ________________________
III
APPROVAL FOR SUBMISSION
I certify that this project report entitled “TREATMENT OF PALM OIL MILL
EFFLUENT USING COMBINATION OF MICROBIAL FUEL CELL AND
ANAEROBIC MEMBRANE BIOREACTOR” was prepared by KONG HONG
FENG has met the required standard for submission in partial fulfillment of the
requirements for the award of Bachelor of Engineering (Hons) Environmental
Engineering at Universiti Tunku Abdul Rahman.
Approved by,
Signature : ________________________
Supervisor : Dr. NG CHOON AUN
Date : ________________________
IV
The copyright of this report belongs to the author under the terms of the
copyright Act 1987 as qualified by Intellectual Property Policy of University Tunku
Abdul Rahman. Due acknowledgement shall always be made of the use of any material
contained in, or derived from, this report.
© 2017, Kong Hong Feng. All right reserved.
V
ACKNOWLEDGEMENTS
I would like to thank everyone who had contributed to the successful completion of this
project. Foremost, I would like to express my sincere gratitude to my research supervisor,
Dr. Ng Choon Aun and co-supervisor, Mr. Wong Ling Yong for their invaluable advice,
guidance, enormous patience and immense knowledge throughout the development of
the research.
In addition, I would also like to express my gratitude to the lab officers, Puan
Zila, Puan Noor Hazreena and Ms. Amelia Ng for assisting me during the lab session.
Moreover, I would like to thank my friends: Yeap Rui Ni, Kevin Cheah, Chai
Huey Yee, Ooi Joo Kheng, Jenny Lim and Ivan Quah who had helped and given me
encouragement during the hardship of the research. Last but not least, I am grateful to
my parents for the unceasing encouragement, support and attention through this venture.
VI
TREATMENT OF PALM OIL MILL EFFLUENT USING COMBINATION OF
MICROBIAL FUEL CELL AND ANAEROBIC MEMBRANE BIOREACTOR
ABSTRACT
Membrane fouling is a perennial problem that becomes a limiting step to the extensive
application of membrane technology in industry. In order to reduce the fouling
propensity, the effect of temperature on anaerobic membrane bioreactors (AnMBRs)
which operated under mesophilic and thermophilic regimes was investigated, and they
were found to have significant effect on AnMBRs performance. The difference in
operational temperatures was associated to the biomass growth rate in the bioreactors.
The highest COD removal efficiency was observed in mesophilic condition (45°C) with
an average COD removal efficiency of as high as 95.60 ± 0.30%. Despite the excellent
performance in removing the organic pollutant, the bioreactors operated at 45°C had the
highest filtration resistance compared to others. In order to further improve the filtration
performance, the AnMBRs were integrated with microbial fuel cell (MFC) instead of
sole AnMBR in treating palm oil mill effluent (POME). The MFC acted as a pre-
treatment unit prior to AnMBR and it was fed directly with POME. The supernatant
from MFC was further treated by AnMBR. Noticeable improvement in filtration
performance was observed in the combined system compared to sole AnMBR. Decrease
in polysaccharide amount was observed in combined system which in turn suggested
that the better filtration performance might be due to the capacity of MFC in reducing
the filamentous bacteria where its presence is associated to high extracellular polymeric
substances (EPS) secretion.
VII
TABLE OF CONTENTS
DECLARATION II
APPROVAL FOR SUBMISSION III
ACKNOWLEDGEMENTS V
ABSTRACT VI
TABLE OF CONTENTS VII
LIST OF TABLES X
LIST OF FIGURES XII
LIST OF SYMBOLS/ ABBREVIATIONS XIV
LIST OF APPENDICES XVI
CHAPTER
1 INTRODUCTION 1
1.1 Background 1
1.2 Problem Statement 5
1.3 Objectives 6
2 LITERATURE REVIEW 7
2.1 Overview of Membrane Bioreactor (MBR) Technology 7
2.2 Microbial Fuel Cell (MFC) 9
2.3 Integration of MBR with MFC 11
2.4 Palm Oil Mill Effluent (POME) 12
2.5 Anaerobic Digestion 14
2.6 Membrane 16
VIII
2.6.1 Membrane Filtration Process 16
2.6.1.1 Microfiltration (MF) 16
2.6.1.2 Ultrafiltration (UF) 16
2.6.2 Membrane Modularization 17
2.7 Membrane Fouling 19
2.7.1 Fouling Components 20
2.7.2 Fouling Control 21
2.8 Operating Conditions of MBR System 23
2.8.1 Sludge Retention Time (SRT) 23
2.8.2 Hydraulic Retention Time (HRT) 24
2.8.3 Flux 24
2.8.4 Temperature 25
2.9 Activated Carbon (AC) 26
3 METHODOLOGY 27
3.1 Experimental Setup 27
3.1.1 Air Cathode Preparation 28
3.2 Materials Used 29
3.2.1 Powdered Activated Carbon (PAC) 29
3.2.2 Palm Oil Mill Effluent (POME) 30
3.3 Analytic Methods 31
3.3.1 Mixed Liquor Suspended Solid (MLSS) and Mixed
Liquor Volatile Suspended Solid (MLVSS) 31
3.3.2 Chemical Oxygen Demand (COD) 31
3.3.3 Polysaccharide 32
3.3.4 Particle Size Analysis 32
3.3.5 pH Measurement 32
3.3.6 Cross Flow Filtration 32
3.3.7 Electrical Power Production 33
4 RESULTS AND DISCUSSIONS 35
IX
4.1 Assessment of Performance of Hybrid Anaerobic
Bioreactors Operated under Different Temperatures 35
4.1.1 Effect of Temperature in COD Removal 36
4.1.2 Assessment of MLSS and MLVSS in Hybrid
Anaerobic Bioreactors Operated under Different
Temperatures 39
4.1.3 Effect of Temperature on Microbial Floc Size in
Hybrid Anaerobic Bioreactors 40
4.1.4 Membrane Fouling Control in Anaerobic Membrane
Bioreactor Operated under Different Temperatures 42
4.2 Assessment of Performance of MFC 45
4.3 Assessment of Performance of Hybrid Anaerobic Bioreactors
Integrated with MFC 46
4.3.1 Wastewater Treatment Performance in Hybrid
Anaerobic Bioreactors Integrated with MFC 47
4.3.2 Assessment of MLSS and MLVSS in Hybrid
Anaerobic Bioreactors Integrated with MFC 48
4.3.3 Assessment of Microbial Floc Size in Hybrid
Anaerobic Bioreactors Integrated with MFC 48
4.3.4 Membrane Fouling Mitigation by Integrating
Hybrid Anaerobic Bioreactors with MFC 50
5 CONCLUSION AND RECOMMENDATIONS 56
5.1 Conclusion 56
5.2 Recommendations 57
REFERENCES 59
APPENDICES 67
X
LIST OF TABLES
TABLE
TITLE
PAGE
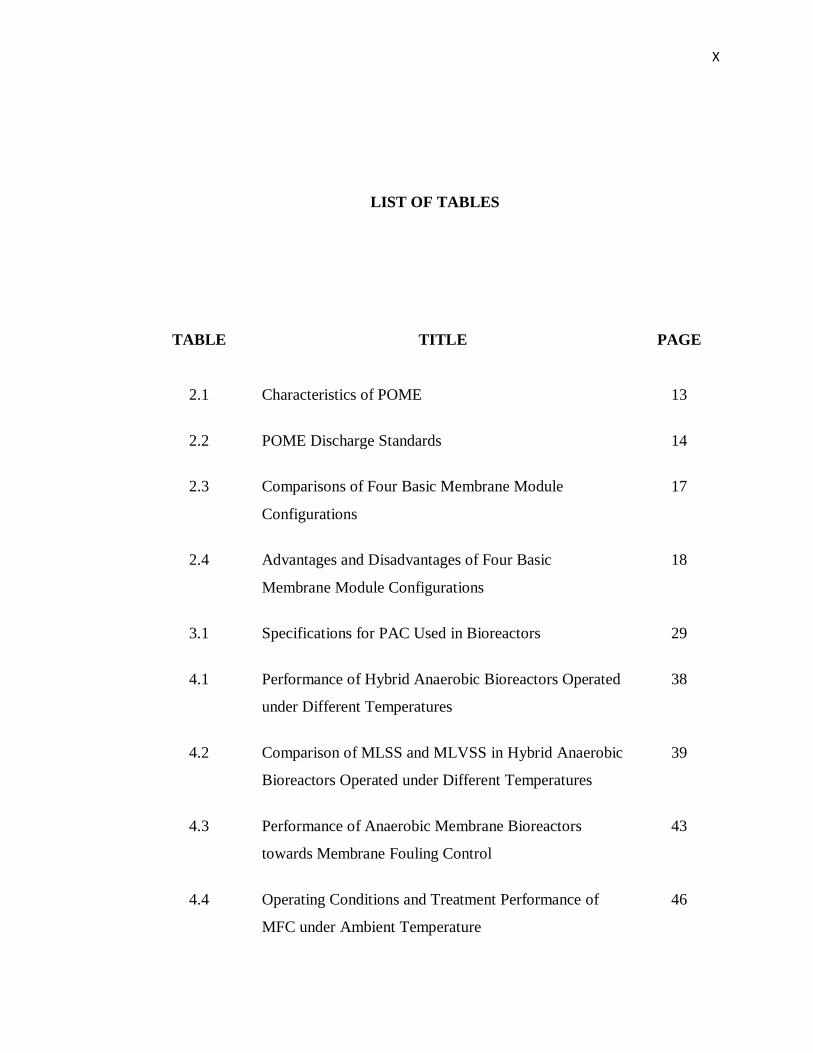
2.1 Characteristics of POME
13
2.2 POME Discharge Standards
14
2.3 Comparisons of Four Basic Membrane Module
Configurations
17
2.4 Advantages and Disadvantages of Four Basic
Membrane Module Configurations
18
3.1 Specifications for PAC Used in Bioreactors
29
4.1 Performance of Hybrid Anaerobic Bioreactors Operated
under Different Temperatures
38
4.2 Comparison of MLSS and MLVSS in Hybrid Anaerobic
Bioreactors Operated under Different Temperatures
39
4.3 Performance of Anaerobic Membrane Bioreactors
towards Membrane Fouling Control
43
4.4 Operating Conditions and Treatment Performance of
MFC under Ambient Temperature
46
XI
4.5 Treatment Performance of Hybrid Anaerobic
Bioreactors Combined with MFC under Different
Temperatures
47
4.6 Comparisons of MLSS and MLVSS in Hybrid
Anaerobic Bioreactors Integrated with MFC
48
4.7 Performance of MFC-AnMBRs towards Membrane
Fouling Control
51
XII
LIST OF FIGURES
FIGURE
TITLE
PAGE
1.1 World Production of Oils and Fats
2
1.2 Planted Area of Palm Oil in Malaysia from Year 1975 to
2011
3
1.3 Palm Oil Word Production
3
3.1 Particle Size Distribution of PAC in Terms of Volume
29
3.2 Particle Size Distribution of PAC in Terms of Size
30
3.3 Schematic Diagram of Cross Flow Filtration Process
33
4.1 Sludge Floc Sizes Distribution of Hybrid Anaerobic
Bioreactors in Terms of Volume
41
4.2 Sludge Floc Sizes Distribution of Hybrid Anaerobic
Bioreactors in Terms of Size
41
4.3 Comparison of TMP Profile for Anaerobic Membrane
Bioreactors Operated at Different Temperatures
44
4.4 Sludge Floc Sizes Distribution of Hybrid Anaerobic 49
XIII
Bioreactors Integrated with MFC in Terms of Volume
4.5 Sludge Floc Sizes Distribution of Hybrid Anaerobic
Bioreactors Integrated with MFC in Terms of Number
50
4.6 Comparison of Overall COD Removal Efficiencies in
MFC, AnMBRs and MFC-AnMBRs
52
4.7 Comparison of Amount of Polysaccharide Present in
AnMBRs and MFC-AnMBRs
52
4.8 Comparison of TMP Profile for AnMBR and MFC-
AnMBR Operated at 25°C
53
4.9 Comparison of TMP Profile for AnMBR and MFC-
AnMBR Operated at 35°C
54
4.10 Comparison of TMP Profile for AnMBR and MFC-
AnMBR Operated at 45°C
54
4.11 Comparison of TMP Profile for AnMBR and MFC-
AnMBR Operated at 55°C
55
XIV
LIST OF SYMBOLS/ ABBREVIATIONS
V voltage
I current
R external resistance
P power density
AC activated carbon
AD anaerobic digestion
AnMBRs anaerobic membrane bioreactors
BAC biological activated carbon
BOD biological oxygen demand
COD chemical oxygen demand
EPS extracellular polymeric substances
HRT hydraulic retention time
LB-EPS loosely bound extracellular polymeric substances
MBR membrane bioreactor
MF microfiltration
MFC microbial fuel cell
MLSS mixed liquor suspended solids
MLVSS mixed liquor volatile suspended solids
NOM natural organic matter
PAC powdered activated carbon
POME palm oil mill effluent
PTFE polytetrafluoroethylene
SMP soluble microbial product

XV
SRT sludge retention time
TMP transmembrane pressure
UF ultrafiltration
VFA volatile fatty acid
XVI
LIST OF APPENDICES
FIGURE
TITLE
PAGE
A1 Hybrid Anaerobic Bioreactor Operated at Ambient
Temperature
67
A2 Hybrid Anaerobic Bioreactor Operated at 45°C
68
A3 Hybrid Anaerobic Bioreactor Operated at 55°C (left)
and 35°C (right)
68
A4 Microbial Fuel Cell Operated at Ambient Temperature
69
B1 COD Reactor
70
B2 UV-Vis Spectrophotometer (DR 6000)
70
B3 Oven
71
B4 Muffle Furnace
71
B5 Particle Size Analyzer
72
B6 pH Meter
72
B7 Analytical Balance
73
XVII
B8 Cross Flow Membrane Test Rig
73
B9 Multimeter
74
C1 Powdered Activated Carbon (PAC)
75
C2 Palm Oil Mill Effluent (POME)
75
C3 Phenol
76
C4 Glass Microfibre Filter
76
1
CHAPTER 1
INTRODUCTION
1.1 Background
Oil palm is a perennial and valuable crop that grows in the tropical regions of the world
like Indonesia and Malaysia, with hot and humid climate throughout the year and the
production continues throughout the year (Garcia-Nunez et al., 2016). Its product, palm
oil is cheap, production-efficient and highly stable oil that are widely used in a variety of
foods, cosmetic, hygiene products and even potentially to be used as a source for biofuel,
rendering palm oil to be one of the worlds’s most produced and consumed oils
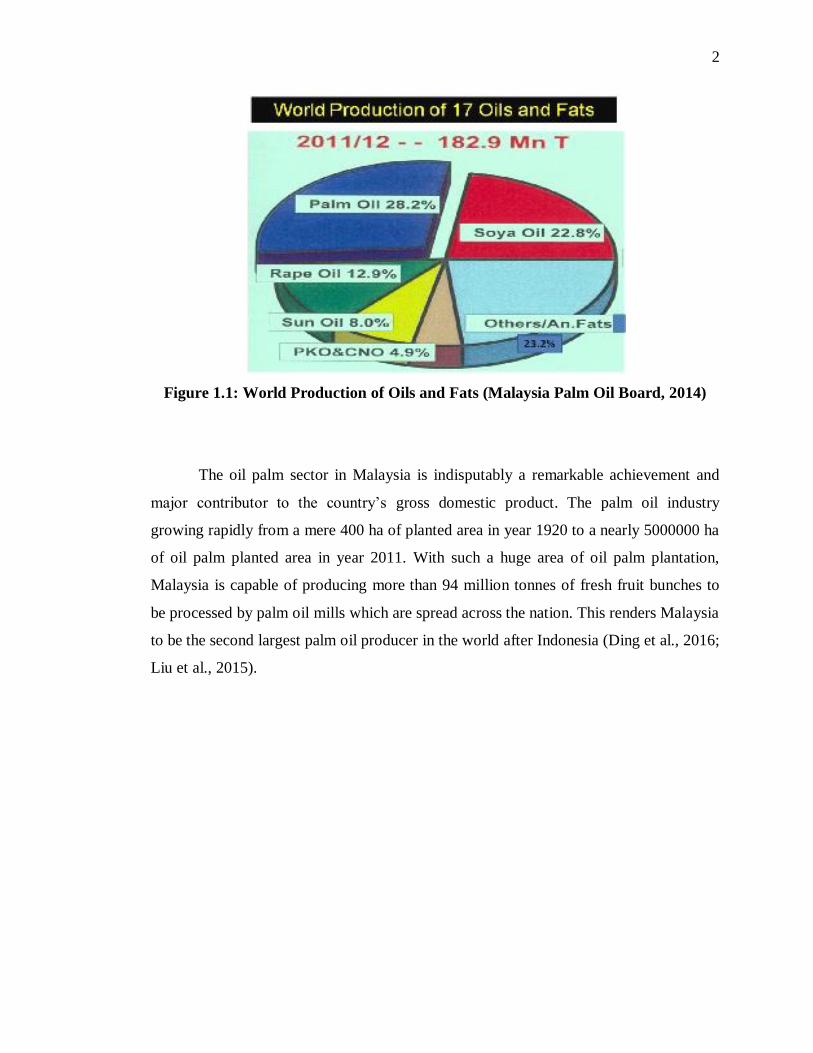
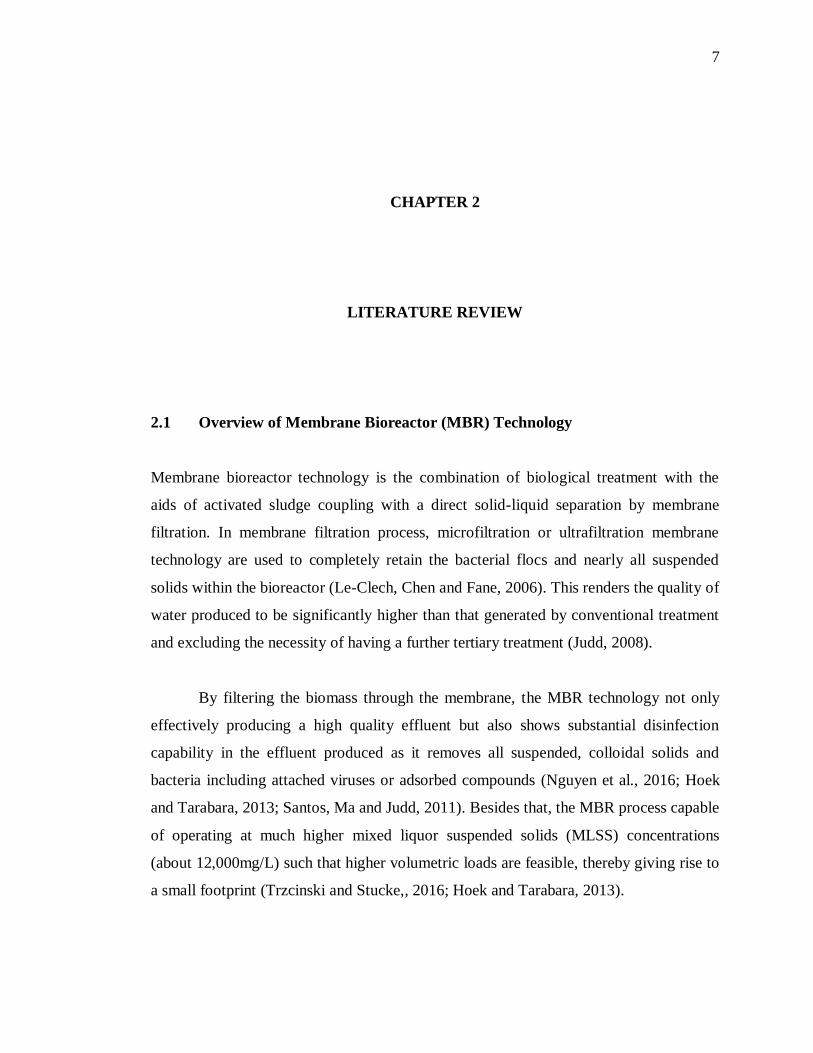
(Indonesia-Investments, 2016). According to Malaysia Palm Oil Board (2014), the
production of palm oil accounts for 28.2% in overall world production of oils and fats
from year 2011 to 2012.
2
Figure 1.1: World Production of Oils and Fats (Malaysia Palm Oil Board, 2014)
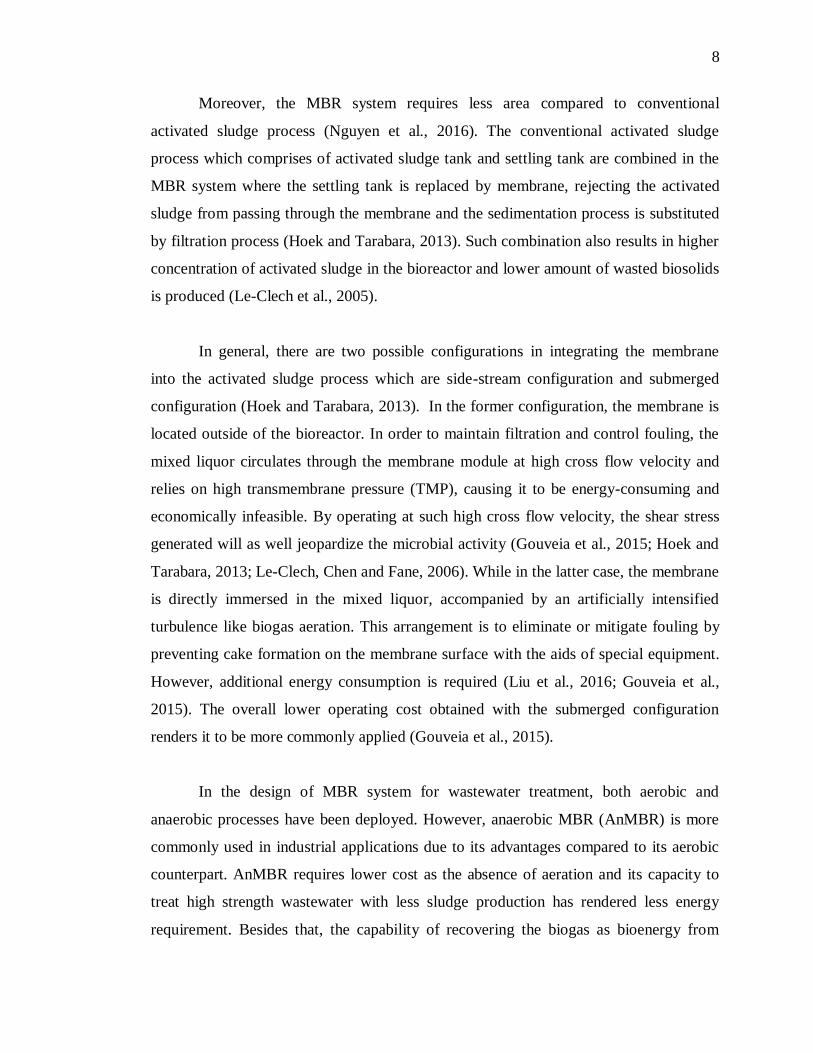
The oil palm sector in Malaysia is indisputably a remarkable achievement and
major contributor to the country’s gross domestic product. The palm oil industry
growing rapidly from a mere 400 ha of planted area in year 1920 to a nearly 5000000 ha
of oil palm planted area in year 2011. With such a huge area of oil palm plantation,
Malaysia is capable of producing more than 94 million tonnes of fresh fruit bunches to
be processed by palm oil mills which are spread across the nation. This renders Malaysia
to be the second largest palm oil producer in the world after Indonesia (Ding et al., 2016;
Liu et al., 2015).
3
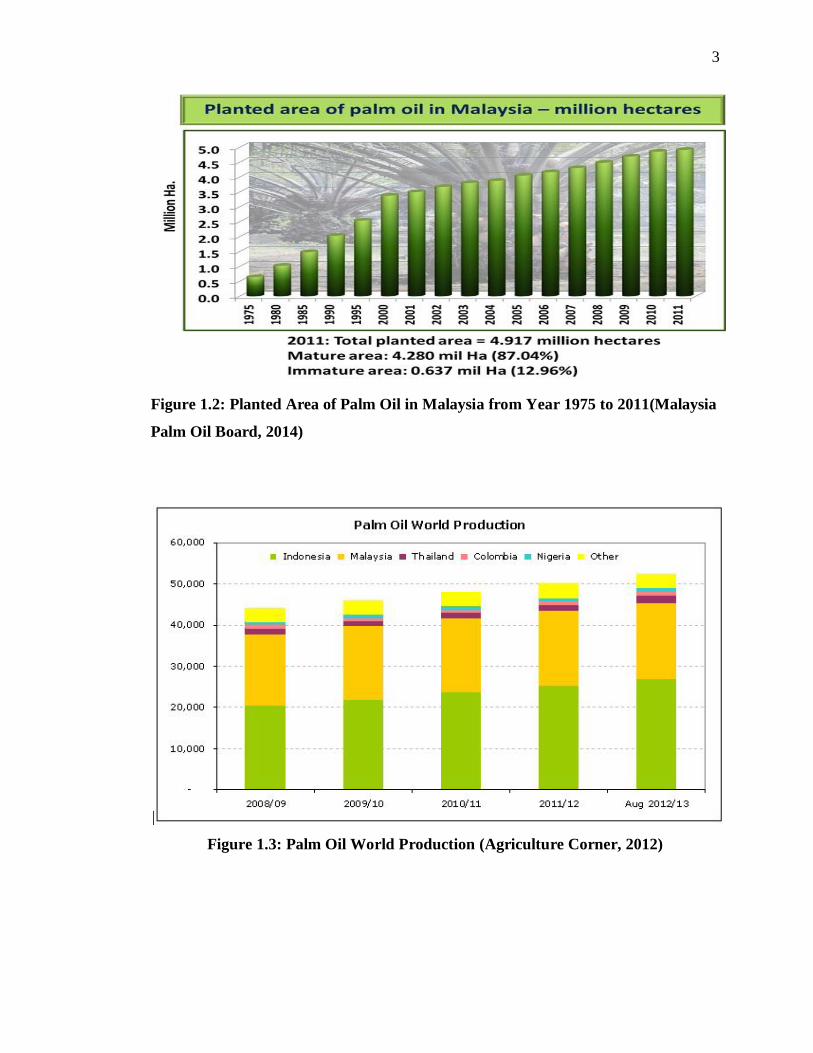
Figure 1.2: Planted Area of Palm Oil in Malaysia from Year 1975 to 2011(Malaysia
Palm Oil Board, 2014)
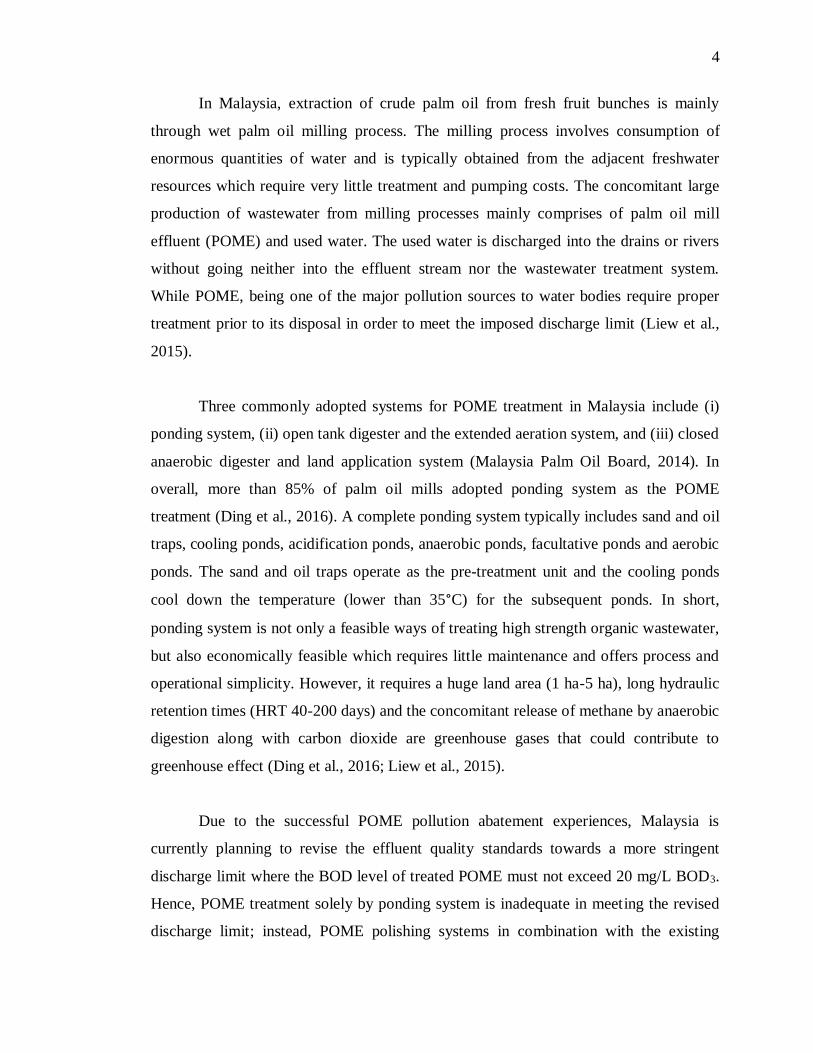
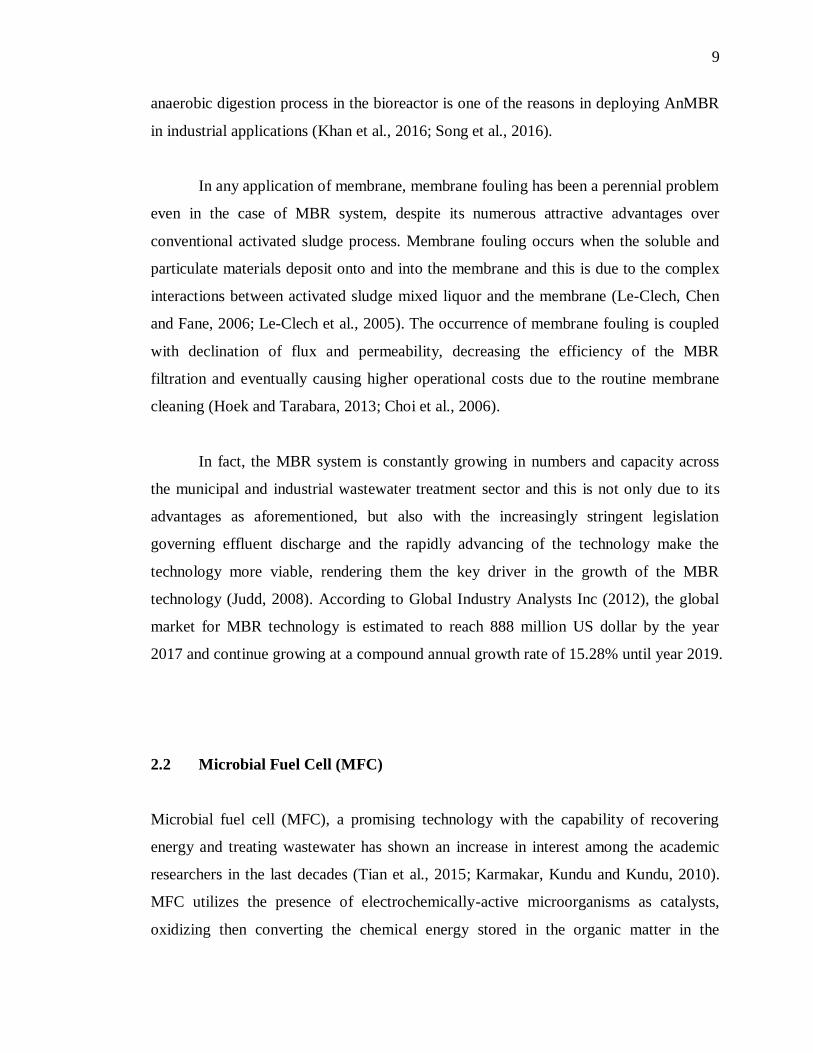
Figure 1.3: Palm Oil World Production (Agriculture Corner, 2012)
4
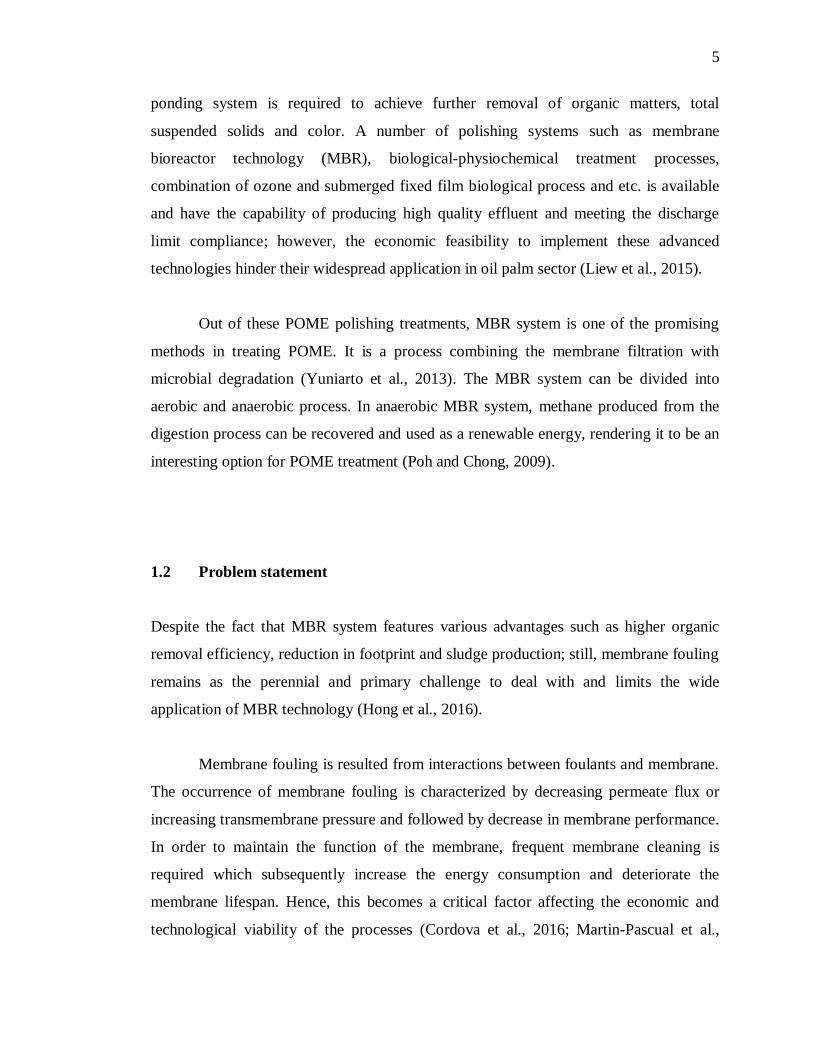
In Malaysia, extraction of crude palm oil from fresh fruit bunches is mainly
through wet palm oil milling process. The milling process involves consumption of
enormous quantities of water and is typically obtained from the adjacent freshwater
resources which require very little treatment and pumping costs. The concomitant large
production of wastewater from milling processes mainly comprises of palm oil mill
effluent (POME) and used water. The used water is discharged into the drains or rivers
without going neither into the effluent stream nor the wastewater treatment system.
While POME, being one of the major pollution sources to water bodies require proper
treatment prior to its disposal in order to meet the imposed discharge limit (Liew et al.,
2015).
Three commonly adopted systems for POME treatment in Malaysia include (i)
ponding system, (ii) open tank digester and the extended aeration system, and (iii) closed
anaerobic digester and land application system (Malaysia Palm Oil Board, 2014). In
overall, more than 85% of palm oil mills adopted ponding system as the POME
treatment (Ding et al., 2016). A complete ponding system typically includes sand and oil
traps, cooling ponds, acidification ponds, anaerobic ponds, facultative ponds and aerobic
ponds. The sand and oil traps operate as the pre-treatment unit and the cooling ponds
cool down the temperature (lower than 35°C) for the subsequent ponds. In short,
ponding system is not only a feasible ways of treating high strength organic wastewater,
but also economically feasible which requires little maintenance and offers process and
operational simplicity. However, it requires a huge land area (1 ha-5 ha), long hydraulic
retention times (HRT 40-200 days) and the concomitant release of methane by anaerobic
digestion along with carbon dioxide are greenhouse gases that could contribute to
greenhouse effect (Ding et al., 2016; Liew et al., 2015).
Due to the successful POME pollution abatement experiences, Malaysia is
currently planning to revise the effluent quality standards towards a more stringent
discharge limit where the BOD level of treated POME must not exceed 20 mg/L BOD3.
Hence, POME treatment solely by ponding system is inadequate in meeting the revised
discharge limit; instead, POME polishing systems in combination with the existing
5
ponding system is required to achieve further removal of organic matters, total
suspended solids and color. A number of polishing systems such as membrane
bioreactor technology (MBR), biological-physiochemical treatment processes,
combination of ozone and submerged fixed film biological process and etc. is available
and have the capability of producing high quality effluent and meeting the discharge
limit compliance; however, the economic feasibility to implement these advanced
technologies hinder their widespread application in oil palm sector (Liew et al., 2015).
Out of these POME polishing treatments, MBR system is one of the promising
methods in treating POME. It is a process combining the membrane filtration with
microbial degradation (Yuniarto et al., 2013). The MBR system can be divided into
aerobic and anaerobic process. In anaerobic MBR system, methane produced from the
digestion process can be recovered and used as a renewable energy, rendering it to be an
interesting option for POME treatment (Poh and Chong, 2009).
1.2 Problem statement
Despite the fact that MBR system features various advantages such as higher organic
removal efficiency, reduction in footprint and sludge production; still, membrane fouling
remains as the perennial and primary challenge to deal with and limits the wide
application of MBR technology (Hong et al., 2016).
Membrane fouling is resulted from interactions between foulants and membrane.
The occurrence of membrane fouling is characterized by decreasing permeate flux or
increasing transmembrane pressure and followed by decrease in membrane performance.
In order to maintain the function of the membrane, frequent membrane cleaning is
required which subsequently increase the energy consumption and deteriorate the
membrane lifespan. Hence, this becomes a critical factor affecting the economic and
technological viability of the processes (Cordova et al., 2016; Martin-Pascual et al.,
6
2016). The major factors affecting fouling are biochemical kinetic parameters,
temperature, membrane characteristics, mixed liquor characteristics, operational style
and reactor hydraulic conditions. Therefore, membrane fouling mechanisms are very
complicated due to the complex rheological and physiological characteristics of mixed
liquors (Martin-Pascual et al., 2016). Instead of using MBR as sole treatment process,
MBR can incorporate with technology like microbial fuel cell (MFC) to reduce the
fouling propensity. Such integrated system achieves higher effluent quality and more
efficient energy recovery. Several studies showed that the integrated system improved
the membrane filterability by retarding membrane fouling by using synthetic wastewater
as the feedstock (Tian et al., 2015; Su et al., 2013). However, the use of combined
system in treating high strength wastewater like POME is yet to be studied.
In this study, MFC is incorporated into the AnMBR system (MFC-AnMBR)
where the MFC acts as a pre-treatment unit prior to AnMBR and one of the operational
conditions, temperature is manipulated and their impact on the degree of membrane
fouling is observed.
1.3 Objectives
The objectives of this study are:
i) To compare the effects of different temperatures on the performance and
membrane fouling control of the AnMBR system in treating POME.
ii) To evaluate the effect of MFC on the wastewater treatment performance and
membrane fouling mitigation in MFC-AnMBR.
7
CHAPTER 2
LITERATURE REVIEW
2.1 Overview of Membrane Bioreactor (MBR) Technology
Membrane bioreactor technology is the combination of biological treatment with the
aids of activated sludge coupling with a direct solid-liquid separation by membrane
filtration. In membrane filtration process, microfiltration or ultrafiltration membrane
technology are used to completely retain the bacterial flocs and nearly all suspended
solids within the bioreactor (Le-Clech, Chen and Fane, 2006). This renders the quality of
water produced to be significantly higher than that generated by conventional treatment
and excluding the necessity of having a further tertiary treatment (Judd, 2008).
By filtering the biomass through the membrane, the MBR technology not only
effectively producing a high quality effluent but also shows substantial disinfection
capability in the effluent produced as it removes all suspended, colloidal solids and
bacteria including attached viruses or adsorbed compounds (Nguyen et al., 2016; Hoek
and Tarabara, 2013; Santos, Ma and Judd, 2011). Besides that, the MBR process capable
of operating at much higher mixed liquor suspended solids (MLSS) concentrations
(about 12,000mg/L) such that higher volumetric loads are feasible, thereby giving rise to
a small footprint (Trzcinski and Stucke,, 2016; Hoek and Tarabara, 2013).
8
Moreover, the MBR system requires less area compared to conventional
activated sludge process (Nguyen et al., 2016). The conventional activated sludge
process which comprises of activated sludge tank and settling tank are combined in the
MBR system where the settling tank is replaced by membrane, rejecting the activated
sludge from passing through the membrane and the sedimentation process is substituted
by filtration process (Hoek and Tarabara, 2013). Such combination also results in higher
concentration of activated sludge in the bioreactor and lower amount of wasted biosolids
is produced (Le-Clech et al., 2005).
In general, there are two possible configurations in integrating the membrane
into the activated sludge process which are side-stream configuration and submerged
configuration (Hoek and Tarabara, 2013). In the former configuration, the membrane is
located outside of the bioreactor. In order to maintain filtration and control fouling, the
mixed liquor circulates through the membrane module at high cross flow velocity and
relies on high transmembrane pressure (TMP), causing it to be energy-consuming and
economically infeasible. By operating at such high cross flow velocity, the shear stress
generated will as well jeopardize the microbial activity (Gouveia et al., 2015; Hoek and
Tarabara, 2013; Le-Clech, Chen and Fane, 2006). While in the latter case, the membrane
is directly immersed in the mixed liquor, accompanied by an artificially intensified
turbulence like biogas aeration. This arrangement is to eliminate or mitigate fouling by
preventing cake formation on the membrane surface with the aids of special equipment.
However, additional energy consumption is required (Liu et al., 2016; Gouveia et al.,
2015). The overall lower operating cost obtained with the submerged configuration
renders it to be more commonly applied (Gouveia et al., 2015).
In the design of MBR system for wastewater treatment, both aerobic and
anaerobic processes have been deployed. However, anaerobic MBR (AnMBR) is more
commonly used in industrial applications due to its advantages compared to its aerobic
counterpart. AnMBR requires lower cost as the absence of aeration and its capacity to
treat high strength wastewater with less sludge production has rendered less energy
requirement. Besides that, the capability of recovering the biogas as bioenergy from
9
anaerobic digestion process in the bioreactor is one of the reasons in deploying AnMBR
in industrial applications (Khan et al., 2016; Song et al., 2016).
In any application of membrane, membrane fouling has been a perennial problem
even in the case of MBR system, despite its numerous attractive advantages over
conventional activated sludge process. Membrane fouling occurs when the soluble and
particulate materials deposit onto and into the membrane and this is due to the complex
interactions between activated sludge mixed liquor and the membrane (Le-Clech, Chen
and Fane, 2006; Le-Clech et al., 2005). The occurrence of membrane fouling is coupled
with declination of flux and permeability, decreasing the efficiency of the MBR
filtration and eventually causing higher operational costs due to the routine membrane
cleaning (Hoek and Tarabara, 2013; Choi et al., 2006).
In fact, the MBR system is constantly growing in numbers and capacity across
the municipal and industrial wastewater treatment sector and this is not only due to its
advantages as aforementioned, but also with the increasingly stringent legislation
governing effluent discharge and the rapidly advancing of the technology make the
technology more viable, rendering them the key driver in the growth of the MBR
technology (Judd, 2008). According to Global Industry Analysts Inc (2012), the global
market for MBR technology is estimated to reach 888 million US dollar by the year
2017 and continue growing at a compound annual growth rate of 15.28% until year 2019.
2.2 Microbial Fuel Cell (MFC)
Microbial fuel cell (MFC), a promising technology with the capability of recovering
energy and treating wastewater has shown an increase in interest among the academic
researchers in the last decades (Tian et al., 2015; Karmakar, Kundu and Kundu, 2010).
MFC utilizes the presence of electrochemically-active microorganisms as catalysts,
oxidizing then converting the chemical energy stored in the organic matter in the
10
wastewater into useful electrical energy while treating the wastewater (Ma et al., 2016;
Su et al., 2013; Karmakar, Kundu and Kundu, 2010).
In general, the anaerobic respiring bacteria in the anodic compartment
disintegrate the organic matter into carbon dioxide as the final product, along with the
production of electrons and protons. These electrons are transported to the anode surface
through several extracellular electron transfer mechanisms, including direct electron
transfer via direct electron transfer via the membrane-bound c-type cytochrome and/or
the bacterial nanowires, and indirect electron self-transfer mediated by shuttle molecules.
The generated electrons are transferred using an external circuit and accepted by an
electron acceptor in the cathode. For instance, in air cathode MFC with cathode being
exposed to the air, oxygen is used as electron acceptor due mostly to its sustainability
and amount (He et al., 2017; Ma et al., 2016). Meanwhile, the protons are oxidized to
water in cathode. The oxidation of water could be done in either a separate chamber or
separately in the same chamber (Karmakar, Kundu and Kundu, 2010).
The increasingly emerging and widespread application of MFC in wastewater
treatment is largely due to its outstanding merits. The potential of MFC in addressing
energy and environmental issues is irrefutable particularly in remote areas with
biosensors equipped or integrated facilities that are capable of producing biohydrogen,
carry out bioremediation with in-situ power source as well as treating wastewater. The
capability of MFC in converting the substrate energy to electricity directly, rendering it
to be more sustainable when come to implementation in wastewater treatment. Besides
that, less excess activated sludge is generated compared to the processes of anaerobic
digestion and conventional aerobic activated sludge treatment systems. Moreover, the
insensitivity of MFC to operation environment renders it to be more viable. The
necessity of having gas treatment and the need for aeration can be opted out, and hence
reducing the energy input. This explains the widespread application of MFC particularly
in locations with insufficient electrical infrastructures (He et al., 2017).
11
Despite the numerous advantages of MFC, some of the challenges remain
unaddressed which subsequently hinder the commercialization of MFC technology. One
of the barriers is the high operating cost of MFC where, on average, the cost of MFC is
30 times higher than that of conventional activated sludge treatment system in treating
domestic wastewater. Such high capital cost is due mostly to its configuration and
treatment capability, for instances, the use of expensive electrode materials such as
current collector, catalysts and separator materials (He et al., 2017). Besides that, MFC
acts as an independent wastewater treatment unit will not be practically applicable due to
its poor effluent quality and low treatment efficiency (Tian et al., 2015). According to
Kim et al. (2016), the power densities are corresponding to the COD concentrations of
wastewater. Therefore, it is unlikely to achieve high power densities while meeting the
stringent discharge limit of the wastewater to the environment. In order to overcome this
issue, a post-treatment process is necessary to further reduce the COD of the treated
effluent from MFC.
2.3 Integration of MBR with MFC
In order to meet the stringent effluent quality, wastewater treatment solely by
MFC is insufficient (Tian et al., 2015). Thus, MFC is integrated with other systems such
as MBR. The integration of MBR with MFC forms a bioelectrochemical membrane
reactor, which takes advantage of both MBR and MFC, enhancing the effluent quality
while achieving energy recovery (Su et al., 2013). In fact, membrane technology is
widely implemented and has excellent filtering capability in removing all suspended,
colloidal solids and bacteria including attached viruses or adsorbed compounds (Nguyen
et al., 2016; Hoek and Tarabara, 2013; Santos, Ma and Judd, 2011). According to Su et
al. (2013), the combined system of MBR and MFC was able to mitigate the membrane
fouling through the modification of sludge. It was found that the combined system could
operate twice as long as that in the conventional MBR. Furthermore, the report showed
that the MFC could effectively reduce the loosely bound extracellular polymeric
12
substances (LB-EPS) content by 22%. Such EPS are considered to be the major cause of
membrane fouling in MBR. By integrating the MBR with MFC, it has the benefits to
improve the effluent quality, recover energy produced and mitigate the membrane
fouling.
2.4 Palm Oil Mill Effluent (POME)
In palm oil industry, the processing of palm oil fruit for extraction of crude palm oil
requires enormous amount of water. In processing every one tonne of fresh fruit bunches
for oil extraction, approximately 1.5m3 of water is needed and almost half of the water is
discharged as POME. This POME are produced and discharged from three principal
sources which are clarification wastewater (60%), sterilizer condensate (36%) and
hydrocyclone wastewater (4%) (Ahmed et al., 2015; Tabassum, Zhang and Zhang, 2015).
POME, as the by-product of the palm oil extraction process is the most significant
pollutant and capable of causing devastating impact on the water environmental system.
The presence of organic and nutrient contents in POME gives it the capability of greatly
depleting the oxygen content in the aquatic system (BioEnergy Consult, 2015).
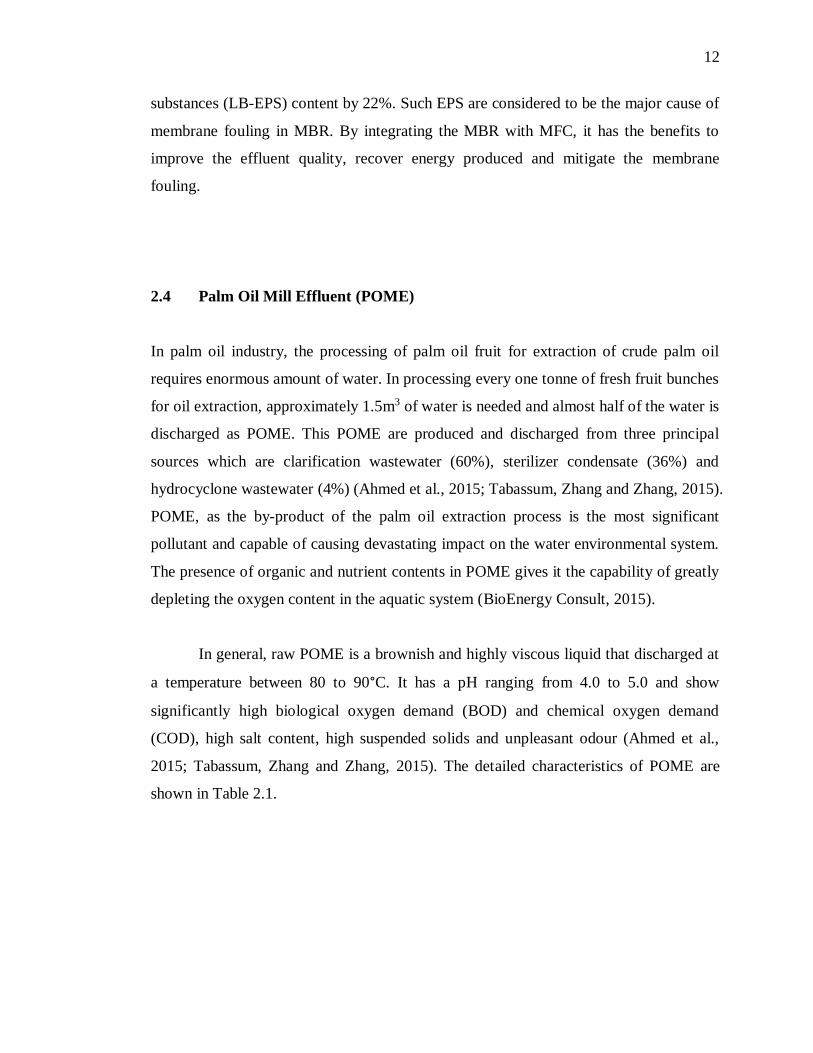
In general, raw POME is a brownish and highly viscous liquid that discharged at
a temperature between 80 to 90°C. It has a pH ranging from 4.0 to 5.0 and show
significantly high biological oxygen demand (BOD) and chemical oxygen demand
(COD), high salt content, high suspended solids and unpleasant odour (Ahmed et al.,
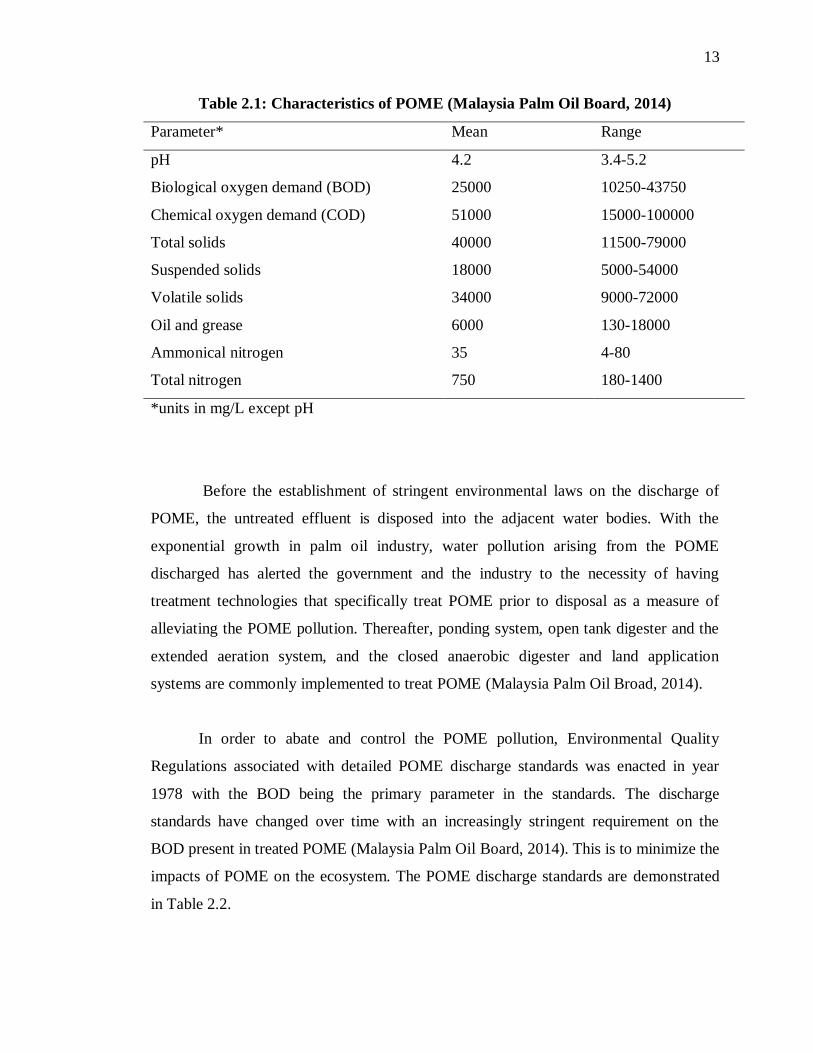
2015; Tabassum, Zhang and Zhang, 2015). The detailed characteristics of POME are
shown in Table 2.1.
13
Table 2.1: Characteristics of POME (Malaysia Palm Oil Board, 2014)
Parameter* Mean Range
pH 4.2 3.4-5.2
Biological oxygen demand (BOD) 25000 10250-43750
Chemical oxygen demand (COD) 51000 15000-100000
Total solids 40000 11500-79000
Suspended solids 18000 5000-54000
Volatile solids 34000 9000-72000
Oil and grease 6000 130-18000
Ammonical nitrogen 35 4-80
Total nitrogen 750 180-1400
*units in mg/L except pH
Before the establishment of stringent environmental laws on the discharge of
POME, the untreated effluent is disposed into the adjacent water bodies. With the
exponential growth in palm oil industry, water pollution arising from the POME
discharged has alerted the government and the industry to the necessity of having
treatment technologies that specifically treat POME prior to disposal as a measure of
alleviating the POME pollution. Thereafter, ponding system, open tank digester and the
extended aeration system, and the closed anaerobic digester and land application
systems are commonly implemented to treat POME (Malaysia Palm Oil Broad, 2014).
In order to abate and control the POME pollution, Environmental Quality
Regulations associated with detailed POME discharge standards was enacted in year
1978 with the BOD being the primary parameter in the standards. The discharge
standards have changed over time with an increasingly stringent requirement on the
BOD present in treated POME (Malaysia Palm Oil Board, 2014). This is to minimize the
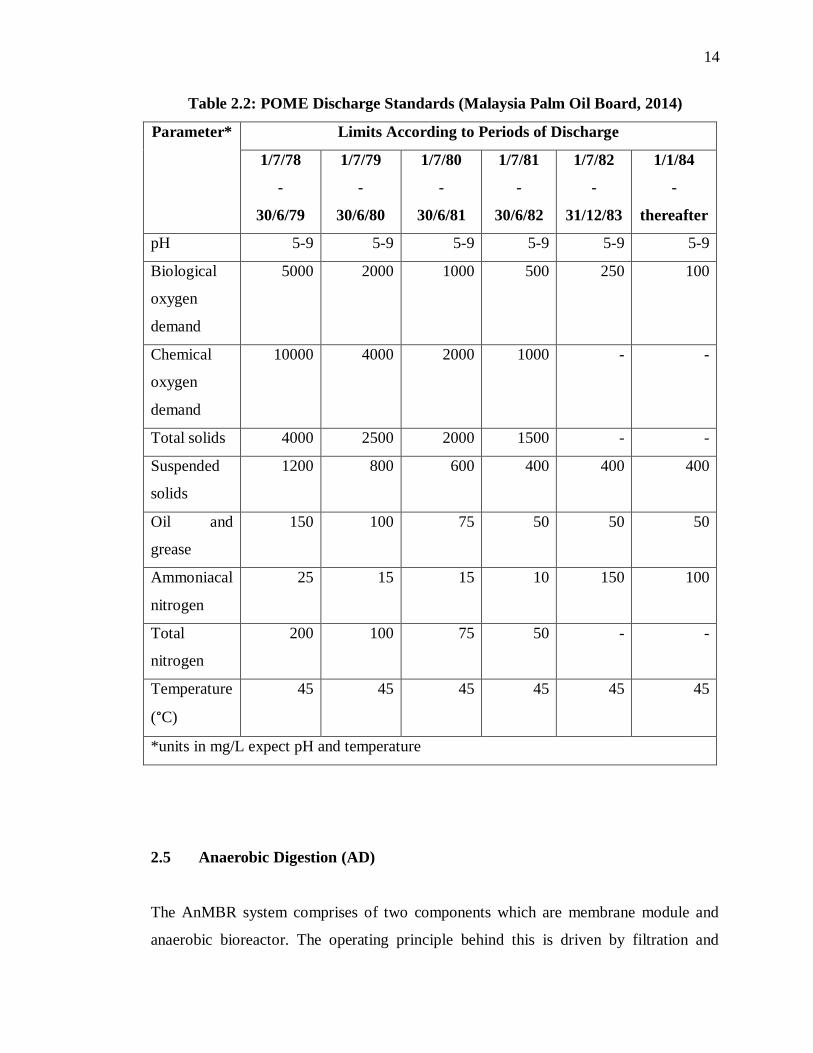
impacts of POME on the ecosystem. The POME discharge standards are demonstrated
in Table 2.2.
14
Table 2.2: POME Discharge Standards (Malaysia Palm Oil Board, 2014)
Parameter* Limits According to Periods of Discharge
1/7/78
-
30/6/79
1/7/79
-
30/6/80
1/7/80
-
30/6/81
1/7/81
-
30/6/82
1/7/82
-
31/12/83
1/1/84
-
thereafter
pH 5-9 5-9 5-9 5-9 5-9 5-9
Biological
oxygen
demand
5000 2000 1000 500 250 100
Chemical
oxygen
demand
10000 4000 2000 1000 - -
Total solids 4000 2500 2000 1500 - -
Suspended
solids
1200 800 600 400 400 400
Oil and
grease
150 100 75 50 50 50
Ammoniacal
nitrogen
25 15 15 10 150 100
Total
nitrogen
200 100 75 50 - -
Temperature
(°C)
45 45 45 45 45 45
*units in mg/L expect pH and temperature
2.5 Anaerobic Digestion (AD)
The AnMBR system comprises of two components which are membrane module and
anaerobic bioreactor. The operating principle behind this is driven by filtration and
15
anaerobic digestion respectively (Khan et al., 2016). Anaerobic digestion is a reduction
process with a number of biochemical reactions taking place in the bioreactor where the
biodegradable materials are broken down by microorganisms under anoxic conditions,
with the formation of methane as the end product (Adekunle and Okolie, 2015).
Anaerobic digestion involves four major steps: hydrolysis, acidogenesis,
acetogenesis and methanogenesis. The initial step involves the enzyme-mediated
transformation of insoluble organic materials and higher molecular mass compounds
like carbohydrate and proteins into derivatives such as sugar and amino acids. Such
transformation is performed by strict anaerobes such as bacterides and clostridia
(Adekunle and Okolie, 2015).
In acidogenesis, the monomers produced are converted further into volatile fatty
acids (VFAs), alcohols, hydrogen and carbon dioxide by acidogenic bacteria. The
products of acidogenesis, especially VFAs and alcohols cannot be utilized by
methanogens directly. Therefore, the third phase involves the conversion of long chain
VFAs and alcohols into methanogenic substrates like acetate, hydrogen and carbon
dioxide. These intermediate products from the previous phase are utilized by
methanogen in the methanogenesis process and produce methane as the final product
(Adekunle and Okolie, 2015).
In anaerobic digestion, optimization between acid and methane forming
processes is essential. This is because excessive production and accumulation of VFAs
in hydrolysis stage will decrease the pH in the bioreactor and the pH-sensitive
methanogen will be inhibited. This could lead to system failure of the digester (Naik et
al., 2014; Xu et al., 2014).
16
2.6 Membrane
A membrane is act as a selective barrier between two adjacent phases, regulating the
transport of substances between two compartments. Membrane involves liquid-solid
separation which does not require additives, and they can be performed isothermally at
low temperatures, rendering lower energy consumption compare to other thermal
separation process (Ulbricht, 2006). In MBR system, microfiltration (MF) and
ultrafiltration (UF) membranes are commonly implemented to retain microbial cells and
proteins respectively. This is achieved through sieve mechanism where the sizes of
compounds become the determinant in allowing the compounds to pass through the
membrane pores (Waszak and Gryta, 2015).
2.6.1 Membrane Process Classification
2.6.1.1 Microfiltration (MF)
Microfiltration is a pressure-driven membrane process that removes suspended colloids
and macromolecular materials larger than 100nm at a low pressure, where the operating
transmembrane pressure ranging from 95 to 276kPa. The excellent performance of MF
in the removal of turbidity, bacteria and protozoa popularize the application in municipal
drinking water and wastewater treatment. However, MF still possess some limitations
due to their large pore sizes, for instance, they are ineffective for removing natural
organic matter (NOM), viruses and other dissolved contaminants. In order to overcome
these limitations, coagulation pretreatment or addition of PAC can be considered (Hoek
and Tarabara, 2013).
2.6.1.2 Ultrafiltration (UF)
Similar to MF, UF is a pressure-driven membrane process except that it has smaller pore
sizes and operate at a pressure higher than MF process, which is about 7bar (700kPa).
The pores size of UF membrane generally ranging from a few nanometers to about
17
100nm. Species having molecular weights ranging from about 300 to 1000 Da will be
retained by UF and this includes proteins, viruses, starches, gums and dispersed colloidal
compounds such as pigments (Hoek and Tarabara, 2013).
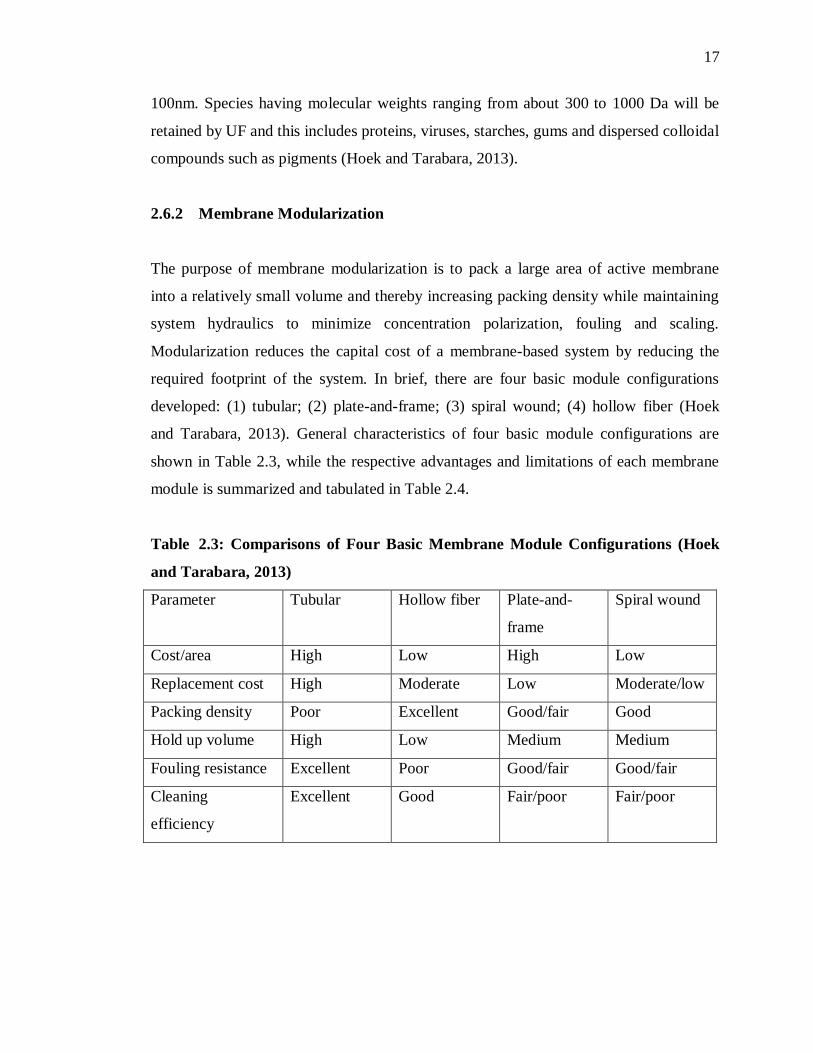
2.6.2 Membrane Modularization
The purpose of membrane modularization is to pack a large area of active membrane
into a relatively small volume and thereby increasing packing density while maintaining
system hydraulics to minimize concentration polarization, fouling and scaling.
Modularization reduces the capital cost of a membrane-based system by reducing the
required footprint of the system. In brief, there are four basic module configurations
developed: (1) tubular; (2) plate-and-frame; (3) spiral wound; (4) hollow fiber (Hoek
and Tarabara, 2013). General characteristics of four basic module configurations are
shown in Table 2.3, while the respective advantages and limitations of each membrane
module is summarized and tabulated in Table 2.4.
Table 2.3: Comparisons of Four Basic Membrane Module Configurations (Hoek
and Tarabara, 2013)
Parameter Tubular Hollow fiber Plate-and-
frame
Spiral wound
Cost/area High Low High Low
Replacement cost High Moderate Low Moderate/low
Packing density Poor Excellent Good/fair Good
Hold up volume High Low Medium Medium
Fouling resistance Excellent Poor Good/fair Good/fair
Cleaning
efficiency
Excellent Good Fair/poor Fair/poor
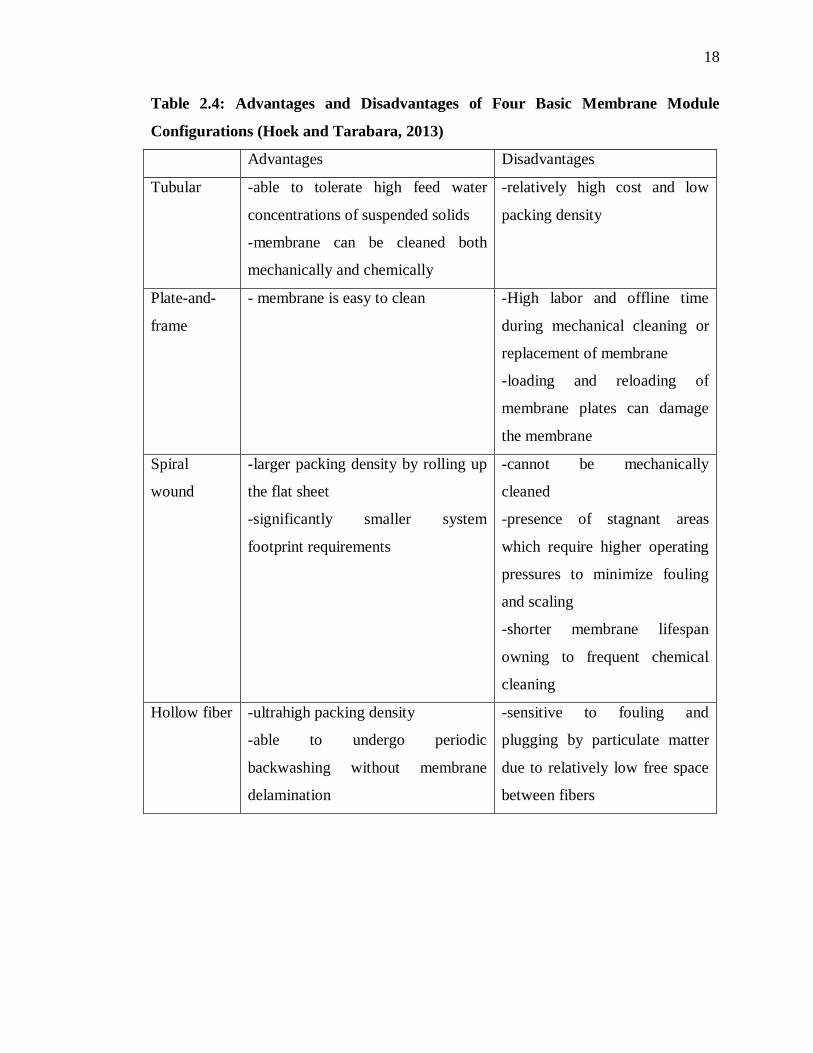
18
Table 2.4: Advantages and Disadvantages of Four Basic Membrane Module
Configurations (Hoek and Tarabara, 2013)
Advantages Disadvantages
Tubular -able to tolerate high feed water
concentrations of suspended solids
-membrane can be cleaned both
mechanically and chemically
-relatively high cost and low
packing density
Plate-and-
frame
- membrane is easy to clean -High labor and offline time
during mechanical cleaning or
replacement of membrane
-loading and reloading of
membrane plates can damage
the membrane
Spiral
wound
-larger packing density by rolling up
the flat sheet
-significantly smaller system
footprint requirements
-cannot be mechanically
cleaned
-presence of stagnant areas
which require higher operating
pressures to minimize fouling
and scaling
-shorter membrane lifespan
owning to frequent chemical
cleaning
Hollow fiber -ultrahigh packing density
-able to undergo periodic
backwashing without membrane
delamination
-sensitive to fouling and
plugging by particulate matter
due to relatively low free space
between fibers
19
2.7 Membrane Fouling
In MBRs, there are five mechanisms which are responsible for the occurrence of
membrane fouling: (1) adsorption of solutes or colloids within or on membranes; (2)
deposition of sludge flocs onto the membrane surface; (3) formation of a cake layer on
the membrane surface; (4) detachment of foulants attributed mainly to shear forces; (5)
the spatial and temporal changes of the foulant composition during the long-term
operation such as the change of bacteria community and biopolymer components in the
cake layer. In short, membrane fouling is defined as the undesirable deposition and
accumulation of microorganisms, colloids, solutes and the cell debris within or on the
membranes with the consequence of reducing the permeability of the membrane (Meng
et al., 2009).
In general, the behavior of membrane fouling is characterized by a three stage
fouling history where the first stage shows an initial short-term rapid rise in
transmembrane pressure (TMP), while second stage shows a long-term weak rise in
TMP and the last stage is indicated by TMP jump. The occurrence of TMP jump is the
indication of severe membrane fouling (Meng et al., 2009). According to Hwang et al
(2008), the occurrences of TMP jump is due to the sudden increase in the concentration
of extracellular polymeric substances (EPS) at the bottom of cake layer. The increase in
the EPS concentration is related to the death of bacteria in the inner cake layer due to
oxygen transfer limitation.
The occurrence of membrane fouling is attributed to various factors such as
sludge characteristics, operational parameters, membrane materials and feed water
characteristics, either directly or indirectly. Sludge characteristics are the main
determinant that has direct influence on the formation of membrane fouling, while
fouling factors like operating parameters (e.g. ratio of food-to-microorganism) indirectly
result in fouling through the modification of the activated sludge (Liu et al., 2013; Meng
et al., 2009).
20
Membrane fouling can be classified into three types based on the cleaning
practices, namely removable fouling, irremovable fouling and irreversible fouling.
Removable fouling is caused by loosely attached foulants and associated with the
formation of cake layer. It can be cleaned with ease via physical cleaning. For
irremovable fouling, the pore is blocked and foulants are strongly attached on the
membrane. In this case, fouling can only be removed by chemical cleaning. For
irreversible fouling, it is a permanent fouling and cannot be removed by any means
(Meng et al., 2009).
2.7.1 Fouling Components
The occurrence of membrane fouling is mainly due to biological fouling and organic
fouling, while partly is due to inorganic fouling, although they happen concurrently
during the filtration process. In biological fouling, the bacteria cells or microbial flocs
deposit, growth and undergo metabolism on the membrane surface and eventually form
a biocake. These deposited cells have higher surface hydrophobicity than the suspended
sludge, rendering them to adhere to the surface tightly (Meng et al., 2009). The SMP and
EPS are biologically secreted by the deposited cell and further exacerbate biofouling. In
organic fouling, it is characterized by the deposition of biopolymers (e.g. protein and
polysaccharide) on the membrane surface. These biopolymers facilitate the formation of
cake layer as evident by substantial amount of protein and polysaccharide on it (Lin et
al., 2013).
The inorganic fouling can either be formed by chemical or biological
precipitation. Chemical polarization is responsible for chemical precipitation, causing
higher concentration of retained salts on the membrane. Example of predominant salts in
inorganic fouling is carbonates. Both aeration process and generation of CO2 by
microorganisms lead to super-saturation of carbonates which subsequently enhance the
formation of precipitate and membrane scaling (Meng et al., 2009). Whereas in
biological precipitation, metal clusters and metal ions are caught by the biocake layer
21
through charge neutralization and bridging effect and subsequently fasten the membrane
fouling (Lin et al., 2013).
2.7.2 Fouling Control
The occurrence of fouling is a continuous recurring and undesirable phenomena in any
membrane application. Membrane fouling not only decreasing the permeate flux of the
membrane but also increasing the operating cost for the industries like expenses used in
maintenance of membranes. Therefore, proper fouling control is one of the key
operating considerations for MBR systems.
According to Le-Clech, Chen and Fane (2006), fouling control is divided into
two main groups which are membrane cleaning for the fouling removal and
precautionary measures taken before the occurrence of fouling. The removal of fouling
can be achieved physically or chemically, depending on the fouling condition on the
membrane surface. The common physical cleaning in reducing membrane fouling rate is
backwashing. Backwashing can effectively remove most of the reversible fouling due to
pore blocking and partially dislodge loosely attached sludge cake from the membrane
surface through flow reversion, either by air or water as a backwashing medium. In the
design of backwashing, two determinants are to be considered: frequency and duration,
in order to achieve optimized backwashing with respect to energy and permeate
consumptions (Ming et al., 2017; Le-Clech, Chen and Fane, 2016).
In long time operation with accumulation of irreversible fouling on the
membrane surface, physical cleaning becomes ineffective in mitigating the fouling. In
this case, chemical cleaning which involves maintenance cleaning with higher chemical
concentration or intensive chemical cleaning, each with different time-period basis, is
recommended. Instead of having frequent intense cleaning, maintenance cleaning is
indispensable in maintaining design permeability as frequent intense cleaning can
damage the membrane integrity. In chemical cleaning, sodium hypochlorite and citric
22
acid are commonly used as cleaning agents for organic and inorganic foulants or metal-
associated structures respectively (Le-Clech, Chen and Fane, 2006).
Proper fouling control before the occurrence of fouling is also an effective way
in alleviating rapid and severe membrane fouling. Measures such as pretreatment of feed,
optimization of membrane and operating conditions and modification of biomass
characteristics can be implemented. Pretreatment like pH adjustment of feed is required
to protect the permeability and lifespan of the membrane. Besides, removal of excessive
amount of inorganic matter like magnesium and calcium prior to the treatment is needed
as they could affect the formation and compactness of the cake layer (Lin et al., 2013).
While in membrane optimization, membrane can be modified by implanting polar
organic functional group onto the membrane surface through plasma treatment. This
increases the hydrophilicity of the membrane which in turn improves the anti-fouling
properties and leading to better filtration performance (Lin et al., 2013; Le-Clech, Chen
and Fane, 2006).
The anti-fouling properties can also be improved through modifying the biomass
characteristics. The modification of biomass characteristics can be achieved through the
addition of coagulant, flocculent and adsorbent agent. Coagulant like alum dissolves in
water and forms hydroxide precipitates that are capable of adsorbing suspended particles,
colloids and soluble organics, forming large microbial flocs and reducing the fouling
propensity (Lin et al., 2013). Adsorbent agent like powdered activated carbon (PAC)
can significantly increase the uptake of soluble organics like the EPS present in activated
sludge through the formation of biologically activated carbon after a long-term operation.
Lastly, optimizing operational conditions like hydrodynamic conditions and flux can
help to control fouling. For instance, better hydrodynamic conditions can be achieved
through increasing the air scouring intensity and time. Moreover, by operating the
system at sustainable flux where the TMP increases gradually at an acceptable rate, such
that chemical cleaning in unnecessary, can helps to control membrane fouling (Lin et al.,
2013; Le-Clech, Chen and Fane, 2006).
23
2.8 Operating Condition of MBR System
In MBR system, the operating condition plays significant role in determining its
performance. In general, operating condition can be classified into two categories which
are membrane and biological operating conditions. In the former case, it includes flux,
transmembrane pressure and backwashing; while biological operating condition involves
temperature, sludge retention time (SRT) and hydraulic retention time (HRT) (Sabia,
Ferraris and Spagni, 2013).
2.8.1 Sludge Retention Time (SRT)
SRT is a vital factor potentially affecting the performance of MBR system; it can
influence filterability and biomass characteristics like bioactivity, biodegradation
kinetics and particle size distribution (Sabia, Ferraris and Spagni, 2013). A long SRT is
generally beneficial to the system as it could minimize the yield of sludge which in turn
saves the cost for the handling and disposal of sludge. The lower yield of sludge is
attributed to the majority of the cells are in an endogenous respiration state instead of
physiological state for growth (Ouyang and Liu, 2009). At higher SRT, it is often
associated with the development of microbial biomass. Such biomass are capable of
degrading macromolecules such as polysaccharide, carbohydrates and protein and
ultimately producing less biopolymer which can attribute to membrane fouling (Sabia,
Ferraris and Spagni, 2013).
Moreover, increase in SRT is related to the decrease in sludge granule sizes. The
system tends to have lower F/M ratio and inert substances accumulate at higher SRT. As
a consequence, the decrease of bonding force associated with the presence of strong
shear force can decrease the sludge floc size (Ouyang and Liu, 2009). However, a study
by Han et al. (2005) indicates that when the system is subjected to too long SRT,
excessive membrane fouling is likely to occur due to large amount of foulants and
increase in sludge viscosity in the system. In overall, the effect of SRT shows significant
24
impact and attains good performance in the removal of COD (Ouyang and Liu, 2009;
Pollice et al., 2008).
2.8.2 Hydraulic Retention Time (HRT)
Similar to SRT, the influence of HRT on the membrane performance and membrane
fouling is not negligible. According to Deng et al. (2016), a MBR system with lower
HRT is more prone to membrane fouling, the results obtained show that lower HRT
could shorten filtration period and deteriorate filterability. Similar trend is observed
where decrease in HRT will accelerate membrane fouling (Aida Isma et al., 2014; Gao,
Tao and An, 2012).
At lower HRT, increase in organic loading rate and flux are observed and both of
them are relevant to membrane fouling (Gao, Tao and An, 2012). Besides that, lower
HRT tends to concentrate the biomass within and subsequently increase sludge viscosity.
As a result, the increased suction force at higher TMP and the increased drag force
toward the membrane at higher fluxes induce more readily deposition of large amounts
of bound EPS and biopolymer cluster on membrane surface to form a cake layer and
eventually lead to pore blocking (Deng et al., 2016). Although lower HRT can causes
fouling propensity, COD removal is not affected by HRT changes (Gao, Tao and An,
2012).
2.8.3 Flux
Membrane flux plays a significant role in MBR filtration characteristics and membrane
fouling. The operating flux need to be controlled well below the critical flux for
sustainable operation of MBR system (Wang et al., 2006). Reaching the critical flux
during the operation is associated with the increase of TMP and filtration resistance as
more sludge particles are attached to the membrane than being removed by the cross
flow. Various factors such as activated sludge properties (e.g. temperature and viscosity),
module specific parameters (e.g. cross flow intensity) and module geometry have
25
significant impacts on critical flux (Hoek and Tarabara, 2013). The study conducted by
Kimura et al. (2008) further verified that increase in membrane flux will significantly
increase the filtration resistance. During the initial stage of operation, design flux is
imposed gradually to allow small and ordered fouling layer to slowly develop. Rapid
increase in membrane flux should be avoided as it will result in disordered structure and
greater hydraulic resistance (Le-Clech et al., 2013).
2.8.4 Temperature
In MBR which involves the anaerobic digestion, temperature exerts a significant role on
the performance and stability of the process. The operational temperature can be
classified into three regimes which are psychrophilic (lower than 20°C), mesophilic (30-
45°C) and thermophilic (55-65°C) temperature (Lin et al., 2009). The good operational
performance in mesophilic temperature renders it to be widely adopted for anaerobic
digestion, whereas the use of thermophilic regime is less extensive because it is highly
susceptible to environmental changes and thus poorer process stability. Despite the
application of thermophilic anaerobic digestion is limited, it is known to present several
advantages such as an increased destruction rate of organic solids and elimination of
pathogen (Meabe et al., 2013; Lin et al., 2009).
The biomass growth rate of microbial community is heavily dependent on the
operational temperature, for instance, relatively lower operational temperatures tend to
reduce the biomass growth rate (Martinez-Sosa et al., 2011). Besides, increase in
temperature could significantly enhance the filtration performance (Meabe et al., 2013).
However, fouling propensity is higher in thermophilic temperature due to the higher
production of soluble microbial products (SMP) and extracellular polymeric substances
(EPS) and the significant decrease in sludge floc size in thermophilic temperature under
long-term operation is responsible for increased filtration resistance (Lin et al., 2009).
26
2.9 Activated Carbon (AC)
The widespread application of activated carbon as adsorbent in industrial fields such as
water treatment is due to its highly developed internal surface area, porous structure and
high degree of surface reactivity, rendering it to have high adsorption capacity
(Tzvetkov et al., 2016). Activated carbon is manufactured from a wide range of
carbonaceous precursors such as coal, wood and biomass sources through physical and
chemical activation process (Byamba-Ochir et al., 2016).
In general, activated carbon come with various sizes and can be classified
according to their sizes such as powdered and granular form. A number of studies have
shown that the addition of powdered activated carbon (PAC) can be beneficial to the
MBR system (Nguyen et al., 2014; Gai and Kim, 2008; Munz et al., 2007). According to
Gai and Kim (2008), addition of PAC can extend the continuous filtration time and
consequently alleviate the membrane fouling. Besides that, PAC can enhance effluent
quality by facilitating the removal of turbidity and organic matter, work as buffer against
shock loads of inhibitory compounds and improve sludge dewaterability (Satyawali and
Balakrishnan, 2009; Gai and Kim, 2008).
The addition of PAC within the MBR system can provide a habitat similar to
natural ecosystem for the microorganisms in the activated sludge, leading to the
formation of biologically activated carbon (BAC) sludge. The formation of BAC allows
the simultaneous occurrence of the adsorption and biodegradation rather than a single
biological process. The combination of the processes leads to the formation of a biofilm
ecosystem which consists of immobilized, acclimatized and succession bacteria. The
biofilm formation enhances partial bioregeneration of saturated BAC that is previously
absorbed by the PAC (Ng et al., 2013). According to Nguyen et al. (2014), it is
necessary to periodically withdraw and replenish PAC for stable performance of PAC.
Hence, frequent and smaller-dose PAC addition is recommended.
27
CHAPTER 3
METHODOLOGY
3.1 Experimental Setup
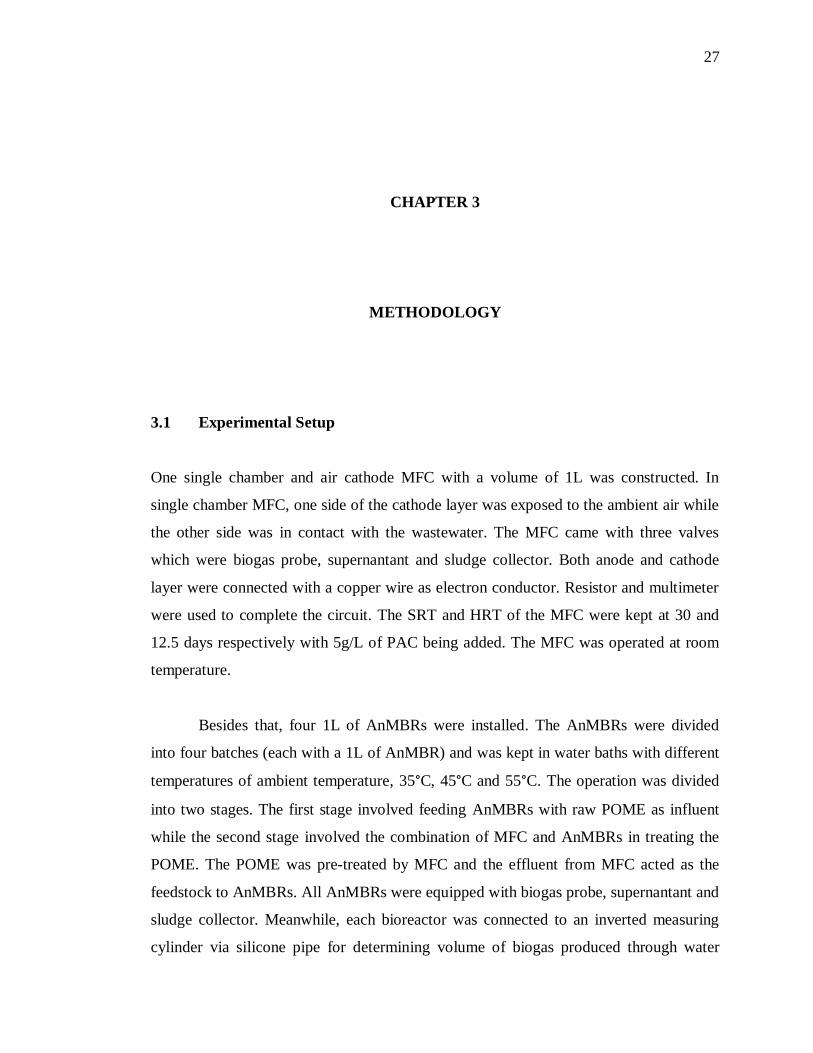
One single chamber and air cathode MFC with a volume of 1L was constructed. In
single chamber MFC, one side of the cathode layer was exposed to the ambient air while
the other side was in contact with the wastewater. The MFC came with three valves
which were biogas probe, supernantant and sludge collector. Both anode and cathode
layer were connected with a copper wire as electron conductor. Resistor and multimeter
were used to complete the circuit. The SRT and HRT of the MFC were kept at 30 and
12.5 days respectively with 5g/L of PAC being added. The MFC was operated at room
temperature.
Besides that, four 1L of AnMBRs were installed. The AnMBRs were divided
into four batches (each with a 1L of AnMBR) and was kept in water baths with different
temperatures of ambient temperature, 35°C, 45°C and 55°C. The operation was divided
into two stages. The first stage involved feeding AnMBRs with raw POME as influent
while the second stage involved the combination of MFC and AnMBRs in treating the
POME. The POME was pre-treated by MFC and the effluent from MFC acted as the
feedstock to AnMBRs. All AnMBRs were equipped with biogas probe, supernantant and
sludge collector. Meanwhile, each bioreactor was connected to an inverted measuring
cylinder via silicone pipe for determining volume of biogas produced through water
28
displacement method. All the bioreactors were added with 5g/L of PAC. The SRT and
HRT of the AnMBRs were controlled at 30 and 12.5 days respectively. Such operating
conditions used were based on the finding of previous studies in optimizing the
performance of AnMBR as conducted by previous FYP students.
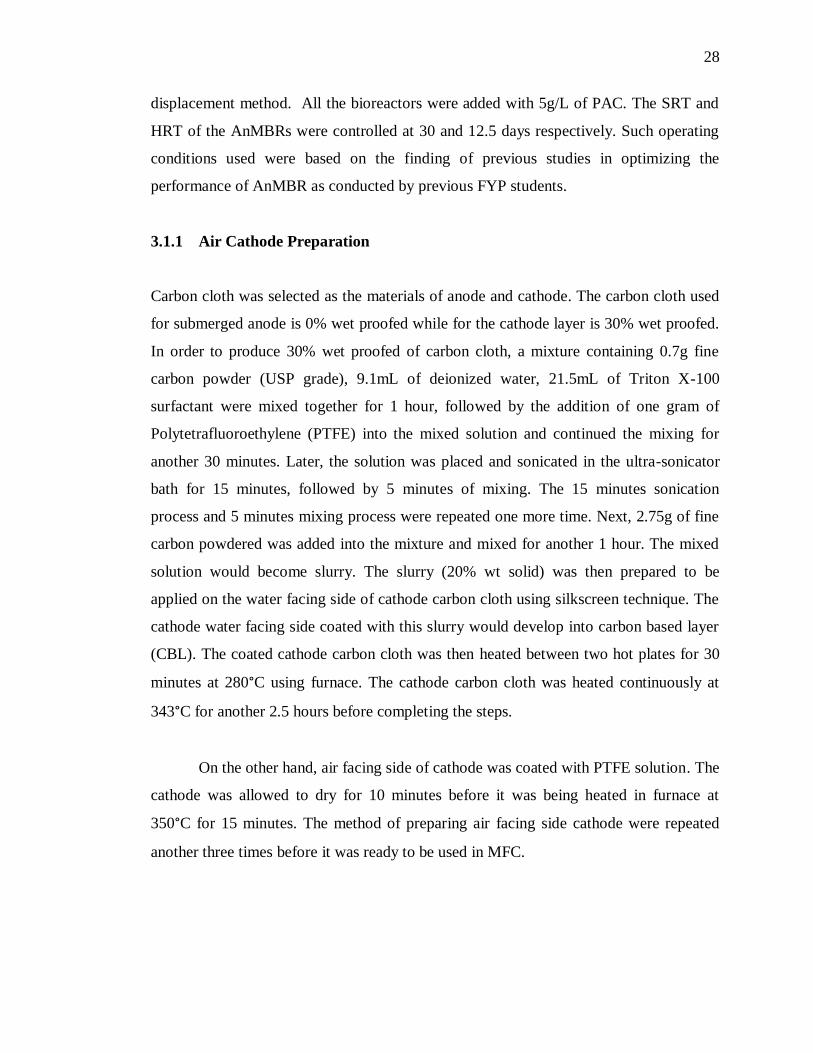
3.1.1 Air Cathode Preparation
Carbon cloth was selected as the materials of anode and cathode. The carbon cloth used
for submerged anode is 0% wet proofed while for the cathode layer is 30% wet proofed.
In order to produce 30% wet proofed of carbon cloth, a mixture containing 0.7g fine
carbon powder (USP grade), 9.1mL of deionized water, 21.5mL of Triton X-100
surfactant were mixed together for 1 hour, followed by the addition of one gram of
Polytetrafluoroethylene (PTFE) into the mixed solution and continued the mixing for
another 30 minutes. Later, the solution was placed and sonicated in the ultra-sonicator
bath for 15 minutes, followed by 5 minutes of mixing. The 15 minutes sonication
process and 5 minutes mixing process were repeated one more time. Next, 2.75g of fine
carbon powdered was added into the mixture and mixed for another 1 hour. The mixed
solution would become slurry. The slurry (20% wt solid) was then prepared to be
applied on the water facing side of cathode carbon cloth using silkscreen technique. The
cathode water facing side coated with this slurry would develop into carbon based layer
(CBL). The coated cathode carbon cloth was then heated between two hot plates for 30
minutes at 280°C using furnace. The cathode carbon cloth was heated continuously at
343°C for another 2.5 hours before completing the steps.
On the other hand, air facing side of cathode was coated with PTFE solution. The
cathode was allowed to dry for 10 minutes before it was being heated in furnace at
350°C for 15 minutes. The method of preparing air facing side cathode were repeated
another three times before it was ready to be used in MFC.
29
3.2 Materials Used
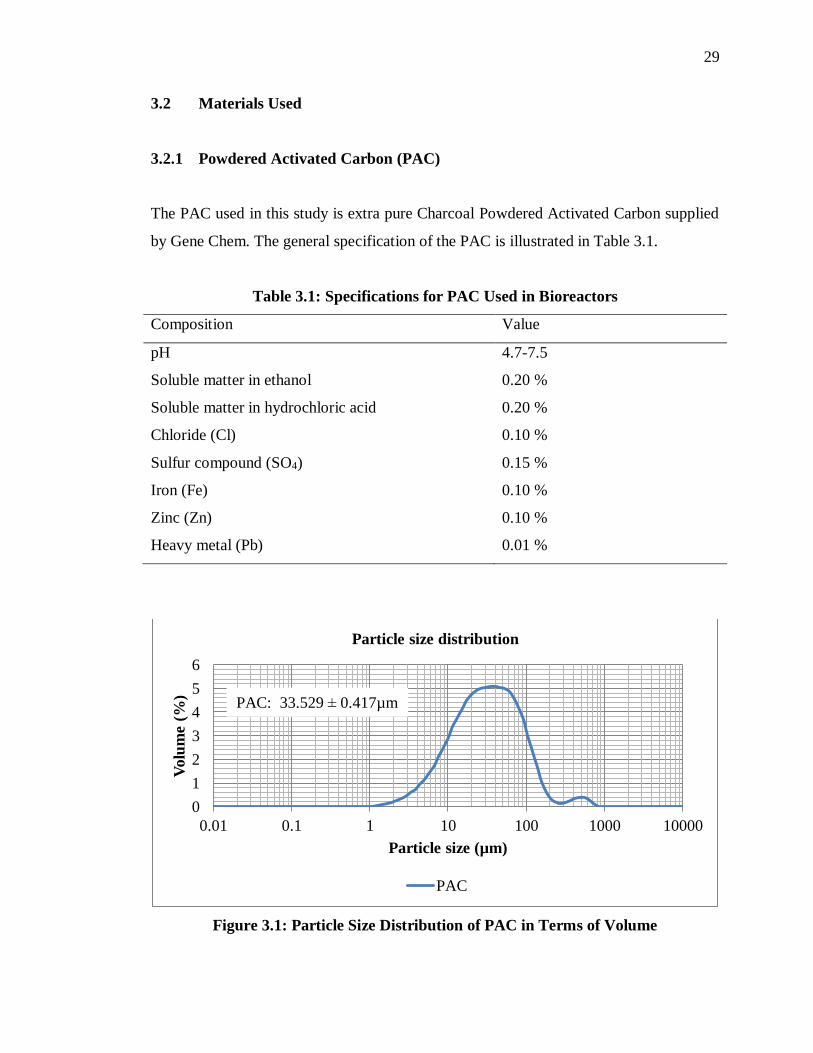
3.2.1 Powdered Activated Carbon (PAC)
The PAC used in this study is extra pure Charcoal Powdered Activated Carbon supplied
by Gene Chem. The general specification of the PAC is illustrated in Table 3.1.
Table 3.1: Specifications for PAC Used in Bioreactors
Composition Value
pH 4.7-7.5
Soluble matter in ethanol 0.20 %
Soluble matter in hydrochloric acid 0.20 %
Chloride (Cl) 0.10 %
Sulfur compound (SO4) 0.15 %
Iron (Fe) 0.10 %
Zinc (Zn) 0.10 %
Heavy metal (Pb) 0.01 %
Figure 3.1: Particle Size Distribution of PAC in Terms of Volume
0
1
2
3
4
5
6
0.01 0.1 1 10 100 1000 10000
Volu
me
(%)
Particle size (µm)
Particle size distribution
PAC
PAC: 33.529 ± 0.417µm
30
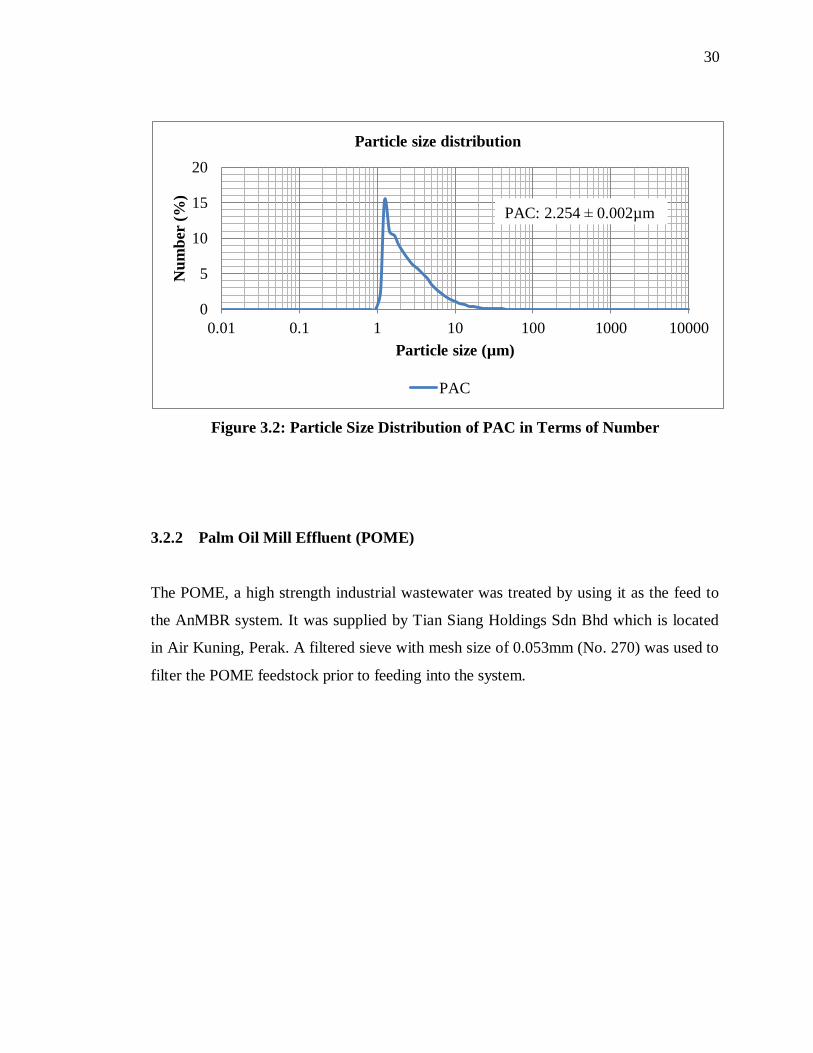
Figure 3.2: Particle Size Distribution of PAC in Terms of Number
3.2.2 Palm Oil Mill Effluent (POME)
The POME, a high strength industrial wastewater was treated by using it as the feed to
the AnMBR system. It was supplied by Tian Siang Holdings Sdn Bhd which is located
in Air Kuning, Perak. A filtered sieve with mesh size of 0.053mm (No. 270) was used to
filter the POME feedstock prior to feeding into the system.
0
5
10
15
20
0.01 0.1 1 10 100 1000 10000
Nu
mb
er (
%)
Particle size (µm)
Particle size distribution
PAC
PAC: 2.254 ± 0.002µm
31
3.3 Analytical Methods
3.3.1 Mixed Liquor Suspended Solid (MLSS) and Mixed Liquor Volatile
Suspended Solid (MLVSS)
Mixed liquor suspended solid (MLSS) and mixed liquor volatile suspended solid
(MLVSS) were determined by using the procedures from Standard Method, 21st Edition.
The crucibles, each with a glass microfiber filter AH-934 placed in it were heated at
550 °C for 15 minutes by using muffle furnace. Then, the heated crucibles with filter
paper in it were stored and cooled down in the desiccator for 20 minutes before
weighing. The mass of crucibles were measured by using M-power Analytical Balance
AZ214. Thereafter, 1mL of sample was applied to the filter paper and filtered by using
vacuum suction pump. Next, the filtered sample was left inside the oven for 2 hours at a
temperature of 105°C. After the filtered sample was left in desiccator for 15 minutes, the
weight of the samples was measured to determine the MLSS. The sample was
subsequently heated in furnace for 15 minutes at 550°C. Once the sample was left cool
down, sample weight was measured to determine the MLVSS.
3.3.2 Chemical Oxygen Demand (COD)
The COD of raw POME, supernatant and permeate water were analyzed by following
the 5220 D Closed Reflux Colorimetric Standard Method as stated in Standard Method,
21st Edition. The samples retrieved were diluted to a ratio of 1:25 prior to adding into
the COD test kit. High range (HR) and high range plus (HR+) HACH COD test kit were
used depending on the concentration of the samples. Then, the test kits with added
samples were heated in the COD reactor (HACH-DRB 200) for 2 hours at 150°C. The
samples were allowed to cool down after heating for 2 hours. The COD value of each
sample was determined by using HACH UV/VIS spectrophotometer (HACH DR 6000).
32
3.3.3 Polysaccharide
The concentration of polysaccharide in supernatant and permeate water were determined
by using phenol-sulfuric acid method. The samples collected were diluted with a ratio of
1:25. Then, mixture solution containing 14mL of phenol and 36mL of distilled water
was prepared. 1mL of mixture solution was retrieved and added into the vial containing
1mL of sample, followed by 5mL of 1 mol/L H2SO4. The vial was wrapped with
aluminium foil wrapper due to light sensitive characteristic of phenol. Next, the samples
were placed in Vortex Shaker for 15 seconds at 1500 rpm. The samples were then
allowed to settle for 15 minutes in the absence of light. The polysaccharide
concentration was measured by using HACH UV/VIS spectrophotometer (HACH DR
6000).
3.3.4 Particle Size Analysis
Particle size distribution of powdered activated carbon used and microbial floc size were
determined by using Malvern Mastersizer 2000 particle size analyser. The particle size
of the sample was analysed in terms of volume and number.
3.3.5 pH measurement
The pH of the sample was measured by using a pH meter (Hanna HI-2550). The pH
meter was calibrated by using buffer solution with a pH of 4, 7 and 10 prior to the usage
to avoid unnecessary error. The pH electrode was rinsed with cleaning agent and
distilled water each time before testing.
3.3.6 Cross Flow Filtration
The supernatant from each bioreactor was used as the input to cross flow filtration
system and the output, permeate water was collected. Conventional membrane was used
to filter the supernatant. The pressure used to force the fluid to pass through the
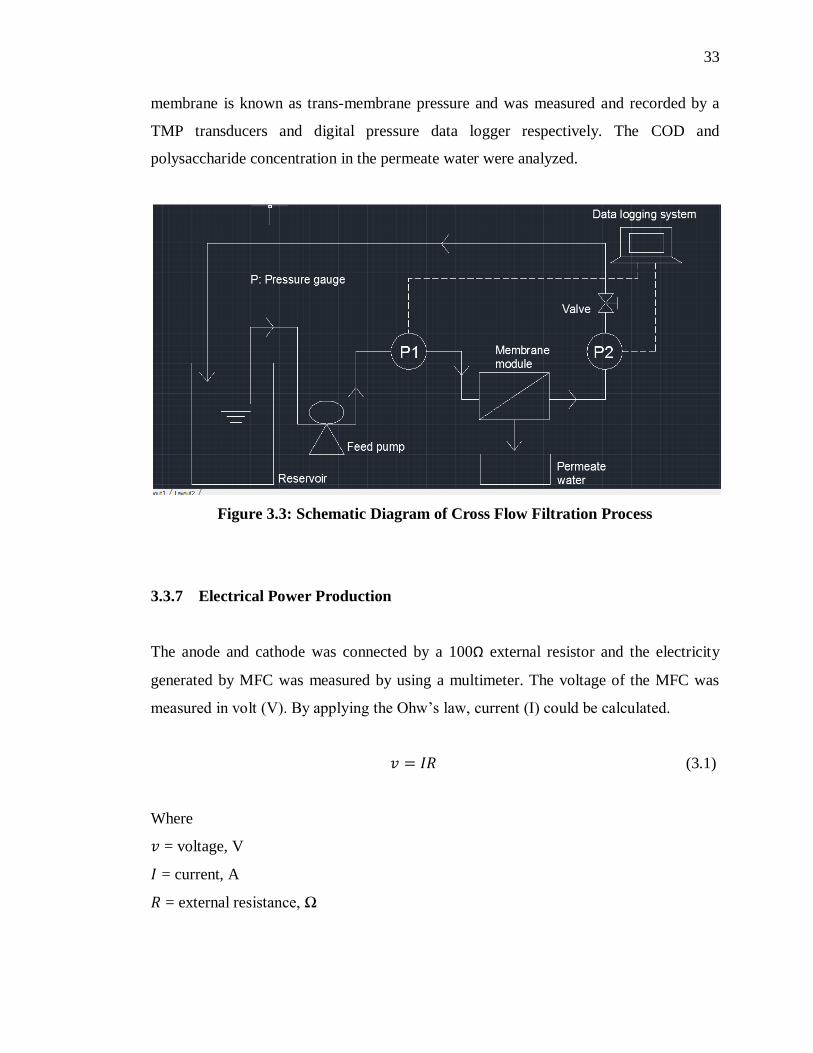
33
membrane is known as trans-membrane pressure and was measured and recorded by a
TMP transducers and digital pressure data logger respectively. The COD and
polysaccharide concentration in the permeate water were analyzed.
Figure 3.3: Schematic Diagram of Cross Flow Filtration Process
3.3.7 Electrical Power Production
The anode and cathode was connected by a 100Ω external resistor and the electricity
generated by MFC was measured by using a multimeter. The voltage of the MFC was
measured in volt (V). By applying the Ohw’s law, current (I) could be calculated.
𝑣 = 𝐼𝑅 (3.1)
Where
𝑣 = voltage, V
𝐼 = current, A
𝑅 = external resistance, Ω
34
The power production of MFC was calculated in terms of volumetric power
density. The equation of volumetric used as follow:
𝑃 =𝑣2
𝑅𝑉 (3.2)
Where
𝑃 = volumetric power density, W/m2
𝑣 = voltage, V
𝑅 = external resistance, Ω
𝑉 = volume of anode chamber, m3
35
CHAPTER 4
RESULTS AND DISCUSSIONS
This chapter discusses the performances of (i) hybrid anaerobic bioreactors, (ii)
anaerobic membrane bioreactor (AnMBRs), (iii) microbial fuel cell (MFC), (iv) hybrid
anaerobic bioreactors incorporated with MFC and (v) anaerobic membrane bioreactor
incorporated with MFC (MFC-AnMBRs). All of the bioreactors were operated under
different temperatures while the microbial fuel cell was in ambient temperature. The
performance of the bioreactors were assessed in terms of efficiencies of COD and
polysaccharides removal, the amount of MLSS and MLVSS, particle size distribution,
membrane fouling and flux rate. While MFC was assessed in terms of efficiency of
COD removal, amount of MLSS and MLVSS, and power generation.
4.1 Assessment of Performance of Hybrid Anaerobic Bioreactors Operated
under Different Temperatures
In this study, four hybrid anaerobic bioreactors, namely R-1, R-2, R-3 and R-4 were set
up with the different temperatures consist of ambient temperature, 35°C, 45°C and 55°C
respectively. The R-1, R-2 and R-3 were cultivated in the mesophilic temperature
regimes while R-4 fell under the thermophlic temperature regimes. Their performances
36
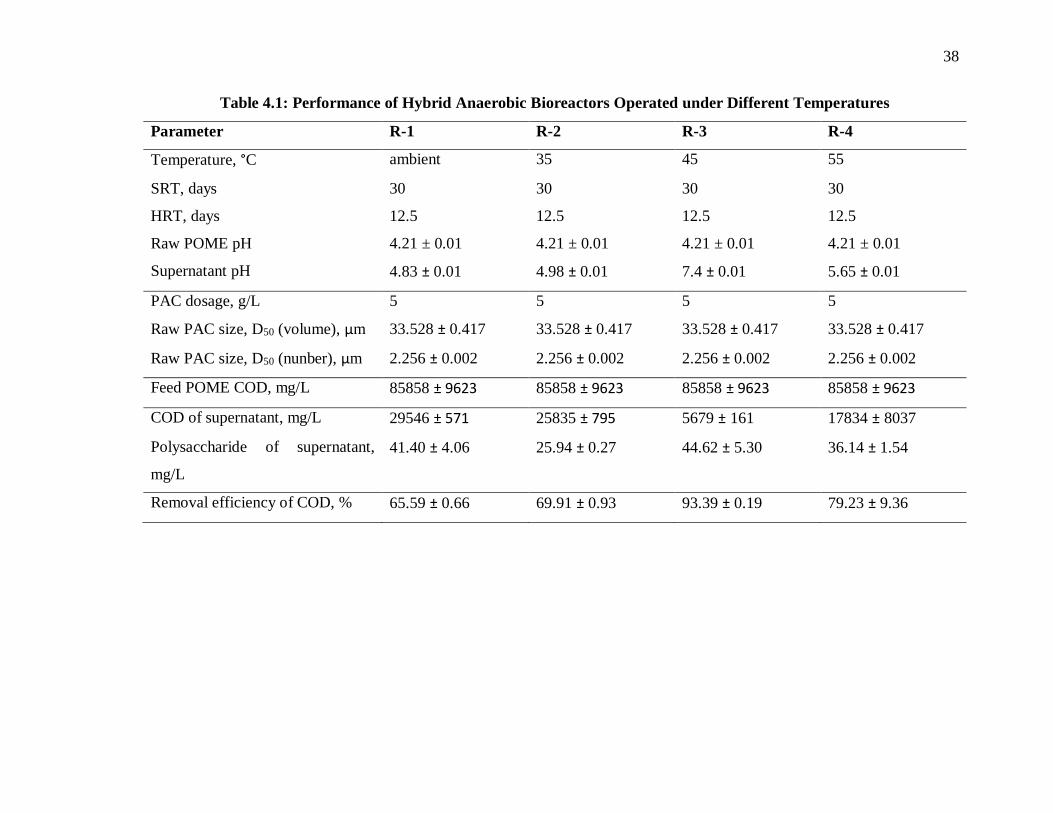
in treating the POME were investigated and the overall treatment performances were
tabulated in Table 4.1.
4.1.1 Effect of Temperature in COD Removal
Throughout the study, it has been found that the bioreactor with the controlled
temperature of 45°C (R-3) achieved the highest treatment efficiency compared to the
other bioreactors, while the bioreactor operated under the ambient temperature (R-1)
manifested the lowest treatment efficiency. The efficiencies of COD removal for R-3
and R-1 were 93.39 ± 0.19 and 65.59 ± 0.66% respectively.
The operational temperature strongly influences the anaerobic processes and
their performance. According to Kim, Ahn and Speece (2002), mesophilic temperatures
have long been employed in most commercial-scale anaerobic digester and yielding
good operational performance, whereas, the use of thermophilic regimes are less
extensively implemented due to poorer process stability and it’s highly sensitive to the
environmental change. Despite the fact that the thermophilic temperature appears to be
less promising, thermophilic anaerobic digestion is known to present several advantages
such as an increased destruction rate of organic solids and the elimination of pathogens
(Meabe et al., 2013). Throughout the study, the process instability of R-4 was observed
as indicated by the relatively large standard deviation in the COD removal efficiency
(79.23 ± 9.36%) compared to the other bioreactors. A number of factors can contribute
to poor process stability such as higher vulnerability as a result of less diverse microbial
community, accumulation of propionate which could potentially result in inhibition and
increased toxicity of intermediates at the thermophilic temperature range (Ghasimi et al.,
2015; Labatut, Angenent and Scott, 2014).
In terms of COD removal efficiency, R-3 showed the best and relatively stable
treating performance compared to the rest of the bioreactors, while R-1 showed the
lowest COD removal efficiency in spite of they both are categorized as mesophilic
processes. This is because the biomass growth rate is closely associated with operational
37
temperature. At low operational temperature, low biomass growth rate will be observed,
rendering difficulty in maintaining biomass concentration as considerable amounts of
biomass can be washed-out from the reactor. Anaerobic treatment at low temperatures
can limit the processes of hydrolysis, breakdown and solubilization of complex organic
matter to soluble substrates (Martinez-Sosa et al., 2011).
Optimal pH is essential for anaerobic digestion where both acidogenic bacteria
and methanogenic bacteria co-exist; the optimal pH range for the system is 6.8-7.4. The
functionality of the micro-organisms will be affected under imbalance pH. For instance,
when pH becomes too low, the capability of methanogens in converting the acids into
methane will be inhibited. (Naik et al., 2014). According to Kunacheva, Soh and
Stuckey (in press) low pH can leads to acidification of the cytoplasm, which is sufficient
to inhibit microbial growth as the cell is unable to synthesize normal cellular
components. Out of the four hybrid anaerobic bioreactors, only R-3 managed to
maintain in the optimal pH range. The drop in pH can be attributed to various factors
such as the accumulation of long-chain fatty acids (LCFA) resulting from the hydrolysis
of neutral lipids (Labatut, Angenent and Scott, 2014). Besides, POME as the feedstock
to the bioreactors is an acidic and high strength wastewater can result in a sudden drop
in pH and thus influencing the microbial metabolism (Gao et al., 2010). The feedstock
needs to be monitored to ensure that it is either having enough alkalinity, or not too
easily hydrolyzed so as to cause a fall in the pH (Naik et al., 2014).
38
Table 4.1: Performance of Hybrid Anaerobic Bioreactors Operated under Different Temperatures
Parameter R-1 R-2 R-3 R-4
Temperature, °C ambient 35 45 55
SRT, days 30 30 30 30
HRT, days 12.5 12.5 12.5 12.5
Raw POME pH 4.21 ± 0.01 4.21 ± 0.01 4.21 ± 0.01 4.21 ± 0.01
Supernatant pH 4.83 ± 0.01 4.98 ± 0.01 7.4 ± 0.01 5.65 ± 0.01
PAC dosage, g/L 5 5 5 5
Raw PAC size, D50 (volume), μm 33.528 ± 0.417 33.528 ± 0.417 33.528 ± 0.417 33.528 ± 0.417
Raw PAC size, D50 (nunber), μm 2.256 ± 0.002 2.256 ± 0.002 2.256 ± 0.002 2.256 ± 0.002
Feed POME COD, mg/L 85858 ± 9623 85858 ± 9623 85858 ± 9623 85858 ± 9623
COD of supernatant, mg/L 29546 ± 571 25835 ± 795 5679 ± 161 17834 ± 8037
Polysaccharide of supernatant,
mg/L
41.40 ± 4.06 25.94 ± 0.27 44.62 ± 5.30 36.14 ± 1.54
Removal efficiency of COD, % 65.59 ± 0.66 69.91 ± 0.93 93.39 ± 0.19 79.23 ± 9.36
39
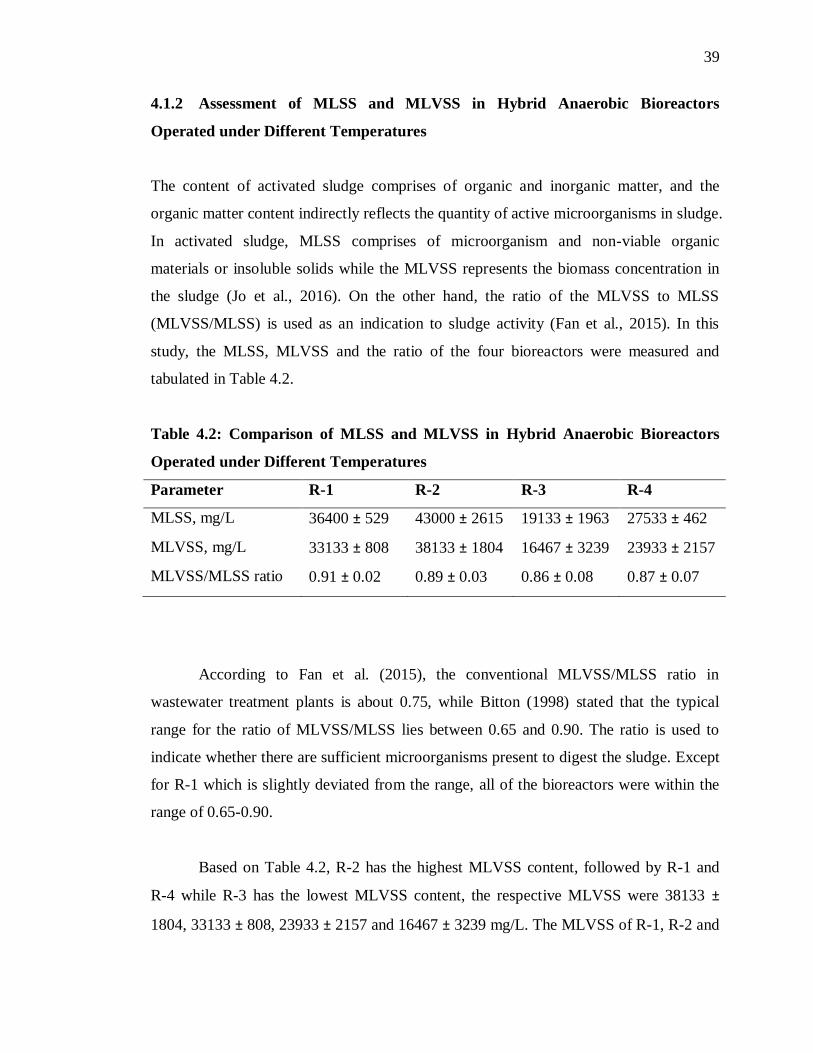
4.1.2 Assessment of MLSS and MLVSS in Hybrid Anaerobic Bioreactors
Operated under Different Temperatures
The content of activated sludge comprises of organic and inorganic matter, and the
organic matter content indirectly reflects the quantity of active microorganisms in sludge.
In activated sludge, MLSS comprises of microorganism and non-viable organic
materials or insoluble solids while the MLVSS represents the biomass concentration in
the sludge (Jo et al., 2016). On the other hand, the ratio of the MLVSS to MLSS
(MLVSS/MLSS) is used as an indication to sludge activity (Fan et al., 2015). In this
study, the MLSS, MLVSS and the ratio of the four bioreactors were measured and
tabulated in Table 4.2.
Table 4.2: Comparison of MLSS and MLVSS in Hybrid Anaerobic Bioreactors
Operated under Different Temperatures
Parameter R-1 R-2 R-3 R-4
MLSS, mg/L 36400 ± 529 43000 ± 2615 19133 ± 1963 27533 ± 462
MLVSS, mg/L 33133 ± 808 38133 ± 1804 16467 ± 3239 23933 ± 2157
MLVSS/MLSS ratio 0.91 ± 0.02 0.89 ± 0.03 0.86 ± 0.08 0.87 ± 0.07
According to Fan et al. (2015), the conventional MLVSS/MLSS ratio in
wastewater treatment plants is about 0.75, while Bitton (1998) stated that the typical
range for the ratio of MLVSS/MLSS lies between 0.65 and 0.90. The ratio is used to
indicate whether there are sufficient microorganisms present to digest the sludge. Except
for R-1 which is slightly deviated from the range, all of the bioreactors were within the
range of 0.65-0.90.
Based on Table 4.2, R-2 has the highest MLVSS content, followed by R-1 and
R-4 while R-3 has the lowest MLVSS content, the respective MLVSS were 38133 ±
1804, 33133 ± 808, 23933 ± 2157 and 16467 ± 3239 mg/L. The MLVSS of R-1, R-2 and
40
R-4 were higher than R-3 despite R-3 showed the best treating efficiency in terms of
COD removal. The unexceptionally high content of MLVSS in R-1, R-2 and R-4 might
be due to the buildup of soluble microbial products (SMP) as a response to
environmental stresses such as low pH and low temperature. The presence of SMP in
biological treatment systems can negatively impact the system such as affecting the
performance in terms of COD removal and causes membrane fouling (Kunacheva, Soh
and Stuckey, in press). The production of SMP can contribute to the organic content in
the sludge and hence rendering a relatively higher MLVSS content in R-1, R-2 and R-4
compared to R-3.
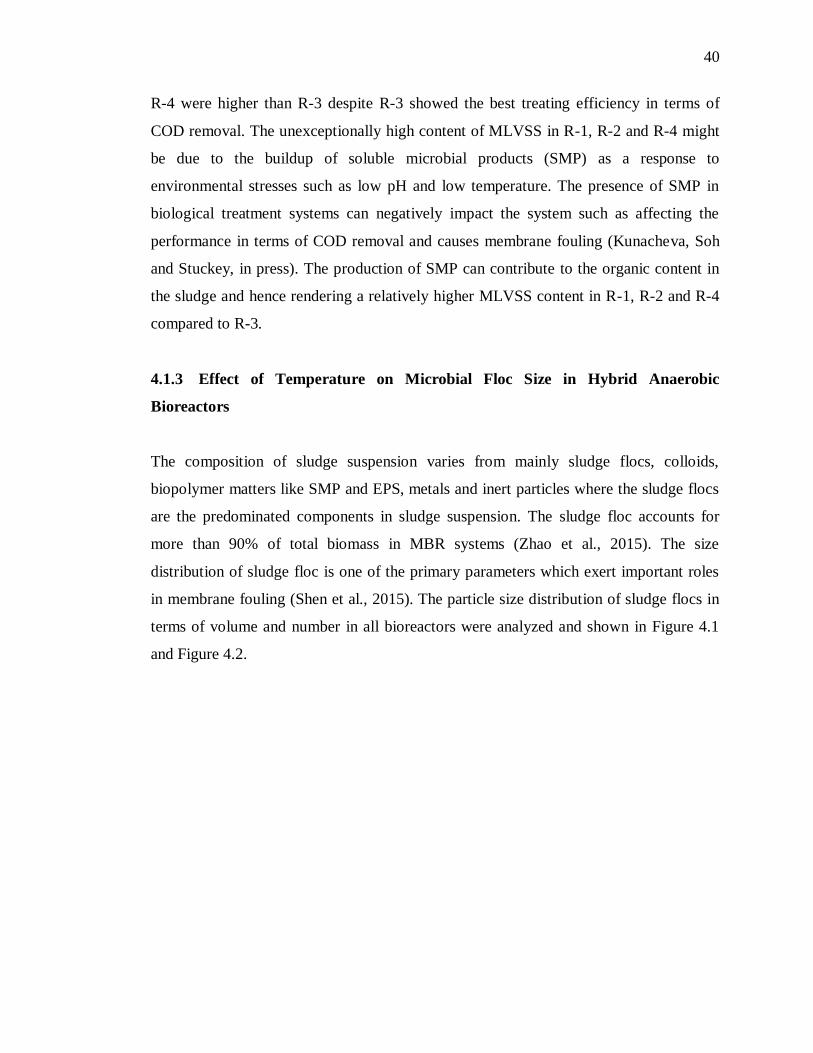
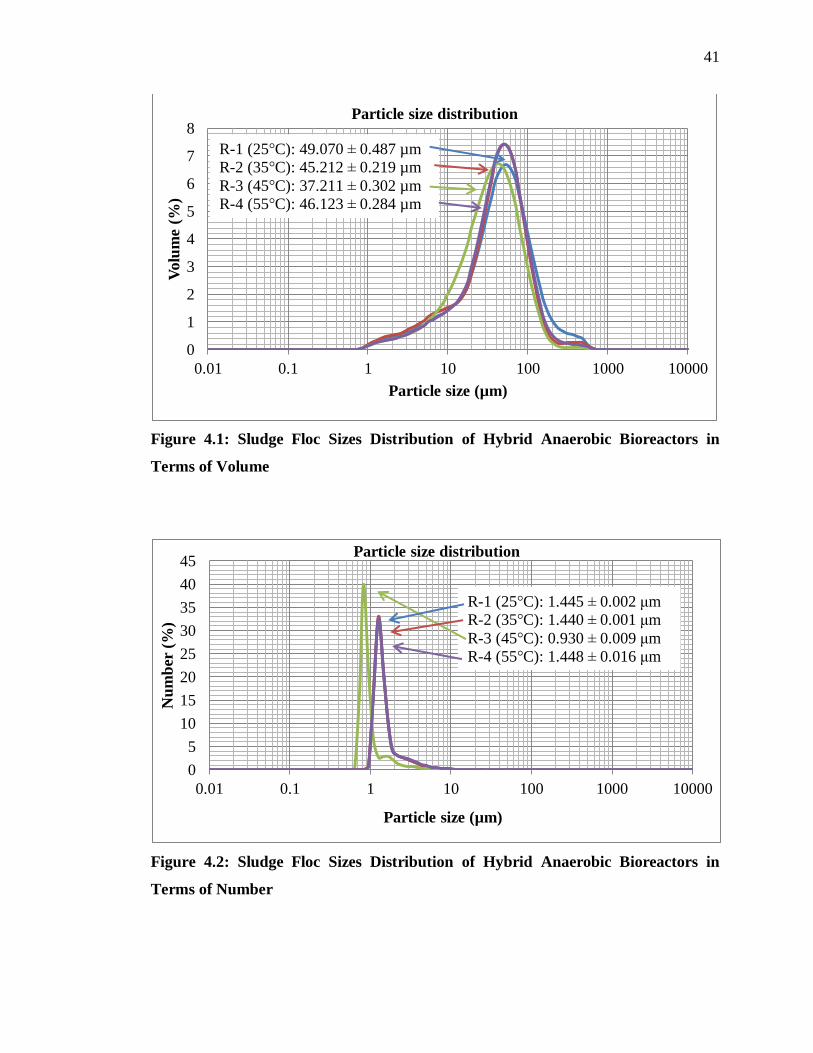
4.1.3 Effect of Temperature on Microbial Floc Size in Hybrid Anaerobic
Bioreactors
The composition of sludge suspension varies from mainly sludge flocs, colloids,
biopolymer matters like SMP and EPS, metals and inert particles where the sludge flocs
are the predominated components in sludge suspension. The sludge floc accounts for
more than 90% of total biomass in MBR systems (Zhao et al., 2015). The size
distribution of sludge floc is one of the primary parameters which exert important roles
in membrane fouling (Shen et al., 2015). The particle size distribution of sludge flocs in
terms of volume and number in all bioreactors were analyzed and shown in Figure 4.1
and Figure 4.2.
41
Figure 4.1: Sludge Floc Sizes Distribution of Hybrid Anaerobic Bioreactors in
Terms of Volume
Figure 4.2: Sludge Floc Sizes Distribution of Hybrid Anaerobic Bioreactors in
Terms of Number
0
1
2
3
4
5
6
7
8
0.01 0.1 1 10 100 1000 10000
Volu
me
(%)
Particle size (µm)
Particle size distribution
R-1 (25°C): 49.070 ± 0.487 µm
R-2 (35°C): 45.212 ± 0.219 µm
R-3 (45°C): 37.211 ± 0.302 µm
R-4 (55°C): 46.123 ± 0.284 µm
0
5
10
15
20
25
30
35
40
45
0.01 0.1 1 10 100 1000 10000
Nu
mb
er (
%)
Particle size (µm)
Particle size distribution
R-1 (25°C): 1.445 ± 0.002 μm
R-2 (35°C): 1.440 ± 0.001 μm
R-3 (45°C): 0.930 ± 0.009 μm
R-4 (55°C): 1.448 ± 0.016 μm
42
From Figure 4.1, R-3 with the best treatment efficiency has the smallest floc size
while the R-1 with the lowest treating efficiency has the biggest floc size in terms of
volume. According to Naik et al. (2014), smaller particles increase the productivity of
the system, largely due to the increased surface area for increased biological activity.
Hence, the smaller in size of the sludge flocs in R-3 have larger surface area available
for biological activity. Meabe et al. (2013) reported that the temperature can
significantly influence the sludge’s rheological properties. It was found that at higher
temperature, the particle sizes will be smaller. From the study of Jeison and van Lier
(2008), it was found that long-term continuous operation under thermophilic condition
can significantly reduce the sludge floc size. However, floc size in R-4 operated under
thermophilic range was larger compared to R-3 operated under mesophilic regime. This
could possibly due to the change of pH in R-4 which drastically shifts the relative
numbers of different species in a heterogeneous population. Besides that, cell
morphology and structure can be affected by pH variation which in turn influences the
flocculation and adhesion phenomena (Yu and Fang, 2003).
4.1.4 Membrane Fouling Control in Anaerobic Membrane Bioreactors Operated
under Different Temperatures
Cross-flow filtration was performed to determine the overall efficiencies of bioreactors
by using polymer membrane. The supernatant from each hybrid anaerobic bioreactors
was retrieved and underwent cross-flow filtration process. The effluent that underwent
filtration process is known as permeate and was collected and analyzed for its quality in
terms of COD and polysaccharide removal efficiencies. The bioreactors, R that
underwent filtration process henceforth shall be referred correspondingly to as AnMBR.
The tested results were tabulated in Table 4.3.
In terms of COD and polysaccharide removal efficiencies, AnMBR-3 achieved
the highest removal efficiencies for both parameters which were 95.60 ± 0.30 and 73.01
± 0.08% respectively. This is in accordance with the result obtained for R-3 operated at
45°C, thus indicating the highest biomass growth rate among the others. While AnMBR-
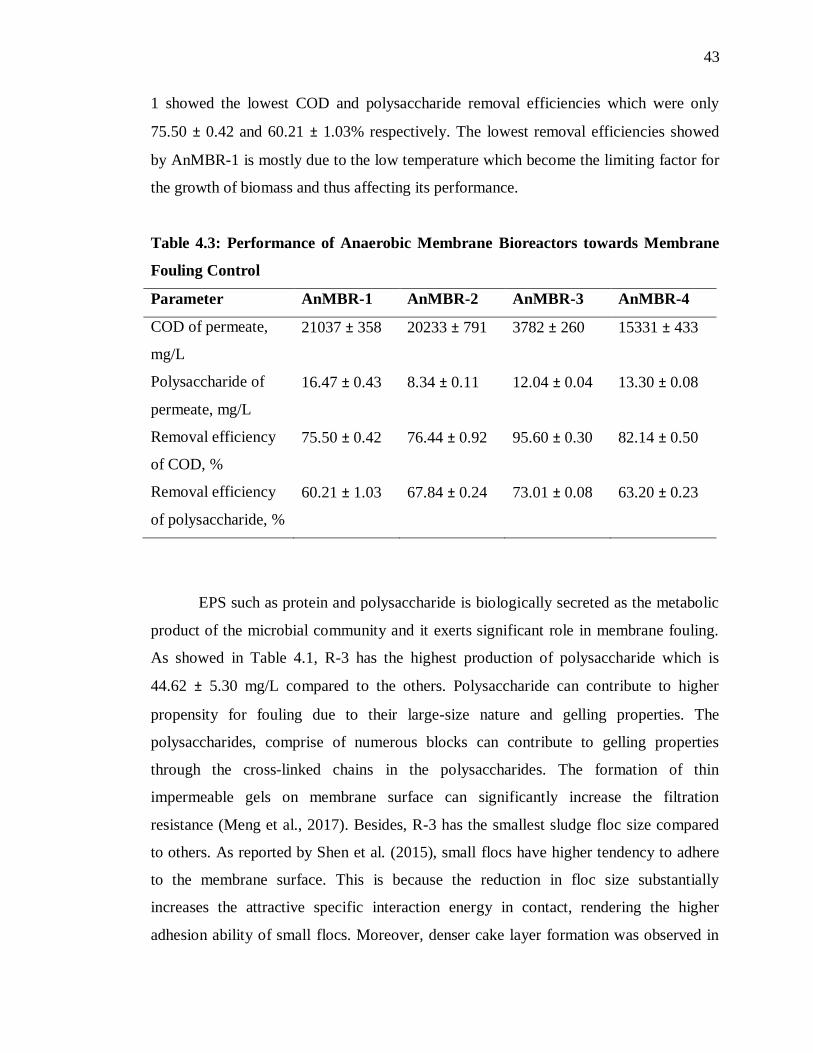
43
1 showed the lowest COD and polysaccharide removal efficiencies which were only
75.50 ± 0.42 and 60.21 ± 1.03% respectively. The lowest removal efficiencies showed
by AnMBR-1 is mostly due to the low temperature which become the limiting factor for
the growth of biomass and thus affecting its performance.
Table 4.3: Performance of Anaerobic Membrane Bioreactors towards Membrane
Fouling Control
Parameter AnMBR-1 AnMBR-2 AnMBR-3 AnMBR-4
COD of permeate,
mg/L
21037 ± 358 20233 ± 791 3782 ± 260 15331 ± 433
Polysaccharide of
permeate, mg/L
16.47 ± 0.43 8.34 ± 0.11 12.04 ± 0.04 13.30 ± 0.08
Removal efficiency
of COD, %
75.50 ± 0.42 76.44 ± 0.92 95.60 ± 0.30 82.14 ± 0.50
Removal efficiency
of polysaccharide, %
60.21 ± 1.03 67.84 ± 0.24 73.01 ± 0.08 63.20 ± 0.23
EPS such as protein and polysaccharide is biologically secreted as the metabolic
product of the microbial community and it exerts significant role in membrane fouling.
As showed in Table 4.1, R-3 has the highest production of polysaccharide which is
44.62 ± 5.30 mg/L compared to the others. Polysaccharide can contribute to higher
propensity for fouling due to their large-size nature and gelling properties. The
polysaccharides, comprise of numerous blocks can contribute to gelling properties
through the cross-linked chains in the polysaccharides. The formation of thin
impermeable gels on membrane surface can significantly increase the filtration
resistance (Meng et al., 2017). Besides, R-3 has the smallest sludge floc size compared
to others. As reported by Shen et al. (2015), small flocs have higher tendency to adhere
to the membrane surface. This is because the reduction in floc size substantially
increases the attractive specific interaction energy in contact, rendering the higher
adhesion ability of small flocs. Moreover, denser cake layer formation was observed in
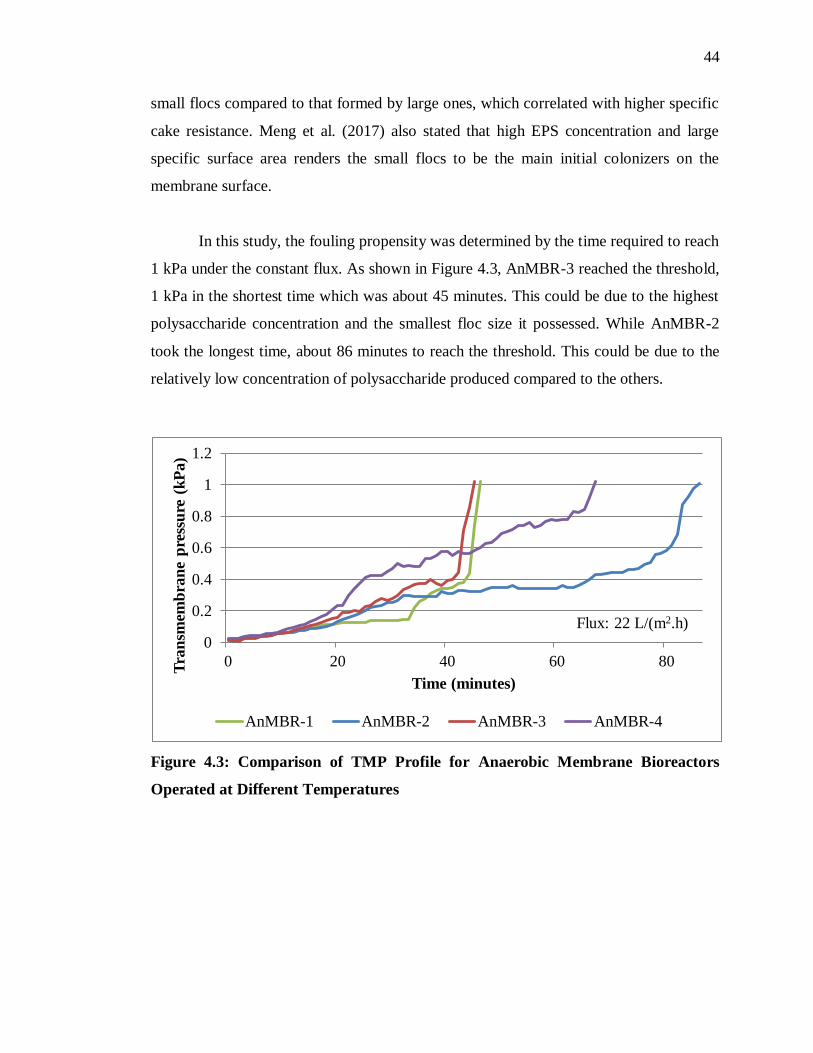
44
small flocs compared to that formed by large ones, which correlated with higher specific
cake resistance. Meng et al. (2017) also stated that high EPS concentration and large
specific surface area renders the small flocs to be the main initial colonizers on the
membrane surface.
In this study, the fouling propensity was determined by the time required to reach
1 kPa under the constant flux. As shown in Figure 4.3, AnMBR-3 reached the threshold,
1 kPa in the shortest time which was about 45 minutes. This could be due to the highest
polysaccharide concentration and the smallest floc size it possessed. While AnMBR-2
took the longest time, about 86 minutes to reach the threshold. This could be due to the
relatively low concentration of polysaccharide produced compared to the others.
Figure 4.3: Comparison of TMP Profile for Anaerobic Membrane Bioreactors
Operated at Different Temperatures
0
0.2
0.4
0.6
0.8
1
1.2
0 20 40 60 80
Tra
nsm
emb
ran
e p
ress
ure
(k
Pa)
Time (minutes)
AnMBR-1 AnMBR-2 AnMBR-3 AnMBR-4
Flux: 22 L/(m2.h)
45
4.2 Assessment of Performance of MFC
One MFC was constructed to determine and compare the COD removal efficiency with
AnMBRs and MFC-MBR. The overall treating performance of MFC was tabulated in
Table 4.4. The SRT, HRT, PAC size and dosage used were similar to the operating
conditions of hybrid anaerobic bioreactors. The MFC was operated under the ambient
temperature. The pH recorded was 5.23 ± 0.01, which was slightly off from the optimal
pH range, 6.8-7.4 for anaerobic processes (Naik et al., 2014). The ratio of
MLVSS/MLSS was kept in the range of 0.65- 0.90 (Bitton, 1998). The COD removal
efficiency for MFC was 72.67 ± 2.70% which was slightly better compared to R-1 and
R-2. Besides, the power produced from MFC was measured. The average power density
for MFC with a total volume of 1615.56 cm3 was 0.062 W/m3.
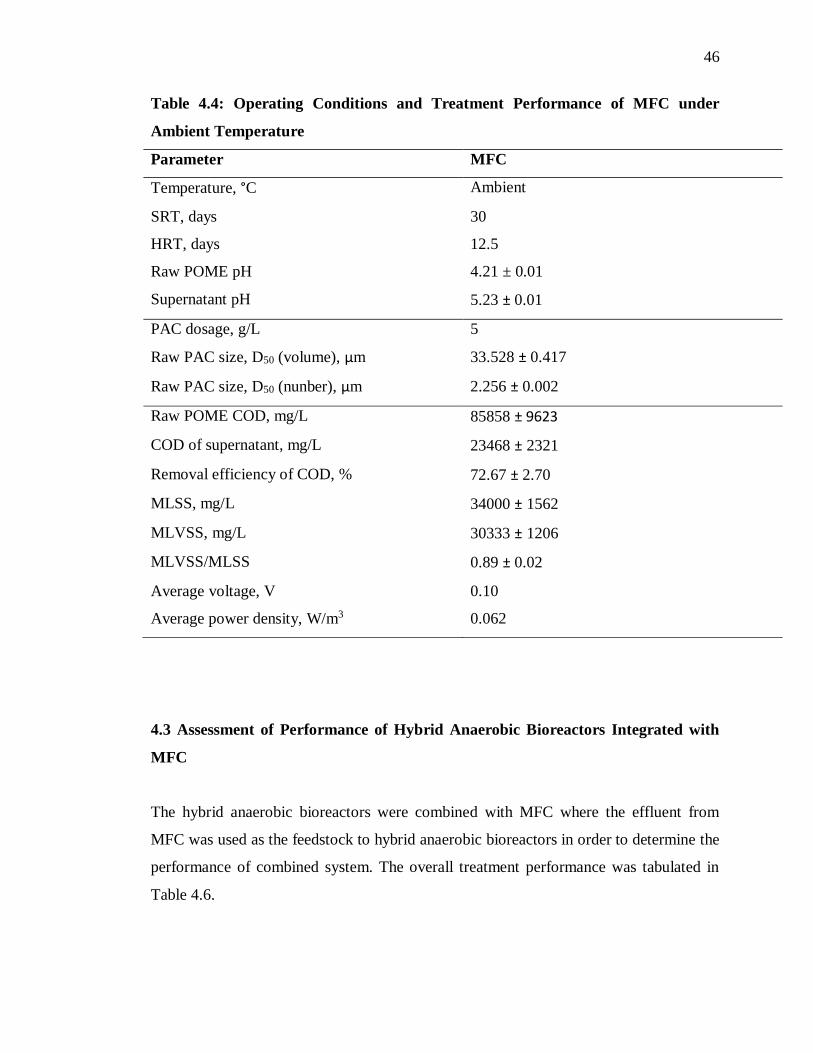
46
Table 4.4: Operating Conditions and Treatment Performance of MFC under
Ambient Temperature
Parameter MFC
Temperature, °C Ambient
SRT, days 30
HRT, days 12.5
Raw POME pH 4.21 ± 0.01
Supernatant pH 5.23 ± 0.01
PAC dosage, g/L 5
Raw PAC size, D50 (volume), μm 33.528 ± 0.417
Raw PAC size, D50 (nunber), μm 2.256 ± 0.002
Raw POME COD, mg/L 85858 ± 9623
COD of supernatant, mg/L 23468 ± 2321
Removal efficiency of COD, % 72.67 ± 2.70
MLSS, mg/L 34000 ± 1562
MLVSS, mg/L 30333 ± 1206
MLVSS/MLSS 0.89 ± 0.02
Average voltage, V 0.10
Average power density, W/m3 0.062
4.3 Assessment of Performance of Hybrid Anaerobic Bioreactors Integrated with
MFC
The hybrid anaerobic bioreactors were combined with MFC where the effluent from
MFC was used as the feedstock to hybrid anaerobic bioreactors in order to determine the
performance of combined system. The overall treatment performance was tabulated in
Table 4.6.
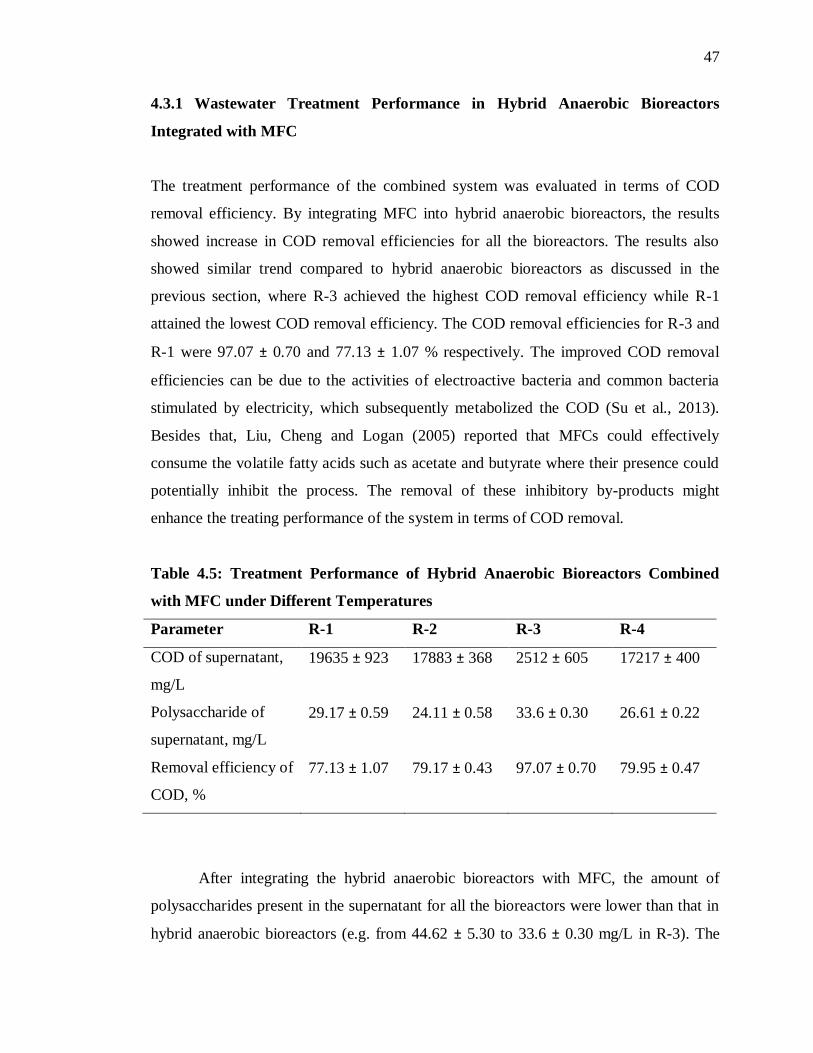
47
4.3.1 Wastewater Treatment Performance in Hybrid Anaerobic Bioreactors
Integrated with MFC
The treatment performance of the combined system was evaluated in terms of COD
removal efficiency. By integrating MFC into hybrid anaerobic bioreactors, the results
showed increase in COD removal efficiencies for all the bioreactors. The results also
showed similar trend compared to hybrid anaerobic bioreactors as discussed in the
previous section, where R-3 achieved the highest COD removal efficiency while R-1
attained the lowest COD removal efficiency. The COD removal efficiencies for R-3 and
R-1 were 97.07 ± 0.70 and 77.13 ± 1.07 % respectively. The improved COD removal
efficiencies can be due to the activities of electroactive bacteria and common bacteria
stimulated by electricity, which subsequently metabolized the COD (Su et al., 2013).
Besides that, Liu, Cheng and Logan (2005) reported that MFCs could effectively
consume the volatile fatty acids such as acetate and butyrate where their presence could
potentially inhibit the process. The removal of these inhibitory by-products might
enhance the treating performance of the system in terms of COD removal.
Table 4.5: Treatment Performance of Hybrid Anaerobic Bioreactors Combined
with MFC under Different Temperatures
Parameter R-1 R-2 R-3 R-4
COD of supernatant,
mg/L
19635 ± 923 17883 ± 368 2512 ± 605 17217 ± 400
Polysaccharide of
supernatant, mg/L
29.17 ± 0.59 24.11 ± 0.58 33.6 ± 0.30 26.61 ± 0.22
Removal efficiency of
COD, %
77.13 ± 1.07 79.17 ± 0.43 97.07 ± 0.70 79.95 ± 0.47
After integrating the hybrid anaerobic bioreactors with MFC, the amount of
polysaccharides present in the supernatant for all the bioreactors were lower than that in
hybrid anaerobic bioreactors (e.g. from 44.62 ± 5.30 to 33.6 ± 0.30 mg/L in R-3). The
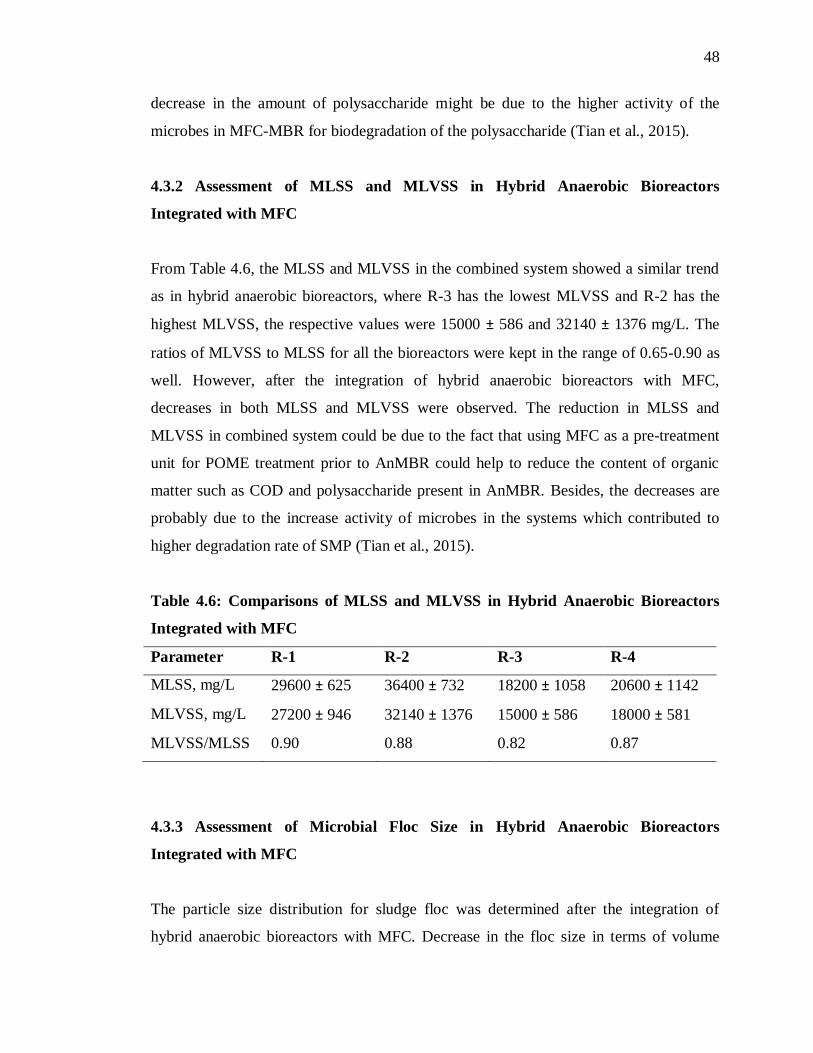
48
decrease in the amount of polysaccharide might be due to the higher activity of the
microbes in MFC-MBR for biodegradation of the polysaccharide (Tian et al., 2015).
4.3.2 Assessment of MLSS and MLVSS in Hybrid Anaerobic Bioreactors
Integrated with MFC
From Table 4.6, the MLSS and MLVSS in the combined system showed a similar trend
as in hybrid anaerobic bioreactors, where R-3 has the lowest MLVSS and R-2 has the
highest MLVSS, the respective values were 15000 ± 586 and 32140 ± 1376 mg/L. The
ratios of MLVSS to MLSS for all the bioreactors were kept in the range of 0.65-0.90 as
well. However, after the integration of hybrid anaerobic bioreactors with MFC,
decreases in both MLSS and MLVSS were observed. The reduction in MLSS and
MLVSS in combined system could be due to the fact that using MFC as a pre-treatment
unit for POME treatment prior to AnMBR could help to reduce the content of organic
matter such as COD and polysaccharide present in AnMBR. Besides, the decreases are
probably due to the increase activity of microbes in the systems which contributed to
higher degradation rate of SMP (Tian et al., 2015).
Table 4.6: Comparisons of MLSS and MLVSS in Hybrid Anaerobic Bioreactors
Integrated with MFC
Parameter R-1 R-2 R-3 R-4
MLSS, mg/L 29600 ± 625 36400 ± 732 18200 ± 1058 20600 ± 1142
MLVSS, mg/L 27200 ± 946 32140 ± 1376 15000 ± 586 18000 ± 581
MLVSS/MLSS 0.90 0.88 0.82 0.87
4.3.3 Assessment of Microbial Floc Size in Hybrid Anaerobic Bioreactors
Integrated with MFC
The particle size distribution for sludge floc was determined after the integration of
hybrid anaerobic bioreactors with MFC. Decrease in the floc size in terms of volume
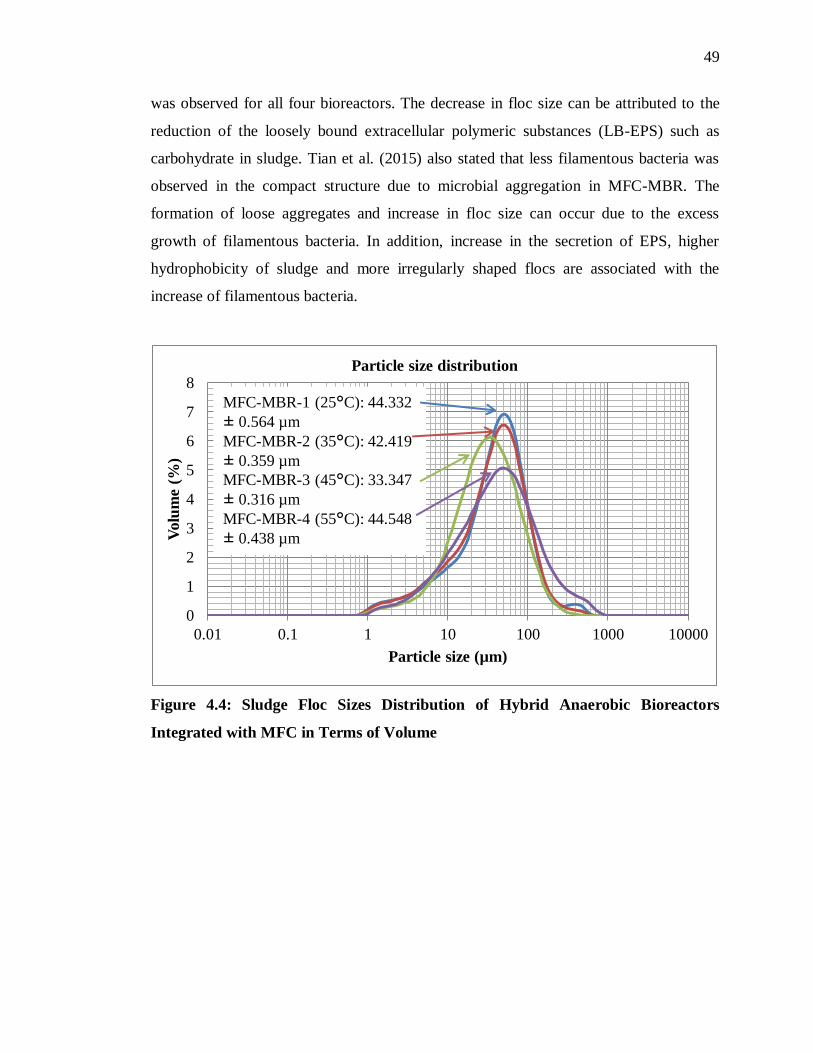
49
was observed for all four bioreactors. The decrease in floc size can be attributed to the
reduction of the loosely bound extracellular polymeric substances (LB-EPS) such as
carbohydrate in sludge. Tian et al. (2015) also stated that less filamentous bacteria was
observed in the compact structure due to microbial aggregation in MFC-MBR. The
formation of loose aggregates and increase in floc size can occur due to the excess
growth of filamentous bacteria. In addition, increase in the secretion of EPS, higher
hydrophobicity of sludge and more irregularly shaped flocs are associated with the
increase of filamentous bacteria.
Figure 4.4: Sludge Floc Sizes Distribution of Hybrid Anaerobic Bioreactors
Integrated with MFC in Terms of Volume
0
1
2
3
4
5
6
7
8
0.01 0.1 1 10 100 1000 10000
Volu
me
(%)
Particle size (µm)
Particle size distribution
MFC-MBR-1 (25°C): 44.332
± 0.564 µm
MFC-MBR-2 (35°C): 42.419
± 0.359 µm
MFC-MBR-3 (45°C): 33.347
± 0.316 µm
MFC-MBR-4 (55°C): 44.548
± 0.438 µm
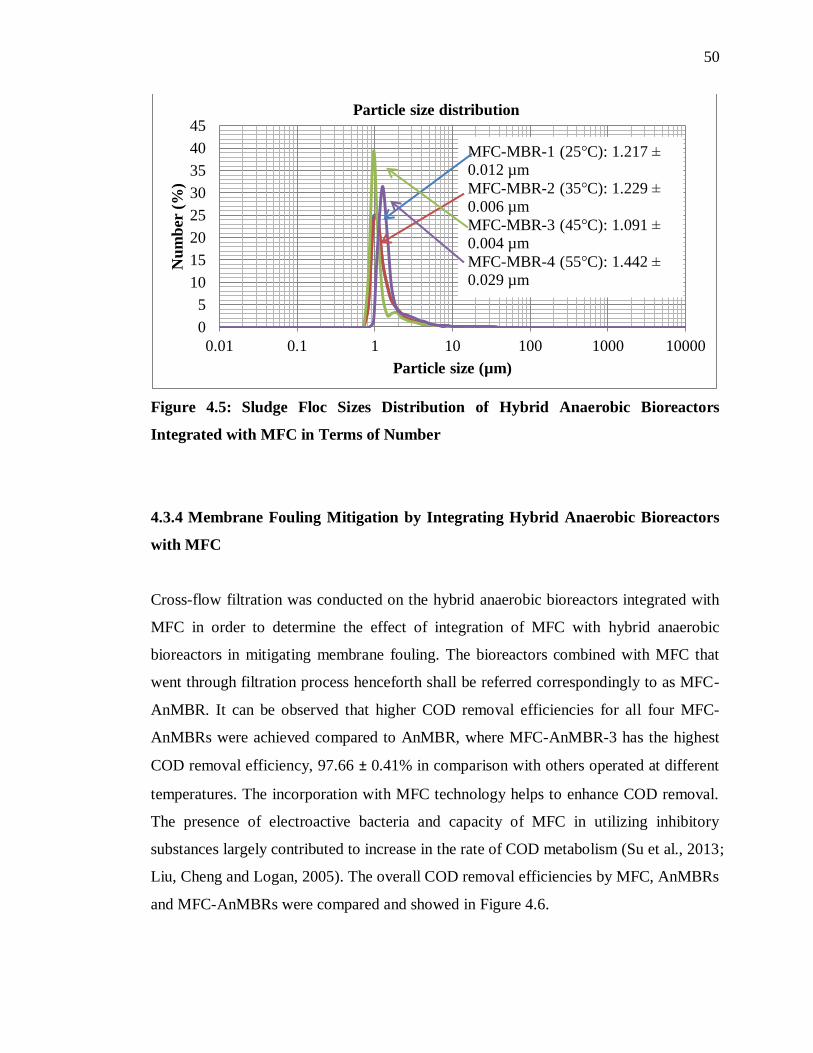
50
Figure 4.5: Sludge Floc Sizes Distribution of Hybrid Anaerobic Bioreactors
Integrated with MFC in Terms of Number
4.3.4 Membrane Fouling Mitigation by Integrating Hybrid Anaerobic Bioreactors
with MFC
Cross-flow filtration was conducted on the hybrid anaerobic bioreactors integrated with
MFC in order to determine the effect of integration of MFC with hybrid anaerobic
bioreactors in mitigating membrane fouling. The bioreactors combined with MFC that
went through filtration process henceforth shall be referred correspondingly to as MFC-
AnMBR. It can be observed that higher COD removal efficiencies for all four MFC-
AnMBRs were achieved compared to AnMBR, where MFC-AnMBR-3 has the highest
COD removal efficiency, 97.66 ± 0.41% in comparison with others operated at different
temperatures. The incorporation with MFC technology helps to enhance COD removal.
The presence of electroactive bacteria and capacity of MFC in utilizing inhibitory
substances largely contributed to increase in the rate of COD metabolism (Su et al., 2013;
Liu, Cheng and Logan, 2005). The overall COD removal efficiencies by MFC, AnMBRs
and MFC-AnMBRs were compared and showed in Figure 4.6.
0
5
10
15
20
25
30
35
40
45
0.01 0.1 1 10 100 1000 10000
Nu
mb
er (
%)
Particle size (µm)
Particle size distribution
MFC-MBR-1 (25°C): 1.217 ±
0.012 µm
MFC-MBR-2 (35°C): 1.229 ±
0.006 µm
MFC-MBR-3 (45°C): 1.091 ±
0.004 µm
MFC-MBR-4 (55°C): 1.442 ±
0.029 µm
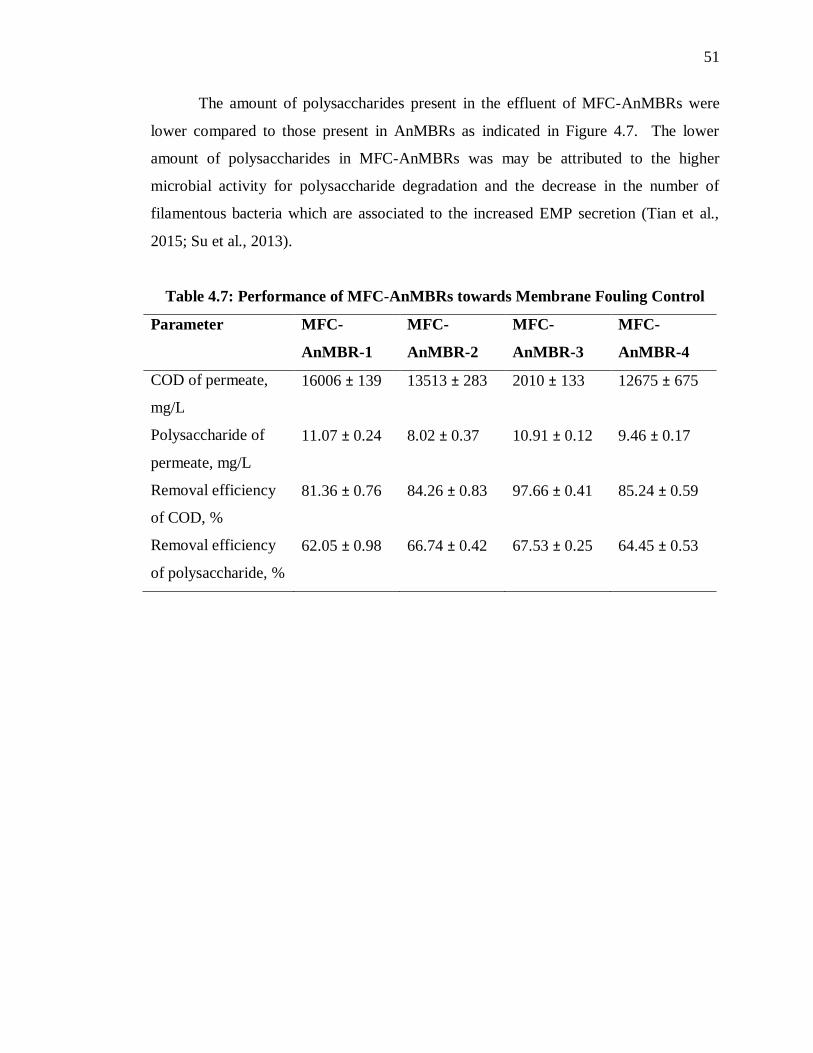
51
The amount of polysaccharides present in the effluent of MFC-AnMBRs were
lower compared to those present in AnMBRs as indicated in Figure 4.7. The lower
amount of polysaccharides in MFC-AnMBRs was may be attributed to the higher
microbial activity for polysaccharide degradation and the decrease in the number of
filamentous bacteria which are associated to the increased EMP secretion (Tian et al.,
2015; Su et al., 2013).
Table 4.7: Performance of MFC-AnMBRs towards Membrane Fouling Control
Parameter MFC-
AnMBR-1
MFC-
AnMBR-2
MFC-
AnMBR-3
MFC-
AnMBR-4
COD of permeate,
mg/L
16006 ± 139 13513 ± 283 2010 ± 133 12675 ± 675
Polysaccharide of
permeate, mg/L
11.07 ± 0.24 8.02 ± 0.37 10.91 ± 0.12 9.46 ± 0.17
Removal efficiency
of COD, %
81.36 ± 0.76 84.26 ± 0.83 97.66 ± 0.41 85.24 ± 0.59
Removal efficiency
of polysaccharide, %
62.05 ± 0.98 66.74 ± 0.42 67.53 ± 0.25 64.45 ± 0.53
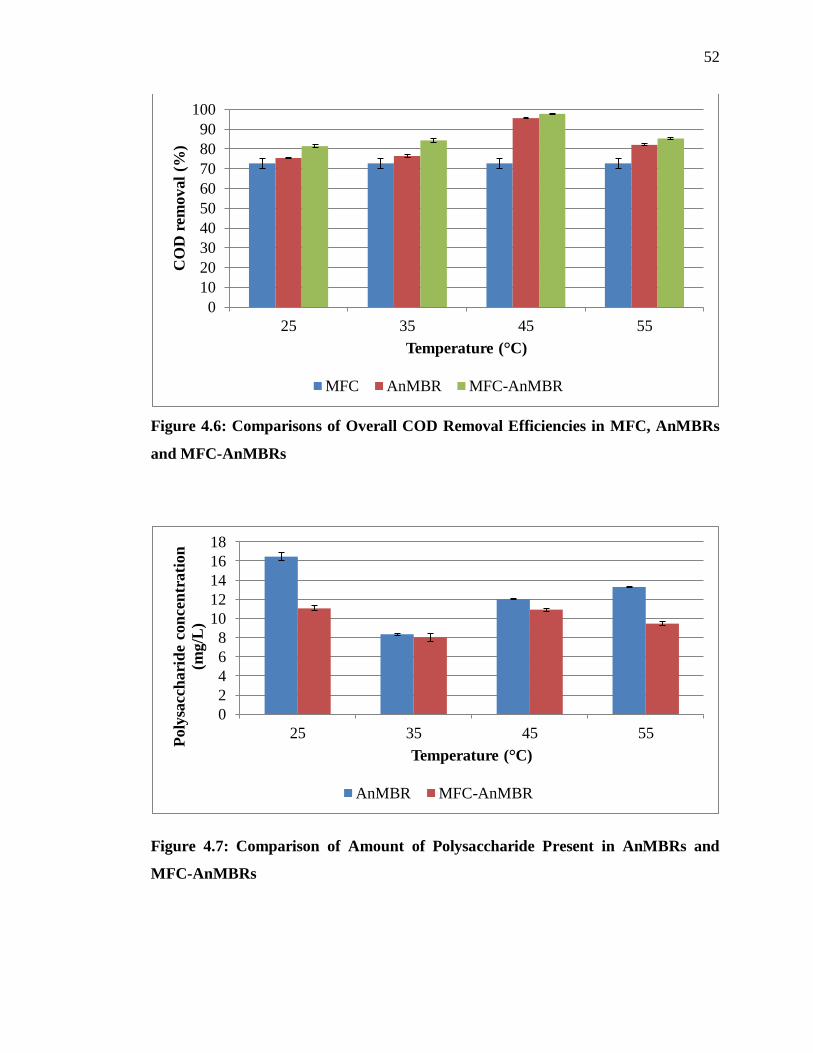
52
Figure 4.6: Comparisons of Overall COD Removal Efficiencies in MFC, AnMBRs
and MFC-AnMBRs
Figure 4.7: Comparison of Amount of Polysaccharide Present in AnMBRs and
MFC-AnMBRs
0
10
20
30
40
50
60
70
80
90
100
25 35 45 55
CO
D r
emov
al
(%)
Temperature (°C)
MFC AnMBR MFC-AnMBR
0
2
4
6
8
10
12
14
16
18
25 35 45 55
Poly
sacc
hari
de
con
cen
trati
on
(mg/L
)
Temperature (°C)
AnMBR MFC-AnMBR
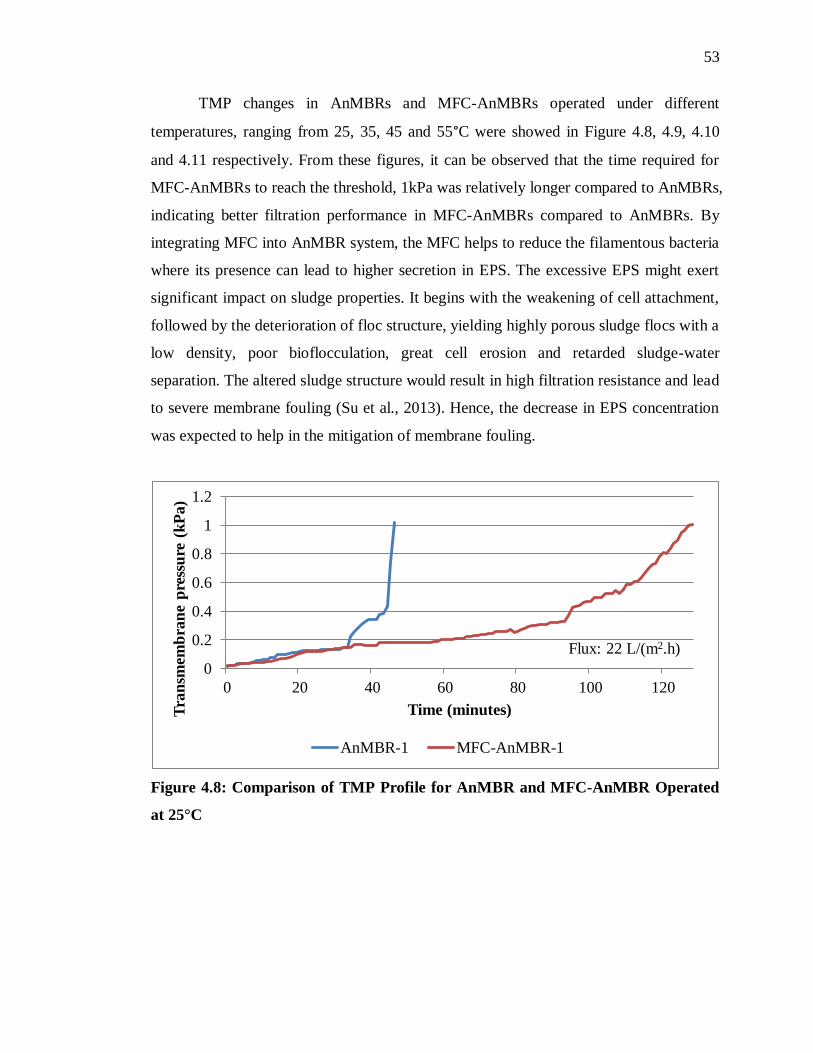
53
TMP changes in AnMBRs and MFC-AnMBRs operated under different
temperatures, ranging from 25, 35, 45 and 55°C were showed in Figure 4.8, 4.9, 4.10
and 4.11 respectively. From these figures, it can be observed that the time required for
MFC-AnMBRs to reach the threshold, 1kPa was relatively longer compared to AnMBRs,
indicating better filtration performance in MFC-AnMBRs compared to AnMBRs. By
integrating MFC into AnMBR system, the MFC helps to reduce the filamentous bacteria
where its presence can lead to higher secretion in EPS. The excessive EPS might exert
significant impact on sludge properties. It begins with the weakening of cell attachment,
followed by the deterioration of floc structure, yielding highly porous sludge flocs with a
low density, poor bioflocculation, great cell erosion and retarded sludge-water
separation. The altered sludge structure would result in high filtration resistance and lead
to severe membrane fouling (Su et al., 2013). Hence, the decrease in EPS concentration
was expected to help in the mitigation of membrane fouling.
Figure 4.8: Comparison of TMP Profile for AnMBR and MFC-AnMBR Operated
at 25°C
0
0.2
0.4
0.6
0.8
1
1.2
0 20 40 60 80 100 120
Tra
nsm
emb
ran
e p
ress
ure
(k
Pa)
Time (minutes)
AnMBR-1 MFC-AnMBR-1
Flux: 22 L/(m2.h)
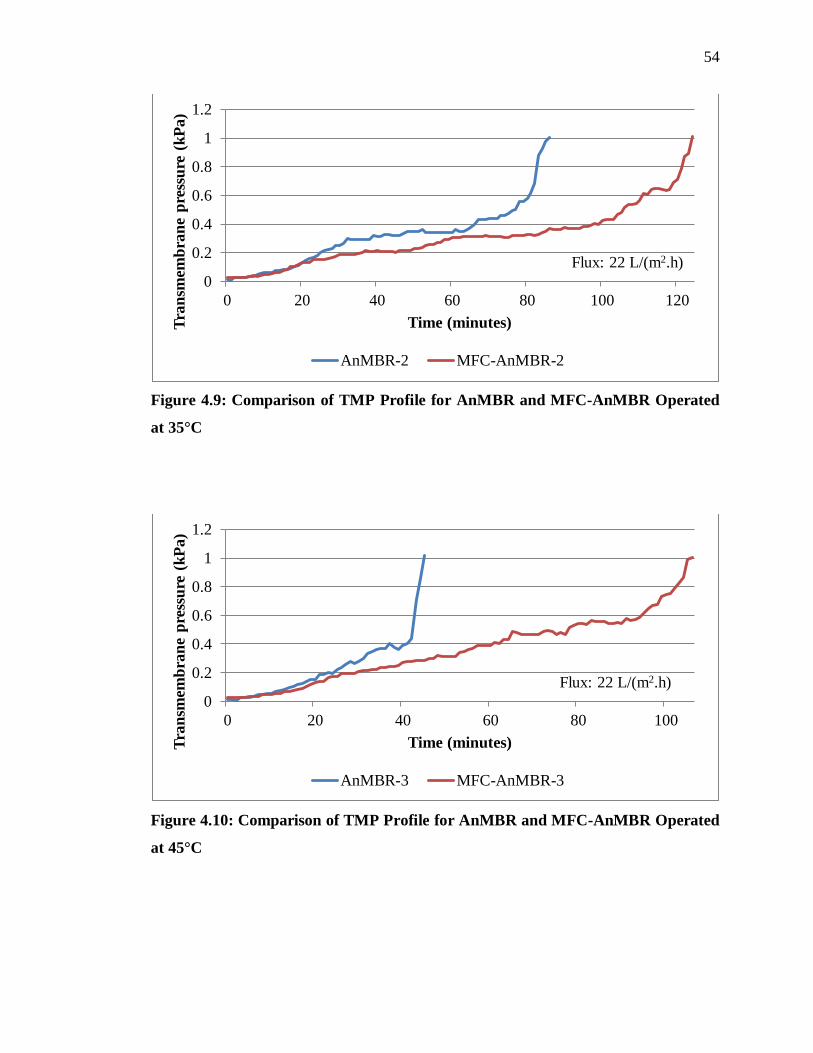
54
Figure 4.9: Comparison of TMP Profile for AnMBR and MFC-AnMBR Operated
at 35°C
Figure 4.10: Comparison of TMP Profile for AnMBR and MFC-AnMBR Operated
at 45°C
0
0.2
0.4
0.6
0.8
1
1.2
0 20 40 60 80 100 120
Tra
nsm
emb
ran
e p
ress
ure
(k
Pa)
Time (minutes)
AnMBR-2 MFC-AnMBR-2
Flux: 22 L/(m2.h)
0
0.2
0.4
0.6
0.8
1
1.2
0 20 40 60 80 100
Tra
nsm
emb
ran
e p
ress
ure
(k
Pa)
Time (minutes)
AnMBR-3 MFC-AnMBR-3
Flux: 22 L/(m2.h)
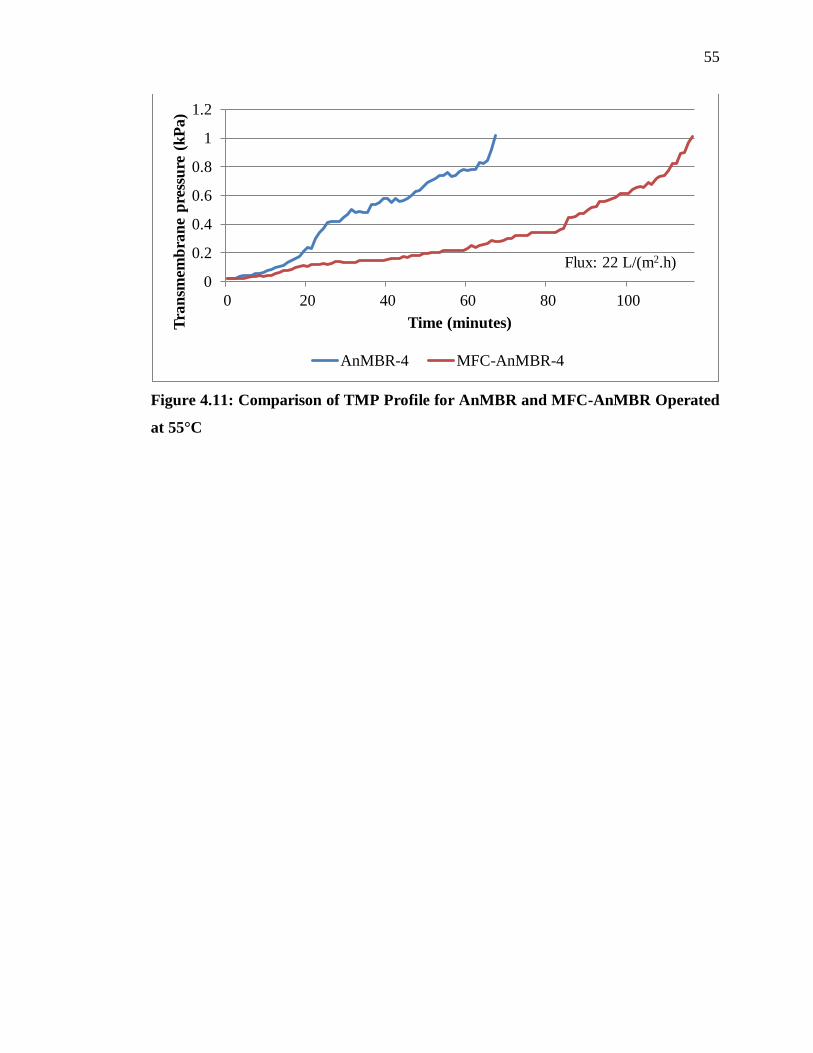
55
Figure 4.11: Comparison of TMP Profile for AnMBR and MFC-AnMBR Operated
at 55°C
0
0.2
0.4
0.6
0.8
1
1.2
0 20 40 60 80 100
Tra
nsm
emb
ran
e p
ress
ure
(k
Pa)
Time (minutes)
AnMBR-4 MFC-AnMBR-4
Flux: 22 L/(m2.h)
56
CHAPTER 5
CONCLUSION AND RECOMMENDATIONS
5.1 Conclusion
The treatment performance of AnMBR operated at mesophilic temperature, 45°C, R-3
was the best among others AnMBRs in terms of COD removal efficiency. The increase
in operational temperature enhances the biomass growth rate which subsequently
improves the processes of hydrolysis, breakdown and solubilization of complex organic
matter to soluble substrates. Higher amount of polysaccharide was observed in AnMBR
operated at 45°C. Polysaccharide as a biologically secreted metabolic product is
associated with the biomass growth rate. R-3 has the highest biomass growth rate as
indicated by the highest polysaccharide concentration among others despite the fact that
it has the lowest MLVSS content. The unusually high content of MLVSS in R-1, R-2
and R-4 might be due to the accumulation of SMP as a response to environmental
stresses such as low pH and low temperature. Besides, long term operation under
mesophilic range is relatively stable compared to thermophilic temperature in terms of
COD removal efficiency. Operation at thermophilic temperature is more prone to the
accumulation of inhibitory substances which could potentially lead to system failure.
Under mesophilic regimes, the size of sludge floc tends to decrease with the increasing
temperature. The higher in the amount of polysaccharide and smaller floc size renders
AnMBR operated at 45°C to be more prone to membrane fouling compared to others.
57
By combining the MFC with AnMBRs, it was noticed that the overall COD
removal efficiencies were higher compared to sole AnMBRs. Besides, the combined
system demonstrated better filtration performance compared to AnMBR. By using MFC
as a pre-treatment prior to AnMBR, it helps to reduce fine foulants and filamentous
bacteria where its presence is associated with high EPS secretion. Decreases in fine
foulants and EPS secretion reduce fouling propensity and thus better filtration
performance.
5.2 Recommendations
Despite the control of temperatures and the integration of MFC with AnMBR could
enhance the overall performance, mainly COD removal and filtration performance, the
results obtained are yet to be the best possible outcome. Improvement can be made to
ameliorate the performances of AnMBR and MFC-AnMBR. Some of the viable
recommendations are suggested and shown as follows:
i) Constant and gentle stirring should be provided to achieve homogeneous mix
in the bioreactor for stable results. The speed of the stirrer should be
controlled to avoid the disturbance of biofloc formation.
ii) Pre-treatment such as pH adjustment on feed should be conducted to avoid
pH shock on the system. The occurrence of pH shock affects the performance
of the bioreactor and secret more SMP which subsequently leads to higher
fouling propensity.
iii) Optimum SRT should be investigated particularly in system involving
anaerobic digestion where the biomass growth rate is relatively slower.
Hence, a longer SRT is usually more beneficial than a short SRT.
58
iv) The effects of polysaccharide and sludge floc size on membrane fouling
should be further investigated to determine the dominant factor in
contributing to membrane fouling.
v) The electricity recovered from MFC should be utilized effectively in the
combined system. The electricity produced provides an external electrical
field which interacts with the bound water in the sludge flocs. Such
interaction could help to mitigate membrane fouling.
59
REFERENCES
Adekunle, K.F. and Okolie, J.A., 2015. A review of biochemical process of anaerobic
digestion. Advances in Bioscience and Biotechnology, 6, pp. 205-212.
Ahmed, Y., Yaakob, Z., Akhtar, P. and Sopian, K., 2015. Production of biogas and
performance evaluation of existing treatment processes in palm oil mill effluent
(POME). Renewable and Sustainable Energy Reviews, 42, pp. 1260-1278.
Agriculture Corner, 2012. Top Ten Palm Oil Producers 2012. [online] Available at:
<http://www.agricorner.com/top-ten-palm-oil-producers-2012/> [Accessed 15 July
2016].
Aida Isma, M.I., Idris, A., Omar, R. and Putri Razreena, A.R., 2014. Effects of SRT and
HRT on Treatment Performance of MBR and Membrane Fouling. International
Journal of Chemical, Molecular, Nuclear, Materials and Metallurgical Engineering,
8(6) pp. 488-492.
BioEnergy Consult, 2015. Properties and uses of POME. [online] Available at:
<http://www.bioenergyconsult.com/tag/what-is-pome/> [Accessed 23 June 2016].
Bitton, G., 1998. Formula handbook for environmental engineers and scientists. [e-book]
Canada: Wiley. Available at: Google Books <
https://books.google.com.my/books?id=7PDS6jb8XtkC&pg=PA166&lpg=PA166&
dq=ratio+of+mlvss+to+mlss&source=bl&ots=Q-
kpHf5czH&sig=BOLlXagsQn1qKG_62364OQqZEcM&hl=en&sa=X&ved=0ahUK
EwjV-
rfggffSAhURSo8KHWSJBXIQ6AEIbTAQ#v=onepage&q=ratio%20of%20mlvss%
20to%20mlss&f=false> [Accessed 28 March 2017].
Byamba-Ochir, N., Shim, W.G., Balathanigaimani, M.S. and Moon, H., 2016. Highly
porous activated carbons prepared from carbon rich Mongolian anthracite by direct
NaOH activation. Applied Surface Science, 379, pp. 331-337.
60
Choi, H., Zhang, K., Dionysiou, D.D., Oerther, B.D. and Sorial, A.G., 2006. Effect of
activated sludge properties and membrane operation conditions on fouling
characteristics in membrane bioreactors. Chemosphere, 63(10), pp. 1699-1708.
Cordova, A., Astudillo, C., Guerrero, C., Vera, C. and Illanes, A., 2016. Assessment of
the fouling mechanisms of an ultrafiltration membrane bioreactor during synthesis of
galacto-oligosaccharides: Effect of the operational variables. Desalination, 393, pp.
79-89.
Deng, L., Guo, W., Ngo, H.H., Du, B., Wei, Q., Tran, N.H., Nguyen, N.C., Chen, S. and
Li, J., 2016. Effects of hydraulic retention time and bioflocculant addition on
membrane fouling in a sponge-submerged membrane bioreactor. Bioresource
Technology, 210, pp. 11-17.
Ding, G.T., Yaakob, Z., Takriff, M.S., Salihon, J. and Rahaman, M.S., 2016. Biomass
production and nutrients removal by a newly-isolated microalgal strain
Chlamydomonas sp in palm oil mill effluent (POME). International Journal of
Hydrogen Energy, 41(8), pp. 4888-4895.
Fan, J., Ji, F., Xu, X., Wang, Y., Yan, D., Xu, X., Chen, Q., Xiong, J. and He, Q., 2015.
Prediction of the effect of fine grit on the MLVSS/MLSS ratio of activated sludge.
Bioresource Technology, 190, pp. 51-56.
Gai, X.J. and Kim, H.S., 2008. The role of powdered activated carbon in enhancing the
performance of membrane systems for water treatment. Desalination, 225, pp. 288-
300.
Gao, D., Tao, Y. and An, R., 2012. Digested sewage treatment using membrane-based
process at different hydraulic retention times. Desalination, 286, pp. 187-192.
Garcia-Nunez, J.A., Ramirez-Contreras, N.E., Rodriguez, D.T., Silva-Lora, E., Frear,
G.S., Stockle, C. and Garcia-Perez, M., 2016. Evolution of palm oil mills into bio-
refineries: Literature review on current and potential uses of residual biomass and
effluents. Resources, Conservation and Recycling, 110, pp. 99-114.
Ghasimi, D.S.M., Tao, Y., Kreuk, M., Abbas, B., Zandvoort, M.H., Lier, J.B., 2015.
Digester performance and microbial community changes in thermophilic and
mesophilic sequencing batch reactors fed with the fine sieved fraction of municipal
sewage. Water Research, 87, pp. 483-493.
Global Industry Analysts Inc., 2012. Global MBR market forecast to reach $888 million
by 2017. [online] Available at: <http://ac.els-cdn.com/S0958211812700174/1-s2.0-
S0958211812700174-main.pdf?_tid=4af567b2-33c6-11e6-8469-
00000aab0f27&acdnat=1466083923_77e4eaa05299b8c664b0d01568a53936>
[Accessed 18 June 2016].
61
Goh, W.J.J., Lin, H.J., Leung, K.T. and Liao, B.Q., 2010. Influence of elevated pH
shocks on the performance of a submerged anaerobic membrane bioreactor. Process
Biochemistry, 45(8), pp. 1279-1287.
Gouveia, J., Plaza, F., Garralon, G., Fdz-Polanco, F. and Pena, M., 2015. A novel
configuration for an anaerobic submerged membrane bioreactor (AnSMBR). Long-
term treatment of municipal wastewater under psychrophilic conditions. Bioresource
Technology, 198, pp. 510-519.
Han, S.S., Bae, T.H., Jang, G.G. and Tak, T.M., 2005. Influence of sludge retention time
on membrane fouling and bioactivities in membrane bioreactor system. Process
Biochemistry, 40, pp. 2393-2400.
He, L., Du, P., Chen, Y., Lu, H., Cheng, X., Chang, B. and Wang, Z., 2017. Advances in
microbial fuel cells for wastewater treatment. Renewable and Sustainable Energy
Reviews, 71, pp. 388-403.
Hoek, M.V.E. and Tarabara, V.V., 2013. Encyclopedia of membrane science and
technology. New Jersey: John Wiley & Sons, Inc.
Hong, H., Lin, H., Mei, R., Zhou, X., Liao, B. and Zhao, L., 2016. Membrane fouling in
a membrane bioreactor: A novel method for membrane surface morphology
construction and its application in interaction energy assessment. Journal of
Membrane Science, 516, pp. 135-143.
Hwang, B.K., Lee, W.N., Yeon, K.M., Park, P.K., Lee, C.H., Chang, I.S., Drews, A. and
Kraume, M., 2008. Correlating TMP increases with microbial characteristics in the
bio-cake on the membrane surface in a membrane bioreactor. Environmental Science
and Technology, 42(11), pp. 3963-3968.
Indonesia-Investments, 2016. Palm Oil. [online] Available at: <http://www.indonesia-
investments.com/business/commodities/palm-oil/item166> [Accessed 15 July 2016].
Jeison, D. and van Lier, J.B., 2008. Feasibility of thermophilic anaerobic submerged
membrane bioreactors (AnSMBR) for wastewater treatment. Desalination, 231(1-3),
pp. 227-235.
Jo, S.J., Kwon, H., J, S.Y., Lee, C.H. and Kim, T.G., 2016. Comparison of microbial
communities of activated sludge and membrane biofilm in 10 full-scale membrane
bioreactors. Water Research, 101, pp. 214-225.
Judd, S., 2008. The status of membrane bioreactor technology. Trends in Biotechnology,
26(2), pp. 109-116.
Karmakar, S., Kundu, K. and Kundu, S., 2010. Design and development of microbial
fuel cells. [pdf] Available at: <http://www.formatex.info/microbiology2/1029-
1034.pdf> [Accessed 7 March 2017].
62
Khan, M.A., Ngo, H.H., Guo, W.S., Liu, Y.W., Zhou, J.L., Zhang, J., Liang, S., Ni, B.J.,
Zhang, X.B. and Wang, J., 2016. Comparing the value of bioproducts from different
stages of anaerobic membrane bioreactos. Bioresource Technology, 214, pp. 816-825.
Kim, K., Yang, W., Ye, Y., LaBarge, N. and Logan, B.E., 2016. Performance of
anaerobic fluidized membrane bioreactors using effluents of microbial fuel cells
treating domestic wastewater. Bioresource Technology, 208, pp. 58-63.
Kim, M., Ahn, Y. and Speece, R.E., 2002. Comparative process stability and efficiency
of anaerobic digestion; mesophilic vs. thermophilic. Water Research, 36(17), pp.
4369-4385.
Kimura, K., Miyoshi, T., Naruse, T., Yamato, N., Ogyu, R. and Watanabe, Y., 2008.
The difference in characteristics of foulants in submerged MBRs caused by the
difference in the membrane flux. Desalination, 231, pp. 268-275.
Kunacheva, C., Soh, Y.N.A. and Stuckey, D.C., in press. Effect of feed pH on Reactor
Performance and Production of Soluble Microbial Products (SMPs) in a Submerged
Anaerobic Membrane Bioreactor. Chemical Engineering Journal.
Labatut, R.A., Angenent, L.T. and Scott, N,R., 2014. Conventional mesophilic vs.
thermophilic anaerobic digestion: A trade-off between performance and stability?.
Water Research, 53, pp. 249-258.
Le-Clech, P., Chen, V. and Fane, A.G.T., 2006. Fouling in membrane bioreactors used
in wastewater treatment. Journal of Membrane Science, 284(1-2), pp. 17-53.
Le-Clech, P., Fane, A., Leslie, G. and Childress, A., 2005. MBR focus: the operators’
perspective. Filtration & Separation, 42(5), pp. 20-23.
Le-Clech, P., Jefferson, B., Chang, I.S. and Judd, S.J., 2003. Critical flux determination
by the flux-step method in a submerged membrane bioreactor. Journal of Membrane
Science, 227, pp. 81-93.
Liew, W.L., Kassim, M.A., Muda, K., Loh, S.K. and Affam, A.C., 2015. Conventional
methods and emerging wastewater polishing technologies for palm oil mill effluent
treatment: A review. Journal of Environmental Management, 149, pp. 222-235.
Liu, H. Cheng, S. and Logan, B.E., 2005. Production of Electricity from Acetate or
Butyrate Using a Single-Chamber Microbial Fuel Cell. Environmental Science
Technology, 39 (2), pp. 658-662.
Lin, H., Peng, W., Zhang, M., Chen, J., Hong, H. and Zhang, Y., 2013. A review of
anaerobic membrane bioreactors: Applications, membrane fouling and future
perspectives. Desalination, 314, pp. 169-188.
63
Lin, H.J., Xie, K., Mahendran, B., Bagley, D.M., Leung, K.T., Liss, S.N. and Liao, B.Q.,
2009. Sludge properties and their effects on membrane fouling in submerged
anaerobic membrane bioreactors (SAnMBRs). Water Research, 43(15), pp. 3827-
3837.
Liu, J., Jia, X., Gao, B., Bo, L. and Wang, L., 2016. Membrane fouling behavior in
anaerobic baffled membrane bioreactor under static operating condition. Bioresource
Technology, 214, pp. 582-588.
Liu, Y., Liu, H., Cui, L. and Zhang, K., 2012. The ratio of food-to-microorganism (F/M)
on membrane fouling of anaerobic membrane bioreactors treating low-strength
wastewater. Desalination, 297, pp. 97-103.
Ma, D., J, Z.H., Lay, C.H. and Zhou, D., 2016. Electricity generation from swine
wastewater in microbial fuel cell: Hydraulic reaction time effect. International
Journal of Hydrogen Energy, 41(46), pp. 21820-21826.
Malaysia Palm Oil Board, 2014. Oil Palm & The Environment (updated March 2014).
[online] Available at: <http://www.mpob.gov.my/palm-info/environment/520-
achievements#Mill> [Accessed 23 June 2016].
Martin-Pascual, J., Reboleiro-Rivas, P., Munio, M.M., Gonzalez-Lopez, J. and Poyatos,
J.M., 2016. Membrane fouling of a hybrid moving bed membrane bioreactor plant to
treat real urban wastewater. Chemical Engineering and Processing: Process
Intensification, 104, pp. 112-119.
Martinez-Sosa, D., Helmreich, B., Netter, T., Paris, S., Bischof, F. and Horn, H., 2011.
Anaerobic submerged membrane bioreactor (AnSMBR) for municipal wastewater
treatment under mesophilic and psychrophilic temperature conditions. Bioresource
Technology, 102(22), pp. 10377-10385.
Meabe, E., Deleris, S., Soroa, S. and Sancho, L., 2013. Performance of anaerobic
membrane bioreactor for sewage sludge treatment: Mesophilic and thermophilic
processes. Journal of Membrane Science, 446, pp. 26-33.
Meng, F., Chae, S., Drews, A., Kraume, M., Shin, H. and Yang, F., 2009. Recent
advances in membrane bioreactors (MBRs): Membrane fouling and membrane
material. Water Research, 43(6), pp. 1489-1512.
Meng, F., Zhang, S., Oh, Y., Zhou, Z., Shin, H.S. and Chae, S.R., 2017. Fouling in
membrane bioreactors: An updated review. Water Research, 114, pp. 151-180.
Munz, G., Gori, R., Mori, G. and Lubello, C., 2007. Powdered activated carbon and
membrane bioreactors (MBR-PAC) for tannery wastewater treatment: long term
effect on biological and filtration process performances. Desalination, 207, pp. 349-
360.
64
Naik, L., Gebreegziabher, Z., Tumwesige, V., Balana, B.B., Mwirigi, J. and Austin, G.,
2014. Factors determining the stability and productivity of small scale anaerobic
digesters. Biomass and Bioenergy, 70, pp. 51-57.
Ng, C.A., Sun, D., Bashir, M.J.K., Wai, S.H., Wong, L.Y., Nisar, H., Wu, B. and Fane,
A.G., 2013. Optimization of membrane bioreactors by the addition of powdered
activated carbon. Bioresource Technology, 138, pp. 38-47.
Nguyen, T.T., Bui, X.T., Vo, T.D.H., Nguyen, D.D., Nguyen, P.D., Do, H.L.C., Ngo,
H.H. and Guo, W., 2016. Performance and membrane fouling of two types of
laboratory-scale submerged membrane bioreactors for hospital wastewater treatment
at low flux condition. Separation and Purification Technology, 165, pp. 123-129.
Nguyen, L.N., Hai, F.I., Nghiem, L.D., Kang, J., Price, W.E., Park, C. and Yamamoto,
K., 2014. Enhancement of removal of trace organic contaminants by powdered
activated carbon dosing into membrane bioreactors. Journal of the Taiwan Institute
of Chemical Engineers, 45(2), pp. 571-578.
Oh, S.T., Kim, J.R., Premier, G.C., Lee, T.H., Kim, C. and Sloan, W.T., 2010.
Sustainable wastewater treatment: How might microbial fuel cells contribute.
Biotechnology Advances, 28(6), pp. 871-881.
Ouyang, K. and Liu, J., 2009. Effect of sludge retention time on sludge characteristics
and membrane fouling of membrane bioreactor. Journal of Environmental Sciences,
21, pp. 1329-1335.
Poh, P.E. and Chong, M.F., 2009. Development of anaerobic digestion methods for palm
oil mill effluent (POME) treatment. Bioresource Technology, 100(1), pp. 1-9.
Pollice, A., Laera, G., Saturno, D. and Giordano, C., 2008. Effects of sludge retention
time on the performance of a membrane bioreactor treating municipal sewage.
Journal of Membrane Sciences, 317, pp. 65-70.
Sabia, G., Ferraris, M. and Spagni, A., 2013. Effect of solid retention time on sludge
filterability and biomass activity: Long-term experiment on a pilot-scale membrane
bioreactor treating municipal wastewater. Chemical Engineering Journal, 221, pp.
176-184.
Santos, A., Ma, W. and Judd, S.J., 2011. Membrane bioreactors: Two decades of
research and implementation. Desalination, 273(1), pp. 148-154.
Satyawali, Y. and Balakrishnan, M., 2009. Performance enhancement with powdered
activated carbon (PAC) addition in a membrane bioreactor (MBR) treating distillery
effluent. Journal of Hazardous Materials, 170, pp. 457-465.
Shen, L., Lei, Q., Chen, J.R., Hong, H.C., He, Y.M. and Lin, H.J., 2015. Membrane
fouling in a submerged membrane bioreactor: Impact of floc size. Chemical
Engineering Journal, 269, pp. 328-334.
65
Song, X., McDonald, J., Price, E.W., Khan, J.S., Hai, I.,F., Ngo, H.H., Guo, W. and
Nghiem, D.L., 2016. Effects of salinity build-up on the performance of an anaerobic
membrane bioreactor regarding basic water quality parameters and removal of trace
organic contaminants. Bioresource Technology, 216, pp. 399-405.
Su, X., Tian, Y., Sun, Z., Lu, Y. and Li, Z., 2013. Performance of a combined system of
microbial fuel cell and membrane bioreactor: Wastewater treatment, sludge
reduction, energy recovery and membrane fouling. Biosensors and Bioelectronics,
49, pp. 92-98.
Tabassum, S., Zhang, Y. and Zhang, Z., 2015. An integrated method for palm oil mill
effluent (POME) treatment for achieving zero liquid discharge – a pilot study.
Journal of Cleaner Production, 95, pp. 148-155.
Tian, Y., Li, H., Su, X., Lu, Y., Zuo, W. and Zhang, J., 2015. In-situ integration of
microbial fuel cell with hollow-fiber membrane bioreactor for wastewater treatment
and membrane fouling mitigation. Biosensors and Bioelectronics, 64, pp. 189-195.
Trzcinski, P.A. and Stuckey, C.D., 2016. Inorganic fouling of an anaerobic membrane
bioreactor treating leachate from the organic fraction of municipal solid waste
(OFMSW) and a polishing aerobic membrane bioreactor. Bioresource Technology,
204, pp. 17-25.
Tzvetkov, G., Mihaylova, S., Stoitchkova, K., Tzvetkov, P. and Spassov, T., 2016.
Mechanochemical and chemical activation of lignocellulosic material to prepare
powdered activated carbons for adsorption applications. Powder Technology, 299,
pp. 41-50.
Ulbricht, M., 2006. Advanced functional polymer membranes. Polymer, 47(7), pp.
2217-2262.
Wang, Z., Wu, Z., Yu, G., Liu, J. and Zhou, Z., 2006. Relationship between sludge
characteristics and membrane flux determination in submerged membrane
bioreactors. Journal of Membrane Science, 284(1-2), pp. 87-94.
Waszak, M. and Gryta, M., 2015. The ultrafiltration ceramic membrane used for broth
separation in membrane bioreactor. Chemical Engineering Journal.
Xu, Z., Zhao, M., Miao, H., Huang, Z., Gao, S. and Ruan, W., 2014. In situ volatile fatty
acids influence biogas generation from kitchen wastes by anaerobic digestion.
Bioresource Technology, 163, pp. 186-192.
Yu, H.Q. and Fang, H.H.P., 2003. Acidogenesis of gelatin-rich wastewater in an upflow
anaerobic reactor: influence of pH and temperature. Water Research, 37(1), pp. 55-
66.

66
Yuniarto, A., Noor, Z.Z., Ujang, Z., Olsson, G., Aris, A. and Hadibarata, T., 2013. Bio-
fouling reducers for improving the performance of an aerobic submerged membrane
bioreactor treating palm oil mill effluent. Desalination, 316, pp. 146-153.
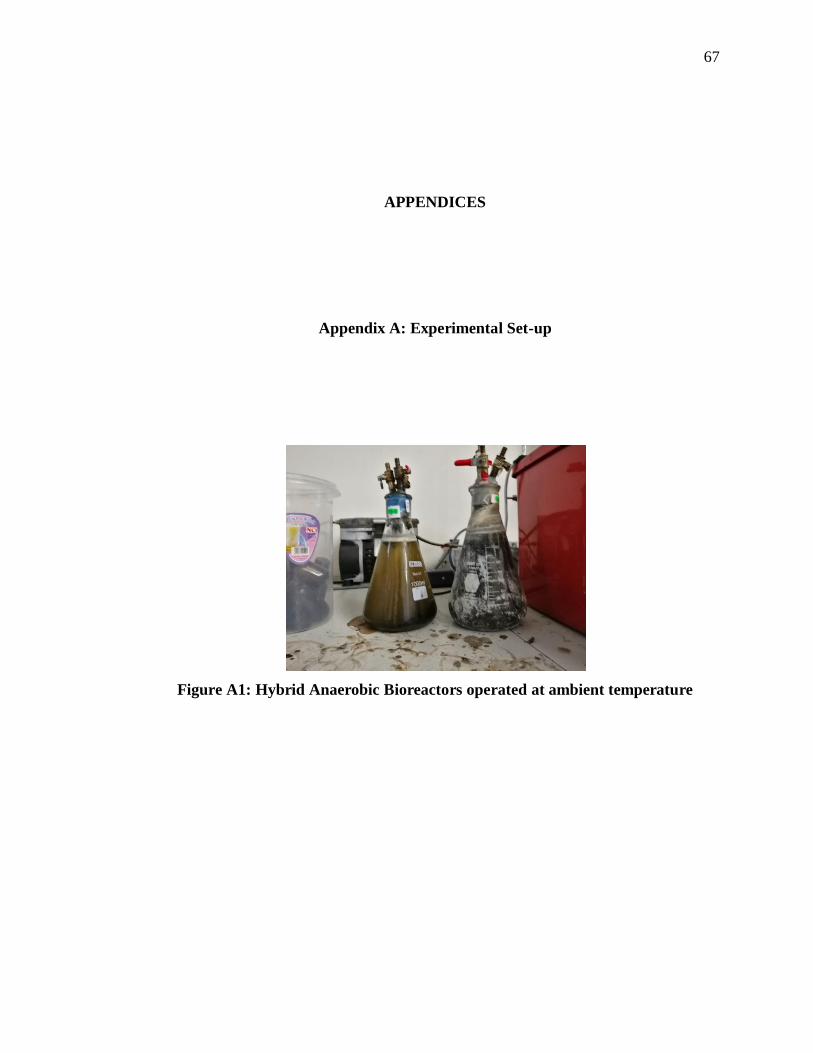
67
APPENDICES
Appendix A: Experimental Set-up
Figure A1: Hybrid Anaerobic Bioreactors operated at ambient temperature
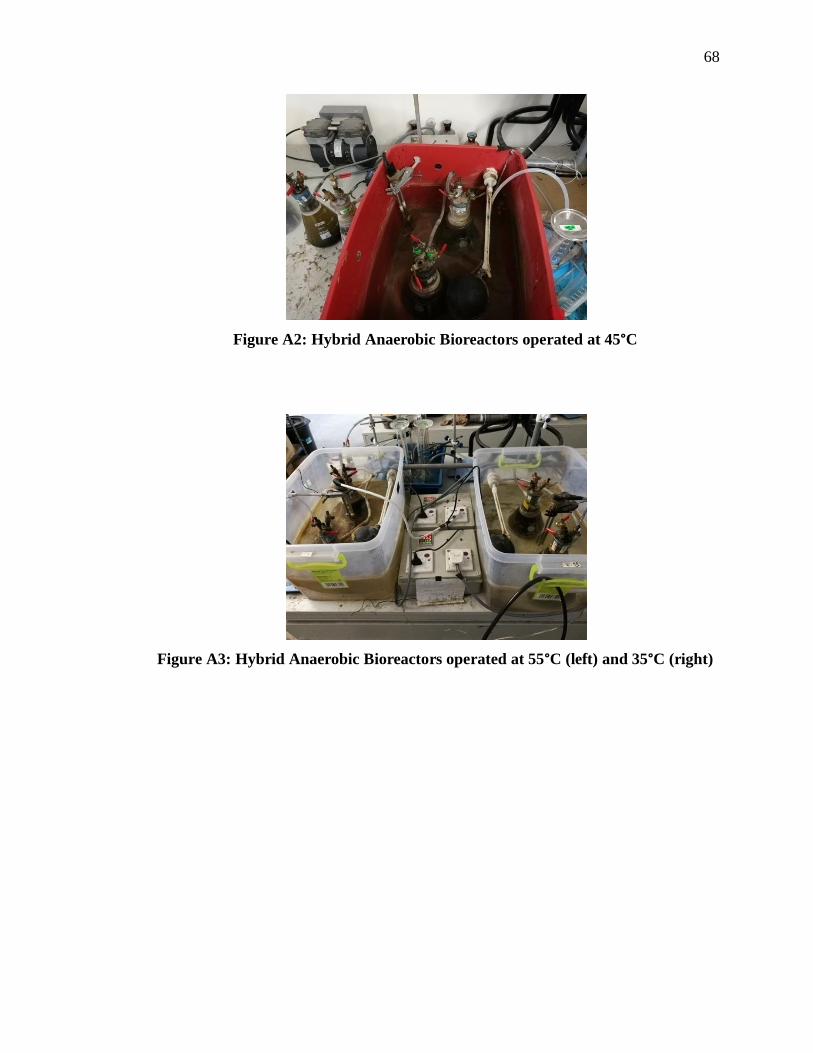
68
Figure A2: Hybrid Anaerobic Bioreactors operated at 45°C
Figure A3: Hybrid Anaerobic Bioreactors operated at 55°C (left) and 35°C (right)
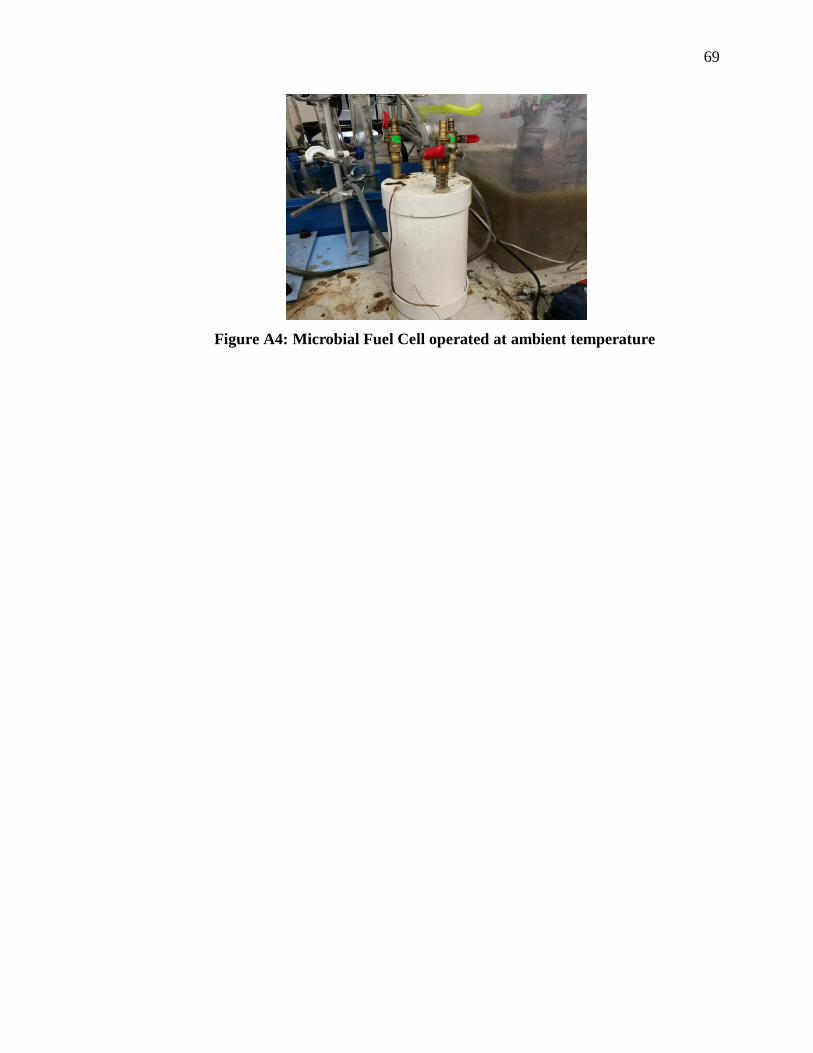
69
Figure A4: Microbial Fuel Cell operated at ambient temperature
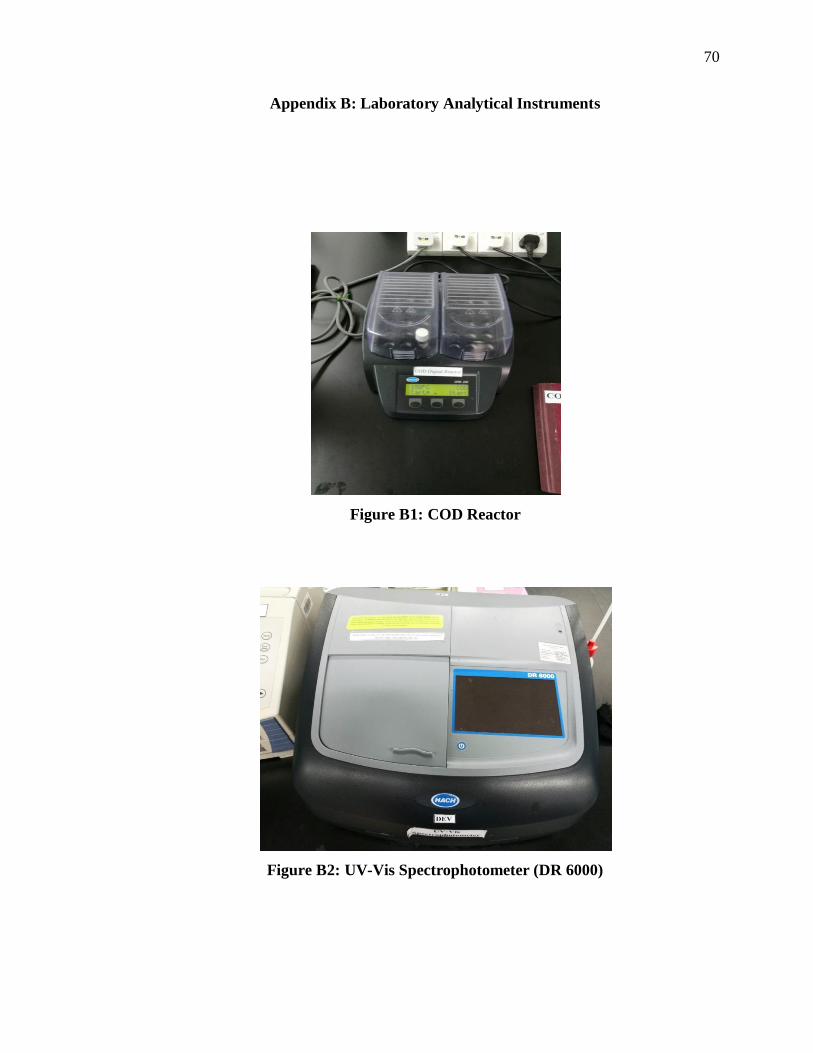
70
Appendix B: Laboratory Analytical Instruments
Figure B1: COD Reactor
Figure B2: UV-Vis Spectrophotometer (DR 6000)
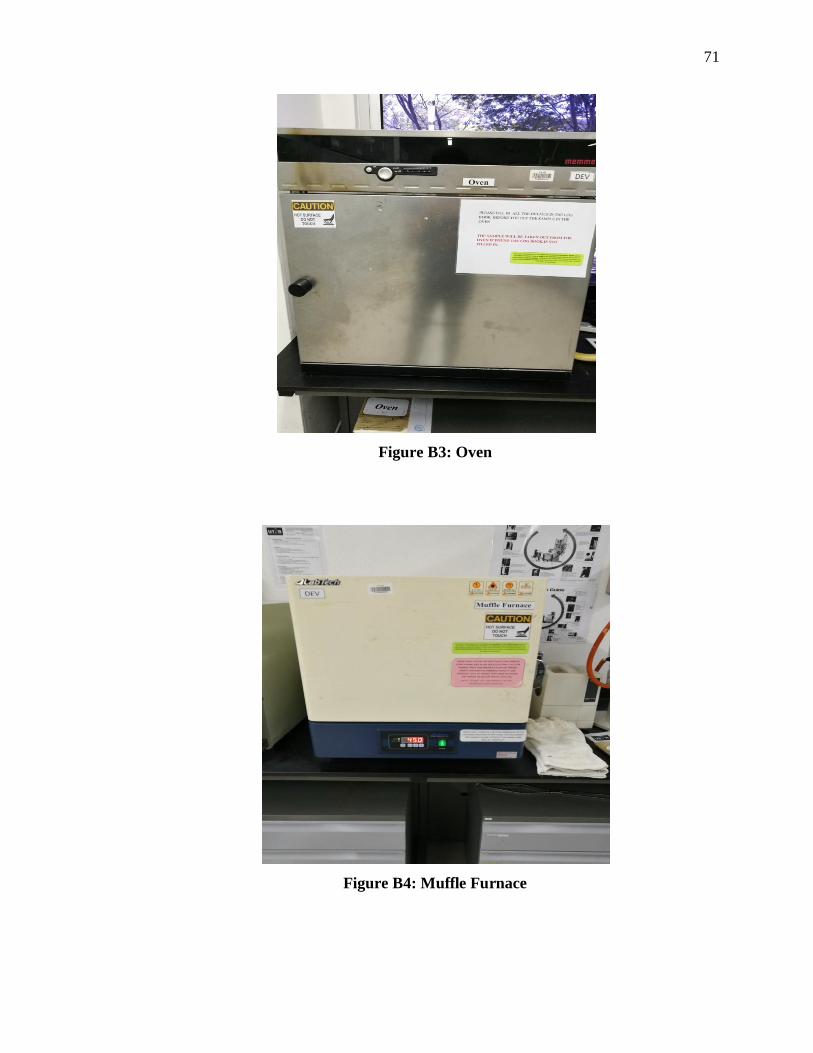
71
Figure B3: Oven
Figure B4: Muffle Furnace
72
Figure B5: Particle Size Analyzer
Figure B6: pH Meter
73
Figure B7: Analytical Balance
Figure B8: Cross Flow Membrane Test Rig
74
Figure B9: Multimeter
75
Appendix C: Materials
Figure C1: Powdered Activated Carbon (PAC)
Figure C2: Palm Oil Mill Effluent (POME)
76
Figure C3: Phenol
Figure C4: Glass Microfibre Filter

![Lecture 17 Membrane separations - CHERIC · Lecture 17. Membrane Separations [Ch. 14] •Membrane Separation •Membrane Materials •Membrane Modules •Transport in Membranes-Bulk](https://img.pdfslide.us/doc/110x75/5e688f368fbb145949438f76/lecture-17-membrane-separations-cheric-lecture-17-membrane-separations-ch-14.jpg)