Embed Size (px)
Citation preview

Treatment of Oil and Gas Wastewater in Colorado: Assessment of a Hybrid
Membrane System
Stephanie M. Riley, Tzahi Y. Cath Department of Civil and Environmental Engineering
Colorado School of Mines
2015 Annual Water Resources Conference November 18, 2015, Denver, CO

Personal Bio
Newman University B.S. Biology (2013)
Raymond Oil Co., Inc. Colorado School of Mines
M.S. Environmental Engineering Science (2015)
PhD Candidate (Current)

Presentation Overview
Unconventional oil and gas (O&G) development in the U.S.
Water management: recycling and reuse Advanced processes: bio-physical treatment
Biologically-active Filtration (BAF) Theory and application
Membrane Treatment Ultrafiltration (UF) Nanofiltration (NF)
Results and conclusions

O&G Development in the U.S.
Figure courtesy of Vengosh et al., 2014. Data obtained from Ceres analysis using WRI’s Aqueduct Water Risk Atlas.
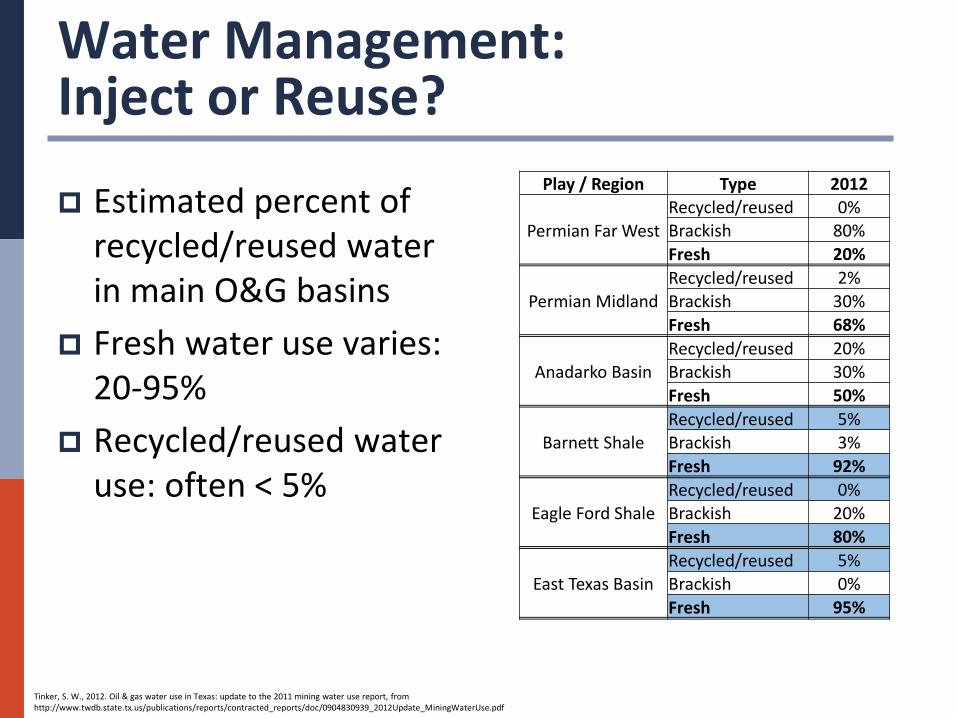
Water Management: Inject or Reuse?
Estimated percent of recycled/reused water in main O&G basins
Fresh water use varies: 20-95%
Recycled/reused water use: often < 5%
Tinker, S. W., 2012. Oil & gas water use in Texas: update to the 2011 mining water use report, from http://www.twdb.state.tx.us/publications/reports/contracted_reports/doc/0904830939_2012Update_MiningWaterUse.pdf
Play / Region Type 2012
Permian Far West Recycled/reused 0% Brackish 80% Fresh 20%
Permian Midland Recycled/reused 2% Brackish 30% Fresh 68%
Anadarko Basin Recycled/reused 20% Brackish 30% Fresh 50%
Barnett Shale Recycled/reused 5% Brackish 3% Fresh 92%
Eagle Ford Shale Recycled/reused 0% Brackish 20% Fresh 80%
East Texas Basin Recycled/reused 5% Brackish 0% Fresh 95%

Produced Water Treatment Challenges Challenges
Salinity: ranging from < 10,000 ppm to >100,000 ppm Organics: Hydrocarbons, carbohydrates (gel), oil, grease Inorganics: silicates, borates, calcium, iron, NORM Varying volumes and characteristics
Treatment technologies Gravity separation, chemical treatment, hydrocyclones,
dissolved-air flotation, filtration, membranes (UF, NF, RO, FO), oxidation, air-stripping
Common hurdles… Need for (thorough?) pretreatment Biological processes?

Potential Treatment of O&G Wastewater: Biological and Membrane Treatment
Biological Treatment Removal of organic constituents Rejection of colloidal material Pretreatment for UF/NF reduced membrane fouling
Membrane Treatment Rejection of colloidal material Inorganics removal and desalination
Potential treatment of produced water (PW) for reuse in fracking operation, irrigation, livestock watering, streamflow augmentation

Biofiltration and Membrane Treatment
Processes

1
Biologically-Active Filtration (BAF) Attachment and growth of biofilm on filter media Biofilm consists of microorganisms and extracellular
polymeric substances (EPS) Microorganisms utilize oxygen and carbon sources to
degrade organic matter
Applications Industrial/municipal wastewater treatment Drinking water treatment
bacteria organic matter + O2 + nutrients CO2 + NH3 + C5H7NO2 + other end
products
(1) Photo courtesy of Nature Education
new cells

Ultrafiltration (UF) and Nanofiltration (NF) UF
Low-pressure membrane process Separates particulate matter (including microorganisms)
and macromolecules from impaired feed streams
NF Higher-pressure membrane process Desalination and softening* Produces high quality permeate suitable for reuse in
industrial or indirect potable applications
* For in-basin reuse in fracking operations, most operators typically require removal of suspended solids, microorganisms, hardness

BAF + UF + NF/RO

Scope of Research Treatment objectives
Optimization of BAF as a pretreatment through: Microbial acclimation and biofilm conditioning Biodegradation of organics Continuous feed of PW/FFB
Reduce fouling propensity of UF and NF membranes Characterization of effluent/permeate at all treatment
stages Evaluate membrane performance (rejection, water flux,
permeability) Optimize backwashing and chemical cleaning

Materials and Methods: BAF Granular activated carbon (GAC) media, 30- 36” depth Aeration Ambient temperature Feed water: PW, FFB Hydraulic loading rate = 1.0 gpm/ft2
Empty bed contact time: Batch mode: 20 min Continuous mode: 24- 48 hrs
Analyses Chemical oxygen demand (COD), dissolved oxygen (DO), dissolved
organic carbon (DOC), ion chromatography (IC), inductive coupled plasma (ICP), turbidity

Materials and Methods: UF
Hollow fiber membranes Membrane modules fabricated in the lab DOW PVDF capillary membranes (62.34 cm2) Koch Puron® PES capillary membranes (125 cm2)
Operation Feed Pressure: 5-7 psi or permeate vacuum Temp: 20 ± 0.5 °C Cross-flow velocity: ~17 cm/s Backwash (BW): UF permeate Chemical-enhanced backwash (CEB): NaOH
Integrity/ Permeability tests
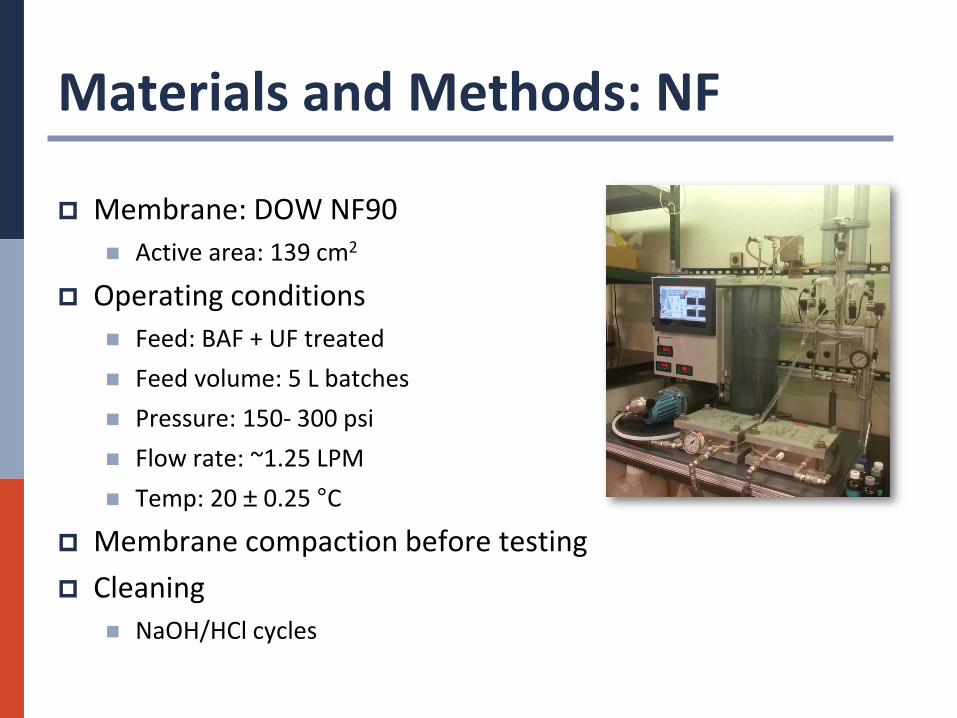
Materials and Methods: NF
Membrane: DOW NF90 Active area: 139 cm2
Operating conditions Feed: BAF + UF treated Feed volume: 5 L batches Pressure: 150- 300 psi Flow rate: ~1.25 LPM Temp: 20 ± 0.25 °C
Membrane compaction before testing Cleaning
NaOH/HCl cycles

Materials and Methods: Feed water
TDS: 12,000 to 30,000 mg/L DOC: 200 mg/L to 2500 mg/L COD: 500 mg/L to 12,000 mg/L Alkalinity: >600 mg/L as CaCO3

Results and Discussion: BAF, UF, NF

BAF: DJ Basin PW Batch- mode, 10 L, raw
Decreased DOC adsorption Increased DOC degradation rates
0
50
100
150
200
250
300
350
0 20 40 60
DO
C (m
g/L)
Time (hours)
Week 1Week 3Week 4Week 5Week 7
Continuous mode: 48 hr HRT 87% DOC removal Steady-state after ~150 hours
0
1
2
3
4
5
6
7
8
0
100
200
300
400
500
600
700
800
0 50 100 150 200 250
DO
(mg/
L)
DO
C (m
g/L)
Time (hours)
FeedBAF 1 DOCBAF 2 DOCBAF 1 DO

BAF: Piceance Basin PW Continuous Mode:
7 mL/min raw PW makeup = 24 hr HRT 67% DOC removal (remaining is recalcitrant) Steady-state after 5 hours Effluent collected for UF
0
1
2
3
4
5
6
7
8
0
5
10
15
20
25
30
35
40
45
50
0 15 30 45 60
DO
(mg/
L)
DO
C (m
g/L)
Time (hours)
FeedBAF 1 DOCBAF 2 DOCBAF 1 DOBAF 2 DO
76% 74%
0
20
40
60
80
100
120
BAF 1 BAF 2
COD
(mg/
L)
InitialFinal
BAF PW or
FFB
To UF

Ultrafiltration: Piceance Basin PW
10 L, 6 psi, CEB at 50% flux decline 1.57 NTU feed 0.3 NTU permeate High flux recovery after CEB
DOW hollow fibers BAF treated Piceance PW, 10 mg/L DOC
05
1015202530354045
0 25 50 75 100
Perm
eate
Flu
x (L
MH
)
Time (hours)
CEB42%
CEB71%
2 x 10 L batches, 6 psi, BW every 6 hrs, CEB at 40 and 80 hrs
0.92 NTU feed 0.16 NTU perm Flux maintained > 20 LMH
05
1015202530354045
0 15 30 45 60
Perm
eate
Flu
x (L
MH
)
Time (hours)
CEB50%
CEB68%
CEB82%

Nanofiltration: Piceance Basin PW
Permeate Flux. “A”= acid/base cleaning, “B”= feed replenishment (150 and 200 psi tests)
Tests at 150, 200, 250, and 300 psi ~1.25 LPM, 5 L batches Feed: TDS= 12 g/L, TOC= 9.6 mg/L,
TN= 7.3 mg/L, turbidity= 0.9 NTU
05
101520253035404550
0 20 40 60
Perm
eate
Flu
x (L
/m2 /
hr)
Time (hours)
150 psi 200 psi
250 psi 300 psi
A B 0
300
600
900
1200
1500
1800
0.0
0.5
1.0
1.5
2.0
2.5
3.0
150 200 250 300
Perm
eate
TD
S (m
g/L)
Perm
eate
TO
C/TN
(mg/
L)
Pressure (psi)
TOC TN TDS

BAF: DJ Basin PW
Continuous mode: 3.5 ml/min raw feed dose = 48 hr HRT 87% DOC removal Steady-state after ~150 hours Effluent collected for UF
0
1
2
3
4
5
6
7
8
0
100
200
300
400
500
600
700
800
0 50 100 150 200 250
DO
(mg/
L)
DO
C (m
g/L)
Time (hours)
FeedBAF 1 DOCBAF 2 DOCBAF 1 DOBAF 2 DO
0
3
6
9
12
15
18
0
5
10
15
20
25
30
0 30 60 90
TMP
(psi
)
Perm
eabi
lity
(LM
H/p
si)
Time (hours)
PermeabilityTMP
CEB CEB
CEB
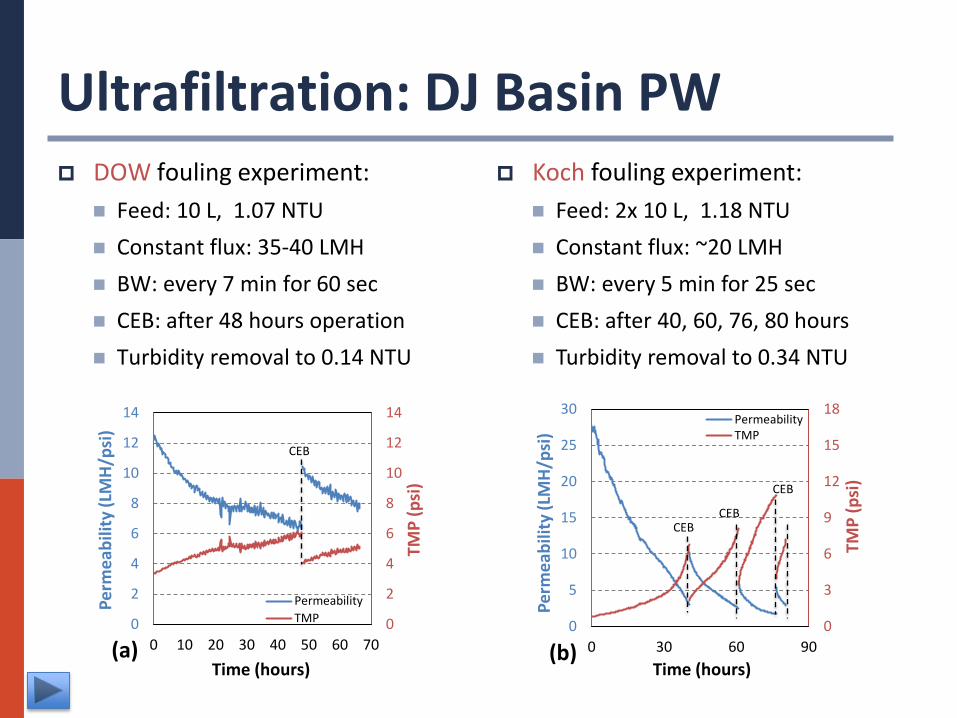
Ultrafiltration: DJ Basin PW DOW fouling experiment:
Feed: 10 L, 1.07 NTU Constant flux: 35-40 LMH BW: every 7 min for 60 sec CEB: after 48 hours operation Turbidity removal to 0.14 NTU
0
2
4
6
8
10
12
14
0
2
4
6
8
10
12
14
0 10 20 30 40 50 60 70
TMP
(psi
)
Perm
eabi
lity
(LM
H/p
si)
Time (hours)
PermeabilityTMP
CEB
(a) (b)
Koch fouling experiment: Feed: 2x 10 L, 1.18 NTU Constant flux: ~20 LMH BW: every 5 min for 25 sec CEB: after 40, 60, 76, 80 hours Turbidity removal to 0.34 NTU

Nanofiltration: DJ Basin PW
Permeate Flux. “A”= acid/base cleaning, “B”= feed replenishment
Tests at 150, 200, 250, and 300 psi ~1.25 LPM, 5 L batches Increased flux/rej with pressure Feed: TDS= 14 g/L, TOC= 32 mg/L,
TN= 8.7 mg/L, turbidity = 0.45 NTU
05
101520253035404550
0 20 40 60
Perm
eate
Flu
x (L
/m2 /
hr)
Time (hours)
150 psi 200 psi
250 psi 300 psi
A B 0
600
1200
1800
2400
3000
0.0
0.5
1.0
1.5
2.0
2.5
150 200 250 300
Perm
eate
TD
S (m
g/L)
Perm
eate
TO
C/TN
(mg/
L)
Pressure (psi)
TOC TN TDS

Summary: DJ Basin PW Pretreatment NF Permeate
Analyte Raw Feed BAF effluent/ UF feed
UF perm/ NF feed 150 psi 200 psi 250 psi 300 psi
turbidity 19.6 1.07 0.445 0.096 0.086 0.078 0.062 COD 1157 132 125 0.000 0.000 0.000 0.000 DOC 385 40.3 31.6 1.61 1.21 1.61 1.35 TN 26.6 13.3 8.72 2.27 1.98 1.29 1.02 B 9.85 9.85 7.28 6.33 5.18 4.17 3.71
Ba 2.52 2.52 4.80 0.072 0.056 0.026 0.015 Ca 43.3 43.3 41.9 0.841 0.515 0.27 0.220 K 526 526 520 119 61.3 46.1 37.3 Li 3.95 3.95 4.10 0.586 0.299 0.248 0.196
Mg 11.5 11.5 9.55 0.155 0.104 0.045 0.024 Na 4968 4968 4432 776 400 344 271 P 0.724 0.724 0.736 0.017 0.026 0.025 0.006 S 10.6 10.6 5.20 0.085 0.063 0.204 0.028 Si 5.63 5.63 3.31 0.292 0.188 0.454 0.182 Sr 4.98 4.98 7.59 0.113 0.080 0.022 0.016 Cl 8919 8919 8858 1595 785 717 568 Br 62.3 62.3 55.1 13.1 6.76 6.06 4.89
Anions (mg/L) 8982 8982 8913 1608 792 723 573 Cations (mg/L) 5588 5588 5036 903 468 397 312
TDS (mg/L) 14569 14569 13950 2512 1260 1120 885 % TDS Removal N/A 0.0% 4.3% 82.0% 91.0% 92.0% 93.7%

BAF: DJ Basin Frac Flowback Continuous mode:
3.5 ml/min raw feed dose 48 hr HRT
Increasing DOC/COD, low DO Optimizing aeration…
Batch mode: Feed tank aeration:
BAF 1: 0.5 LPM
Column aeration BAF 2: 0.05 LPM BAF 3: 0.1 LPM BAF 4: 0.25 LPM
0
1
2
3
4
5
6
7
8
0
100
200
300
400
500
600
700
800
0 50 100 150 200 250
DO
(mg/
L)
DO
C (m
g/L)
Time (hours)
BAF 1 DOCBAF 2 DOCFeedBAF 1 DOBAF 2 DO
0
100
200
300
400
500
600
700
800
0 50 100 150
DO
C (m
g/L)
Time (hours)
BAF 1 BAF 2BAF 3 BAF 4

BAF: DJ Basin Frac Flowback Continuous mode:
4 columns in series 48 hr HRT 0.05 LPM aeration (BAF 1 & 3) 79% DOC removal Steady-state after 72 hours
0
1
2
3
4
5
6
7
8
0
100
200
300
400
500
600
700
800
0 50 100 150 200 250
DO
(mg/
L)
DO
C (m
g/L)
Time (hours)
FeedEffluent DOCDO

Ultrafiltration: DJ Basin Frac Flowback Feed: 2x10 L batches, turbidity = 24 NTU, COD = 277 mg/L
012345678910
0
5
10
15
20
25
30
0 40 80 120
TMP
(psi
)
Perm
eabi
lity
(LM
H/p
si)
Time (hours)
CEB, Add 10 L FFB
0
2
4
6
8
10
0
5
10
15
20
25
30
0 30 60 90
TMP
(psi
)
Perm
eabi
lity
(LM
H/p
si)
Time (hours) (a) (b)
DOW UF Membrane Constant flux: ~40 LMH BW: every 5 min Permeate turbidity 0.2 NTU Permeate COD 233 mg/L
Koch UF Membrane Constant flux: ~ 20 LMH BW: every 5 min Permeate turbidity 0.4 NTU Permeate COD 237 mg/L

Nanofiltration: DJ Basin Frac Flowback Tests at 200, 250, and 300 psi ~1.25 LPM, 5 L batches Feed: TDS= 29 g/L, TOC= 57 mg/L,
TN= 12 mg/L, turbidity = 0.59 NTU Nearly 2x the TDS and TOC of DJ PW
05
101520253035404550
0 20 40 60
Perm
eate
Flu
x (L
/m2 /
hr)
Time (hours)
200 psi 250 psi 300 psi
A B
Permeate Flux. “A”= acid/base cleaning, “B”= feed replenishment
0
1000
2000
3000
4000
5000
0.0
1.0
2.0
3.0
4.0
5.0
200 250 300
Perm
eate
TD
S (m
g/L)
Perm
eate
TO
C/TN
(mg/
L)
Pressure (psi)
TOC TN TDS

Summary: DJ Basin Frac Flowback 3D fluorescence
Removal of dissolved organic matter a) Untreated flowback b) BAF effluent c) NF permeate- 200 psi d) NF permeate- 300 psi
a)
b)
c) d)

Conclusions BAF
Biofilm can be conditioned to treat PW and FFB Effectively removes organic matter and colloidal material
Batch mode PW: achieves > 90% DOC removal in 24 hours Batch mode FFB: achieves > 75% DOC removal in 50 hours Continuous mode: efficiently treats PW, FFB more challenging…
NF High rejection of organics and inorganics Minimal flux decline at 150 and 200 psi
UF Achieves > 95% water recovery Turbidity removal to < 0.1 NTU BW/CEB maintain and recover permeability

Future Research Improve efficiency of BAF
Treatment of FFB in continuous mode Pilot-size BAF being constructed Microbial analyses
Reduce membrane fouling (UF and NF) Optimization of chemical cleaning/backwashing Membrane characterization Membrane selection
Characterization of recalcitrant organics

Acknowledgements NSF/Sustainability Research Network US Department of Energy/RPSEA Aqwatec labmates