Embed Size (px)
Citation preview

1
Treatment of Nutrients by
Stormwater Management
2006 FDOT Design Conference
by
Harvey H. Harper, Ph.D.,PEEnvironmental Research & Design Inc.
Areas of Discussion
1. Sources of Nutrients in Stormwater
2. Removal Mechanisms
A. Structural Techniques
B. Non-structural Techniques
2
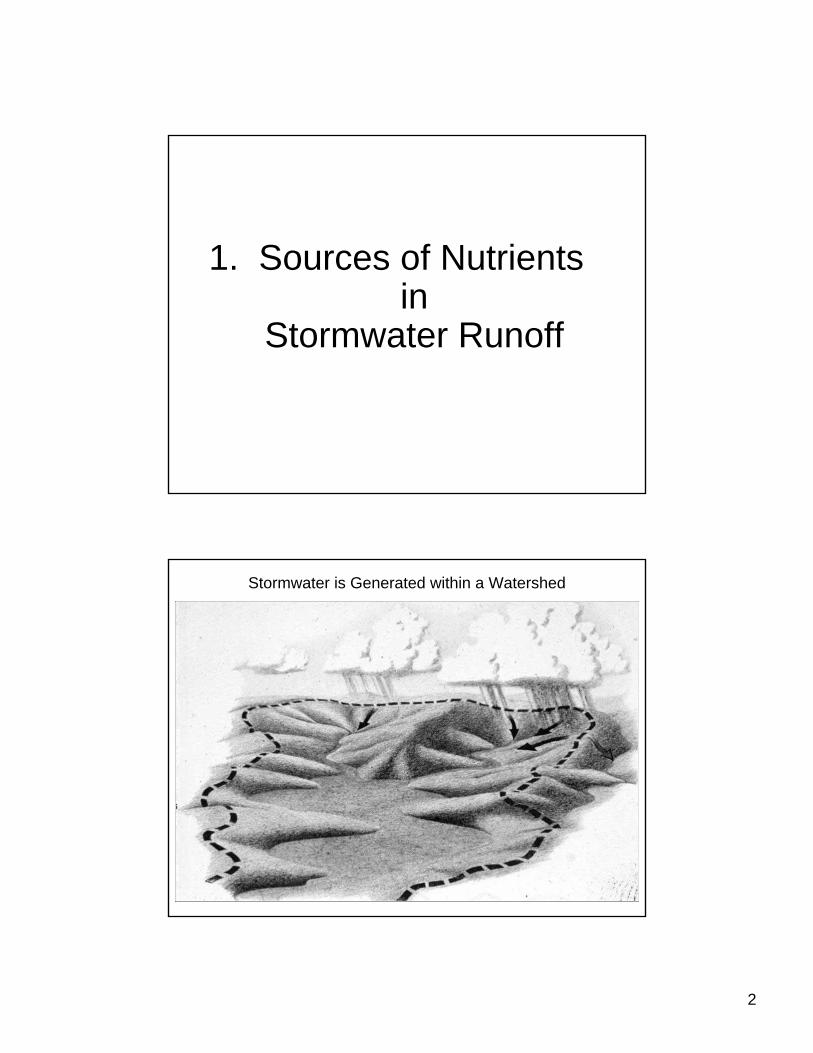
1. Sources of Nutrientsin
Stormwater Runoff
Stormwater is Generated within a Watershed

3
Runoff Entering an Urban Lake
NutrientsCompounds which stimulate the
growth of algae and other plants:
1. Nitrogen – NH3, NOX, Organic N, Particulate N
2. Phosphorus – Soluble reactive P (SRP), Organic P, Particulate P
4
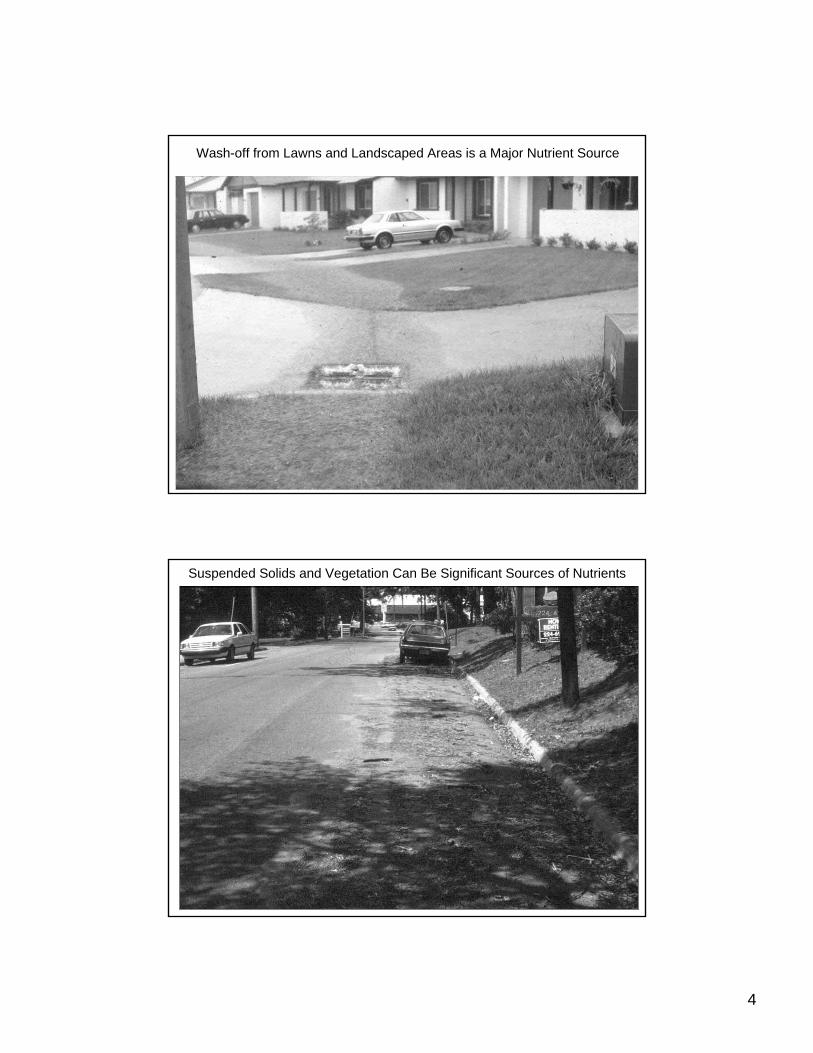
Wash-off from Lawns and Landscaped Areas is a Major Nutrient Source
Suspended Solids and Vegetation Can Be Significant Sources of Nutrients

5
Nutrients are Also Attached to Colloidal Suspended Solids
Pelagic Algal Bloom Resulting from Stormwater Runoff
6
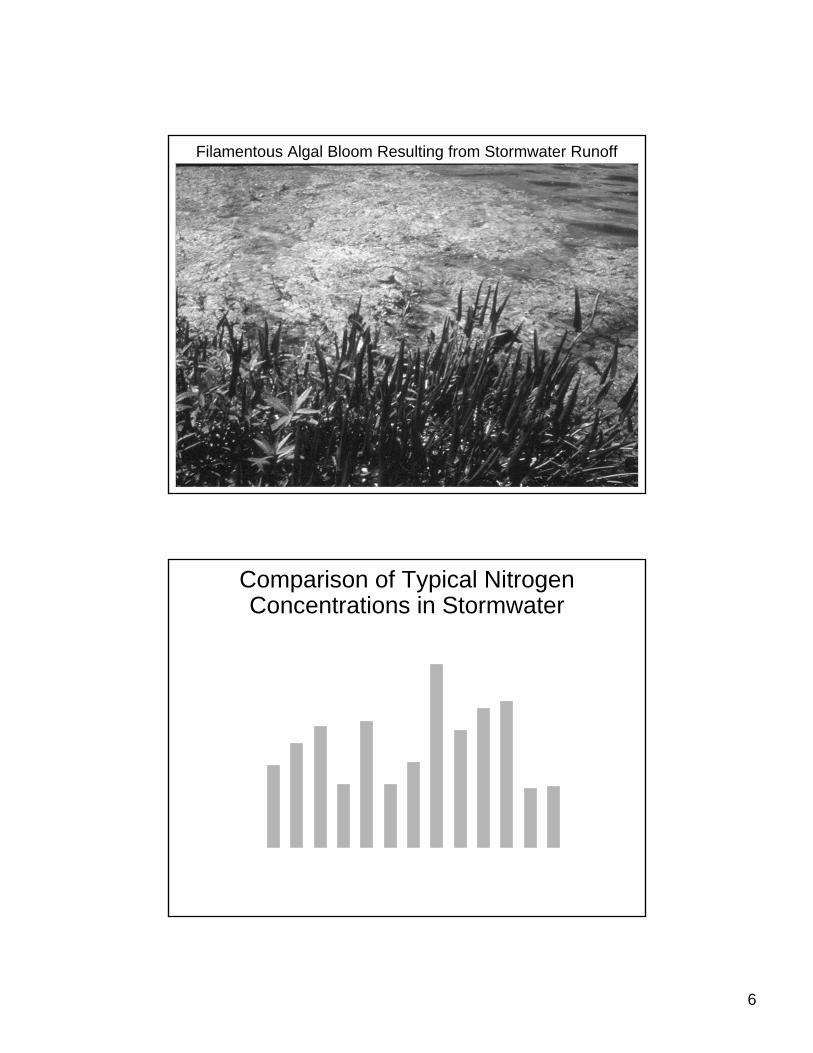
Filamentous Algal Bloom Resulting from Stormwater Runoff
Comparison of Typical Nitrogen Concentrations in Stormwater
LD R
es.
SF R
es.
MF
Res
.
LI C
omm
.
HI
Com
m.
Indu
stria
l
Hig
hway
Past
ure
Citr
us
Row
Cro
ps
Gen
eral
Ag.
Und
evel
oped
Min
ing
Tota
l Nitr
ogen
(mg/
l)
0
1
2
3
4

7
Comparison of Typical PhosphorusConcentrations in Stormwater
LD R
es.
SF R
es.
MF
Res
.
LI C
omm
.
HI
Com
m.
Indu
stria
l
Hig
hway
Past
ure
Citr
us
Row
Cro
ps
Gen
eral
Ag.
Und
evel
oped
Min
ing
Tota
l Pho
spho
rus
(mg/
l)
0.0
0.1
0.2
0.3
0.4
0.5
0.6
0.7
2. Removal/Control of Runoff Nutrients
a. Structural Techniques
8
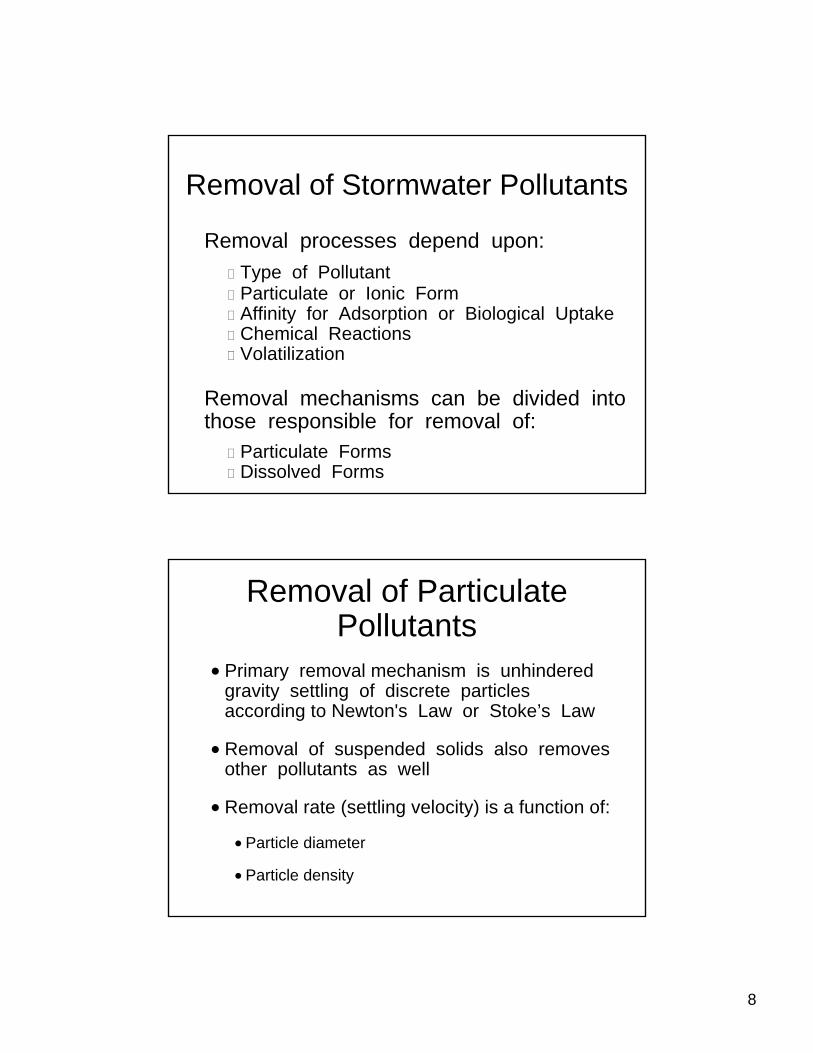
Removal of Stormwater Pollutants
Removal processes depend upon:Type of PollutantParticulate or Ionic FormAffinity for Adsorption or Biological UptakeChemical ReactionsVolatilization
Removal mechanisms can be divided intothose responsible for removal of:
Particulate FormsDissolved Forms
Removal of Particulate Pollutants
nPrimary removal mechanism is unhindered gravity settling of discrete particles according to Newton's Law or Stoke’s Law
nRemoval of suspended solids also removes other pollutants as well
nRemoval rate (settling velocity) is a function of:
nParticle diameter
nParticle density
9
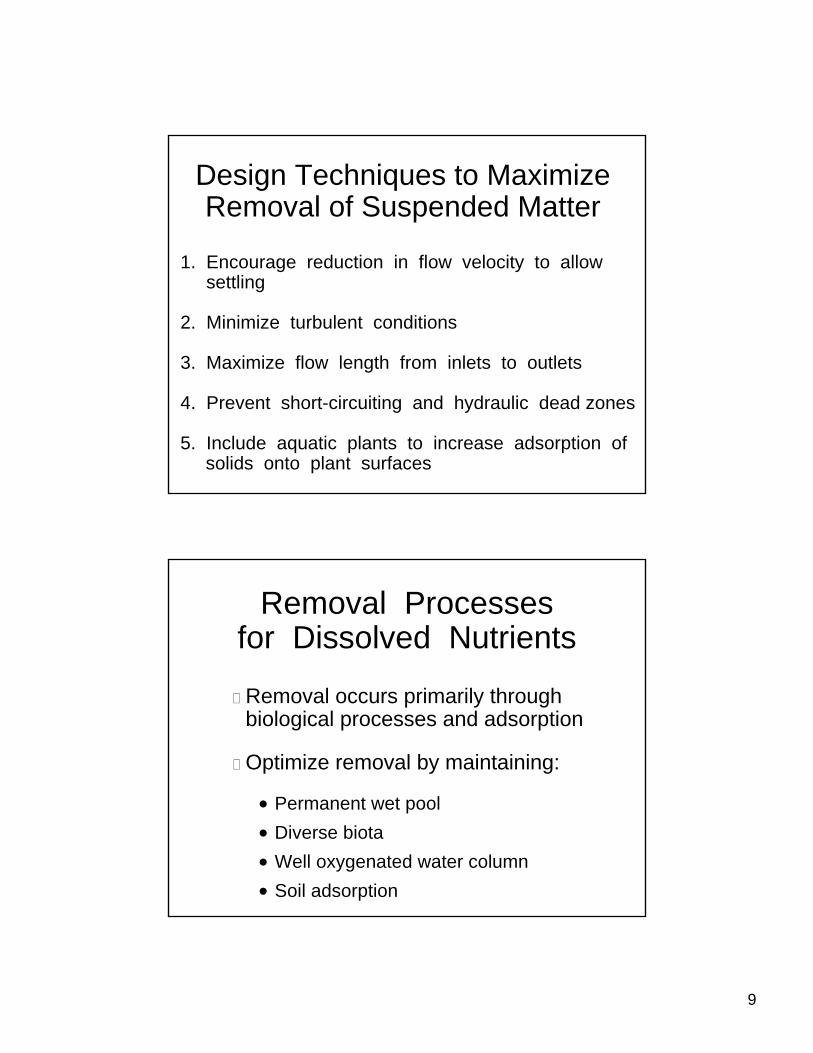
Design Techniques to Maximize Removal of Suspended Matter
1. Encourage reduction in flow velocity to allow settling
2. Minimize turbulent conditions
3. Maximize flow length from inlets to outlets
4. Prevent short-circuiting and hydraulic dead zones
5. Include aquatic plants to increase adsorption of solids onto plant surfaces
Removal Processesfor Dissolved Nutrients
Removal occurs primarily through biological processes and adsorption
Optimize removal by maintaining:
n Permanent wet pooln Diverse biotan Well oxygenated water columnn Soil adsorption

10
Common Stormwater Treatment Practicesn Infiltration Systems
Retention BasinsSwalesInfiltration TrenchesExfiltration SystemsPervious Pavement
n Detention SystemsnDry DetentionnWet Detention
n Filter Systemsn Alum Injectionn Gross Pollutant Separators
Infiltration SystemsDescription
Family of practices where the stormwater is disposed of by infiltration or evaporation
rather than by surface discharge
Purposen Reduce total runoff volumen Reduce pollutant loadings
Pollutant Removaln Percolation, evaporationn Filtering and adsorption

11
Infiltration Systems(Continued)
Limitations on Use:
n Require porous soils
n Not on soils with high clay or silt
n Not where high water tables, bedrock
n Not on fill sites or steep slopes
n Not at sites where hazard materials spill
n Risk of groundwater contamination
Benefits of Infiltrationn Groundwater recharge
n Maintain baseflow
n Maintain pre-development hydrology
n Reduce stormwater pollutant loads
n Reduce total stormwater volume
12
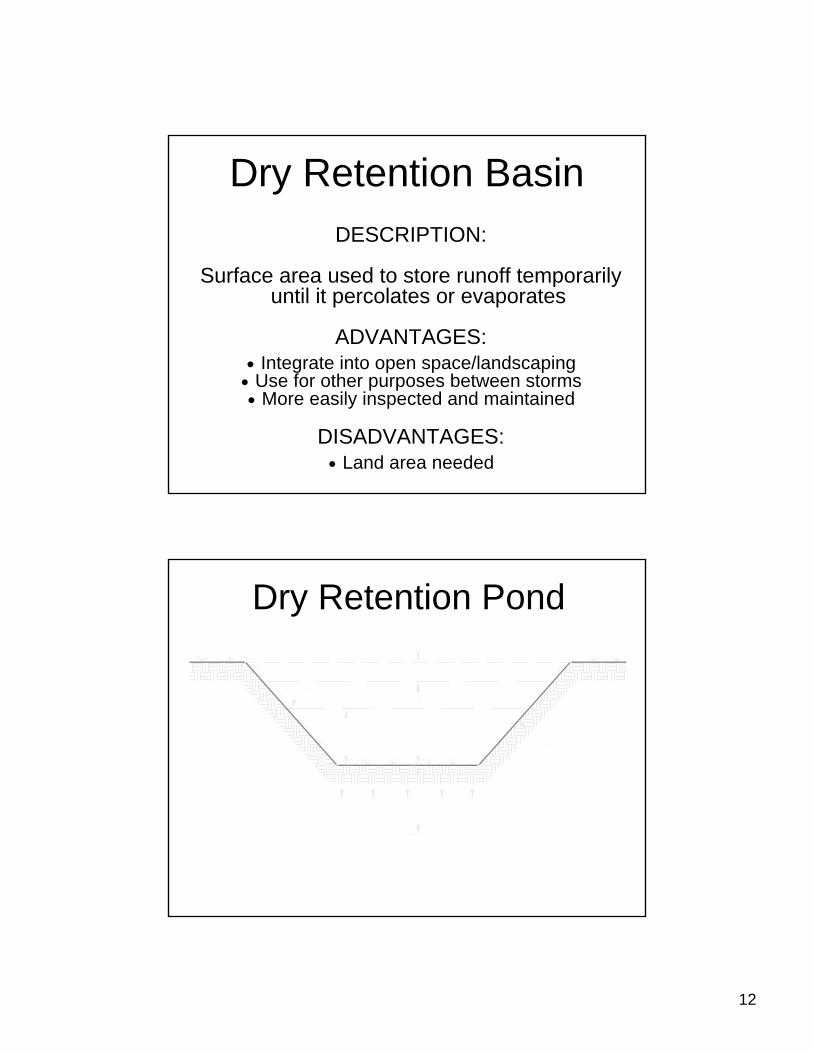
Dry Retention BasinDESCRIPTION:
Surface area used to store runoff temporarily until it percolates or evaporates
ADVANTAGES:n Integrate into open space/landscapingn Use for other purposes between stormsn More easily inspected and maintained
DISADVANTAGES:n Land area needed
Dry Retention Pond

13
Retention Storage Underneath a Commercial Building in Tallahassee
Typical Swale Section
14
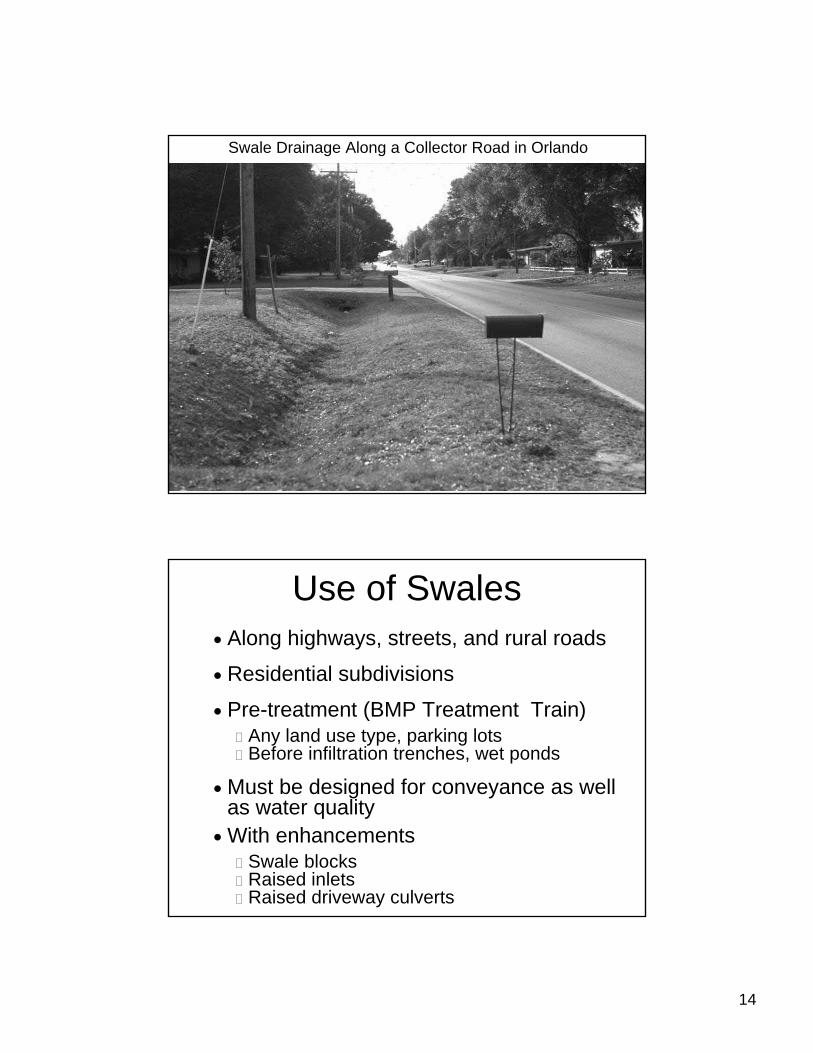
Swale Drainage Along a Collector Road in Orlando
Use of Swalesn Along highways, streets, and rural roads
n Residential subdivisions
n Pre-treatment (BMP Treatment Train)Any land use type, parking lotsBefore infiltration trenches, wet ponds
n Must be designed for conveyance as well as water quality
n With enhancementsSwale blocksRaised inletsRaised driveway culverts

15
Infiltration TrenchDescription
n Shallow excavated trench, backfilled with coarse stone, allowing for temporary
storage of runoff
Advantagesn Require less land
n Can be fit into tight places
Disadvantagesn Difficult to monitor performancen Clog easily and hard to maintain
Schematic of Infiltration Trench with Observation Well
16
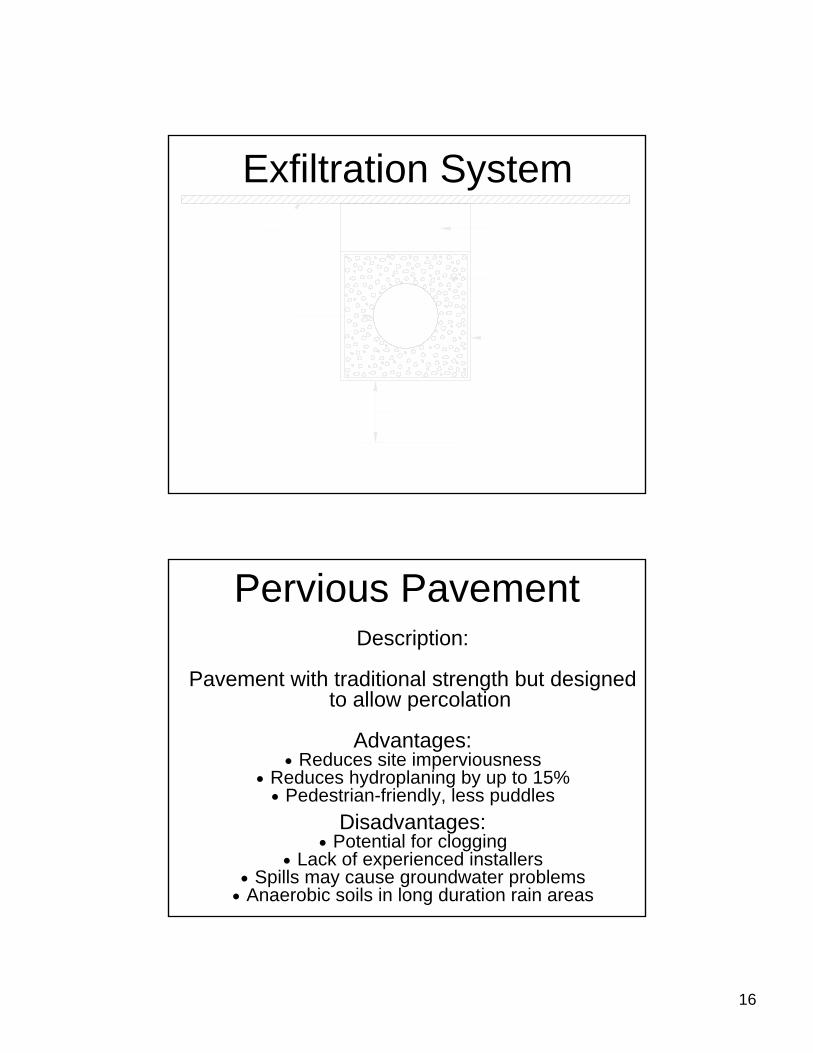
Exfiltration System
Pervious PavementDescription:
Pavement with traditional strength but designed to allow percolation
Advantages:n Reduces site imperviousness
n Reduces hydroplaning by up to 15%n Pedestrian-friendly, less puddles
Disadvantages:n Potential for clogging
n Lack of experienced installersn Spills may cause groundwater problemsn Anaerobic soils in long duration rain areas

17
Pervious Pavement in a Shopping Center in Tallahassee

18
North Florida (Branford)
0.00
-0.1
0
0.11
-0.2
0
0.21
-0.3
0
0.31
-0.4
0
0.41
-0.5
0
0.51
-1.0
0
1.01
-1.5
0
1.51
-2.0
0
2.01
-2.5
0
2.51
-3.0
0
3.01
-3.5
0
3.51
-4.0
0
4.01
-4.5
0
4.51
-5.0
0
5.01
-6.0
0
6.01
-7.0
0
7.01
-8.0
0
8.01
-9.0
0
>9.0
0
Num
ber o
f Ann
ual E
vent
s
0
10
20
30
40
50
Typical Rainfall
FrequencyDistribution
Bran
ford
Cro
ss C
ity
Fort
Mye
rs
Jack
sonv
ille
Key
Wes
t
Mel
bour
ne
Mia
mi
Orla
ndo
Pens
acol
a
Talla
hass
ee
Tam
pa
Per
cent
of A
nnua
l Rai
nfal
l Vol
ume
< 0.
1 In
ch (%
)
0
2
4
6
8
10
Mean
Bran
ford
Cro
ss C
ity
Fort
Mye
rs
Jack
sonv
ille
Key
Wes
t
Mel
bour
ne
Mia
mi
Orla
ndo
Pens
acol
a
Talla
hass
ee
Tam
pa
Per
cent
of A
nnua
l Rai
nfal
l Vol
ume
> 1.
0 In
ch (%
)
30
35
40
45
50
55
60
Mean
Characteristics of Rainfall Events at the 10 Meteorological Sites

19
Bran
ford
Cro
ss C
ity
Fort
Mye
rs
Jack
sonv
ille
Key
Wes
t
Mel
bour
ne
Mia
mi
Orla
ndo
Pens
acol
a
Talla
hass
ee
Tam
pa
Ann
ual C
Val
ue
0.20
0.25
0.30
0.35
0.40
0.45
0.50
Mean
Comparison of State-Wide Annual C Values forA Hypothetical Residential Development
DCIA = 40%Non-DCIA CN = 70
Retention Efficiency for CN=70 and DCIA=40%
Bran
ford
Cro
ss C
ity
Fort
Mye
rs
Jack
sonv
ille
Key
Wes
t
Mel
bour
ne
Mia
mi
Orla
ndo
Pens
acol
a
Talla
hass
ee
Tam
pa
Trea
tmen
t Effi
cien
cy (%
)
40
50
60
70
80Treatment for Runoff from 1.0-inch of RainfallTreatment for 0.5 Inches of Runoff
Comparison of Retention Efficiency for 0.5 inch of Runoff and 1 inch of Rainfall

20
Non-DCIA Curve Number
30 40 50 60 70 80 90 100
Perc
ent D
CIA
(%)
10
20
30
40
50
60
70
80
90
100
0.0 0.2 0.4 0.6 0.8 1.0 1.2 1.4 1.6 1.8
Treatment Depth(inches)
Non DCIA Curve Number
30 40 50 60 70 80 90 100
Perc
ent D
CIA
(%)
10
20
30
40
50
60
70
80
90
100
0.0 0.2 0.4 0.6 0.8 1.0 1.2 1.4 1.6 1.8
Treatment Depth(inches)
Retention Depth Required for 80% RemovalMelbourne Pensacola
Detention PracticesDESCRIPTION
n A family of practices which detain runoff and discharge it over a period of days
PURPOSEn Flood protectionn Water storagen Pollutant removal
POLLUTANT REMOVALn Depends on type of detention BMP
21
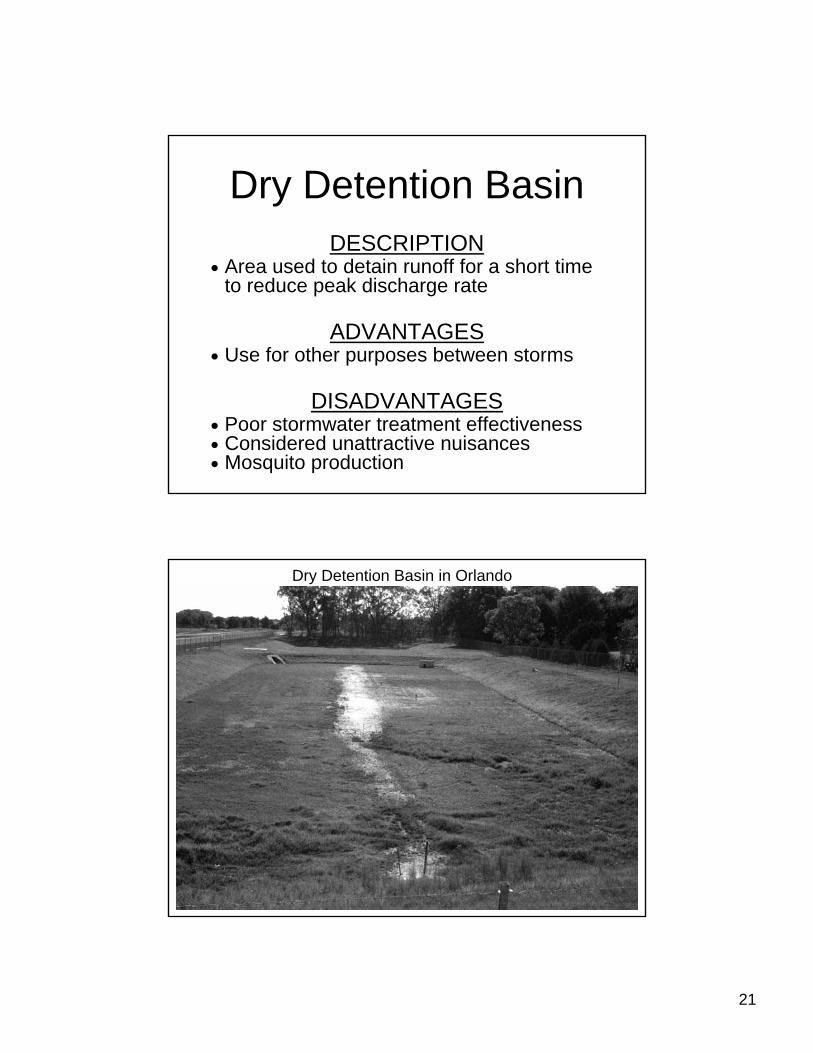
Dry Detention BasinDESCRIPTION
n Area used to detain runoff for a short time to reduce peak discharge rate
ADVANTAGESn Use for other purposes between storms
DISADVANTAGESn Poor stormwater treatment effectivenessn Considered unattractive nuisancesn Mosquito production
Dry Detention Basin in Orlando
22
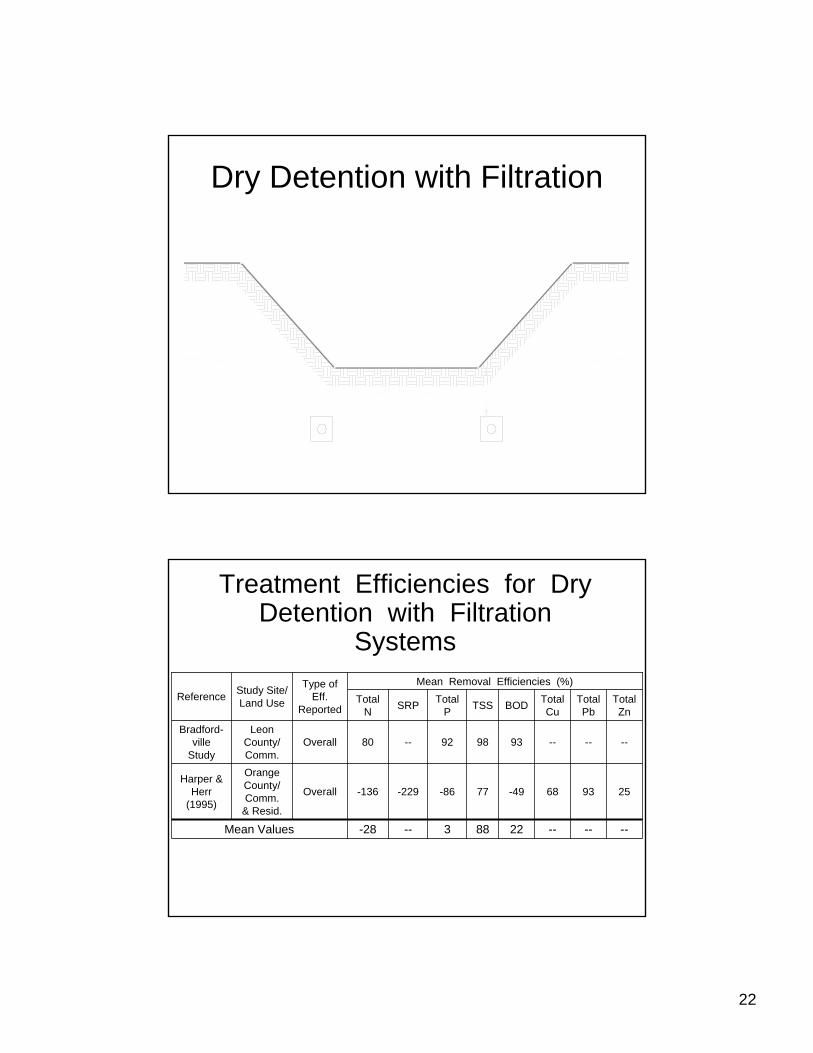
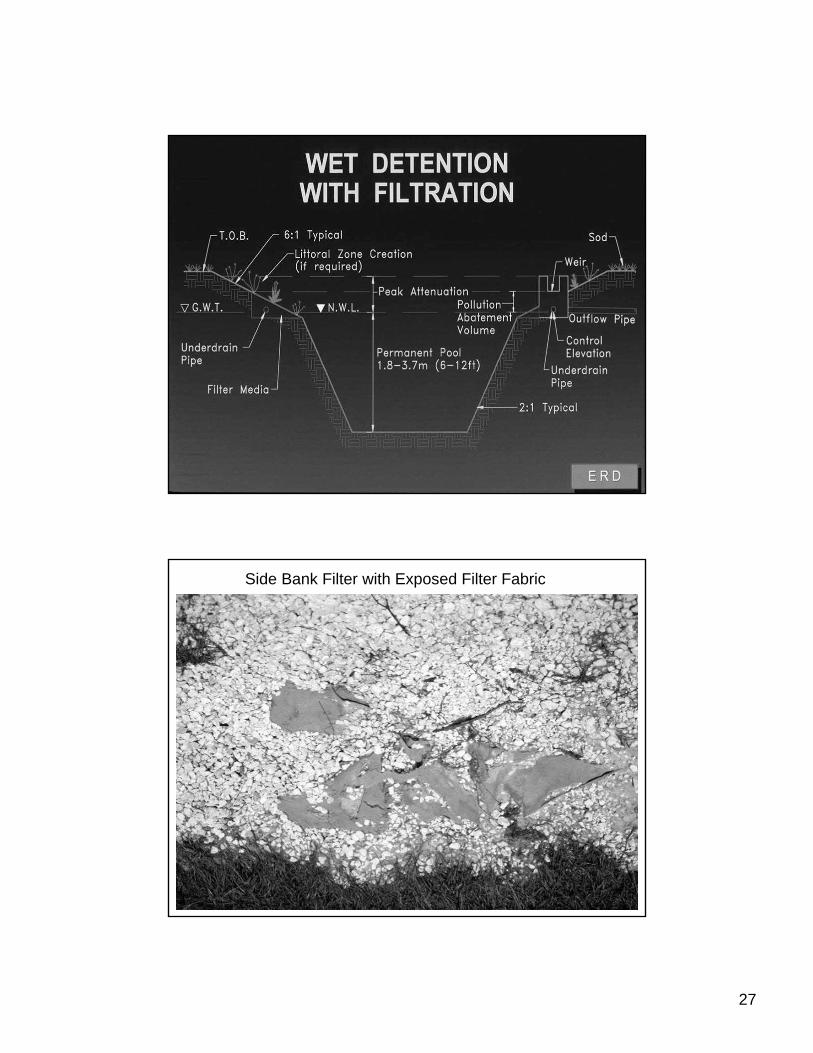
Dry Detention with Filtration
Treatment Efficiencies for DryDetention with Filtration
Systems
------22883---28Mean Values
259368-4977-86-229-136Overall
OrangeCounty/Comm.
& Resid.
Harper &Herr
(1995)
------939892--80OverallLeon
County/Comm.
Bradford-ville
Study
TotalZn
TotalPb
TotalCuBODTSSTotal
PSRPTotalN
Mean Removal Efficiencies (%)Type ofEff.
Reported
Study Site/Land UseReference
23
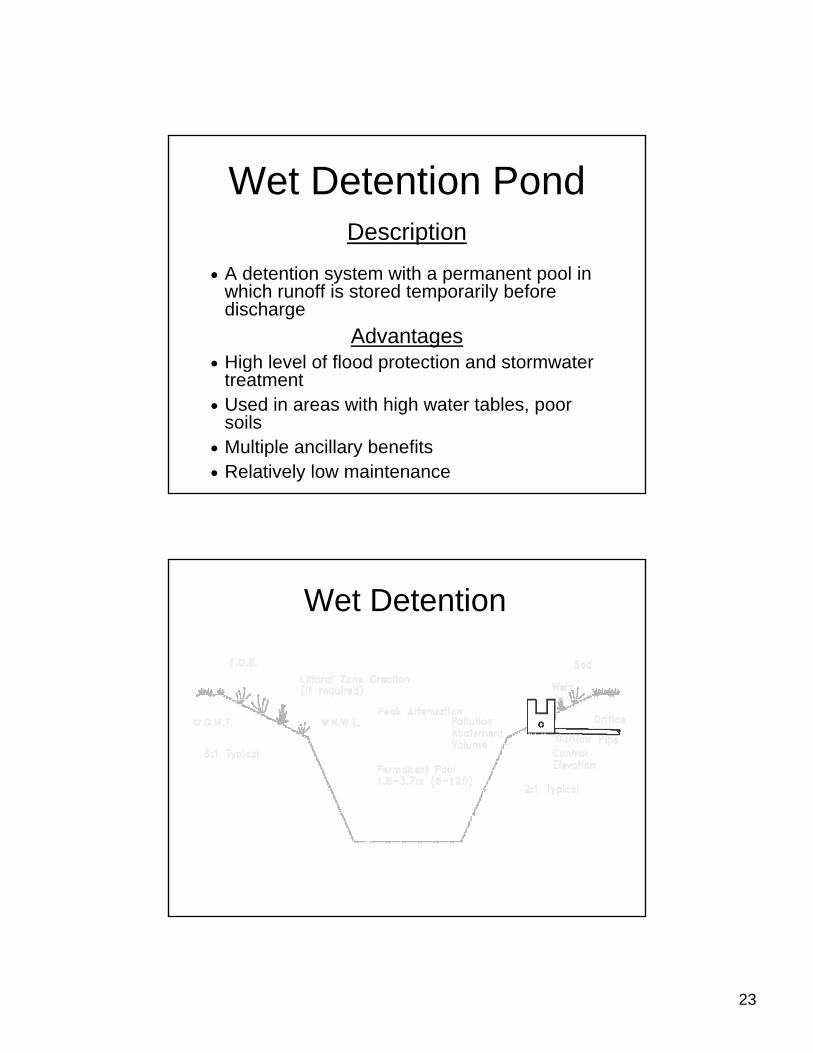
Wet Detention PondDescription
n A detention system with a permanent pool in which runoff is stored temporarily before discharge
Advantagesn High level of flood protection and stormwater
treatmentn Used in areas with high water tables, poor
soilsn Multiple ancillary benefitsn Relatively low maintenance
Wet Detention
24
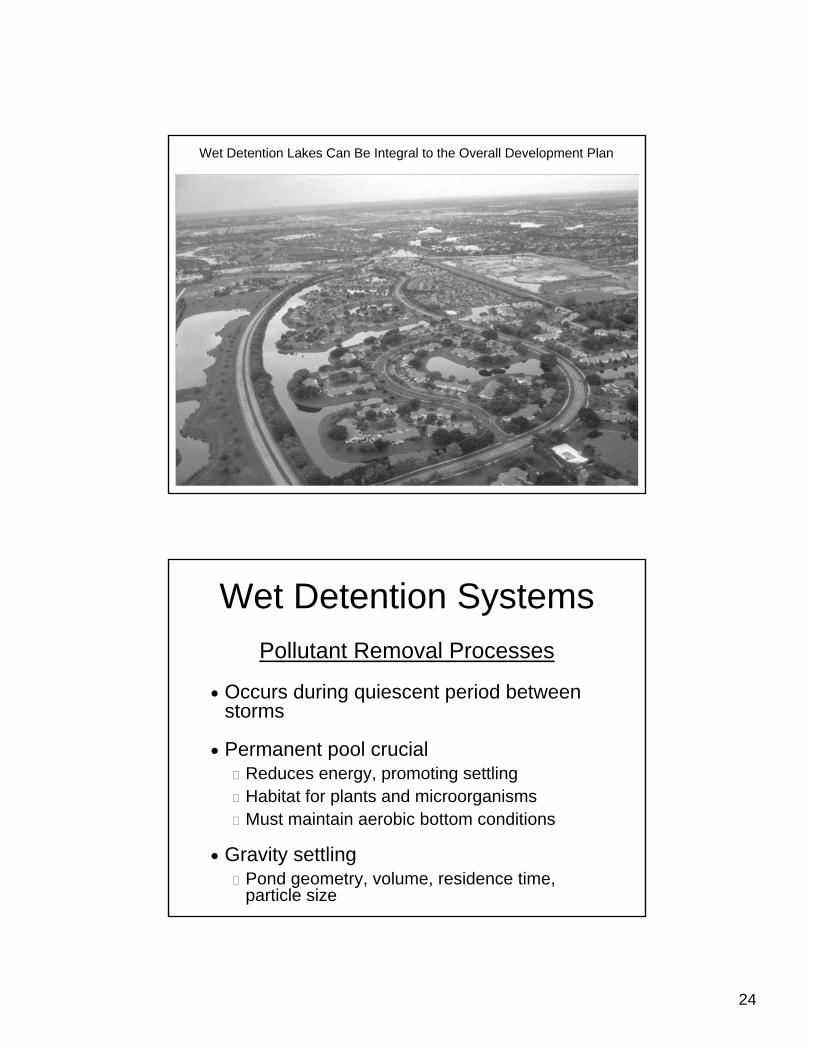
Wet Detention Lakes Can Be Integral to the Overall Development Plan
Wet Detention SystemsPollutant Removal Processes
n Occurs during quiescent period between storms
n Permanent pool crucialReduces energy, promoting settlingHabitat for plants and microorganismsMust maintain aerobic bottom conditions
n Gravity settlingPond geometry, volume, residence time, particle size

25
Wet Detention Design Considerations
nPermanent pool and residence timeAverage > 14 daysPermanent pool volume calculation:n (Annual runoff volume) x (14/365)
nDepth of permanent poolNeed mix of deep (> 3 m) and shallow areas (< 1 m)Maximum depth of 6 m (20 ft), maintain aerobic bottomDo not breach confining layers
Wet Detention Design Considerations
nLittoral Zone30% of surface area, slope gently (6:1 to 10:1), depth < 3 feetConcentrate at outfall or around perimeterVariety of native aquatic plants
nPond GeometryLength to width ratio at least 3:1, preferably 5:1Separate inlets and outlets, long flow path

26
Total Phosphorus
Detention Time, td (days)0 100 200 300 400
Rem
oval
Effi
cien
cy (%
)
0
20
40
60
80
100
R2 = 0.877
2))(ln(19.0)ln(87.518.44 dd ttEfficiency •+•+=
Total Nitrogen
Detention Time, td (days)0 100 200 300 400
Rem
oval
Effi
cien
cy (%
)
0
20
40
60
80
100
R2 = 0.808
)46.5()72.44(
d
d
ttEfficiency
+•
=
27
Side Bank Filter with Exposed Filter Fabric

28
Off-line Retention/Detention Systems
Comparative Removal Efficiencies for Total Nitrogen
0.25
" R
eten
tion
0.50
" R
eten
tion
0.75
" R
eten
tion
1.00
" R
eten
tion
Off-
Line
Ret
./Det
.
Wet
Det
entio
n
Dry
Det
entio
n
Alum
Tre
atm
ent
Tota
l Nitr
ogen
Rem
oval
Effi
cien
cies
(%)
0
20
40
60
80
100
29
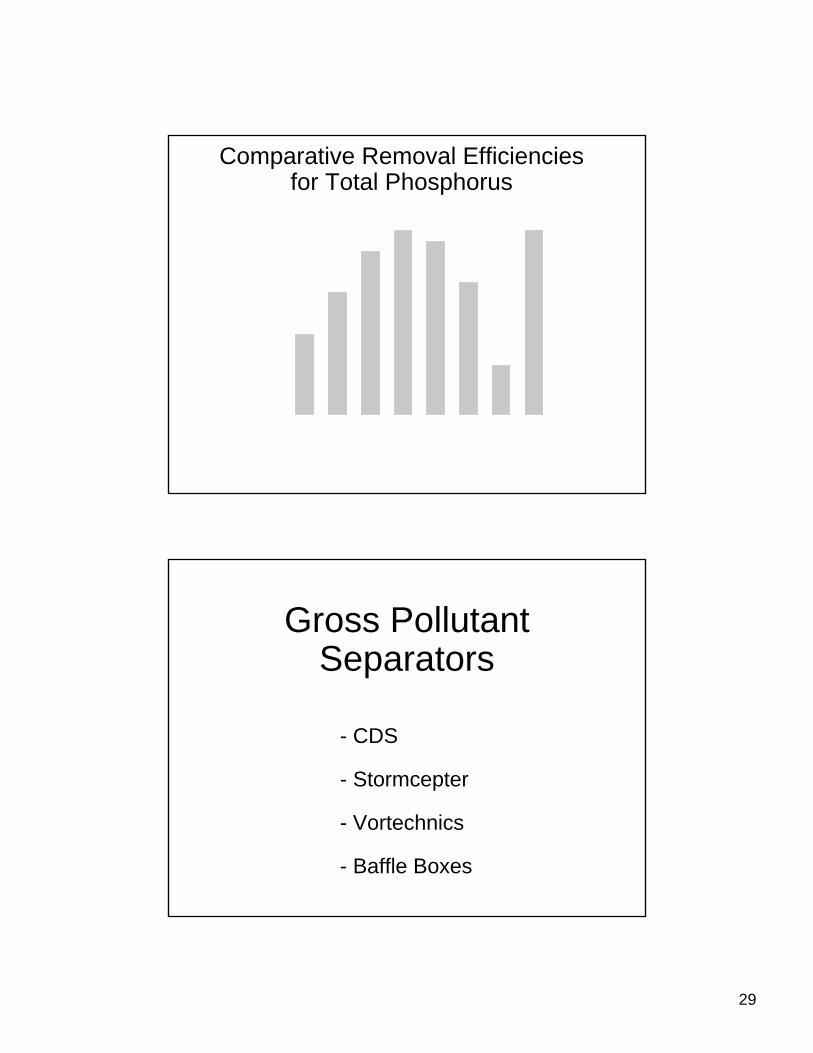
Comparative Removal Efficiencies for Total Phosphorus
0.25
" R
eten
tion
0.50
" R
eten
tion
0.75
" R
eten
tion
1.00
" R
eten
tion
Off-
Line
Ret
./Det
.
Wet
Det
entio
n
Dry
Det
entio
n
Alum
Tre
atm
ent
Tota
l Pho
spho
rus
Rem
oval
Effi
cien
cies
(%)
0
20
40
60
80
100
Gross Pollutant Separators
- CDS
- Stormcepter
- Vortechnics
- Baffle Boxes
30
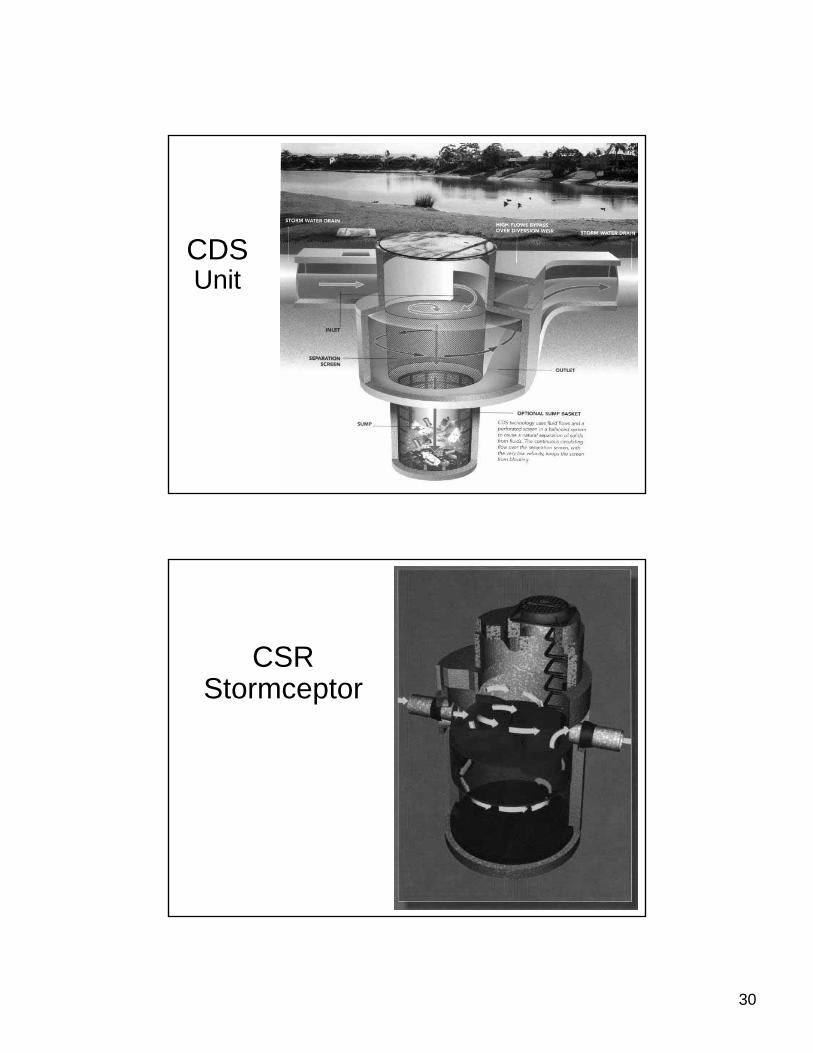
CDSCDSUnitUnit
CSRCSRStormceptorStormceptor

31
VortechsVortechsStormwaterStormwaterTreatmentTreatment
SystemSystem
Typical Baffle Box or Sediment Trap Design
32
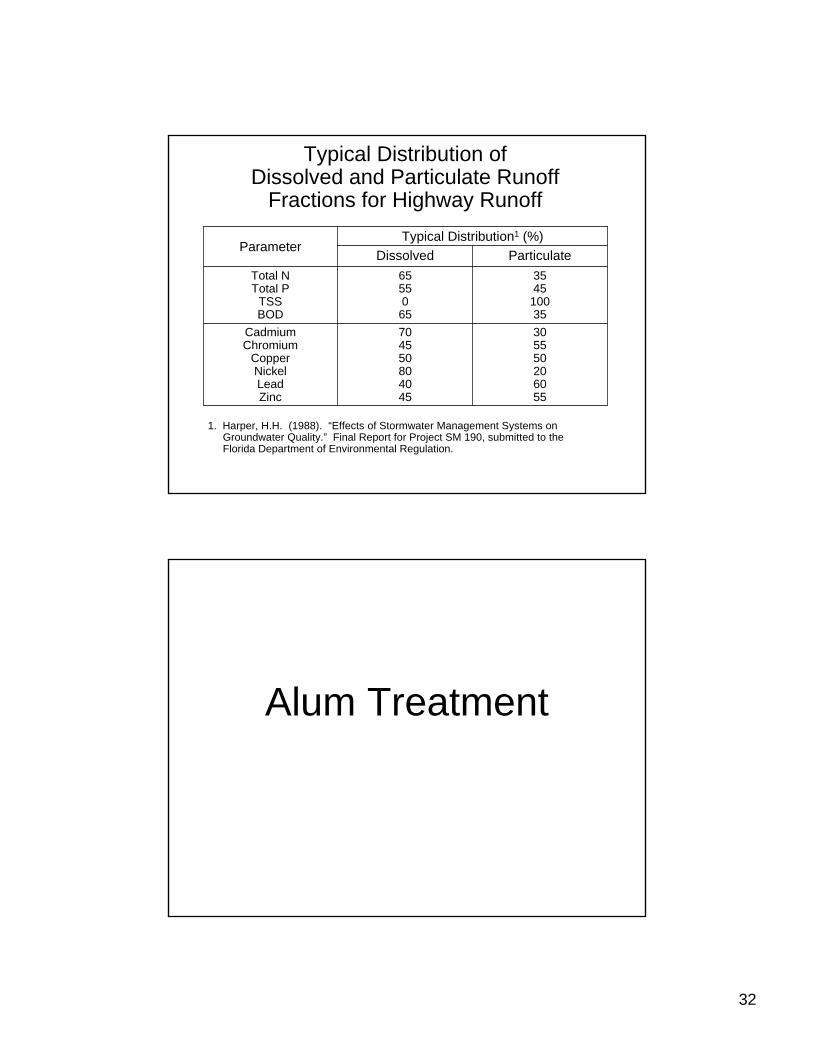
Typical Distribution ofDissolved and Particulate Runoff
Fractions for Highway Runoff
305550206055
704550804045
CadmiumChromium
CopperNickelLeadZinc
1. Harper, H.H. (1988). “Effects of Stormwater Management Systems onGroundwater Quality.” Final Report for Project SM 190, submitted to theFlorida Department of Environmental Regulation.
354510035
6555065
Total NTotal P
TSSBOD
ParticulateDissolvedTypical Distribution1 (%)
Parameter
Alum Treatment

33
Alum is a viscous clear liquid with a greenish to tan color
Significant Alum Removal Processes
1. Removal of suspended solids, algae,phosphorus, heavy metals and bacteria:
Al+3+ 6H O2
Al(OH)3(s)
+ 3H3O +
2. Removal of dissolved phosphorus:
Al+3 + HnPO
4
n-3 AlPO4(s)
+ nH +
34
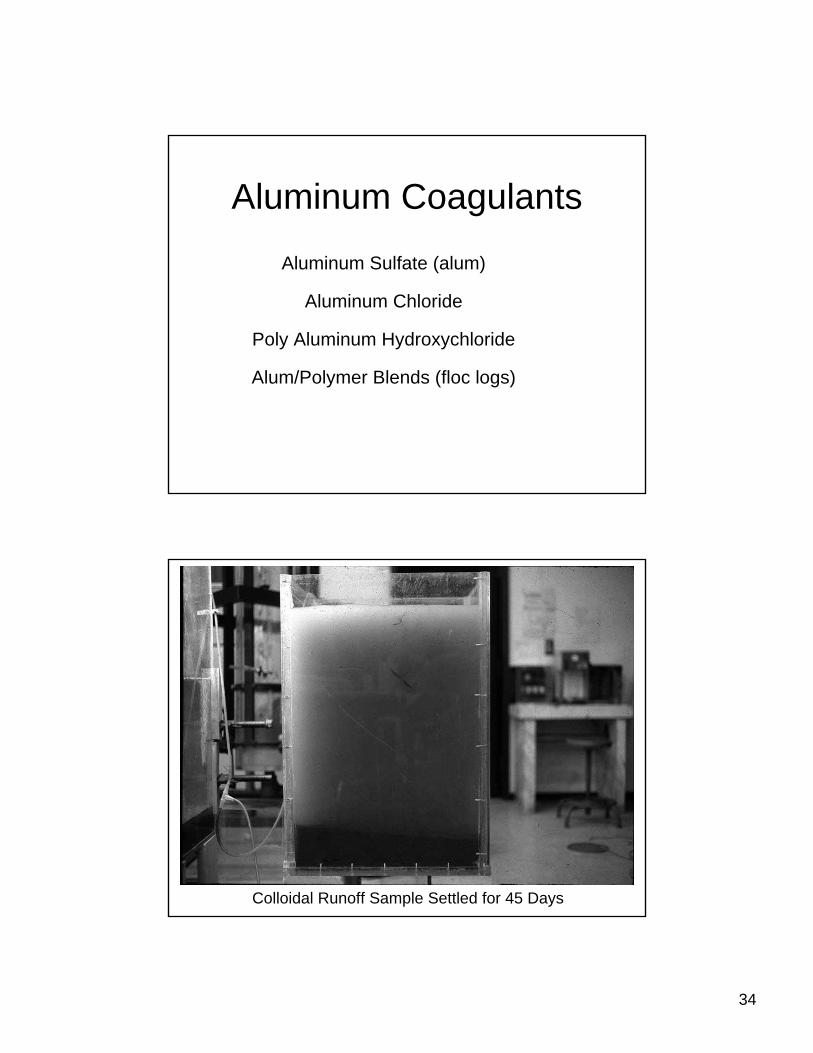
Aluminum Coagulants
Aluminum Sulfate (alum)
Aluminum Chloride
Poly Aluminum Hydroxychloride
Alum/Polymer Blends (floc logs)
Colloidal Runoff Sample Settled for 45 Days
35
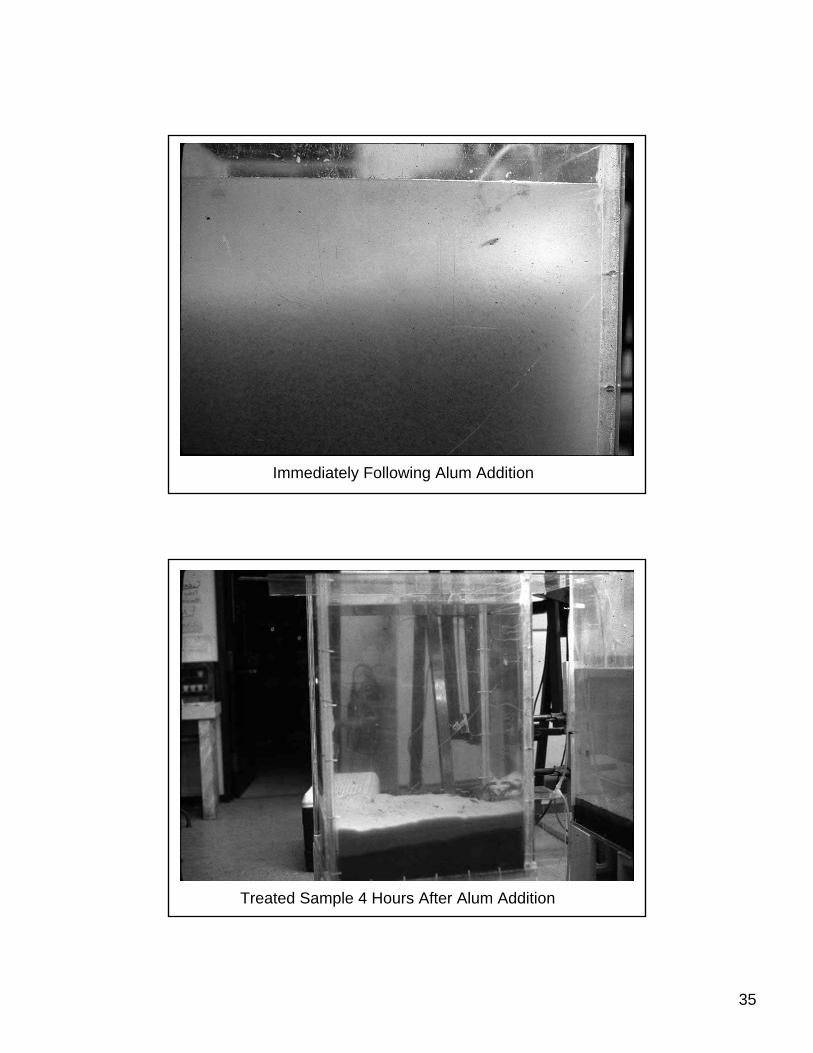
Immediately Following Alum Addition
Treated Sample 4 Hours After Alum Addition

36
Alum CoagulationAdvantages
Rapid, efficient removal of solids, phosphorus, and bacteria
Inexpensive – approximately $0.65/gallon
Relatively easy to handle and feed
Does not deteriorate under long-term storage
Floc is inert and is immune to normal fluctuations in pH and redox potential
Floc also binds heavy metals in sediments, reducing sediment toxicity
Disadvantage
May result in lowered pH and elevated levels of Al+3 if improperly applied
Typical Percent Removal Efficiencies for Alum Treated Stormwater Runoff
99999661Fecal Coliform99948037Total Coliform64636130BOD98979570TSS99999882Turbidity96948645Total P95948261Particulate P98989617Diss. Ortho-P73716525Total N96948857Particulate N65625120Diss. Organic N
107.55
ALUM DOSE (Dose in mg Al/liter)SETTLEDWITHOUT
ALUM (24 hrs)PARAMETER
37
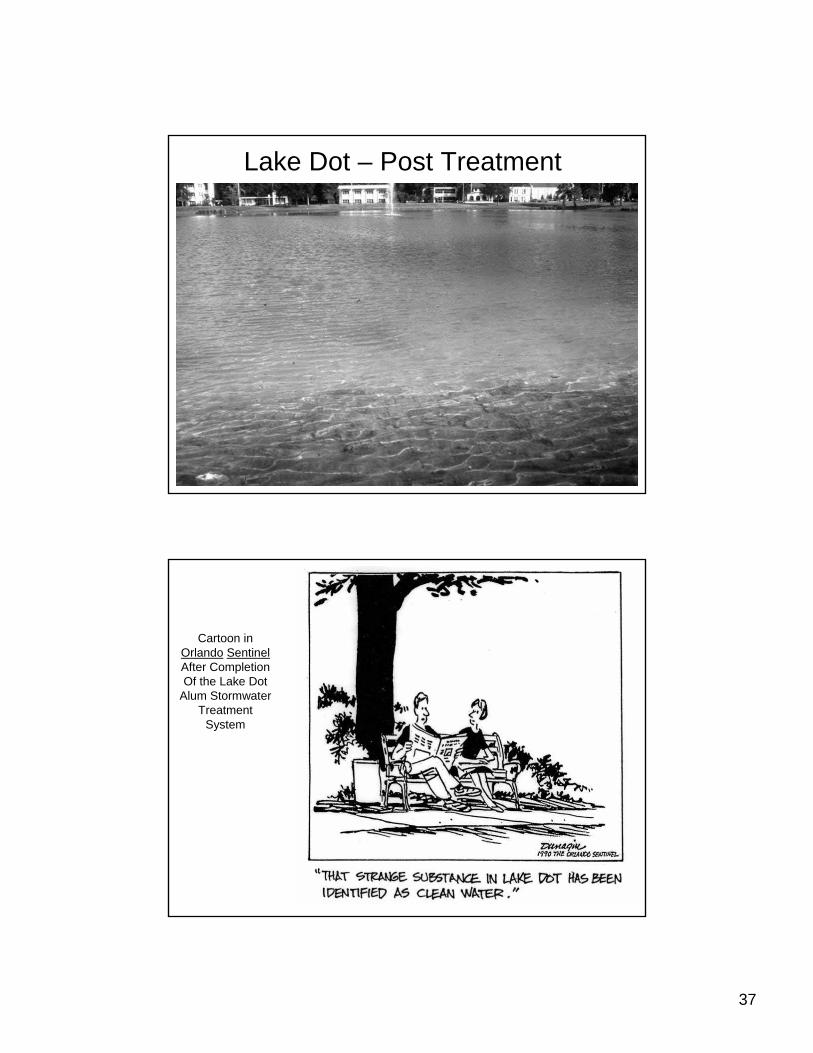
Lake Dot – Post Treatment
Cartoon inOrlando SentinelAfter CompletionOf the Lake Dot
Alum StormwaterTreatment
System
38
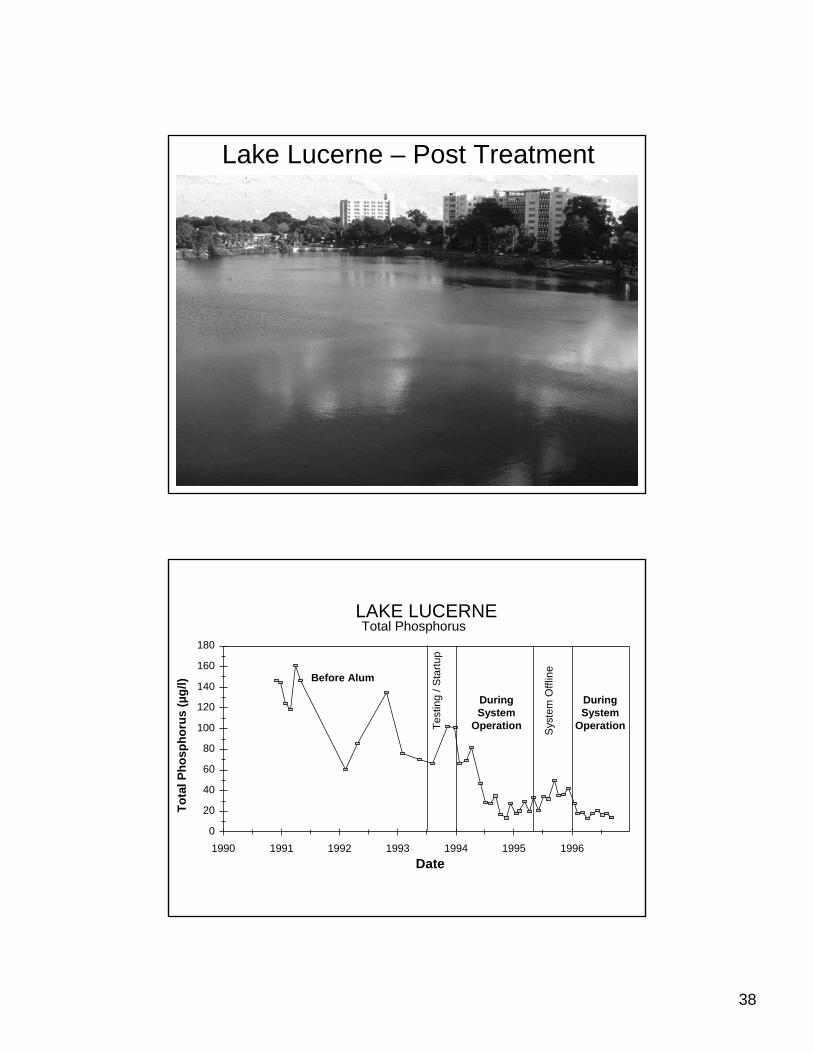
Lake Lucerne – Post Treatment
0
20
40
60
80
100
120
140
160
180
Tota
l Pho
spho
rus
(µg/
l)
1990 1991 1992 1993 1994 1995 1996Date
LAKE LUCERNETotal Phosphorus
Before Alum
Test
ing
/ Sta
rtup
DuringSystem
Operation
DuringSystem
OperationSys
tem
Offl
ine
39
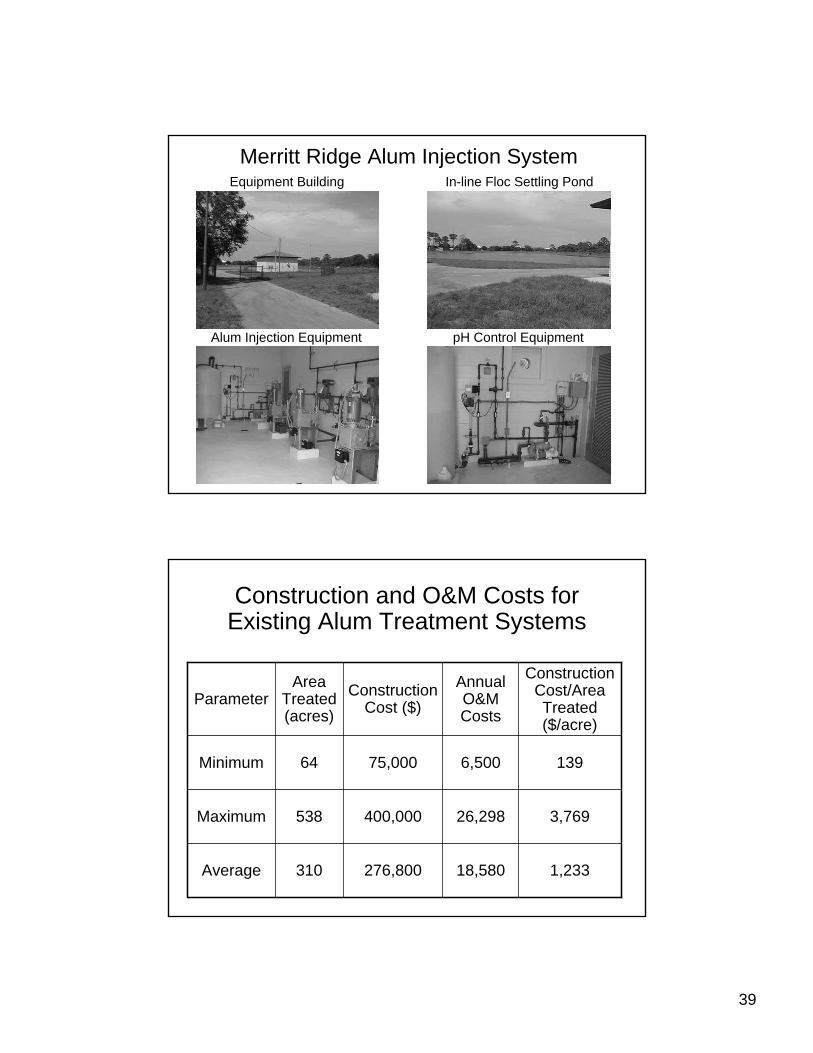
Equipment Building
Alum Injection Equipment pH Control Equipment
In-line Floc Settling Pond
Merritt Ridge Alum Injection System
Construction and O&M Costs for Existing Alum Treatment Systems
1,23318,580276,800310Average
3,76926,298400,000538Maximum
1396,50075,00064Minimum
Construction Cost/Area Treated ($/acre)
Annual O&M Costs
Construction Cost ($)
Area Treated (acres)
Parameter
40
2. Removal/Control of Nutrients
b. Non-structural Techniques
Street Sweeping
Most applicable for paved streets having curbs and gutters, but can be used on any impervious surface
Particularly applicable to urban built-out areas where space for conventional stormwater treatment is unavailable or too expensive
41
Types of Street SweepersMechanical Sweepers
Most common type of sweeper
Uses brooms to sweep solids into a hopper
Water is sprayed for dust control
Efficiency is a function of:
Particle sizeFrequency of sweepingNumber of passesEquipment speedPavement conditions
Types of Street SweepersVacuum (plus mechanical)
Provides air vacuum over entire path with mechanical broom assist
Some particles do not receive sufficient agitation to become air-entrained
Regenerative Air
Air is forced down onto the pavement, suspending particles, which are then picked up by the vacuum

42
Estimated TSS Reduction from Street Sweeping (%)
(Major Arterial Highway)
7543Mechanical Brush Type
24221715Air Sweeper
85766249New Type Vacuum
Twice WeeklyWeeklyTwice
MonthlyMonthly
Frequency of SweepingSweeper
Type
Relationships Between Particle Size and Sweeper Efficiency
(Mechanical Sweeper; Ref. USEPA)
50Overall15<432043 – 10448104 – 24660246 – 84066840 – 200076>2000
Sweeper Efficiency (%)
Particle Size (microns)
43
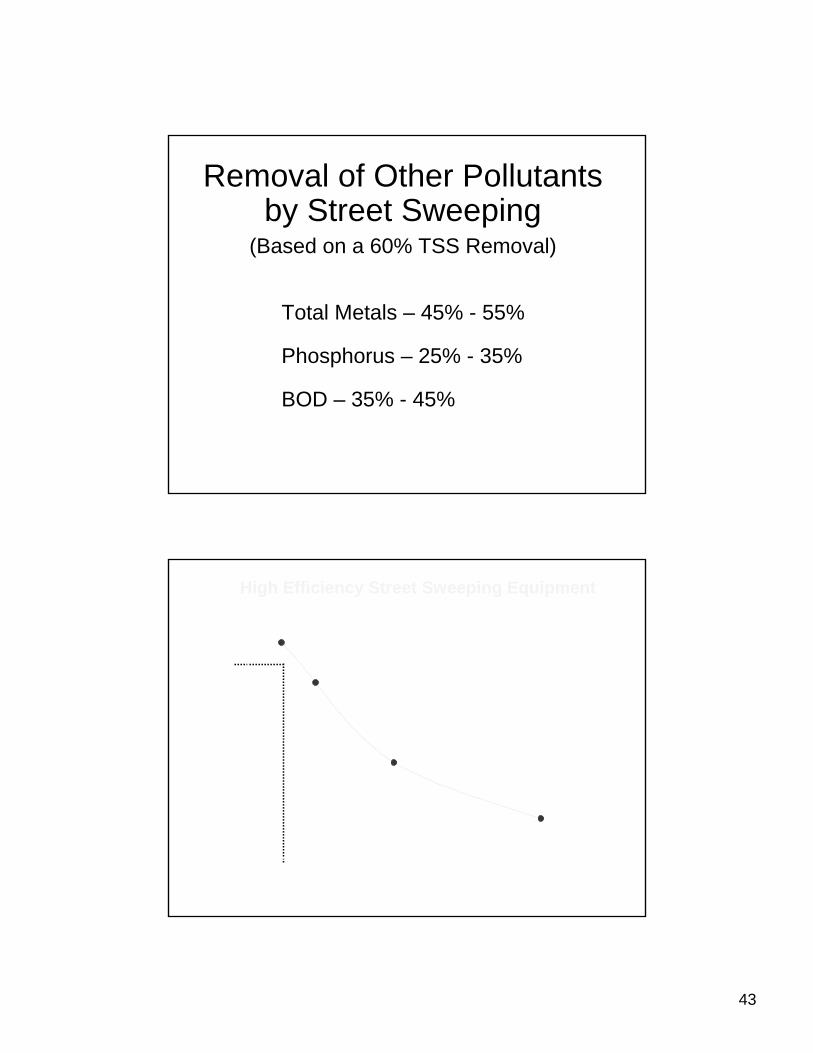
Removal of Other Pollutants by Street Sweeping
(Based on a 60% TSS Removal)
Total Metals – 45% - 55%
Phosphorus – 25% - 35%
BOD – 35% - 45%
High Efficiency Street Sweeping Equipment
Sweeping Interval (days)
0 5 10 15 20 25 30 35
Tota
l Pho
spho
rus
Rem
oval
(%)
25
30
35
40
45
50
55

44
Questions?
![USE OF THE ASSESSMENT TOOL - Florida Stormwater · •PM is the predominate sink and source of nutrients (P, N) • Management of PM = Control of chemical (nutrient) load, [C] •](https://img.pdfslide.us/doc/110x75/5f5c55f16574850b08202339/use-of-the-assessment-tool-florida-stormwater-apm-is-the-predominate-sink-and.jpg)