Embed Size (px)
Citation preview
© ICBTS Copyright by Author(s) The 2016 International Academic Research Conference in Boston -Toronto 147
TREATMENT OF NICKEL-CONTAINING WASTEWATER USING
FENTON PROCESSES
M.-C. Lu* , J. Encarnacion**, and G. Peralta***
* Department of Environmental Resources Management, Chia-Nan University of Pharmacy and Science,
Tainan 71710, Taiwan, E-Mail:[email protected] ** Department of Chemical Engineering, University of the Philippines, Quezon City,
Philippines, E-Mail: [email protected] ***Department of Chemical Engineering, University of the Philippines, Quezon City,
Philippines, E-Mail: [email protected]
ABSTRACT
Abstract—Electro-Fenton (EF) and Convention Fenton (CF) processes were used to treat the
wastewater containing nickel and citric acid as its chelating agent. A stainless steel reactor was used for
all the experiments. For the EF experiments, the reactor also served as the cathode while the anode is
rod-type titanium metal coated with IrO2/RuO2. The nickel and COD removal were studied. Mere
coagulation of the wastewater was not enough to treat the wastewater. The COD removal was only
5.65% and there was no nickel removal after 4.5 hours of reaction time. This implies that potent
treatment for the non-biodegradability of the wastewater was required. In this study, EF and CF was done
to treat the wastewater followed by neutralization and settling to meet the pH requirement of possible
effluent discharge or succeeding treatment. A 1.5Fe2+:1Ni molar ratio for EF process gave the highest
COD removal at 96.88% though at the start there was marginal difference between EF and CF process.
As for nickel removal, a molar ratio of 1Fe2+:1Ni for EF process gave the highest removal at 98.31%. It
can be noted however that after the 8 hour reaction time and neutralization, the 1.5Fe2+:1Ni molar ratio
for EF had the highest nickel removal. Based on the results, organic and nickel containing wastewater
can be treated with EF process coupled with neutralization and settling.
Keywords—Advanced oxidation processes, Electro-Fenton process, Nickel
INTRODUCTION
Nickel is a widely used metal in electroplating and semiconductor industry. In the Philippines, Nickel
is the largest metal consumed according to the Department of Environment and Natural Resources (DENR,
2005). Conventional treatment cannot remove heavy metals in the wastewater, thus a more potent treatment
is needed to address the problem.
Advanced oxidation processes (AOPs) are now considered as an alternative treatment for toxic organic
and recalcitrant wastewaters. Fenton process uses ferrous ions and hydrogen peroxide to produce hydroxyl
radicals to oxidize different kinds of chemicals. Organic contaminants such as chlorobenzenes, nitrophenols
and aromatic amines have been proven to be effectively treated by Fenton process (Casero et al., 1997; Ewa,
1991; Sedlak and Andren, 1991). However the application has been limited because of the significant amount
of Fe(OH)3 that was generated that would further need separation process and disposal (Chang, et al., 2004).
EF process was developed to minimize or eliminate the disadvantage of Fenton process.
This study aimed to investigate the effect of varying initial Fe2+ dosage using EF and CF process coupled
with neutralization and settling on COD and nickel removal. This study may be able to help the industries
using nickel to have an alternative wastewater treatment.
MATERIAL AND METHODS
All experiments were done in batch mode with a total reaction time of 8 hours using a stainless steel
cylindrical reactor with a working volume of 1 liter and were operated at a constant electric current of 1A.
The reactor was provided with mixers for appropriate agitation and was connected to a Topward 33010D DC
© ICBTS Copyright by Author(s) The 2016 International Academic Research Conference in Boston -Toronto 148
power supply. The reactor serves as the cathode while the anode is a rod-type titanium metal coated with
IrO2/RuO2.
The synthetic wastewater was prepared using reagent grade NiSO4·6H2O (99-102%) and C6H8O7·H2O
(99.5-101%) from Riedel-de Haën that was diluted with deionized water, from a Millipore system with a
resistivity of 18.2 MΩcm-1, to the desired nickel and citric acid concentrations of 85 mM. The prepared
solution was adjusted to pH 2 using 1N NaOH that was prepared using reagent grade NaOH (99%) from
Riedel-de Haën and 20% H2SO4 that was prepared using reagent grade H2SO4 (acidimetric assay of 95-97%)
from Merck. pH was measured using a SUNTEX TS-1 portable pH/MV meter.
The effect of Fe2+ on nickel degradation and COD removal was determined by varying the concentration
of Fe2+ in the reactor from 85 mM to 128 mM with a multi-step addition of H2O2 and a total concentration of
2.1 M. H2O2 (35%) was obtained from Chang Chun Petrochemical Co., Ltd. and FeSO4·7H2O was obtained
from JT Baker.
The effect of coagulation on nickel degradation and COD removal was determined by using FeCl3
(iodometric assay of ≥ 98%) with a concentration of 85 mM that was obtained from Merck.
Samples were taken at determined time intervals for COD and Nickel analysis. The nickel concentration
was determined with an atomic absorbance spectrophotometer (Perkin Elmer AAnalyst 200). Chemical
oxygen demand (COD) was determined using closed reflux titrimetric method based on the Standard methods
(APHA, 1992).
RESULTS AND DISCUSSION
Coagulation process by FeCl3 failed to degrade the wastewater. After 4.5 hours of reaction time there
was no nickel removal and the COD reduction was just 5.65%. This implies that a more potent treatment is
required to treat the wastewater. Thus, EF and CF process were employed to treat the wastewater.
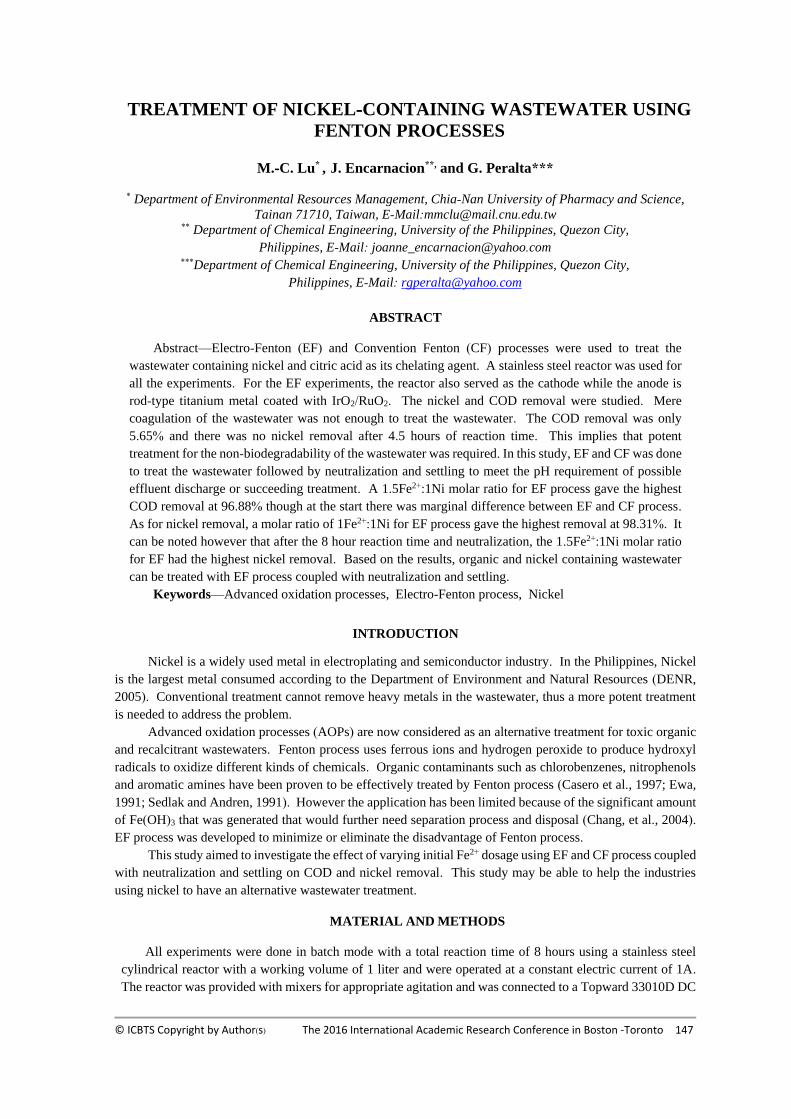
Nickel removal results for the EF and CF process are shown in Figure 1. Slow nickel removal occurred
during the first 6 hours of the reaction time. Only the 1.5Fe2+:1Ni molar ratio showed degradation for all of
the Fenton process. Longer reaction time or a higher Fe2+ concentration might be required to fully degrade
the nickel. The slow removal of nickel could possibly be the result of its strong attachment to its chelating
agent, citric acid. Another possibility is the very close electrode potential of nickel with iron. However,
neutralization and settling affected the nickel removal as shown in Table 1. The higher pH triggers the
precipitation of nickel in the wastewater.
Based on the principles of EF, the possible reactions that occurred are as follows:
On the anode side:
H2O → 2 H+ + ½ O2 + 2 e-
(1)
Fe2+ → Fe3+ + e-
(2)
On the cathode side
Fe3+ + e- → Fe2+
(3)
H2O + e- → ½ H2 + OH-
(4)
© ICBTS Copyright by Author(s) The 2016 International Academic Research Conference in Boston -Toronto 149
Figure 1: Effect of Fe2+ on nickel remaining. [Ni] = 85mM, [C6H8O7] = 85mM, [H2O2] = 2.1M, I = 1A
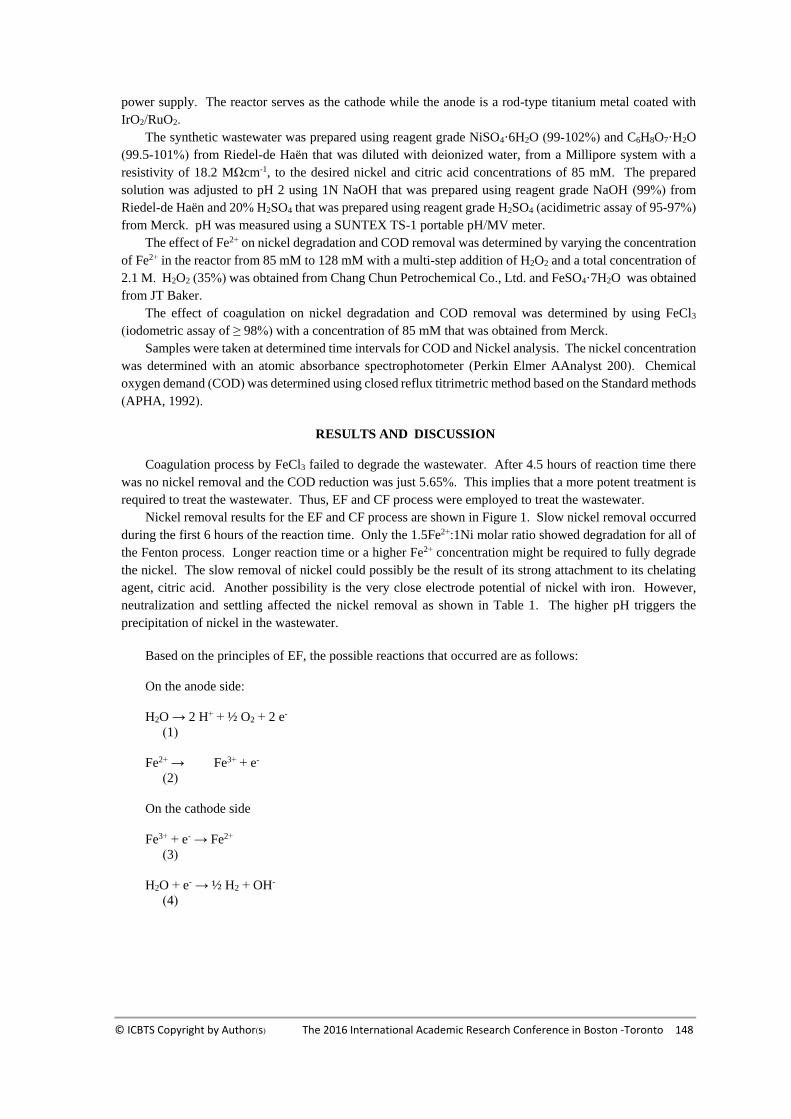
Table 1: Effect of Fe2+ on nickel removal after EF/CF process, neutralization and settling. [Ni] = 85mM,
[C6H8O7] = 85mM, [H2O2] = 2.1M, I = 1A
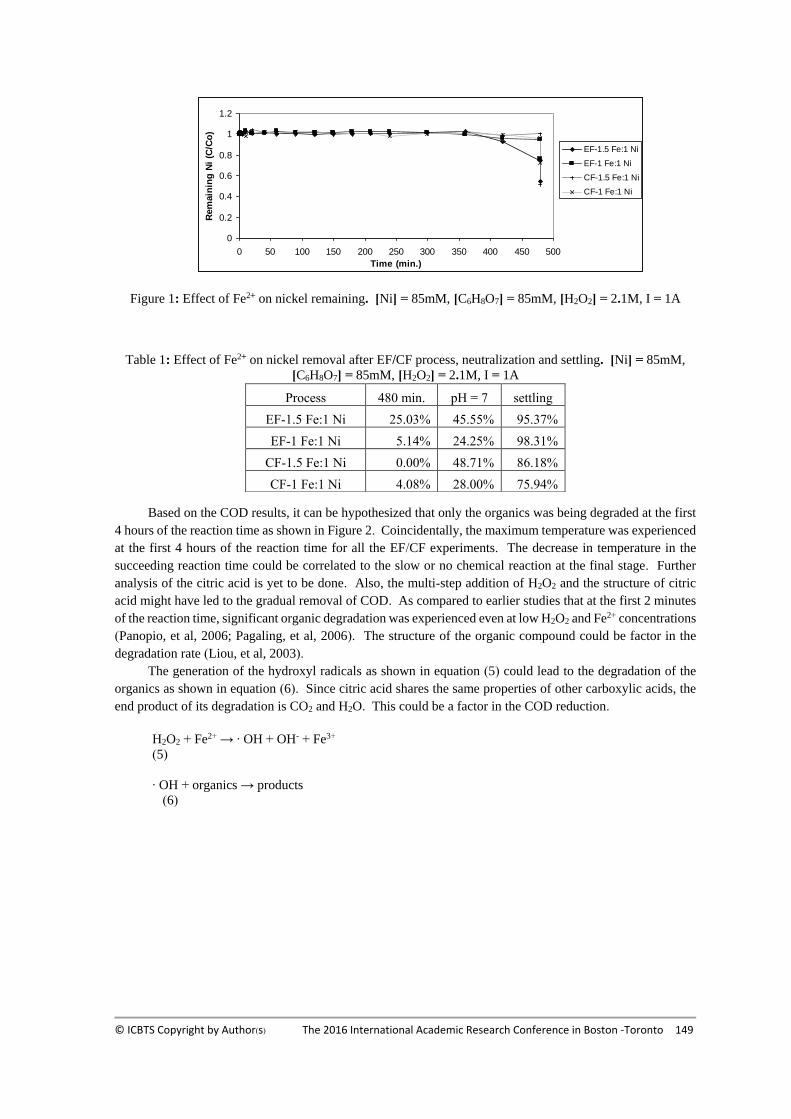
Based on the COD results, it can be hypothesized that only the organics was being degraded at the first
4 hours of the reaction time as shown in Figure 2. Coincidentally, the maximum temperature was experienced
at the first 4 hours of the reaction time for all the EF/CF experiments. The decrease in temperature in the
succeeding reaction time could be correlated to the slow or no chemical reaction at the final stage. Further
analysis of the citric acid is yet to be done. Also, the multi-step addition of H2O2 and the structure of citric
acid might have led to the gradual removal of COD. As compared to earlier studies that at the first 2 minutes
of the reaction time, significant organic degradation was experienced even at low H2O2 and Fe2+ concentrations
(Panopio, et al, 2006; Pagaling, et al, 2006). The structure of the organic compound could be factor in the
degradation rate (Liou, et al, 2003).
The generation of the hydroxyl radicals as shown in equation (5) could lead to the degradation of the
organics as shown in equation (6). Since citric acid shares the same properties of other carboxylic acids, the
end product of its degradation is CO2 and H2O. This could be a factor in the COD reduction.
H2O2 + Fe2+ → ∙ OH + OH- + Fe3+
(5)
∙ OH + organics → products
(6)
0
0.2
0.4
0.6
0.8
1
1.2
0 50 100 150 200 250 300 350 400 450 500
Time (min.)
Rem
ain
ing
Ni
(C/C
o)
EF-1.5 Fe:1 Ni
EF-1 Fe:1 Ni
CF-1.5 Fe:1 Ni
CF-1 Fe:1 Ni
Process 480 min. pH = 7 settling
EF-1.5 Fe:1 Ni 25.03% 45.55% 95.37%
EF-1 Fe:1 Ni 5.14% 24.25% 98.31%
CF-1.5 Fe:1 Ni 0.00% 48.71% 86.18%
CF-1 Fe:1 Ni 4.08% 28.00% 75.94%
© ICBTS Copyright by Author(s) The 2016 International Academic Research Conference in Boston -Toronto 150
Figure 2: COD removal. [Ni] = 85mM, [C6H8O7] = 85mM, [H2O2] = 2.1M, I = 1A
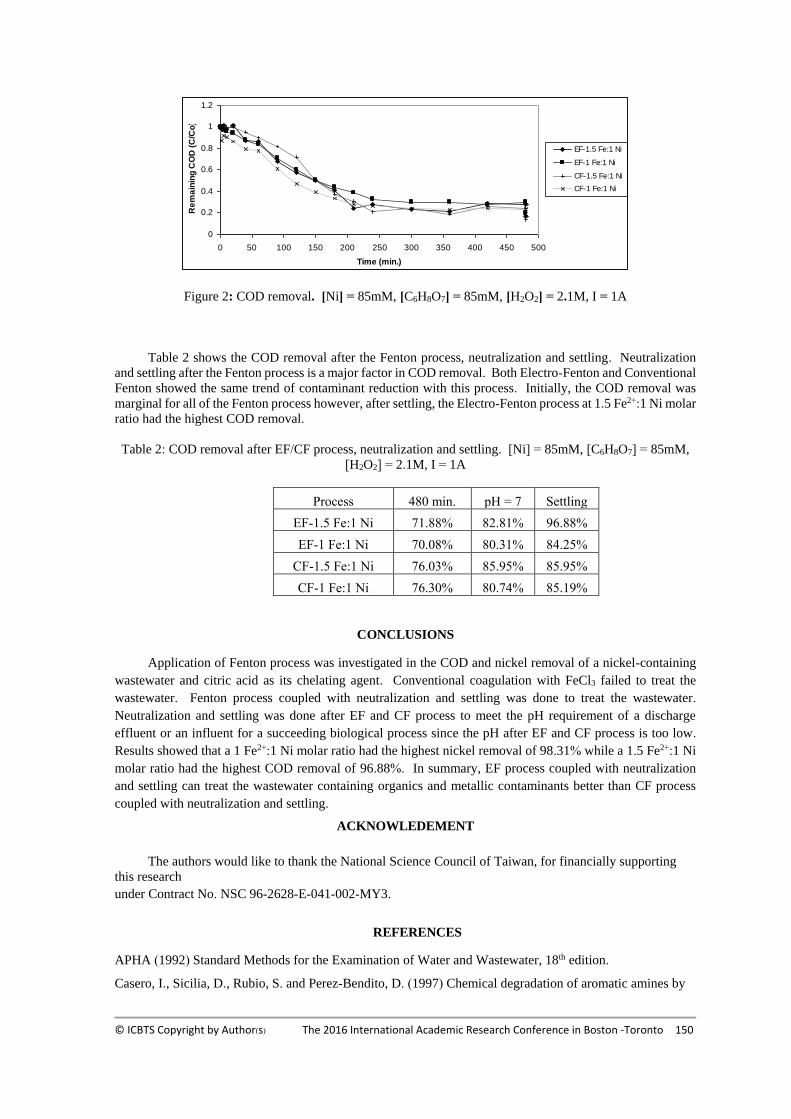
Table 2 shows the COD removal after the Fenton process, neutralization and settling. Neutralization
and settling after the Fenton process is a major factor in COD removal. Both Electro-Fenton and Conventional
Fenton showed the same trend of contaminant reduction with this process. Initially, the COD removal was
marginal for all of the Fenton process however, after settling, the Electro-Fenton process at 1.5 Fe2+:1 Ni molar
ratio had the highest COD removal.
Table 2: COD removal after EF/CF process, neutralization and settling. [Ni] = 85mM, [C6H8O7] = 85mM,
[H2O2] = 2.1M, I = 1A
Process 480 min. pH = 7 Settling
EF-1.5 Fe:1 Ni 71.88% 82.81% 96.88%
EF-1 Fe:1 Ni 70.08% 80.31% 84.25%
CF-1.5 Fe:1 Ni 76.03% 85.95% 85.95%
CF-1 Fe:1 Ni 76.30% 80.74% 85.19%
CONCLUSIONS
Application of Fenton process was investigated in the COD and nickel removal of a nickel-containing
wastewater and citric acid as its chelating agent. Conventional coagulation with FeCl3 failed to treat the
wastewater. Fenton process coupled with neutralization and settling was done to treat the wastewater.
Neutralization and settling was done after EF and CF process to meet the pH requirement of a discharge
effluent or an influent for a succeeding biological process since the pH after EF and CF process is too low.
Results showed that a 1 Fe2+:1 Ni molar ratio had the highest nickel removal of 98.31% while a 1.5 Fe2+:1 Ni
molar ratio had the highest COD removal of 96.88%. In summary, EF process coupled with neutralization
and settling can treat the wastewater containing organics and metallic contaminants better than CF process
coupled with neutralization and settling.
ACKNOWLEDEMENT
The authors would like to thank the National Science Council of Taiwan, for financially supporting
this research
under Contract No. NSC 96-2628-E-041-002-MY3.
REFERENCES APHA (1992) Standard Methods for the Examination of Water and Wastewater, 18th edition.
Casero, I., Sicilia, D., Rubio, S. and Perez-Bendito, D. (1997) Chemical degradation of aromatic amines by
0
0.2
0.4
0.6
0.8
1
1.2
0 50 100 150 200 250 300 350 400 450 500
Time (min.)
Re
ma
inin
g C
OD
(C
/Co
)
EF-1.5 Fe:1 Ni
EF-1 Fe:1 Ni
CF-1.5 Fe:1 Ni
CF-1 Fe:1 Ni
© ICBTS Copyright by Author(s) The 2016 International Academic Research Conference in Boston -Toronto 151
Fenton’s reagent. Wat. Res. 31, 1985-1995.
Chang, P.H., Huang, Y.H., Hsueh, C.L., Lu, M.C. and Huang, G.H. (2004) Treatment of Non-Biodegradable
Wastewater by Electro-Fenton Method. Wat. Sci. and Tech. 49(4), 213-218.
Department of Environment and Natural Resources (2005) Philippine Metallic Mineral Production CY 2005
versus CY 2004. http://www.denr.gov.ph/section-facts-figures
Ewa, L.K. (1991) Degradation of aqueous nitrophenols and nitrobenzene by means of the Fenton reaction.
Chemosphere 22, 549-536.
Liou, M.J., Lu, M.C. and Chen, J.N. (2003) Oxidation of explosives by Fenton and photo-Fenton processes.
Wat. Res. 37, 3172-3179.
Pagaling, E.D., Peralta, G.L. and Lu, M.C. (2006) Effect of H2O2 on Aniline Degradation using Two
Different Electro-Fenton Reactors. Proceedings of 2006 International Conference on Environmental
Quality, Concern, Control and Conservation A-125-A-131.
Panopio, L.V., Peralta, G.L. and Lu, M.C. (2006) Chemical Oxidation of m-Phenylenediamine by Electro-
Fenton Process. Proceedings of 2006 International Conference on Environmental Quality, Concern, Control
and Conservation A-117-A-123.
Sedlak, D.L. and Andren, A.W. (1991) Oxidation of chlorobenzene with Fenton’s reagent. Envi. Sci. Tech. 25,
777-782.
© ICBTS Copyright by Author(s) The 2016 International Academic Research Conference in Boston -Toronto 152
A CONCEPTUAL MODEL OF E-COMMERCE SYSTEMS SUCCESS
IN THE CONTEXT OF PHYSICAL PRODUCT E-TAILING
Yi-Shun Wang
Department of Information Management
National Changhua University of Education, Taiwan
Email: [email protected]
Hsin-Hui Lin
Department of Distribution Management
National Taichung University of Science and Technology, Taiwan
Shin-jeng Lin
Department of Management, Leadership and Information Systems
Le Moyne College, Syracuse, USA
Ci-Rong Li
College of Management
Jilin University, China
Hsien-Ta Li
Department of Information Management
National Changhua University of Education, Taiwan
ABSTRACT
The main purpose of the current study is to develop and validate a customer value-centric e-commerce
success model specific to the physical product e-tailing context based on the existing information
systems/e-commerce success models and marketing and consumer behavior literature. The proposed
e-tailing success model describes the interrelationships among nine dimensions: Information Quality, System
Quality, Service Quality, Product Quality, Perceived Price, Perceived Value, User Satisfaction, Intention to
Reuse, and Electronic Word-of-Mouth. Data will be collected to test the research model using the partial
least squares (PLS) approach. The results of this study will provide some important theoretical and practical
implications for physical product e-tailing.
Keywords: Information systems/e-commerce success model, physical product, e-tailing, customer perceived
value
INTRODUCTION
The emergence of the Internet as an electronic marketplace has had a profound impact on the world
economy and the way business is conducted. Purchasing commodities via cyber stores provides greater
convenience and economy as compared to physical stores. The widespread use of electronic shopping has
gradually altered the commercial styles of our whole society.
© ICBTS Copyright by Author(s) The 2016 International Academic Research Conference in Boston -Toronto 153
Previous studies have investigated different e-commerce settings, including business-to-customer,
customer-to-customer, business-to-business, group-buying, individual purchasing, products, services,
purchase situations, and re-purchase situations (e.g., Cheng and Huang, 2013; Fang et al., 2011; Gullen and
Taylor, 2009; Ha et al., 2010; Wang et al., 2013). The customer-focused era of information systems (IS)
evolution puts emphasis on customer value/impacts. In this era, measuring success of customer-facing
systems (e.g., e-commerce systems) constitutes a prominent issue. Taking the context of an information
system as well as its users and other stakeholders into consideration, the need to develop customized
measures of IS success has been stressed (Petter et al., 2012). In this regard, customized forms of measures
are needed to guide e-commerce proprietors to enhance their e-commerce systems.
The development of e-commerce systems success measures has been addressed by previous research.
Researchers have addressed several fundamental issues, including what factors influence IS success (Petter
et al., 2013), the extent to which measures of IS success can be applied to the e-commerce context (e.g.,
Wang, 2008), and which e-commerce success criteria counts most (Ramanathan, 2010). As suggested by
Amin and Nayak (2010), key theoretical perspectives underpinning IS success measures research include the
information success model (DeLone and McLean, 1992), the technology acceptance model (Davis et al.,
1989), the theory of planned behavior (Ajzen, 2002), and the unified theory of acceptance and use of
technology (Venkatesh et al., 2003). In particular, the DeLone and McLean (2003) IS success model has
been a popular choice as the theoretical foundation to assess the success of e-commerce systems (e.g., Chen
et al., 2013; DeLone and McLean, 2004; Fang et al., 2011; Lin et al., 2011; Sun, 2010; Wang, 2008).
Following the rationale of developing customized measures (Petter et al., 2012), the purpose of this
study is to establish a customer-focused e-commerce success model for physical product e-tailing, enriching
the DeLone and McLean approach of measuring e-commerce systems success through customer-focused,
context-specific theorizing. As for customer-focused theorizing, it emphasizes the role of customer perceived
value, producing a customer value-centric model. In this model, customer perceived value plays a mediating
role in transforming e-tailers’ quality and price attributes into customers' loyalty. With regard to
context-specific theorizing, it produces a model for the specific context of physical product e-tailing.
The remainder of this article is organized as follows. The next section reviews previous IS systems
and e-commerce systems success models as well as relevant marketing and consumer behavior literature.
Developing from previous studies, a customer value-centric e-commerce systems success model for the
specific context of physical product e-tailing is proposed. Then, it discusses the methodology of this study
© ICBTS Copyright by Author(s) The 2016 International Academic Research Conference in Boston -Toronto 154
and presents the results of hypothesis-testing. After that, it addresses the theoretical and practical
implications of this studies' findings.
THEORETICAL BACKGROUND
2.1 The development of IS/e-commerce systems success models
DeLone and McLean (1992) review different IS success measures and propose a model of
interrelationships between six IS success measures: System Quality, Information Quality, IS Use, User
Satisfaction, Individual Impact, and Organization Impact. Since the publication of this model, some
researchers have responded to the call for further development of this model. For instance, Pitt et al. (1995)
suggest that Service Quality should be added to the DeLone and McLean (1992) model. In addition, Seddon
(1997) points out that IS Use in the DeLone and McLean (1992) model has potentially ambiguous meanings,
and thus proposes an alternative model that replaces IS Use with Perceived Usefulness.
In response to these critiques, DeLone and McLean (2003) propose an updated model of IS success by:
(1) adding Service Quality as a new dimension in the IS success model, (2) considering Use and Intention to
Use as important measures of IS success, and (3) grouping individual and organizational impact into a single
impact category called Net Benefits. DeLone and McLean (2004) then utilize two cases to demonstrate that
their 2003 updated IS success model can be adapted to the e-commerce context and be used to guide the
specification of e-commerce systems success metrics.
More recently, Wang (2008) argues that the updated DeLone and McLean (2003) model is a generic
model and suffers from three limitations. First, the Net Benefits measure in the model is conceptually too
broad to define. Second, Use in the model does not reconcile itself with Seddon’s (1997) Perceived
Usefulness measure and the belief-attitude-behavior chain in the IS literature that explains system use
behavior (e.g., Davis, 1989). Third, the nomological structure of the model is not fully consistent with the
quality-value-satisfaction-loyalty chain in the marketing and consumer behavior literature. To address these
issues, Wang (2008) re-specifies the updated DeLone and McLean model and validates it in the context of
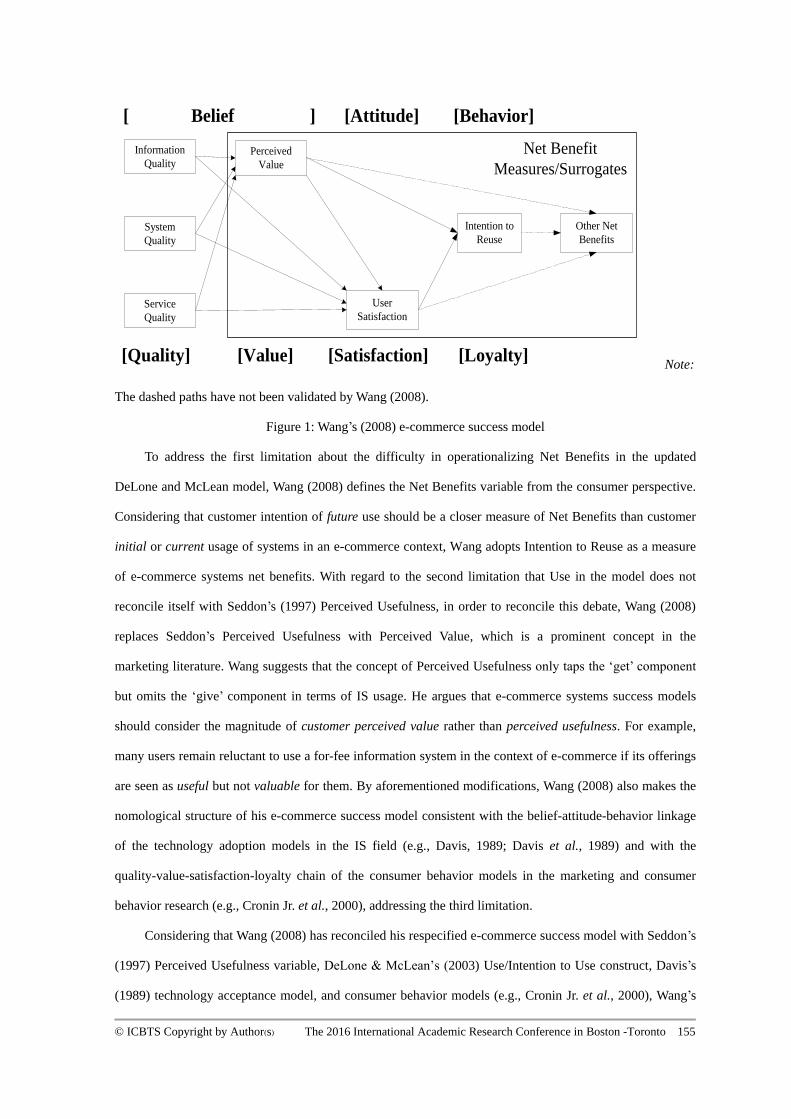
e-commerce systems success (see Figure 1).
© ICBTS Copyright by Author(s) The 2016 International Academic Research Conference in Boston -Toronto 155
Perceived
Value
Intention to
Reuse
User
Satisfaction
Information
Quality
System
Quality
Service
Quality
[ Belief ] [Attitude] [Behavior]
[Quality] [Value] [Satisfaction] [Loyalty]
Other Net
Benefits
Net Benefit
Measures/Surrogates
Note:
The dashed paths have not been validated by Wang (2008).
Figure 1: Wang’s (2008) e-commerce success model
To address the first limitation about the difficulty in operationalizing Net Benefits in the updated
DeLone and McLean model, Wang (2008) defines the Net Benefits variable from the consumer perspective.
Considering that customer intention of future use should be a closer measure of Net Benefits than customer
initial or current usage of systems in an e-commerce context, Wang adopts Intention to Reuse as a measure
of e-commerce systems net benefits. With regard to the second limitation that Use in the model does not
reconcile itself with Seddon’s (1997) Perceived Usefulness, in order to reconcile this debate, Wang (2008)
replaces Seddon’s Perceived Usefulness with Perceived Value, which is a prominent concept in the
marketing literature. Wang suggests that the concept of Perceived Usefulness only taps the ‘get’ component
but omits the ‘give’ component in terms of IS usage. He argues that e-commerce systems success models
should consider the magnitude of customer perceived value rather than perceived usefulness. For example,
many users remain reluctant to use a for-fee information system in the context of e-commerce if its offerings
are seen as useful but not valuable for them. By aforementioned modifications, Wang (2008) also makes the
nomological structure of his e-commerce success model consistent with the belief-attitude-behavior linkage
of the technology adoption models in the IS field (e.g., Davis, 1989; Davis et al., 1989) and with the
quality-value-satisfaction-loyalty chain of the consumer behavior models in the marketing and consumer
behavior research (e.g., Cronin Jr. et al., 2000), addressing the third limitation.
Considering that Wang (2008) has reconciled his respecified e-commerce success model with Seddon’s
(1997) Perceived Usefulness variable, DeLone & McLean’s (2003) Use/Intention to Use construct, Davis’s
(1989) technology acceptance model, and consumer behavior models (e.g., Cronin Jr. et al., 2000), Wang’s
© ICBTS Copyright by Author(s) The 2016 International Academic Research Conference in Boston -Toronto 156
(2008) model instead of other e-commerce systems success models (e.g, DeLone and McLean, 2003) is
chosen as the theoretical basis of this study. However, there are two shortcomings in the Wang’s (2008)
model. First, while Wang’s model emphasizes the importance of Perceived Value, it overlooks certain crucial
antecedents and consequences of Perceived Value in the context of e-commerce. As for antecedents, his
model only includes three dimensions of Perceived Quality (i.e., Information Quality, System Quality, and
Service Quality) and may therefore omit other potential antecedents of Perceived Value, such as Perceived
Price and Product Quality (e.g., Chen and Dubinsky, 2003; Gupta and Kim, 2010). With regard to
consequences, Wang's model only considers User Satisfaction and Intention to Reuse as the consequences of
Perceived Value, and it may consequently neglect other potential consequences of Perceived Value, such as
electronic word-of-mouth (eWOM). For instance, Valvi and Fragkos (2012) implicitly treat Perceived Value
as an antecedent of recommendation. Second, as a generic model, Wang’s model may omit some important
success measures unique to specific e-commerce contexts. The various e-commerce contexts (e.g., digital
service, digital product, and physical product) may require different e-commerce systems success models.
Lin (2009) postulates that the e-commerce contexts can be addressed in terms of types of tasks, technologies,
consumers, and products. Take products for example, product types can affect differently how the usability
issues of the web sites are perceived, which in term influence web site use behavior and then the purchase
behavior (Venkatesh and Agarwal, 2006). Furthermore, since digital products (e.g., online music and video
on demand) and digital service (e.g., banking and stock exchange) can be delivered through the Internet, the
characteristics and website success factors of these products are different from those of physical products.
Thus, e-commerce web sites with different product types may require their own unique e-commerce systems
success measures, and this study focuses only on developing an e-commerce success model for the context
of physical product e-tailing.
To address the two shortcomings of Wang’s model, firstly, this study enhances the theoretical
richness of Perceived Value in the context of e-commerce systems success by reviewing literature to identify
antecedents and consequences of Perceived Value that are omitted by Wang's model. Then, this study
fine-tunes his generic e-commerce systems success model by putting an emphasis on the specific context
of physical product e-tailing.
2.2 Perceived value
Kim et al. (2012) integrate the logic of the quality-value-satisfaction-loyalty chain (e.g., Hellier et al.,
2003) with the e-commerce success model of DeLone and McLean (2004), and specify the
© ICBTS Copyright by Author(s) The 2016 International Academic Research Conference in Boston -Toronto 157
quality-value-customer satisfaction-repurchase intention chain for analyzing internet shopping. In their study,
quality attributes consist of system, information and service quality, while internet shopping value consists of
utilitarian and hedonic shopping value. They suggest that superior product/service quality is insufficient for
predicting repurchase intention in the context of e-commerce, emphasizing the role of internet shopping
value. In a similar vein, the concept of customer perceived value has been applied to explaining online
customer behavior or measuring e-commerce systems success (e.g., Chen and Dubinsky, 2003; Gupta and
Kim, 2010; Wang, 2008;). Zeithaml (1988, p.14) defines Perceived Value as “the consumer’s overall
assessment of the utility of a product based on perceptions of what is received and what is given”.
Parasuraman and Grewal (2000) suggest that Perceived Value is a function of a ‘get’ component (i.e., the
benefits a buyer derives from a seller’s offering) and a ‘give’ component (i.e., the buyer’s monetary and
nonmonetary costs of acquiring the offering). Thus, Perceived Value has been conceptualized as essentially a
trade-off between perceived benefits and perceived cost. This study follows this line of thought, utilizing the
notion of Perceived Value to investigate e-commerce systems success in the specific context of physical
product e-tailing.
2.3 The antecedents of perceived value: product quality and perceived price
Perceived product quality is a critical antecedent of perceived customer value (Chen and Dubinsky,
2003). It has been defined as 'the consumer’s judgment about a product’s overall excellence or superiority'
(Tsiotsou, 2006, p. 210). In addition to Information Quality, System Quality, and Service Quality (Wang,
2008), Product Quality may be another possible antecedent of Perceived Value in the context of physical
product e-tailing, since it is one of the benefits a customer can derive from an e-tailer’s offering, being a ‘get’
component of Perceived Value.
Achieving price leadership has been proposed as an effective way to enhance customer value (Porter,
1985). Perceived Price is a critical antecedent of Perceived Value (Gupta and Kim, 2010). Zeithaml (1988)
suggests that Perceived Sacrifice, the “give” component of Perceived Value, includes both perceived
monetary price and perceived non-monetary price. Perceived Price has been considered from the monetary
perspective and thus defined as the perceived level of (monetary) price at a vendor (i.e., objective price) in
comparison with the customer’s reference price (Gupta and Kim, 2010; Dodds et al., 1991). In the context of
physical product e-tailing, Perceived Price may be a possible antecedent of Perceived Value, since it
represents the customer perception of monetary cost incurred in obtaining the desired benefits from an
e-tailer’s offering, being a “give” component of Perceived Value.
© ICBTS Copyright by Author(s) The 2016 International Academic Research Conference in Boston -Toronto 158
2.4 The consequence of perceived value: electronic word-of-mouth
Within the Internet context, online customer reviews or electronic word-of-mouth (eWOM) emerge as
a form of customer-created information influencing purchase decisions of other customers (Lee et al., 2011).
Chen et al. (2012, p. 934) suggest that eWOM has been understood as 'online customers or potential
customers often seek out information on products or companies and share their knowledge, experiences and
opinions, both in a positive and negative manner'. Researchers have also suggested that channels for
disseminating eWOM include e-mail, virtual communities, online forums, review websites, retailer websites,
e-bulletin board systems, newsgroups, industry portal discussion areas, social networking sites, etc (e.g.,
Cheung and Lee, 2012; Chen et al., 2012).
Valvi and Fragkos (2012) implicitly treat recommendation as a consequence of Perceived Value. To
allow it to serve as an e-tailing systems success measure, eWOM in this study refers to positive eWOM (e.g.,
recommendation) only. Considering that E-tailers may benefit from positive eWOM as it may attract new
customers to purchase their retail products, eWOM is not only a consequence of Perceived Value but also a
form of Net Benefits. Importantly, because eWOM communications possess unprecedented scalability and
speed of diffusion and are more persistent and accessible than traditional WOM (Cheung and Lee, 2012), a
customer’s online recommendation behavior creates more net benefits for an e-commerce system than does a
customer’s repurchase behavior. Consequently, eWOM is seen as a closer measure of physical product
e-tailing systems success than Intention to Reuse.
RESEARCH MODEL AND HYPOTHESES
3.1 Research model
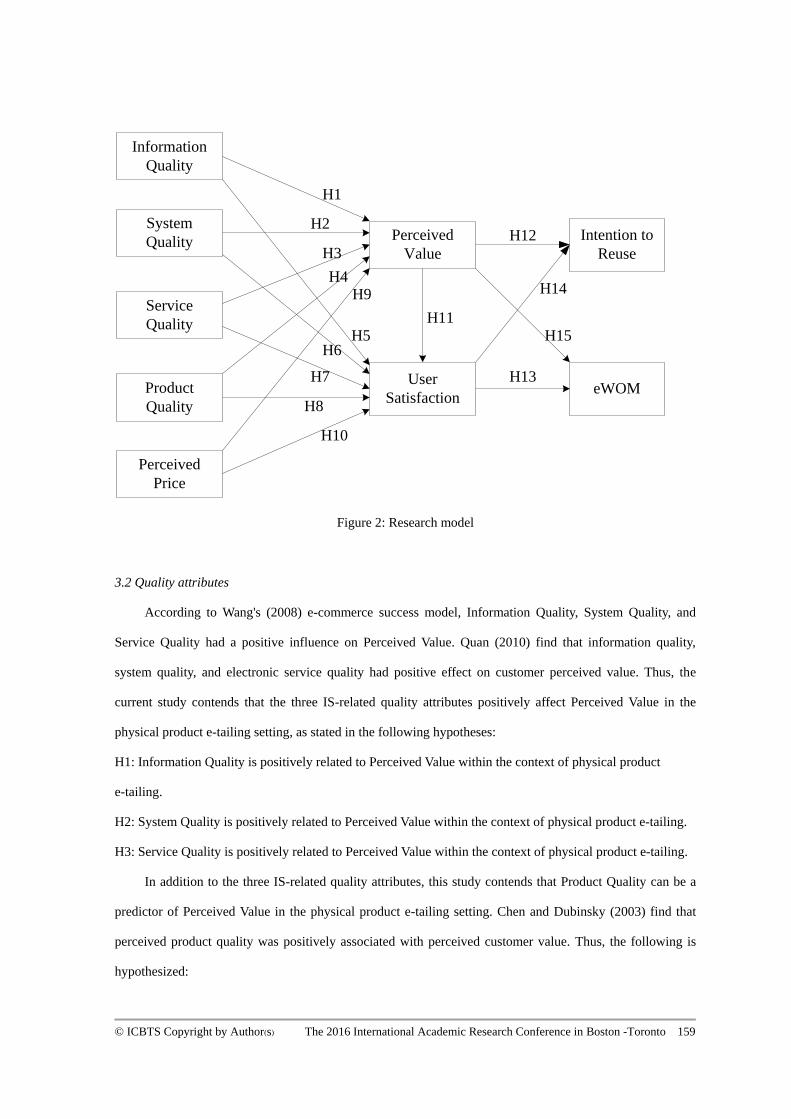
Based on the discussions above, this study proposes a research model that represents a customer
value-centric e-commerce systems success model for the context of physical product e-tailing (see Figure 2).
In other words, this model incorporates additional antecedents of Perceived Value (i.e., Product Quality and
Perceived Price) and an additional form of Net Benefits (i.e., eWOM) into Wang's (2008) generic model,
seeking to enrich the DeLone and McLean approach through customer-focused, context-specific theorizing.
Thus, in this model, customers' Perceived Value plays a crucial mediating role in transforming e-tailers’
quality and price attributes into customers' affective response (i.e., User Satisfaction) and behavioral
intentions (i.e., Intention to Reuse and eWOM). In addition, following Wang’s (2008) suggestion, this study
measures the success variables in a post-use situation, since a customer possessing first-hand experience
with an e-commerce system would be able to form value and satisfaction evaluations of the system.
© ICBTS Copyright by Author(s) The 2016 International Academic Research Conference in Boston -Toronto 159
Perceived
Value
Intention to
Reuse
User
Satisfaction
Information
Quality
System
Quality
Service
Quality
Product
Quality
Perceived
Price
eWOM
H1
H2
H3
H4
H5H6
H7
H8
H9
H10
H11
H12
H13
H14
H15
Figure 2: Research model
3.2 Quality attributes
According to Wang's (2008) e-commerce success model, Information Quality, System Quality, and
Service Quality had a positive influence on Perceived Value. Quan (2010) find that information quality,
system quality, and electronic service quality had positive effect on customer perceived value. Thus, the
current study contends that the three IS-related quality attributes positively affect Perceived Value in the
physical product e-tailing setting, as stated in the following hypotheses:
H1: Information Quality is positively related to Perceived Value within the context of physical product
e-tailing.
H2: System Quality is positively related to Perceived Value within the context of physical product e-tailing.
H3: Service Quality is positively related to Perceived Value within the context of physical product e-tailing.
In addition to the three IS-related quality attributes, this study contends that Product Quality can be a
predictor of Perceived Value in the physical product e-tailing setting. Chen and Dubinsky (2003) find that
perceived product quality was positively associated with perceived customer value. Thus, the following is
hypothesized:
© ICBTS Copyright by Author(s) The 2016 International Academic Research Conference in Boston -Toronto 160
H4: Product Quality is positively related to Perceived Value within the context of physical product e-tailing.
Based on previous IS/e-commerce success models (e.g., DeLone and McLean, 2003, 2004; Wang,
2008), Information Quality, Systems Quality, and Service Quality are proposed to have positive influences
on User Satisfaction. Empirical evidence also shows that the three IS-related quality attributes had a
significant positive effect on User Satisfaction (e.g., Lin et al., 2011; Quan, 2010; Wang, 2008; cf. Chen et
al., 2013). Thus, this study contends that Information Quality, Systems Quality, and Service Quality
positively influence User Satisfaction in the physical product e-tailing setting.
H5: Information Quality is positively related to User Satisfaction within the context of physical product
e-tailing.
H6: System Quality is positively related to User Satisfaction within the context of physical product e-tailing.
H7: Service Quality is positively related to User Satisfaction within the context of physical product e-tailing.
Based on the expectation disconfirmation theory (Anderson, 1973; Oliver, 1977, 1980), if product
performance exceeds a customer’s expectations (positive disconfirmation), post-purchase satisfaction will
result; if product performance falls short of expectations (negative disconfirmation), the consumer is likely
to be dissatisfied. Thus, a high extent of perceived product quality or performance may lead to positive
disconfirmation, thereby resulting in higher customer satisfaction. Lin et al. (2011) find that product quality
had a positive influence on online user satisfaction. Tsiotsou (2006) also find that perceived product quality
was positively related to consumer overall satisfaction. Therefore, the following is hypothesized:
H8: Product Quality is positively related to User Satisfaction within the context of physical product e-tailing.
3.3 The price attribute
Gupta and Kim (2010) find that Perceived Price negatively influenced Perceived Value for online
customers. In the context of on-line content services, Wang et al. (2013) find that Perceived Fee was
negatively related to Perceived Value. In other words, customers who perceive the product price of an
e-tailer to be on the low end tend to have a higher perception of customer value than those who perceive the
product price to be on the high end. Thus, the following hypothesis is tested:
H9: Perceived Price is negatively related to Perceived Value within the context of physical product e-tailing.
Lin et al. (2011) find that Perceived Price had a positive influence on online user satisfaction. However,
this study conjectures that if a product price is higher, customers’ expectations of product quality will also be
© ICBTS Copyright by Author(s) The 2016 International Academic Research Conference in Boston -Toronto 161
higher. Inspired by the expectation disconfirmation theory (Oliver, 1977, 1980), it can also be speculated that
product performance is more likely to fall short of higher product quality expectations (negative
disconfirmation) as compared to lower product quality expectations. Thus, a perceived higher price is more
likely to result in negative disconfirmation, thereby being more likely to bring about lower customer
satisfaction. In a nutshell, the following is hypothesized:
H10: Perceived Price is negatively related to User Satisfaction within the context of physical product
e-tailing.
3.4 Perceived value
Fishbein and Ajzen (1975) suggests that affect is influenced by cognition. Similarly, being consistent
with Bagozzi’s (1992) appraisal→emotional response→coping framework, Wang (2008) supports that the
cognitively-oriented value appraisal precedes the affectively-oriented satisfaction response. He finds that
Perceived Value had a positive influence on User Satisfaction. Quan (2010) also find that Perceived Value
had a positive effect on customer satisfaction. Hence, this study tests the following hypothesis:
H11: Perceived Value is positively related to User Satisfaction within the context of physical product
e-tailing.
Kuo et al. (2009) find that Perceived Value positively influenced post-purchase intention in mobile
value-added services. Perceived Value had a positive effect on Intention to Reuse in the e-commerce context
(Wang, 2008). This means that a customer’s perception of the value received from a supplier can influence
the customer's intention to patronize the supplier again. If their Perceived Value is higher, their Intention to
Reuse tends to be higher. Thus, this study makes the following hypothesis:
H12: Perceived Value is positively related to Intention to Reuse within the context of physical product
e-tailing.
Valvi and Fragkos (2012) implicitly treat perceived value as an antecedent of recommendation.
Previous studies provide empirical support for the relationship between perceived value and post-purchase
WOM in the contexts of mobile value-added services (Kuo et al., 2009) and a software product (Gruen et al.,
2006). Thus, it is expected that customers who find an e-tailer to deliver a higher level of value are more
likely to recommend the e-tailer to other customers. As such, this study proposes the following hypothesis:
H13: Perceived Value is positively related to eWOM within the context of physical product e-tailing.
3.5 User satisfaction
Wang (2008) find that User Satisfaction positively affected Intention to Reuse in the e-commerce
© ICBTS Copyright by Author(s) The 2016 International Academic Research Conference in Boston -Toronto 162
context. In the context of internet shopping websites involving e-retailers and on-line shoppers, Rose et al.
(2012) find that the greater the level of on-line shopping satisfaction, the greater the level of on-line
repurchase intention. In the context of on-line travel services, Ha et al. (2010) also find that satisfaction had
a positive influence on re-purchase intention. Thus, this study makes the following hypothesis:
H14: User Satisfaction is positively related to Intention to Reuse within the context of physical product
e-tailing.
Satisfaction is regarded as an antecedent of WOM activity ( de Matos and Rossi, 2008). Chen et al.
(2012) find that satisfaction had a positive influence on eWOM of Web 2.0 users. Kassim and Ismail (2009)
find that customer satisfaction was positively related to WOM in e-commerce settings. Therefore, it can be
anticipated that consumers with a higher level of satisfaction tend to have a stronger intention to recommend
the purchased product than those with a lower level of satisfaction. In short, the following hypothesis is
proposed:
H15: User Satisfaction is positively related to eWOM within the context of physical product e-tailing.
CONCLUSIONS AND FUTURE RESEARCH
Based on the existing information systems/e-commerce success models and marketing and consumer
behavior literature, this study attempts to develop and validate a customer value-centric e-commerce success
model specific to the physical product e-tailing context. The proposed e-tailing success model describes the
interrelationships among nine dimensions: Information Quality, System Quality, Service Quality, Product
Quality, Perceived Price, Perceived Value, User Satisfaction, Intention to Reuse, and Electronic
Word-of-Mouth. Data will be collected to test the research model using the partial least squares (PLS)
approach. The results of this study will provide some important theoretical and practical implications for
physical product e-tailing.
REFERENCES
Ajzen, I. (2002), "Perceived behavioral control, self-efficacy, locus of control, and the theory of planned
behavior", Journal of Applied Social Psychology, Vo. 32 No. 4, pp. 665-683.
Ajzen, I. and Fishbein, M. (1980), Understanding Attitudes and Predicting Social Behavior, Prentice-Hall,
Englewood Cliffs, NJ.
Amin, M.A.M. and Nayak, R. (2010), "Theoretical model of user acceptance: in the review of measuring
success in web personalization", in Forbrig, P., Paternó, F. and Pejtersen, A.M. (Eds.),
Human-Computer Interaction: Second IFIP TC 13 Symposium, HCIS 2010, Held as Part of WCC 2010,
Brisbane, Australia, September 20-23, 2010, Proceedings, Springer Berlin Heidelberg, Germany, pp.
255-264.
Anderson, R.E. (1973), "Consumer dissatisfaction: the effect of disconfirmed expectancy on perceived
© ICBTS Copyright by Author(s) The 2016 International Academic Research Conference in Boston -Toronto 163
product performance", Journal of Marketing Research, Vol.10 No.1, pp. 38-44.
Anderson, R.E. and Srinivasan, S.S. (2003), "E-satisfaction and e-loyalty: a contingency framework",
Psychology and Marketing, Vol. 20 No. 2, pp. 123-138.
Bagozzi, R.P. (1992), "The self-regulation of attitudes, intentions, and behavior", Social Psychology
Quarterly, Vol. 55 No. 2, pp. 178-204.
Bohmstedt, G.W. (1970), "Reliability and validity assessment in attitude measurement", in Summers, G. F.
(Ed.), Attitude Measurement, Rand-McNally, Chicago, IL, pp. 80-99.
Chen, J.V., Rungruengsamrit, D., Rajkumar, T.M. and Yen, D.C. (2013), " Success of electronic commerce
success Web sites: a comparative study in two countries", Information and Management, Vol. 50 No. 6,
pp. 344-355.
Chen, S.C., Yen, D.C. and Hwang, M.I. (2012), "Factors influencing the continuance intention to the usage
of Web 2.0: an empirical study", Computers in Human Behavior, Vol. 28 No. 3, pp. 933-941.
Chen, Z. and Dubinsky, A.J. (2003), "A conceptual model of perceived customer value in e-commerce: a
preliminary investigation", Psychology and Marketing, Vol. 20 No. 4, pp. 323-347.
Cheung, C.M.K., and Lee, M.K.O. (2012), "What drives consumers to spread electronic word of mouth in
online consumer-opinion platforms", Decision Support System, Vol. 53 No. 1, pp. 218-225.
Cheng, H.H. and Huang, S.W. (2013), " Exploring antecedents and consequence of online group-buying
intention: an extended perspective on theory of planned behavior", International Journal of
Information Management, Vol. 33 No. 1, pp. 185-198.
Cronin Jr., J.J., Brady, M.K. and Hult, G.T.M. (2000), "Assessing the effects of quality, value, and customer
satisfaction on consumer behavioral intentions in service environments", Journal of Retailing, Vol. 76
No. 2, pp. 193-218.
Davis, F.D. (1989), "Perceived usefulness, perceived ease of use, and user acceptance of information
technology", MIS Quarterly, Vol. 13 No. 3, pp. 318-339
Davis, L.D., Bagozzi, R.P. and Warshaw, P.R. (1989), "User acceptance of computer technology: a
comparison of two theoretical models", Management Science, Vol. 35 No. 8, pp. 982-1003.
DeLone, W.H. and McLean, E.R. (1992), "Information systems success: the quest for the dependent
variable", Information Systems Research, Vol. 3 No. 1, pp. 60-95.
DeLone, W.H. and McLean, E.R. (2003), "The DeLone and McLean model of information systems success:
a ten-year update", Journal of Management Information Systems, Vol. 19 No. 4, pp. 9-30.
DeLone, W.H. and McLean, E.R. (2004), "Measuring e-commerce success: applying the DeLone & McLean
information systems success model", International Journal of Electronic Commerce, Vol. 9 No. 1, pp.
31-47.
de Matos, C.A. and Rossi, C.A.V. (2008), "Word-of-mouth communications in marketing: a meta-analytic
review of the antecedents and moderators", Journal of the Academy of Marketing Science, Vol. 36 No.
4, pp. 578-596.
Dodds, W.B., Monroe, K.B. and Grewal, D. (1991), "Effects of price, brand, and store information on
buyers’ product evaluations", Journal of Marketing Research, Vol. 28 No. 3, pp. 307-319.
Doll, W.J. and Torkzadeh, G. (1988), "The measurement of end-user computing satisfaction", MIS Quarterly,
Vol. 12 No. 2, pp. 259-274.
Fang, Y.H., Chiu, C.M. and Wang, E.T.G. (2011), "Understanding customers' satisfaction and repurchase
intentions: an integration of IS success model, trust, and justice", Internet Research, Vol. 21 No. 4, pp.
479-503.
Fishbein, M. and Ajzen, I. (1975), Beliefs, Attitude, Intention and Behavior: An Introduction to Theory and
Research, Addison-Wesley, Reading, MA.
Fornell, C. and Larcker, D.F. (1981), "Evaluating structural equation models with unobservable variables
and measurement error", Journal of Marketing Research, Vol. 18 No. 1, pp. 39-50.
© ICBTS Copyright by Author(s) The 2016 International Academic Research Conference in Boston -Toronto 164
Garvin, D.A. (1984), "What does “product quality” really mean?", Sloan Management Review, Vol. 26 No. 1,
pp. 25-43.
Grewal, D., Monroe, K.B. and Krishnan, R. (1998), "The effects of price-comparison advertising on buyers’
perceptions of acquisition value, transaction value and behavioral intentions", Journal of Marketing,
Vol. 62 No. 2, pp. 46-59.
Gruen, T.W., Osmonbekov, T. and Czaplewski, A.J. (2006), "eWOM: the impact of customer-to-customer
online know-how exchange on customer value and loyalty", Journal of Business Research, Vol. 59 No.
4, pp. 449-456.
Gullen, A.J. and Taylor, M. (2009), "Critical success factors for B2B e-commerce use within the UK NHS
pharmaceutical supply chain", International Journal of Operations and Production Management, Vol.
29 No. 11, pp. 1156-1185.
Gupta, S. and Kim, H.W. (2010), "Value-driven internet shopping: the mental accounting theory perspective",
Psychology and Marketing, Vol. 27 No. 1, pp. 13-35.
Ha, H.Y., Janda, S. and Muthaly, S.K. (2010), "A new understanding of satisfaction model in e-re-purchase
situation", European Journal of Marketing, Vol. 44 No. 7/8, pp. 997-1016.
Hair, J.T., Anderson, R.E., Tatham, R.L. and Black, W.C. (1992), Multivariate Data Analysis with Readings,
Macmillan, New York, NY.
Hellier, P.K., Geursen, G.M., Carr, R.A. and Rickard, J.A. (2003), "Customer repurchase intention: a general
structural equation model", European Journal of Marketing, Vol. 37 No. 11/12, pp. 1762-1800.
Kassim, N.M. and Ismail, S. (2009), "Investigating the complex drivers of loyalty in e-commerce settings",
Measuring Business Excellence, Vol. 13 No.1, pp. 56-71.
Kim, C., Galliers, R.D., Shin, N., Ryoo, J.H. and Kim, J. (2012), "Factors influencing internet shopping
value and customer repurchase intention", Electronic Commerce Research and Applications, Vol. 11
No. 4, pp. 374-387.
Kuo, W.F., Wu, C.M., and Deng, W.J. (2009), "The relationships among service quality, perceived value,
customer satisfaction, and post-purchase intention in mobile value-added services", Computers in
Human Behavior, Vol. 25 No. 4, pp. 887-896.
Lee, J., Park, D.H. and Han, I. (2011), "The different effects of online customer reviews on customers'
purchase intentions depending on trust in online shopping malls: an advertising perspective", Internet
Research, Vol. 21 No. 2, 187-206.
Lin, C.C, Wu, H.Y. and Chang, Y.F. (2011), "The critical factors impact on online customer satisfaction",
Procedia Computer Science, Vol. 3, pp. 276-281.
Lin, H.H. (2011), "Gender differences in the linkage of online patronage behavior with TV-and-online
shopping values", Service Business, Vol. 5 No. 4, pp. 295-312.
Lin, S. (2009), "Interaction archetypes of information searches during online shopping", in The proceedings
of Association for Chinese Management Educators, San Francisco, CA.
McKinney, V., Yoon, K. and Zahedi, F.M. (2002), "The measurement of Web-customer satisfaction: an
expectation and disconfirmation approach", Information Systems Research, Vol. 13 No. 3, pp. 296-315.
Oliver, R.L. (1977), "Effect of expectation and disconfirmation on postexposure product evaluations: an
alternative interpretation", Journal of Applied Psychology, Vol. 62 No. 4, pp. 480-486.
Oliver, R.L. (1980), "A cognitive model of the antecedents and consequences of satisfaction decisions",
Journal of Marketing Research, Vol. 17 No. 3, pp. 460-469.
Parasuraman, A. and Grewal, D. (2000), "The impact of technology on the quality-value-loyalty chain: a
research agenda", Journal of the Academy of Marketing Science, Vol. 28 No. 1, pp. 168-174.
Petter, S., DeLone, W. and McLean, E.R. (2012), "The past, present, and future of "IS success"", Journal of
the Association for Information Systems, Vol. 13 No. 5, pp. 341-362.
Petter, S., DeLone, W. and McLean, E.R. (2013), "Information systems success: the quest for the
© ICBTS Copyright by Author(s) The 2016 International Academic Research Conference in Boston -Toronto 165
independent variables", Journal of Management Information Systems, Vol. 29 No. 4, pp. 7-61.
Pitt, L.F., Watson, R.T. and Kavan, C.B. (1995), "Service quality: a measure of information systems
effectiveness", MIS Quarterly, Vol. 19 No. 2, pp. 173-187.
Porter, M.E. (1985). Competitive Advantage: Creating and Sustaining Superior Performance. The Free
Press, New York, NY.
Quan, S. (2010), "The relationships among e-service quality, system quality, information quality and
customer loyalty: an empirical study of internet banking in China", Global Journal of Management and
Business Research, Vol. 10 No. 7, pp. 27-34.
Rai, A., Lang, S.S. and Welker, R.B. (2002), "Assessing the validity of IS success models: an empirical test
and theoretical analysis", Information Systems Research, Vol. 13 No. 1, pp. 50-69.
Ramanathan, R. (2010), " E-commerce success criteria: determining which criteria count most", Electronic
Commerce Research, Vol. 10 No. 2, pp. 191-208.
Rao, A.R. and Monroe, K.B. (1988), "The moderating effect of prior knowledge on cue utilization in product
evaluations", Journal of Consumer Research, Vol. 15 No. 2, pp. 253-264.
Rose, S., Clark, M., Samouel, P. and Hair, N. (2012), "On-line customer experience in e-retailing: an
empirical model of antecedents and outcomes", Journal of Retailing, Vol. 88 No. 2, pp. 308-322.
Seddon, P.B. (1997), "A respecification and extension of the DeLone and McLean model of IS success",
Information Systems Research, Vol. 8 No. 3, pp. 240-253.
Smith, M.D. and Brynjolfsson, E. (2001), "Consumer decision-making at an Internet shopbot: brand still
matters", Journal of Industrial Economics, Vol. 49 No. 4, pp. 541-558.
Sun, H. (2010), "Transferring attributes of e-commerce systems into business benefits: a relationship quality
perspective", Journal of Electronic Commerce Research, Vol. 11 No. 2, pp. 92-109.
Tsiotsou, R. (2006), "The role of perceived product quality and overall satisfaction on purchase intentions",
International Journal of Consumer Studies, Vol. 30 No. 2, pp. 207-217.
Turel, O., Serenko, A. and Bontis, N. (2010), "User acceptance of hedonic digital artifacts: a theory of
consumption values perspective", Information and Management, Vol. 47 No. 1, pp. 53-59.
Valvi, A.C. and Fragkos, K.C. (2012), "Critical review of the e-loyalty literature: a purchase-centred
framework", Electronic Commerce Research, Vol. 12 No. 3, pp. 331-378.
Venkatesh, V. and Agarwal, R. (2006), "Turning visitors into customers: a usability-centric perspective on
purchase behavior in e-channels", Management Science, Vol. 52 No. 3, pp. 367-382.
Venkatesh, V., Morris, M.G., Davis, G.B. and Davis, F.D. (2003), "User acceptance of information
technology: toward a unified view", MIS Quarterly, Vol. 27 No. 3, pp. 425-478.
Wang, Y.S. (2008), "Assessing e-commerce systems success: a respecification and validation of the DeLone
and McLean model of IS success", Information Systems Journal, Vol. 18 No. 5, pp. 529-557.
Wang, Y.S. and Tang, T.I (2003), "Assessing customer perceptions of Web sites service quality in digital
marketing environments", Journal of End User Computing, Vol. 15 No. 3, pp. 14-31.
Wang, Y.S., Tang, T.I. and Tang, J.T.E. (2001), "An instrument for measuring customer satisfaction toward
websites that market digital products and services", Journal of Electronic Commerce Research, Vol. 2
No. 3, pp. 89-102.
Wang, Y.S., Wu, S.C., Lin, H.H. and Wang, Y.Y. (2011), "The relationship of service failure severity,
service recovery justice and perceived switching costs with customer loyalty in the context of e-tailing",
International Journal of Information Management, Vol. 31 No. 4, pp. 350-359.
Wang, Y.S., Yeh, C.H. and Liao, Y.W. (2013), " What drives purchase intention in the context of online
content services? The moderating role of ethical self-efficacy for online piracy", International Journal
of Information Management, Vol. 33 No. 1, pp. 199-208.
Zeithaml, V.A. (1988), "Consumer perceptions of price, quality, and value: a means-end model and synthesis
of evidence", Journal of Marketing, Vol. 52 No. 3, pp. 2-22.
© ICBTS Copyright by Author(s) The 2016 International Academic Research Conference in Boston -Toronto 166
OPERATIONAL MANAGEMENT EXPERIENCES OF RCC DAMS IN
THE PAST DECADE
Aidan Zamani Executive Manager of Dezh Hael Saze Gilan Company, Iran
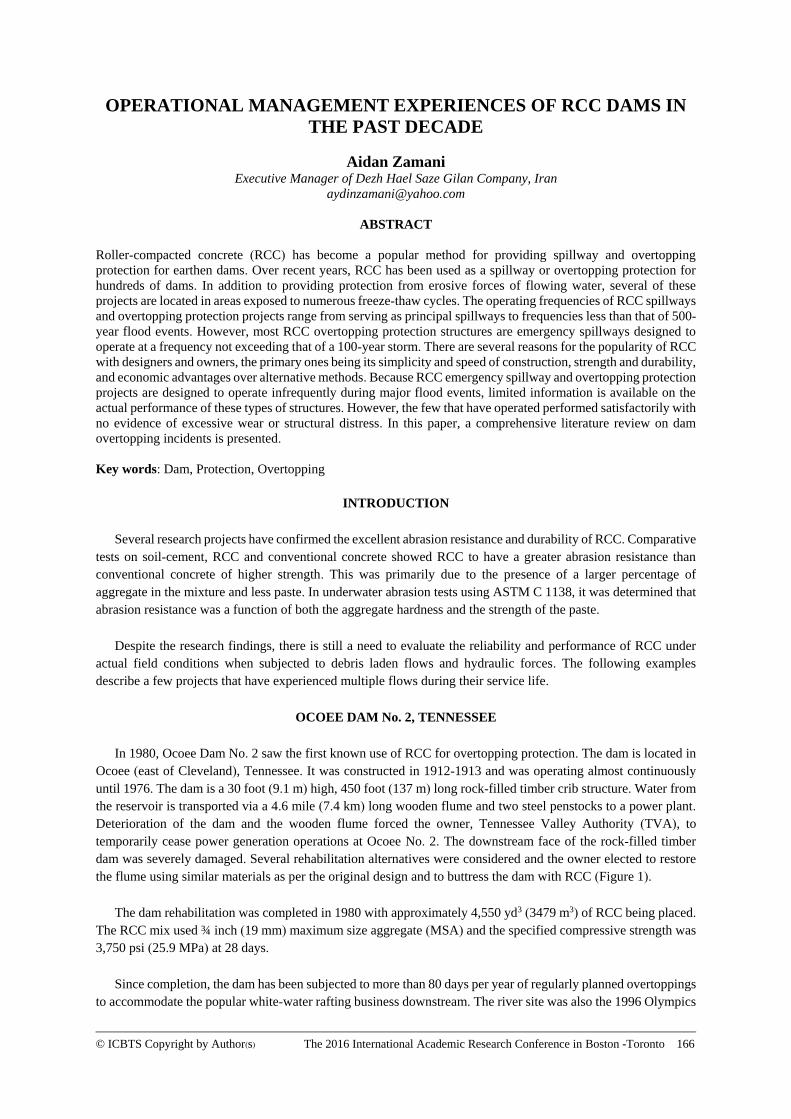
ABSTRACT
Roller-compacted concrete (RCC) has become a popular method for providing spillway and overtopping
protection for earthen dams. Over recent years, RCC has been used as a spillway or overtopping protection for
hundreds of dams. In addition to providing protection from erosive forces of flowing water, several of these
projects are located in areas exposed to numerous freeze-thaw cycles. The operating frequencies of RCC spillways
and overtopping protection projects range from serving as principal spillways to frequencies less than that of 500-
year flood events. However, most RCC overtopping protection structures are emergency spillways designed to
operate at a frequency not exceeding that of a 100-year storm. There are several reasons for the popularity of RCC
with designers and owners, the primary ones being its simplicity and speed of construction, strength and durability,
and economic advantages over alternative methods. Because RCC emergency spillway and overtopping protection
projects are designed to operate infrequently during major flood events, limited information is available on the
actual performance of these types of structures. However, the few that have operated performed satisfactorily with
no evidence of excessive wear or structural distress. In this paper, a comprehensive literature review on dam
overtopping incidents is presented.
Key words: Dam, Protection, Overtopping
INTRODUCTION
Several research projects have confirmed the excellent abrasion resistance and durability of RCC. Comparative
tests on soil-cement, RCC and conventional concrete showed RCC to have a greater abrasion resistance than
conventional concrete of higher strength. This was primarily due to the presence of a larger percentage of
aggregate in the mixture and less paste. In underwater abrasion tests using ASTM C 1138, it was determined that
abrasion resistance was a function of both the aggregate hardness and the strength of the paste.
Despite the research findings, there is still a need to evaluate the reliability and performance of RCC under
actual field conditions when subjected to debris laden flows and hydraulic forces. The following examples
describe a few projects that have experienced multiple flows during their service life.
OCOEE DAM No. 2, TENNESSEE
In 1980, Ocoee Dam No. 2 saw the first known use of RCC for overtopping protection. The dam is located in
Ocoee (east of Cleveland), Tennessee. It was constructed in 1912-1913 and was operating almost continuously
until 1976. The dam is a 30 foot (9.1 m) high, 450 foot (137 m) long rock-filled timber crib structure. Water from
the reservoir is transported via a 4.6 mile (7.4 km) long wooden flume and two steel penstocks to a power plant.
Deterioration of the dam and the wooden flume forced the owner, Tennessee Valley Authority (TVA), to
temporarily cease power generation operations at Ocoee No. 2. The downstream face of the rock-filled timber
dam was severely damaged. Several rehabilitation alternatives were considered and the owner elected to restore
the flume using similar materials as per the original design and to buttress the dam with RCC (Figure 1).
The dam rehabilitation was completed in 1980 with approximately 4,550 yd3 (3479 m3) of RCC being placed.
The RCC mix used ¾ inch (19 mm) maximum size aggregate (MSA) and the specified compressive strength was
3,750 psi (25.9 MPa) at 28 days.
Since completion, the dam has been subjected to more than 80 days per year of regularly planned overtoppings
to accommodate the popular white-water rafting business downstream. The river site was also the 1996 Olympics

© ICBTS Copyright by Author(s) The 2016 International Academic Research Conference in Boston -Toronto 167
site for canoe and kayak competitions, which required overtopping the dam 160 times that year. In addition, on
16 February, 1990, a major flood overtopped the dam by approximately 12 feet (3.7 m).
Where energy dissipation is minimal near the top of the dam, the RCC experienced very minor erosion. Further
downstream, where energy dissipation is greater, the water has eroded the uncompacted lift edges and in some
areas several inches (millimetres) of the compacted RCC. The RCC surface appears rough and uneven, but the
dam continues to perform well (Figures 2-5).
Figure 1. Typical cross-section of Ocoee Dam No. 2.
Figure 2. Ocoee Dam No. 2 without white-water rafting overflow (provided by TVA).
Figure 3. Ocoee Dam No. 2 with white-water rafting overflow (provided by TVA).
© ICBTS Copyright by Author(s) The 2016 International Academic Research Conference in Boston -Toronto 168
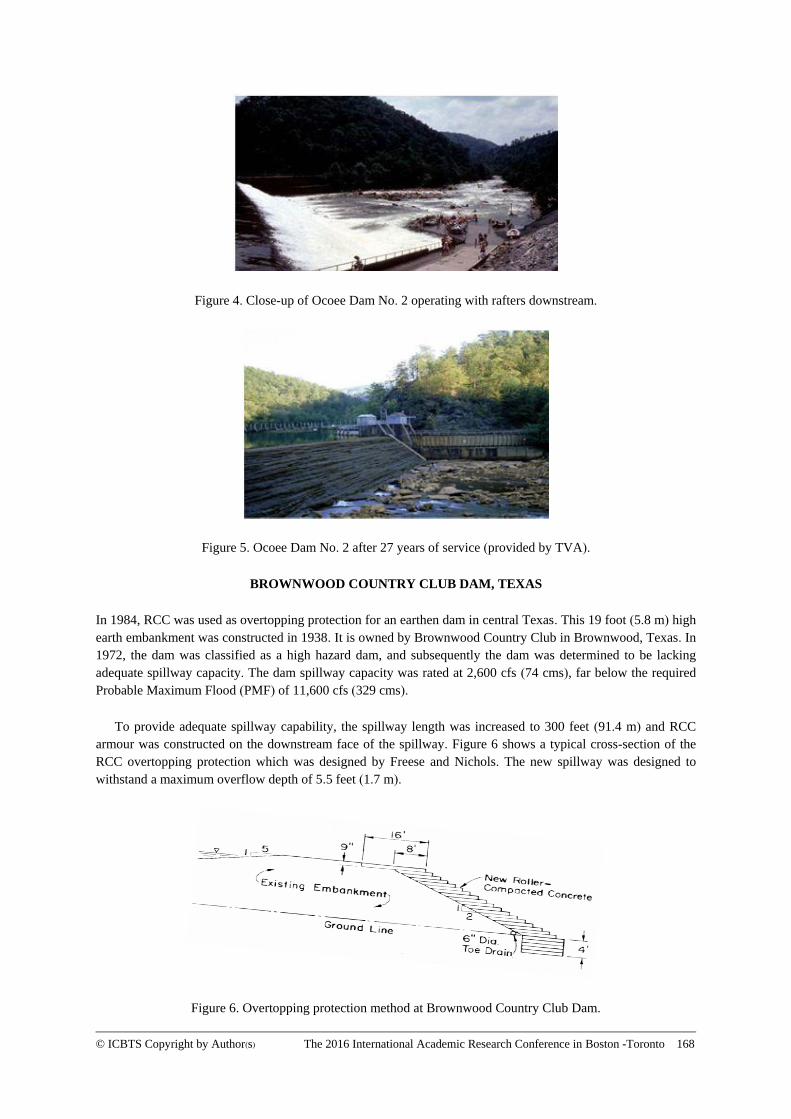
Figure 4. Close-up of Ocoee Dam No. 2 operating with rafters downstream.
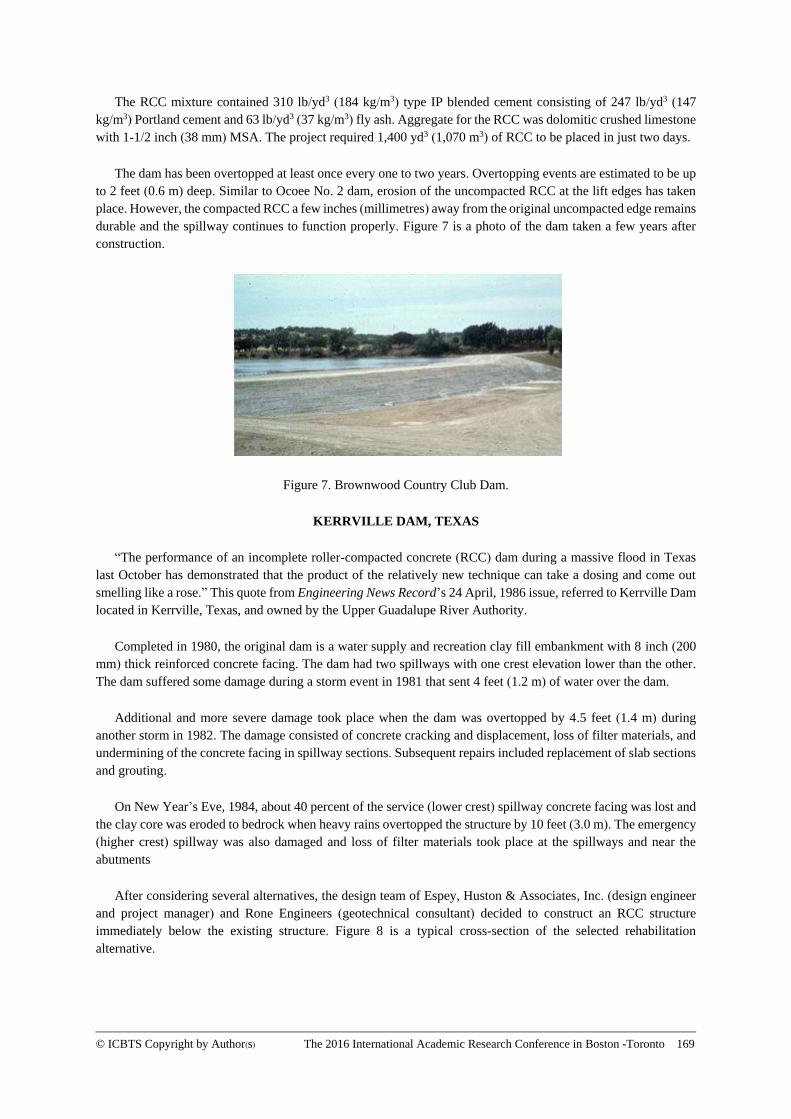
Figure 5. Ocoee Dam No. 2 after 27 years of service (provided by TVA).
BROWNWOOD COUNTRY CLUB DAM, TEXAS
In 1984, RCC was used as overtopping protection for an earthen dam in central Texas. This 19 foot (5.8 m) high
earth embankment was constructed in 1938. It is owned by Brownwood Country Club in Brownwood, Texas. In
1972, the dam was classified as a high hazard dam, and subsequently the dam was determined to be lacking
adequate spillway capacity. The dam spillway capacity was rated at 2,600 cfs (74 cms), far below the required
Probable Maximum Flood (PMF) of 11,600 cfs (329 cms).
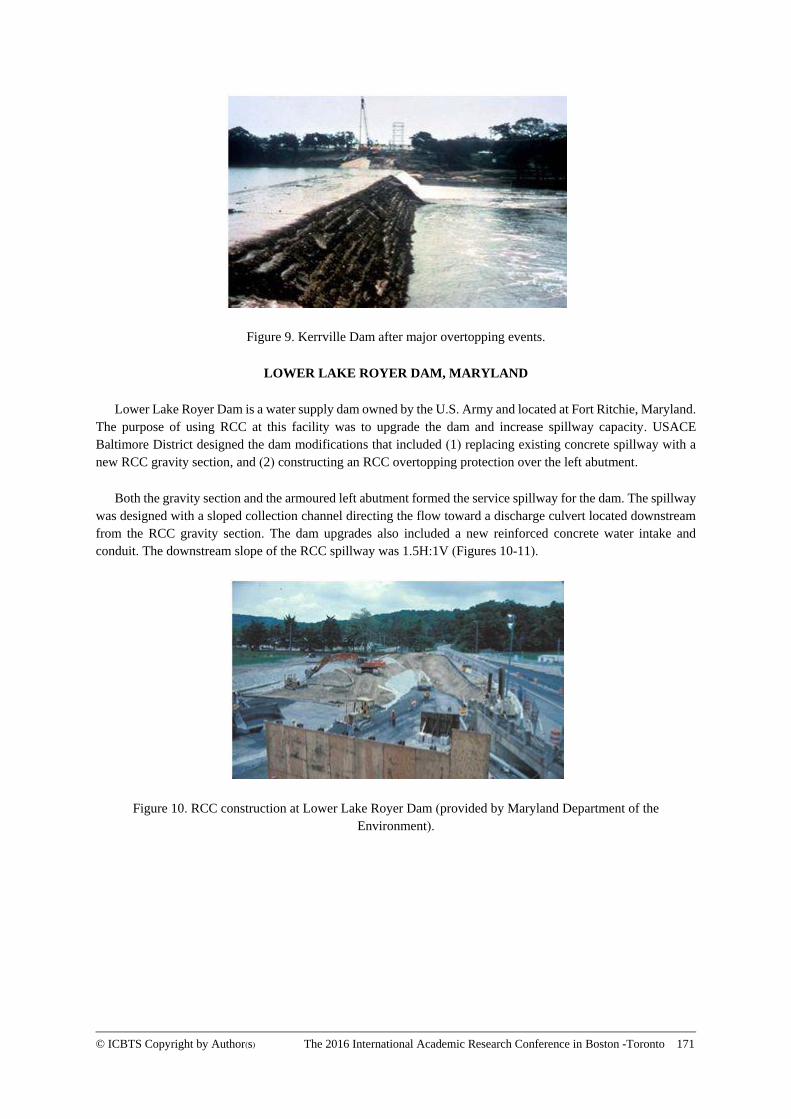
To provide adequate spillway capability, the spillway length was increased to 300 feet (91.4 m) and RCC
armour was constructed on the downstream face of the spillway. Figure 6 shows a typical cross-section of the
RCC overtopping protection which was designed by Freese and Nichols. The new spillway was designed to
withstand a maximum overflow depth of 5.5 feet (1.7 m).
Figure 6. Overtopping protection method at Brownwood Country Club Dam.
© ICBTS Copyright by Author(s) The 2016 International Academic Research Conference in Boston -Toronto 169
The RCC mixture contained 310 lb/yd3 (184 kg/m3) type IP blended cement consisting of 247 lb/yd3 (147
kg/m3) Portland cement and 63 lb/yd3 (37 kg/m3) fly ash. Aggregate for the RCC was dolomitic crushed limestone
with 1-1/2 inch (38 mm) MSA. The project required 1,400 yd3 (1,070 m3) of RCC to be placed in just two days.
The dam has been overtopped at least once every one to two years. Overtopping events are estimated to be up
to 2 feet (0.6 m) deep. Similar to Ocoee No. 2 dam, erosion of the uncompacted RCC at the lift edges has taken
place. However, the compacted RCC a few inches (millimetres) away from the original uncompacted edge remains
durable and the spillway continues to function properly. Figure 7 is a photo of the dam taken a few years after
construction.
Figure 7. Brownwood Country Club Dam.
KERRVILLE DAM, TEXAS
“The performance of an incomplete roller-compacted concrete (RCC) dam during a massive flood in Texas
last October has demonstrated that the product of the relatively new technique can take a dosing and come out
smelling like a rose.” This quote from Engineering News Record’s 24 April, 1986 issue, referred to Kerrville Dam
located in Kerrville, Texas, and owned by the Upper Guadalupe River Authority.
Completed in 1980, the original dam is a water supply and recreation clay fill embankment with 8 inch (200
mm) thick reinforced concrete facing. The dam had two spillways with one crest elevation lower than the other.
The dam suffered some damage during a storm event in 1981 that sent 4 feet (1.2 m) of water over the dam.
Additional and more severe damage took place when the dam was overtopped by 4.5 feet (1.4 m) during
another storm in 1982. The damage consisted of concrete cracking and displacement, loss of filter materials, and
undermining of the concrete facing in spillway sections. Subsequent repairs included replacement of slab sections
and grouting.
On New Year’s Eve, 1984, about 40 percent of the service (lower crest) spillway concrete facing was lost and
the clay core was eroded to bedrock when heavy rains overtopped the structure by 10 feet (3.0 m). The emergency
(higher crest) spillway was also damaged and loss of filter materials took place at the spillways and near the
abutments
After considering several alternatives, the design team of Espey, Huston & Associates, Inc. (design engineer
and project manager) and Rone Engineers (geotechnical consultant) decided to construct an RCC structure
immediately below the existing structure. Figure 8 is a typical cross-section of the selected rehabilitation
alternative.

© ICBTS Copyright by Author(s) The 2016 International Academic Research Conference in Boston -Toronto 170
Figure 8. Repair solution for damaged Kerrville Dam.
The project required approximately 23,000 yd3 (17,600 m3) of RCC to complete. The mixture contained 200
lb/yd3 (119 kg/m3) Portland cement for the majority of the dam and 400 lb/yd3 (237 kg/m3) for the upper seven
lifts. Bedding mortar was also used to improve bonding strength at the lift joints of several upper lifts. The RCC
aggregate was pit-run river deposit with 3-1/2 inch (89 mm) MSA. Compressive strength test results of RCC cores
were in the order of 1,600 psi (11 MPa) at 90 days for RCC containing 200 lb/yd3 (119 kg/m3) cement and 3,000
psi (20.7 MPa) at 90 days for RCC containing 400 lb/yd3 (237 kg/m3) cement. Normal water flow at this dam is
continuously passed over the RCC spillway area. Significant flood events causing overtopping of the entire dam
are listed below:
1. On 19 October, 1985, 30 days after completion of RCC placement and before final completion of the project,
up to 11 inches (28 mm) of rain fell upstream of the dam. At peak flow, the water overtopped the main portion of
the dam by 14.5 feet (4.4 m) and the lower spillway section by 15.5 feet (4.7 m). This event was estimated to be
a 50-year flood with a maximum flow of 125,000 cfs (3540 cms). The flow from the storm lasted five days over
the entire dam and three weeks over the spillway.
2. The dam was overtopped again on 17 July, 1987. This time the flow peaked at 162,000 cfs (4587 cms) and
the maximum depth of the flow at the dam was estimated at 16.2 feet (4.9 m), which is close to the 100-year
storm.
3. Additional significant events reported by the owner include one in 1988 and another in 1990 causing the
water to overtop the dam by 10 feet (3.0 m) and 8 feet (2.4 m), respectively.
Observation after the flood events listed above and subsequent inspections, including an inspection fairly
recently done in 2007, revealed that the RCC performed and continues to perform remarkably. No significant
damage was observed. RCC damage was limited to surface erosion exposing large aggregates and, at isolated
locations, minor spalling took place during the July 1987 event. Figure 9 shows Kerrville Dam after several
overtopping events.
© ICBTS Copyright by Author(s) The 2016 International Academic Research Conference in Boston -Toronto 171
Figure 9. Kerrville Dam after major overtopping events.
LOWER LAKE ROYER DAM, MARYLAND
Lower Lake Royer Dam is a water supply dam owned by the U.S. Army and located at Fort Ritchie, Maryland.
The purpose of using RCC at this facility was to upgrade the dam and increase spillway capacity. USACE
Baltimore District designed the dam modifications that included (1) replacing existing concrete spillway with a
new RCC gravity section, and (2) constructing an RCC overtopping protection over the left abutment.
Both the gravity section and the armoured left abutment formed the service spillway for the dam. The spillway
was designed with a sloped collection channel directing the flow toward a discharge culvert located downstream
from the RCC gravity section. The dam upgrades also included a new reinforced concrete water intake and
conduit. The downstream slope of the RCC spillway was 1.5H:1V (Figures 10-11).
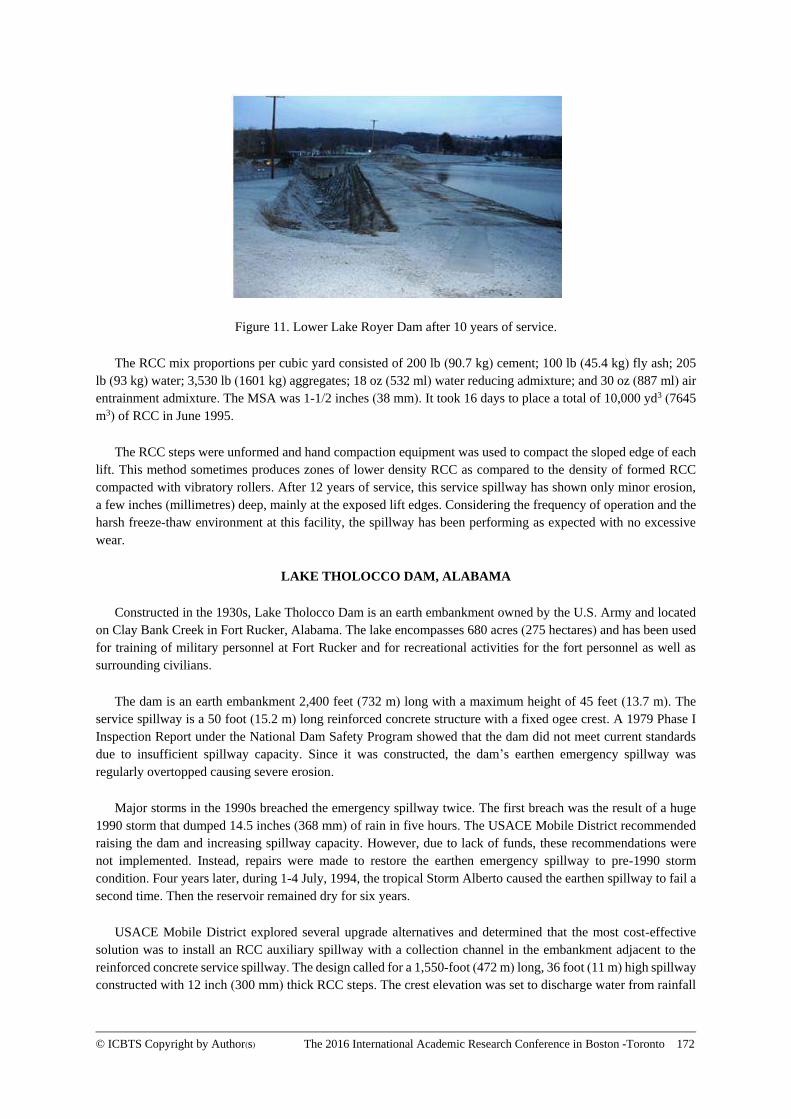
Figure 10. RCC construction at Lower Lake Royer Dam (provided by Maryland Department of the
Environment).
© ICBTS Copyright by Author(s) The 2016 International Academic Research Conference in Boston -Toronto 172
Figure 11. Lower Lake Royer Dam after 10 years of service.
The RCC mix proportions per cubic yard consisted of 200 lb (90.7 kg) cement; 100 lb (45.4 kg) fly ash; 205
lb (93 kg) water; 3,530 lb (1601 kg) aggregates; 18 oz (532 ml) water reducing admixture; and 30 oz (887 ml) air
entrainment admixture. The MSA was 1-1/2 inches (38 mm). It took 16 days to place a total of 10,000 yd3 (7645
m3) of RCC in June 1995.
The RCC steps were unformed and hand compaction equipment was used to compact the sloped edge of each
lift. This method sometimes produces zones of lower density RCC as compared to the density of formed RCC
compacted with vibratory rollers. After 12 years of service, this service spillway has shown only minor erosion,
a few inches (millimetres) deep, mainly at the exposed lift edges. Considering the frequency of operation and the
harsh freeze-thaw environment at this facility, the spillway has been performing as expected with no excessive
wear.
LAKE THOLOCCO DAM, ALABAMA
Constructed in the 1930s, Lake Tholocco Dam is an earth embankment owned by the U.S. Army and located
on Clay Bank Creek in Fort Rucker, Alabama. The lake encompasses 680 acres (275 hectares) and has been used
for training of military personnel at Fort Rucker and for recreational activities for the fort personnel as well as
surrounding civilians.
The dam is an earth embankment 2,400 feet (732 m) long with a maximum height of 45 feet (13.7 m). The
service spillway is a 50 foot (15.2 m) long reinforced concrete structure with a fixed ogee crest. A 1979 Phase I
Inspection Report under the National Dam Safety Program showed that the dam did not meet current standards
due to insufficient spillway capacity. Since it was constructed, the dam’s earthen emergency spillway was
regularly overtopped causing severe erosion.
Major storms in the 1990s breached the emergency spillway twice. The first breach was the result of a huge
1990 storm that dumped 14.5 inches (368 mm) of rain in five hours. The USACE Mobile District recommended
raising the dam and increasing spillway capacity. However, due to lack of funds, these recommendations were
not implemented. Instead, repairs were made to restore the earthen emergency spillway to pre-1990 storm
condition. Four years later, during 1-4 July, 1994, the tropical Storm Alberto caused the earthen spillway to fail a
second time. Then the reservoir remained dry for six years.
USACE Mobile District explored several upgrade alternatives and determined that the most cost-effective
solution was to install an RCC auxiliary spillway with a collection channel in the embankment adjacent to the
reinforced concrete service spillway. The design called for a 1,550-foot (472 m) long, 36 foot (11 m) high spillway
constructed with 12 inch (300 mm) thick RCC steps. The crest elevation was set to discharge water from rainfall

© ICBTS Copyright by Author(s) The 2016 International Academic Research Conference in Boston -Toronto 173
events once every one to two years, and the design maximum overflow height was 6.5 feet (2.0 m). The RCC lifts
varied in width from 8 to 12 feet (2.4-3.7 m).
The slope of the spillway chute was 6H:1V, whereas a slope of 3H:1V was selected for the downstream side
of the collection channel. The design also included large riprap placed immediately downstream of the collection
channel to prevent damage to the backside of the collection channel should the estimated tail water levels not be
realized during storm events.
Approximately 26,000 yd3 (19,878 m3) of RCC were placed in the spring of 2000. The RCC mixture contained
275 lb/yd3 (163 kg/m3) Portland cement and 50 lb/yd3 (30 kg/m3) fly ash. The MSA for the RCC was 1-1/2 inches
(38 mm). Figure 12 shows the spillway shortly after completion.
Figure 12. A view of principal and auxiliary spillways at Lake Tholocco Dam.
On-site USACE personnel report that the spillway has been overtopped at least twice. The first was during
hurricane Ivan on 16 September, 2004. At peak flow, overflow height was determined to be 3 feet (0.9 m). The
second storm took place on 27-28 March, 2005. Maximum overflow depth during this storm was 1.5 feet (0.45
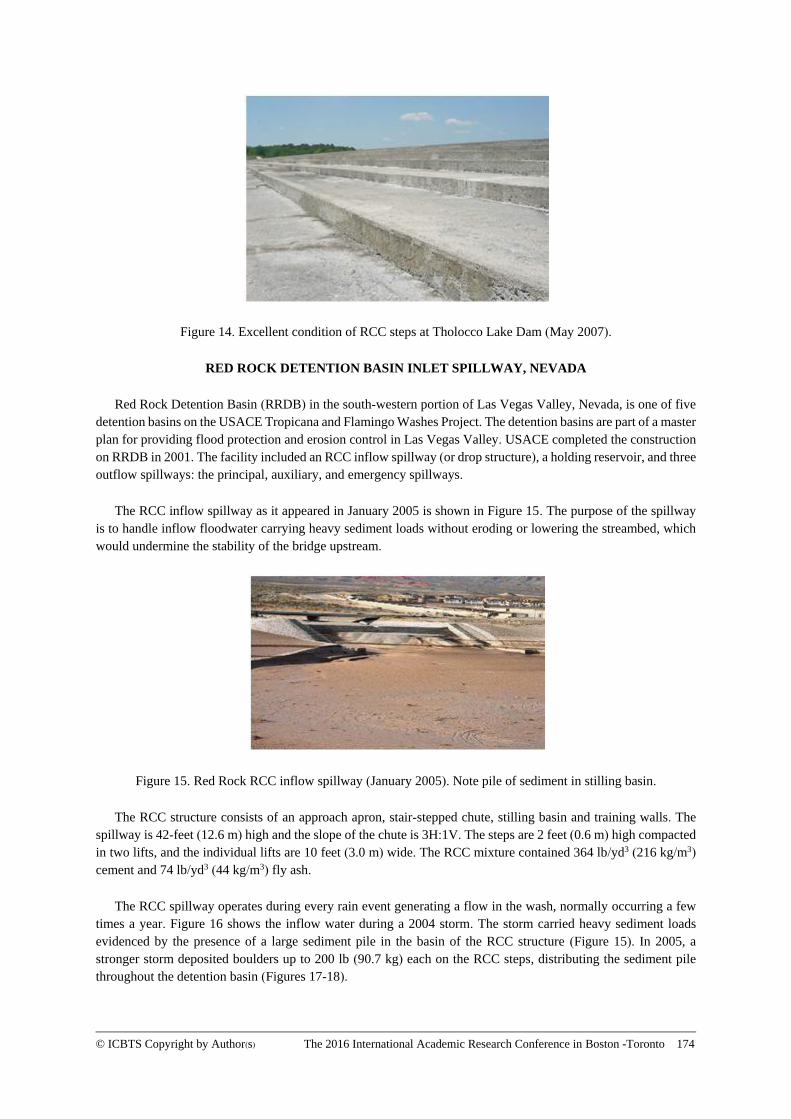
m). Figure 13 was taken during this overtopping event. Figure 14 was taken in May 2007 and shows the excellent
condition of the RCC steps.
Figure 13. March 2005 overtopping event at Tholocco Lake Dam (provided by U.S. Army).
© ICBTS Copyright by Author(s) The 2016 International Academic Research Conference in Boston -Toronto 174
Figure 14. Excellent condition of RCC steps at Tholocco Lake Dam (May 2007).
RED ROCK DETENTION BASIN INLET SPILLWAY, NEVADA
Red Rock Detention Basin (RRDB) in the south-western portion of Las Vegas Valley, Nevada, is one of five
detention basins on the USACE Tropicana and Flamingo Washes Project. The detention basins are part of a master
plan for providing flood protection and erosion control in Las Vegas Valley. USACE completed the construction
on RRDB in 2001. The facility included an RCC inflow spillway (or drop structure), a holding reservoir, and three
outflow spillways: the principal, auxiliary, and emergency spillways.
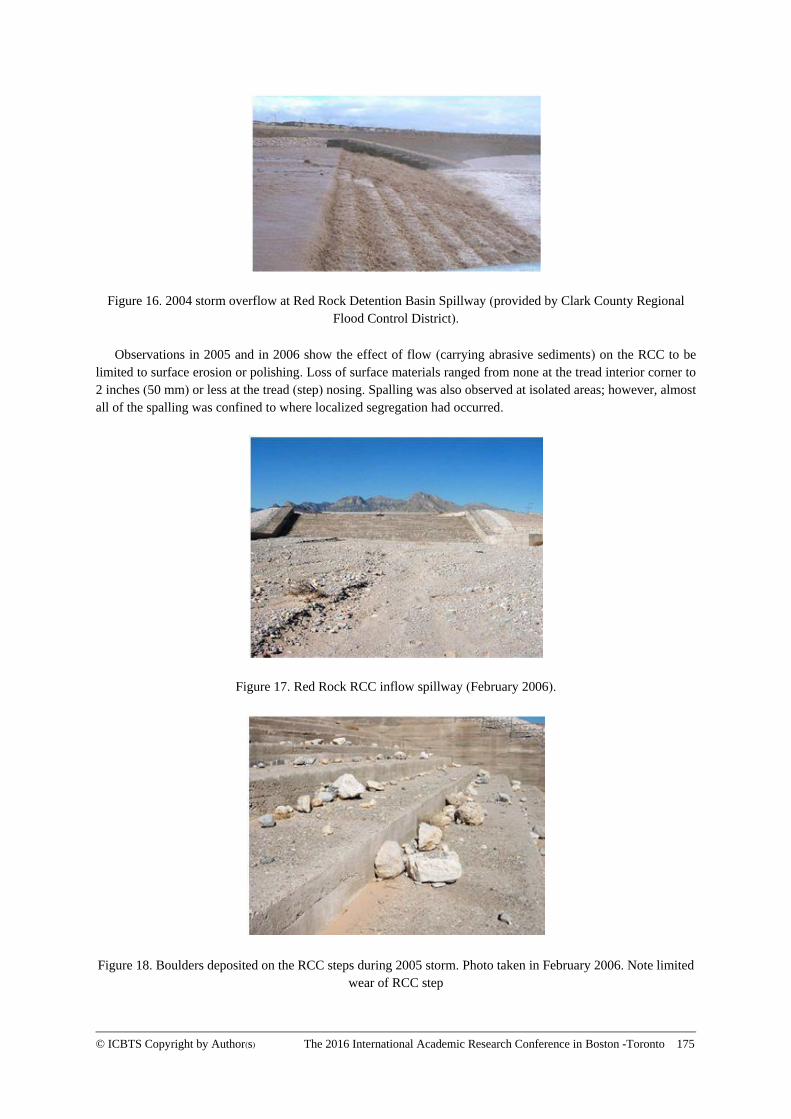
The RCC inflow spillway as it appeared in January 2005 is shown in Figure 15. The purpose of the spillway
is to handle inflow floodwater carrying heavy sediment loads without eroding or lowering the streambed, which
would undermine the stability of the bridge upstream.
Figure 15. Red Rock RCC inflow spillway (January 2005). Note pile of sediment in stilling basin.
The RCC structure consists of an approach apron, stair-stepped chute, stilling basin and training walls. The
spillway is 42-feet (12.6 m) high and the slope of the chute is 3H:1V. The steps are 2 feet (0.6 m) high compacted
in two lifts, and the individual lifts are 10 feet (3.0 m) wide. The RCC mixture contained 364 lb/yd3 (216 kg/m3)
cement and 74 lb/yd3 (44 kg/m3) fly ash.
The RCC spillway operates during every rain event generating a flow in the wash, normally occurring a few
times a year. Figure 16 shows the inflow water during a 2004 storm. The storm carried heavy sediment loads
evidenced by the presence of a large sediment pile in the basin of the RCC structure (Figure 15). In 2005, a
stronger storm deposited boulders up to 200 lb (90.7 kg) each on the RCC steps, distributing the sediment pile
throughout the detention basin (Figures 17-18).
© ICBTS Copyright by Author(s) The 2016 International Academic Research Conference in Boston -Toronto 175
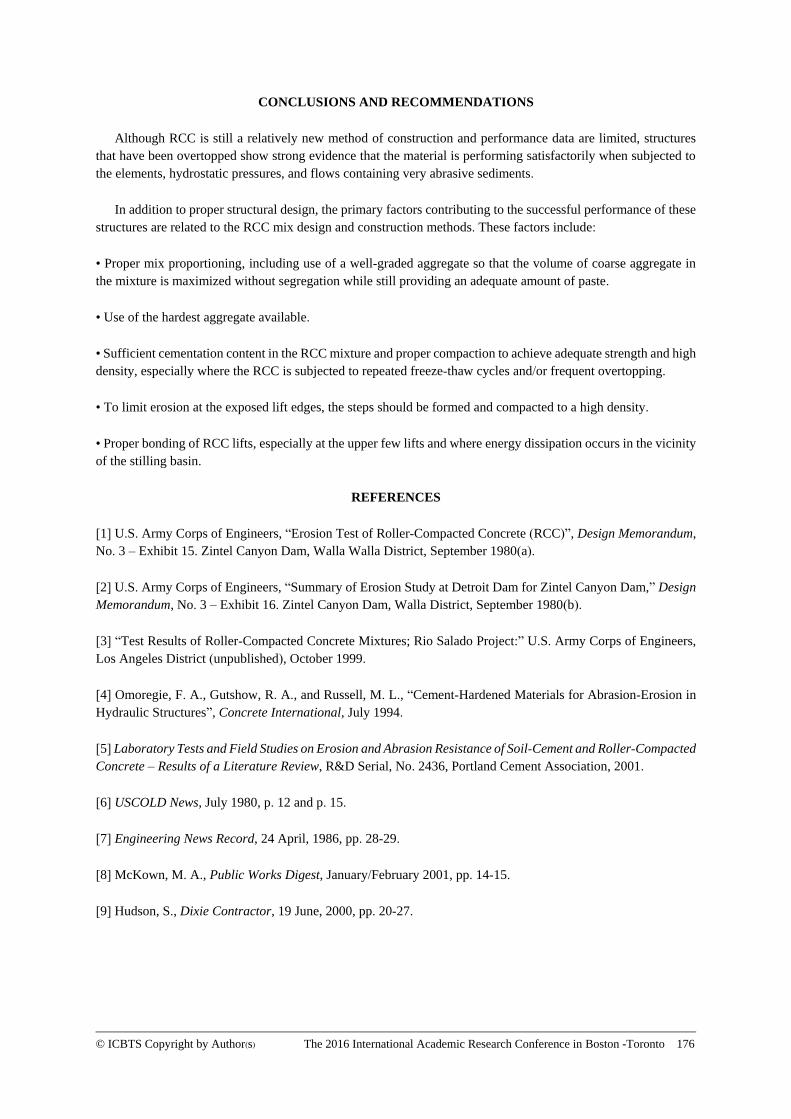
Figure 16. 2004 storm overflow at Red Rock Detention Basin Spillway (provided by Clark County Regional
Flood Control District).
Observations in 2005 and in 2006 show the effect of flow (carrying abrasive sediments) on the RCC to be
limited to surface erosion or polishing. Loss of surface materials ranged from none at the tread interior corner to
2 inches (50 mm) or less at the tread (step) nosing. Spalling was also observed at isolated areas; however, almost
all of the spalling was confined to where localized segregation had occurred.
Figure 17. Red Rock RCC inflow spillway (February 2006).
Figure 18. Boulders deposited on the RCC steps during 2005 storm. Photo taken in February 2006. Note limited
wear of RCC step
© ICBTS Copyright by Author(s) The 2016 International Academic Research Conference in Boston -Toronto 176
CONCLUSIONS AND RECOMMENDATIONS
Although RCC is still a relatively new method of construction and performance data are limited, structures
that have been overtopped show strong evidence that the material is performing satisfactorily when subjected to
the elements, hydrostatic pressures, and flows containing very abrasive sediments.
In addition to proper structural design, the primary factors contributing to the successful performance of these
structures are related to the RCC mix design and construction methods. These factors include:
• Proper mix proportioning, including use of a well-graded aggregate so that the volume of coarse aggregate in
the mixture is maximized without segregation while still providing an adequate amount of paste.
• Use of the hardest aggregate available.
• Sufficient cementation content in the RCC mixture and proper compaction to achieve adequate strength and high
density, especially where the RCC is subjected to repeated freeze-thaw cycles and/or frequent overtopping.
• To limit erosion at the exposed lift edges, the steps should be formed and compacted to a high density.
• Proper bonding of RCC lifts, especially at the upper few lifts and where energy dissipation occurs in the vicinity
of the stilling basin.
REFERENCES
[1] U.S. Army Corps of Engineers, “Erosion Test of Roller-Compacted Concrete (RCC)”, Design Memorandum,
No. 3 – Exhibit 15. Zintel Canyon Dam, Walla Walla District, September 1980(a).
[2] U.S. Army Corps of Engineers, “Summary of Erosion Study at Detroit Dam for Zintel Canyon Dam,” Design
Memorandum, No. 3 – Exhibit 16. Zintel Canyon Dam, Walla District, September 1980(b).
[3] “Test Results of Roller-Compacted Concrete Mixtures; Rio Salado Project:” U.S. Army Corps of Engineers,
Los Angeles District (unpublished), October 1999.
[4] Omoregie, F. A., Gutshow, R. A., and Russell, M. L., “Cement-Hardened Materials for Abrasion-Erosion in
Hydraulic Structures”, Concrete International, July 1994.
[5] Laboratory Tests and Field Studies on Erosion and Abrasion Resistance of Soil-Cement and Roller-Compacted
Concrete – Results of a Literature Review, R&D Serial, No. 2436, Portland Cement Association, 2001.
[6] USCOLD News, July 1980, p. 12 and p. 15.
[7] Engineering News Record, 24 April, 1986, pp. 28-29.
[8] McKown, M. A., Public Works Digest, January/February 2001, pp. 14-15.
[9] Hudson, S., Dixie Contractor, 19 June, 2000, pp. 20-27.

© ICBTS Copyright by Author(s) The 2016 International Academic Research Conference in Boston -Toronto 177
CRITICAL CITIZENRY AND DEMOCRATIC CONSOLIDATION IN
NIGERIA.
Babalola BTA
Moshood Abiola Polytechnic, Abeokuta, Ogun-State, Nigeria
ABSTRACT
Nigeria political history seems to have hung precariously on an unsteady pendulum as democratic experience
in the first and second republic ended ignominiously in coup detats. The annulment of June 12, 1993
presidential election invidiously collapsed its attempted third republic. The fourth republic is characterized
with incessant political and constitutional crises. In view of this, this paper explored ‘Critical Citizenry and
Democratic Consolidation in Nigeria’; with the objective of determining the causes of the failure of democracy
in Nigeria. The study used exposition analytical approach to achieve the objective of the research work. The
study reveals among other that bequeathed British legacy trapping on institutions of democracy without the
indigenous actors understanding and internalizing the values. Rigging of elections, opposition thuggery,
corruption and victimization serve as bane to the sustainability of democracy. Lack of trust among political
actors and lack of faith in regimes by the citizens are detrimental to the democratic consolidation. The paper,
therefore, recommends that there should be a conscious and practical citizenship education. More so, political
mentoring for future public office holders should be institutionalized; there should be ethical and moral
reorientation for Nigeria citizens. And, above all, there is also the need to restructure the Nigeria federation so
as to practice true federalism.
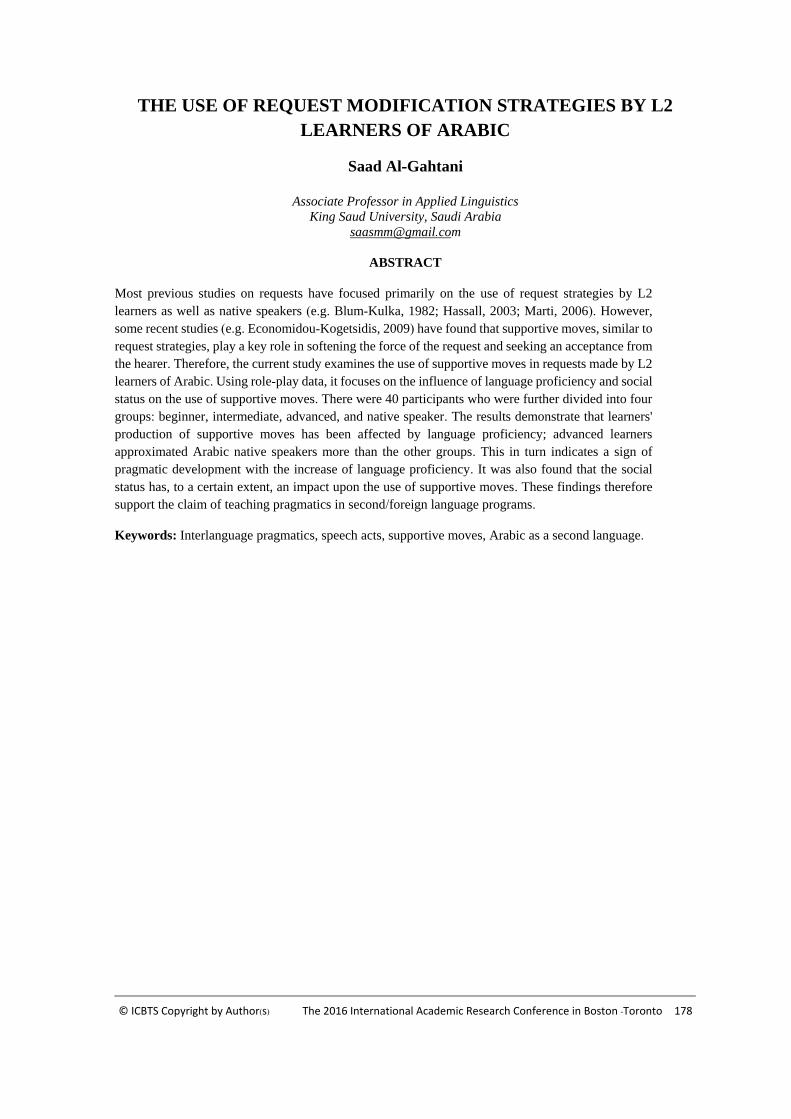
© ICBTS Copyright by Author(s) The 2016 International Academic Research Conference in Boston -Toronto 178
THE USE OF REQUEST MODIFICATION STRATEGIES BY L2
LEARNERS OF ARABIC
Saad Al-Gahtani
Associate Professor in Applied Linguistics
King Saud University, Saudi Arabia
mco.saasmm@gmail
ABSTRACT
Most previous studies on requests have focused primarily on the use of request strategies by L2
learners as well as native speakers (e.g. Blum-Kulka, 1982; Hassall, 2003; Marti, 2006). However,
some recent studies (e.g. Economidou-Kogetsidis, 2009) have found that supportive moves, similar to
request strategies, play a key role in softening the force of the request and seeking an acceptance from
the hearer. Therefore, the current study examines the use of supportive moves in requests made by L2
learners of Arabic. Using role-play data, it focuses on the influence of language proficiency and social
status on the use of supportive moves. There were 40 participants who were further divided into four
groups: beginner, intermediate, advanced, and native speaker. The results demonstrate that learners'
production of supportive moves has been affected by language proficiency; advanced learners
approximated Arabic native speakers more than the other groups. This in turn indicates a sign of
pragmatic development with the increase of language proficiency. It was also found that the social
status has, to a certain extent, an impact upon the use of supportive moves. These findings therefore
support the claim of teaching pragmatics in second/foreign language programs.
Keywords: Interlanguage pragmatics, speech acts, supportive moves, Arabic as a second language.
© ICBTS Copyright by Author(s) The 2016 International Academic Research Conference in Boston -Toronto 179
A STUDY ON THE PROFESSIONAL DEVELOPMENT OF
UNIVERSITY CLUB LEADERS, FROM THE PERSPECTIVE OF
COMMUNITIES OF PRACTICE
Wen-Bing Gau
National Chung Cheng University, Taiwan,
Email: [email protected]
ABSTRACT
Participating in student clubs is one of the important learning activities during the process of one’s university
life. Some suggested that group members can learn professional skills through participating in such extra
curriculum activities, while others argue that students’ talent, attitude and value system can also be developed
during the process. Whether or not a student club can create a positive learning environment for the participated
students depends on whether or not the club leader is professional enough to create a learning environment. In
order to develop the student club well, the leader who is also a university student has experienced varied
challenges which are similar to but not exactly same as those in the general workplace. Few articles discussed
about student club leaders’ professional development to say nothing about using Communities of Practice
(CoPs) as a research framework to view the leaders’ professional development. The research questions of this
study are as follows: A) What kinds of capability may a leader improve during the processed of his or her
leadership? B) How do those key professional skills develop? This article tries to answer the above questions
and discuss the findings from the perspective of Communities of Practice.
In order to explore leaders’ professional development in student clubs in universities, the researchers visited
all the universities in Chia- yi County ( one of the counties in southern Taiwan) and interviewed appropriate
student club leaders. 4 universities were visited, while 27 club leaders were recruited. All interviewees were
student club leaders who had ever organized university-scale activities or larger. The semi-structured interview
method was adopted to collect the data, while Wenger’ s ( 1998) theoretical framework, including mutual
engagement, joint enterprise, and shared repertoire, were employed to analyze the raw data and to reflect on
the leaders’ professional development. The findings support the concept of learning by doing. Student club
activities provide the club leaders with opportunities to learn how to plan an activity, to market and implement
the activity, and to evaluate the whole process. Some challenges impressed club leaders, such as how to
maintain activity quality, to reduce the risks of uncertainty, and to balance their personal time and working
hours. Some professional skills and key attitudes to dealing with tasks, which may influence their future career,
were also discussed in this study.
© ICBTS Copyright by Author(s) The 2016 International Academic Research Conference in Boston -Toronto 180
WHERE TWO PR MORE ARE GATHERED THERE IS BOUND TO
BE A CONFLICT
Babalola BTA1, Yusuf Sulaimon Aremu2
1&2Department of General Studies, Moshood Abiola Polytechnic, PMB 2210,
Abeokuta, Ogun-State, Nigeria.
ABSTRACT
Through the ages, the co-existence of man had always been marred by conflict. This study examined ‘Where
two or more are gathered there is bound to be a conflict’. The objective of the research work was to determine
and shed light on how conflict situations can be transformed to produce positive changes by examining the
concepts of conflict and the pre-conditions for conflict to occur among people. The study used exposition
analytical approach to achieve the objective of the research work. The study found out interestingly that
conflict is inevitable due to the fact that the resources available for life are scarce and human interactions
cannot be avoided. The study, therefore, recommends that violent conflict should be prevented, managed and
resolved where and when possible by resisting inter and intra group harassment, promoting effective
communication within and among groups in the community; resorting to the mediation and conciliation (court
house) in the community when confidence has been lost in government institutions responsible for conflict
resolution.
Keywords: Conflict, Conflict Management, Conflict Prevention, Conciliation, Mediation, Social Conflict.
© ICBTS Copyright by Author(s) The 2016 International Academic Research Conference in Boston -Toronto 181
THE ACCEPTANCE OF SOCIAL NETWORKING SYSTEMS AS AN
E-LEARNING TOOL IN ODL INSTITUTIONS: STUDENTS’
PERCEPTION
*Michael C. Cant,
University of South Africa (Unisa), South Africa
Department of Marketing and Retail Management
E-mail: [email protected]
Tel.: +27 (0)12 429 4456
Johannes A. Wiid,
University of South Africa (Unisa), South Africa
Department of Marketing and Retail Management
E-mail: [email protected]
Tel.: +27 (0)12 429 3939
ABSTRACT
Over the past few years, technology has modernised the way in which we live, the way we do business, the
methods we use to communicate and the way in which we learn. Technology has ultimately provided many
new methods of communicating and has changed the way in which students interact with each other. This had
an impact on the way in which students of today interact with their learning environment as well. Educational
institutions have started to make use of technology to better their interaction with students and the level of
education that they provide. Open and Distance Learning (ODL) institutions have made use of this technology
to provide a better learning environment and service to the students. The main purpose of this study was
therefore to determine the level of acceptance of e-learning systems and technology in ODL institutions.
Within the context of an ODL institution, the study aimed to (1) explore the constructs of the TAM model
with regard to the student’s view; and (2) explore the proposed constructs using the TAM model.
In order to determine the acceptance of social media as a lecturing tool, a questionnaire was developed which
mostly incorporated questions that are of a quantitative nature. A total of 221 viable questionnaires were
obtained. The respondents mostly comprised of students between the ages of 18 and 29 (109 or 55.05%) and
the gender split for the respondent group was dominated by females (126 or 63%).
To identify the relationship between the chosen constructs, regression analysis is performed on the constructs,
keeping in mind the flow structure of the TAM model. This was achieved by performing two separate
regression analyses. The first tested the relationship between single predictor ease of use and usefulness as the
dependent variable. From the analysis, a significant model emerged (F1,160≈63.32; p<0.0001) with a R Square
of 0.28. The second regression analysis tested the relationship between predictors and attitude/intention as the
dependent variable. From the analysis, a significant model emerged (F2,160≈251.47; p<0.0001) with the
adjusted R Square of 0.76. The proposed positive linkage between perceived usefulness and ease of use from
the first hypotheses (H1) is significant. It is clear from the empirical analysis that usefulness plays a significant
role in predicting attitude/intention toward social network systems (H2). Ease of use has also been found to be
a significant factor in determining attitude/intention toward social network systems confirming the second
hypothesis (H3). Findings presented in the Table 5 suggest that usefulness (β= .68), in comparison to ease of
use (β= .29), has more impact on attitude/intention toward social network systems.
The study has also looked at ease of use as a predictor, taking usefulness as a dependent variable. Social
network systems are an integral part of everyday life and students are motivated to use them. It is therefore
recommended that institutions of higher learning put mechanisms in place to support the use of social

© ICBTS Copyright by Author(s) The 2016 International Academic Research Conference in Boston -Toronto 182
networking systems by students. It is further recommended that higher learning institutions develop social
network-friendly programmes and material in order to enhance the students’ learning experiences.
Keywords: Social networking systems; open distance learning (ODL) institutions; technology; TAM; e-
learning tools; students
© ICBTS Copyright by Author(s) The 2016 International Academic Research Conference in Boston -Toronto 183
USER AUTHENTICATION SCHEMES: CONSIDERING SECURITY
AND USABILITY OF GRAPHICAL PASSWORD
Adebayo Muideen Yisau and Dr. Olumide Babatope LONGE University of Ibadan, Nigeria
Email: [email protected]
ABSTRACT
User Authentication Schemes play a significant role in today's information security. With the reduction in
the cost of computer system, there is increased demand and high reliance on the use of computer in many
applications such as data transfer, data sharing, login to e-mail or Internet. Due to increased number of users,
it can be inferred that there is increase in the amount of data stored in databases. Strong text-based
passwords have been typically used to offer some assurance of security, but users end-up writing them down
on pieces of papers because of the problem of memorability. Thus the introduction of graphical-based
password becomes imperative, because Psychologist opined that human beings have natural inclination to
remember images more easily than text. Generally passwords have two essential aspects: usability and
security. This paper presents a review of the security and usability features of different graphical password
authentication schemes and presents what to be considered in having a balance between usability and
security of graphical password as a future work.
© ICBTS Copyright by Author(s) The 2016 International Academic Research Conference in Boston -Toronto 184
IMPACTS OF ENVIRONMENTAL FACTORS AFFECTING
SOFTWARE MAINTENANCE PRODUCTIVITY TO THE
CUSTOMER SATISFACTION AND RETENTION OF
SOFTWARE PRODUCT ORIENTED
COMPANIES IN SRI LANKA
Ahilan Rajendram Department of Computer Science and Engineering
University of Moratuwa, Sri Lanka
Email: [email protected]
Chandana Gamage Department of Computer Science and Engineering
University of Moratuwa, Sri Lanka
Email: [email protected]
ABSTRACT
Software Maintenance is being the cash cow of software industry. On current basis, maintenance is claiming
a larger fraction of the available personal resources than it has historically. While Sri Lankan ICT industry is
moving ahead in achieving the ICT export value of USD 5 billion by 2020, lack of trained manpower is
being the biggest hindrance. The biggest challenge is increasing the productivity of software maintenance
with the efficient usage of the man power, with no negative impacts to the customer satisfaction and
retention.
Nearly 50% of the companies who contributed to the year 2010 IT export value are software product
oriented companies who maximise their profits in maintenance phase. Our study is to identify the
environmental factors influencing software maintenance in software product oriented organizations and
finding their impacts to the customer satisfaction and customer retention. Identification of this as either
aiding or hindering productivity enables management to take necessary steps to encourage the positive
influences and eliminate the negative ones.
Labour hour, the input of Software Maintenance can be modelled as the function of the size and complexity
of software plus the affecting environmental factors. Reduction of labour hour to increase the productivity is
possible via encouraging the positively influencing environmental factors and eliminating the negative ones.
We identified these positive factors and their impacts to customer satisfaction and retention via two levels of
surveys, in Sri Lankan product oriented companies.
As per our findings, maintenance staffs’ capability and educational background in software maintenance are
positively influencing personnel factors. Same in project management is deadline pressure and in end-user,
software reliability, UAT sign-off responsibility and application knowledge. Modern structured analysis,
design and programming practices with IDE and quality documentation are positive technical environmental
factors. Staffs’ motivational factors and reward schemes are the organizational factors influence positively.
Keywords: Software Maintenance Productivity, Customer Satisfaction, Customer Retention, Product
Oriented Organization, Environmental Factors
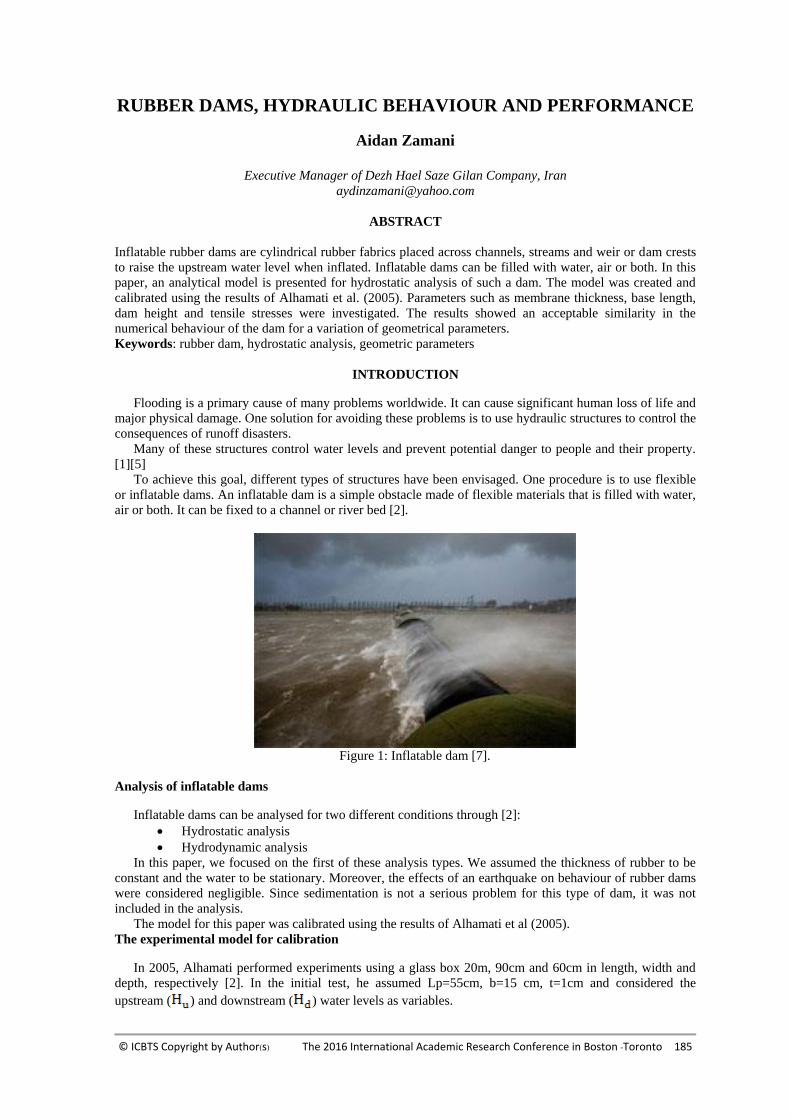
© ICBTS Copyright by Author(s) The 2016 International Academic Research Conference in Boston -Toronto 185
RUBBER DAMS, HYDRAULIC BEHAVIOUR AND PERFORMANCE
Aidan Zamani
Executive Manager of Dezh Hael Saze Gilan Company, Iran
ABSTRACT
Inflatable rubber dams are cylindrical rubber fabrics placed across channels, streams and weir or dam crests
to raise the upstream water level when inflated. Inflatable dams can be filled with water, air or both. In this
paper, an analytical model is presented for hydrostatic analysis of such a dam. The model was created and
calibrated using the results of Alhamati et al. (2005). Parameters such as membrane thickness, base length,
dam height and tensile stresses were investigated. The results showed an acceptable similarity in the
numerical behaviour of the dam for a variation of geometrical parameters.
Keywords: rubber dam, hydrostatic analysis, geometric parameters
INTRODUCTION
Flooding is a primary cause of many problems worldwide. It can cause significant human loss of life and
major physical damage. One solution for avoiding these problems is to use hydraulic structures to control the
consequences of runoff disasters.
Many of these structures control water levels and prevent potential danger to people and their property.
[1][5]
To achieve this goal, different types of structures have been envisaged. One procedure is to use flexible
or inflatable dams. An inflatable dam is a simple obstacle made of flexible materials that is filled with water,
air or both. It can be fixed to a channel or river bed [2].
Figure 1: Inflatable dam [7].
Analysis of inflatable dams
Inflatable dams can be analysed for two different conditions through [2]:
Hydrostatic analysis
Hydrodynamic analysis
In this paper, we focused on the first of these analysis types. We assumed the thickness of rubber to be
constant and the water to be stationary. Moreover, the effects of an earthquake on behaviour of rubber dams
were considered negligible. Since sedimentation is not a serious problem for this type of dam, it was not
included in the analysis.
The model for this paper was calibrated using the results of Alhamati et al (2005).
The experimental model for calibration
In 2005, Alhamati performed experiments using a glass box 20m, 90cm and 60cm in length, width and
depth, respectively [2]. In the initial test, he assumed Lp=55cm, b=15 cm, t=1cm and considered the
upstream ( ) and downstream ( ) water levels as variables.
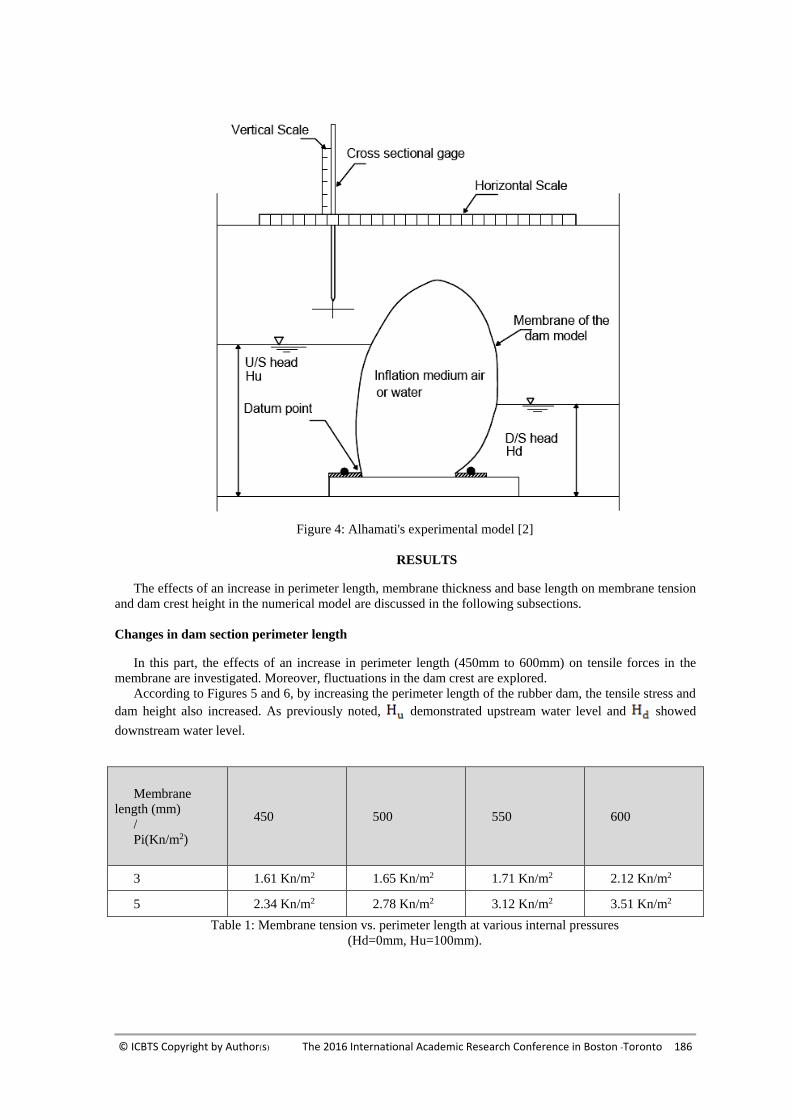
© ICBTS Copyright by Author(s) The 2016 International Academic Research Conference in Boston -Toronto 186
Figure 4: Alhamati's experimental model [2]
RESULTS
The effects of an increase in perimeter length, membrane thickness and base length on membrane tension
and dam crest height in the numerical model are discussed in the following subsections.
Changes in dam section perimeter length
In this part, the effects of an increase in perimeter length (450mm to 600mm) on tensile forces in the
membrane are investigated. Moreover, fluctuations in the dam crest are explored.
According to Figures 5 and 6, by increasing the perimeter length of the rubber dam, the tensile stress and
dam height also increased. As previously noted, demonstrated upstream water level and showed
downstream water level.
600 550 500 450
Membrane
length (mm)
/
Pi(Kn/m2)
2.12 Kn/m2 1.71 Kn/m2 1.65 Kn/m2 1.61 Kn/m2 3
3.51 Kn/m2 3.12 Kn/m2 2.78 Kn/m2 2.34 Kn/m2 5
Table 1: Membrane tension vs. perimeter length at various internal pressures
(Hd=0mm, Hu=100mm).
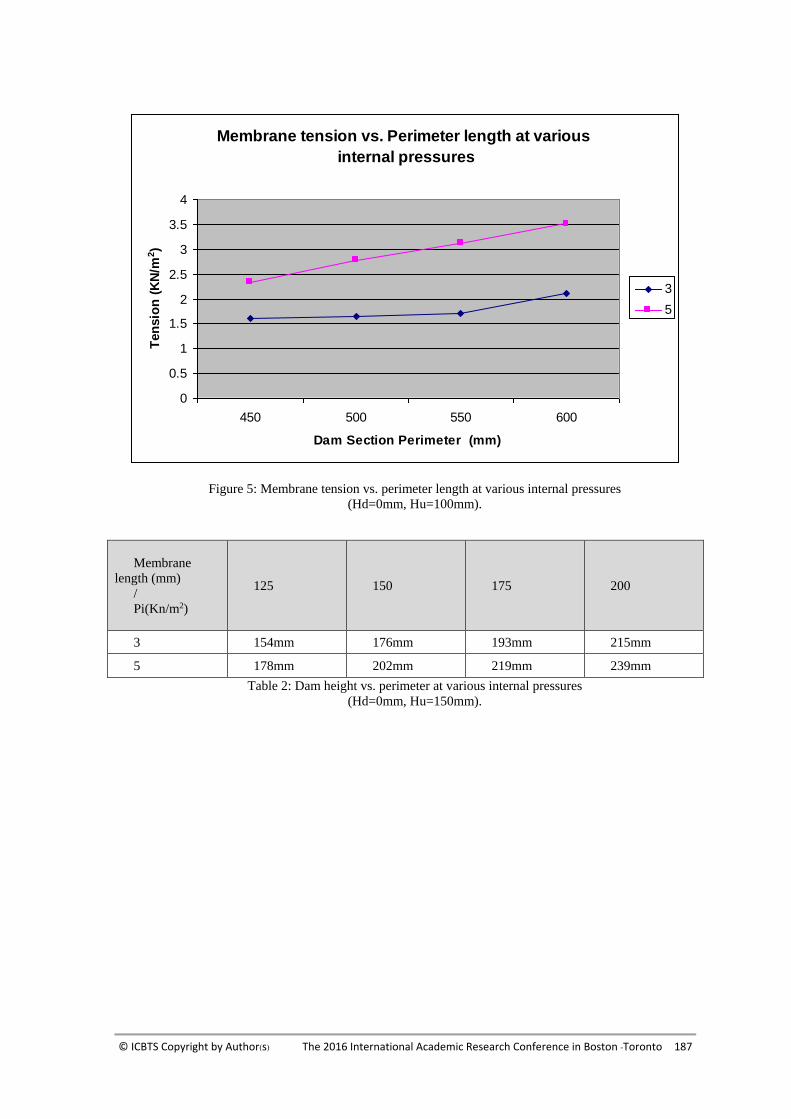
© ICBTS Copyright by Author(s) The 2016 International Academic Research Conference in Boston -Toronto 187
Membrane tension vs. Perimeter length at various
internal pressures
0
0.5
1
1.5
2
2.5
3
3.5
4
450 500 550 600
Dam Section Perimeter (mm)
Ten
sio
n (
KN
/m2)
3
5
Figure 5: Membrane tension vs. perimeter length at various internal pressures
(Hd=0mm, Hu=100mm).
200 175 150 125
Membrane
length (mm)
/
Pi(Kn/m2)
215mm 193mm 176mm 154mm 3
239mm 219mm 202mm 178mm 5
Table 2: Dam height vs. perimeter at various internal pressures
(Hd=0mm, Hu=150mm).
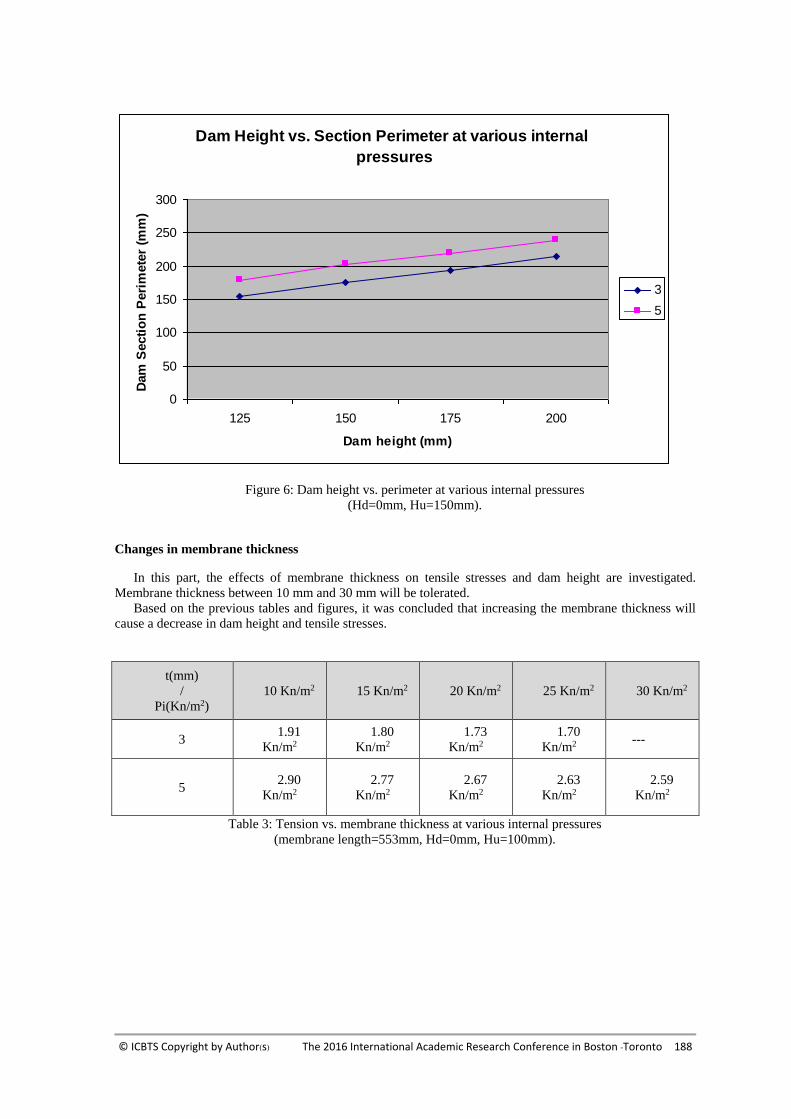
© ICBTS Copyright by Author(s) The 2016 International Academic Research Conference in Boston -Toronto 188
Dam Height vs. Section Perimeter at various internal
pressures
0
50
100
150
200
250
300
125 150 175 200
Dam height (mm)
Dam
Secti
on
Peri
mete
r (m
m)
3
5
Figure 6: Dam height vs. perimeter at various internal pressures
(Hd=0mm, Hu=150mm).
Changes in membrane thickness
In this part, the effects of membrane thickness on tensile stresses and dam height are investigated.
Membrane thickness between 10 mm and 30 mm will be tolerated.
Based on the previous tables and figures, it was concluded that increasing the membrane thickness will
cause a decrease in dam height and tensile stresses.
30 Kn/m2 25 Kn/m2 20 Kn/m2 15 Kn/m2 10 Kn/m2
t(mm)
/
Pi(Kn/m2)
--- 1.70
Kn/m2
1.73
Kn/m2
1.80
Kn/m2
1.91
Kn/m2 3
2.59
Kn/m2
2.63
Kn/m2
2.67
Kn/m2
2.77
Kn/m2
2.90
Kn/m2 5
Table 3: Tension vs. membrane thickness at various internal pressures
(membrane length=553mm, Hd=0mm, Hu=100mm).
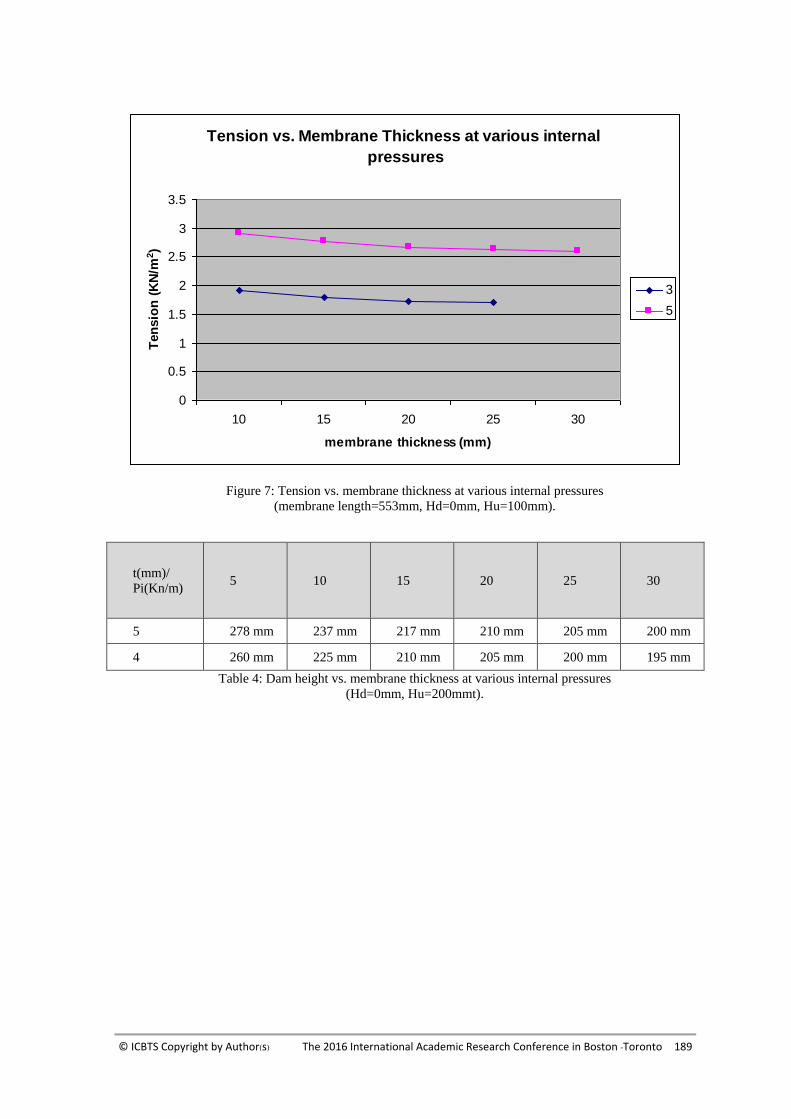
© ICBTS Copyright by Author(s) The 2016 International Academic Research Conference in Boston -Toronto 189
Tension vs. Membrane Thickness at various internal
pressures
0
0.5
1
1.5
2
2.5
3
3.5
10 15 20 25 30
membrane thickness (mm)
Ten
sio
n (
KN
/m2)
3
5
Figure 7: Tension vs. membrane thickness at various internal pressures
(membrane length=553mm, Hd=0mm, Hu=100mm).
30 25 20 15 10 5 t(mm)/
Pi(Kn/m)
200 mm 205 mm 210 mm 217 mm 237 mm 278 mm 5
195 mm 200 mm 205 mm 210 mm 225 mm 260 mm 4
Table 4: Dam height vs. membrane thickness at various internal pressures
(Hd=0mm, Hu=200mmt).
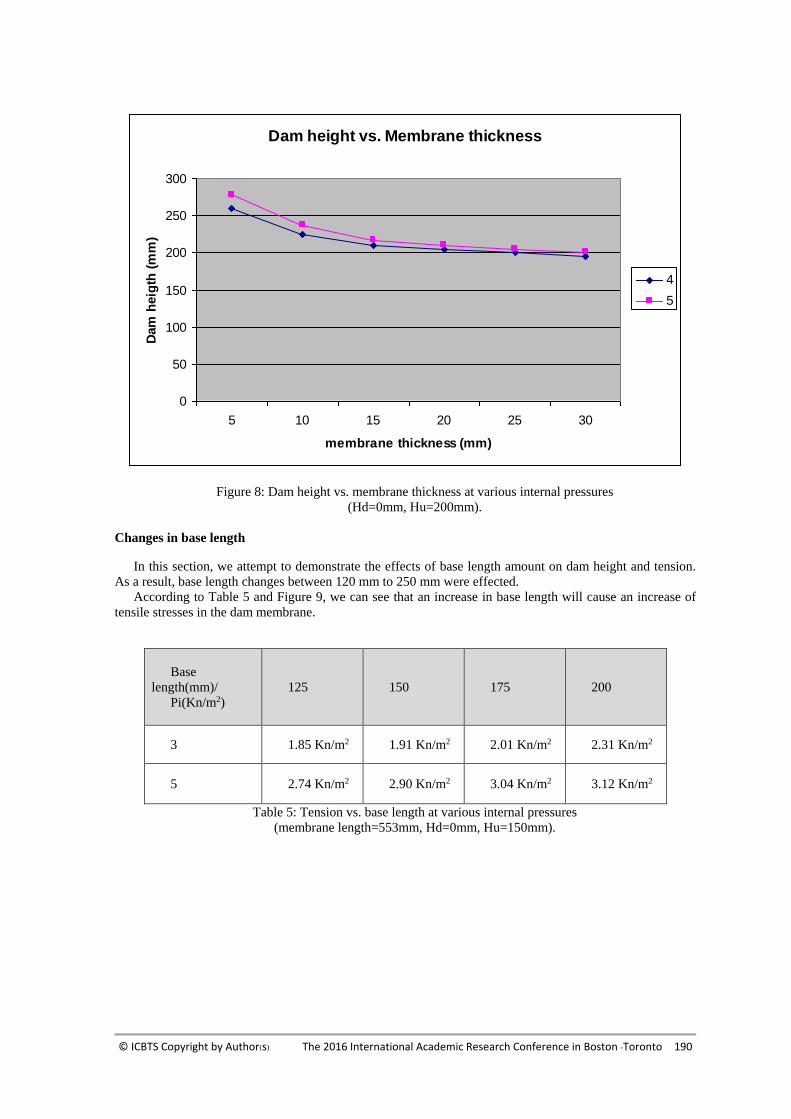
© ICBTS Copyright by Author(s) The 2016 International Academic Research Conference in Boston -Toronto 190
Dam height vs. Membrane thickness
0
50
100
150
200
250
300
5 10 15 20 25 30
membrane thickness (mm)
Dam
heig
th (
mm
)
4
5
Figure 8: Dam height vs. membrane thickness at various internal pressures
(Hd=0mm, Hu=200mm).
Changes in base length
In this section, we attempt to demonstrate the effects of base length amount on dam height and tension.
As a result, base length changes between 120 mm to 250 mm were effected.
According to Table 5 and Figure 9, we can see that an increase in base length will cause an increase of
tensile stresses in the dam membrane.
200 175 150 125
Base
length(mm)/
Pi(Kn/m2)
2.31 Kn/m2 2.01 Kn/m2 1.91 Kn/m2 1.85 Kn/m2 3
3.12 Kn/m2 3.04 Kn/m2 2.90 Kn/m2 2.74 Kn/m2 5
Table 5: Tension vs. base length at various internal pressures
(membrane length=553mm, Hd=0mm, Hu=150mm).
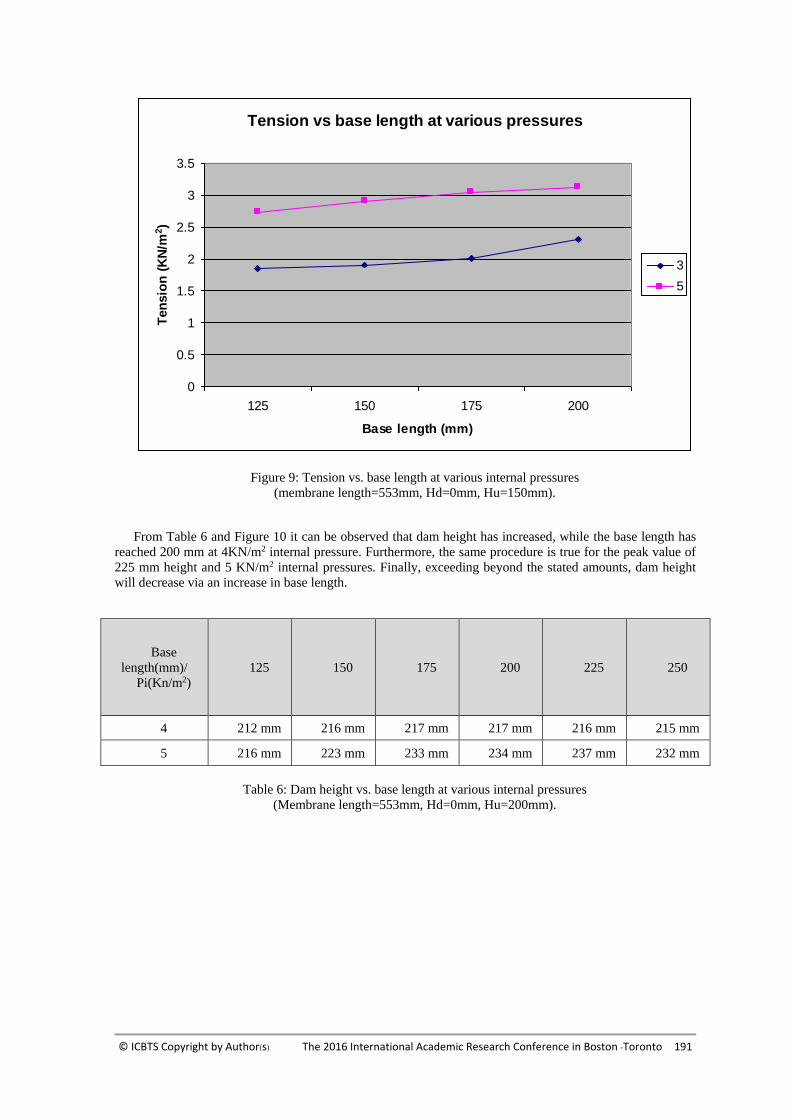
© ICBTS Copyright by Author(s) The 2016 International Academic Research Conference in Boston -Toronto 191
Tension vs base length at various pressures
0
0.5
1
1.5
2
2.5
3
3.5
125 150 175 200
Base length (mm)
Ten
sio
n (
KN
/m2)
3
5
Figure 9: Tension vs. base length at various internal pressures
(membrane length=553mm, Hd=0mm, Hu=150mm).
From Table 6 and Figure 10 it can be observed that dam height has increased, while the base length has
reached 200 mm at 4KN/m2 internal pressure. Furthermore, the same procedure is true for the peak value of
225 mm height and 5 KN/m2 internal pressures. Finally, exceeding beyond the stated amounts, dam height
will decrease via an increase in base length.
250 225 200 175 150 125
Base
length(mm)/
Pi(Kn/m2)
215 mm 216 mm 217 mm 217 mm 216 mm 212 mm 4
232 mm 237 mm 234 mm 233 mm 223 mm 216 mm 5
Table 6: Dam height vs. base length at various internal pressures
(Membrane length=553mm, Hd=0mm, Hu=200mm).
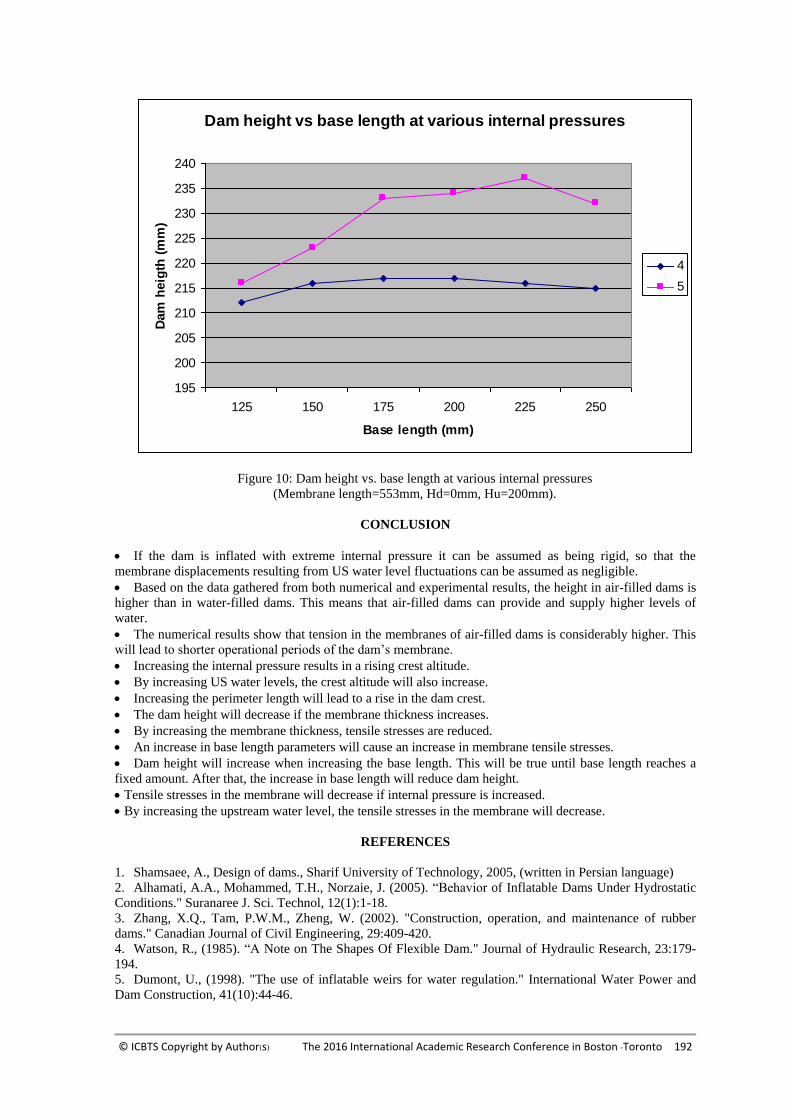
© ICBTS Copyright by Author(s) The 2016 International Academic Research Conference in Boston -Toronto 192
Dam height vs base length at various internal pressures
195
200
205
210
215
220
225
230
235
240
125 150 175 200 225 250
Base length (mm)
Dam
heig
th (
mm
)
4
5
Figure 10: Dam height vs. base length at various internal pressures
(Membrane length=553mm, Hd=0mm, Hu=200mm).
CONCLUSION
If the dam is inflated with extreme internal pressure it can be assumed as being rigid, so that the
membrane displacements resulting from US water level fluctuations can be assumed as negligible.
Based on the data gathered from both numerical and experimental results, the height in air-filled dams is
higher than in water-filled dams. This means that air-filled dams can provide and supply higher levels of
water.
The numerical results show that tension in the membranes of air-filled dams is considerably higher. This
will lead to shorter operational periods of the dam’s membrane.
Increasing the internal pressure results in a rising crest altitude.
By increasing US water levels, the crest altitude will also increase.
Increasing the perimeter length will lead to a rise in the dam crest.
The dam height will decrease if the membrane thickness increases.
By increasing the membrane thickness, tensile stresses are reduced.
An increase in base length parameters will cause an increase in membrane tensile stresses.
Dam height will increase when increasing the base length. This will be true until base length reaches a
fixed amount. After that, the increase in base length will reduce dam height.
Tensile stresses in the membrane will decrease if internal pressure is increased.
By increasing the upstream water level, the tensile stresses in the membrane will decrease.
REFERENCES
1. Shamsaee, A., Design of dams., Sharif University of Technology, 2005, (written in Persian language)
2. Alhamati, A.A., Mohammed, T.H., Norzaie, J. (2005). “Behavior of Inflatable Dams Under Hydrostatic
Conditions." Suranaree J. Sci. Technol, 12(1):1-18.
3. Zhang, X.Q., Tam, P.W.M., Zheng, W. (2002). "Construction, operation, and maintenance of rubber
dams." Canadian Journal of Civil Engineering, 29:409-420.
4. Watson, R., (1985). “A Note on The Shapes Of Flexible Dam." Journal of Hydraulic Research, 23:179-
194.
5. Dumont, U., (1998). "The use of inflatable weirs for water regulation." International Water Power and
Dam Construction, 41(10):44-46.

© ICBTS Copyright by Author(s) The 2016 International Academic Research Conference in Boston -Toronto 193
6. Parbery, R.D., (1978). "Factors affecting the membrane dam inflated by air pressure." Proceeding of the
Institution of Civil Engineers, Part2, 65:645-654.
7. www.Bridjestone Co.com.
© ICBTS Copyright by Author(s) The 2016 International Academic Research Conference in Boston -Toronto 194
APPLYING THE BCG MATRIX TO THE ACADEMIC
TRAJECTORY OF HOSPITALITY RESEARCHERS IN BRAZIL
Grace Kelly Marcelino Department of Hospitality, Anhembi Morumbi University, São Paulo, Brazil
E-mail: [email protected]
Elizabeth Kioko Wada Department of Hospitality, Anhembi Morumbi University, São Paulo, Brazil
E-mail: [email protected]
Luiz Octavio de Lima Camargo Department of Hospitality, Anhembi Morumbi University, São Paulo, Brazil
E-mail: [email protected]
ABSTRACT
This article aims to use the BCG Matrix to identify course more performed by Brazilian researchers studying
hospitality. Exploratory research through bibliographical and documentary survey. When applying the
matrix in the academic trajectory of a group of researchers, can show a scenario with contributions to
universities, professional hospitality or research and / or investments in this area. In April 2014, 693
curriculum were downloaded from the Lattes Platform (database of the National Council for Scientific and
Technological Development - CNPq), because they contained the word hospitality. To determine the sample
was used the Gaussian formula that culminated in 70 curriculum, chosen in random order. To apply the BCG
Matrix was used the data from researchers they did articles published in journals included the word
hospitality, resulting in 21 researchers and 59 articles. The study allowed to apply the concept of BCG
Matrix to the academic trajectory of hospitality researchers in Brazil. Despite the diversity of obtained
courses like performed by these researchers both at graduation, the master and doctorate, it is noted that
some are present in both circumstances, such as Geography, History, Law and Nursing, but do not represent
the areas most researching the subject hospitality However researchers with masters and doctoral courses in
Business Administration, Communication Sciences and Production Engineering, but with a different
graduation, are those with greater expressiveness in queries related to hospitality.
Keyword: BCG Matrix, Higher education, Hospitality, Researchers.
INTRODUCTION
The society changes as well as the practices and the same happens with the theme hospitality. The
interest to search this area is increasing on a day by day basis. The number of researches about the theme
consequently increased thus there is a desire to identify who are the researchers and which are the similar
and different characteristics between them.
Being the research problem: which the academic trajectory of Brazilian researchers who study
hospitality considering the applicability of BCG Matrix? It establishes the aim to use the BCG Matrix to
identify the majority of courses realized by Brazilian researchers studying hospitality area. This is an
exploratory research and has the means of survey data referring to the undergraduate and doctorate that the
researcher has taken and has made available in the Lattes Platform. Literature researches are also included to
clarify concepts of hospitality and BCG Matrix.
1. Literature & Theory
1.1 Hospitality
Hospitality is a theme investigated in several areas of the knowledgement and its definition is
associated with the context that will be addressed. Hospitality happens in society from different dimensions
© ICBTS Copyright by Author(s) The 2016 International Academic Research Conference in Boston -Toronto 195
and modalities. Dealing with hospitality comprises an approach based on a type of relationship between
people, therefore, often needs to mention issues in connection with culture and their characteristics.
It can be said that the search in hospitality uses an entire methodology of social
sciences, seeking to cover the most diverse aspects of social reality. However,
the way of each one of the disciplines places differences of each approach
(SALLES, 2010, p. 09).
The study of hospitality seeks to understand the complexity of social relations in the contemporary
and globalized world, where, at the same time, the frontiers are not rigid and are apparently mixed, there are
differences and inequalities. It will also help to analize the hospitable behavior of each social group, which
varies not only from one region to another, but of communities, groups and individuals.
Many times the hospitality is considered a product or servisse and/or defined basically as the act of
a welcoming and providing service to someone from outside. But hospitality is not limited just to hotels,
restaurants, shops and entertainment venues. Hospitality works differently in each region and for each
individual. Hospitality is not providing only shelter and food but it has a more comprehensive concept,
which involves a set of structures, services and atitudes, related to provide well-being (DIAS, 2002).
Hospitality is a sociocultural, professional, political and spatial phenomenon and the reason to be
characterized as sociocultural is because the hospitable action is realized by an individual or a group and the
disposition to receive is variable and may be voluntary or not.
Professional hospitality is composed by a combination of tangible and intangible aspects; there is
interaction between the service and the provider, consumer and guest; the imparting of security,
physiological and psychological comfort with food, drink and accommodation; can be profitable or not. The
public sector is involved for the creation of a friendly environment in a geographical scale. The spatial
dimension shows that the hospitality may occur in rural and urban spaces.
Hospitality is a rich and complex acquaintanceship due to conflicts, commitments, rules and
adjustments and that is why there are those who prefer only the neutrality of hotels and restaurants. The
hospitality in tourism, in general, occurs as a staging (paid), seen by society as the status unlike what
occurred in Antiquity. Despite the commercial activity be as opposed to donation, they are connected at the
same time due to the base of the commercial hospitality be the free one, or the gift.
In a free hospitality a guest can be expected or unexpected and the host can accept the visitor or not.
In a commercial relationship the donation becomes a duty. At the same time that the host is present he is
absent for the customer. In a commercial hospitality there is no commitment to retribute, therefore the
strategy for the return of the guest return is the establishment of the loyalty (the plus). The hospitality
normally is analyzed and the studies are focused on the host and its virtues and/or duties, without waiting
counterparts.
1.2 Product Portfolio and BCG Matrix
Companies need to have a portfolio of products, that is, a list of different product segments of prices
and market position, thus reaching customers from several niches in order to obtain success. In such a
portfolio there will be products of high growth which will require inputs of money and those of low growth
that generate extra money for the cash flow. The ideal is to have both types simultaneously. Some rules will
determine the cash flow of product (STERN & DEIMLER, 2006):
Margins and generated cash flow as functions of the market share. The high margins and
participation of high market go together. This is a matter of common remark, explained by the
effect of the curve of experience.
Growth requires input from cash flow to finance the additional assets. The money added necessary
to maintain market share is a function of the rates of growth.
Part of the high level of market participation must be conquered or purchased. Buying market
requires additional increase of investment.
© ICBTS Copyright by Author(s) The 2016 International Academic Research Conference in Boston -Toronto 196
On the market of products none can grow indefinitely. The return of growth must come when the
growth slows down, or never come. Payment is in cash which can not be reinvested in the same
product.
The items of the portfolio of products can be framed in different positions in the market
environment; these four positions that are distinguished by the propensity can generate or consume the
financial resources, explains Gracioso (1996). Therefore, it is possible to understand that the portfolio of
products facilitate decisions regarding the priority and the distribution of resources.
To measure and analyze the position of the product on the market it can be uses the BCG Matrix
that was created by the founder of the Boston Consulting Group in the decade of 70 with the objective of
managing and classify the portfolio of products of the organization as to obtain a better distribution of
resources. "His great merit is to allow a quantitative and qualitative analysis, comparing the products of a
company in the market in relation to the main competition and its growth" (COBRA, 2001, p. 129).
The Matrix BCG is also known by the following names: B-Box, B.C.G. Analysis, BCG-Matrix,
Boston Box, Boston Matrix, Boston Consulting Group Analysis, Portfolio Diagram. Based on authors like
Stern & Deimler (2006) we have two guidelines in the Matrix BCG: (a) market share in the axis X and (b)
rate of market growth in the axis Y. Besides those four references are: Star (Estrela), Interrogation
(Interrogação), Cow (Vaca) and Pineapple (Abacaxi) as product categories.
Star (product category): is the product with a high participation in the market and with also a high
sales growth. As the profit of such product are used for reinvestments for the continuous growth, even when
it is profitable, the cash flow is almost neutral. Subsequently it starts to generate cash flow (Milky Cow).
Milky Cow (product category): produces continuous cash flow and surplus due to the low cost.
Thus the real sales growth is slow, but it has a high market share.
Pineapple (product category): it has a low market share and low sales growth rate which causes high
costs to the product due to the lower sales volume. Competing in mature markets with competitors who have
a high market participation requires great efforts to generate revenue (milky cow). When the cash flow is not
a negative one these products are reviewed or become part of the list of products to be excluded from the
portfolio and if the cash flow becomes negative such products certainly will be withdrawn.
Question ((product category): this product participation in the market is low and rotating but with a
high rate of growth in sales, it needs high investment to become star or milky cows (category products) in
the future.
On the pineapple category it is worth to stress that "although the prospects of survival are in
general very low, you cannot simply eliminate them before obtaining other categories that are able to
balance the portfolio and the company's cash generation" (COBRA, 2001, p. 131).
Figure 1: BCG Matrix
Market share
Market Growth
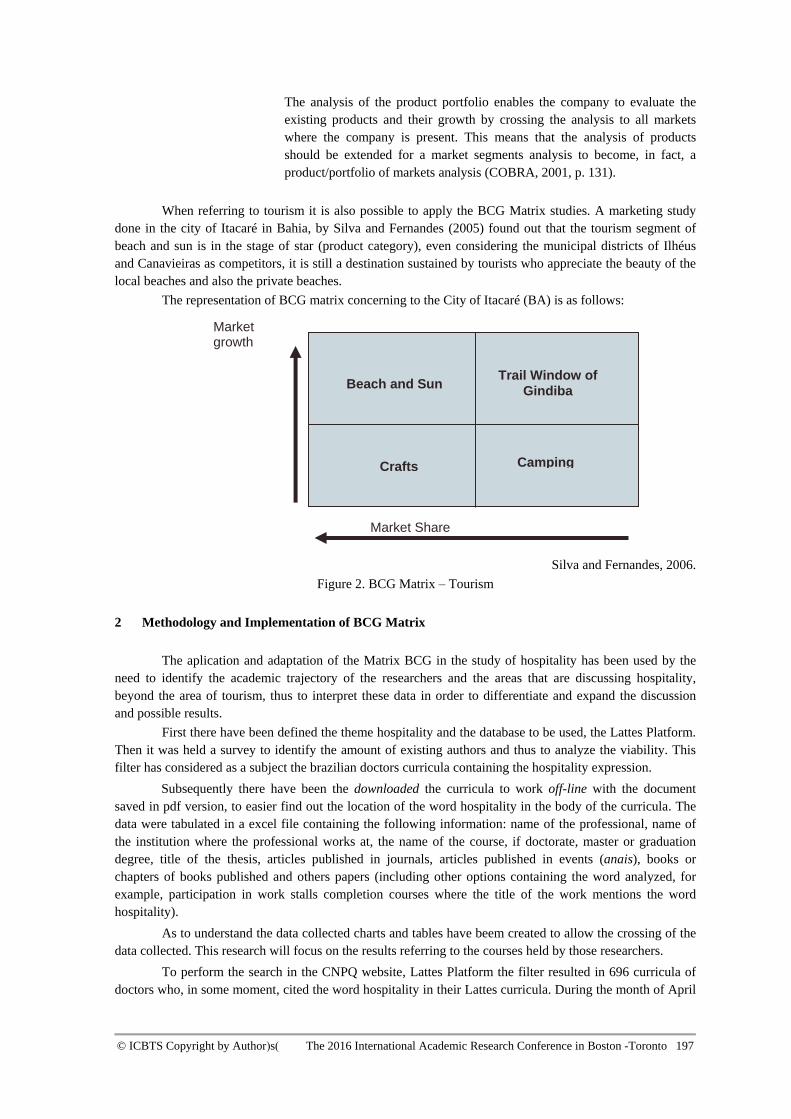
© ICBTS Copyright by Author(s) The 2016 International Academic Research Conference in Boston -Toronto 197
The analysis of the product portfolio enables the company to evaluate the
existing products and their growth by crossing the analysis to all markets
where the company is present. This means that the analysis of products
should be extended for a market segments analysis to become, in fact, a
product/portfolio of markets analysis (COBRA, 2001, p. 131).
When referring to tourism it is also possible to apply the BCG Matrix studies. A marketing study
done in the city of Itacaré in Bahia, by Silva and Fernandes (2005) found out that the tourism segment of
beach and sun is in the stage of star (product category), even considering the municipal districts of Ilhéus
and Canavieiras as competitors, it is still a destination sustained by tourists who appreciate the beauty of the
local beaches and also the private beaches.
The representation of BCG matrix concerning to the City of Itacaré (BA) is as follows:
Silva and Fernandes, 2006.
Figure 2. BCG Matrix – Tourism
2 Methodology and Implementation of BCG Matrix
The aplication and adaptation of the Matrix BCG in the study of hospitality has been used by the
need to identify the academic trajectory of the researchers and the areas that are discussing hospitality,
beyond the area of tourism, thus to interpret these data in order to differentiate and expand the discussion
and possible results.
First there have been defined the theme hospitality and the database to be used, the Lattes Platform.
Then it was held a survey to identify the amount of existing authors and thus to analyze the viability. This
filter has considered as a subject the brazilian doctors curricula containing the hospitality expression.
Subsequently there have been the downloaded the curricula to work off-line with the document
saved in pdf version, to easier find out the location of the word hospitality in the body of the curricula. The
data were tabulated in a excel file containing the following information: name of the professional, name of
the institution where the professional works at, the name of the course, if doctorate, master or graduation
degree, title of the thesis, articles published in journals, articles published in events (anais), books or
chapters of books published and others papers (including other options containing the word analyzed, for
example, participation in work stalls completion courses where the title of the work mentions the word
hospitality).
As to understand the data collected charts and tables have beem created to allow the crossing of the
data collected. This research will focus on the results referring to the courses held by those researchers.
To perform the search in the CNPQ website, Lattes Platform the filter resulted in 696 curricula of
doctors who, in some moment, cited the word hospitality in their Lattes curricula. During the month of April
Camping
Trail Window of
Gindiba
Crafts
Beach and Sun
Market growth
Market Share
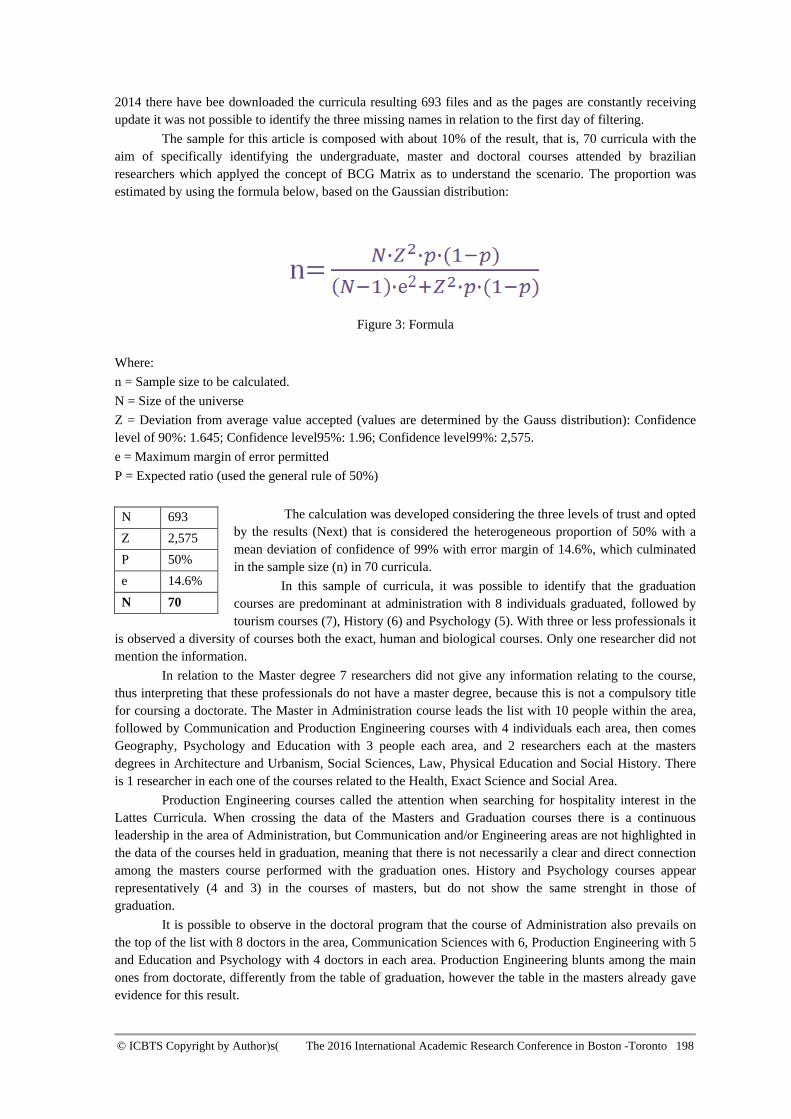
© ICBTS Copyright by Author(s) The 2016 International Academic Research Conference in Boston -Toronto 198
2014 there have bee downloaded the curricula resulting 693 files and as the pages are constantly receiving
update it was not possible to identify the three missing names in relation to the first day of filtering.
The sample for this article is composed with about 10% of the result, that is, 70 curricula with the
aim of specifically identifying the undergraduate, master and doctoral courses attended by brazilian
researchers which applyed the concept of BCG Matrix as to understand the scenario. The proportion was
estimated by using the formula below, based on the Gaussian distribution:
Figure 3: Formula
Where:
n = Sample size to be calculated.
N = Size of the universe
Z = Deviation from average value accepted (values are determined by the Gauss distribution): Confidence
level of 90%: 1.645; Confidence level95%: 1.96; Confidence level99%: 2,575.
e = Maximum margin of error permitted
P = Expected ratio (used the general rule of 50%)
The calculation was developed considering the three levels of trust and opted
by the results (Next) that is considered the heterogeneous proportion of 50% with a
mean deviation of confidence of 99% with error margin of 14.6%, which culminated
in the sample size (n) in 70 curricula.
In this sample of curricula, it was possible to identify that the graduation
courses are predominant at administration with 8 individuals graduated, followed by
tourism courses (7), History (6) and Psychology (5). With three or less professionals it
is observed a diversity of courses both the exact, human and biological courses. Only one researcher did not
mention the information.
In relation to the Master degree 7 researchers did not give any information relating to the course,
thus interpreting that these professionals do not have a master degree, because this is not a compulsory title
for coursing a doctorate. The Master in Administration course leads the list with 10 people within the area,
followed by Communication and Production Engineering courses with 4 individuals each area, then comes
Geography, Psychology and Education with 3 people each area, and 2 researchers each at the masters
degrees in Architecture and Urbanism, Social Sciences, Law, Physical Education and Social History. There
is 1 researcher in each one of the courses related to the Health, Exact Science and Social Area.
Production Engineering courses called the attention when searching for hospitality interest in the
Lattes Curricula. When crossing the data of the Masters and Graduation courses there is a continuous
leadership in the area of Administration, but Communication and/or Engineering areas are not highlighted in
the data of the courses held in graduation, meaning that there is not necessarily a clear and direct connection
among the masters course performed with the graduation ones. History and Psychology courses appear
representatively (4 and 3) in the courses of masters, but do not show the same strenght in those of
graduation.
It is possible to observe in the doctoral program that the course of Administration also prevails on
the top of the list with 8 doctors in the area, Communication Sciences with 6, Production Engineering with 5
and Education and Psychology with 4 doctors in each area. Production Engineering blunts among the main
ones from doctorate, differently from the table of graduation, however the table in the masters already gave
evidence for this result.
N 693
Z 2,575
P 50%
e 14.6%
N 70
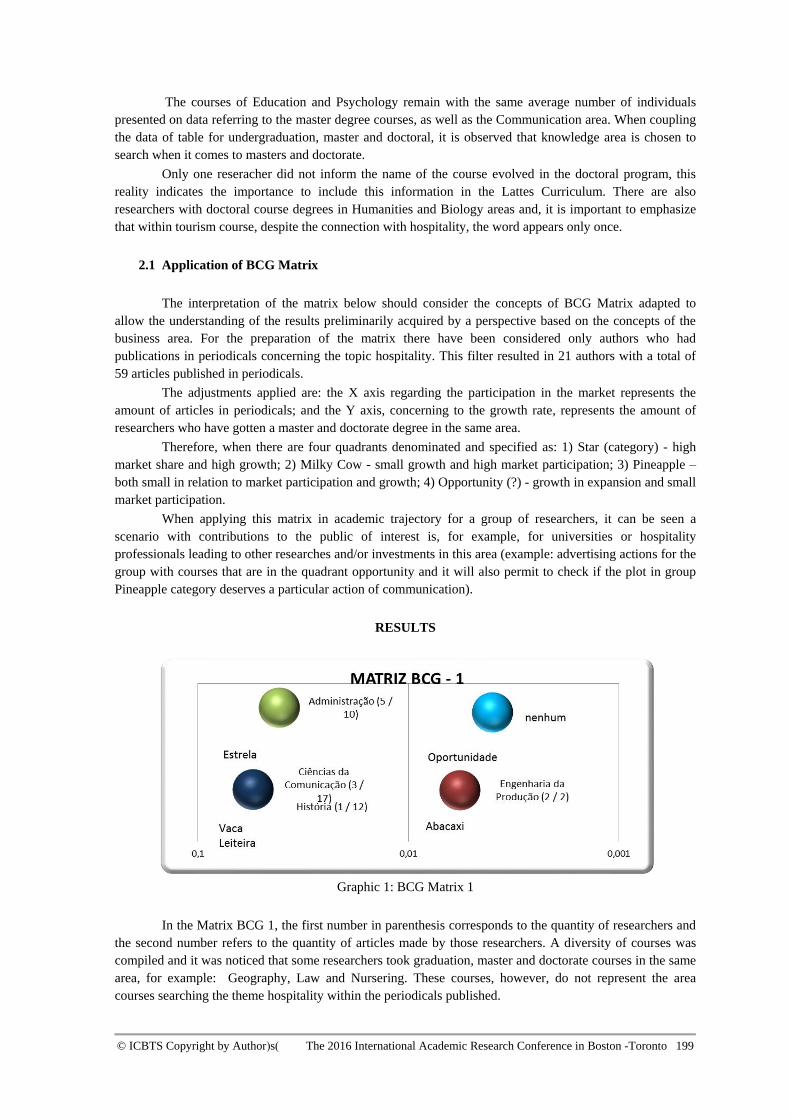
© ICBTS Copyright by Author(s) The 2016 International Academic Research Conference in Boston -Toronto 199
The courses of Education and Psychology remain with the same average number of individuals
presented on data referring to the master degree courses, as well as the Communication area. When coupling
the data of table for undergraduation, master and doctoral, it is observed that knowledge area is chosen to
search when it comes to masters and doctorate.
Only one reseracher did not inform the name of the course evolved in the doctoral program, this
reality indicates the importance to include this information in the Lattes Curriculum. There are also
researchers with doctoral course degrees in Humanities and Biology areas and, it is important to emphasize
that within tourism course, despite the connection with hospitality, the word appears only once.
2.1 Application of BCG Matrix
The interpretation of the matrix below should consider the concepts of BCG Matrix adapted to
allow the understanding of the results preliminarily acquired by a perspective based on the concepts of the
business area. For the preparation of the matrix there have been considered only authors who had
publications in periodicals concerning the topic hospitality. This filter resulted in 21 authors with a total of
59 articles published in periodicals.
The adjustments applied are: the X axis regarding the participation in the market represents the
amount of articles in periodicals; and the Y axis, concerning to the growth rate, represents the amount of
researchers who have gotten a master and doctorate degree in the same area.
Therefore, when there are four quadrants denominated and specified as: 1) Star (category) - high
market share and high growth; 2) Milky Cow - small growth and high market participation; 3) Pineapple –
both small in relation to market participation and growth; 4) Opportunity (?) - growth in expansion and small
market participation.
When applying this matrix in academic trajectory for a group of researchers, it can be seen a
scenario with contributions to the public of interest is, for example, for universities or hospitality
professionals leading to other researches and/or investments in this area (example: advertising actions for the
group with courses that are in the quadrant opportunity and it will also permit to check if the plot in group
Pineapple category deserves a particular action of communication).
RESULTS
Graphic 1: BCG Matrix 1
In the Matrix BCG 1, the first number in parenthesis corresponds to the quantity of researchers and
the second number refers to the quantity of articles made by those researchers. A diversity of courses was
compiled and it was noticed that some researchers took graduation, master and doctorate courses in the same
area, for example: Geography, Law and Nursering. These courses, however, do not represent the area
courses searching the theme hospitality within the periodicals published.
© ICBTS Copyright by Author(s) The 2016 International Academic Research Conference in Boston -Toronto 200
However the researchers with master and doctoral courses in Administration, Communication
Sciences, History and Production Engineering, with graduation in other areas are the ones with a more
expressive search number.
The matrix BCG resulted then in the following quadrants, for the specific category: 1) Star - the
area of the Administration course counts with 5 researchers and 10 articles; 2) Milky Cow – the área of
Communication Sciences courses counts with 3 researchers and 17 articles, plus History which counts with 1
researcher and 12 articles; 3) Pineapple - the área of Production Engineering course counts with 2
researchers; 4) in the quadrant Opportunities there was no course. It is understood that the lack of progress in
the quadrant opportunities, occurs due to the need to perform a temporal monitoring to identify the courses
which may present signs of increased authors with publications in articles concerning the theme hospitality.
CONCLUSION
The study allowed us to evaluate the profile of the researcher in hospitality theme in Brazil and also
to apply the concept of BCG Matrix on the results that research has conceived on the courses and researchers
addressing the word hospitality in their research, thus, somehow the goal has been reached.
The study pemitted us to sort the display and review the data obtained by means of the Matrix BCG
and also analyze the scenario utilizing a strategic tool. Neverthless, there was no objective to pointing out the
courses as best or worst, nor to indicate any course to cease to exist or not, but just allowed to have and
evaluate the presented results, in order to facilitate and interpret in a differentiated manner within the
framework the data of the researchers interested to find out about the hospitality theme.
The researchers with master and doctoral courses in Administration, Communication Sciences and
Production Engineering, in a different scale, are those with great expressiveness on searching the subject
hospitality. For future research it is suggested to check what leads the professionals with masters and
doctorate degrees to have this connection with the expression hospitality.
REFERENCES
BUENO, Marielys Siqueira; SALLES, Maria do Rosário Rolfsen. BASTOS, Sênia. (2010). Hospitalidade:
trajetória e possibilidades. Contribuciones a las ciências sociales.
CAMARGO, Luiz Octávio de Lima. (2008). A pesquisa em hospitalidade. Revista Hospitalidade: São Paulo,
Ano V, nº 2, Pp. 15-51, july– december.
COBRA, Marcos. (2001). Marketing de Serviços: Turismo, Lazer e Negócios. São Paulo: Cobra.
DENCKER, Ada de Freitas Maneti (Org.). (2004). Planejamento e Gestão em Turismo e Hospitalidade. São
Paulo: Pioneira Thomson Learning.
DIAS, Célia Maria de Moraes. (2002). Hospitalidade: reflexões e perspectivas. São Paulo: Manole.
GOTMAN, Anne. (2009). O comércio da hospitalidade é possível? Translation: Luiz Octávio de Lima
Camargo. Revista Hospitalidade: São Paulo. Vol. VI, nº 2, Pp. 3-27.
GRACIOSO, Francisco. (1996). Planejamento estratégico orientado para o mercado: como planejar o
crescimento da empresa conciliando recursos e “cultura” com as oportunidades do ambiente externo. 3ª ed.
São Paulo: Atlas.
LASHLEY, Conrad; MORRISON, Alison. (2004). Em busca da hospitalidade: perspectivas para um mundo
globalizado. São Paulo: Manole.
OCHOA, CARLOS (2014). http://www.netquest.com/br/blog/qual-e-o-tamanho-de-amostra-que-preciso/
Access on: Feb 06, 2014.
PORTAL INOVAÇÃO. (2014). http://www.portalinovacao.mct.gov.br/pi/ Access on March 06.
SALLES, Maria do Rosário Rolfsen; BUENO, Marielys Siqueira; BASTOS, Sênia. (2010). Desafios da
pesquisa em hospitalidade. Revista Hospitalidade: São Paulo, Vol. VII, nº 1, Pp. 3-14.
SERRANO, Daniel Portillo (2006). A Matriz BCG. Portal do Marketing. São Paulo. Available at:
<http://www.portaldomarketing.com.br/Artigos/MatrizBCG.htm>. Access on: Mai 02, 2014.

© ICBTS Copyright by Author(s) The 2016 International Academic Research Conference in Boston -Toronto 201
SILVA, Marcelo; FERNANDES, Fábio. (2005). Plano Estratégico de Marketing da Trilha Janela da
Gindiba. Revista Turismo. Bahia.
STERN, Carl W; DEIMLER, Michael S. (2006). The Boston Consulting Group on Strategy. John Wiley &
Sons. New Jersey.
WADA, Elizabeth Kyoko (2003). Reflexões de um aprendiz de hospitalidade. In: DENCKER, Ada de
Freitas Maneti; BUENO, Marielys Siqueira (Orgs.). Hospitalidade, cenários e oportunidades. São Paulo:
Thomson.