Embed Size (px)
Citation preview
8/31/2016
1
Steven Krueger MD
Bryan Heart
2016 Bryan Heart Fall Cardiology Conference
Treatment of Malnutrition and Heart Failure
Currently on the speaker bureau’s for the following companies related to this talk:
Ensure Enlive – Abbott
All Honoria to Big Heart Initiative charitable fund
…One Final Disclosure..
Disclosure
A. Introduction
B. Preliminary Data
C. NOURISH Trial
D. Readmissions
E. Conclusions
Treatment of Malnutrition and Heart Failure
8/31/2016
2
OBJECTIVES
• Review the clinical impact of malnutrition and loss of lean body mass (LBM)
• Discuss the clinical and economic benefits of oral nutrition supplements (ONS)
• Present new scientific evidence of specialized ONS in the management of malnourished hospitalized patients
1. Tappenden KA et al. JPEN J Parenter Enteral Nutr. 2013;37(4):482-497. 2. Naber TH et al. Am J Clin Nutr. 1997;66(5):1232-1239.3. Somanchi M et al. JPEN J Parenter Enteral Nutr. 2011;35(2):209-216. 4. Braunschweig C et al. J Am Diet Assoc. 2000;100(11):1316-1322.
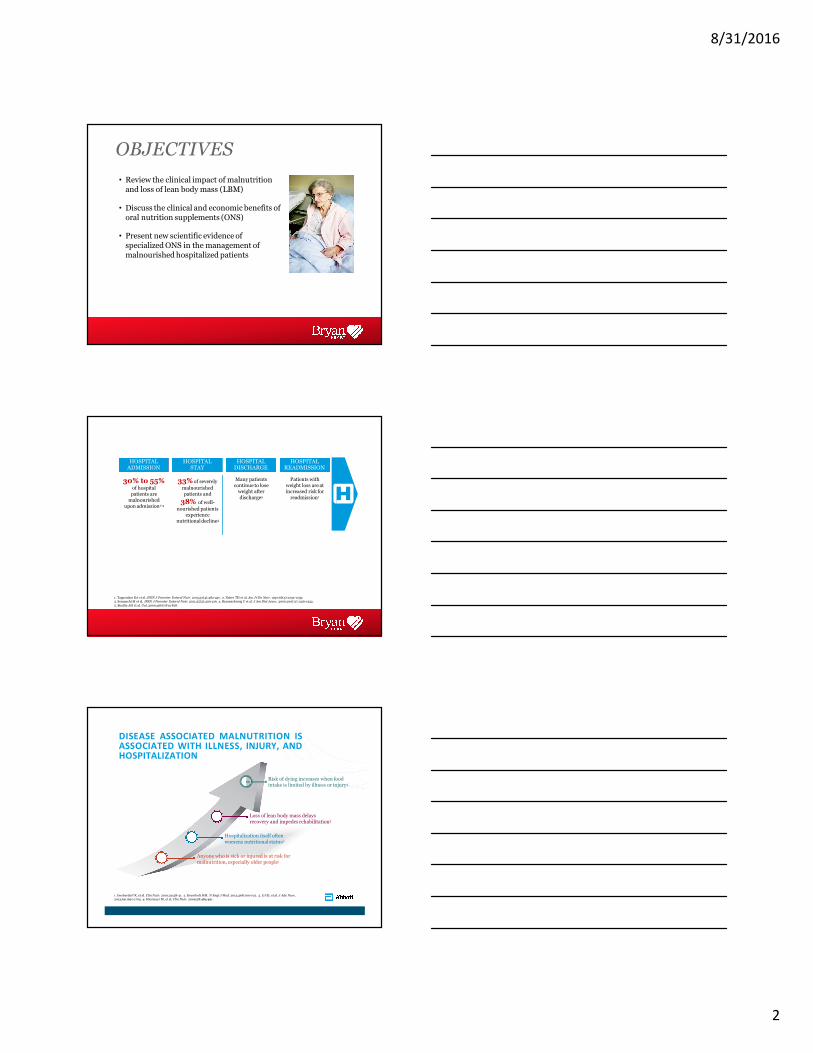
HOSPITAL ADMISSION
33% of severely
malnourished patients and
38% of well-
nourished patients experience
nutritionaldecline4
Many patients continue to lose
weight after discharge5
Patients with weight loss are at increased risk for
readmission1
HOSPITAL STAY
30% to 55%of hospital
patients are malnourished
upon admission1-4
HOSPITAL DISCHARGE
HOSPITAL READMISSION
5. Beattie AH et al. Gut.2000;46(6):813-818.
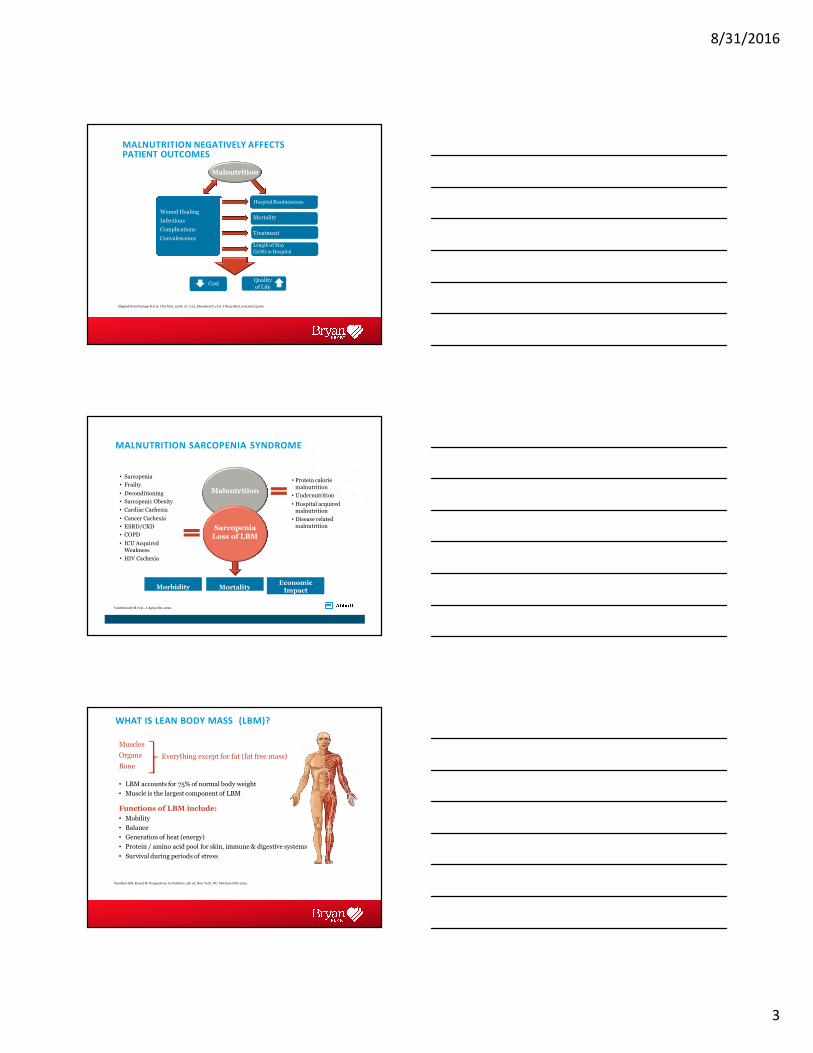
DISEASE ASSOCIATED MALNUTRITION ISASSOCIATED WITH ILLNESS, INJURY, ANDHOSPITALIZATION
Risk of dying increases when food intake is limited by illness or injury4
Loss of lean body mass delays recovery and impedes rehabilitation3
Hospitalization itself often worsens nutritionalstatus2
Anyone who is sick or injured is at risk for malnutrition, especially older people1
1. Imoberdorf R, et al. Clin Nutr. 2010;29:38-41. 2. Krumholz HM. N Engl J Med. 2013;368:100-102. 3. Li HJ, et al. J Adv Nurs.2013;69:1691-1703. 4. Hiesmayr M, et al. Clin Nutr. 2009;28:484-491.
8/31/2016
3
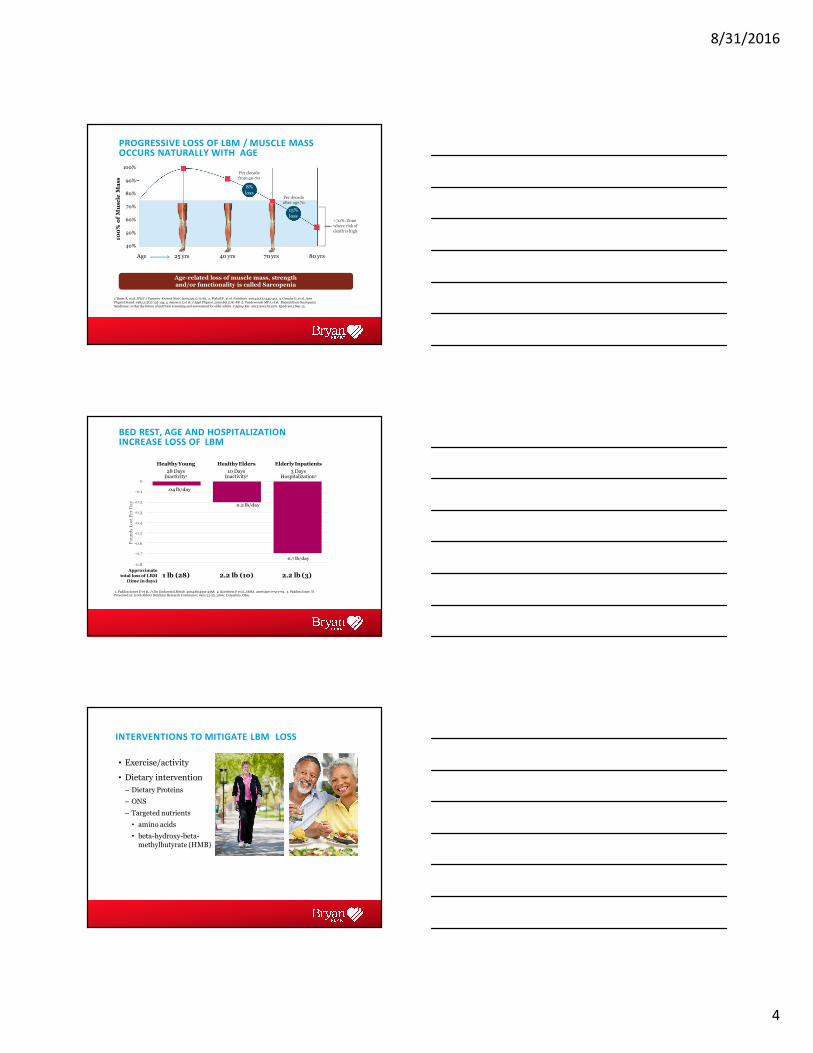
MALNUTRITION NEGATIVELY AFFECTS PATIENT OUTCOMES
Wound Healing
Infections
Complications
Convalescence
Malnutrition
Hospital Readmissions
Adapted from Norman K et al. Clin Nutr. 2008; 27: 5-15. Allaudeen N, et al. J Hosp Med. 2011;6(2):54-60.
Mortality
Treatment
Length of Stay
(LOS) in Hospital
CostQuality of Life
MALNUTRITION SARCOPENIA SYNDROME
• Protein calorie
malnutrition
• Undernutrition
• Hospital acquired malnutrition
• Disease related malnutrition
Morbidity MortalityEconomic Impact
• Sarcopenia
• Frailty
• Deconditioning
• Sarcopenic Obesity
• Cardiac Cachexia
• Cancer Cachexia
• ESRD/CKD
• COPD
• ICU Acquired Weakness
• HIV Cachexia
Sarcopenia Loss of LBM
Vandewoude M et al., J Aging Res. 2012.
Malnutrition
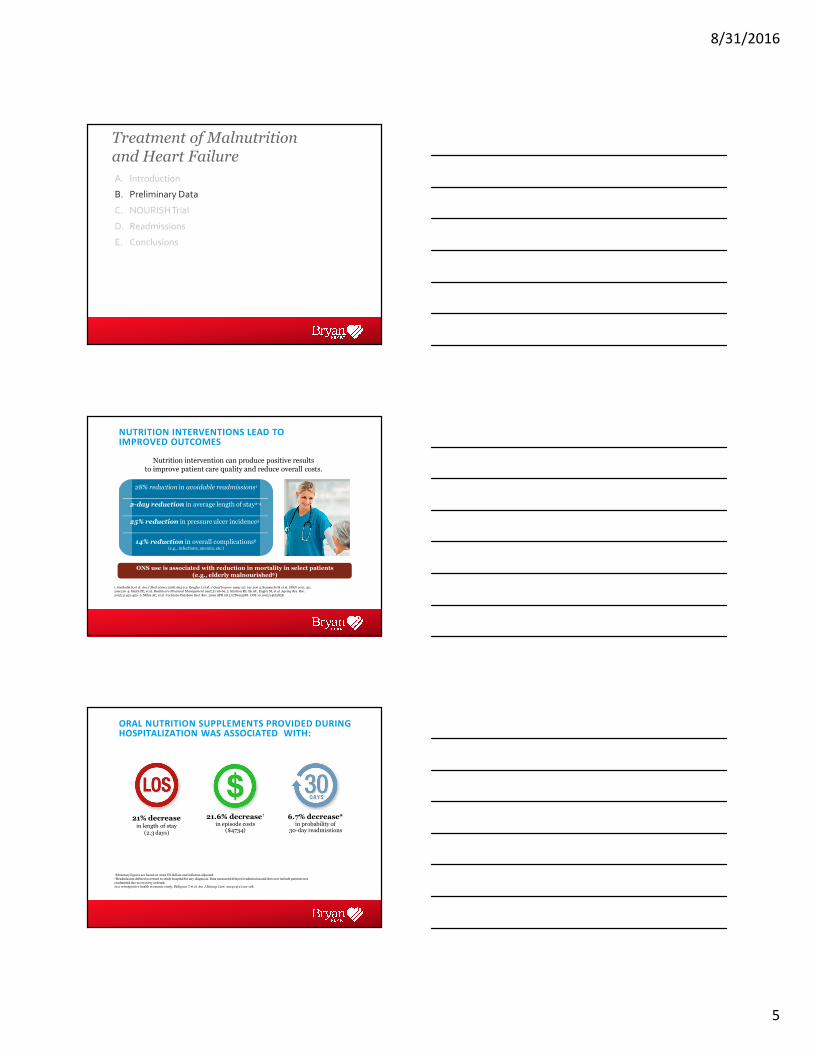
WHAT IS LEAN BODY MASS (LBM)?
Muscles
Organs
Bone
• LBM accounts for 75% of normal body weight
• Muscle is the largest component of LBM
Functions of LBM include:
• Mobility
• Balance
• Generation of heat (energy)
• Protein / amino acid pool for skin, immune & digestive systems
• Survival during periods of stress
Everything except for fat (fat free mass)
Wardlaw GM, Kessel M. Perspectives in Nutrition. 5th ed. New York, NY: McGraw-Hill; 2002.
8/31/2016
4
PROGRESSIVE LOSS OF LBM / MUSCLE MASS OCCURS NATURALLY WITH AGE
Age-related loss of muscle mass, strength
and/or functionality is called Sarcopenia
1. Baier S, et al. JPEN J Parenter Enteral Nutr. 2009;33(1):71-82. 2. Flakoll P, et al. Nutrition. 2004;20(5):445-451. 3. Grimby G, et al. Acta Physiol Scand. 1982;115(1):125-134. 4. Janssen I, et al. J Appl Physiol. 2000;89(1):81-88. 5. Vandewoude MFJ, et al. Malnutrition-Sarcopenia
100%ofMuscleMass
Age 25 yrs 40 yrs 70 yrs 80 yrs
8%loss
Per decade
from 40-70
Per decadeafter age70
15%loss
100%
40%
50%
60%
70%
80%
90%
<70%: Zone
where risk of
death is high
Syndrome: is this the future of nutrition screening and assessment for older adults. J Aging Res. 2012;2012:651570. Epub 2013 Sep 13.
BED REST, AGE AND HOSPITALIZATION INCREASE LOSS OF LBM
HealthyElders
10 Days Inactivity2
HealthyYoung
28 Days Inactivity1
Elderly Inpatients
3 Days Hospitalization3
1. Paddon-Jones D et al. J Clin Endocrinol Metab. 2004;89:4351-4358. 2. Kortebein P et al. JAMA. 2007;297:1772-1774. 3. Paddon-Jones D.
.04 lb/day
0.2 lb/day
Presented at: 110th Abbott Nutrition Research Conference; June 23-25, 2009; Columbus, Ohio.
0
-0.1
-0.2
-0.3
-0.4
-0.5
-0.6
-0.70.7 lb/day
-0.8
Po
un
ds
Lo
stP
erD
ay
1 lb (28) 2.2 lb (10) 2.2 lb (3)Approximate
total lossof LBM
(time indays)
INTERVENTIONS TO MITIGATE LBM LOSS
• Exercise/activity
• Dietary intervention
– Dietary Proteins
– ONS
– Targeted nutrients
• amino acids
• beta-hydroxy-beta-
methylbutyrate (HMB)
8/31/2016
5
A. Introduction
B. Preliminary Data
C. NOURISH Trial
D. Readmissions
E. Conclusions
Treatment of Malnutrition and Heart Failure
NUTRITION INTERVENTIONS LEAD TO IMPROVED OUTCOMES
Nutrition intervention can produce positive resultsto improve patient care quality and reduce overall costs.
28% reduction in avoidable readmissions1
2-day reduction in average length of stay2-4
25% reduction in pressure ulcer incidence5
14% reduction in overall complications6
(e.g., infections, anemia, etc.)
ONS use is associated with reduction in mortality in select patients
(e.g., elderly malnourished6)
1. Gariballa S, et al. Am J Med 2006;119(8):693-9 2. Brugler L et al. J Qual Improv 1999; 25: 191-206 3. Somanchi M et al. JPEN 2011; 35: 209-216 4. Smith PE, et al. Healthcare Financial Management 1997;51:66-69. 5. Stratton RJ, Ek AC, Engfer M, et al. Ageing Res Rev.
2005;4:422-450. 6. Milne AC, et al. Cochrane Database Syst. Rev. 2009 APR 16(2):CD003288. DOI:10.1002/14651858.
ORAL NUTRITION SUPPLEMENTS PROVIDED DURING HOSPITALIZATION WAS ASSOCIATED WITH:
21% decreasein length of stay
(2.3 days)
21.6% decrease†
in episode costs ($4734)
6.7% decrease*in probability of
30-day readmissions
†Monetary figures are based on 2010 US dollars and inflation adjusted.*Readmission defined as return to study hospital for any diagnosis. Data measured delayed readmission and does not include patients not
readmitted due to recovery ordeath.In a retrospective health economic study, Philipson T et al. Am J Manag Care. 2013;19(2):121-128.
8/31/2016
6
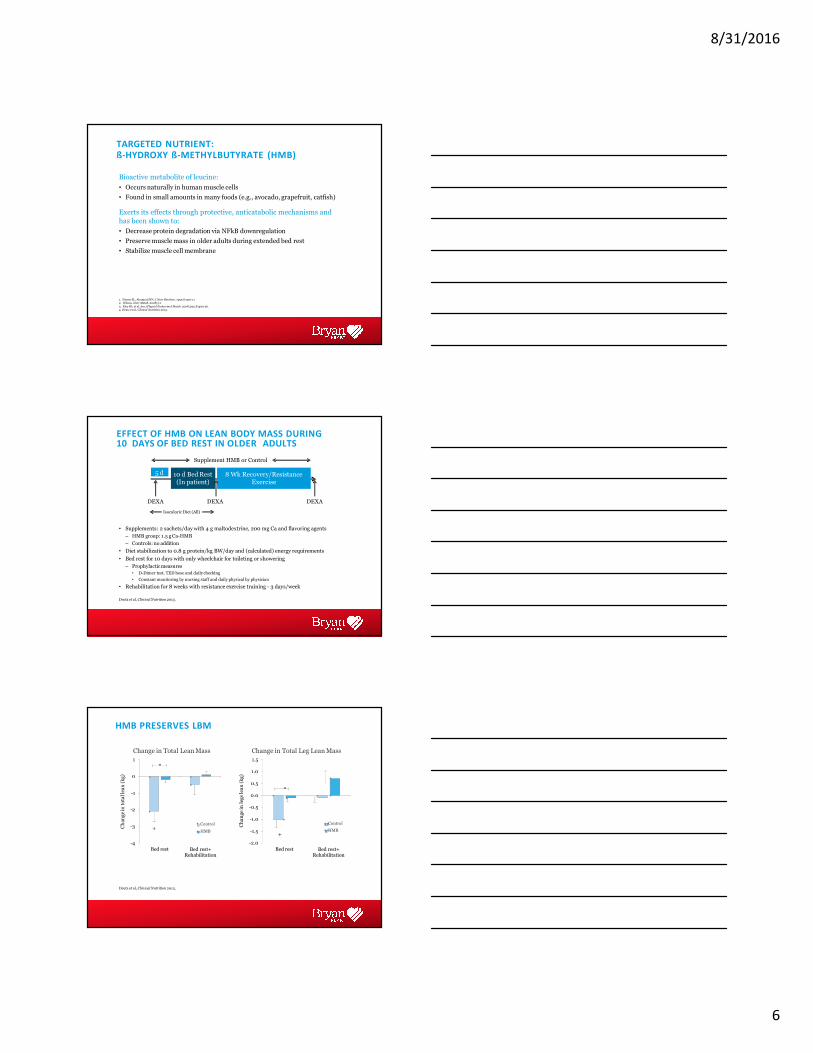
Bioactive metabolite of leucine:
• Occurs naturally in human muscle cells
• Found in small amounts in many foods (e.g., avocado, grapefruit, catfish)
Exerts its effects through protective, anticatabolic mechanisms and
has been shown to:
• Decrease protein degradation via NFkB downregulation
• Preserve muscle mass in older adults during extended bed rest
• Stabilize muscle cell membrane
4. Deutz et al., Clinical Nutrition 2013.
1. Nissen SL, Abumrad NN. J Nutr Biochem. 1997;8:300-112. Wilson. Nutr Metab. 2008;5:1
3. Eley HL et al. Am j Physiol Endocrinol Metab. 2008;295:E1409-26.
TARGETED NUTRIENT:ß-HYDROXY ß-METHYLBUTYRATE (HMB)
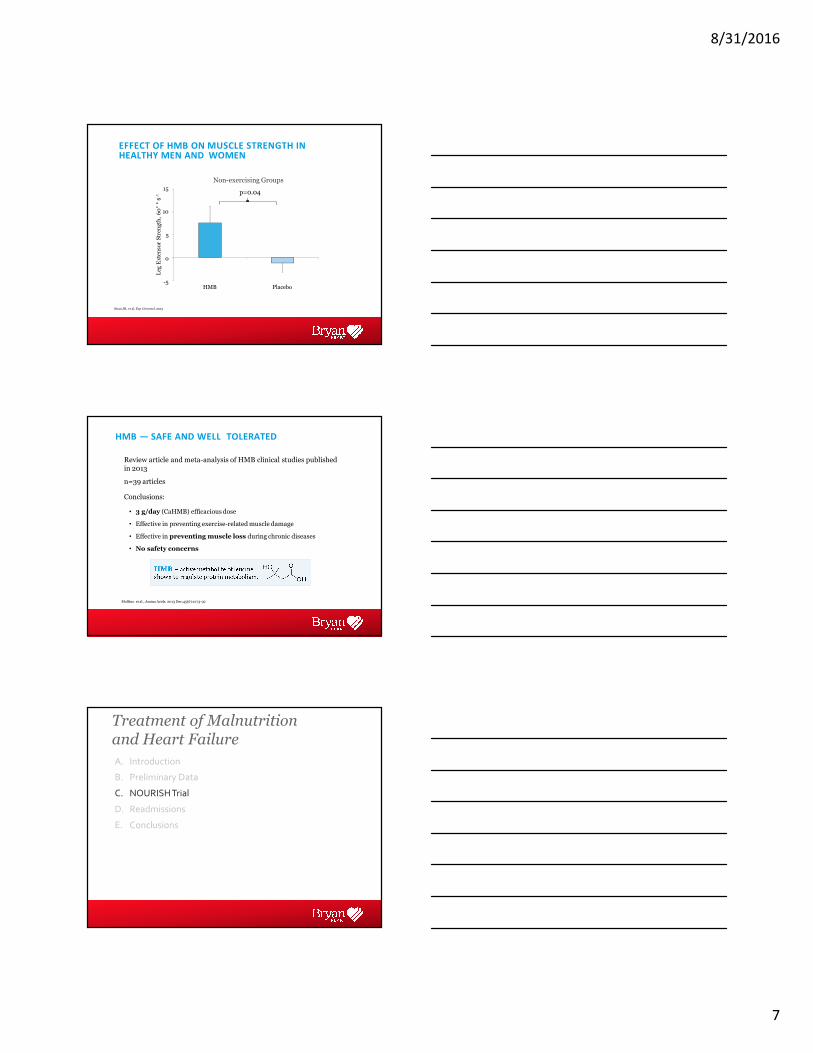
EFFECT OF HMB ON LEAN BODY MASS DURING 10 DAYS OF BED REST IN OLDER ADULTS
• Supplements: 2 sachets/day with 4 g maltodextrine, 200 mg Ca and flavoring agents
– HMB group: 1.5 g Ca-HMB
– Controls: no addition
• Diet stabilization to 0.8 g protein/kg BW/day and (calculated) energy requirements
• Bed rest for 10 days with only wheelchair for toileting or showering
– Prophylacticmeasures
• D-Dimer test, TED hose and daily checking
• Constant monitoring by nursing staff and daily physical by physician
• Rehabilitation for 8 weeks with resistance exercise training - 3 days/week
10 d Bed Rest (In patient)
8 Wk Recovery/Resistance Exercise
5 d
Supplement HMB or Control
DEXA DEXADEXA
Isocaloric Diet (All)
Deutz et al, Clinical Nutrition2013.
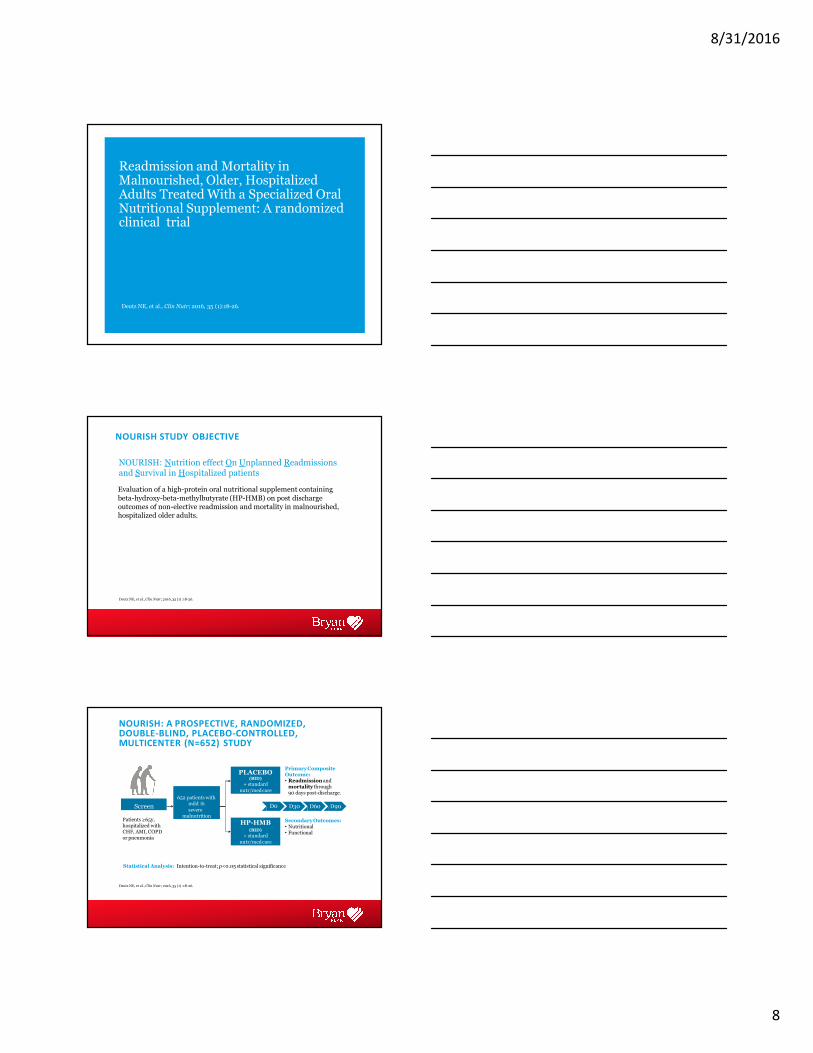
HMB PRESERVES LBM
-2.0
-1.5
-1.0
-0.5
0.0
0.5
1.0
1.5
Bed rest Bed rest+ Rehabilitation
Ch
an
ge
inle
gs
lea
n(k
g)
Change in Total Leg Lean Mass
Control
HMB
-4
-3
-2
-1
0
1
Bed rest Bed rest+ Rehabilitation
Ch
an
ge
into
tal
lea
n(k
g)
Change in Total Lean Mass
Control
HMB+
Deutz et al, Clinical Nutrition2013.
+
*
*
8/31/2016
7
10
5
0
-5
15
HMB Placebo
Leg
Ex
ten
sor
Str
eng
th,
60°* s-1
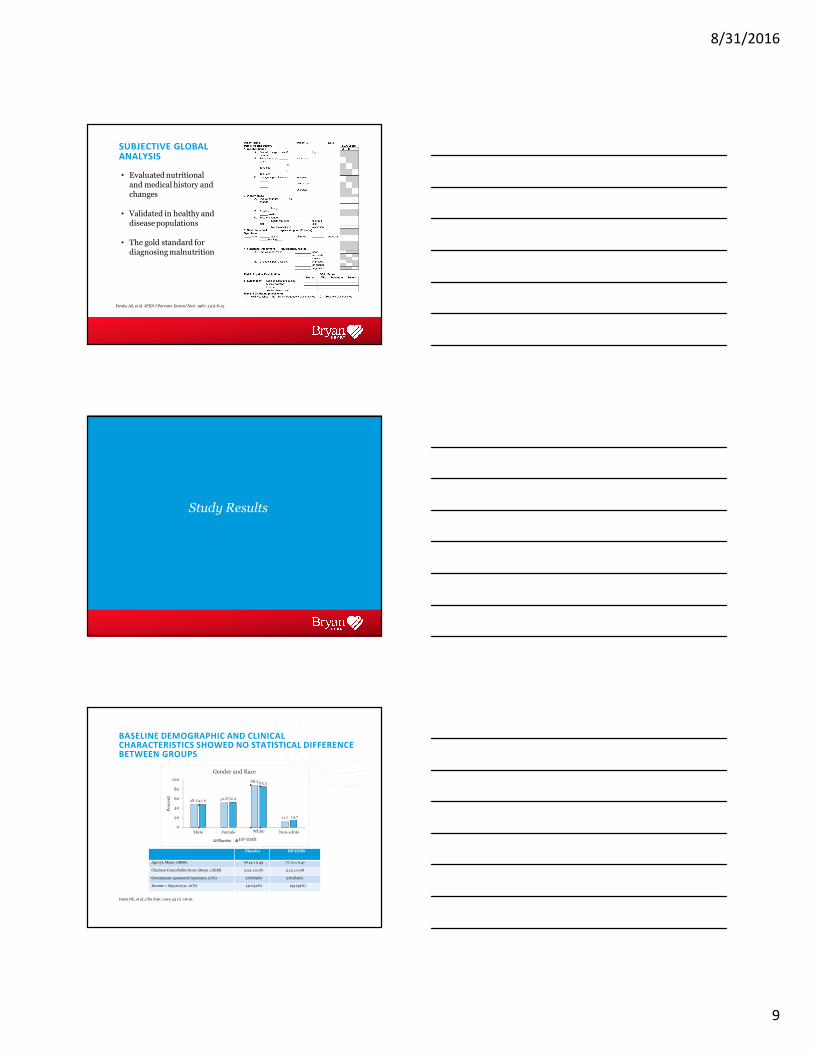
Non-exercising Groups
EFFECT OF HMB ON MUSCLE STRENGTH IN HEALTHY MEN AND WOMEN
p=0.04
Stout JR, et al. Exp Gerontol.2013
HMB — SAFE AND WELL TOLERATED
Review article and meta-analysis of HMB clinical studies published in 2013
n=39 articles
Conclusions:
• 3 g/day (CaHMB) efficacious dose
• Effective in preventing exercise-related muscle damage
• Effective in preventing muscle loss during chronic diseases
• No safety concerns
Molfino et al., Amino Acids. 2013 Dec;45(6):1273-92
A. Introduction
B. Preliminary Data
C. NOURISH Trial
D. Readmissions
E. Conclusions
Treatment of Malnutrition and Heart Failure
8/31/2016
8
Readmission and Mortality in Malnourished, Older, Hospitalized Adults Treated With a Specialized Oral Nutritional Supplement: A randomized clinical trial
Deutz NE, et al., Clin Nutr; 2016, 35 (1):18-26.
NOURISH STUDY OBJECTIVE
Deutz NE, et al., Clin Nutr; 2016, 35 (1) :18-26.
NOURISH: Nutrition effect On Unplanned Readmissions and Survival in Hospitalized patients
Evaluation of a high-protein oral nutritional supplement containing
beta-hydroxy-beta-methylbutyrate (HP-HMB) on post discharge outcomes of non-elective readmission and mortality in malnourished, hospitalized older adults.
NOURISH: A PROSPECTIVE, RANDOMIZED, DOUBLE-BLIND, PLACEBO-CONTROLLED, MULTICENTER (N=652) STUDY
Statistical Analysis: Intention-to-treat; p<0.05 statistical significance
Screen
PLACEBO(BID)
+ standard
nutr/medcare
HP-HMB(BID)
+ standard
nutr/medcare
652 patients with mild �
severemalnutrition
Patients ≥65y, hospitalized with CHF, AMI, COPDor pneumonia
D0
PrimaryComposite Outcome:• Readmission andmortality through90 days post-discharge.
D30 D60 D90
SecondaryOutcomes:• Nutritional• Functional
Deutz NE, et al., Clin Nutr; 2016, 35 (1) :18-26.
8/31/2016
9
SUBJECTIVE GLOBAL ANALYSIS
• Evaluated nutritional and medical history and changes
• Validated in healthy and disease populations
• The gold standard for diagnosing malnutrition
Detsky AS, et al. JPEN J Parenter Enteral Nutr. 1987 ;11(1):8-13.
Study Results
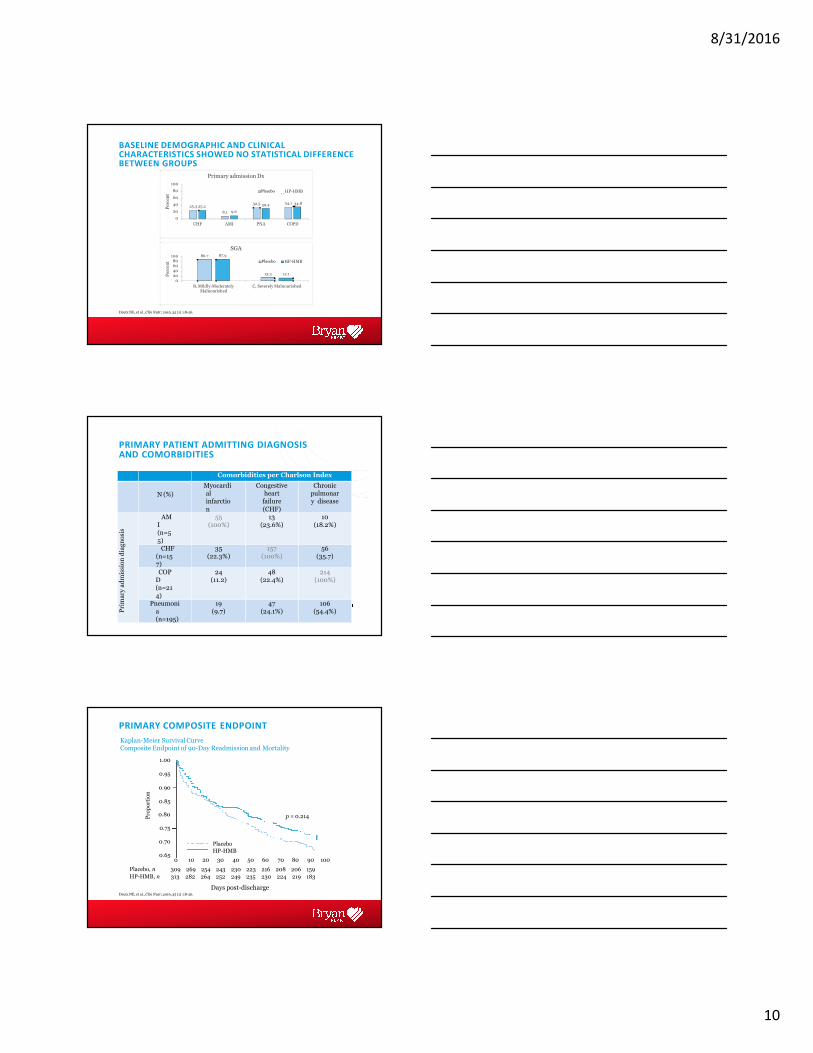
BASELINE DEMOGRAPHIC AND CLINICAL CHARACTERISTICS SHOWED NO STATISTICAL DIFFERENCE BETWEEN GROUPS
Placebo HP-HMB
Age (yr, Mean ±SEM) 78.14 ± 0.49 77.72 ± 0.47
Charlson Comorbidity Score (Mean ± SEM) 2.05 ±0.08 2.12 ± 0.08
Government sponsored insurance, n(%) 278(89%) 276 (89%)
Income < $25,000/yr, n(%) 130 (42%) 154 (49%)
11.7
48.2 47.6 51.8 52.4
88.3 85.3
14.7
0
20
40
60
80
100
Male Female Non-white
Per
cen
t
Gender and Race
Control
White
HP-HMBPlacebo
Deutz NE, et al., Clin Nutr; 2016, 35 (1) :18-26.
8/31/2016
10
BASELINE DEMOGRAPHIC AND CLINICAL CHARACTERISTICS SHOWED NO STATISTICAL DIFFERENCE BETWEEN GROUPS
8.1
25.3 25.2
9.6
32.5 30.4 34.1 34.8
100
80
60
40
20
0
CHF AMI PNA COPD
Per
cen
t
Primary admission Dx
ControlPlacebo HP-HMB
86.7 87.910080604020
0
B, Mildly-Moderately Malnourished
13.3 12.1
C, Severely Malnourished
Per
cen
t
SGA
Control HP-HMBPlacebo
Deutz NE, et al., Clin Nutr; 2016, 35 (1) :18-26.
PRIMARY PATIENT ADMITTING DIAGNOSIS AND COMORBIDITIES
Deutz NE, et al., Clin Nutr; 2016, 35 (1) :18-26.
Comorbidities per Charlson Index
N (%)
Myocardial infarctio
n
Congestive heart
failure
(CHF)
Chronic pulmonary disease
Pri
ma
rya
dm
issi
on
dia
gn
osi
s
AMI (n=5
5)
55(100%)
13(23.6%)
10(18.2%)
CHF (n=157)
35(22.3%)
157(100%)
56(35.7)
COPD (n=21
4)
24(11.2)
48(22.4%)
214(100%)
Pneumonia (n=195)
19(9.7)
47(24.1%)
106(54.4%)
PRIMARY COMPOSITE ENDPOINT
Pro
po
rtio
n
Kaplan-Meier Survival CurveComposite Endpoint of 90-Day Readmission and Mortality
1.00
0.95
0.90
0.85
0.80
0.75
0.70
0.65
Placebo
HP-HMB
p = 0.214
0
309
313
10
269
282
20
254
264
30
243
252
40
230
249
50
223
235
60
216
230
70
208
224
80
206
219
90
159
183
100
Placebo, n
HP-HMB, n
Days post-dischargeDeutz NE, et al., Clin Nutr; 2016, 35 (1) :18-26.
8/31/2016
11
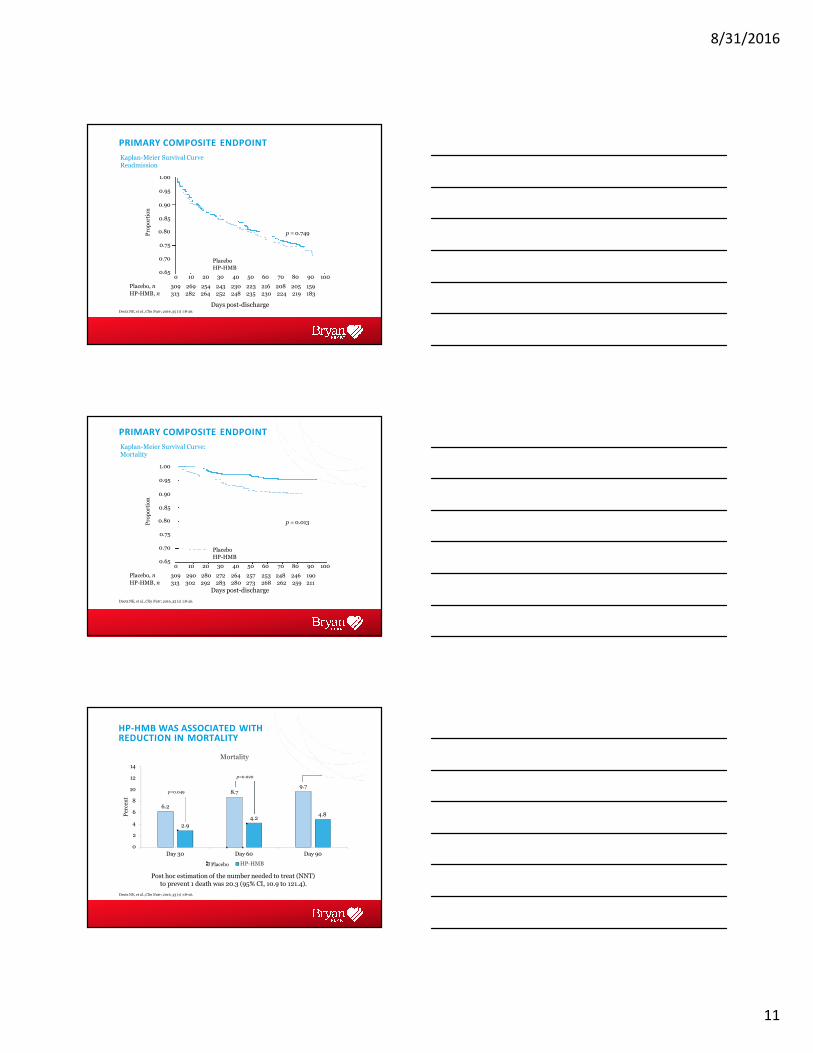
PRIMARY COMPOSITE ENDPOINT
Placebo
HP-HMB
p = 0.749
0
309
313
10
269
282
20
254
264
30
243
252
40
230
248
50
223
235
60
216
230
70
208
224
80
205
219
90
159
183
100
Placebo, n
HP-HMB, n
Days post-dischargeDeutz NE, et al., Clin Nutr; 2016, 35 (1) :18-26.
Pro
po
rtio
n
Kaplan-Meier Survival Curve Readmission
1.00
0.95
0.90
0.85
0.80
0.75
0.70
0.65
PRIMARY COMPOSITE ENDPOINT
Placebo
HP-HMB
p = 0.013
0
309
313
10
290
302
20
280
292
30
272
283
40
264
280
50
257
273
60
253
268
70
248
262
80
246
259
90
190
211
100
Placebo, n
HP-HMB, n
Days post-discharge
Deutz NE, et al., Clin Nutr; 2016, 35 (1) :18-26.
Pro
po
rtio
n
Kaplan-Meier Survival Curve: Mortality
1.00
0.95
0.90
0.85
0.80
0.75
0.70
0.65
HP-HMB WAS ASSOCIATED WITH 50% REDUCTION IN MORTALITY
Post hoc estimation of the number needed to treat (NNT)
p=0.049
p=0.018
p=0.020
6.2
8.79.7
2.9
4.24.8
14
12
10
8
6
4
2
0
Day 30 Day 60 Day 90
Per
cen
t
Mortality
Control HP-HMBPlacebo
to prevent 1 death was 20.3 (95% CI, 10.9 to 121.4).
Deutz NE, et al., Clin Nutr; 2016, 35 (1) :18-26.
8/31/2016
12
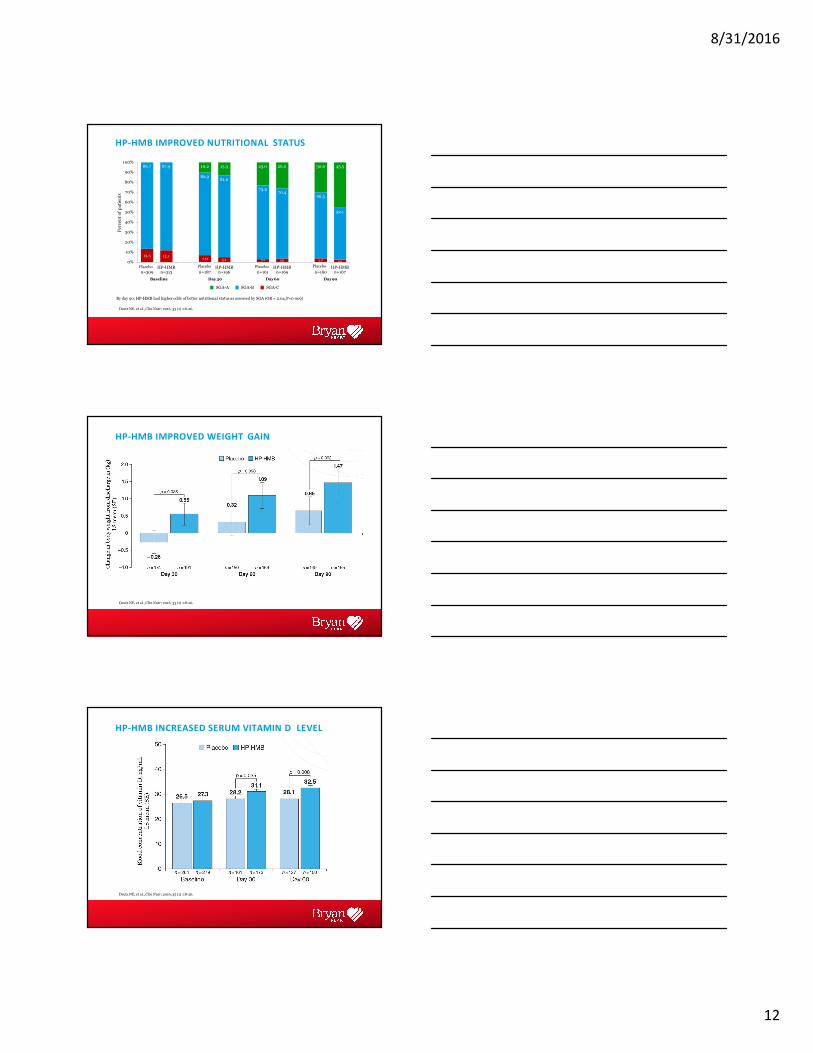
HP-HMB IMPROVED NUTRITIONAL STATUS
By day 90, HP-HMB had higher odds of better nutritional status as assessed by SGA (OR = 2.04,P=0.009)
13.3 12.17.0 5.1 3.1 3.6 3.8 2.4
86.7 87.9
82.981.6
73.970.4
66.3
52.1
10.2 13.3 23.0 26.0 30.0 45.5
0%
10%
40%
30%
20%
50%
60%
70%
80%
90%
100%
Controln=309
HP-HMB n=313
Controln=187
HP-HMB n=196
Controln=161
HP-HMB n=169
Controln=160
HP-HMB n=167
Per
cen
to
fp
ati
ents
Placebo Placebo Placebo Placebo
Deutz NE, et al., Clin Nutr; 2016, 35 (1) :18-26.
Baseline Day30
SGA-A SGA-B
Day60
SGA-C
Day90
HP-HMB IMPROVED WEIGHT GAIN
Deutz NE, et al., Clin Nutr; 2016, 35 (1) :18-26.
HP-HMB INCREASED SERUM VITAMIN D LEVEL
Deutz NE, et al., Clin Nutr; 2016, 35 (1) :18-26.
8/31/2016
13
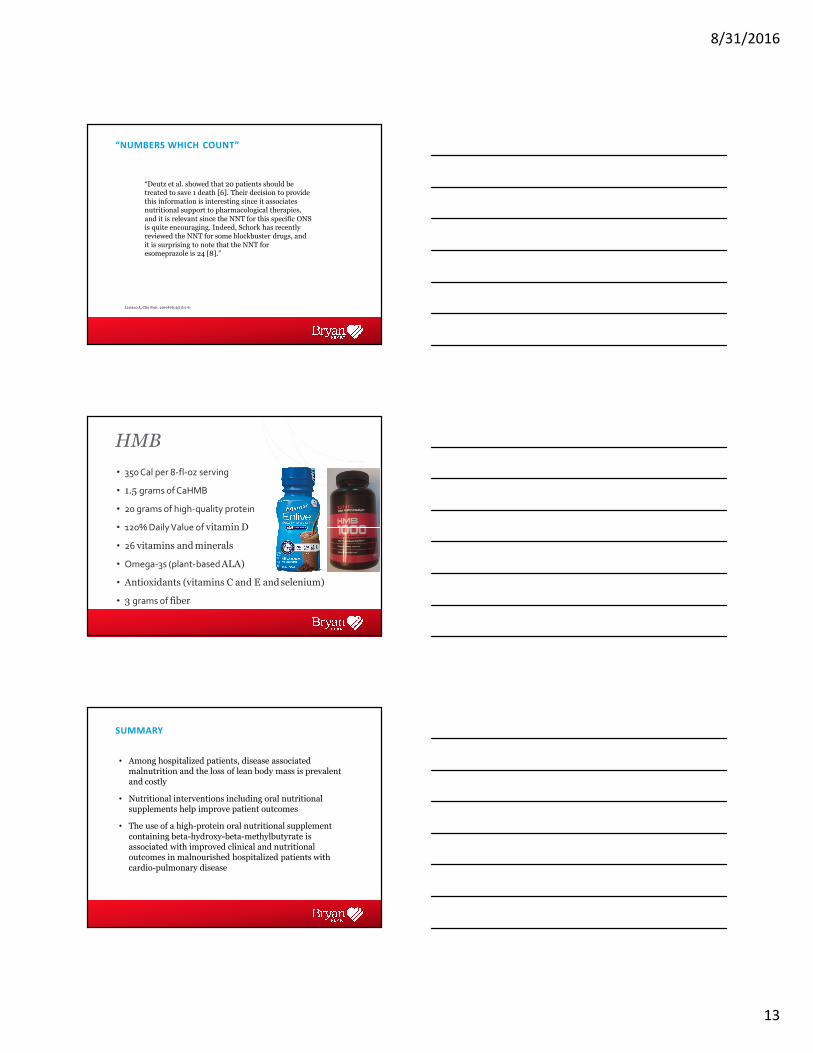
“NUMBERS WHICH COUNT”
Laviano A; Clin Nutr. 2016 Feb;35(1):5-6.
“Deutz et al. showed that 20 patients should be treated to save 1 death [6]. Their decision to provide
this information is interesting since it associates nutritional support to pharmacological therapies,
and it is relevant since the NNT for this specific ONS is quite encouraging. Indeed, Schork has recently reviewed the NNT for some blockbuster drugs, and
it is surprising to note that the NNT for esomeprazole is 24 [8].”
HMB
• 350 Cal per 8-fl-oz serving
• 1.5 grams of CaHMB
• 20 grams of high-quality protein
• 120% Daily Value of vitamin D
• 26 vitamins and minerals
• Omega-3s (plant-based ALA)
• Antioxidants (vitamins C and E and selenium)
• 3 grams of fiber
SUMMARY
• Among hospitalized patients, disease associated malnutrition and the loss of lean body mass is prevalent and costly
• Nutritional interventions including oral nutritional supplements help improve patient outcomes
• The use of a high-protein oral nutritional supplement
containing beta-hydroxy-beta-methylbutyrate is associated with improved clinical and nutritional outcomes in malnourished hospitalized patients with
cardio-pulmonary disease
8/31/2016
14
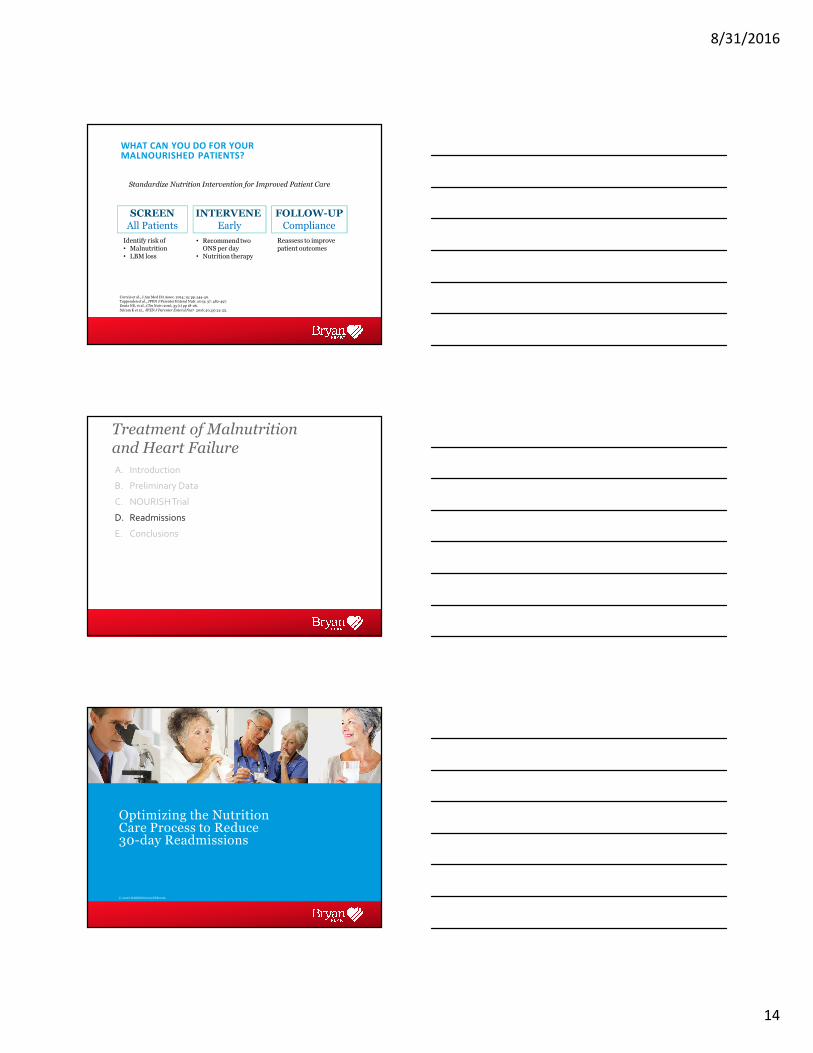
WHAT CAN YOU DO FOR YOUR MALNOURISHED PATIENTS?
Standardize Nutrition Intervention for Improved Patient Care
INTERVENE
Early
SCREEN
All Patients
Identify risk of• Malnutrition• LBM loss
• Recommend two ONS per day
• Nutrition therapy
Correia et al., J Am Med Dir Assoc. 2014; 15; pp. 544-50. Tappenden et al., JPEN J Parenter Enteral Nutr. 2013; 37: 482-497. Deutz NE, et al., Clin Nutr; 2016, 35 (1) pp 18-26.
Sriram K et al., JPEN J Parenter Enteral Nutr 2016; 40, pp 24-25.
FOLLOW-UP
Compliance
Reassess to improve patient outcomes
A. Introduction
B. Preliminary Data
C. NOURISH Trial
D. Readmissions
E. Conclusions
Treatment of Malnutrition and Heart Failure
Optimizing the Nutrition Care Process to Reduce 30-day Readmissions
© 2016 USANENS160179/FEB 2016
8/31/2016
15
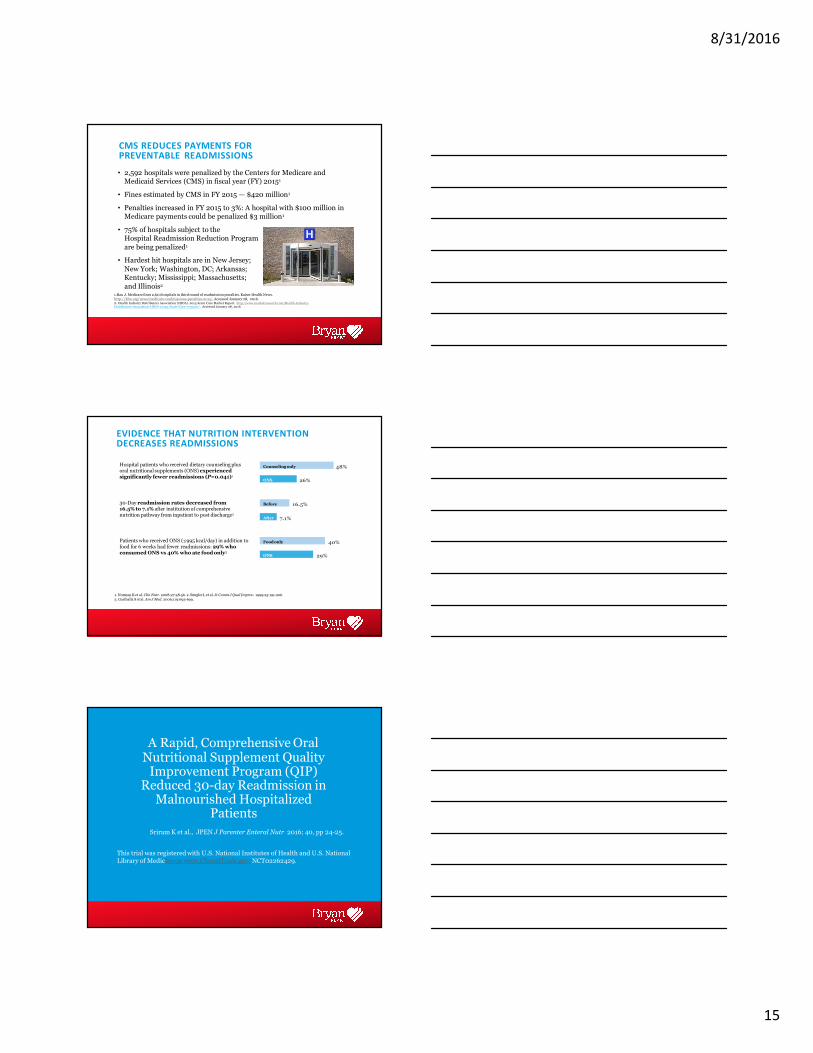
CMS REDUCES PAYMENTS FOR PREVENTABLE READMISSIONS
• 2,592 hospitals were penalized by the Centers for Medicare and Medicaid Services (CMS) in fiscal year (FY) 20151
• Fines estimated by CMS in FY 2015 — $420 million1
• Penalties increased in FY 2015 to 3%: A hospital with $100 million in Medicare payments could be penalized $3 million1
• 75% of hospitals subject to theHospital Readmission Reduction Program
are being penalized1
• Hardest hit hospitals are in New Jersey;
New York; Washington, DC; Arkansas; Kentucky; Mississippi; Massachusetts;
and Illinois2
1.Rau J. Medicare fines 2,610 hospitals in third round of readmission penalties. Kaiser Health News. http://khn.org/news/medicare-readmissions-penalties-2015/. Accessed January 28, 2016.2. Health Industry Distributors Association (HIDA). 2013 Acute Care Market Report. http://www.marketresearch.com/Health-Industry-Distributors-Association-HIDA-v2745/Acute-Care-7731227/. Accessed January 28, 2016.
EVIDENCE THAT NUTRITION INTERVENTION DECREASES READMISSIONS
3. Gariballa S et al. Am J Med. 2006;119:693-699.
Hospital patients who received dietary counseling plus oral nutritional supplements (ONS) experienced significantly fewer readmissions (P=0.041)1
30-Day readmission rates decreased from 16.5% to 7.1% after institution of comprehensive nutrition pathway from inpatient to post discharge2
Patients who received ONS (≤995 kcal/day) in addition to food for 6 weeks had fewer readmissions: 29% who consumed ONS vs 40% who ate foodonly3
Counselingonly
Before
Foodonly
48%
16.5%
40%
ONS
After
ONS
26%
7.1%
29%
1. Norman K et al. Clin Nutr. 2008;27:48-56. 2. Brugler L et al. Jt Comm J Qual Improv. 1999;25:191-206.
REAL WORLD EVIDENCE FOR VALUE OF NUTRITION IN THE NEW HEALTH CARE ENVIRONMENT
A Rapid, Comprehensive OralNutritional Supplement Quality
Improvement Program (QIP) Reduced 30-day Readmission in
Malnourished Hospitalized Patients
Sriram K et al., JPEN J Parenter Enteral Nutr 2016; 40, pp 24-25.
This trial was registered with U.S. National Institutes of Health and U.S. National Library of Medicine on www.ClincalTrials.gov: NCT02262429.w.ClinicalTrials.gov
8/31/2016
16
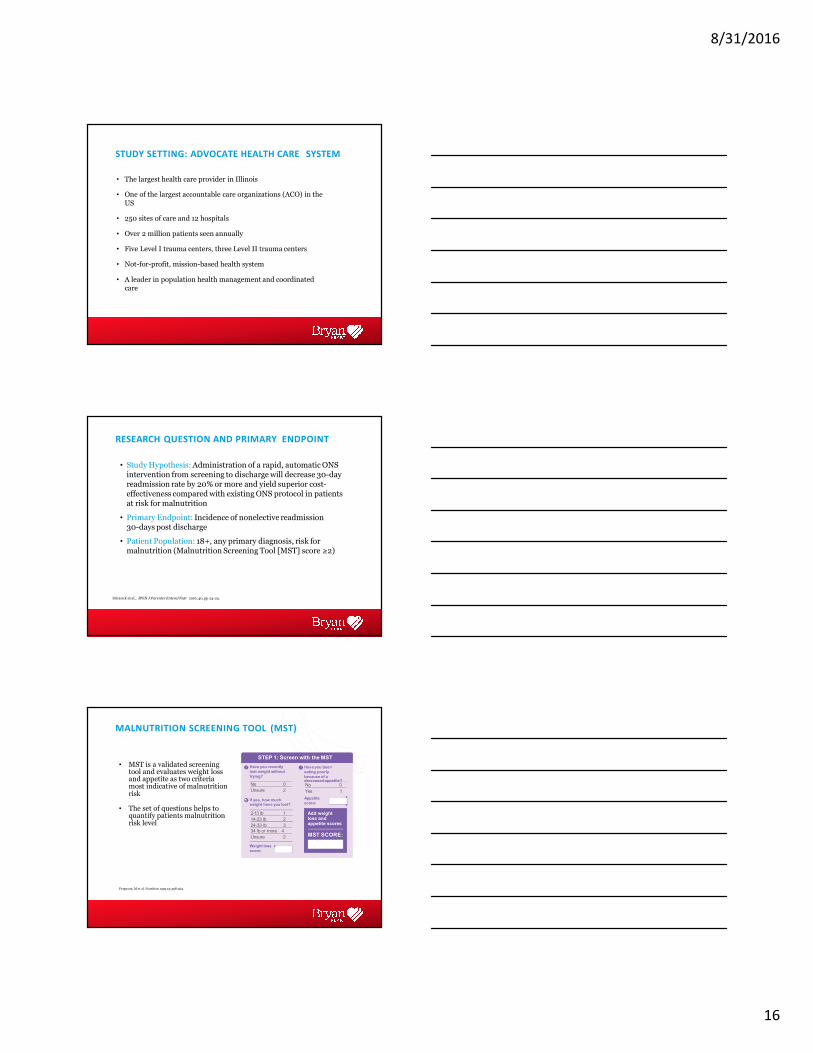
STUDY SETTING: ADVOCATE HEALTH CARE SYSTEM
• The largest health care provider in Illinois
• One of the largest accountable care organizations (ACO) in the
US
• 250 sites of care and 12 hospitals
• Over 2 million patients seen annually
• Five Level I trauma centers, three Level II trauma centers
• Not-for-profit, mission-based health system
• A leader in population health management and coordinatedcare
RESEARCH QUESTION AND PRIMARY ENDPOINT
• Study Hypothesis: Administration of a rapid, automatic ONS intervention from screening to discharge will decrease 30-day readmission rate by 20% or more and yield superior cost-effectiveness compared with existing ONS protocol in patients at risk for malnutrition
• Primary Endpoint: Incidence of nonelective readmission 30-days post discharge
• Patient Population: 18+, any primary diagnosis, risk for malnutrition (Malnutrition Screening Tool [MST] score ≥2)
Sriram K et al., JPEN J Parenter Enteral Nutr 2016; 40, pp 24-25.
MALNUTRITION SCREENING TOOL (MST)
Ferguson, M et al. Nutrition 1999 15:458-464
• MST is a validated screening tool and evaluates weight loss and appetite as two criteriamost indicative of malnutrition risk
• The set of questions helps to quantify patients malnutrition risk level
No 0
Unsure 2
If yes, how much weight have you lost?
2-13 lb 1
14-23 lb 2
24-33 lb 3
34 lb or more 4
Unsure 2
Weight loss
score:
Have you recently
lost weight without
trying?
Yes
Appetite
score:
Have you been
eating poorly
because of adecreasedappetite?No 0
1
STEP 1: Screen with the MST
Add weight loss and appetite scores
MST SCORE:
8/31/2016
17
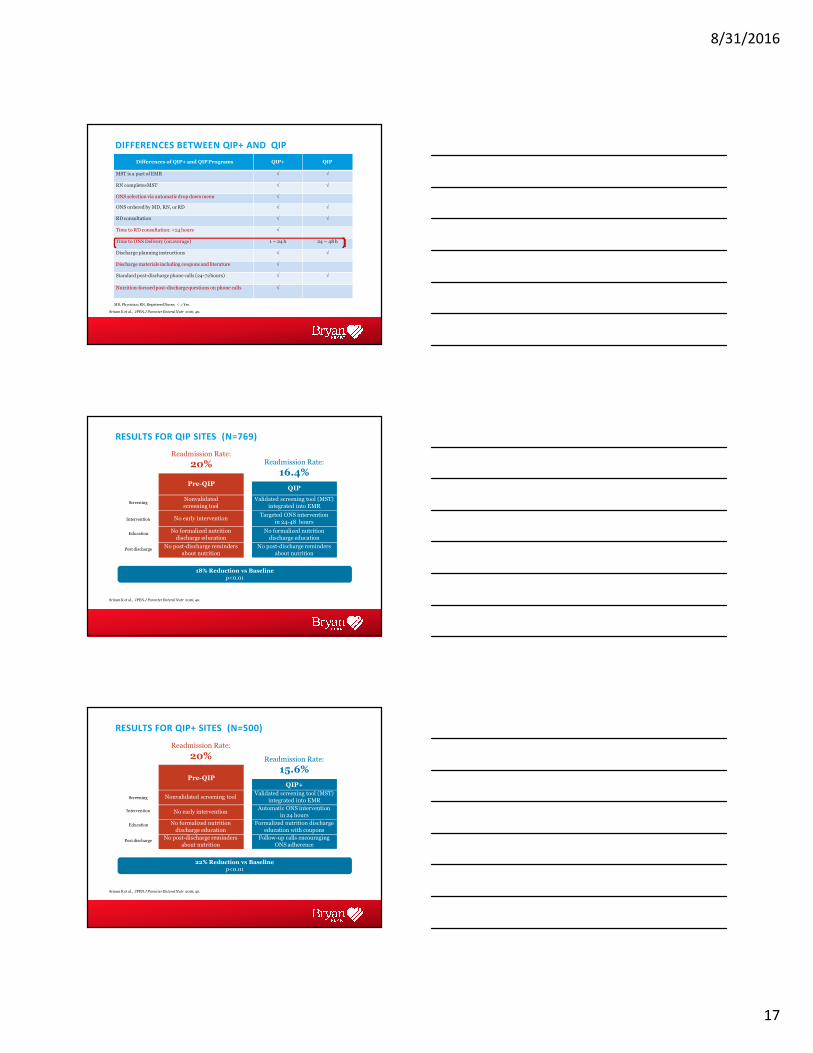
Differences of QIP+ and QIPPrograms QIP+ QIP
MST is a part of EMR √ √
RN completesMST √ √
ONS selection via automatic drop down menu √
ONS ordered by MD, RN, orRD √ √
RD consultation √ √
Time to RD consultation: <24 hours √
Time to ONS Delivery (onaverage) 1 – 24 h 24 – 48 h
Discharge planning instructions √ √
Discharge materials including coupons and literature √
Standard post-discharge phone calls (24-72hours) √ √
Nutrition-focused post-discharge questions on phone calls √
DIFFERENCES BETWEEN QIP+ AND QIP
MD, Physician; RN, Registered Nurse; √ = Yes.
Sriram K et al., JPEN J Parenter Enteral Nutr 2016; 40.
RESULTS FOR QIP SITES (N=769)
Pre-QIPQIP
Readmission Rate:
20% Readmission Rate:
16.4%
Screening
Intervention
Post discharge
Education
Validated screening tool (MST)
integrated into EMR
Targeted ONS intervention
in 24-48 hours
No formalized nutrition
discharge education
No post-discharge reminders
about nutrition
Nonvalidated
screening tool
No early intervention
No formalized nutrition
discharge education
No post-discharge reminders
about nutrition
18% Reduction vs Baseline
p<0.01
Sriram K et al., JPEN J Parenter Enteral Nutr 2016; 40.
Screening
Intervention
Post discharge
Education
RESULTS FOR QIP+ SITES (N=500)
Readmission Rate:
20% Readmission Rate:
15.6%
Validated screening tool (MST)
integrated into EMR
Automatic ONS intervention
in 24 hours
Formalized nutrition discharge
education with coupons
Follow-up calls encouraging
ONS adherence
QIP+
Nonvalidated screening tool
No early intervention
No formalized nutrition
discharge education
No post-discharge reminders
about nutrition
Pre-QIP
22% Reduction vs Baseline
p<0.01
Sriram K et al., JPEN J Parenter Enteral Nutr 2016; 40.
8/31/2016
18
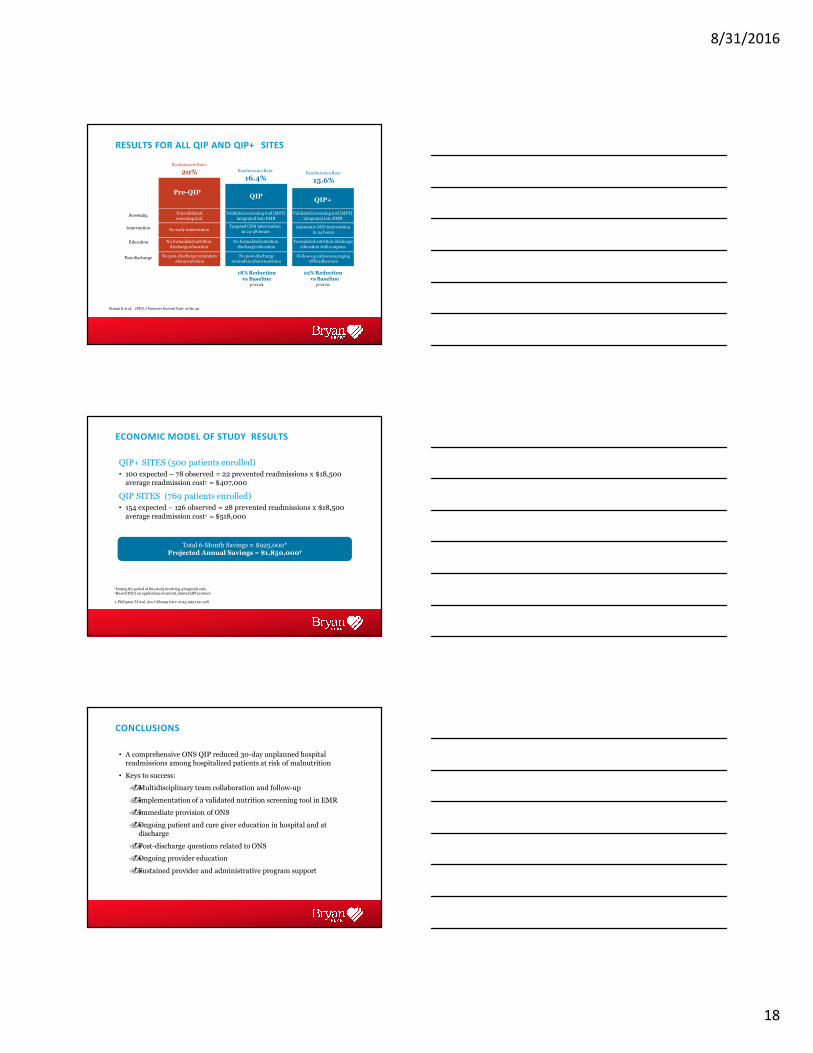
RESULTS FOR ALL QIP AND QIP+ SITES
Screening
Intervention
Post discharge
Education
ReadmissionRate:
16.4%
ReadmissionRate:
20%
Pre-QIP
ReadmissionRate:
15.6%
QIP+QIP
Validated screening tool (MST)
integrated into EMR
Automatic ONS intervention
in 24 hours
Validated screening tool (MST)
integrated into EMR
Sriram K et al., JPEN J Parenter Enteral Nutr 2016; 40.
Targeted ONS intervention
in 24-48 hours
No formalized nutrition
discharge education
No post-discharge
reminders about nutrition
Nonvalidated
screening tool
No early intervention
No formalized nutrition
discharge education
No post-discharge reminders
about nutrition
Formalized nutrition discharge
education with coupons
Follow-up calls encouraging ONS adherence
22%Reduction vsBaselinep<0.01
18%Reduction vs Baseline
p<0.01
ECONOMIC MODEL OF STUDY RESULTS
QIP+ SITES (500 patients enrolled)
• 100 expected – 78 observed = 22 prevented readmissions x $18,500 average readmission cost1 = $407,000
QIP SITES (769 patients enrolled)
• 154 expected – 126 observed = 28 prevented readmissions x $18,500
average readmission cost1 = $518,000
*During the period of this study involving 4 hospitals only.†Based ONLY on application of current, limited QIP protocol.
Total 6-Month Savings = $925,000*Projected Annual Savings = $1,850,000†
1. Philipson TJ et al. Am J Manag Care. 2013;19(2):121-128.
• A comprehensive ONS QIP reduced 30-day unplanned hospital readmissions among hospitalized patients at risk of malnutrition
• Keys to success:
��Multidisciplinary team collaboration and follow-up
��Implementation of a validated nutrition screening tool in EMR
��Immediate provision of ONS
��Ongoing patient and care giver education in hospital and at discharge
��Post-discharge questions related to ONS
��Ongoing provider education
��Sustained provider and administrative program support
CONCLUSIONS
8/31/2016
19
A. Introduction
B. Preliminary Data
C. NOURISH Trial
D. Readmissions
E. Conclusions
Treatment of Malnutrition and Heart Failure
A. Malnutrition is a big problem in patients with Heart Failure
B. Therapy can decrease mortality and readmissions
C. We should screen for malnutrition and treat Heart Failure patients that qualify
Treatment of Malnutrition and Heart Failure Conclusions