Embed Size (px)
Citation preview
Treatment of Diabetes Mellitus
Hasan Aydın, MD
Department of Endocrinology and Metabolism
Yeditepe University Medical Faculty
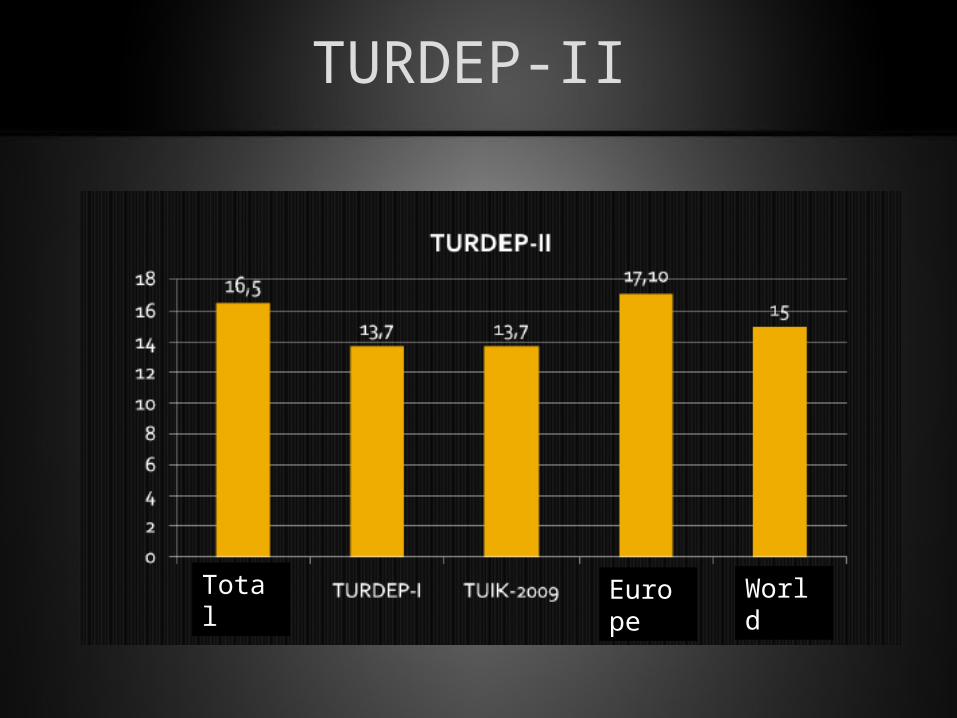
TURDEP-II
Total Europe World
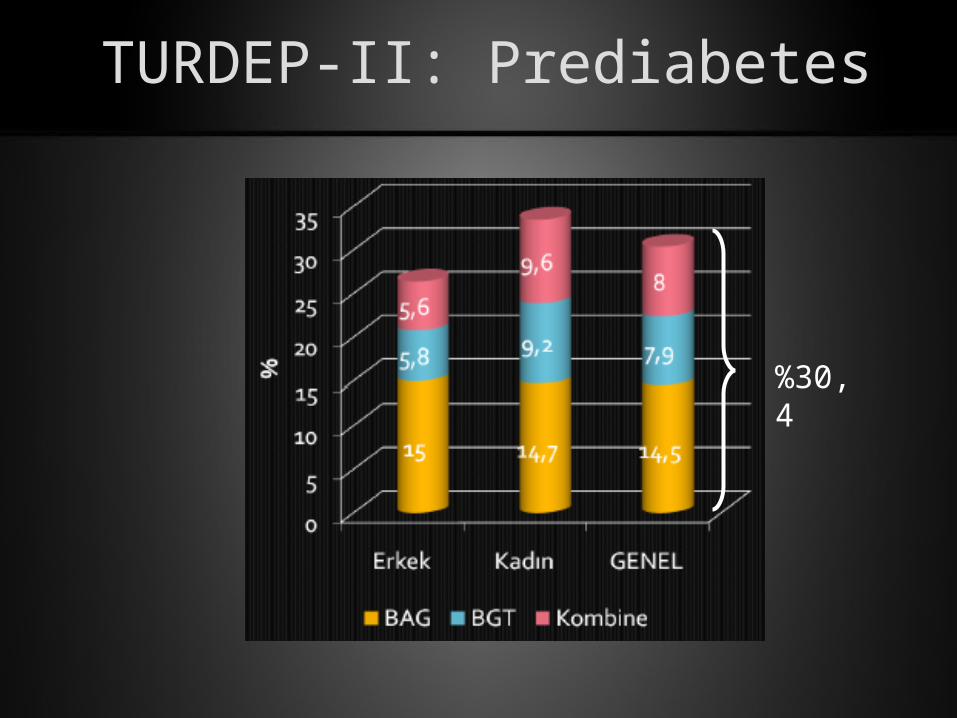
TURDEP-II: Prediabetes
%30,4
Every 1$ of 7 $ of health expenditure is paid for diabetes
in USA
Rubin RJ, Altman WM et al: JCEM
Number One Cause of
• End Stage Renal Failure (% 35)
• Blindness in ages of 20- 74 years
• Nontraumatic lower extremity amputations
is DIABETES
Volume 24 Supplement 1 American Diabetes Association:Clinical Practice Recommendations 2001
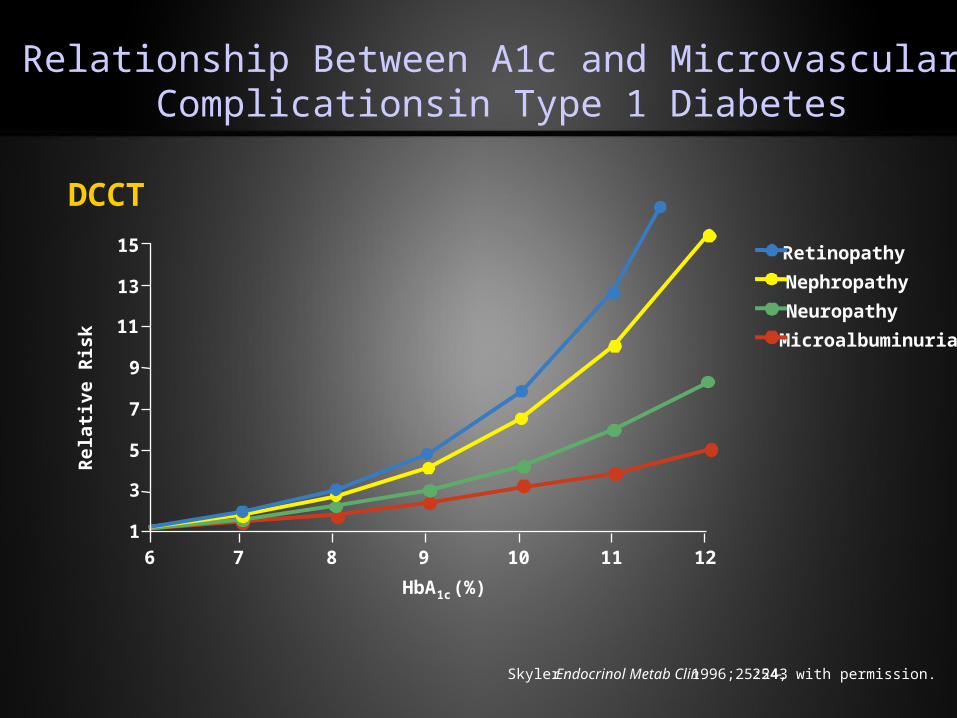
DCCT
Relationship Between A1c and Microvascular Complicationsin Type 1 Diabetes
Skyler. Endocrinol Metab Clin. 1996;25:243-254, with permission.
Rel
ativ
e R
isk
Retinopathy
Nephropathy
Neuropathy
Microalbuminuria
HbA1c (%)
15
13
11
9
7
5
3
1
6 7 8 9 10 11 12
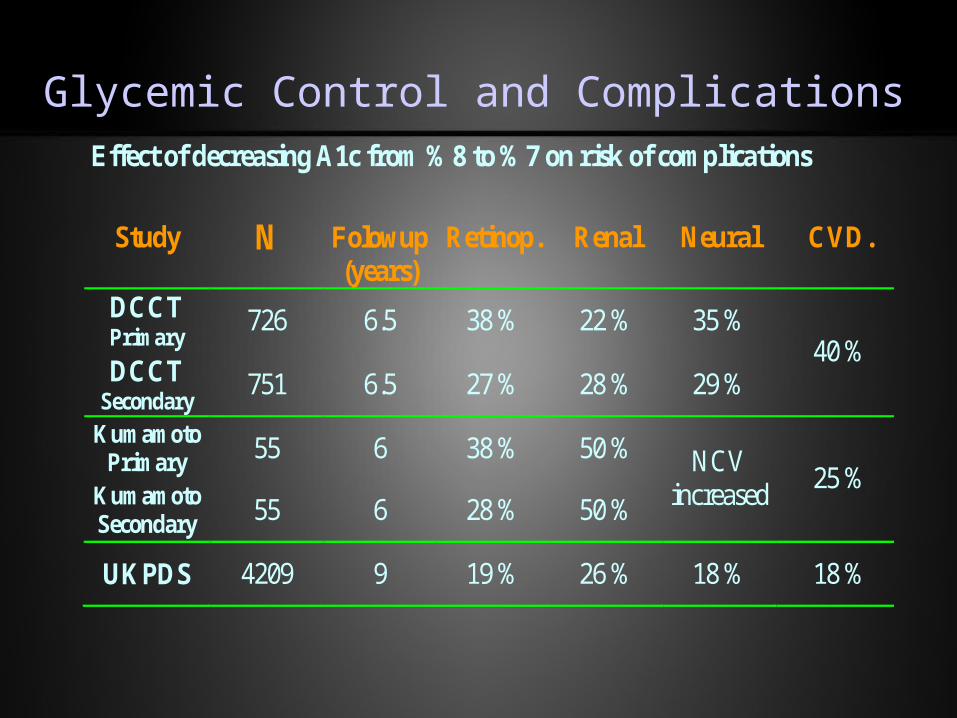
Glycemic Control and ComplicationsEffect of decreasing A1c from %8 to %7 on risk of complications
Study N
Folowup (years)
Retinop. Renal Neural CVD.
DCCT Primary
726 6.5 38 % 22 % 35 %
DCCT Secondary
751 6.5 27 % 28 % 29 % 40 %
Kumamoto Primary 55 6 38 % 50 %
Kumamoto Secondary 55 6 28 % 50 %
NCV increased
25 %
UKPDS 4209 9 19 % 26 % 18 % 18 %
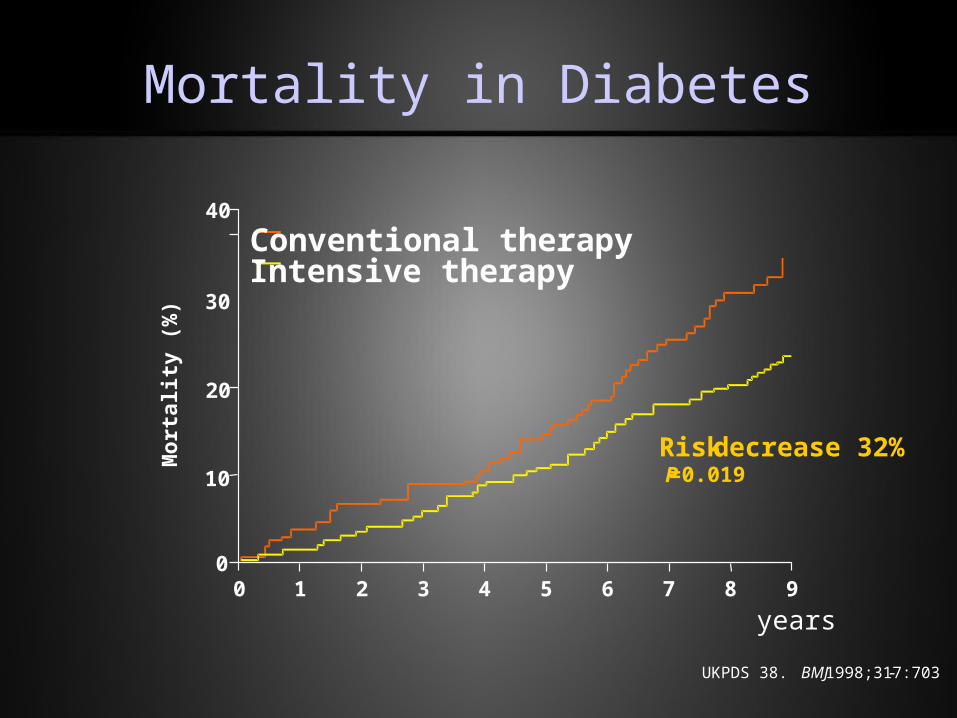
Mortality in Diabetes
UKPDS 38. BMJ 1998;317:703-
years0
Mor
tali
ty (
%)
40
1 2 3 4 5 6 7 8 9
20
0
30
10
Conventional therapyIntensive therapy
Risk- decrease 32%P=0.019
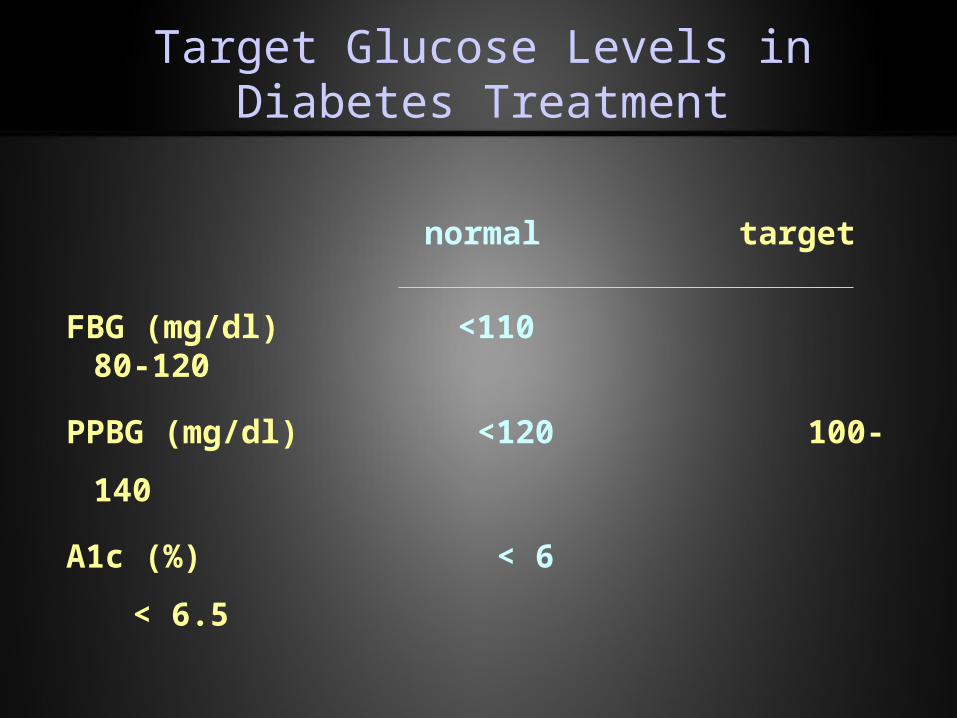
normal target
FBG (mg/dl) <110 80-120
PPBG (mg/dl) <120 100-140
A1c (%) < 6 < 6.5
Target Glucose Levels in Diabetes Treatment
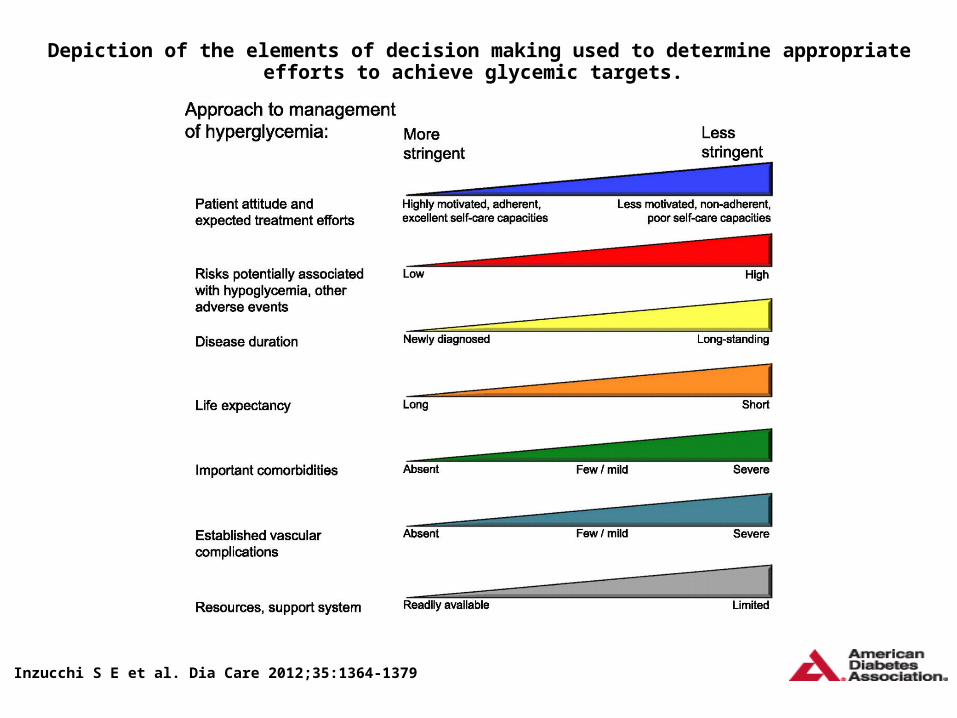
Depiction of the elements of decision making used to determine appropriate efforts to achieve glycemic targets.
Inzucchi S E et al. Dia Care 2012;35:1364-1379
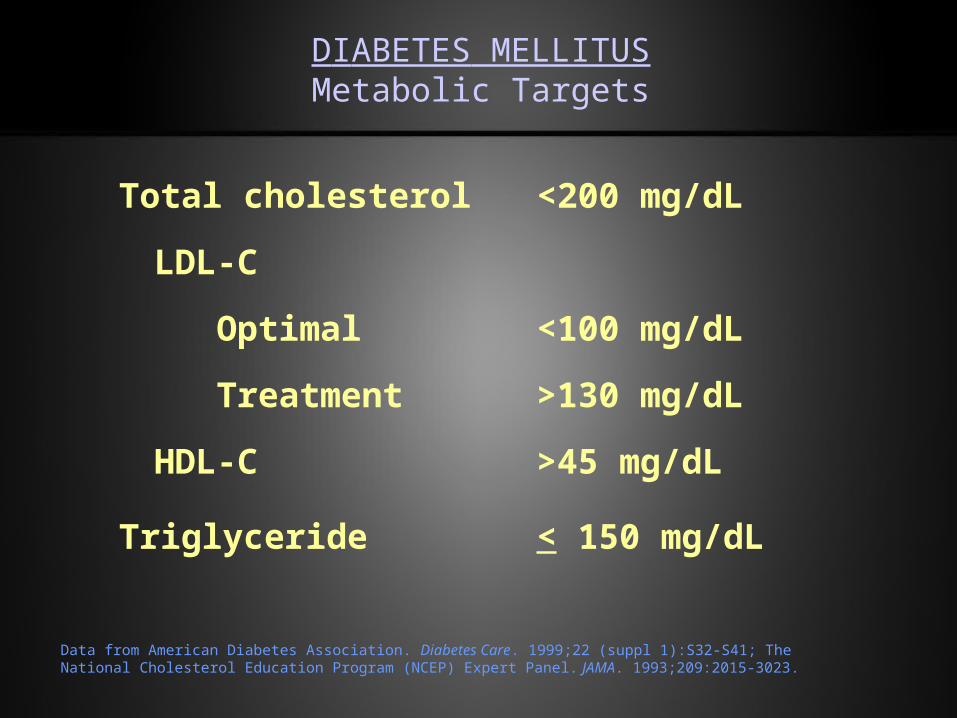
DIABETES MELLITUSMetabolic Targets
Total cholesterol <200 mg/dL
LDL-C
Optimal <100 mg/dL
Treatment >130 mg/dL
HDL-C >45 mg/dL
Triglyceride < 150 mg/dL
Data from American Diabetes Association. Diabetes Care. 1999;22 (suppl 1):S32-S41; The National Cholesterol Education Program (NCEP) Expert Panel. JAMA. 1993;209:2015-3023.
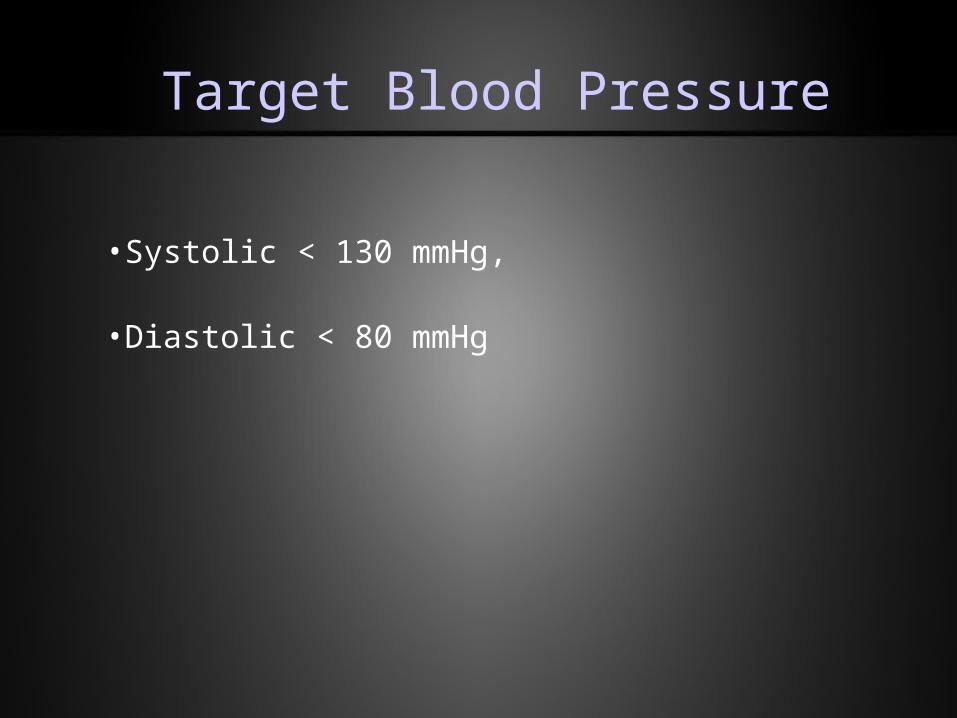
•Systolic < 130 mmHg,
•Diastolic < 80 mmHg
Target Blood Pressure
TREATMENT
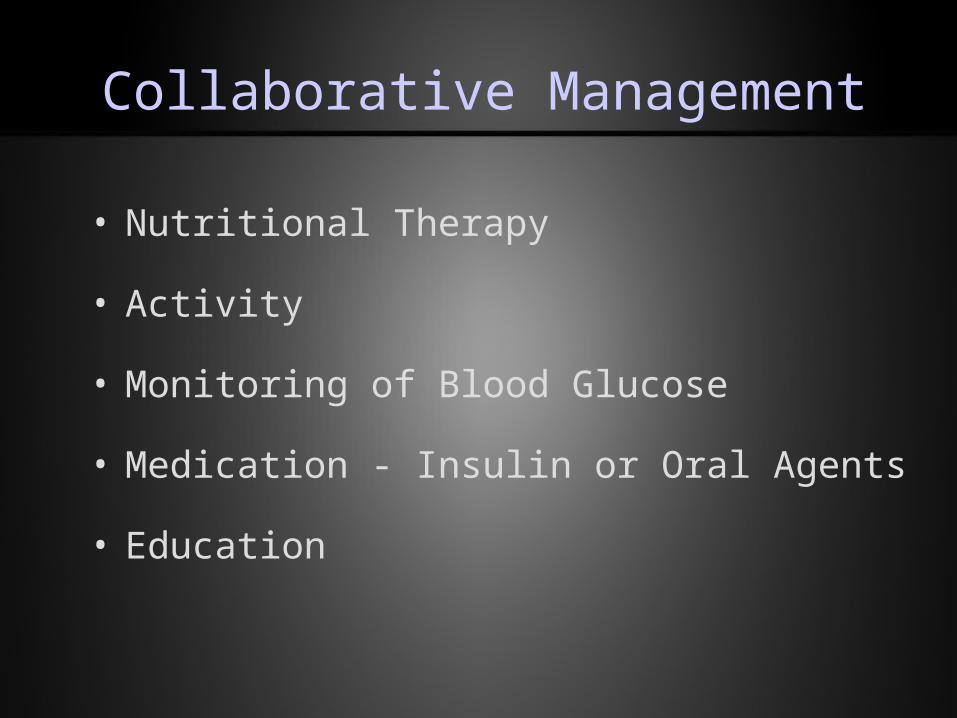
Collaborative Management
• Nutritional Therapy
• Activity
• Monitoring of Blood Glucose
• Medication - Insulin or Oral Agents
• Education
Nutrition Recommendations and Principles for People With
Diabetes Mellitus
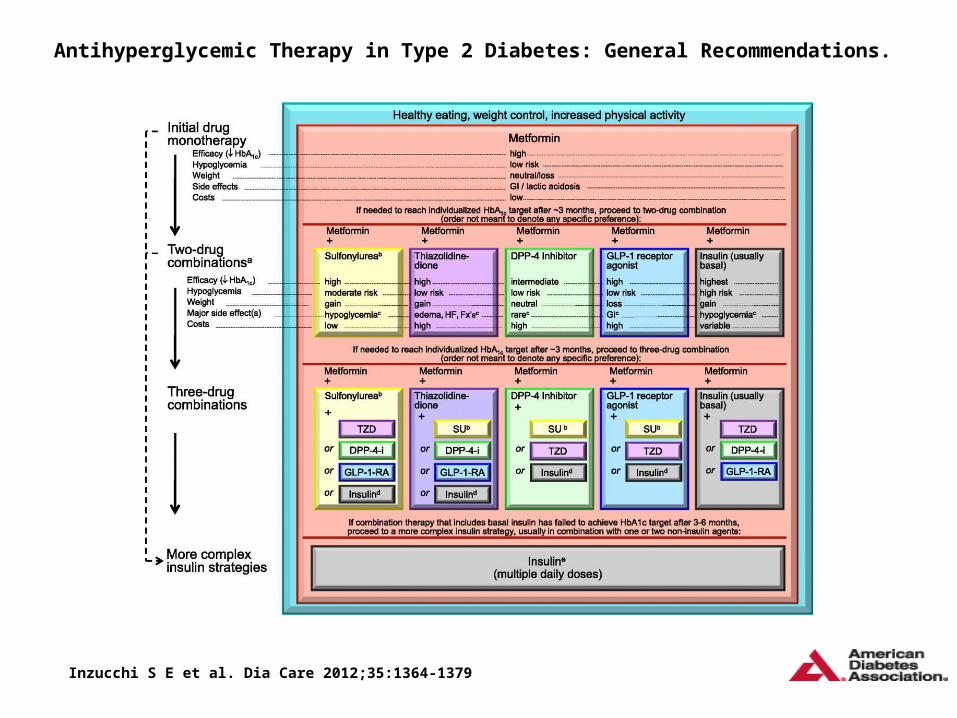
Antihyperglycemic Therapy in Type 2 Diabetes: General Recommendations.
Inzucchi S E et al. Dia Care 2012;35:1364-1379
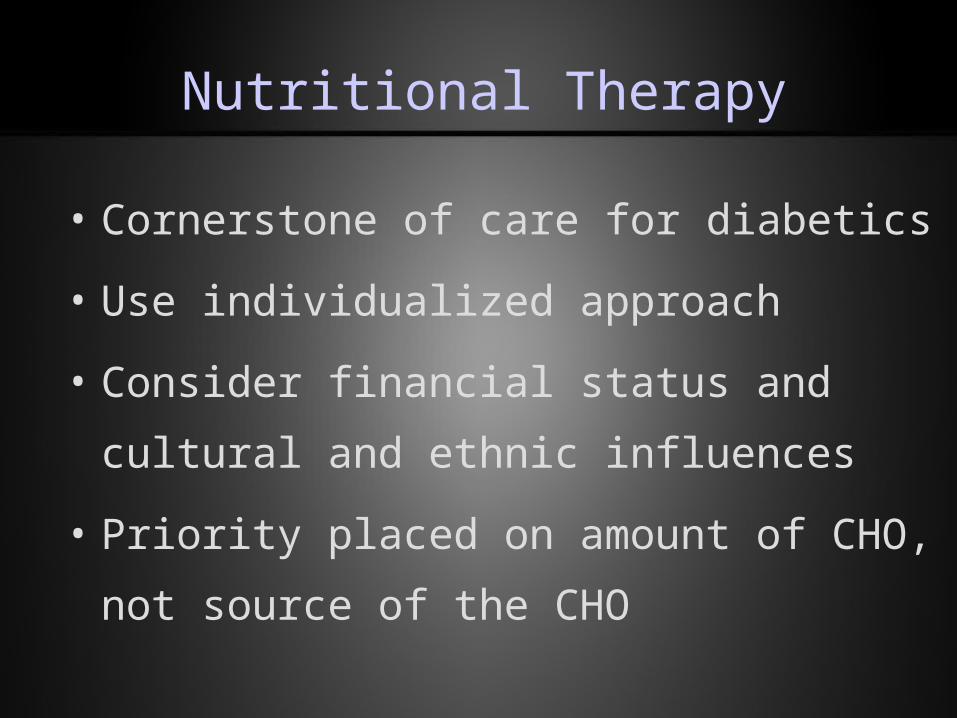
Nutritional Therapy
• Cornerstone of care for diabetics
• Use individualized approach
• Consider financial status and cultural and ethnic
influences
• Priority placed on amount of CHO, not source
of the CHO
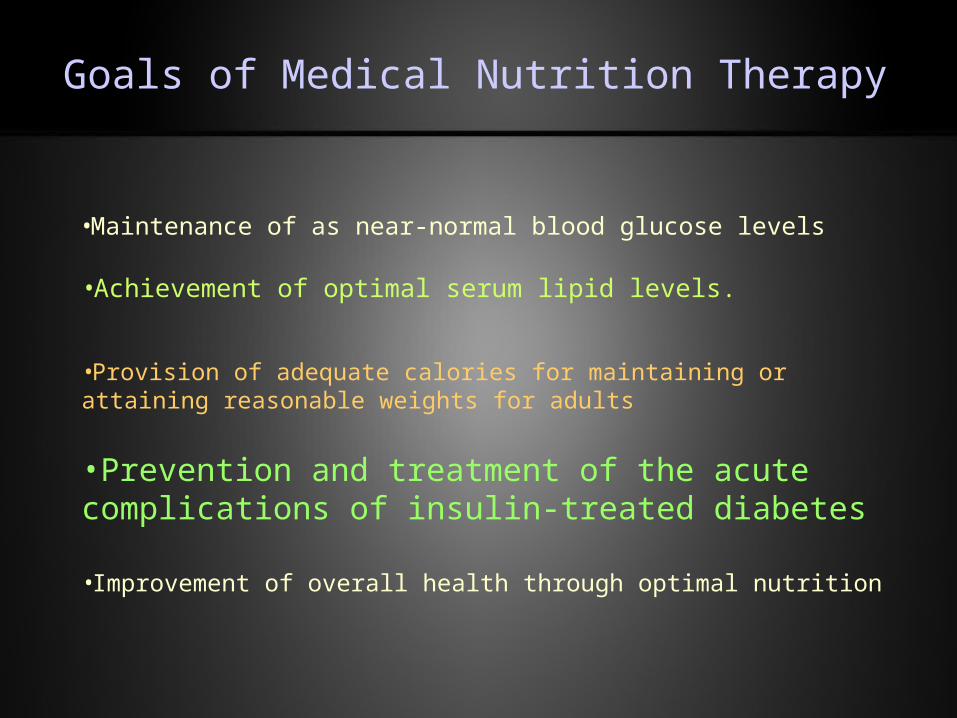
Goals of Medical Nutrition Therapy
•Maintenance of as near-normal blood glucose levels
•Achievement of optimal serum lipid levels.
•Provision of adequate calories for maintaining or attaining reasonable weights for adults
•Prevention and treatment of the acute complications of insulin-treated diabetes
•Improvement of overall health through optimal nutrition
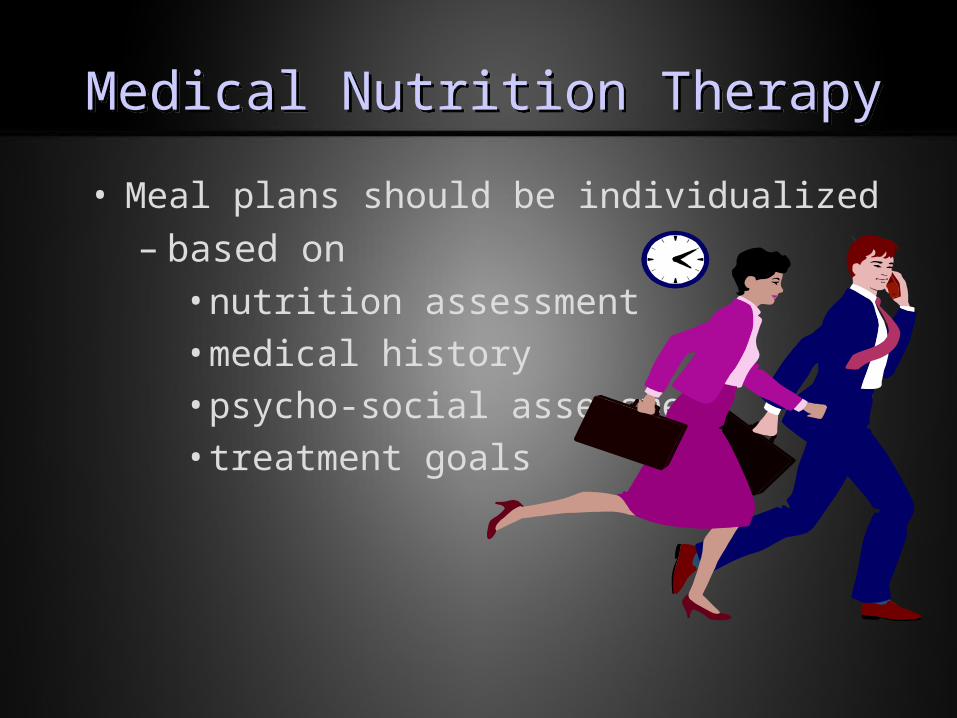
Medical Nutrition TherapyMedical Nutrition Therapy
• Meal plans should be individualized
– based on • nutrition assessment
• medical history
• psycho-social assessment
• treatment goals
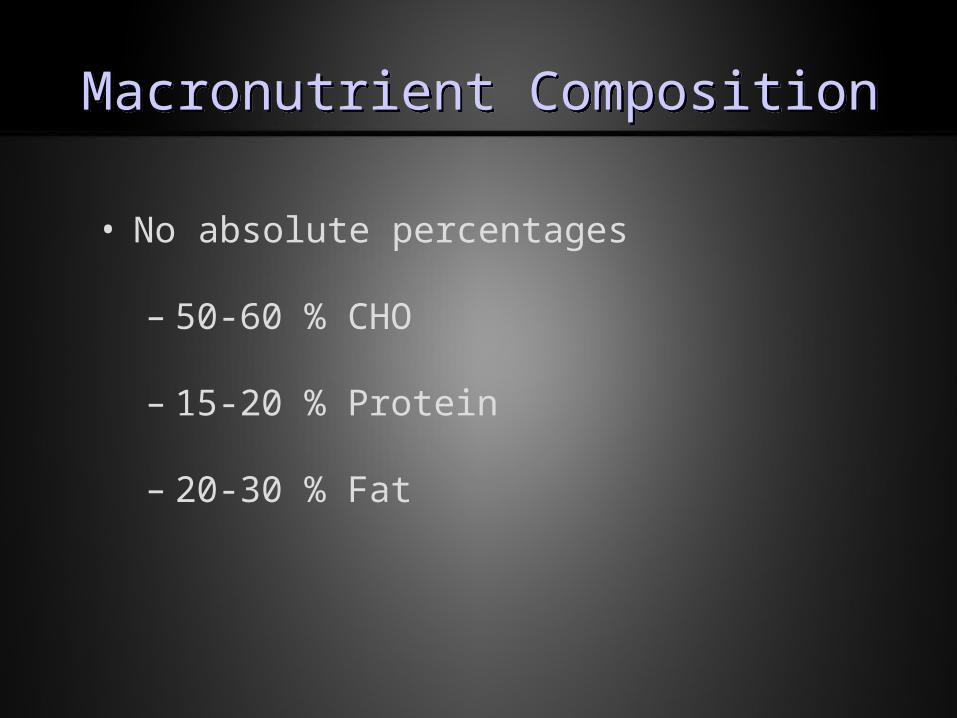
Macronutrient CompositionMacronutrient Composition
• No absolute percentages
– 50-60 % CHO
– 15-20 % Protein
– 20-30 % Fat
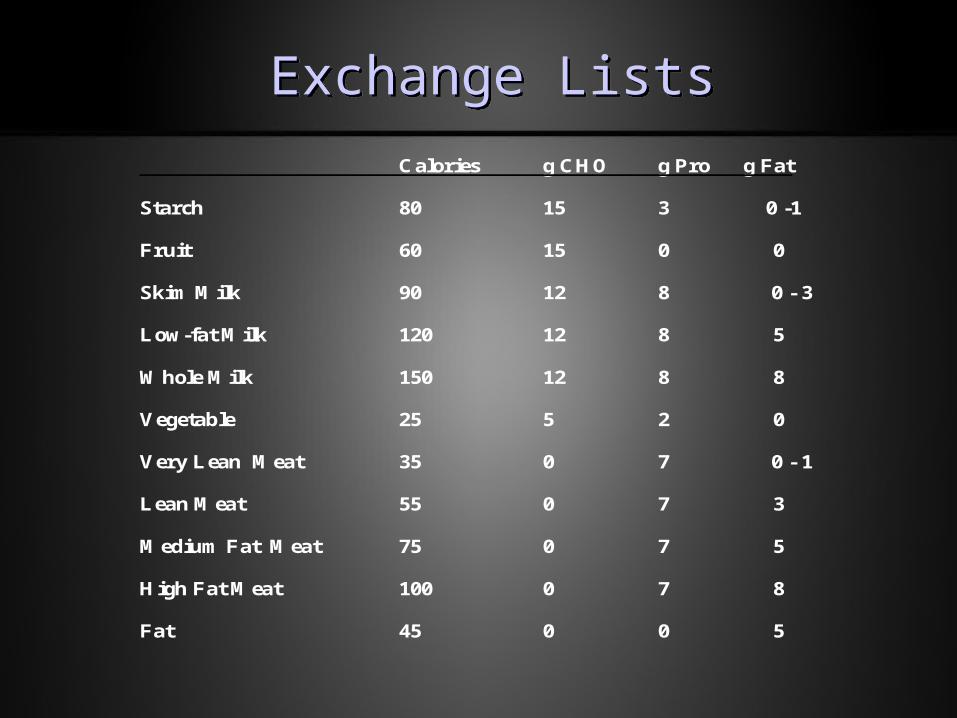
Exchange ListsExchange Lists
Calories g CHO g Pro g Fat
Starch 80 15 3 0 -1
Fruit 60 15 0 0
Skim Milk 90 12 8 0 - 3
Low-fat Milk 120 12 8 5
Whole Milk 150 12 8 8
Vegetable 25 5 2 0
Very Lean Meat 35 0 7 0 - 1
Lean Meat 55 0 7 3
Medium Fat Meat 75 0 7 5
High Fat Meat 100 0 7 8
Fat 45 0 0 5
Drug Treatment
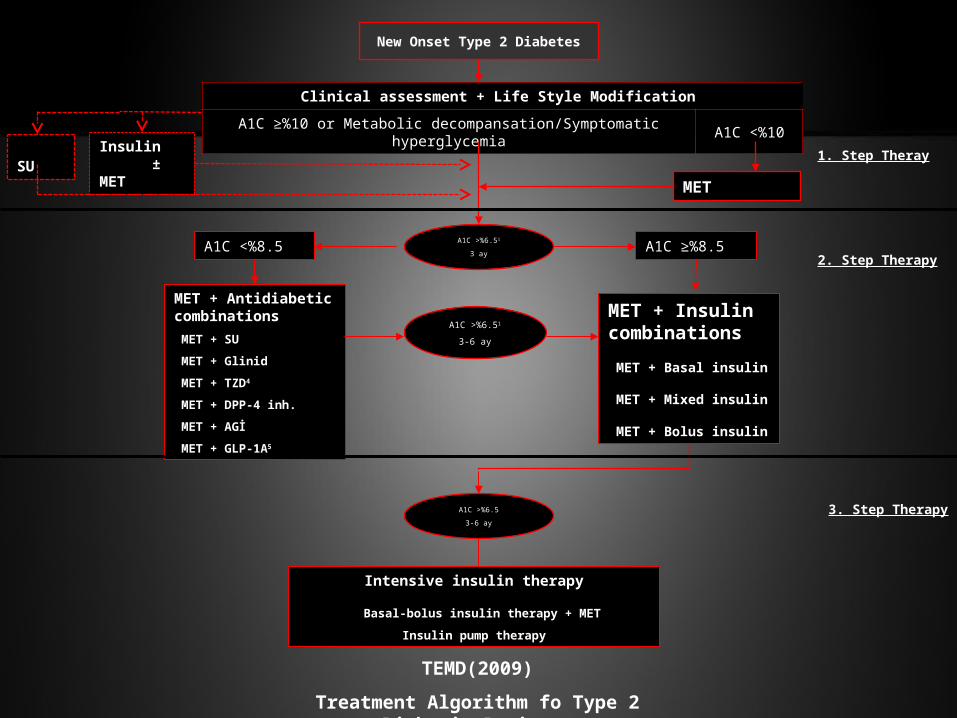
New Onset Type 2 Diabetes
A1C >%6.51
3 ayA1C ≥%8.5A1C <%8.5
A1C >%6.51
3-6 ay
MET + Antidiabetic combinations
MET + SU
MET + Glinid
MET + TZD4
MET + DPP-4 inh.
MET + AGİ
MET + GLP-1A5
MET + Insulin combinations
MET + Basal insulin
MET + Mixed insulin
MET + Bolus insulin
A1C >%6.5
3-6 ay
Intensive insulin therapy
Basal-bolus insulin therapy + MET
Insulin pump therapy
Clinical assessment + Life Style Modification
A1C ≥%10 or Metabolic decompansation/Symptomatic hyperglycemia A1C <%10
MET
Insulin ± MET
SU 1. Step Theray
2. Step Therapy
3. Step Therapy
TEMD(2009)
Treatment Algorithm fo Type 2 Diabetic Patients
Drugs Stimulating Insulin Secretion
(Insulin Secretegogues)
Sulfonylurea
Meglitinides
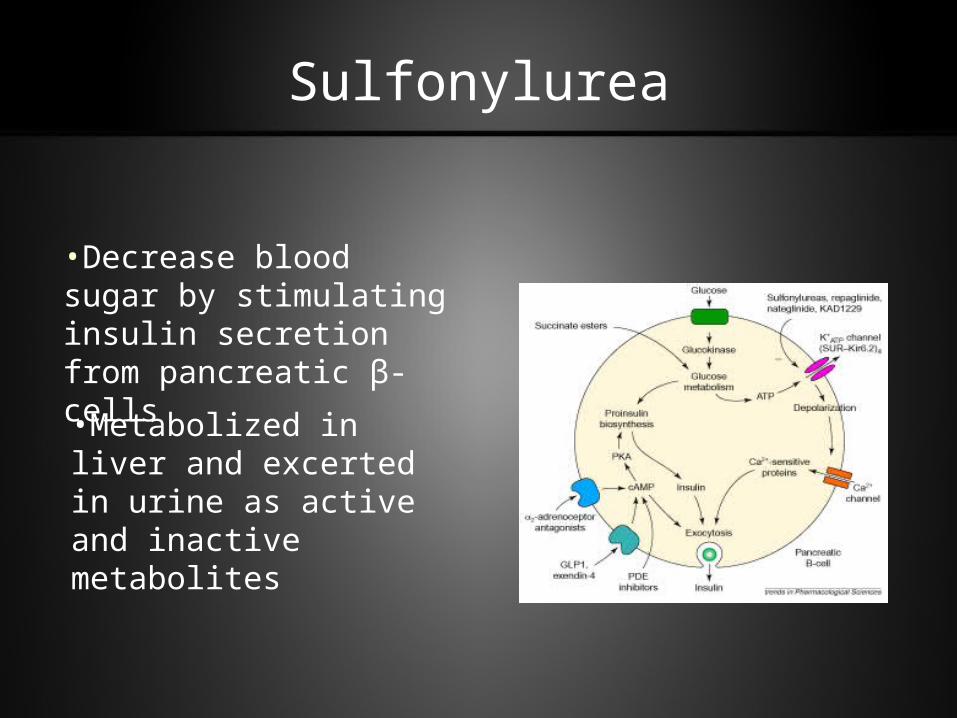
Sulfonylurea
•Decrease blood sugar by stimulating insulin secretion from pancreatic β-cells
•Metabolized in liver and excerted in urine as active and inactive metabolites
Sulfonylurea
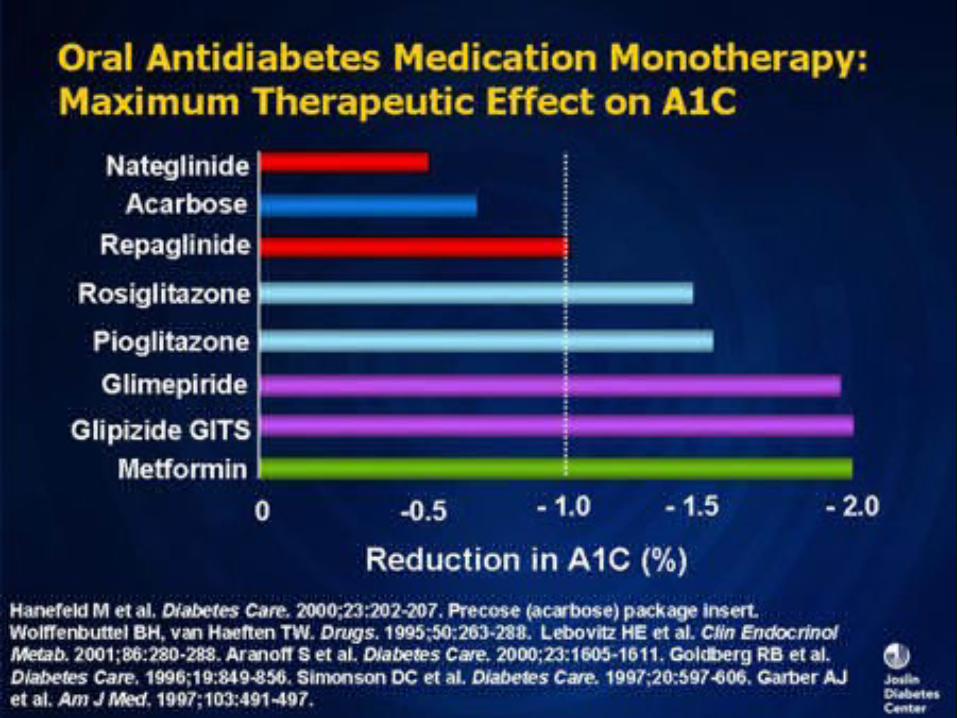
• Decreases A1c 0.8 - 1.7 % and fasting blood sugar 50 - 70 mg/dl
• 20-25 % of patients using a sulfonylurea for the first time does not achieve enough blood sugar control (Primary Failure).
• Annually 5-10 % of patients started on sulfonylurea treatment fails to control blood sugars (Secondary Failure).
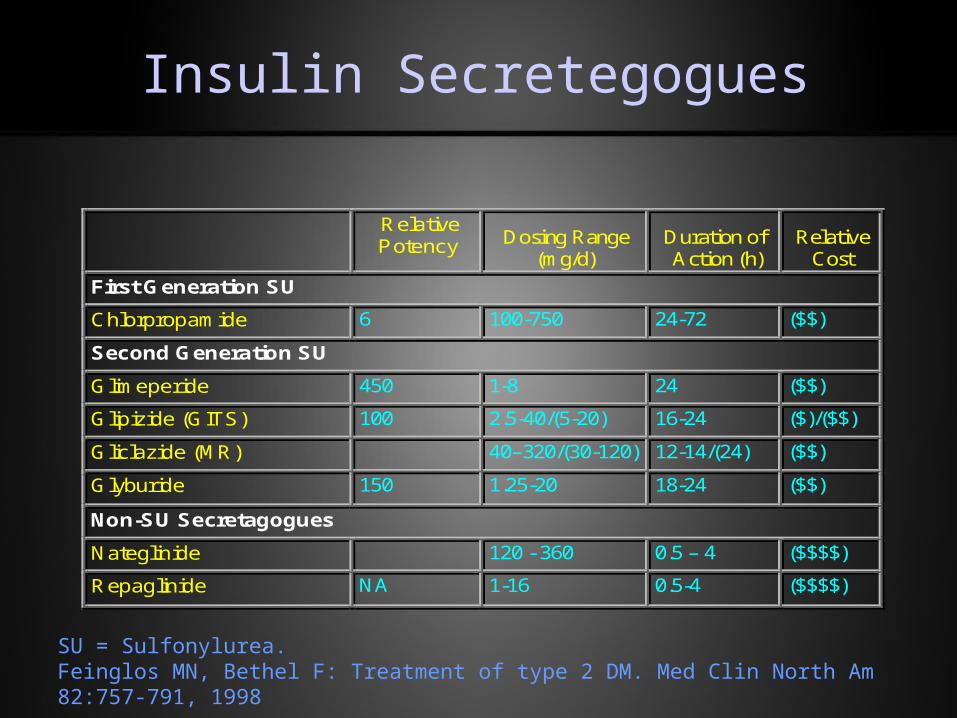
Relative Potency Dosing Range
(mg/d) Duration of Action (h)
Relative Cost
First Generation SU
Chlorpropamide 6 100-750 24-72 ($$)
Second Generation SU
Glimeperide 450 1-8 24 ($$)
Glipizide (GITS) 100 2.5-40/(5-20) 16-24 ($)/($$)
Gliclazide (MR) 40–320/(30-120) 12-14/(24) ($$)
Glyburide 150 1.25-20 18-24 ($$)
Non-SU Secretagogues
Nateglinide 120 - 360 0.5 – 4 ($$$$)
Repaglinide NA 1-16 0.5-4 ($$$$)
SU = Sulfonylurea.Feinglos MN, Bethel F: Treatment of type 2 DM. Med Clin North Am 82:757-791, 1998
Insulin Secretegogues
Sulfonylurea; Side Effects
• Hypoglycemia
• Weight gain
• SIADH (Chlorpropamide)
• Hematological abnormalities (Hemolytic anemia, Thrombocytopenia, Agranulocytosis)
• GI side effects
• Abnormal LFT
Meglitinides
• Benzoic acid derivatives.
• Short effect insulinotrophic (insulin secretion
stimulating) drugs.
• Bind same reseptor for sulfonylurea at different
position.
Repaglinide and Nateglinide
• Indicated in type 2 diabetic patients not responding diet, excercise and life style modifications
• Taken before meals
• Dose: Repaglinide 3 X 0.5-2mg, Nateglinide 3 X 60-120mg
• 0.5 – 2% decrease in A1c and 50-70 mg/dl in postprandial blood glucose
• Side effect: Hypoglycemia (less than SU)
• Contrandications: Pregnancy, lactation, hypersensitivity
• Avoid in end stage liver and renal failure
• Safer than SU in advanced ages
Alpha-Glucosidase Inhibitors
AcarboseMiglitol
Voglibose
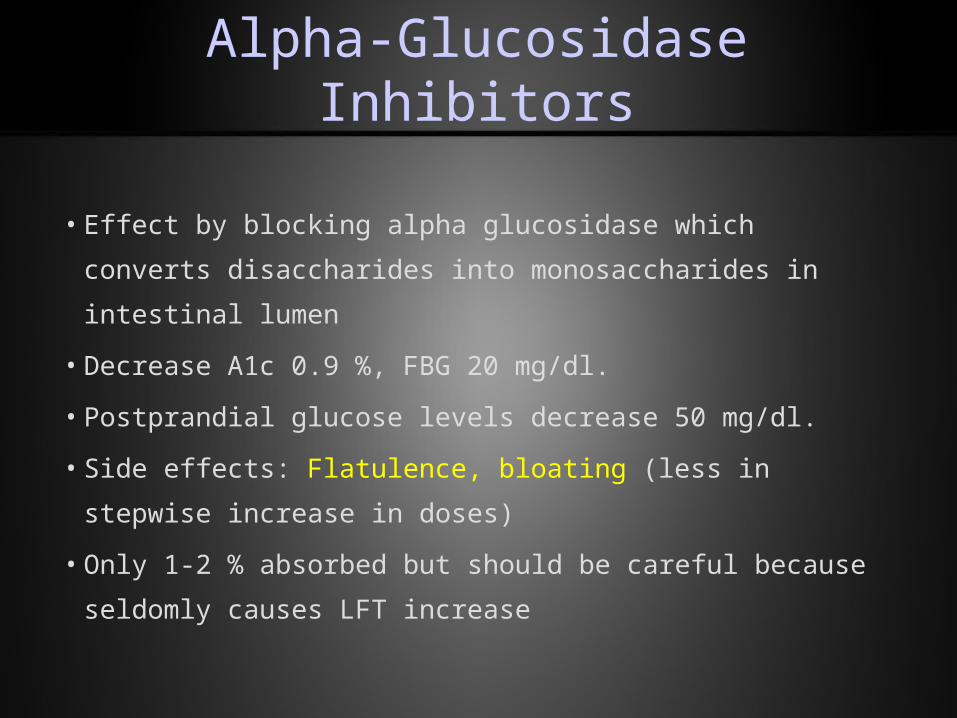
Alpha-Glucosidase Inhibitors
• Effect by blocking alpha glucosidase which converts
disaccharides into monosaccharides in intestinal lumen
• Decrease A1c 0.9 %, FBG 20 mg/dl.
• Postprandial glucose levels decrease 50 mg/dl.
• Side effects: Flatulence, bloating (less in stepwise increase in
doses)
• Only 1-2 % absorbed but should be careful because seldomly
causes LFT increase
Biguanides
(Metformin)
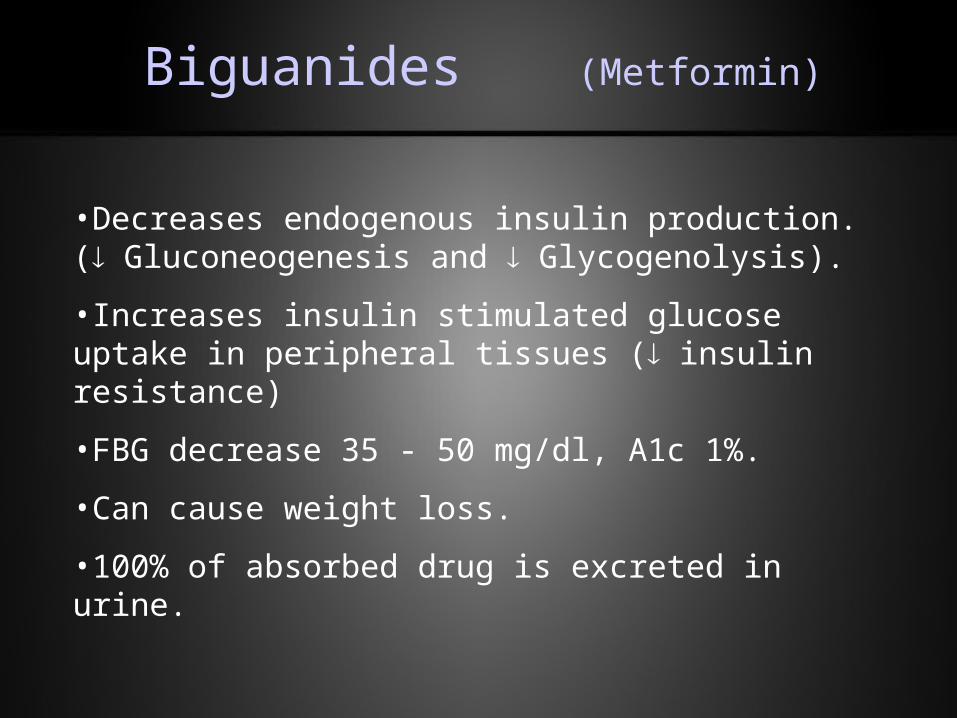
Biguanides (Metformin)
•Decreases endogenous insulin production. ( Gluconeogenesis and Glycogenolysis).
•Increases insulin stimulated glucose uptake in peripheral tissues ( insulin resistance)
•FBG decrease 35 - 50 mg/dl, A1c 1%.
•Can cause weight loss.
•100% of absorbed drug is excreted in urine.
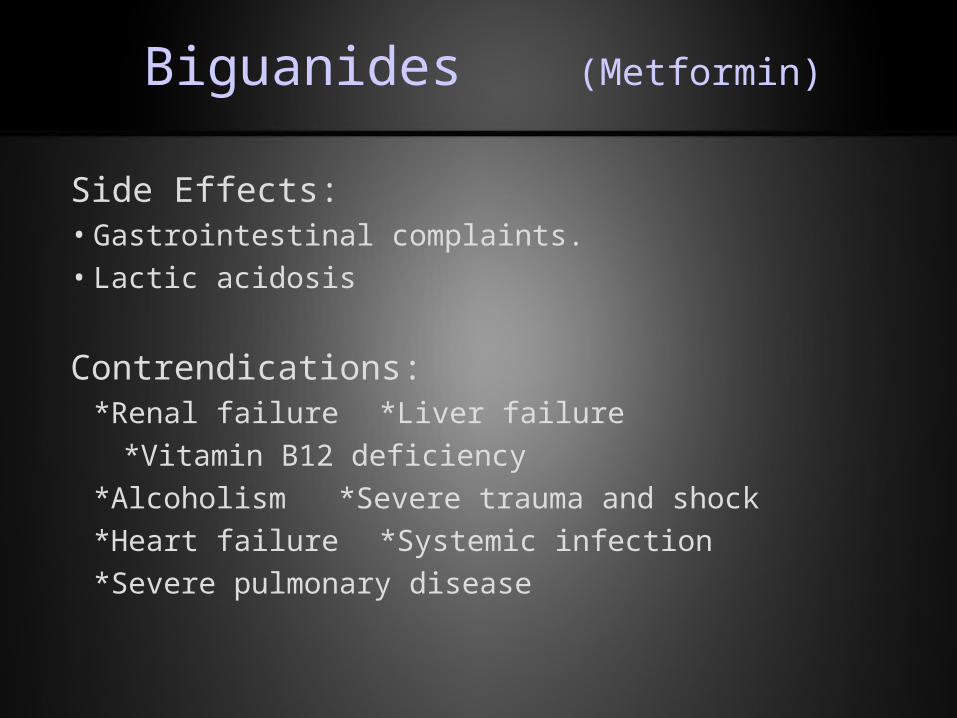
Side Effects:• Gastrointestinal complaints.
• Lactic acidosis
Contrendications:*Renal failure *Liver failure
*Vitamin B12 deficiency
*Alcoholism *Severe trauma and shock
*Heart failure *Systemic infection
*Severe pulmonary disease
Biguanides (Metformin)
Thiazolidinediones
Rosiglitazone
Pioglitazone
(Troglitazone)
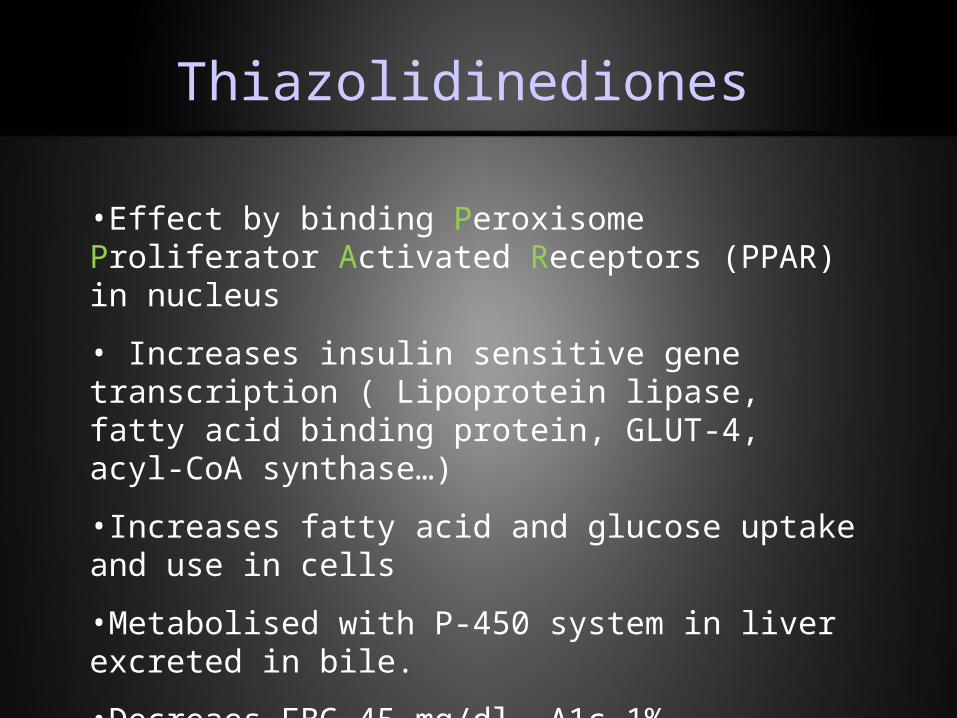
Thiazolidinediones
•Effect by binding Peroxisome Proliferator Activated Receptors (PPAR) in nucleus
• Increases insulin sensitive gene transcription ( Lipoprotein lipase, fatty acid binding protein, GLUT-4, acyl-CoA synthase…)
•Increases fatty acid and glucose uptake and use in cells
•Metabolised with P-450 system in liver excreted in bile.
•Decreaes FBG 45 mg/dl, A1c 1%.
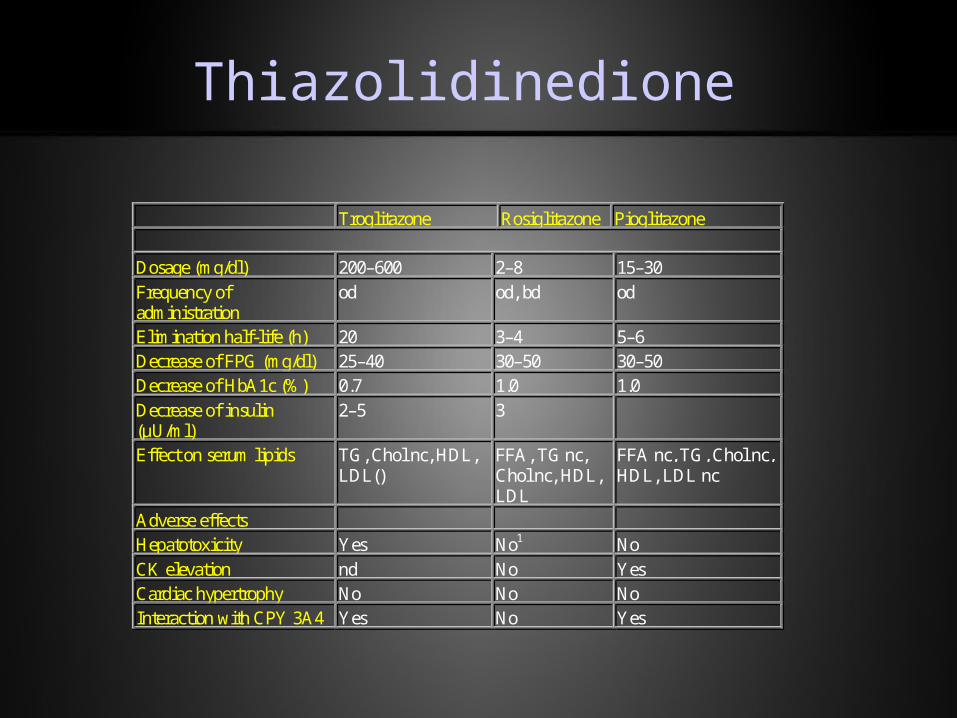
Troglitazone Rosiglitazone Pioglitazone
Dosage (mg/dl) 200–600 2–8 15–30Frequency ofadministration
od od, bd od
Elimination half-life (h) 20 3–4 5–6Decrease of FPG (mg/dl) 25–40 30–50 30–50Decrease of HbA1c (%) 0.7 1.0 1.0Decrease of insulin(µU/ml)
2–5 3
Effect on serum lipids TG, Chol nc, HDL,LDL()
FFA, TG nc,Chol nc, HDL,LDL
FFA nc, TG, Chol nc,HDL, LDL nc
Adverse effectsHepatotoxicity Yes No1 NoCK elevation nd No YesCardiac hypertrophy No No NoInteraction with CPY 3A4 Yes No Yes
Thiazolidinedione
Thiazolidinedione – Side Effects:
• Edema and water retention (Contrendicated in NYHA Class III ve IV heart failure)
• Weight gain (not different than insülin and sulfonylurea)
• Increase in CPK (mechanism?)
• Increase in LFT (not different than placebo with Rosiglitazone and Pioglitazone)

The family of incretin-based therapies
Human GLP-1 analogues, e.g.
liraglutide
Exendin-basedtherapies, e.g.
exenatide
GLP-1 receptor agonists
DPP-4 inhibitors, e.g.
sitagliptin, vildagliptin
Incretin-basedtherapies
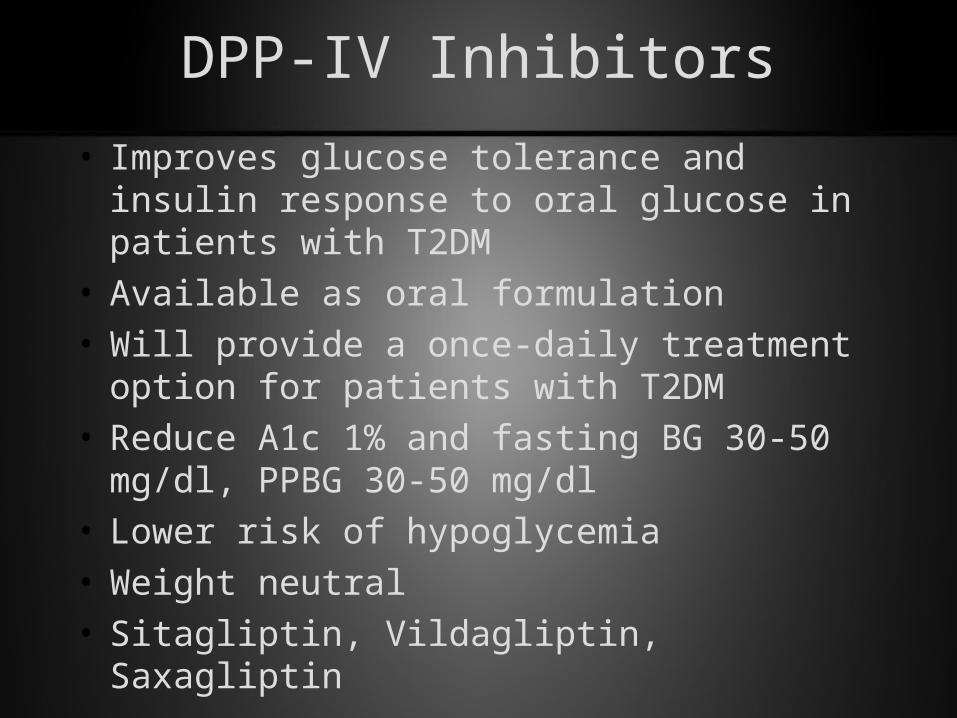
DPP-IV Inhibitors
• Improves glucose tolerance and insulin response to oral glucose in patients with T2DM
• Available as oral formulation• Will provide a once-daily treatment option for
patients with T2DM• Reduce A1c 1% and fasting BG 30-50 mg/dl, PPBG
30-50 mg/dl• Lower risk of hypoglycemia• Weight neutral• Sitagliptin, Vildagliptin, Saxagliptin
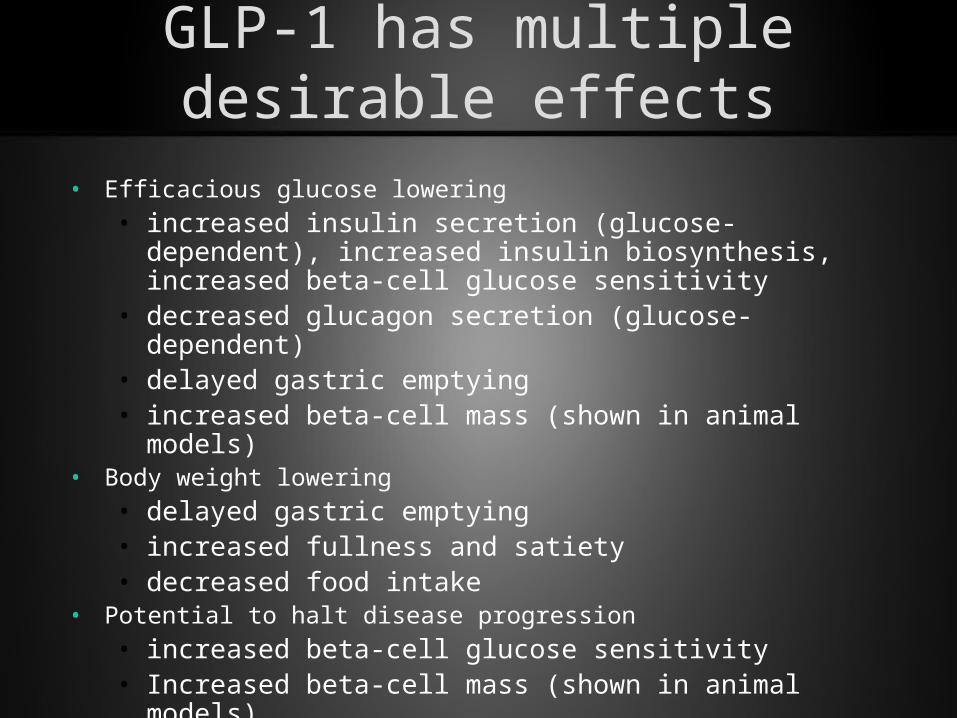
GLP-1 has multiple desirable effects
• Efficacious glucose lowering• increased insulin secretion (glucose-dependent),
increased insulin biosynthesis, increased beta-cell glucose sensitivity
• decreased glucagon secretion (glucose-dependent)• delayed gastric emptying• increased beta-cell mass (shown in animal models)
• Body weight lowering• delayed gastric emptying• increased fullness and satiety• decreased food intake
• Potential to halt disease progression• increased beta-cell glucose sensitivity• Increased beta-cell mass (shown in animal models)
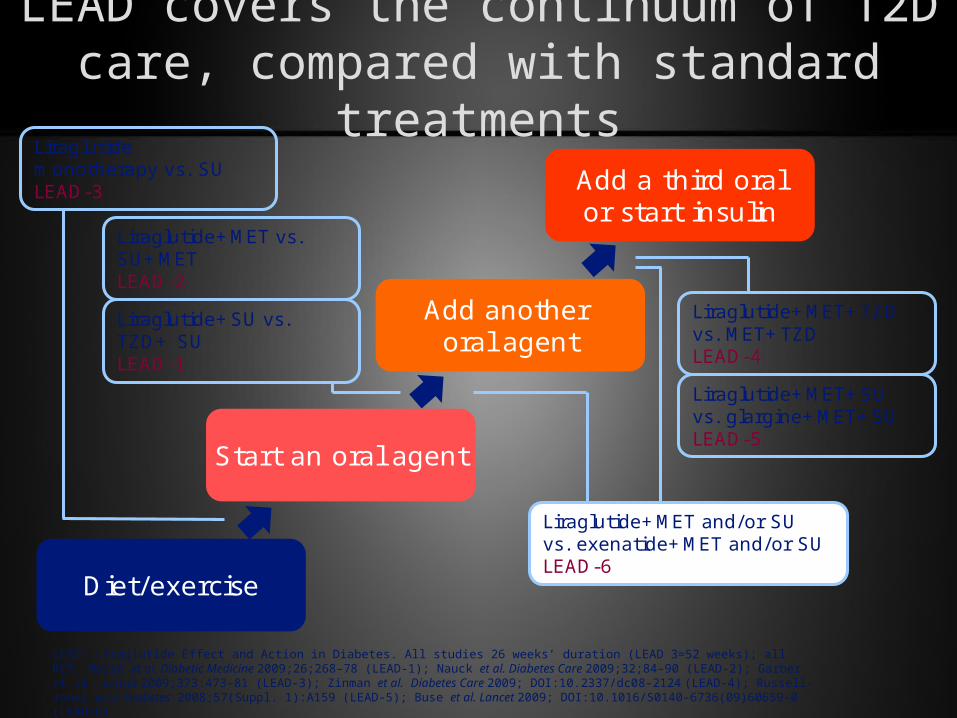
LEAD covers the continuum of T2D care, compared with standard treatments
Diet/exercise
Start an oral agent
Add another oral agent
Add a third oralor start insulin
Liraglutide monotherapy vs. SULEAD-3
Liraglutide+MET vs. SU+MET LEAD-2
Liraglutide+SU vs. TZD+ SU LEAD-1
Liraglutide+MET+TZDvs. MET+TZDLEAD-4
Liraglutide+MET+SUvs. glargine+MET+SULEAD-5
Liraglutide+MET and/or SU vs. exenatide+MET and/or SULEAD-6
LEAD: Liraglutide Effect and Action in Diabetes. All studies 26 weeks’ duration (LEAD 3=52 weeks); all RCT; Marre et al. Diabetic Medicine 2009;26;268–78 (LEAD-1); Nauck et al. Diabetes Care 2009;32;84–90 (LEAD-2); Garber et al. Lancet 2009;373:473–81 (LEAD-3); Zinman et al. Diabetes Care 2009; DOI:10.2337/dc08-2124 (LEAD-4); Russell-Jones et al. Diabetes 2008;57(Suppl. 1):A159 (LEAD-5); Buse et al. Lancet 2009; DOI:10.1016/S0140-6736(09)60659-0 (LEAD-6)
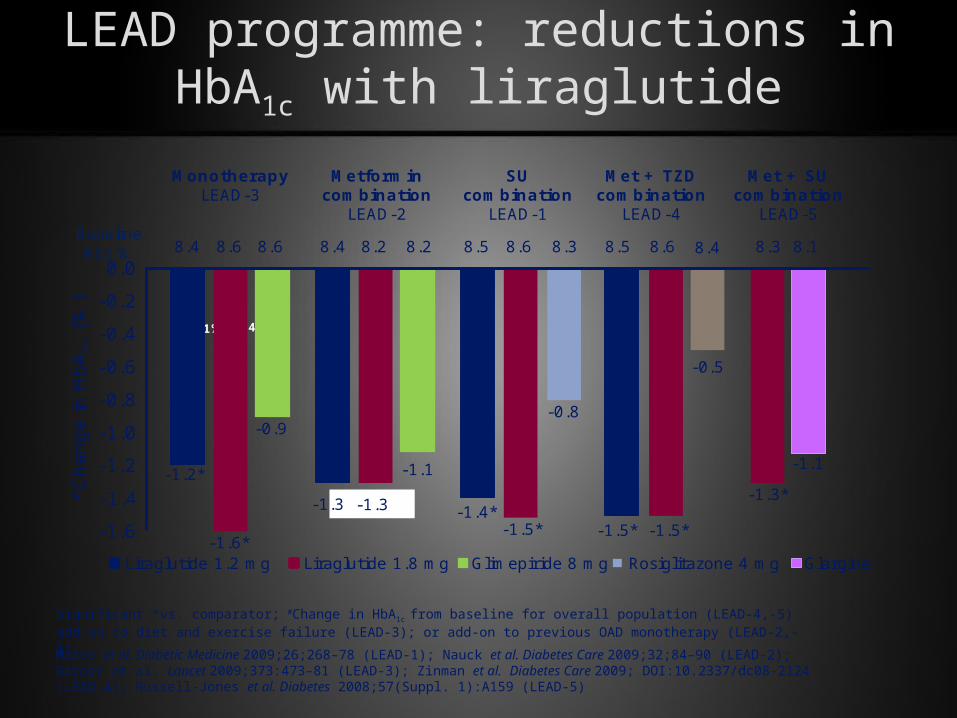
LEAD programme: reductions in HbA1c with liraglutide
#C
hange in H
bA
1c
(%)
0.0
-0.2
-0.4
-0.6
-0.8
-1.0
-1.2
-1.4
SU combination
LEAD-1
Metformin combination
LEAD-2
Met + TZD combination
LEAD-4
Met + SU combination
LEAD-5
-1.6
-1.3*
-1.5*-1.5*
MonotherapyLEAD-3
51% 43%
-1.4*-1.3
-1.1
-1.6*
-1.2*
-1.5*
-0.9
-1.3
-0.8
-1.1
-0.5
Baseline A1c % 8.3 8.18.68.58.38.68.58.2 8.28.6 8.6 8.48.4 8.4
Liraglutide 1.8 mgLiraglutide 1.2 mg Glimepiride 8 mg Rosiglitazone 4 mg Glargine
Significant *vs. comparator; #Change in HbA1c from baseline for overall population (LEAD-4,-5) add-on to diet and exercise failure (LEAD-3); or add-on to previous OAD monotherapy (LEAD-2,-1). Marre et al. Diabetic Medicine 2009;26;268–78 (LEAD-1); Nauck et al. Diabetes Care 2009;32;84–90 (LEAD-2); Garber et al. Lancet 2009;373:473–81 (LEAD-3); Zinman et al. Diabetes Care 2009; DOI:10.2337/dc08-2124 (LEAD-4); Russell-Jones et al. Diabetes 2008;57(Suppl. 1):A159 (LEAD-5)
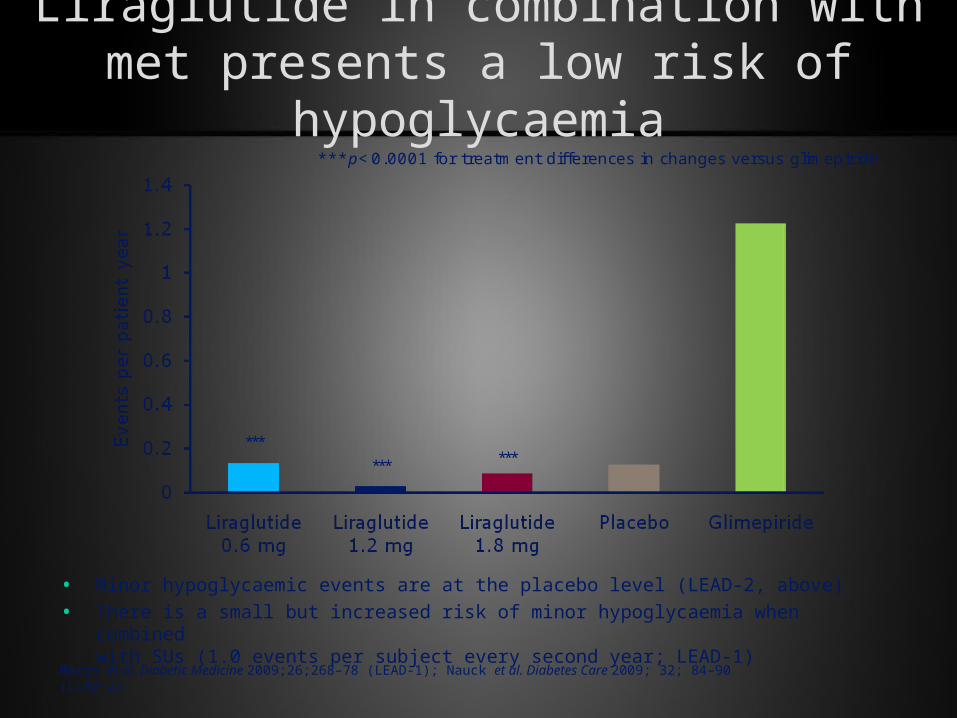
Liraglutide in combination with met presents a low risk of hypoglycaemia
***p<0.0001 for treatment differences in changes versus glimepiride
******
***
• Minor hypoglycaemic events are at the placebo level (LEAD-2, above)
• There is a small but increased risk of minor hypoglycaemia when combined with SUs (1.0 events per subject every second year; LEAD-1)
Marre et al. Diabetic Medicine 2009;26;268–78 (LEAD-1); Nauck et al. Diabetes Care 2009; 32; 84–90 (LEAD-2)
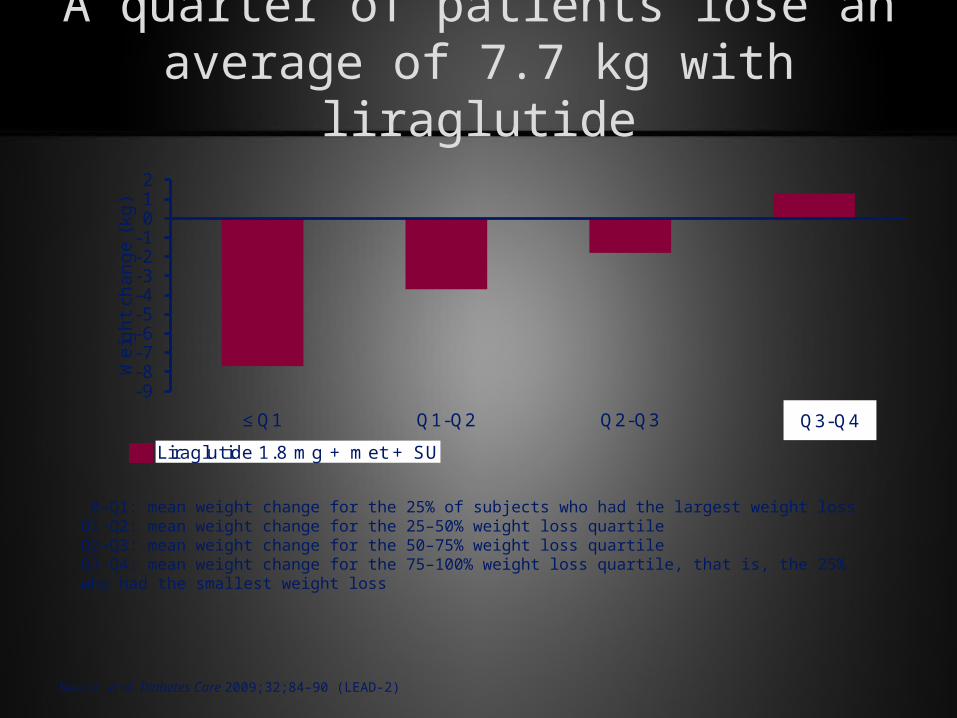
A quarter of patients lose an average of 7.7 kg with liraglutide
-9-8-7-6-5-4-3-2-1012
≤Q1 Q1-Q2 Q2-Q3 >Q3
Weig
ht
chan
ge (
kg)
Liraglutide 1.8 mg + met + SU
Q3-Q4
0–Q1: mean weight change for the 25% of subjects who had the largest weight loss Q1–Q2: mean weight change for the 25–50% weight loss quartile Q2–Q3: mean weight change for the 50–75% weight loss quartile Q3–Q4: mean weight change for the 75–100% weight loss quartile, that is, the 25% who had the smallest weight loss
Nauck et al. Diabetes Care 2009;32;84–90 (LEAD-2)
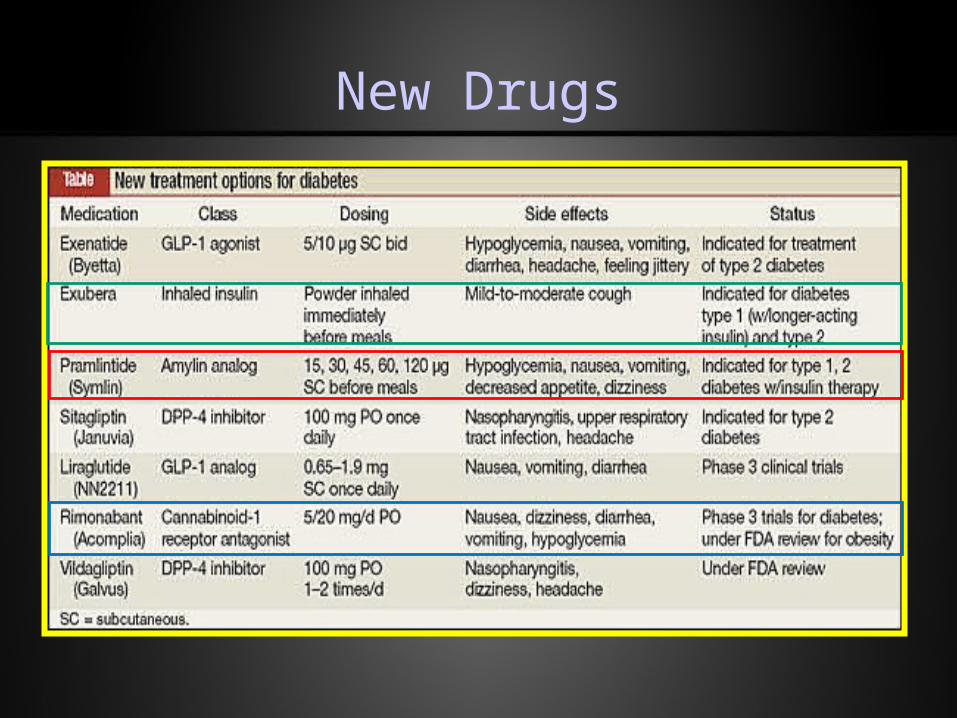
New Drugs
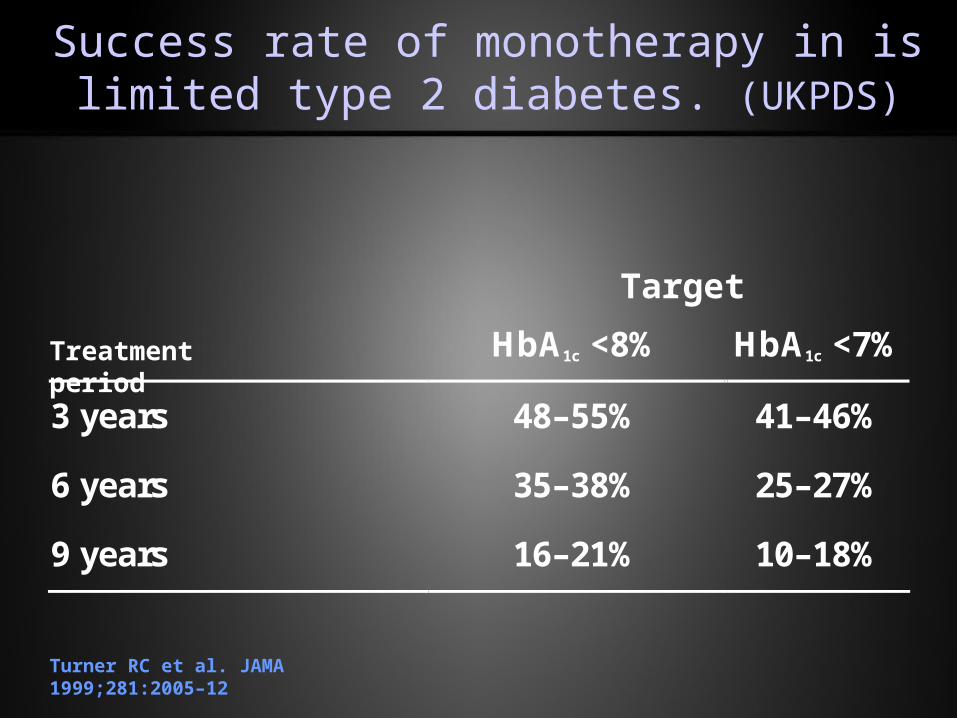
Success rate of monotherapy in is limited type 2 diabetes. (UKPDS)
Turner RC et al. JAMA 1999;281:2005–12
HbA1c <8%
HbA1c <7%
3 years 48–55% 41–46%
6 years 35–38% 25–27%
9 years 16–21% 10–18%
Target
Treatment period
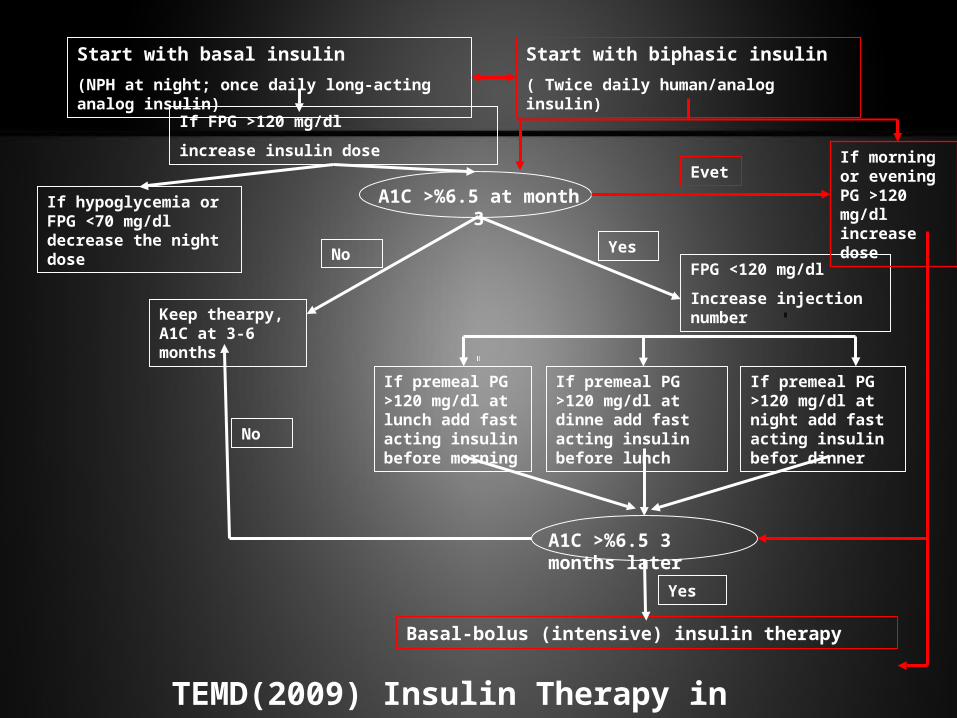
Start with basal insulin
(NPH at night; once daily long-acting analog insulin)
If FPG >120 mg/dl
increase insulin dose
If hypoglycemia or FPG <70 mg/dl decrease the night dose
A1C >%6.5 3 months later
No Yes
Keep thearpy, A1C at 3-6 months
If premeal PG >120 mg/dl at lunch add fast acting insulin before morning
If premeal PG >120 mg/dl at dinne add fast acting insulin before lunch
If premeal PG >120 mg/dl at night add fast acting insulin befor dinner
Basal-bolus (intensive) insulin therapy
A1C >%6.5 at month 3
FPG <120 mg/dl
Increase injection number
Yes
No
TEMD(2009) Insulin Therapy in Type 2 Diabetes
Start with biphasic insulin
( Twice daily human/analog insulin)
EvetIf morning or evening PG >120 mg/dl increase dose
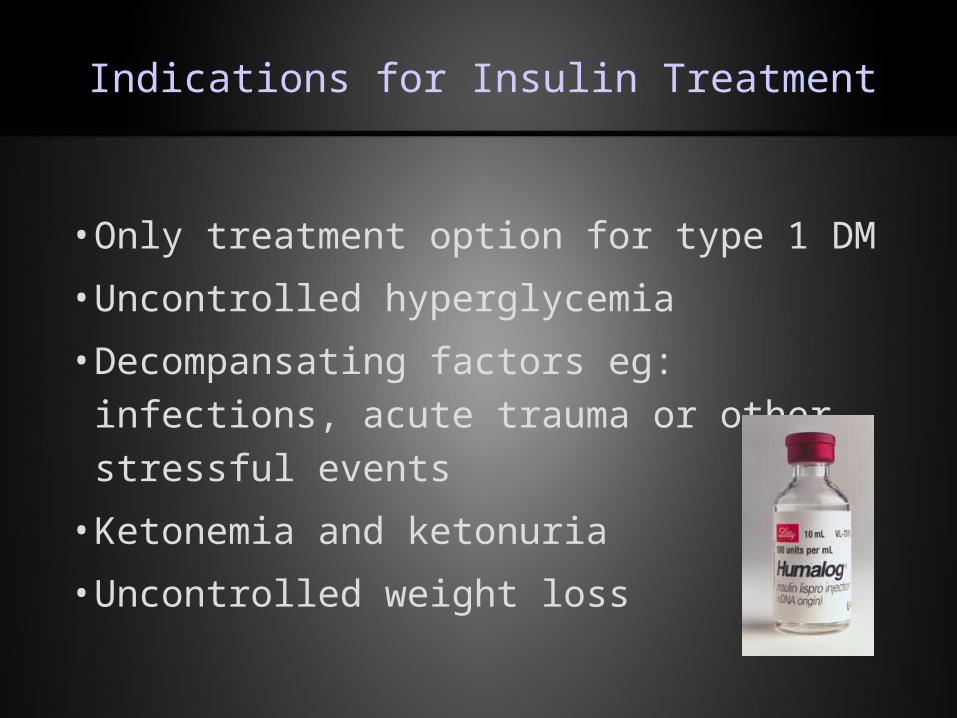
• Only treatment option for type 1 DM
• Uncontrolled hyperglycemia
• Decompansating factors eg: infections, acute trauma or
other stressful events
• Ketonemia and ketonuria
• Uncontrolled weight loss
Indications for Insulin Treatment
•Perioperative period
•Pregnancy
•Renal and liver failure
•Allergic reactions to oral antidiabetic patients
•LADA (Latent autoimmune diabetes in adults)
•Patient or doctor choice
Indications for Insulin Treatment
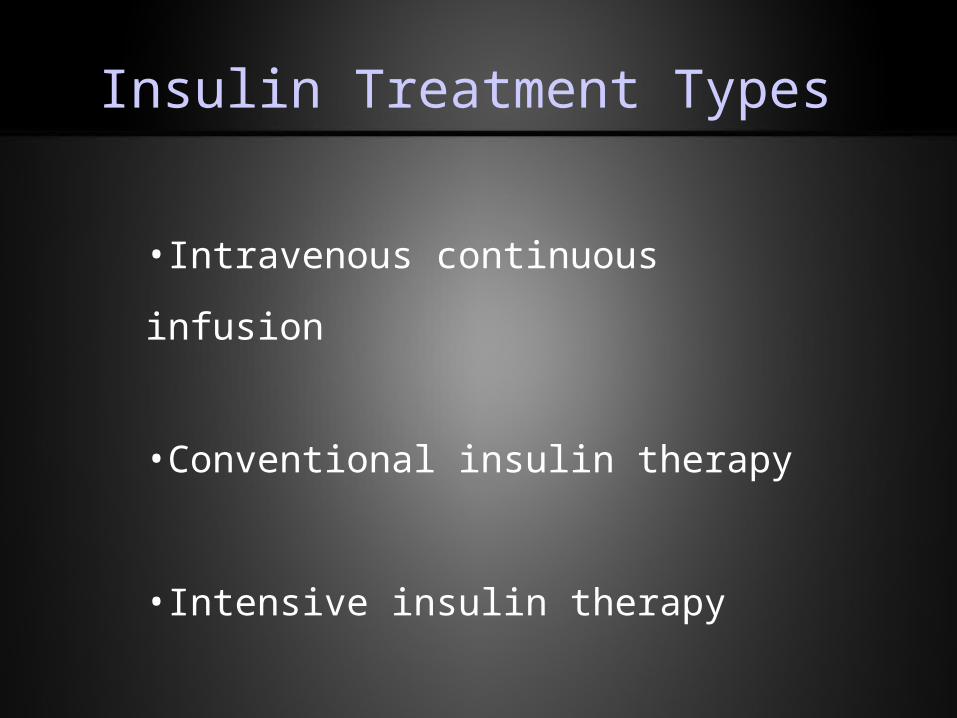
Insulin Treatment Types
•Intravenous continuous infusion
•Conventional insulin therapy
•Intensive insulin therapy
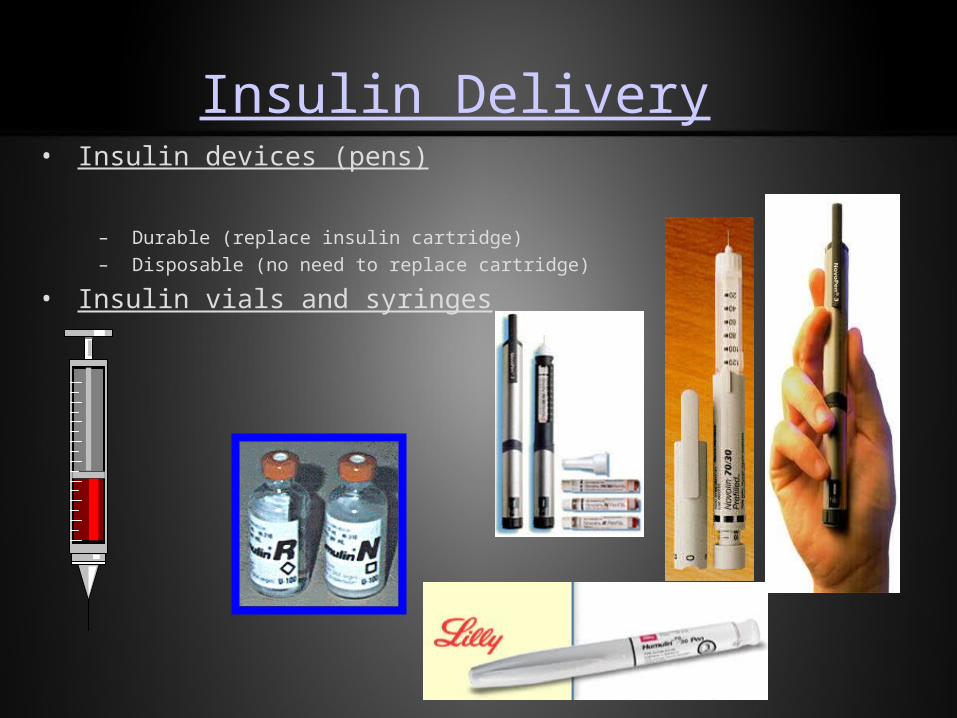
Insulin Delivery• Insulin devices (pens)
– Durable (replace insulin cartridge)
– Disposable (no need to replace cartridge)
• Insulin vials and syringes
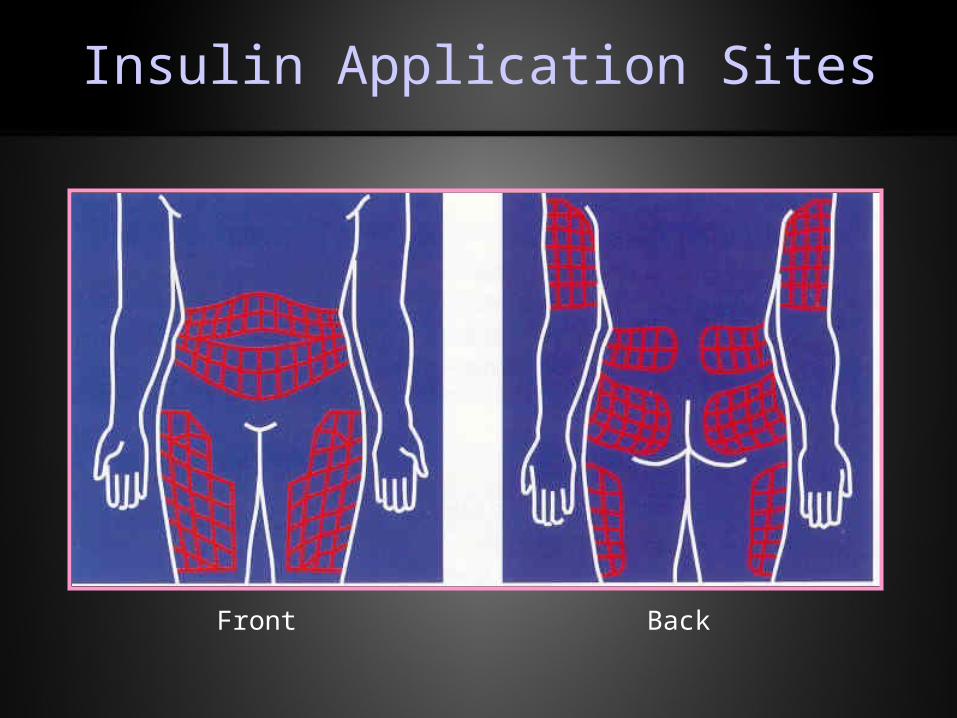
Front Back
Insulin Application Sites
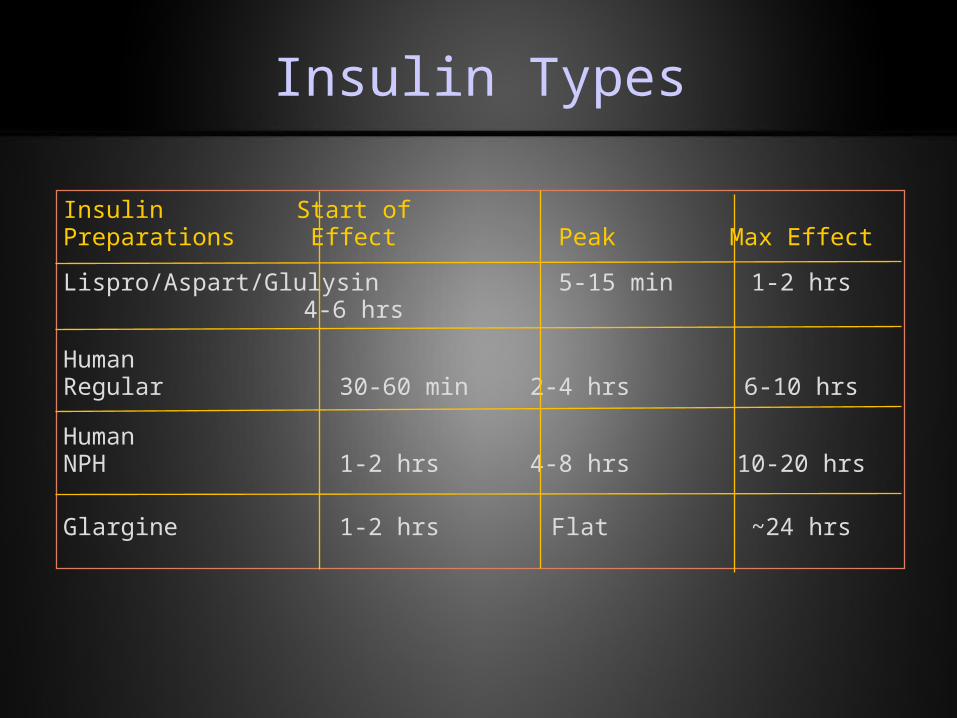
Insulin Types
Insulin Start ofPreparations Effect Peak Max Effect
Lispro/Aspart/Glulysin 5-15 min 1-2 hrs 4-6 hrs
Human Regular 30-60 min 2-4 hrs 6-10 hrs
Human NPH 1-2 hrs 4-8 hrs 10-20 hrs
Glargine 1-2 hrs Flat ~24 hrs
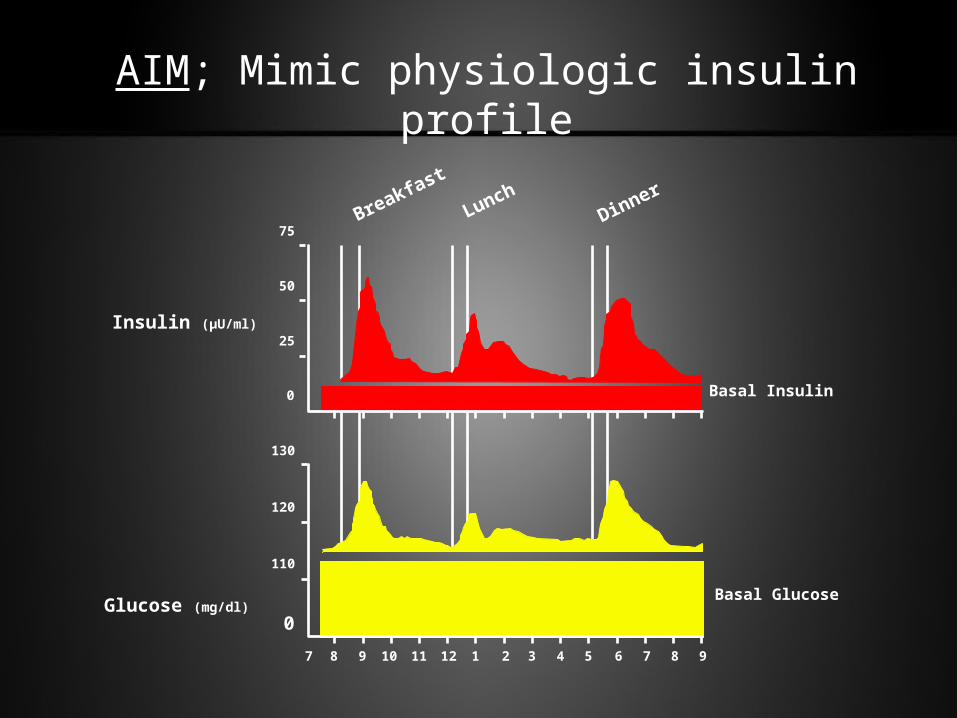
AIM; Mimic physiologic insulin profile
130
120
110
0
7 8 9 10 11 12 1 2 3 4 5 6 7 8 9
Breakfast
LunchDinner
75
50
25
0 Basal Insulin
Basal Glucose
Insulin (µU/ml)
Glucose (mg/dl)
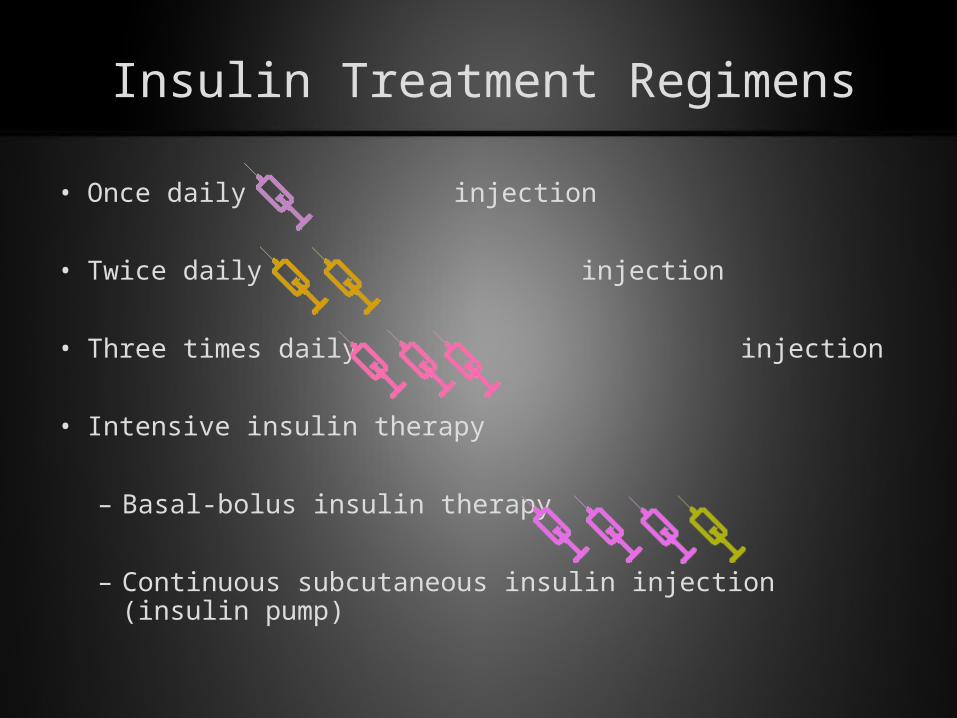
Insulin Treatment Regimens
• Once daily injection
• Twice daily injection
• Three times daily injection
• Intensive insulin therapy
– Basal-bolus insulin therapy
– Continuous subcutaneous insulin injection (insulin pump)
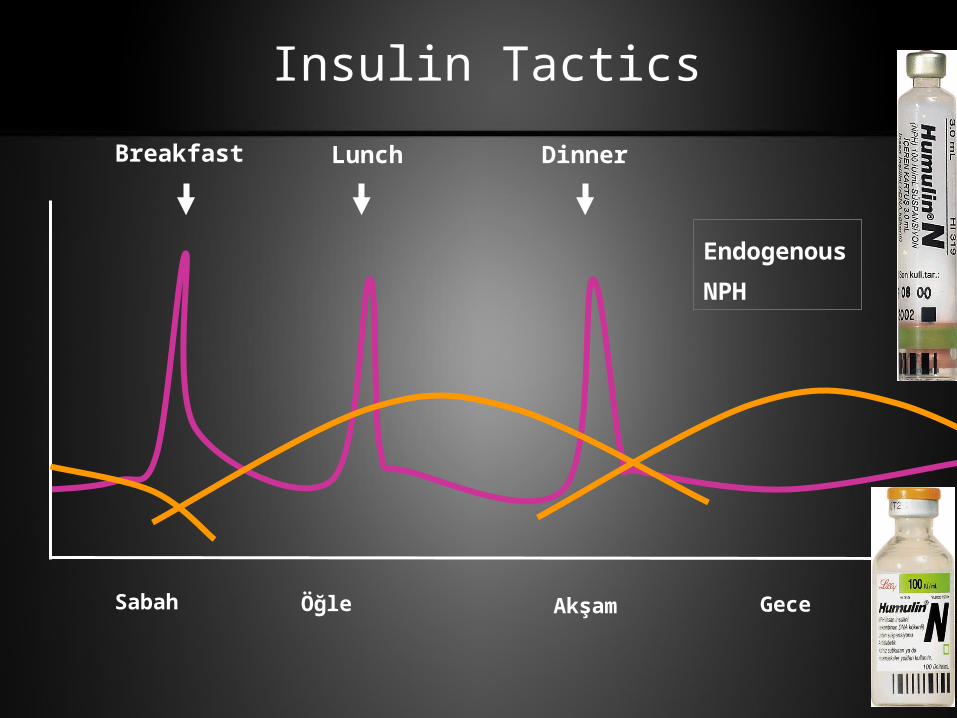
Breakfast Lunch Dinner
Endogenous
NPH
Sabah GeceÖğle Akşam
Insulin Tactics
Breakfast Lunch Dinner
Sabah GeceÖğle Akşam
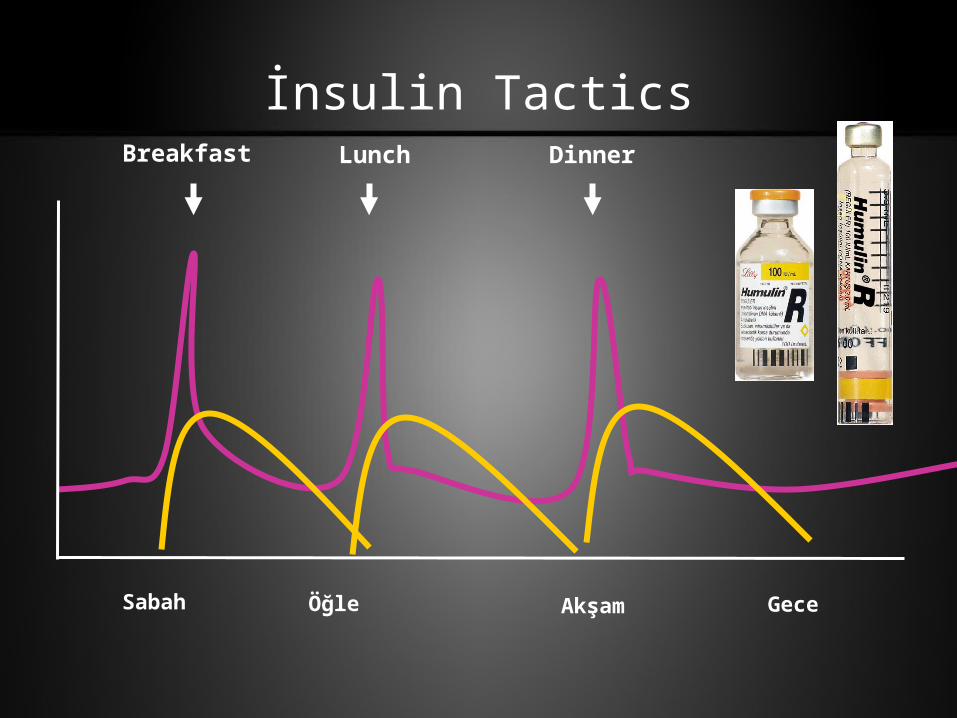
İnsulin Tactics
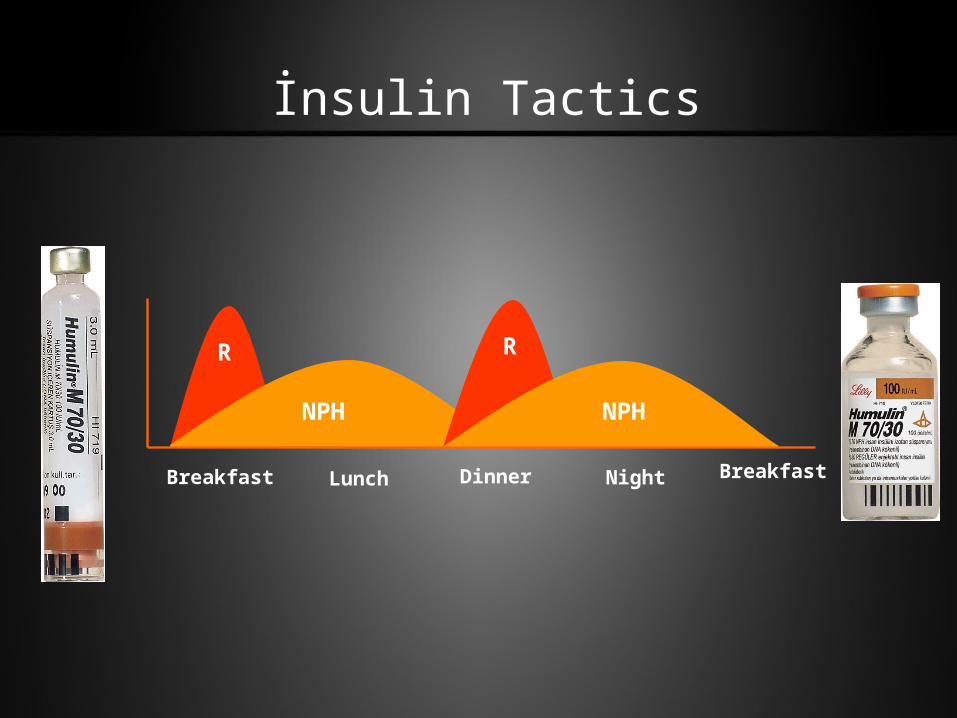
Breakfast Dinner
R
Lunch
NPH NPH
R
Breakfast
İnsulin Tactics
Night
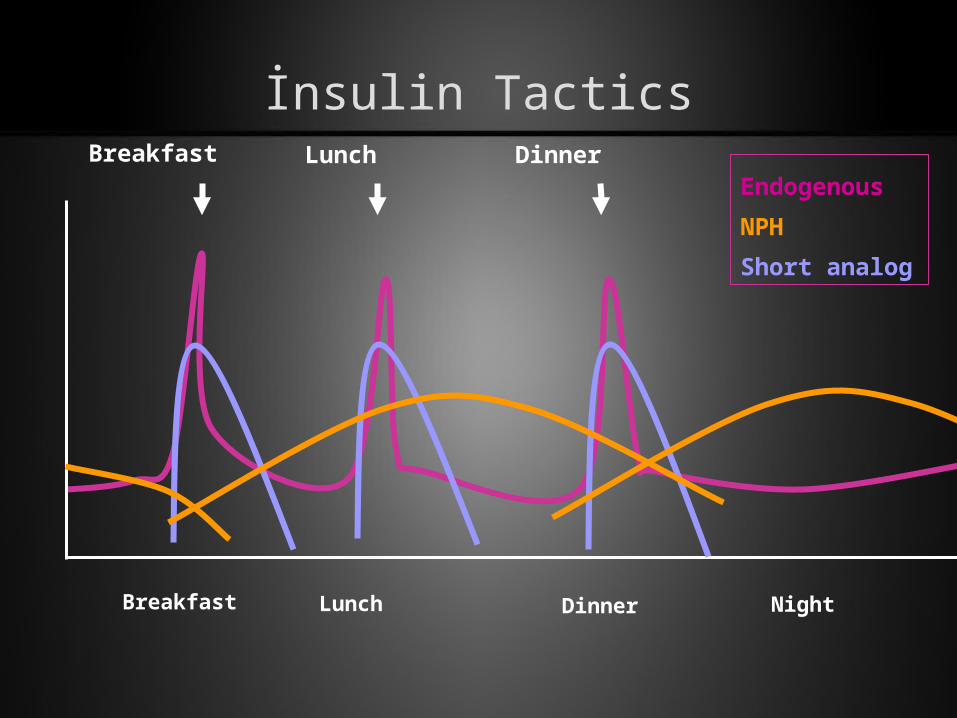
Breakfast Lunch DinnerEndogenous
NPH
Short analog
Breakfast NightLunch Dinner
İnsulin Tactics
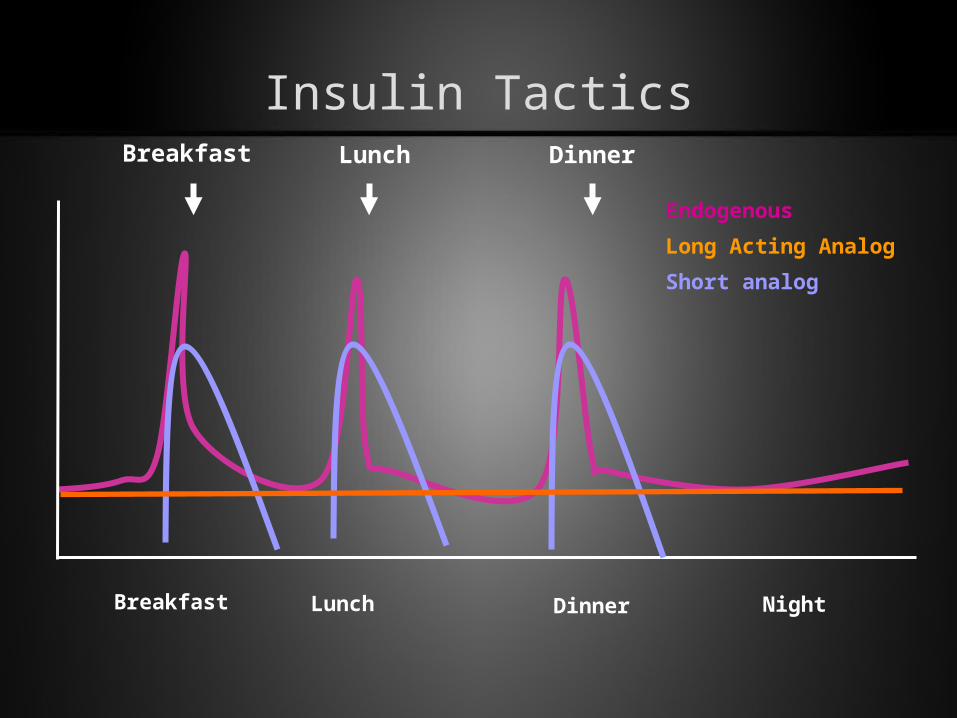
Breakfast Lunch Dinner
Endogenous
Long Acting Analog
Short analog
Breakfast NightLunch Dinner
Insulin Tactics
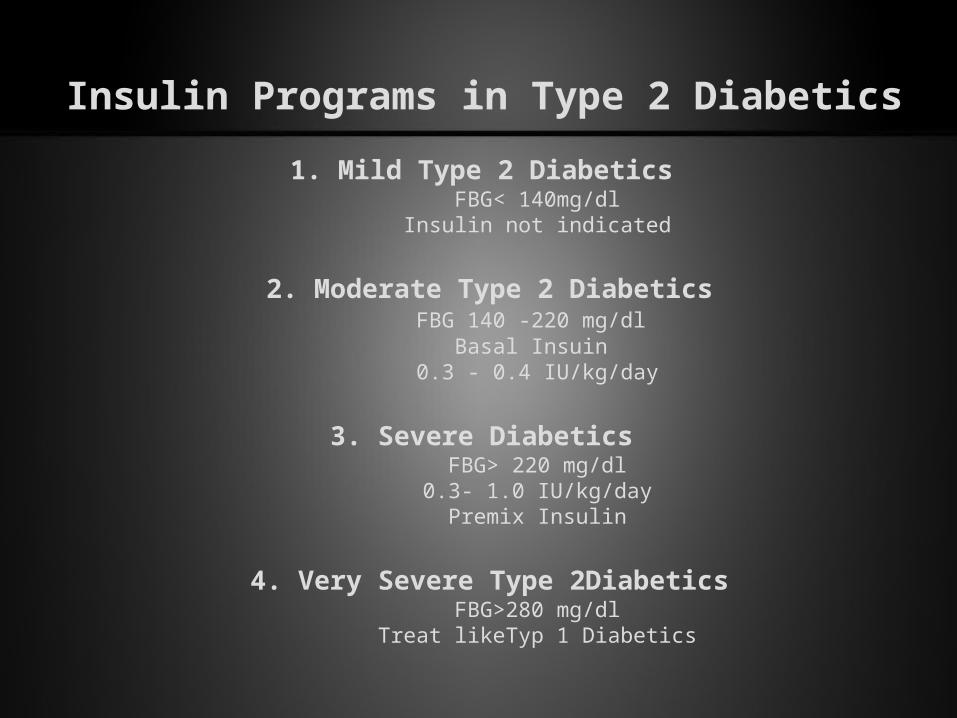
1. Mild Type 2 Diabetics FBG< 140mg/dl
Insulin not indicated
2. Moderate Type 2 DiabeticsFBG 140 -220 mg/dl
Basal Insuin 0.3 - 0.4 IU/kg/day
3. Severe Diabetics FBG> 220 mg/dl
0.3- 1.0 IU/kg/dayPremix Insulin
4. Very Severe Type 2DiabeticsFBG>280 mg/dl
Treat likeTyp 1 Diabetics
Insulin Programs in Type 2 Diabetics
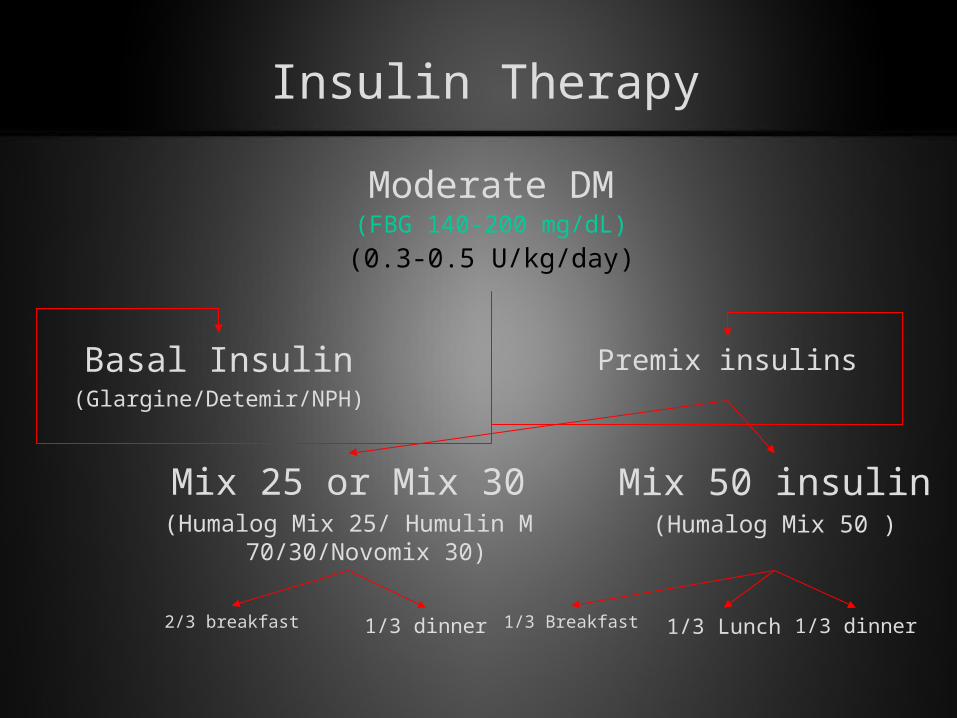
Insulin Therapy
Moderate DM(FBG 140-200 mg/dL)
(0.3-0.5 U/kg/day)
Basal Insulin(Glargine/Detemir/NPH)
Premix insulins
Mix 25 or Mix 30(Humalog Mix 25/ Humulin M
70/30/Novomix 30)
Mix 50 insulin(Humalog Mix 50 )
2/3 breakfast 1/3 dinner 1/3 Breakfast 1/3 dinner1/3 Lunch
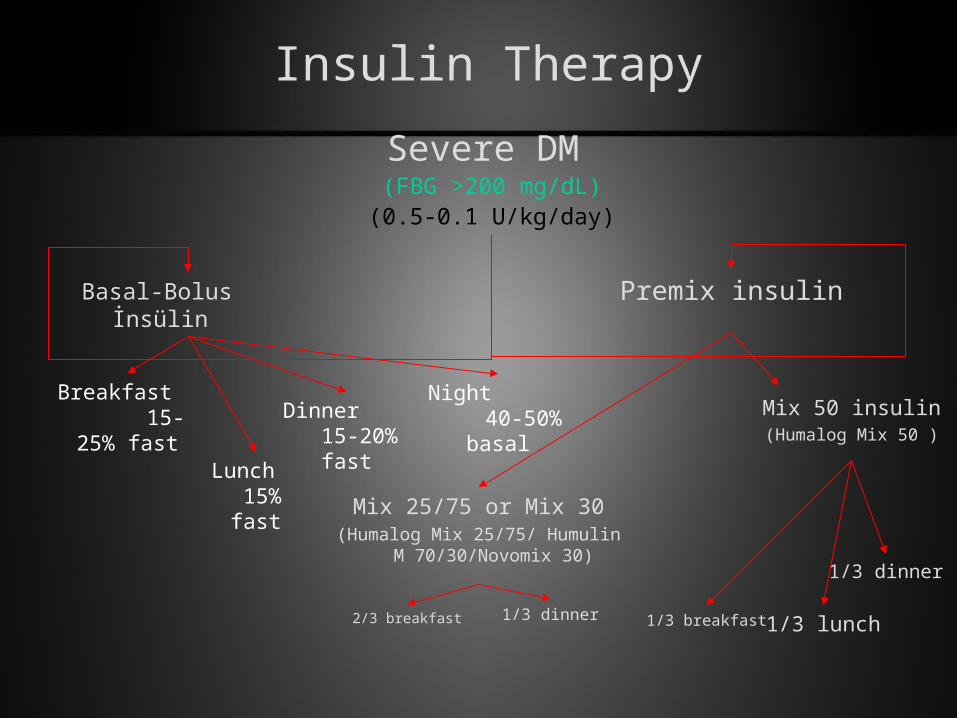
Insulin Therapy
Basal-Bolus İnsülin
Severe DM (FBG >200 mg/dL)(0.5-0.1 U/kg/day)
Premix insulin
Mix 25/75 or Mix 30(Humalog Mix 25/75/ Humulin M
70/30/Novomix 30)
2/3 breakfast 1/3 dinner 1/3 breakfast
1/3 dinner
1/3 lunch
Mix 50 insulin(Humalog Mix 50 )
Breakfast 15-25% fast
Lunch 15% fast
Dinner 15-20% fast
Night 40-50% basal

FOLLOW-UP ?
At least 3 day/week glucose profile shold be done
Glycemia in a meal is controlled by previous insulin dose
If exist, hypoglycemia should be corrected first
If hyperglycemia persists all day long, begin titration from the highest
Insulin Dose Titration

Bad Glycemic Profile
• General assessment
• Control diet–excercise plan
• Control insulin effectivity
• Focal infection or anything increasing insulin need
• Control application site and style
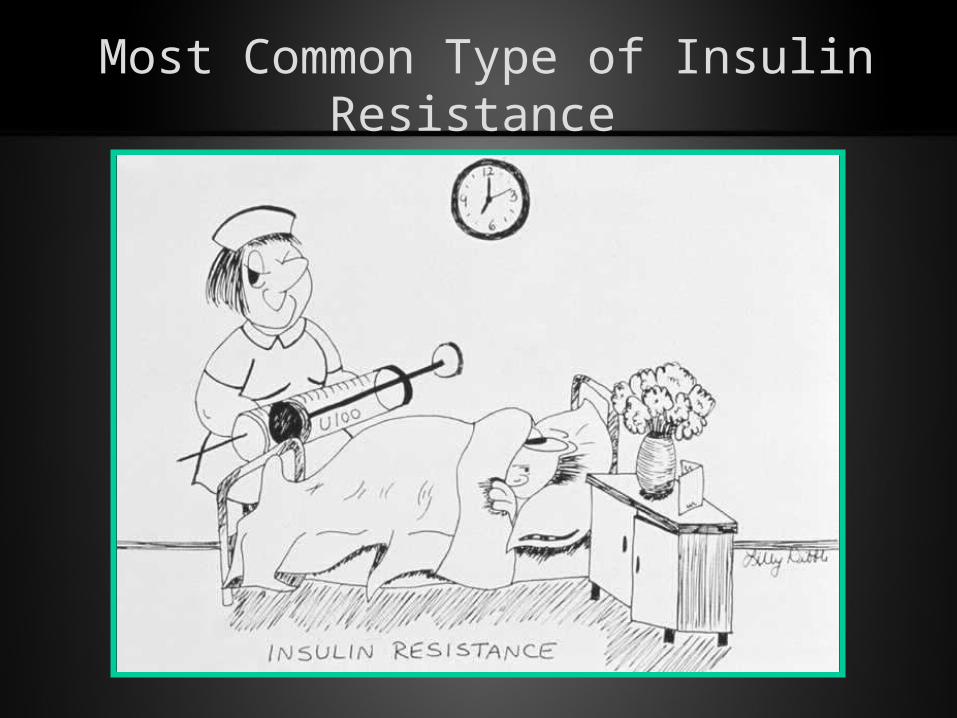
Most Common Type of Insulin Resistance

EDUCATION
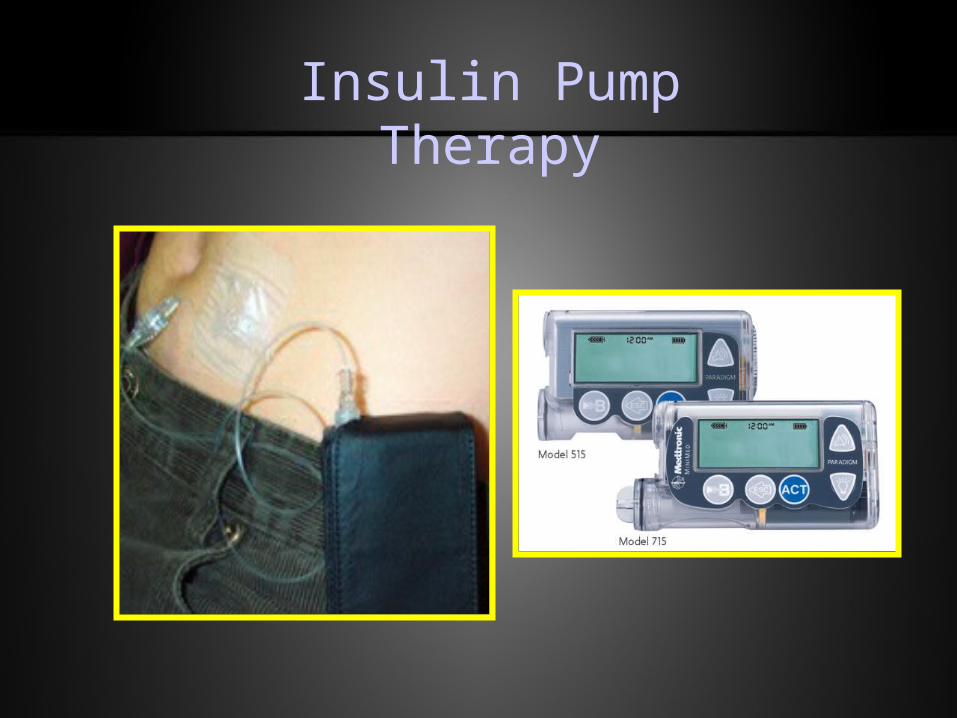
Insulin Pump Therapy
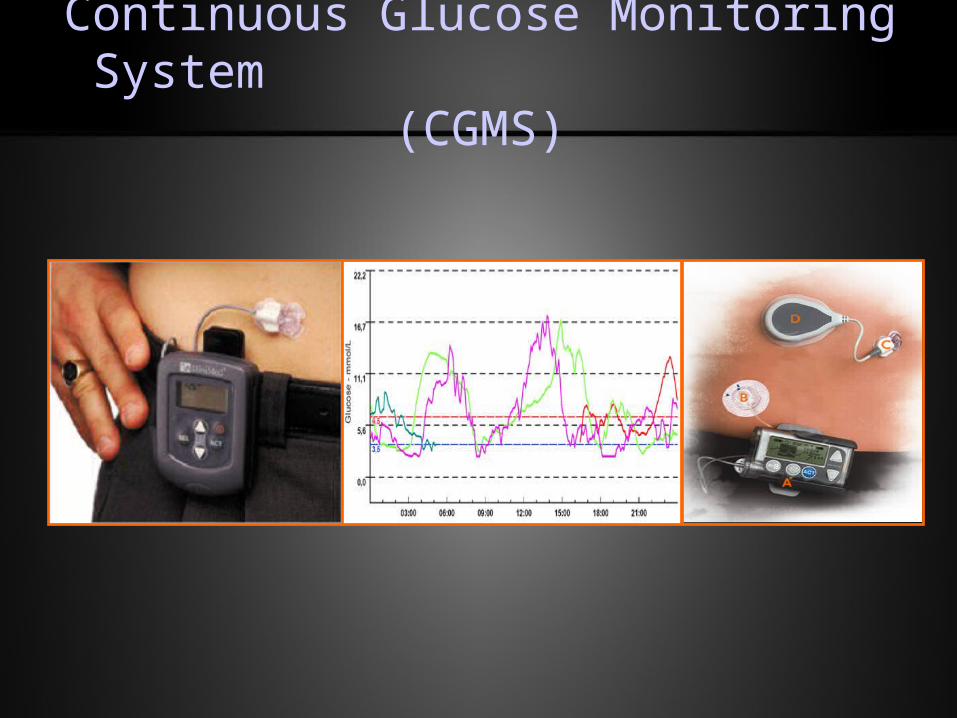
Continuous Glucose Monitoring System (CGMS)
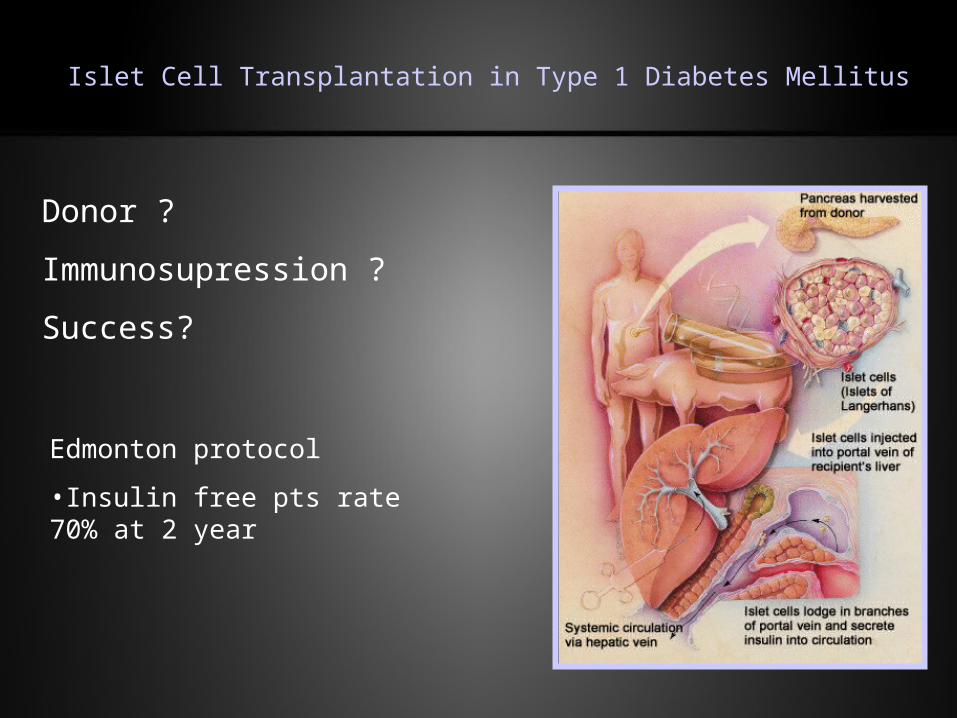
Islet Cell Transplantation in Type 1 Diabetes Mellitus
Donor ?
Immunosupression ?
Success?
Edmonton protocol
•Insulin free pts rate 70% at 2 year