Embed Size (px)
Citation preview
5/29/2013
1
Treatment and Clinical Trials for PTCL
Julie M. Vose, M.D., M.B.A.
University of Nebraska Medical Center

5/29/2013
2
2013 Estimated US New Cancer CasesFemales
Prostate 238,590 27.9%
Lung & bronchus 118,080 13.8%
Urinary bladder 54,610 6.4%
Colon 50,090 5.8%
Melanoma of skin 45,060 5.3%
Kidney & renal pelvis 40,430 4.7%
NonNon--Hodgkin 37,600 4.4%Hodgkin 37,600 4.4%
lymphomalymphoma
Oral cavity & pharynx 29,620 3.5%
Leukemia 27,880 3.3%
Pancreas 22,740 2.7%
ALL SITES 854,790 100%
Males
Breast 232,340 28.8%
Lung & bronchus 110,110 13.7%
Colon 52,390 6.5%
Uterine corpus 49,560 6.1%
Thyroid 45,310 5.6%
NonNon--Hodgkin Hodgkin 32,140 4.0%32,140 4.0%
lymphomalymphoma
Kidney & renal pelvis 24,720 3.1%
Melanoma of skin 31,630 3.9%
Pancreas 22,480 2.8%
Ovary 22,240 2.8%
ALL SITES805,500 100%
American Cancer Society. Cancer Facts & Figures 2013. Available online athttp://www.cancer.org/research/cancerfactsfigures/cancerfactsfigures/cancer-facts-figures-2013
Most Common Subtypes of NHL
Percentages are of all NHLs.MALT=mucosa-associated lymphoid tissue; NK=natural killer.
Lichtman MA. Williams Hematology. 7th ed. New York, NY: McGraw Hill. 2006;1408.
T and NK cell(12%)
Other subtypes(9%)
Burkitt(2.5%)
Mantle cell(6%)
Diffuse large B cell
(DLBCL)(30%)
Follicular(25%)
Small lymphocytic(7%)
MALT-type marginal-zone B cell (7.5%)
Nodal-type marginal-zone
B cell (<2%)
Lymphoplasmacytic (<2%)

5/29/2013
3
T-cell Lymphomas
• T-cell lymphomas account for ~15% of all NHLs
• Less common than B-cell lymphomas
• Can be indolent or clinically aggressive
• Similarly heterogeneous in their clinical presentation, features, and prognosis
• Challenges in treatment:
– Increasing number of subtypes, making it very difficult to understand and to keep track of these entities
– Each entity is encountered infrequently
Gisselbrecht C, et al. Blood. 1998;92:76-82; Armitage J, et al. J Clin Oncol. 1998;16:2780–2795.
Classification of Peripheral T-cell Lymphoma (PTCL)
• PTCL is a heterogeneous group of aggressive mature
T-/NK-cell lymphomas1
– PTCL does not refer to anatomic sites, but rather to the involvement of more mature (post-
thymic) T cells vs pre-thymic or immature T cells1
Adapted from Swerdlow SH, et al. WHO Classification of Tumours of Haematopoietic and Lymphoid Tissues. 2008.
Non-Hodgkin’’’’s Lymphoma
Precursor Lymphoid Neoplasms
T-Lymphoblastic Leukemia/Lymphoma
Cutaneous
Primary Cutaneous CD30+ T-cell Disorders
Mycosis Fungoides(MF)
T-/NK-cell NeoplasmsB-cell Neoplasms
Extranodal
NK/TCL Nasal Type
Adult T-cell Leukemia/Lymphoma
T-cell Large Granular Lymphocytic Leukemia
Subcutaneous Panniculitis-like TCL
Leukemic
Enteropathy-associated TCL
Hepatosplenic TCL
Aggressive NK-Cell Leukemia
T-cell ProlymphocyticLeukemia
TransformedMF
Mature T-/NK-cell Neoplasms
Primary Cutaneous Gamma/Delta TCL
Sézary Syndrome
Peripheral TCL-NOS
Nodal
AngioimmunoblasticTCL
Anaplastic Large Cell Lymphoma (ALK +/-)
Aggressive Indolent

5/29/2013
4
Copyright © American Society of Clinical Oncology
International T-Cell Lymphoma Project, Vose, et al: J Clin Oncol; 26:4124-4130 2008
Fig 1. Distribution of 1,314 cases by consensus diagnosis
PTCL Incidence
• PTCL represents 10-15% of new NHL cases per year1
• By some estimates, the incidence of PTCL is growing significantly2,3
• The growth in PTCL incidence may be driven by an aging population3
1. O’Leary HM, Savage KJ. Curr Oncol Rep. 2008;10:404-411.2. Abouyabis AN, et al. Leuk Lymphoma. 2008:49:2099-2107. 3. Morton LM, et al. Blood. 2006;107:265-276.
0.1
10
<15 15-24 25-34 35-44 45-54 55-64 65-74 >75
Ages (years)
Rate
per
100,0
00 p
ers
on y
ears
0
0.1
0.2
0.3
0.4
0.5
0.6
0.7
0.8
0.9
1
Year of diagnosis
Age a
dju
sted incid
ence rate
Peripheral T-cell lymphoma, combined
AITL PTCL, NOS
Extranodal, nasal ALCL
White Male White Female
Black Male Black Female
Asian Male Asian Female
1

5/29/2013
5
Staging of PTCL
Ann Arbor Classification System
[1] Rodriguez-Abreu D, et al. Hematol Oncol. 2008;26:8–20. [2] Carbone PP, et al. Cancer Res. 1971;31:1860–1861.
Ann Arbor Classification for Hodgkin’s and non-Hodgkin’s Lymphoma[2]
Principal stages
Stage I Cancer is located in a single region, (eg, 1 lymph node and the surrounding area)
Stage II Cancer is located in 2 separate regions but confined to 1 side of the diaphragm
Stage III Cancer has spread to both sides of the diaphragm, including 1 organ or area near the lymph nodes or the spleen
Stage IV Diffuse or disseminated involvement of 1 or more extralymphatic organs, including any involvement of the liver, bone marrow, or nodular involvement of the lungs
Modifiers
A Absence of constitutional (B-type) symptoms
B Presence of B-type symptoms
E Extranodal disease
PTCL most commonly presents with advanced, systemic symptoms (stage III-IV).[1]
Prognostic Indices for PTCL
• The IPI for NHL is commonly
utilized in PTCL1
1. International Non-Hodgkin's Lymphoma Prognostic Factors Project. N Eng J Med. 1993;329:987-994. 2. Gallamini A, et al. Blood. 2004;103:2474-2479.
International Prognostic Index (IPI)
All patients • Age (≤60 years vs >60 years)• Serum LDH (≤1 x ULN vs >1x ULN)
• Performance status (0 or 1 vs 2–4)
• Stage I or II [(localized) vs III or IV (advanced)]
• Extranodal involvement (≤1 site vs >1
site)
Age-adjusted
index (age ≤60 years)
• Stage (I or II vs III or IV)
• Serum LDH (≤1 x ULN vs >1x ULN)• Performance status (0 or 1 vs 2–4)
� The Prognostic Index for
PTCL (PIT) is also in use2
Prognostic Risk Factors for PTCL (PIT)
• Age >60 years
• ECOG Performance Status (score ≥2)• Elevated LDH
• Bone marrow involvement
The IPI is calculated based on the sum of the number of risk factors present at diagnosis.
0-1 Low2 Low/intermediate3 High/intermediate4-5 High
The PIT is based on number of risk factors present at diagnosis
Group 1 0 risk factor (62% 5-yr OS)Group 2 1 risk factor (53% 5-yr OS)Group 3 2 risk factors (33% 5-yr OS)Group 4 3-4 risk factors (18% 5-yr OS)
5/29/2013
6
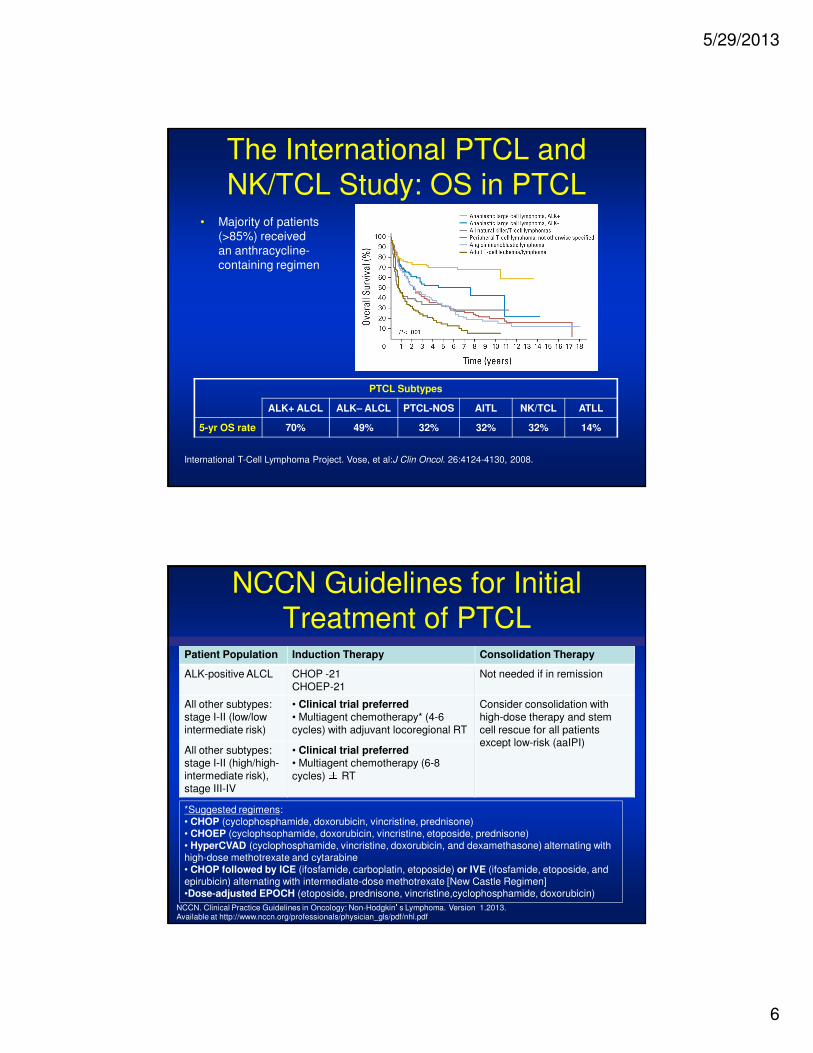
The International PTCL and
NK/TCL Study: OS in PTCL• Majority of patients
(>85%) received an anthracycline-containing regimen
International T-Cell Lymphoma Project. Vose, et al:J Clin Oncol. 26:4124-4130, 2008.
PTCL Subtypes
ALK+ ALCL ALK– ALCL PTCL-NOS AITL NK/TCL ATLL
5-yr OS rate 70% 49% 32% 32% 32% 14%
NCCN Guidelines for Initial
Treatment of PTCLPatient Population Induction Therapy Consolidation Therapy
ALK-positive ALCL CHOP -21CHOEP-21
Not needed if in remission
All other subtypes: stage I-II (low/low intermediate risk)
• Clinical trial preferred• Multiagent chemotherapy* (4-6 cycles) with adjuvant locoregional RT
Consider consolidation with high-dose therapy and stem cell rescue for all patients except low-risk (aaIPI)
All other subtypes: stage I-II (high/high-intermediate risk), stage III-IV
• Clinical trial preferred• Multiagent chemotherapy (6-8
cycles) ± RT
*Suggested regimens: • CHOP (cyclophosphamide, doxorubicin, vincristine, prednisone)• CHOEP (cyclophsophamide, doxorubicin, vincristine, etoposide, prednisone)• HyperCVAD (cyclophosphamide, vincristine, doxorubicin, and dexamethasone) alternating with high-dose methotrexate and cytarabine• CHOP followed by ICE (ifosfamide, carboplatin, etoposide) or IVE (ifosfamide, etoposide, and epirubicin) alternating with intermediate-dose methotrexate [New Castle Regimen]•Dose-adjusted EPOCH (etoposide, prednisone, vincristine,cyclophosphamide, doxorubicin)
NCCN. Clinical Practice Guidelines in Oncology: Non-Hodgkin’s Lymphoma. Version 1.2013. Available at http://www.nccn.org/professionals/physician_gls/pdf/nhl.pdf

5/29/2013
7
Adding Etoposide to CHOP: German
Prospective High-Grade NHL Studies
PTCL Subtype n
ALCL, ALK+ 78
ALCL, ALK- 113
PTCL-NOS 70
AITL 28
Other 31
Total 320
EFS, aged
< 60 yrs
Benefit
EFS, other
subtypes
No Benefit
Schmitz N, et al. Blood. 2010;116:3418-3425.Mos
Non-etoposide (n = 29)
1100 10 20 30 40 60 70 80 90 10050
100
80
60
20
0
40
Pa
tie
nts
(%
) Etoposide (n = 69)
P = .057
Mos
1100 10 20 30 40 60 70 80 90 10050
100
80
60
20
0
40
Pa
tie
nts
(%
)
P = .003
6 x CHOP-14/21 (n = 41)
6 x CHOEP-14/21 (n = 42)
Mos
1100 10 20 30 40 60 70 80 90 10050
100
80
60
20
0
40
Pa
tie
nts
(%
)
P = .012
Non-etoposide (n = 12)
Etoposide (n = 34)
EFS,
ALCL, ALK+
Benefit
German Prospective Trial of
ASCT in First Remission
• PIT group 1: 0 risk factors
• PIT group 2: 1 risk factor
• PIT group 3: 2 risk factors
• PIT group 4: 3-4 risk factors
• N = 83 untreated patients
• CHOP x 4-6
• If ≥ PR, dexaBEAM or ESHAP
• dexaBEAM or ESHAP ± TBI, ASCT
• Median follow-up: 33 mos
Reimer P, et al. J Clin Oncol. 2009;27:106-113.
Nontransplanted patients did poorly
Poor-risk patients did poorlyPro
po
rtio
n A
ch
ievin
g O
S
1.0
0.8
0.6
0.4
0.2
00 12 24 36 48 60
Mos
P < .001
Transplanted (n = 55)
Nontransplanted (n = 28)
Pro
po
rtio
n A
ch
ievin
g O
S
1.0
0.8
0.6
0.4
0.2
00 12 24 36 48 60
Mos
P = .0414
PIT group 2 (n = 34)
PIT group 4 (n = 3)PIT group 3
(n = 21)
PIT group 1 (n = 25)

5/29/2013
8
NCCN Treatment Guidelines for
Relapsed/Refractory PTCL• NCCN recommends clinical trials for treatment of relapsed or refractory PTCL
• Patients may be evaluated as candidates for high-dose therapy
• Patients who are not candidates for high-dose therapy may receive experimental treatments
NCCN. Clinical Practice Guidelines in Oncology: Non-Hodgkin’s Lymphoma. Version 1.2013. Available at: http://www.nccn.org/professionals/physician_gls/pdf/nhl.pdf
Suggested Treatment Regimens for Second-line Therapy of PTCL (in alphabetical order)1
Candidates for Transplant Non-candidates for Transplant
Clinical trial preferred
Brentuximab vedotin (systemic ALCL only)
DHAP (dexamethasone, cisplatin, cytarabine)
ESHAP (etoposide, methylprednisolone, cytarabine, cisplatin)
Dose-Adjusted EPOCH (etoposide, prednisone, vincristine,
cyclophosphamide, doxorubicin)
GDP (gemcitabine, dexamethasone, cisplatin)
GemOx (gemcitabine, oxaliplatin)
ICE (ifosfamide, carboplatin, etoposide)
MINE (mesna, ifosfamide, mitoxantrone, etoposide)
Pralatrexate (category 2B)
Romidepsin
Clinical trial preferred
Alemtuzumab
Bortezomib
Brentuximab vedotin (systemic ALCL only)
Cyclosporine (AITL only)
Dose-adjusted EPOCH (etoposide,
prednisone, vincristine, cyclophosphamide,
doxorubicin)
Gemcitabine
Pralatrexate
Radiation therapy
Romidepsin
Relapsed/Refractory PTCL: FDA-Approved Agents
Agent Regimen N ORR, % CR, % Response Duration, Mos
Romidepsin[1]
(NCI)14 mg/m2 weekly x 3
every 28 days47 38 18 8.9
Romidepsin[2]
(pivotal)14 mg/m2 weekly x 3
every 28 days131 25 14 17.0
Pralatrexate[3]
(pivotal)
30 mg/m2 weekly x 6 of 7 wks
111 29 11 10.1
Brentuximab vedotin[4] (ALCL)
1.8 mg/kg every 21 days 58 86 57 12.6
1. Piekarz RL, et al. Blood. 2011;117:5827-5834. 2. Coiffier B, et al. J Clin Oncol. 2012;30:631-636.
3. O’Connor OA, et al. J Clin Oncol. 2011;29:1182-1189. 4. Pro B, et al. J Clin Oncol. 2012;30:2190-2196.

5/29/2013
9
Pralatrexate Mechanism of Action
Pralatrexate is a selective antifolate designed to accumulate preferentially in cancer cells
Entry
Pralatrexate selectively enters cells expressing RFC-1, a protein that is overexpressed on cancer cells compared to normal cells
Accumulation
Once inside cancer cells, pralatrexate is efficiently polyglutamylated, which leads to high intracellular drug retention
Inhibition
Acting on the folate pathway, pralatrexate interferes with DNA synthesis and triggers cancer cell death
Sirotnak et al. Cancer Chemother Pharmacol. 1998;42(4):313-318. Krug LM, et al. Clin Cancer Res. 2000;6:3493-3498.Wang ES, et al. Leuk Lymphoma. 2003;44:1027-1035.
PROPEL: A Multi-center Phase 2 Open-label Study
of Pralatrexate with Vitamin B12 and Folic Acid
Supplementation in Patients with Relapsed or Refractory
Peripheral T-cell Lymphoma (PTCL)
1 2 3 4 5 8 9 10 11 12 13 15 16 17 18 19 20 22 236 24 25 26 2714 217 28
Cycle 1 Cycle 2 Cycle 3 Cycle 4
Response
assessment
Response
assessment
Weeks
Out-patient dosing schedule
• PDX 30 mg/m2 once weekly IV push ×××× 6 weeks
• Vitamin B12 1 mg IM q 8 - 10 weeks
• Folic acid 1.0 - 1.25 mg PO QD
Treat until progression or intolerance

5/29/2013
10
Depsipeptide in Rel/Ref PTCL: Treatment Schedule
Week 4Week 2 Week 3
1 22158 1
Week 1
Cycle 1
Week 1
Cycle 2
Schedule:
4-hour infusion 14 mg/m2 on days 1, 8, & 15 every 28 days
Romidepsin Romidepsin Romidepsin Romidepsin
Brentuximab Vedotin Mechanism of Action
Brentuximab vedotin (SGN-35) ADC
monomethyl auristatin E (MMAE), potent antitubulin agent
protease-cleavable linker
anti-CD30 monoclonal antibody
ADC binds to CD30
MMAE disruptsmicrotubule network
ADC-CD30 complex
traffics to lysosome
MMAE is released
Apoptosis
G2/M cellcycle arrest

5/29/2013
11
Targeting T-cell Lymphoma
Surface Antigens/ReceptorsCD2CD4CD25CD30Chemokine receptors….
Microenvironmental FactorsAngiogenesis
Immunomodulation
Viral Pathogens
Cellular Survival MechanismsProteasome Inhibition
HDAC inhibition
Death Receptors & Ligands
Cell Cycle Arrest
Signal Transduction Inhibition
New Agents for T-cell LymphomaNucleoside analogs/pathway
inhibitors
– Gemcitabine
– Fludarabine
– Cladribine
– Forodesine
– Clofarabine
– Nelarabine
HDAC inhibitors
– Depsipeptide
– Vorinostat
– Panabinostat
– Belinostat
Antifolate
– Pralatrexate
Proteasome inhibitors
– Bortezomib
– Carfilzomib
Immunomodulators
– Lenalidomide
Monoclonal antibodies
– Alemtuzumab
– Anti-CD30
– Zanolimumab
– Siplizumab
Immunotoxins /immunoconjugates
– Denileukin difitox
– SGN-35
– Daclizumab
Syk inhibitors
– Fostamatinib disodium
Kinase Inhibitors
-- PDGFRβ inhibitor
-- TKI/Src inhibitors
-- JAK2-Stat inhibitors

5/29/2013
12
Alisertib: Investigational
Aurora A Kinase Inhibitor• Results in mitotic defects
– Abnormal spindles
– Unseparated centrosomes
– Delayed mitotic progression
• Apoptosis or senescence
Untreated Treated Treated
NCI
O
F
N
N
HN
O
OH
O
Anti-CCR4 Antibody: KW-0761
• Defucosylated humanized IgG1 MoAb
• Targets CCR4
– Shown to be overexpressed on tumor cells
• 88% of patients with ATLL
• 38% of patients with PTCL
– CCR4 expression associated with unfavorable prognosis in both diseases
• Phase II studies under way in relapsed/refractory ATLL and PTCL patients

5/29/2013
13
Lenalidomide in Relapsed/Refractory Lenalidomide in Relapsed/Refractory
Aggressive NHL: Aggressive NHL: ResultsResults
Histology n ORR PFS (mo.)
DLBCL 108 28% 2.3
Mantle 57 42% 5.7
Follicular (grade 3) 19 42% 6.3
T-cell 33 45% 4.6
Witzig et al. Blood 2009; 114: ASH Abstract #1676
ORR in patients with prior SCT = 37% (27/73)
Gr 3-4 neutropenia 41%, thrombocytopenia 19%
Gene Expression Profiles (GEP)
in PTCL-nos• PTCL-nos can be separated into 3 subgroups on the
basis of gene expression profiles (U1, U2, and U3)
• It has not been established whether these subgroups correlate with clinical outcome
– Preliminary findings indicate that PTCL-U1 tended to
have a worse outcome than PTCL-U2 or -U3
1. Ballester B, et al. Oncogene. 2006;25:1560-1570.
Molecular subgroup Gene expression signature
U1 Included genes involved with poor outcome in other tumors (CCND2)
U2 Over-expression of genes involved in T-cell activation
and apoptosis (NFKB1, BCL-2)
U3 Over-expression of genes involved in IFN/JAK/STAT pathway

5/29/2013
14
Future for PTCL Therapy
• Standard CHOP – does not work well
• Need to identify novel agents or combinations
• GEP may help us identify specific targets
• Induction therapy, consolidation , and/or maintenance therapy may be needed
• Consider PSCT for selected patients
• Novel therapies added to PSCT also an option
• Clinical trials essential for all PTCL patients

5/29/2013
15