Embed Size (px)
Citation preview

istorically, diamonds in the pink-to-redcolor range have been among the mosthighly prized. In nature, most pink-to-red,
brown, and purple colors (and combinations there-of) in diamond have been attributed to the develop-ment of defect centers caused by shear stress andplastic deformation. These defects, which gemolo-gists describe as colored “graining,” were formedafter the growth of the gem was complete andeither prior to or during the diamond’s ascent tothe earth’s surface (see, e.g., Orlov, 1977; Collins,1982; Fritsch, 1998; Moses et al., 2002). Many ofthe world’s most famous diamonds owe their colorto this mechanism, including such notable stonesas the 0.95 ct Hancock Red, the 5.11 ct MoussaieffRed, the 59.60 ct Steinmetz Pink, and the 128.48 ctStar of the South.
As a result of the prestige and value associatedwith these colors, attempts have been made sinceantiquity to impart a pink-to-red coloration to dia-monds. In the earliest times, topical coatings wereused to achieve this goal; however, such coatingswere not stable and could be readily removed. The
first treatment to induce a more stable hue in thisrange was introduced in the 1950s, when irradiationwith high-energy electrons began to be appliedexperimentally to modify the color of natural dia-monds. On rare occasions, a brownish pink to redhue would result when certain diamonds were irra-diated in this manner and subsequently annealed(Crowningshield, 1959; Crowningshield andReinitz, 1995). It was only significantly later, duringthe mid- to late 1980s, that scientists realized thestones that changed color in this manner were typeIb diamonds, which contain single substitutionalnitrogen impurities (Fritsch, 1998; Shigley et al.,2004). More recently, high pressure/high tempera-ture (HPHT) annealing of type IIa diamonds hasbeen shown to change the color of some brown dia-monds to hues in the purplish pink to brown-pinkrange (Hall and Moses, 2000).
6 LUCENT TREATED-COLOR DIAMONDS GEMS & GEMOLOGY SPRING 2005
H
TREATED-COLOR PINK-TO-REDDIAMONDS FROM
LUCENT DIAMONDS INC. Wuyi Wang, Christopher P. Smith, Matthew S. Hall,
Christopher M. Breeding, and Thomas M. Moses
See end of article for About the Authors and Acknowledgments.GEMS & GEMOLOGY, Vol. 41, No. 1, pp. 6–19.© 2005 Gemological Institute of America
Lucent Diamonds has developed a new treatment process for natural type Ia diamonds that pro-duces colors ranging from pink-purple through red to orangy brown, using a multi-step processthat involves HPHT annealing, irradiation, and low-pressure annealing at relatively lower temper-atures. Those stones that achieve a predominant pink-to-red or purple color are marketed as“Imperial Red Diamonds.” Gemological properties and characteristic spectra are presented for 41diamonds, representing the range of colors produced thus far. These treated-color natural dia-monds can be readily identified by internal graphitization and surface etching seen with magnifi-cation, distinctive color zoning, and reactions to long- and short-wave UV radiation. The color iscaused primarily by the absorption of the (N-V)- center, with further influence from the (N-V)0,H3, H4, and N3 centers. Other characteristic infrared and UV-visible absorption features includethe H1a, H1b, H1c, 6170 cm-1, and, frequently, 594 nm bands. This type of defect combinationis not known in naturally colored diamonds.
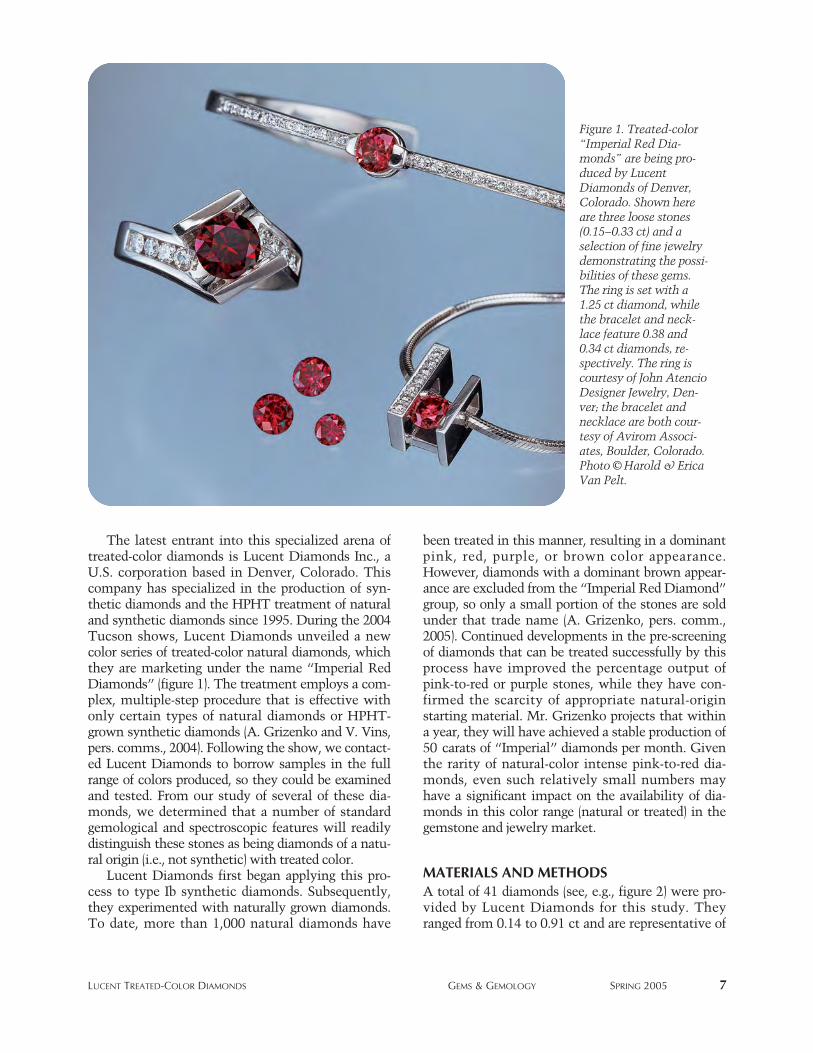
The latest entrant into this specialized arena oftreated-color diamonds is Lucent Diamonds Inc., aU.S. corporation based in Denver, Colorado. Thiscompany has specialized in the production of syn-thetic diamonds and the HPHT treatment of naturaland synthetic diamonds since 1995. During the 2004Tucson shows, Lucent Diamonds unveiled a newcolor series of treated-color natural diamonds, whichthey are marketing under the name “Imperial RedDiamonds” (figure 1). The treatment employs a com-plex, multiple-step procedure that is effective withonly certain types of natural diamonds or HPHT-grown synthetic diamonds (A. Grizenko and V. Vins,pers. comms., 2004). Following the show, we contact-ed Lucent Diamonds to borrow samples in the fullrange of colors produced, so they could be examinedand tested. From our study of several of these dia-monds, we determined that a number of standardgemological and spectroscopic features will readilydistinguish these stones as being diamonds of a natu-ral origin (i.e., not synthetic) with treated color.
Lucent Diamonds first began applying this pro-cess to type Ib synthetic diamonds. Subsequently,they experimented with naturally grown diamonds.To date, more than 1,000 natural diamonds have
been treated in this manner, resulting in a dominantpink, red, purple, or brown color appearance.However, diamonds with a dominant brown appear-ance are excluded from the “Imperial Red Diamond”group, so only a small portion of the stones are soldunder that trade name (A. Grizenko, pers. comm.,2005). Continued developments in the pre-screeningof diamonds that can be treated successfully by thisprocess have improved the percentage output ofpink-to-red or purple stones, while they have con-firmed the scarcity of appropriate natural-originstarting material. Mr. Grizenko projects that withina year, they will have achieved a stable production of50 carats of “Imperial” diamonds per month. Giventhe rarity of natural-color intense pink-to-red dia-monds, even such relatively small numbers mayhave a significant impact on the availability of dia-monds in this color range (natural or treated) in thegemstone and jewelry market.
MATERIALS AND METHODS A total of 41 diamonds (see, e.g., figure 2) were pro-vided by Lucent Diamonds for this study. Theyranged from 0.14 to 0.91 ct and are representative of
LUCENT TREATED-COLOR DIAMONDS GEMS & GEMOLOGY SPRING 2005 7
Figure 1. Treated-color“Imperial Red Dia-monds” are being pro-duced by LucentDiamonds of Denver,Colorado. Shown hereare three loose stones(0.15–0.33 ct) and aselection of fine jewelrydemonstrating the possi-bilities of these gems.The ring is set with a1.25 ct diamond, whilethe bracelet and neck-lace feature 0.38 and0.34 ct diamonds, re-spectively. The ring iscourtesy of John AtencioDesigner Jewelry, Den-ver; the bracelet andnecklace are both cour-tesy of Avirom Associ-ates, Boulder, Colorado.Photo © Harold & EricaVan Pelt.
the color range that is currently being produced bythis process (A. Grizenko, pers. comm., 2005).
Color grades were determined by experienced col-ored-diamond color graders using the standard condi-tions and methodology of GIA’s color grading systemfor colored diamonds (King et al., 1994). Internal fea-tures were observed with a standard binocular micro-scope using a variety of lighting techniques.Reactions to ultraviolet radiation were checked in adarkened room with a conventional four-watt combi-nation long-wave (365 nm) and short-wave (254 nm)lamp. All of the stones were also examined using aDiamond Trading Company (DTC) DiamondViewdeep-ultraviolet (<230 nm) luminescence imagingsystem (Welbourn et al., 1996). A handheld spectro-scope was used to view absorption features in the vis-ible range, with the samples at both room tempera-ture and low temperature.
All the samples were also analyzed using severalother spectroscopic techniques. Absorption spectrain the ultraviolet to visible (UV-Vis) range wererecorded with a Thermo-Spectronic Unicam UV500spectrophotometer over the range 250–850 nm with
a sampling interval of 0.1 nm. The samples weremounted in a cryogenic cell and cooled using liquidnitrogen. Infrared absorption spectra were recordedin the mid-infrared (6000–400 cm-1, 1 cm-1 resolu-tion) and near-infrared (up to 11000 cm-1, 4 cm-1
resolution) ranges at room temperature with aThermo-Nicolet Nexus 670 Fourier-transforminfrared (FTIR) spectrometer, equipped with KBrand quartz beam splitters. In collecting absorptionspectra in the near-infrared range, the lower energyside was extended to 2700 cm-1 to cover the three-phonon region of diamond absorption, which—likethe two-phonon region absorption in the middle-infrared region—can be employed to calibrate theabsorption intensity of other defects. A 6¥ beamcondenser focused the incident beam on the sam-ple, and a total of 1,024 scans (per spectrum) werecollected to improve the signal-to-noise ratio.
Low-temperature photoluminescence (PL) spectrawere recorded using a Renishaw 1000 Ramanmicrospectrometer with an Argon-ion laser at twodifferent laser excitations: 488.0 nm (for the range490–850 nm) and 514.5 nm (for the range 517–850nm). PL spectra of 15 stones were also collected usinga Diode laser (780 nm) for the range 782–1000 nm.The samples were cooled by direct immersion in liq-uid nitrogen. Up to three scans were accumulated insome cases to achieve a better signal-to-noise ratio.
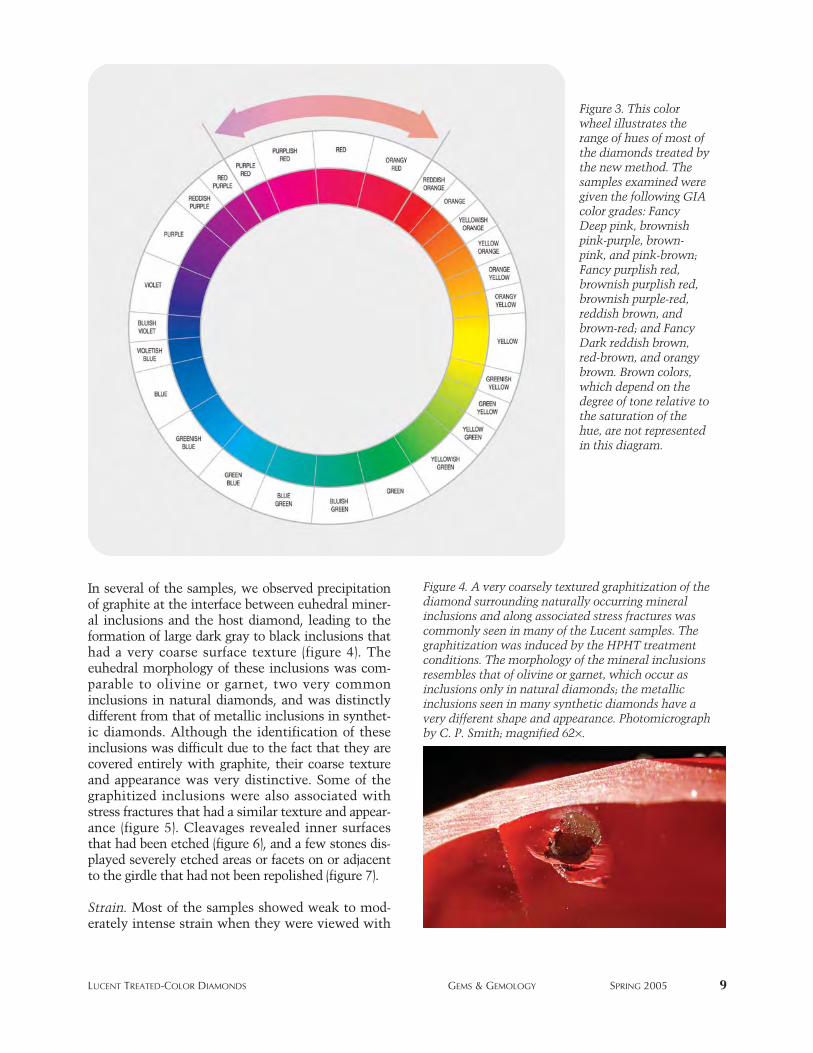
RESULTSVisual Appearance. All the samples had an obviouscoloration that ranged from pink/red to purple andbrown, as well as combinations thereof (again, seefigure 2). In the face-up position, all samplesappeared homogeneously colored; however, whenviewed face-down, a few samples revealed subtle tomore distinct uneven coloration (see below). Whencolor graded, the majority of the samples fell withina relatively small area of color space. These are inthe GIA hue ranges of purple-red to orangy red (fig-ure 3), as well as in a rather confined area of toneand saturation.
Microscopic Characteristics. Internal and SurfaceFeatures. A broad range of internal characteristicswere noted, including predominant octahedralgrowth sectors and color zoning, as well as a varietyof natural mineral inclusions. Although these indi-cated that the diamonds had grown naturally (i.e.,were not synthetic), they also showed evidence ofstrong alterations due to treatment in a laboratory.
8 LUCENT TREATED-COLOR DIAMONDS GEMS & GEMOLOGY SPRING 2005
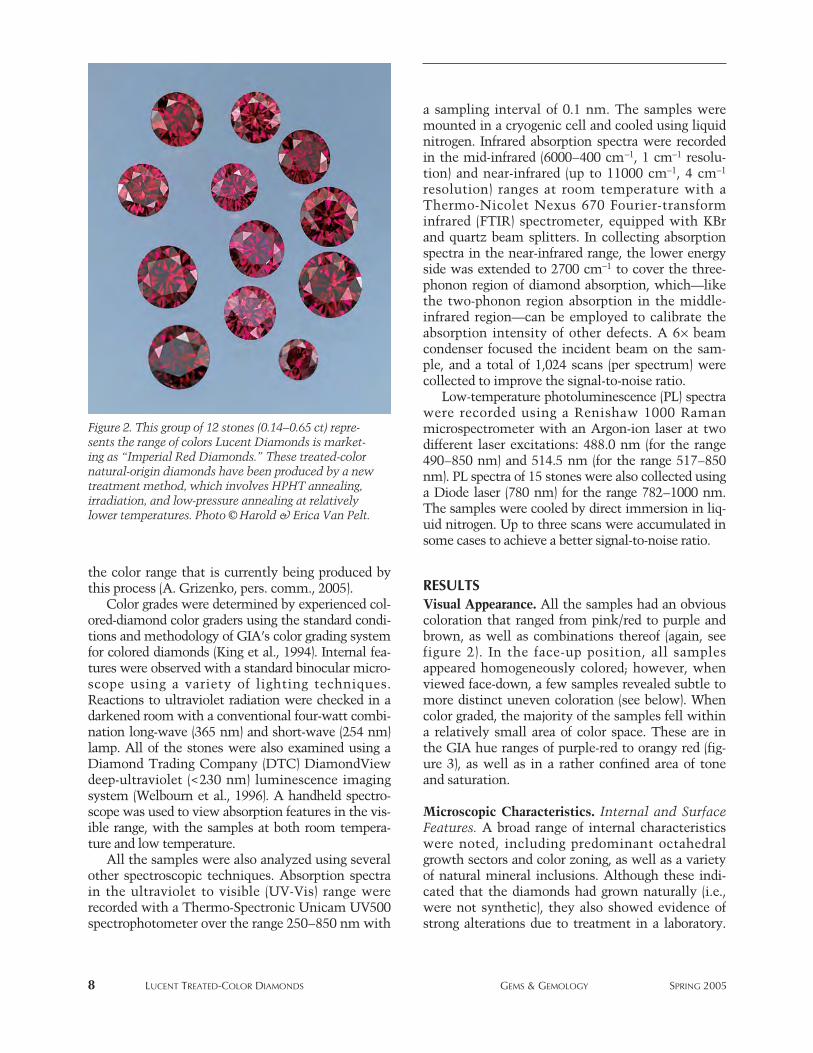
Figure 2. This group of 12 stones (0.14–0.65 ct) repre-sents the range of colors Lucent Diamonds is market-ing as “Imperial Red Diamonds.” These treated-colornatural-origin diamonds have been produced by a newtreatment method, which involves HPHT annealing,irradiation, and low-pressure annealing at relativelylower temperatures. Photo © Harold & Erica Van Pelt.
LUCENT TREATED-COLOR DIAMONDS GEMS & GEMOLOGY SPRING 2005 9
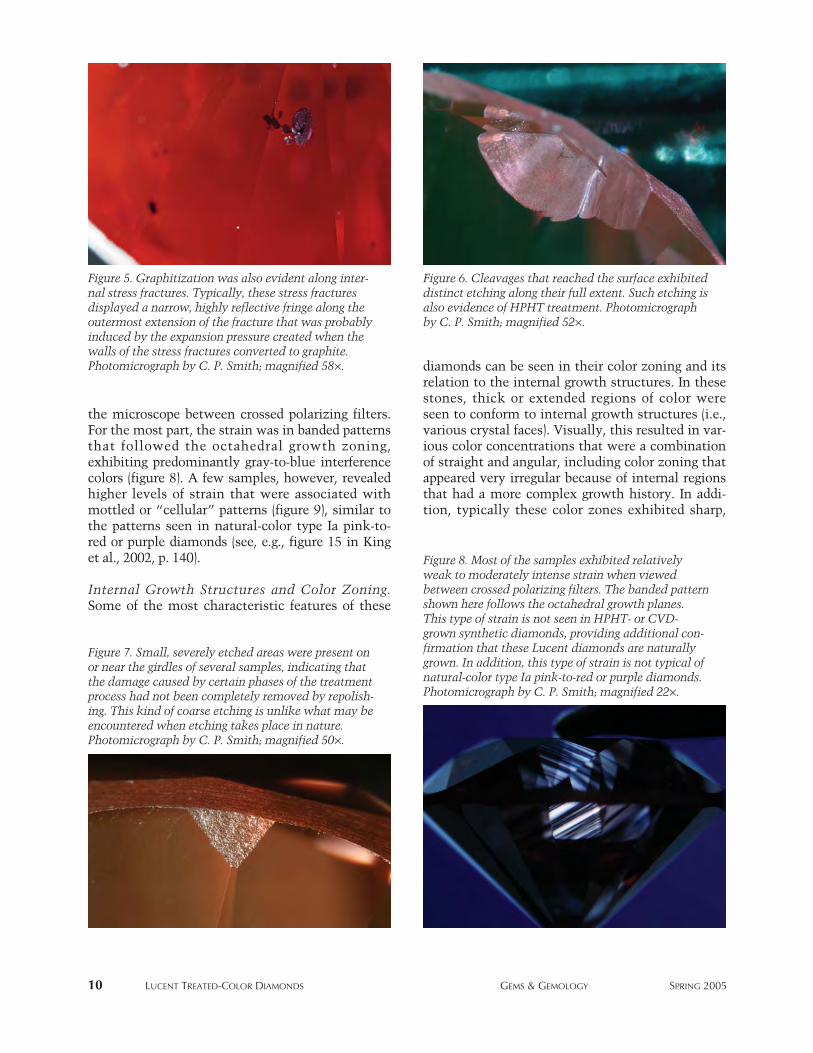
In several of the samples, we observed precipitationof graphite at the interface between euhedral miner-al inclusions and the host diamond, leading to theformation of large dark gray to black inclusions thathad a very coarse surface texture (figure 4). Theeuhedral morphology of these inclusions was com-parable to olivine or garnet, two very commoninclusions in natural diamonds, and was distinctlydifferent from that of metallic inclusions in synthet-ic diamonds. Although the identification of theseinclusions was difficult due to the fact that they arecovered entirely with graphite, their coarse textureand appearance was very distinctive. Some of thegraphitized inclusions were also associated withstress fractures that had a similar texture and appear-ance (figure 5). Cleavages revealed inner surfacesthat had been etched (figure 6), and a few stones dis-played severely etched areas or facets on or adjacentto the girdle that had not been repolished (figure 7).
Strain. Most of the samples showed weak to mod-erately intense strain when they were viewed with
Figure 3. This colorwheel illustrates therange of hues of most ofthe diamonds treated bythe new method. Thesamples examined weregiven the following GIAcolor grades: FancyDeep pink, brownishpink-purple, brown-pink, and pink-brown;Fancy purplish red,brownish purplish red,brownish purple-red,reddish brown, andbrown-red; and FancyDark reddish brown,red-brown, and orangybrown. Brown colors,which depend on thedegree of tone relative tothe saturation of thehue, are not representedin this diagram.
Figure 4. A very coarsely textured graphitization of thediamond surrounding naturally occurring mineralinclusions and along associated stress fractures wascommonly seen in many of the Lucent samples. Thegraphitization was induced by the HPHT treatmentconditions. The morphology of the mineral inclusionsresembles that of olivine or garnet, which occur asinclusions only in natural diamonds; the metallicinclusions seen in many synthetic diamonds have avery different shape and appearance. Photomicrographby C. P. Smith; magnified 62¥.
the microscope between crossed polarizing filters.For the most part, the strain was in banded patternsthat followed the octahedral growth zoning,exhibiting predominantly gray-to-blue interferencecolors (figure 8). A few samples, however, revealedhigher levels of strain that were associated withmottled or “cellular” patterns (figure 9), similar tothe patterns seen in natural-color type Ia pink-to-red or purple diamonds (see, e.g., figure 15 in Kinget al., 2002, p. 140).
Internal Growth Structures and Color Zoning.Some of the most characteristic features of these
diamonds can be seen in their color zoning and itsrelation to the internal growth structures. In thesestones, thick or extended regions of color wereseen to conform to internal growth structures (i.e.,various crystal faces). Visually, this resulted in var-ious color concentrations that were a combinationof straight and angular, including color zoning thatappeared very irregular because of internal regionsthat had a more complex growth history. In addi-tion, typically these color zones exhibited sharp,
10 LUCENT TREATED-COLOR DIAMONDS GEMS & GEMOLOGY SPRING 2005
Figure 7. Small, severely etched areas were present onor near the girdles of several samples, indicating thatthe damage caused by certain phases of the treatmentprocess had not been completely removed by repolish-ing. This kind of coarse etching is unlike what may beencountered when etching takes place in nature.Photomicrograph by C. P. Smith; magnified 50¥.
Figure 8. Most of the samples exhibited relativelyweak to moderately intense strain when viewedbetween crossed polarizing filters. The banded patternshown here follows the octahedral growth planes.This type of strain is not seen in HPHT- or CVD-grown synthetic diamonds, providing additional con-firmation that these Lucent diamonds are naturallygrown. In addition, this type of strain is not typical ofnatural-color type Ia pink-to-red or purple diamonds.Photomicrograph by C. P. Smith; magnified 22¥.
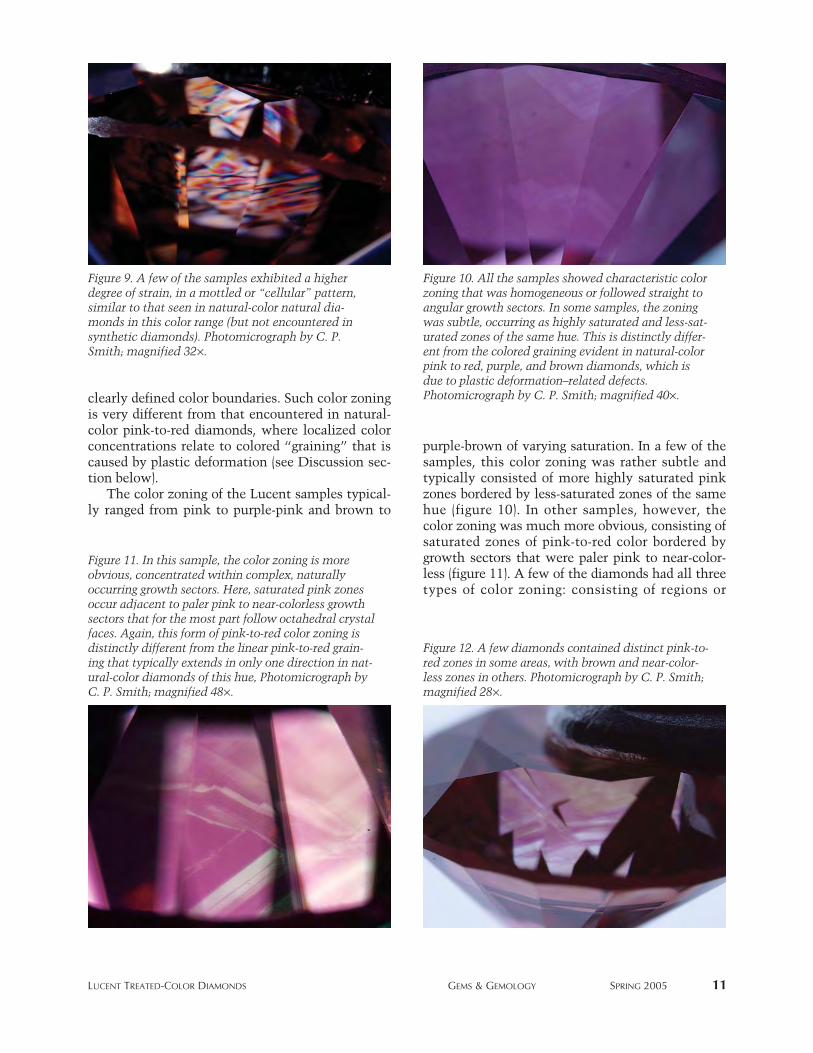
Figure 5. Graphitization was also evident along inter-nal stress fractures. Typically, these stress fracturesdisplayed a narrow, highly reflective fringe along theoutermost extension of the fracture that was probablyinduced by the expansion pressure created when thewalls of the stress fractures converted to graphite.Photomicrograph by C. P. Smith; magnified 58¥.
Figure 6. Cleavages that reached the surface exhibiteddistinct etching along their full extent. Such etching isalso evidence of HPHT treatment. Photomicrographby C. P. Smith; magnified 52¥.
clearly defined color boundaries. Such color zoningis very different from that encountered in natural-color pink-to-red diamonds, where localized colorconcentrations relate to colored “graining” that iscaused by plastic deformation (see Discussion sec-tion below).
The color zoning of the Lucent samples typical-ly ranged from pink to purple-pink and brown to
purple-brown of varying saturation. In a few of thesamples, this color zoning was rather subtle andtypically consisted of more highly saturated pinkzones bordered by less-saturated zones of the samehue (figure 10). In other samples, however, thecolor zoning was much more obvious, consisting ofsaturated zones of pink-to-red color bordered bygrowth sectors that were paler pink to near-color-less (figure 11). A few of the diamonds had all threetypes of color zoning: consisting of regions or
LUCENT TREATED-COLOR DIAMONDS GEMS & GEMOLOGY SPRING 2005 11
Figure 12. A few diamonds contained distinct pink-to-red zones in some areas, with brown and near-color-less zones in others. Photomicrograph by C. P. Smith;magnified 28¥.
Figure 11. In this sample, the color zoning is moreobvious, concentrated within complex, naturallyoccurring growth sectors. Here, saturated pink zonesoccur adjacent to paler pink to near-colorless growthsectors that for the most part follow octahedral crystalfaces. Again, this form of pink-to-red color zoning isdistinctly different from the linear pink-to-red grain-ing that typically extends in only one direction in nat-ural-color diamonds of this hue, Photomicrograph byC. P. Smith; magnified 48¥.
Figure 9. A few of the samples exhibited a higherdegree of strain, in a mottled or “cellular” pattern,similar to that seen in natural-color natural dia-monds in this color range (but not encountered insynthetic diamonds). Photomicrograph by C. P.Smith; magnified 32¥.
Figure 10. All the samples showed characteristic colorzoning that was homogeneous or followed straight toangular growth sectors. In some samples, the zoningwas subtle, occurring as highly saturated and less-sat-urated zones of the same hue. This is distinctly differ-ent from the colored graining evident in natural-colorpink to red, purple, and brown diamonds, which isdue to plastic deformation–related defects.Photomicrograph by C. P. Smith; magnified 40¥.
growth sectors that were saturated pink to purple-pink, brown to purple-brown, and pale pink tonear-colorless (figure 12).
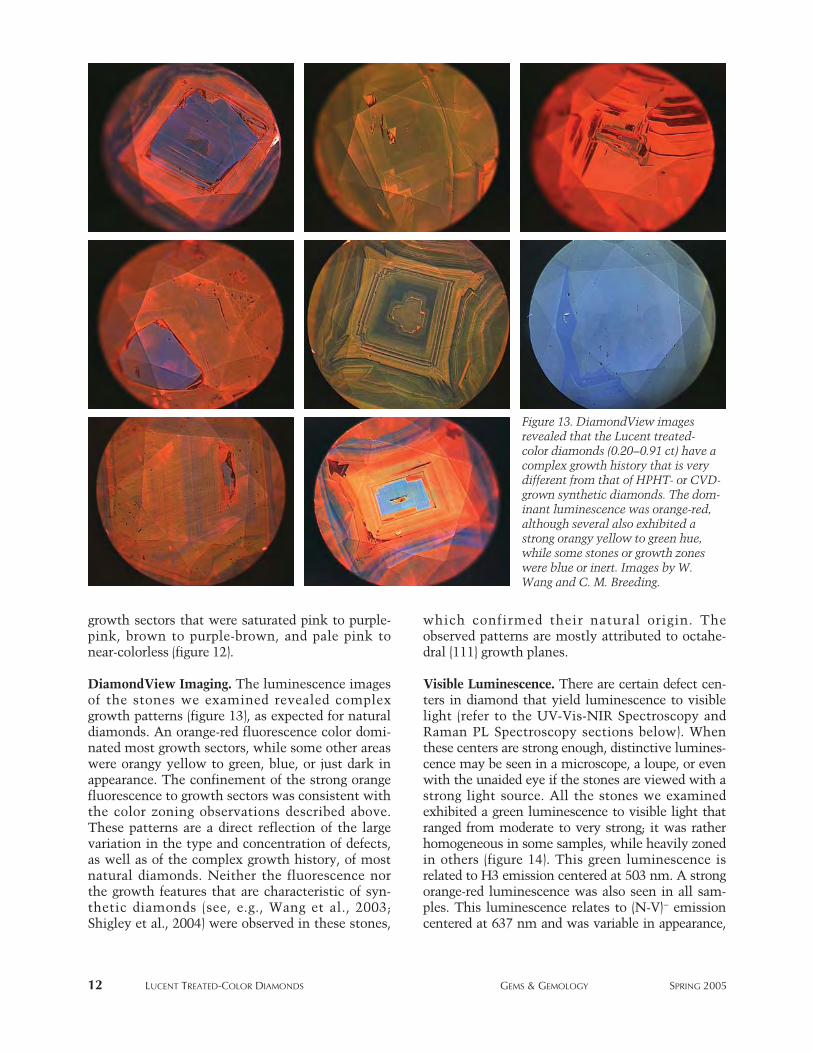
DiamondView Imaging. The luminescence imagesof the stones we examined revealed complexgrowth patterns (figure 13), as expected for naturaldiamonds. An orange-red fluorescence color domi-nated most growth sectors, while some other areaswere orangy yellow to green, blue, or just dark inappearance. The confinement of the strong orangefluorescence to growth sectors was consistent withthe color zoning observations described above.These patterns are a direct reflection of the largevariation in the type and concentration of defects,as well as of the complex growth history, of mostnatural diamonds. Neither the fluorescence northe growth features that are characteristic of syn-thetic diamonds (see, e.g., Wang et al., 2003;Shigley et al., 2004) were observed in these stones,
which confirmed their natural origin. Theobserved patterns are mostly attributed to octahe-dral {111} growth planes.
Visible Luminescence. There are certain defect cen-ters in diamond that yield luminescence to visiblelight (refer to the UV-Vis-NIR Spectroscopy andRaman PL Spectroscopy sections below). Whenthese centers are strong enough, distinctive lumines-cence may be seen in a microscope, a loupe, or evenwith the unaided eye if the stones are viewed with astrong light source. All the stones we examinedexhibited a green luminescence to visible light thatranged from moderate to very strong; it was ratherhomogeneous in some samples, while heavily zonedin others (figure 14). This green luminescence isrelated to H3 emission centered at 503 nm. A strongorange-red luminescence was also seen in all sam-ples. This luminescence relates to (N-V)- emissioncentered at 637 nm and was variable in appearance,
12 LUCENT TREATED-COLOR DIAMONDS GEMS & GEMOLOGY SPRING 2005
Figure 13. DiamondView imagesrevealed that the Lucent treated-color diamonds (0.20–0.91 ct) have acomplex growth history that is verydifferent from that of HPHT- or CVD-grown synthetic diamonds. The dom-inant luminescence was orange-red,although several also exhibited astrong orangy yellow to green hue,while some stones or growth zoneswere blue or inert. Images by W.Wang and C. M. Breeding.
ranging from homogeneous to an alignment withthe internal growth structures. In addition, a fewsamples also displayed zones of yellow lumines-cence attributed to (N-V)0 emission centered at 575nm. When all three luminescence colors were pre-sent in the same stone, they made for a very colorfulimage of the internal growth structures (figure 15),which we had not encountered previously.
Fluorescence. All the samples displayed a distinc-tive, moderate-to-strong, very chalky fluorescencereaction when exposed to either long- or short-waveUV radiation. In general, these diamonds revealedcombinations of yellow, green, and orange fluores-cence on exposure to long-wave UV, although acouple of samples also exhibited blue fluorescence.With close inspection, zoning (often subtle) could beseen between the different colors (figure 16). Toshort-wave UV, these diamonds displayed a ratherconsistent moderate-to-strong orange and yellowfluorescence. In most samples, the orange fluores-cence dominated, and the yellow could be seen inonly certain areas, such as near the culet (figure 17).No phosphorescence was evident in any of the sam-ples following exposure to long- or short-wave UV.
UV-Vis-NIR Spectroscopy. Overall, of the 41stones included in this study, most revealed simi-lar absorption features in the ultraviolet to visibleand near-infrared regions of the spectrum,
although certain variations were noted (figure 18).The most dominant series of bands includedstrong absorptions at 415 nm (N3), 503 nm (H3),575 nm (N-V)0, and 637 nm (N-V)-, which wereevident in all the samples. Of these, the absorp-tion at 637 nm was consistently the most intense.A weak absorption at 496 nm (H4) was recorded
LUCENT TREATED-COLOR DIAMONDS GEMS & GEMOLOGY SPRING 2005 13
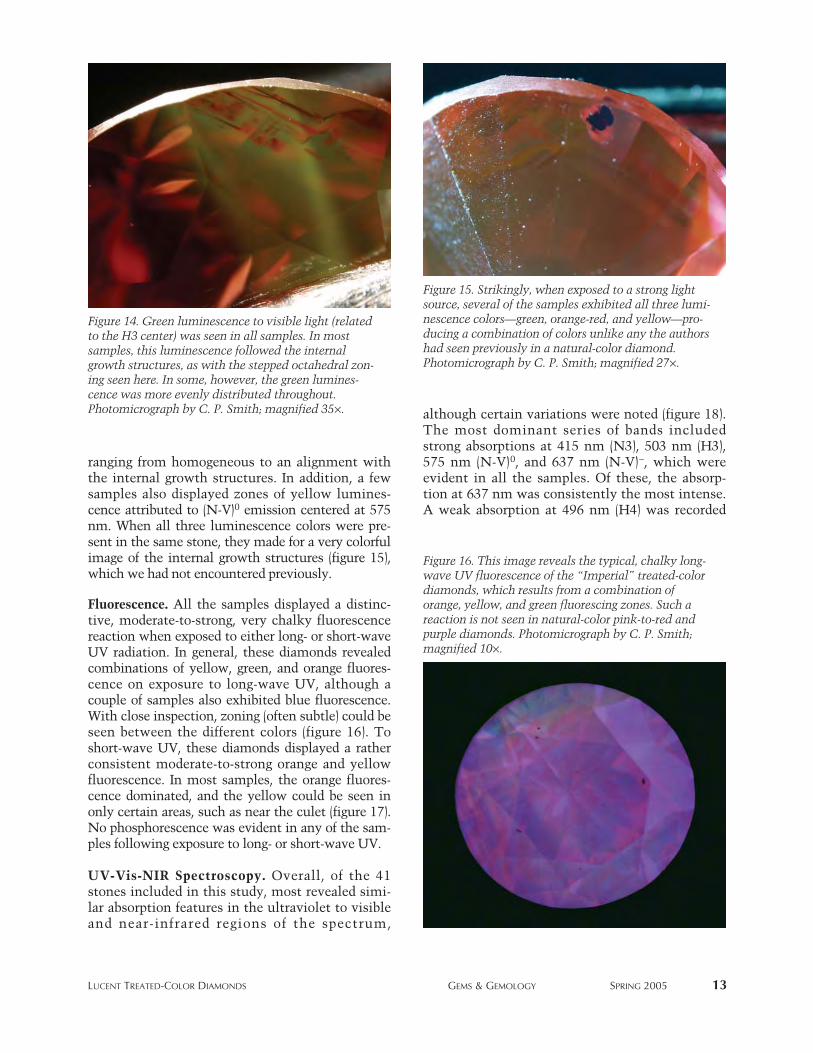
Figure 14. Green luminescence to visible light (relatedto the H3 center) was seen in all samples. In mostsamples, this luminescence followed the internalgrowth structures, as with the stepped octahedral zon-ing seen here. In some, however, the green lumines-cence was more evenly distributed throughout.Photomicrograph by C. P. Smith; magnified 35¥.
Figure 15. Strikingly, when exposed to a strong lightsource, several of the samples exhibited all three lumi-nescence colors—green, orange-red, and yellow—pro-ducing a combination of colors unlike any the authorshad seen previously in a natural-color diamond.Photomicrograph by C. P. Smith; magnified 27¥.
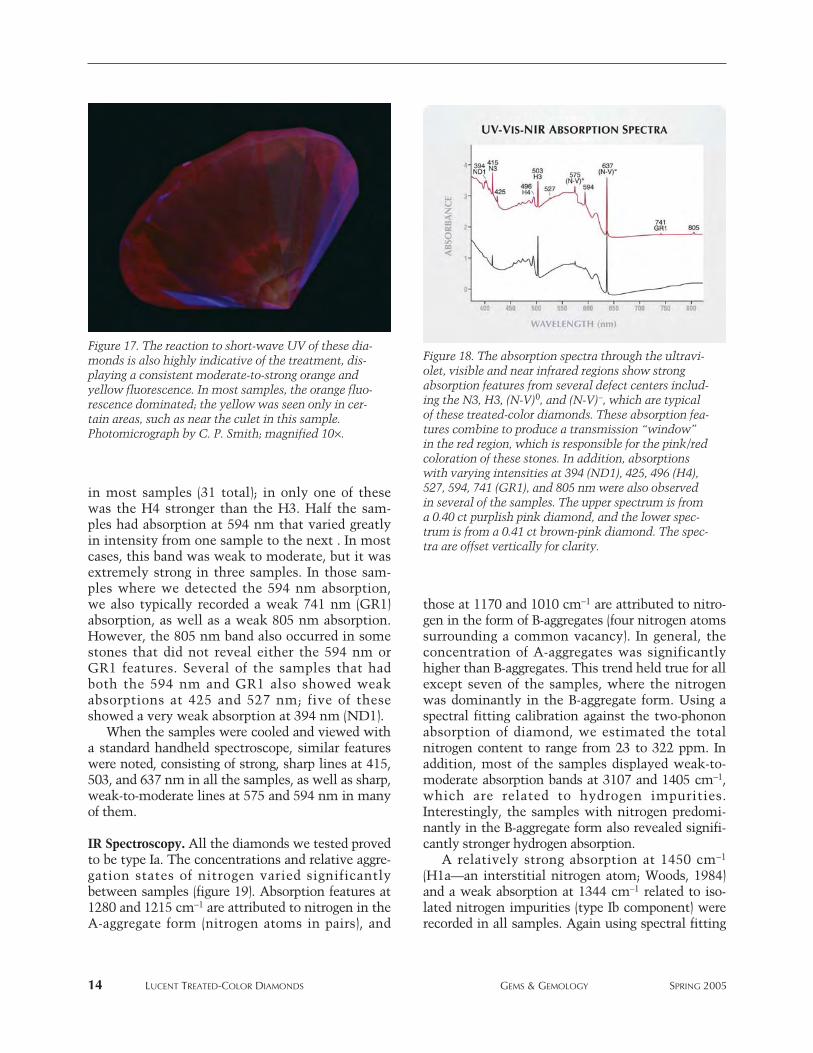
Figure 16. This image reveals the typical, chalky long-wave UV fluorescence of the “Imperial” treated-colordiamonds, which results from a combination oforange, yellow, and green fluorescing zones. Such areaction is not seen in natural-color pink-to-red andpurple diamonds. Photomicrograph by C. P. Smith;magnified 10¥.
in most samples (31 total); in only one of thesewas the H4 stronger than the H3. Half the sam-ples had absorption at 594 nm that varied greatlyin intensity from one sample to the next . In mostcases, this band was weak to moderate, but it wasextremely strong in three samples. In those sam-ples where we detected the 594 nm absorption,we also typically recorded a weak 741 nm (GR1)absorption, as well as a weak 805 nm absorption.However, the 805 nm band also occurred in somestones that did not reveal either the 594 nm orGR1 features. Several of the samples that hadboth the 594 nm and GR1 also showed weakabsorptions at 425 and 527 nm; five of theseshowed a very weak absorption at 394 nm (ND1).
When the samples were cooled and viewed witha standard handheld spectroscope, similar featureswere noted, consisting of strong, sharp lines at 415,503, and 637 nm in all the samples, as well as sharp,weak-to-moderate lines at 575 and 594 nm in manyof them.
IR Spectroscopy. All the diamonds we tested provedto be type Ia. The concentrations and relative aggre-gation states of nitrogen varied significantlybetween samples (figure 19). Absorption features at1280 and 1215 cm-1 are attributed to nitrogen in theA-aggregate form (nitrogen atoms in pairs), and
those at 1170 and 1010 cm-1 are attributed to nitro-gen in the form of B-aggregates (four nitrogen atomssurrounding a common vacancy). In general, theconcentration of A-aggregates was significantlyhigher than B-aggregates. This trend held true for allexcept seven of the samples, where the nitrogenwas dominantly in the B-aggregate form. Using aspectral fitting calibration against the two-phononabsorption of diamond, we estimated the totalnitrogen content to range from 23 to 322 ppm. Inaddition, most of the samples displayed weak-to-moderate absorption bands at 3107 and 1405 cm-1,which are related to hydrogen impurities.Interestingly, the samples with nitrogen predomi-nantly in the B-aggregate form also revealed signifi-cantly stronger hydrogen absorption.
A relatively strong absorption at 1450 cm-1
(H1a—an interstitial nitrogen atom; Woods, 1984)and a weak absorption at 1344 cm-1 related to iso-lated nitrogen impurities (type Ib component) wererecorded in all samples. Again using spectral fitting
14 LUCENT TREATED-COLOR DIAMONDS GEMS & GEMOLOGY SPRING 2005
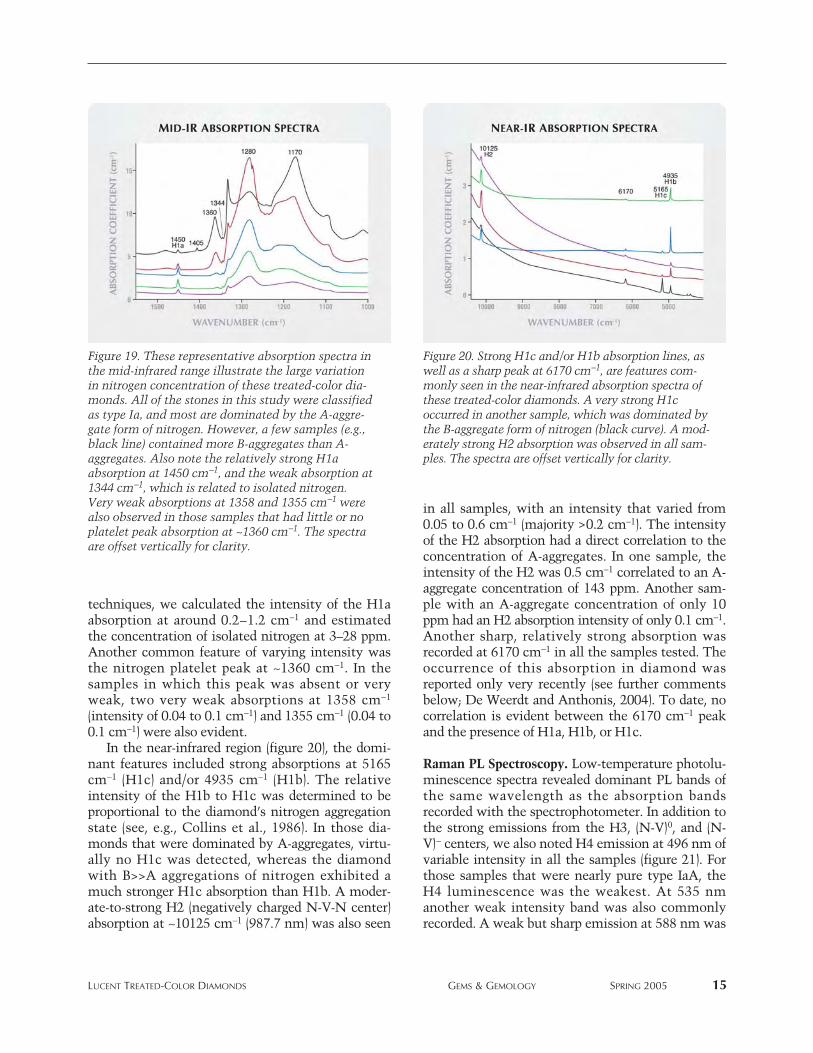
Figure 18. The absorption spectra through the ultravi-olet, visible and near infrared regions show strongabsorption features from several defect centers includ-ing the N3, H3, (N-V)0, and (N-V)-, which are typicalof these treated-color diamonds. These absorption fea-tures combine to produce a transmission “window”in the red region, which is responsible for the pink/redcoloration of these stones. In addition, absorptionswith varying intensities at 394 (ND1), 425, 496 (H4),527, 594, 741 (GR1), and 805 nm were also observedin several of the samples. The upper spectrum is froma 0.40 ct purplish pink diamond, and the lower spec-trum is from a 0.41 ct brown-pink diamond. The spec-tra are offset vertically for clarity.
Figure 17. The reaction to short-wave UV of these dia-monds is also highly indicative of the treatment, dis-playing a consistent moderate-to-strong orange andyellow fluorescence. In most samples, the orange fluo-rescence dominated; the yellow was seen only in cer-tain areas, such as near the culet in this sample.Photomicrograph by C. P. Smith; magnified 10¥.
techniques, we calculated the intensity of the H1aabsorption at around 0.2–1.2 cm-1 and estimatedthe concentration of isolated nitrogen at 3–28 ppm.Another common feature of varying intensity wasthe nitrogen platelet peak at ~1360 cm-1. In thesamples in which this peak was absent or veryweak, two very weak absorptions at 1358 cm-1
(intensity of 0.04 to 0.1 cm-1) and 1355 cm-1 (0.04 to0.1 cm-1) were also evident.
In the near-infrared region (figure 20), the domi-nant features included strong absorptions at 5165cm-1 (H1c) and/or 4935 cm-1 (H1b). The relativeintensity of the H1b to H1c was determined to beproportional to the diamond’s nitrogen aggregationstate (see, e.g., Collins et al., 1986). In those dia-monds that were dominated by A-aggregates, virtu-ally no H1c was detected, whereas the diamondwith B>>A aggregations of nitrogen exhibited amuch stronger H1c absorption than H1b. A moder-ate-to-strong H2 (negatively charged N-V-N center)absorption at ~10125 cm-1 (987.7 nm) was also seen
in all samples, with an intensity that varied from0.05 to 0.6 cm-1 (majority >0.2 cm-1). The intensityof the H2 absorption had a direct correlation to theconcentration of A-aggregates. In one sample, theintensity of the H2 was 0.5 cm-1 correlated to an A-aggregate concentration of 143 ppm. Another sam-ple with an A-aggregate concentration of only 10ppm had an H2 absorption intensity of only 0.1 cm-1.Another sharp, relatively strong absorption wasrecorded at 6170 cm-1 in all the samples tested. Theoccurrence of this absorption in diamond wasreported only very recently (see further commentsbelow; De Weerdt and Anthonis, 2004). To date, nocorrelation is evident between the 6170 cm-1 peakand the presence of H1a, H1b, or H1c.
Raman PL Spectroscopy. Low-temperature photolu-minescence spectra revealed dominant PL bands ofthe same wavelength as the absorption bandsrecorded with the spectrophotometer. In addition tothe strong emissions from the H3, (N-V)0, and (N-V)- centers, we also noted H4 emission at 496 nm ofvariable intensity in all the samples (figure 21). Forthose samples that were nearly pure type IaA, theH4 luminescence was the weakest. At 535 nmanother weak intensity band was also commonlyrecorded. A weak but sharp emission at 588 nm was
LUCENT TREATED-COLOR DIAMONDS GEMS & GEMOLOGY SPRING 2005 15
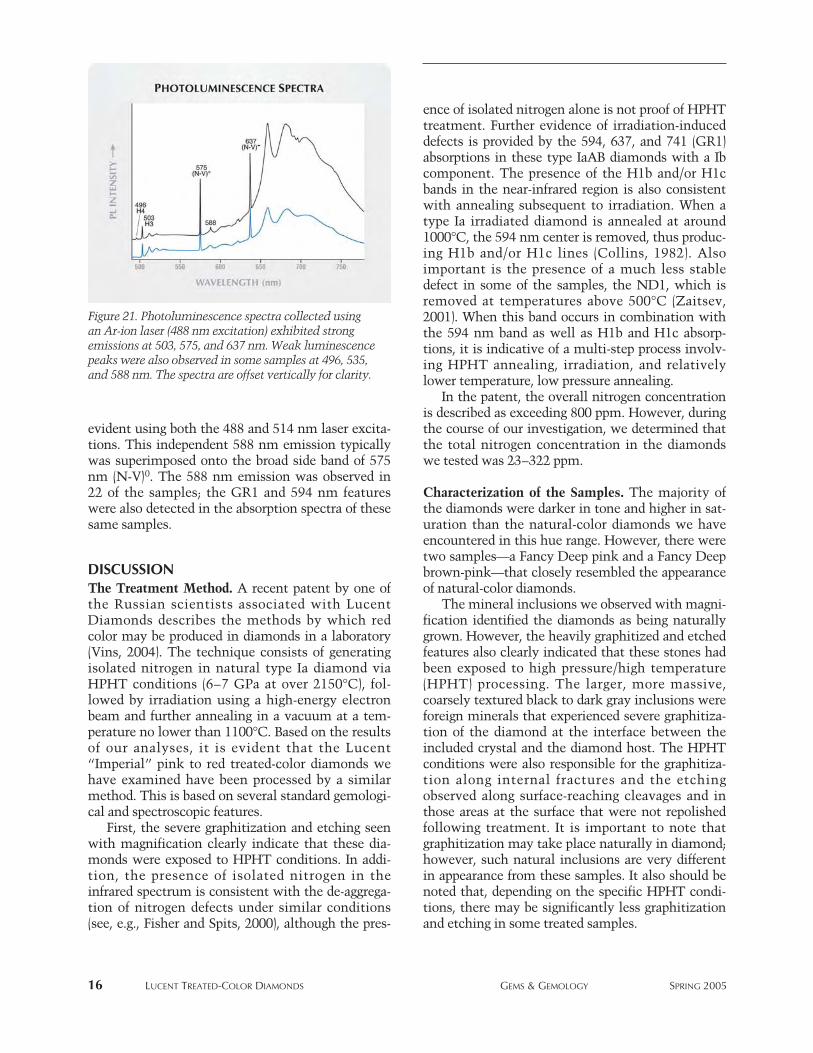
Figure 19. These representative absorption spectra inthe mid-infrared range illustrate the large variationin nitrogen concentration of these treated-color dia-monds. All of the stones in this study were classifiedas type Ia, and most are dominated by the A-aggre-gate form of nitrogen. However, a few samples (e.g.,black line) contained more B-aggregates than A-aggregates. Also note the relatively strong H1aabsorption at 1450 cm-1, and the weak absorption at1344 cm-1, which is related to isolated nitrogen.Very weak absorptions at 1358 and 1355 cm-1 werealso observed in those samples that had little or noplatelet peak absorption at ~1360 cm-1. The spectraare offset vertically for clarity.
Figure 20. Strong H1c and/or H1b absorption lines, aswell as a sharp peak at 6170 cm-1, are features com-monly seen in the near-infrared absorption spectra ofthese treated-color diamonds. A very strong H1coccurred in another sample, which was dominated bythe B-aggregate form of nitrogen (black curve). A mod-erately strong H2 absorption was observed in all sam-ples. The spectra are offset vertically for clarity.
evident using both the 488 and 514 nm laser excita-tions. This independent 588 nm emission typicallywas superimposed onto the broad side band of 575nm (N-V)0. The 588 nm emission was observed in22 of the samples; the GR1 and 594 nm featureswere also detected in the absorption spectra of thesesame samples.
DISCUSSION The Treatment Method. A recent patent by one ofthe Russian scientists associated with LucentDiamonds describes the methods by which redcolor may be produced in diamonds in a laboratory(Vins, 2004). The technique consists of generatingisolated nitrogen in natural type Ia diamond viaHPHT conditions (6–7 GPa at over 2150°C), fol-lowed by irradiation using a high-energy electronbeam and further annealing in a vacuum at a tem-perature no lower than 1100°C. Based on the resultsof our analyses, it is evident that the Lucent“Imperial” pink to red treated-color diamonds wehave examined have been processed by a similarmethod. This is based on several standard gemologi-cal and spectroscopic features.
First, the severe graphitization and etching seenwith magnification clearly indicate that these dia-monds were exposed to HPHT conditions. In addi-tion, the presence of isolated nitrogen in theinfrared spectrum is consistent with the de-aggrega-tion of nitrogen defects under similar conditions(see, e.g., Fisher and Spits, 2000), although the pres-
ence of isolated nitrogen alone is not proof of HPHTtreatment. Further evidence of irradiation-induceddefects is provided by the 594, 637, and 741 (GR1)absorptions in these type IaAB diamonds with a Ibcomponent. The presence of the H1b and/or H1cbands in the near-infrared region is also consistentwith annealing subsequent to irradiation. When atype Ia irradiated diamond is annealed at around1000°C, the 594 nm center is removed, thus produc-ing H1b and/or H1c lines (Collins, 1982). Alsoimportant is the presence of a much less stabledefect in some of the samples, the ND1, which isremoved at temperatures above 500°C (Zaitsev,2001). When this band occurs in combination withthe 594 nm band as well as H1b and H1c absorp-tions, it is indicative of a multi-step process involv-ing HPHT annealing, irradiation, and relativelylower temperature, low pressure annealing.
In the patent, the overall nitrogen concentrationis described as exceeding 800 ppm. However, duringthe course of our investigation, we determined thatthe total nitrogen concentration in the diamondswe tested was 23–322 ppm.
Characterization of the Samples. The majority ofthe diamonds were darker in tone and higher in sat-uration than the natural-color diamonds we haveencountered in this hue range. However, there weretwo samples—a Fancy Deep pink and a Fancy Deepbrown-pink—that closely resembled the appearanceof natural-color diamonds.
The mineral inclusions we observed with magni-fication identified the diamonds as being naturallygrown. However, the heavily graphitized and etchedfeatures also clearly indicated that these stones hadbeen exposed to high pressure/high temperature(HPHT) processing. The larger, more massive,coarsely textured black to dark gray inclusions wereforeign minerals that experienced severe graphitiza-tion of the diamond at the interface between theincluded crystal and the diamond host. The HPHTconditions were also responsible for the graphitiza-tion along internal fractures and the etchingobserved along surface-reaching cleavages and inthose areas at the surface that were not repolishedfollowing treatment. It is important to note thatgraphitization may take place naturally in diamond;however, such natural inclusions are very differentin appearance from these samples. It also should benoted that, depending on the specific HPHT condi-tions, there may be significantly less graphitizationand etching in some treated samples.
16 LUCENT TREATED-COLOR DIAMONDS GEMS & GEMOLOGY SPRING 2005
Figure 21. Photoluminescence spectra collected usingan Ar-ion laser (488 nm excitation) exhibited strongemissions at 503, 575, and 637 nm. Weak luminescencepeaks were also observed in some samples at 496, 535,and 588 nm. The spectra are offset vertically for clarity.
In type Ia natural diamonds, naturally occurringpink-to-red and purple coloration is clearly associat-ed with zones exhibiting plastic deformation. As aresult, when such stones are viewed betweencrossed polarizing filters, they typically reveal veryhigh levels of strain (see, e.g., figure 15 in King et al.,2002, p. 140). The strain visible in these treated-colorsamples was significantly weaker. In only a few ofthe Lucent samples did the strain levels approachwhat is typical for their natural-color counterparts.
The thick and extended regions of color zoningthat were present in these samples occurred in avariety of straight, angular, and irregular patterns.Such color zoning is very different from that encoun-tered in natural-color pink-to-red diamonds, whichis visible as straight, parallel color zones that extendin only one direction and typically do not have sharpboundaries (see, e.g., Koivula, 2000, p. 92).
The DiamondView imaging accentuates thecomplex growth structure of these natural dia-monds, which involves the development of primari-ly octahedral {111} growth planes. The large varia-tion in fluorescence colors (red, orange, yellow,blue, and green) as well as the dark areas where nofluorescence was evident, is a direct reflection of thespecific type and concentration of defects beforetreatment and the resultant reconfiguration of thedefects by the treatment process. These features aremarkedly different from those of synthetic dia-monds created by HPHT or CVD techniques, andthey confirm the natural origin of these samples(Wang et al., 2003; Shigley et al, 2004).
When illuminated by a strong light source, green(H3) luminescence has been seen in many naturallycolored, as well as artificially colored, diamonds(Fritsch, 1998; Reinitz et al., 2000). (It is oftenreferred to as “transmission luminescence,” thoughthis is not strictly correct.) A weak orange-red lumi-nescence due to N-V centers may be seen in somenatural-color pink diamonds; however, it is morecommonly associated with treated-color pink-to-reddiamonds with moderate to high color saturation(see, e.g., Shigley et al., 2004). Nevertheless, we hadnot previously witnessed the combination of green(H3), orange-red (N-V)-, and yellow (N-V)0 visibleluminescence seen in these treated-color diamonds.Nor have we encountered in natural-color pink-to-red diamonds the strong, chalky orange, green, andyellow fluorescence to long-wave UV that was evi-dent in these treated stones.
The “Imperial” treated-color diamonds in thisstudy owed their color to the absorption of N-V cen-
ters positioned at 575 and 637 nm, with some influ-ence from other absorption features. The introductionof a relatively high concentration of H3/H4 defects,which absorb blue-green light, is essential to generatea pure red hue. If the H3/H4 absorptions are notstrong enough, a distinct purple hue will be devel-oped, as was observed in some of the stones we tested.High concentrations of the A/B form of nitrogen arenecessary to generate H3/H4 defects during treat-ment. Additionally, if the absorption of the N-V cen-ters is not strong enough relative to the absorption ofthe H3 and H4 centers, then brown colors develop.
In contrast, the vast majority of natural-colorpink-to-red diamonds owe their hue to a broadabsorption band centered at approximately 550 nm(e.g., Collins 1982; King et al., 2002; Moses et al.,2002). To date, we are not aware of any reports ofthe artificial introduction of the 550 nm band intype I natural diamonds. We have examined a smallnumber of natural-color pink diamonds that owetheir color to N-V centers. Typically, these dia-monds are rather pale in color and are classified astype IIa. However, we have not observed strong H3or N3 absorption in such diamonds.
The physics responsible for the 588 nm peak vis-ible in the PL spectra of some samples is not fullyunderstood (Zaitsev, 2001). On initial consideration,there seemed to be some correlation between theoccurrence of this peak and the color saturation ofthe diamonds. After further investigation, however,we found that the 588 nm emission may also beobserved in some natural green-yellow diamondsthat have high concentrations of H3 centers.
The 6170 cm-1 absorption in the infrared isanother little-known defect. Its occurrence, reportedin previous publications and the present study, isclosely related to irradiation and annealing, eithernaturally or in the laboratory. De Weerdt andAnthonis (2004) first reported a peak at 6172 cm-1
in a treated diamond and, based on their experi-ments, suggested that it resulted from a complextreatment process. In addition, Hainschwang et al.(in preparation) have correlated a band at 6165 cm-1
to the presence of H1c centers in irradiated andannealed diamonds. In this study of a large set ofsamples, we found no such correlation. However,those samples with the strongest 6170 cm-1 band ingeneral had very weak H1b/H1c bands and relative-ly stronger 594 nm absorption. In unpublished datafrom ongoing research at GIA, we have recorded theoccurrence of this band (with position varyingslightly from 6170 to 6168 cm-1) in a few naturally
LUCENT TREATED-COLOR DIAMONDS GEMS & GEMOLOGY SPRING 2005 17
irradiated diamonds as well. A few of those natural-color stones displayed green radiation stains. Allthese observations indicate that the 6170 cm-1
absorption represents a defect that may be intro-duced via irradiation and annealing processes, eitherin the laboratory or in nature. Consequently, we donot consider the presence of this band as conclusiveof color treatment on its own.
Although we did not perform stability testingper se, we concluded—based on the kinds of defectsobserved and their concentrations—that the colorsproduced by the multiple-step treatment processdescribed here are both stable and permanent tonormal conditions of wear and care. In addition, wedid not detect any residual radioactivity.
IDENTIFYING CHARACTERISTICSA number of standard gemological properties andadvanced analytical features will readily identifythat these stones are naturally grown and their colorhas been artificially induced. The fact that they weregrown in nature can be confirmed by the presence ofcharacteristic mineral inclusions and distinctiveinternal growth structures, as well as by the lack ofthe inclusion features and growth structures typicalof HPHT- and CVD-grown synthetic diamonds.With standard gemological techniques, the artificialcoloration can be identified by the strongly alteredinclusion features in combination with the differ-ences in appearance of the pink-to-purple or browncolor zoning in these samples as compared to thecolored graining in natural-color diamonds. In addi-tion, with a standard handheld spectroscope, the dis-tinctive combination of strong 415, 503, and 637 nmabsorption lines, as well as weak-to-moderate 575and 594 absorption lines, clearly identifies the treat-ed origin of the color. Furthermore, the unique long-and short-wave UV fluorescence reactions are clearindicators that this material has been treated.
The more advanced analytical techniques alsorevealed some interesting identification criteria that
appear to be unique to this process. The occurrenceof trace isolated nitrogen, together with H3 and H2centers, are some of the common features related toHPHT treatment, whereas defects such as H1a,H1b, H1c, (N-V)-, 594 nm, (N-V)0, H3, and H4 com-monly occur in diamonds that have been exposed toradiation. Although these defects may occur in nat-ural-color diamonds, we have not seen a knownnatural-color diamond that has all of these features.The absorption at 6170 cm-1, although not proof,may also suggest color treatment.
CONCLUSIONNaturally colored diamonds in the pink-to-red huerange are some of the most exotic and expensivegemstones. At auction, such diamonds have achievedas much as US$895,000 per carat (Balfour, 2000). As aresult, various forms of treatment have been appliedin attempts to recreate these highly desirable colors.Previously, these ranged from simple topical coatings(e.g., Moses et al., 2004) to move advanced techniquessuch as irradiation of type Ib diamonds(Crowningshield, 1959; Crowningshield and Reinitz,1995) and HPHT annealing of type IIa diamonds (e.g.,De Beers Industrial Diamonds et al., 2001).
Most recently, Lucent Diamonds has intro-duced treated-color pink-to-red natural diamondsinto the marketplace under the trade name“Imperial Red Diamonds.” The Lucent groupbegan developing the technology to produce thesestable colors on a commercial basis toward the endof 2003, and they first offered them for sale in thesummer of 2004. Our investigations confirmed thata combination of treatment techniques, includingHPHT annealing and irradiation, are applied toinduce the coloration in these diamonds, consis-tent with the process described by Vins (2004).They can be readily identified by their distinctiveinclusion features, color zoning, and long- andshort-wave UV fluorescence, as well as by theirunique combination of spectroscopic features.
18 LUCENT TREATED-COLOR DIAMONDS GEMS & GEMOLOGY SPRING 2005
ABOUT THE AUTHORSDr. Wang is research scientist, Mr. Smith is director of identi-fication services, Mr. Hall is manager of analytical researchservices, and Mr. Moses is vice president of identification andresearch at the GIA Gem Laboratory in New York. Dr.Breeding is research scientist at the GIA Gem Laboratory inCarlsbad, California.
ACKNOWLEDGMENTS: The authors are grateful to AlexGrizenko, president of Lucent Diamonds Inc., for supplyingspecimens for this study, and to Dr. Victor Vins, research anddevelopment manager of New Diamonds of Siberia, Novosibirsk,Russia, for many helpful discussions. They also thank John Kingand Joshua Cohn, of the GIA Gem Laboratory in New York, forcareful color grading observations and useful discussions.
LUCENT TREATED-COLOR DIAMONDS GEMS & GEMOLOGY SPRING 2005 19
REFERENCESBalfour I. (2000) Famous Diamonds. Christie, Manson & Woods,
London.Collins A.T. (1982) Colour centres in diamond. Journal of
Gemmology, Vol. 18, No. 1, pp. 37–75.Collins A.T., Davies G., Woods G.S. (1986) Spectroscopic studies
of the H1b and H1c absorption lines in irradiated, annealedtype-Ia diamonds. Journal of Physics C: Solid State Physics,Vol. 19, pp. 3933–3944.
Crowningshield G.R. (1959) Highlights at the Gem Trade Lab inNew York. Gems & Gemology, Vol. 9, No. 9, pp. 268–270.
Crowningshield G.R., Reinitz I. (1995) Gem Trade Lab Notes:Treated-color pink diamond. Gems & Gemology, Vol. 31, No.2, pp. 121–122.
De Beers Industrial Diamonds, Spits R.A., Burns R., Fisher D.(2001) High Temperature/Pressure Color Change of Diamond.International (PCT) patent application WO 01/72404A1, filedApril 2.
De Weerdt F., Anthonis A. (2004) A new defect observed in irra-diated and heat treated type Ia diamonds. The 55th DiamondConference, July 5–7, 2004, Warwick, England, p. 17.
Fisher D., Spits R.A. (2000) Spectroscopic evidence of GE POLHPHT-treated natural type IIa diamonds. Gems & Gemology,Vol. 36, No. 1, pp. 42–49.
Fritsch E. (1998) The color of diamond. In G. E. Harlow, Ed., TheNature of Diamonds, Cambridge University Press, Cambridge,U.K., pp. 23–47.
Hainschwang T., Fritsch E., Notari F., Massi L. (in preparation)The properties of irradiated and annealed diamonds exhibitingan undescribed near-infrared absorption.
Hall M., Moses T. (2000) Gem Trade Lab Notes: Diamond—blueand pink HPHT annealed. Gems & Gemology, Vol. 36, No. 3,pp. 254–255.
King J.M., Moses T.M., Shigley J.E., Liu Y. (1994) Color grading ofcolored diamonds in the GIA Gem Trade Laboratory. Gems& Gemology, Vol. 30, No. 4, pp. 220–242.
King J.M., Shigley J.E., Guhin S.S., Gelb T.H., Hall M. (2002)Characterization and grading of natural-color pink diamonds.Gems & Gemology, Vol. 38, No. 2, pp. 128–147.
Koivula J.I. (2000) The Microworld of Diamonds. GemworldInternational, Northbrook, IL.
Moses T., King J.M., Wang W., Shigley J.E. (2002) A highlyunusual 7.34 carat Fancy Vivid purple diamond. Journal ofGemmology, Vol. 28, No. 1, pp. 7–12.
Moses T., Smith C., Wang W., Hall M. (2004) Topical coating ondiamonds to improve their color: A long history. RapaportDiamond Report, Vol. 27, No. 20, pp. 91–93.
Orlov Yu. L. (1977) The Mineralogy of Diamond. Wiley Inter-science, New York, pp. 128–131.
Reinitz I.M., Buerki P.R., Shigley J.E., McClure S.F., Moses T.M.(2000) Identification of HPHT-treated yellow to green dia-monds. Gems & Gemology, Vol. 36, No. 2, pp. 128–137.
Shigley J.E., McClure S.F., Breeding C.M., Shen A.H.,Muhlmeister S.M. (2004) Lab-grown colored diamonds fromChatham Created Gems. Gems & Gemology, Vol. 40, No. 2,pp. 128–145.
Vins V.G. (2004) The Technique of Production of Fancy RedDiamonds. Russian Federation patent 2237113, filed June 26,2003, issued Sept. 27, 2004. [in Russian]
Wang W., Moses T., Linares R., Hall M., Shigley J.E., Butler, J.(2003) Gem-quality synthetic diamonds grown by a chemicalvapor deposition (CVD) method. Gems & Gemology, Vol. 39,No. 4, pp. 268–283.
Welbourn C.M., Cooper M., Spear P.M. (1996) De Beers naturalversus synthetic diamond verification instruments. Gems &Gemology, Vol. 32, No. 3, pp. 156–169.
Woods G.S. (1984) Infrared absorption studies of the annealing ofirradiated diamonds. Philosophical Magazine B, Vol. 50, pp.673–688.
Zaitsev A.M. (2001) Optical Properties of Diamond. Springer-Verlag, Berlin, 502 pp.