Embed Size (px)
Citation preview
Appendix 1
Treasury Management Strategy2020 - 21

Contents1 INTRODUCTION..................................................................................................3
1.1 Background to Treasury Management ...........................................................31.2 Reporting Requirements.................................................................................31.3 Treasury Management Strategy for 2020/21..................................................51.4 Training...........................................................................................................51.5 Treasury Management Consultants ...............................................................5
2 THE CAPITAL PRUDENTIAL INDICATORS 2020/21 – 2022/23 ........................62.1 Capital Expenditure ........................................................................................62.2 The Council’s Borrowing Need (the Capital Financing Requirement) ............72.3 Core Funds and Expected Investment Balances ...........................................8
3 BORROWING.......................................................................................................93.1 Borrowing objectives ......................................................................................93.2 Current borrowing portfolio ...........................................................................103.3 Treasury Indicators: Limits to Borrowing Activity..........................................113.4 Prospects for Interest Rates.........................................................................123.5 Borrowing Strategy.......................................................................................133.6 Policy on borrowing in advance of need.......................................................143.7 Proportionality...............................................................................................143.8 Debt repayment and rescheduling ...............................................................15
4 ANNUAL INVESTMENT STRATEGY ................................................................164.1 Investment overview.....................................................................................164.2 Investment policy objectives.........................................................................164.3 Investment rules ...........................................................................................174.4 Creditworthiness policy.................................................................................174.5 Use of additional information other than credit ratings .................................194.6 Time and monetary limits applying to investments.......................................194.7 Other considerations ....................................................................................204.8 Investment approach....................................................................................204.9 Investment returns expectations and benchmarking....................................214.10 End of Year Investment Report.................................................................22
5 THE CAPITAL PRUDENTIAL AND TREASURY INDICATORS 2020/21 – 2022/23 AND MRP STATEMENT .............................................................................23
5.1 Capital Expenditure ......................................................................................235.2 Minimum Revenue Provision Policy .............................................................235.3 Affordability Prudential Indicators .................................................................24
ANNEXE A1 TREASURY MANAGEMENT PRACTICES (TMP1) COUNTERPARTY AND CREDIT RISK MANAGEMENT.........................................................................26Annexe A2 - Public Works Loan Board (PWLB) Debt Analysis.................................29Annexe A3 Treasury Management Glossary of Terms .............................................31

1 INTRODUCTION
1.1 Background to Treasury Management
1.1.1 The Council is required to operate a balanced budget, which means that cash raised during the year will meet cash expenditure. Part of the treasury management operation is to ensure that this cash flow is adequately planned, with cash being available when it is needed to meet day-to-day running costs and planned capital expenditure. Any surplus monies are invested in counterparties or instruments commensurate with the Council’s risk appetite, providing adequate liquidity initially before considering investment return.
1.1.2 The second main function of the treasury management service is the funding of the Council’s capital plans as set out in the Budget and Capital Investment Strategy (CIS). These capital plans provide a guide to the borrowing need of the Council, essentially the longer-term cash flow planning, to ensure that the Council can meet its capital spending obligations. This management of longer-term cash may involve arranging long or short-term loans, or using longer-term cash flow surpluses. On occasion, when it is prudent and economic, any debt previously drawn may be restructured to meet Council risk or cost objectives.
1.1.3 The contribution the treasury management function makes to the authority is critical, as the balance of debt and investment operations ensure liquidity or the ability to meet spending commitments as they fall due, either on day-to-day revenue or for larger capital projects. The treasury operations will see a balance of the interest costs of debt and the investment income arising from cash deposits affecting the available budget. Since cash balances generally result from reserves and balances, it is paramount to ensure adequate security of the sums invested, as a loss of principal will in effect result in a loss to the General Fund Balance.
1.1.4 Whilst any commercial initiatives or loans to third parties will impact on the treasury function, these activities are generally classed as non-treasury activities, arising usually from capital expenditure and are separate from the day to day treasury management activities.
1.1.5 CIPFA defines treasury management as “…The management of the local authority’s borrowing, investments and cash flows, its banking, money market and capital market transactions; the effective control of the risks associated with those activities; and the pursuit of optimum performance consistent with those risks.”
1.2 Reporting Requirements
Treasury Management Reporting
1.2.1 The Council is required to receive and approve, as a minimum, three main reports each year which incorporate a variety of policies, estimates and actuals.
1.2.2 Prudential and treasury indicators and treasury strategy (this report) - The first and most important report covers:

the capital plans (including prudential indicators) as derived through the budget and CIS;
a minimum revenue provision (MRP) policy (how residual capital expenditure is charged to revenue over time);
the treasury management strategy (how the investments and borrowings are to be organised) including treasury indicators; and
an investment strategy for treasury investments (the parameters on how investments are to be managed).
1.2.3 A mid-year treasury management report – This will update members with the progress of the capital position, amending prudential indicators as necessary and whether any policies require revision. In addition, this Council will receive an update on investment returns.
1.2.4 An annual treasury report – This provides details of a selection of actual prudential and treasury indicators and actual treasury operations compared to the estimates within the strategy.
1.2.5 Scrutiny - The above reports are required to be adequately scrutinised before being recommended to Council. This role is undertaken by Cabinet and reports are also made available to Scrutiny Panels.
Capital Investment Strategy
1.2.6 The Treasury Management Strategy should be read in conjunction with the Council’s Capital Investment Strategy as the Council’s debt and MRP policy are directly impacted by capital plans.
1.2.7 The overall aim of the Council, with respect to capital expenditure and investment, is to achieve council objectives and priorities whilst ensuring that capital plans are affordable, prudent and sustainable.
1.2.8 The CIS provides a framework that allows that objective to be achieved. It sets out:
what is capital expenditure/investment and why we incur it (section 2);
the Council’s overall capital objectives, priorities and plans (section 3);
how the Council’s capital expenditure/investment will be funded/ resourced (section 4);
how the Council’s capital expenditure/investment plans will be appraised (section 5) including the Council’s commercial investment policy (Annexe B1);
how capital plans will be approved (section 6), monitored and reported upon (Section 7); and
the skills and knowledge required to deliver the capital plans (section 8).

1.3 Treasury Management Strategy for 2020/21
1.3.1 The strategy for 2020/21 covers two main areas.
Capital Issues
the capital plans and the prudential indicators;
the minimum revenue provision (MRP) policy.
Treasury Management Issues
the current treasury position;
treasury indicators which limit the treasury risk and activities of the Council;
prospects for interest rates;
the borrowing strategy and policy on borrowing in advance of need;
debt rescheduling;
the investment strategy (for treasury investments);
creditworthiness policy; and
the policy on use of external service providers.
1.3.2 These elements cover the requirements of the Local Government Act 2003, the CIPFA Prudential Code, MHCLG MRP Guidance, the CIPFA Treasury Management Code and MHCLG Investment Guidance.
1.4 Training
1.4.1 The CIPFA Code requires the Section 151 Officer to ensure that members with responsibility for treasury management receive adequate training in treasury management. The training needs of treasury management officers and members are periodically reviewed.
1.5 Treasury Management Consultants
1.5.1 The Council uses Link Asset Services Treasury Solutions as its external treasury management advisors.
1.5.2 The Council recognises that responsibility for treasury management decisions remains with the organisation at all times and will ensure that undue reliance is not placed upon our external service providers. All decisions will be undertaken with regards to all available information, including, but not solely, our treasury advisers.
1.5.3 It also recognises that there is value in employing external providers of treasury management services in order to acquire access to specialist skills and resources. The Council will ensure that the terms of their appointment and the methods by which their value will be assessed are properly agreed and documented and subjected to regular review.

2 THE CAPITAL PRUDENTIAL INDICATORS 2020/21 – 2022/23
2.1 Capital Expenditure
2.1.1 The Council’s capital expenditure plans as set out in the budget are the key driver of treasury management activity. The output of the capital expenditure plans is reflected in the prudential indicators, which are designed to assist members’ overview and confirm capital expenditure plans.
2.1.2 The capital expenditure prudential indicator is a summary of the Council’s capital expenditure plans, both those agreed previously and those forming part of this budget cycle. As at 1 April 2020 the Council estimates that it will have capital projects approved of £26.586m. The details of this are shown in Budget Report (Report No: 3/2020).
2.1.3 The table below shows the indicative spend profile of approved capital projects included in the 2020/21 Budget. Whilst the Council may have approved a project in 2020/21 spending may not occur until 2021/22. Members are asked to approve the capital expenditure forecasts:
Estimates of capital expenditure (Prudential Indicator (PI) 3) and Actual capital expenditure (PI4)
Actuals 2018/19
Projects 2019/20
Projects 2020/21
Projects 2021/22
Projects 2022/23Estimated Capital Programme
£000 £000 £000 £000 £000Total Projects 4,479 7,420 449 249 249Total Commercial Activities/non- financial investments* 0 0 10,000 0 0
Total 4,479 7,420 10,449 249 249Non ring fenced grants- unallocated 0 0 2,467 2,147 2,147
Total Budget 2020/21** 4,479 7,420 12,917 2,397 2,397* Commercial activities / non-financial investments relate to areas such as capital expenditure on investment properties, loans to third parties etc.**The existing capital programme in the budget for 20/21 is £26.586m. £5.506m has already been spent in 2018/19 and prior years, with £21.08m to be spent in 2019/20 onwards.
2.1.4 These figures do not yet include proposals for new projects being developed. In these areas Cabinet reports are expected in 2020/21. Funding for any future projects will be funded in full or in part from the unallocated funding.
2.1.5 The table overleaf summarises the above capital expenditure plans and how these plans are being financed by capital or revenue resources. Any shortfall of resources results in a funding borrowing need. The table also shows the percentage of the borrowing need relating solely to commercial investments.

Actuals 2018/19
Projects 2019/20
Projects 2020/21
Projects 2021/22
Projects 2022/23Estimated Capital Programme
£000 £000 £000 £000 £000Grant 3,931 5,847 2,717 2,397 2,397Capital Receipts 158 279 0 0 0RCCO 154 278 0 0 0Oakham North 180 0 0 0 0S106/CIL 56 329 0 0 0Total Funding 4,479 6,733 2,717 2,397 2,397Borrowing Need 582 687 10,200 0 0Borrowing relating to Commercial Investments 0 0 10,000 0 0
Percentage of total net financing need % 0% 0% 98% 0% 0%
2.2 The Council’s Borrowing Need (the Capital Financing Requirement)
2.2.1 The second prudential indicator is the Council’s Capital Financing Requirement (CFR). The CFR is simply the total historic outstanding capital expenditure which has not yet been paid for from either revenue or capital resources. It is essentially a measure of the Council’s indebtedness and its underlying borrowing need. Any capital expenditure above, which has not immediately been paid for, will increase the CFR.
2.2.2 The CFR does not increase indefinitely, as the minimum revenue provision (MRP) is a statutory annual revenue charge which broadly reduces the indebtedness in line with each assets life and so charges the economic consumption of capital assets as they are used.
2.2.3 The Council is asked to approve the CFR projections below:
Estimates of CFR (PI5) and Actual CFR (PI6)
2018/19Actual £000
2019/20Est
£000
2020/21Est
£000
2021/22Est
£000
2022/23Est
£000Capital Financing RequirementCFR – Services 1 Apr 21,858 21,244 21,267 30,770 29,801Movement in Year (614) 23 9,503 (969) (969)Total CFR 21,244 21,267 30,770 29,801 28,832Movement in CFR represented byNet financing need for the year (above)
0 687 10,200 0 0
Less MRP/VRP and other financing movements
(614) (664) (697) (969) (969)
Movement in CFR (614) 23 9,503 (969) (969)

2.2.4 A key aspect of the regulatory and professional guidance is that elected members are aware of the size and scope of any commercial activity in relation to the authority’s overall financial position. The capital expenditure figures shown in 2.1.3 and the details below demonstrate the scope of this activity and, by approving these figures, consider the scale proportionate to the Authority’s remaining activity.
2018/19Actual £000
2019/20Est
£000
2020/21Est
£000
2021/22Est
£000
2022/23Est
£000Capital Financing Requirement – Commercial ActivityCFR – Services 1 Apr 0 0 0 10,000 9,800Movement in Year 0 0 10,000 (200) (200)Total CFR 0 0 10,000 9,800 9,600Movement in CFR represented byNet financing need for the year (above)
0 0 10,000 0 0
Less MRP/VRP and other financing movements
0 0 0 (200) (200)
Movement in CFR 0 0 10,000 (200) (200)
2.3 Core Funds and Expected Investment Balances
2.3.1 The application of resources (capital receipts, reserves etc.) to either finance capital expenditure or to support the revenue budget will have an ongoing impact on investments unless resources are supplemented each year from new sources (asset sales etc.). Detailed below are estimates of the year-end balances for each resource and anticipated cash flow balances.
Year End Resources 2018/19Actual £000
2019/20Est
£000
2020/21Est
£000
2021/22Est
£000
2022/23Est
£000Fund balances / reserves
28,143 21,992 22,072 20,165 18,576
Capital receipts 1,443 50 100 150 200Provisions 518 518 518 518 518Total core funds 30,104 22,560 22,690 20,833 19,294Working capital* (2,000) (2,000) (2,000) (2,000) (2,000)New borrowing** - - (5,000) - -Expected investments 28,104 20,560 15,690 18,833 17,294
*Working capital balances shown are estimated year-end; these may be higher mid-year **Prudential borrowing in line with CIS.

3 BORROWING
3.1 Borrowing objectives
3.1.1 Councils borrow to fund capital expenditure or refinance/reschedule existing borrowing e.g. replace one loan with one at a lower rate. There are 7 types of borrowing that may be considered under this strategy.
Borrowing to fund a scheme that will reduce the Council’s ongoing revenue costs in future years or avoid increased costs in future years.
Borrowing to fund the purchase of essential vehicles, plant and equipment in order to maintain Council functions.
Borrowing in advance of anticipated receipts to enable the Council to invest in capital expenditure before it has the income to fund the investment.
Borrowing to enable the Council to fund a larger capital programme than it is able to do using Government grant and self-financed borrowing.
Borrowing to fund an overspend on a large-scale capital scheme that would otherwise have to be funded from a revenue contribution to capital outlay with major impact on the Council’s revenue budget.
Borrowing to fund a capital development which the Council believes is so essential to the transformation of Rutland, and able, within the context of setting a robust budget and medium term financial strategy, to allocate to the development a specific, ongoing, relatively secure source of funding that can clearly be seen to be able to cover the cost of debt financing for the project over its expected life.
Borrowing to reschedule existing borrowing i.e. replace existing loans with others.
3.1.2 Effectively, the Council works out its capital expenditure plans and then calculates how much it needs to borrow having considered whether it should fund capital expenditure using other options. The Council’s objectives are to:
avoid external borrowing as far as possible (i.e. use other sources of funding first where possible) unless that borrowing yields income or deliver savings beyond the cost of borrowing;
repay borrowing early if this is financially prudent and viable;
reduce its borrowing charge if this represents value for money;
ensure any new borrowing is affordable; and
work within prudential indicator limits.
3.2 Current borrowing portfolio
3.2.1 The Council currently has loans outstanding of £22.436m of which £21.386m are long term loans with the Public Works Loans Board (PWLB). PWLB is managed as part of the UK Debt Management Office, which is a HM Treasury Executive Agency. The remainder is a £630k Local Enterprise Partnership interest free loan which matures in 2023 and an interest free Salix loan of £420k repayable in 2022. Included within the £21.386m is £8.232m of debt that was inherited from Leicestershire in the Local Government Re-organisation in 1997.
3.2.2 The last time the Council actually borrowed from the PWLB was in 2008 to contribute towards funding the Oakham bypass, the value of this loan was £4m.
3.2.3 All PWLB loans have been borrowed on a maturity basis. Interest payments will be made every six months on equal instalments throughout the term of the loan, with the principal being re-paid on the maturity date.
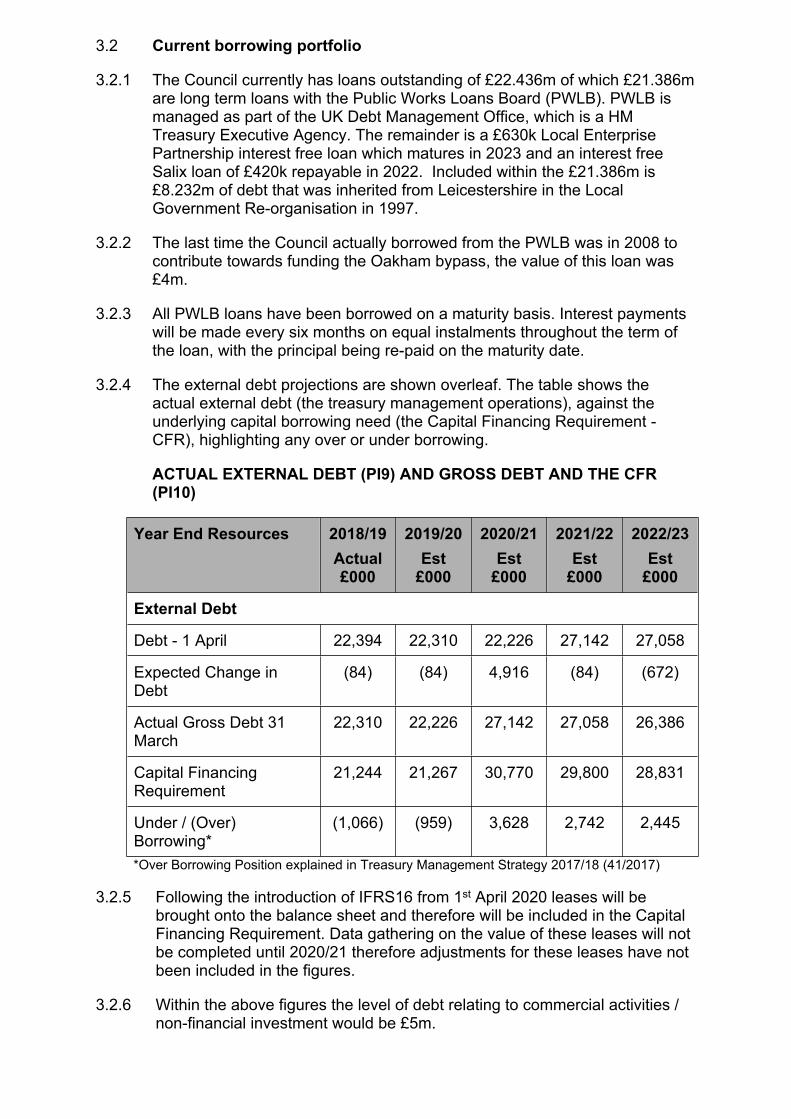
3.2.4 The external debt projections are shown overleaf. The table shows the actual external debt (the treasury management operations), against the underlying capital borrowing need (the Capital Financing Requirement - CFR), highlighting any over or under borrowing.
ACTUAL EXTERNAL DEBT (PI9) AND GROSS DEBT AND THE CFR (PI10)
Year End Resources 2018/19Actual £000
2019/20Est
£000
2020/21Est
£000
2021/22Est
£000
2022/23Est
£000
External Debt
Debt - 1 April 22,394 22,310 22,226 27,142 27,058
Expected Change in Debt
(84) (84) 4,916 (84) (672)
Actual Gross Debt 31 March
22,310 22,226 27,142 27,058 26,386
Capital Financing Requirement
21,244 21,267 30,770 29,800 28,831
Under / (Over) Borrowing*
(1,066) (959) 3,628 2,742 2,445
*Over Borrowing Position explained in Treasury Management Strategy 2017/18 (41/2017)
3.2.5 Following the introduction of IFRS16 from 1st April 2020 leases will be brought onto the balance sheet and therefore will be included in the Capital Financing Requirement. Data gathering on the value of these leases will not be completed until 2020/21 therefore adjustments for these leases have not been included in the figures.
3.2.6 Within the above figures the level of debt relating to commercial activities / non-financial investment would be £5m.

External Debt for commercial activities / non-financial investments
2018/19Actual
2019/20Est
2020/21Est
2021/22Est
2022/23Est
Actual debt at 31 March £000
0 0 5,000 5,000 5,000
Percentage of total external debt %
0 0 18 18 19
3.2.7 Within the range of prudential indicators there are a number of key indicators to ensure that the Council operates its activities within well-defined limits. One of these is that the Council needs to ensure that its gross debt does not, except in the short term, exceed the total of the CFR in the preceding year plus the estimates of any additional CFR for 2020/21 and the following two financial years. This allows some flexibility for limited early borrowing for future years but ensures that borrowing is not undertaken for revenue or speculative purposes.
3.2.8 The Section 151 Officer reports that the Council complied with this prudential indicator in the current year and does not envisage difficulties for the future. This view takes into account current commitments, existing plans and the proposals in this budget report.
3.3 Treasury Indicators: Limits to Borrowing Activity
3.3.1 Operational boundary for external debt (PI6) - This is the limit beyond which external debt is not normally expected to exceed. It is not an absolute limit, it can be temporarily breached. In most cases, this would be a similar figure to the CFR but may be lower or higher depending on the levels of actual debt and the ability to fund under-borrowing by other cash resource.
Operational boundary 2019/20Estimate
£000
2020/21Estimate
£000
2021/22Estimate
£000
2022/23Estimate
£000Debt 23,000 23,000 23,000 23,000Commercial activities/non-financial investments
5,000 5,000 5,000 5,000
Total 28,000 28,000 28,000 28,0003.3.2 Following the introduction of IFRS16 from 1st April 2020 leases will be
brought onto the balance sheet and therefore will be included in the Capital Financing Requirement. The CFR figures in 3.2.4 from 2020/21 onwards do not include these figures as data gathering is not yet completed. The operational boundary and authorised limit may need to be amended in the mid-year report once the detailed impact is known.
3.3.3 Authorised limit for external debt (PI7) - A further key prudential indicator represents a control on the maximum level of borrowing. This represents a limit beyond which external debt is prohibited and this limit needs to be set or revised by the full Council. It reflects the level of external debt which, while not desired, could be afforded in the short term but is not sustainable in the longer term.
3.3.4 This is the statutory limit determined under section 3 (1) of the Local Government Act 2003. The Government retains an option to control either the total of all councils’ plans, or those of a specific council, although this power has not yet been exercised.
3.3.5 The Council is asked to approve the following authorised limit:
Authorised limit 2019/20Estimate
£000
2020/21Estimate
£000
2021/22Estimate
£000
2022/23Estimate
£000Debt 28,000 28,000 28,000 28,000Commercial activities/non-financial investments
5,000 5,000 5,000 5,000
Total 33,000 33,000 33,000 33,000
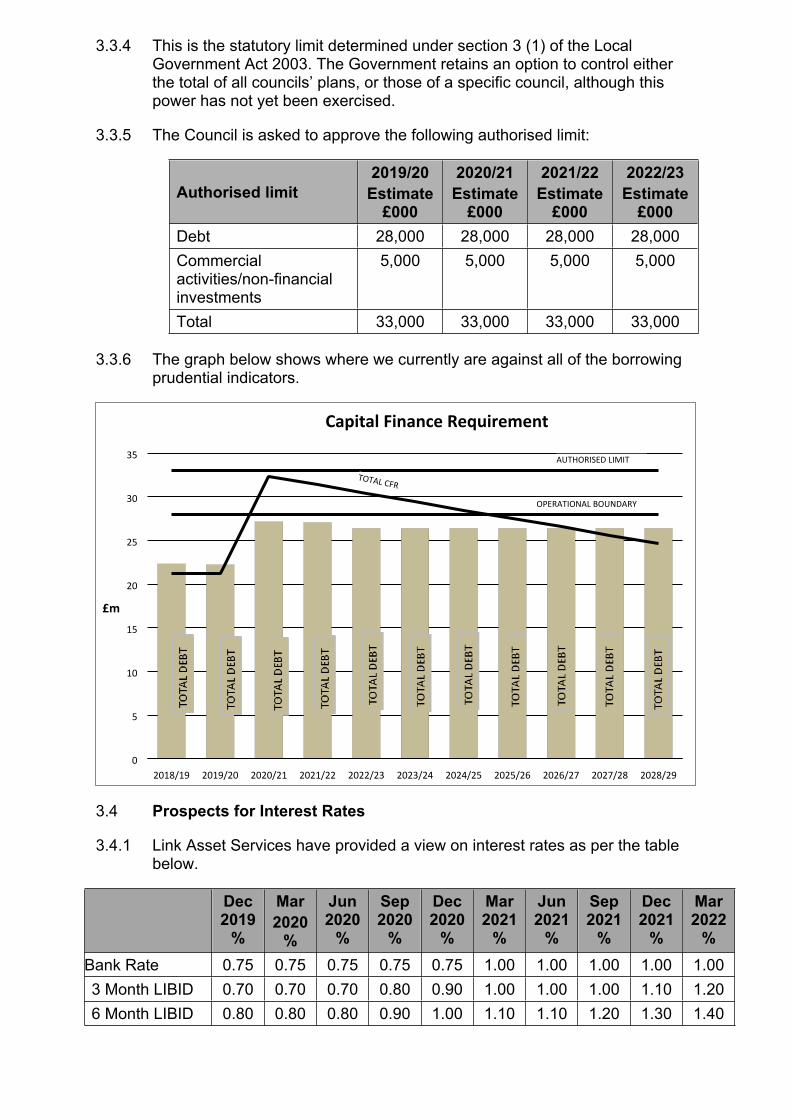
3.3.6 The graph below shows where we currently are against all of the borrowing prudential indicators.
2018/19 2019/20 2020/21 2021/22 2022/23 2023/24 2024/25 2025/26 2026/27 2027/28 2028/290
5
10
15
20
25
30
35
Capital Finance Requirement
£m
TOTAL CFR
OPERATIONAL BOUNDARY
AUTHORISED LIMIT
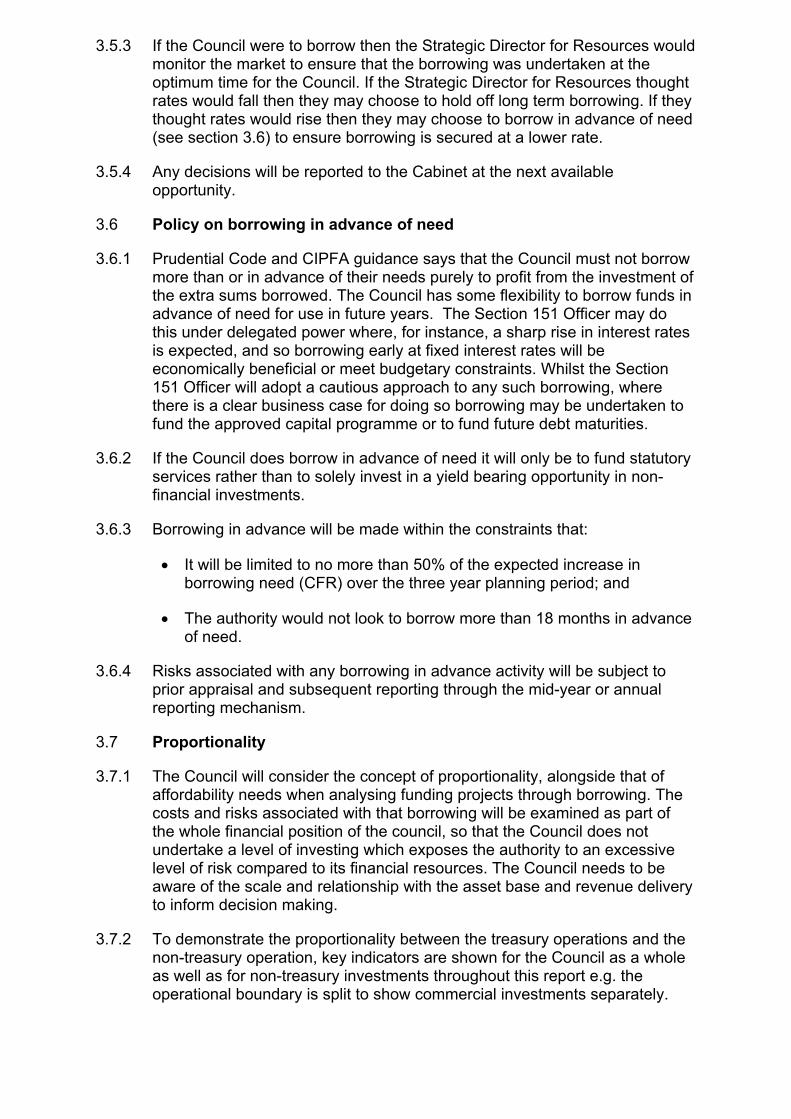
3.4 Prospects for Interest Rates
3.4.1 Link Asset Services have provided a view on interest rates as per the table below.
Dec 2019
%
Mar2020
%
Jun 2020
%
Sep 2020
%
Dec 2020
%
Mar 2021
%
Jun 2021
%
Sep 2021
%
Dec 2021
%
Mar 2022
%Bank Rate 0.75 0.75 0.75 0.75 0.75 1.00 1.00 1.00 1.00 1.003 Month LIBID 0.70 0.70 0.70 0.80 0.90 1.00 1.00 1.00 1.10 1.206 Month LIBID 0.80 0.80 0.80 0.90 1.00 1.10 1.10 1.20 1.30 1.40

12 Month LIBID 1.00 1.00 1.00 1.10 1.20 1.30 1.30 1.40 1.50 1.605 Yr PWLB 2.30 2.40 2.40 2.50 2.50 2.60 2.70 2.80 2.90 2.9010 Yr PWLB 2.60 2.70 2.70 2.70 2.80 2.90 3.00 3.10 3.20 3.2025 Yr PWLB 3.20 3.30 3.40 3.40 3.50 3.60 3.70 3.70 3.80 3.9050 Yr PWLB 3.10 3.20 3.30 3.30 3.40 3.50 3.60 3.60 3.70 3.80Interest rate forecast provided by Link Asset Services on 22 November 2019
3.4.2 Investment and borrowing rates
Investment returns are likely to remain low during 2020/21 with little increase in the following two years. However if major progress was made with an agreed Brexit, then there is upside potential for earnings.
Long term borrowing interest rates had been decreasing during the first half of 2019-20 but then in October there was an increase in PWLB rates of 1%. The unexpected increase would normally require a rethink of local authority treasury management strategy and risk management as the gap between longer term borrowing rates and investment rates has materially widened. However the only significant planned borrowing or refinancing for the Council is on commercial investments should the opportunity arise; therefore there is no requirement to amend borrowing plans based on this.
When an opportunity arises regarding the commercial investments consideration will also need to be given to sourcing funding at cheaper rates from the following:
a) Local authorities (primarily shorter dated maturities)
b) Financial institutions (primarily insurance companies and pension funds but also some banks, out of spot or forward dates)
c) Municipal Bonds Agency (no issuance at present but there is potential)
While the Council will not be able to avoid borrowing to finance new capital expenditure should an opportunity for commercial investment arise, there will be a cost of carry, (the difference between higher borrowing costs and lower investment returns), to any new short or medium-term borrowing that causes a temporary increase in cash balances as this position will, most likely, incur a revenue cost.
3.5 Borrowing Strategy
3.5.1 From 2020/21 the Council is maintaining an under-borrowed position. This means that the capital borrowing need (the Capital Financing Requirement), has not been fully funded with loan debt as cash supporting the Council’s reserves, balances and cash flow has been used as a temporary measure. This strategy is prudent as investment returns are low and counterparty risk is still an issue that needs to be considered.
3.5.2 Against this background and the risks within the economic forecast, caution will be adopted with the 2020/21 treasury operations. The Strategic Director of Resources will monitor interest rates in financial markets and adopt a pragmatic approach to changing circumstances.
3.5.3 If the Council were to borrow then the Strategic Director for Resources would monitor the market to ensure that the borrowing was undertaken at the optimum time for the Council. If the Strategic Director for Resources thought rates would fall then they may choose to hold off long term borrowing. If they thought rates would rise then they may choose to borrow in advance of need (see section 3.6) to ensure borrowing is secured at a lower rate.
3.5.4 Any decisions will be reported to the Cabinet at the next available opportunity.
3.6 Policy on borrowing in advance of need
3.6.1 Prudential Code and CIPFA guidance says that the Council must not borrow more than or in advance of their needs purely to profit from the investment of the extra sums borrowed. The Council has some flexibility to borrow funds in advance of need for use in future years. The Section 151 Officer may do this under delegated power where, for instance, a sharp rise in interest rates is expected, and so borrowing early at fixed interest rates will be economically beneficial or meet budgetary constraints. Whilst the Section 151 Officer will adopt a cautious approach to any such borrowing, where there is a clear business case for doing so borrowing may be undertaken to fund the approved capital programme or to fund future debt maturities.
3.6.2 If the Council does borrow in advance of need it will only be to fund statutory services rather than to solely invest in a yield bearing opportunity in non-financial investments.
3.6.3 Borrowing in advance will be made within the constraints that:
It will be limited to no more than 50% of the expected increase in borrowing need (CFR) over the three year planning period; and
The authority would not look to borrow more than 18 months in advance of need.
3.6.4 Risks associated with any borrowing in advance activity will be subject to prior appraisal and subsequent reporting through the mid-year or annual reporting mechanism.
3.7 Proportionality
3.7.1 The Council will consider the concept of proportionality, alongside that of affordability needs when analysing funding projects through borrowing. The costs and risks associated with that borrowing will be examined as part of the whole financial position of the council, so that the Council does not undertake a level of investing which exposes the authority to an excessive level of risk compared to its financial resources. The Council needs to be aware of the scale and relationship with the asset base and revenue delivery to inform decision making.
3.7.2 To demonstrate the proportionality between the treasury operations and the non-treasury operation, key indicators are shown for the Council as a whole as well as for non-treasury investments throughout this report e.g. the operational boundary is split to show commercial investments separately.

3.8 Debt repayment and rescheduling
3.8.1 The graph below demonstrates when PWLB debt is due to be repaid.
2033
/34
2043
/44
2044
/45
2045
/46
2046
/47
2047
/48
2048
/49
2049
/50
2050
/51
2051
/52
2052
/53
2053
/54
2054
/55
2055
/56
2056
/57
2057
/58
2058
/59
2059
/60
0.000.501.001.502.002.503.003.504.004.505.00
PWLB Loan MaturitiesM
illion
s
3.8.2 As short-term borrowing rates will be considerably cheaper than longer term fixed interest rates, there may be potential opportunities to generate savings by switching from long-term debt to short-term debt. However, these savings will need to be considered in the light of the current treasury position and the size of the cost of debt repayment (premiums incurred). The rate rise mentioned in 3.4.2 will have an impact on the opportunity to undertake refinancing.
3.8.3 The reasons for any rescheduling to take place will include:
the generation of cash savings and / or discounted cash flow savings;
helping to fulfil the treasury strategy;
enhance the balance of the portfolio (amend the maturity profile and/or the balance of volatility).
3.8.4 Consideration will also be given to identify if there is any residual potential for making savings by running down investment balances to repay debt prematurely as short term rates on investments are likely to be lower than rates paid on current debt.
3.8.5 All rescheduling will be reported to the Cabinet at the earliest meeting following its action.

4 ANNUAL INVESTMENT STRATEGY
4.1 Investment overview
4.1.1 The Council receives substantial income from council tax, business rates and central government. The majority of council tax and business rates payments are received between April and January, with expenditure being fairly static throughout the year.
At any point of time in the year, the Council can have between £32m - £42m available to invest. The estimated level of investments at year end based on the current cash flow calculations and for the next few years is shown Overleaf. The total investments at Quarter 2 show the estimated level of investment at the mid-point during the financial year.
2019/20 Actual£000
2019/20 Forecast
£000
2020/21 Estimate
£000
2021/22 Estimate
£000
2022/23 Estimate
£000
Total Investments at Quarter 2
38,888 24,000 23,000 22,000
Total Investments at 31 March
30,000 22,000 21,000 20,000
4.1.2 The Council will invest surplus money in various ways to get a return on balances thus generating extra income.
4.2 Investment policy objectives
4.2.1 The MHCLG and CIPFA have extended the meaning of ‘investments’ to include both financial and non-financial investments. This report deals solely with financial investments, as managed by the treasury management team. Non-financial investments, essentially the purchase of income yielding assets, are covered in the Capital Strategy.
4.2.2 The Council’s investment policy has regard to the MHCLG’s Guidance on Local Government Investments (“the Guidance”); CIPFA Treasury Management in Public Services Code of Practice and Cross Sectoral Guidance Notes (“the CIPFA TM Code”) and CIPFA Treasury Management Guidance Notes 2018.
4.2.3 This policy only covers treasury investments. The objectives of non-treasury investments are covered in the CIS.
4.2.4 The Council’s investment strategy primary objectives, in order of importance are:
safeguarding the re-payment of the principal and interest of its investments on time – losing any funds like in the case of Icelandic banks would be very significant in this financial climate;
adequate liquidity – the Council does not want to run short of money so it cannot pay its bills or does not have money available to make investments in capital expenditure;
maximising the investment return – this is clearly important but the Council does not want to maximise returns at the expense of the first two objectives.
4.2.5 These objectives filter through this strategy.
4.3 Investment rules
4.3.1 In accordance with the above guidance from the MHCLG and CIPFA and in order to minimise the risk to investments, the Council applies minimum acceptable credit criteria in order to generate a list of highly creditworthy counterparties which also enables diversification and thus avoidance of concentration risk. The key ratings used to monitor counterparties are the short term and long term ratings.
4.3.2 The Council engages with its advisors to monitor markets to support the ratings systems which ensures the Council is aware of the standing of the bank / building society.
4.3.3 Other information sources used will include the financial press, share price and other such information pertaining to the banking sector in order to establish the most robust scrutiny process on the suitability of potential investment counterparties.
4.4 Creditworthiness policy
4.4.1 The primary principle governing the Council’s investment criteria is the security of its investments, although the yield or return on the investment is also a key consideration. After this main principle the Council will ensure:
It maintains a policy covering both the categories of investment types it will invest in, criteria for choosing investment counterparties with adequate security and monitoring their security. This is set out in the Specified and Non-Specified investment sections below.
It has sufficient liquidity in its investments. For this purpose it will set out procedures for determining the maximum periods for which funds may prudently be committed. These procedures also apply to the Council’s prudential indicators covering the maximum principal sums invested.
4.4.2 The Section 151 Officer will maintain a counterparty list in compliance with the following criteria and will revise the criteria and submit them to Council for approval as necessary. This criteria is separate to that which chooses Specified and Non-Specified investments as it provides an overall pool of counterparties considered high quality the Council may use rather than defining what its investments are.
4.4.3 Typically, the minimum credit ratings criteria the Council use will be a short term rating (Fitch or equivalents) of F1 and a long term rating of A-. There may be occasions when the counterparty ratings from one or two of the rating agencies are marginally lower than these ratings but may still be used. In these instances, when counterparty ratings from one of the credit rating agencies (Fitch) meet the minimum criteria and also other relevant market data shows a stable position the counterparty can be used. If there is a major disparity between the counterparty ratings issued by Fitch and the other credit rating agencies then the counterparty will not be used.
4.4.4 Credit rating information is supplied by our treasury consultants daily on all active counterparties that comply with the criteria below. Any counterparty failing to meet the criteria would be omitted from the counterparty (dealing) list. Any rating changes, rating watches (notification of a likely change), rating outlooks (notification of the longer-term bias outside the central rating view) are provided to officers almost immediately after they occur and this information is considered before dealing. For instance for overseas counterparties a negative rating watch at the minimum Council criteria will be suspended from use, with all others being reviewed in light of market.
4.4.5 Most UK counterparties have been on negative watch since February 2019; due to the economic uncertainty arising from Brexit. In most cases the downgrade of the credit rating of a UK counterparty solely due to a downgrade of the credit rating of the UK government does not indicate the counterparty has become financially weaker; and therefore they should not be removed from the list of suitable counterparties. Therefore the negative ratings watch will only be a factor in the selection process for overseas banks or if the negative rating applies only to one or several counterparties.
4.4.6 The criteria for providing a pool of high quality investment counterparties (both Specified and Non-specified investments) is:
Banks 1 - good credit quality – the Council will only use banks which:a) are UK banks; and/orb) are non-UK and domiciled in a country which has a minimum
sovereign Long Term rating of AA+c) and have, as a minimum, the following Fitch (where rated): Short Term
A-/ Long Term F1
Banks 2 – Part nationalised UK bank – Royal Bank of Scotland ring-fenced operations. These banks can be included provided they continue to be part nationalised or meet the ratings in Banks 1 above.
Banks 3 – The Council’s own banker for transactional purposes if the bank falls below the above criteria, in this case balances will be minimised in both monetary size and time invested.
Building societies. The Council will only use societies which:a) Meet the ratings for banks outlined above;b) Have assets in excess of £1bn;
Money Market Funds (MMFs) CNAV LVNAV
UK Government (including gilts, Treasury Bills and the DMADF)
Local authorities, parish councils etc.
Property Funds
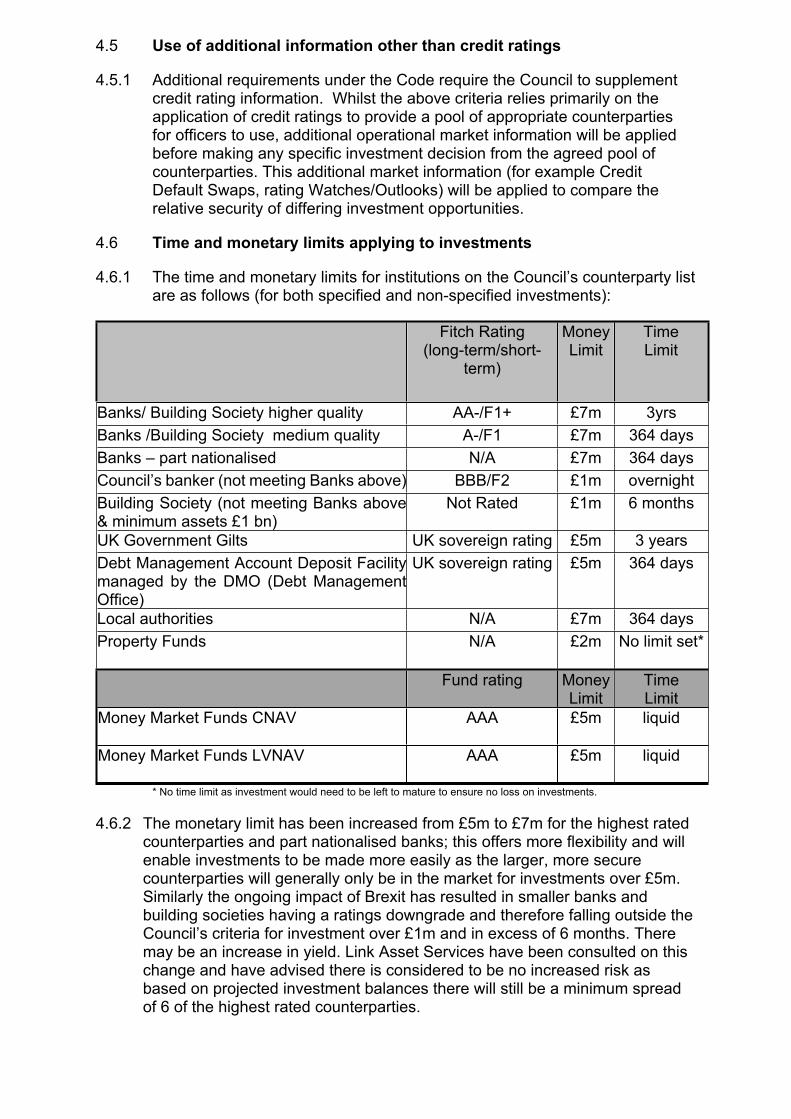
4.5 Use of additional information other than credit ratings
4.5.1 Additional requirements under the Code require the Council to supplement credit rating information. Whilst the above criteria relies primarily on the application of credit ratings to provide a pool of appropriate counterparties for officers to use, additional operational market information will be applied before making any specific investment decision from the agreed pool of counterparties. This additional market information (for example Credit Default Swaps, rating Watches/Outlooks) will be applied to compare the relative security of differing investment opportunities.
4.6 Time and monetary limits applying to investments
4.6.1 The time and monetary limits for institutions on the Council’s counterparty list are as follows (for both specified and non-specified investments):
Fitch Rating(long-term/short-
term)
MoneyLimit
Time Limit
Banks/ Building Society higher quality AA-/F1+ £7m 3yrsBanks /Building Society medium quality A-/F1 £7m 364 daysBanks – part nationalised N/A £7m 364 daysCouncil’s banker (not meeting Banks above) BBB/F2 £1m overnightBuilding Society (not meeting Banks above & minimum assets £1 bn)
Not Rated £1m 6 months
UK Government Gilts UK sovereign rating £5m 3 yearsDebt Management Account Deposit Facility managed by the DMO (Debt Management Office)
UK sovereign rating £5m 364 days
Local authorities N/A £7m 364 daysProperty Funds N/A £2m No limit set*
Fund rating MoneyLimit
TimeLimit
Money Market Funds CNAV AAA £5m liquid
Money Market Funds LVNAV AAA £5m liquid
* No time limit as investment would need to be left to mature to ensure no loss on investments.
4.6.2 The monetary limit has been increased from £5m to £7m for the highest rated counterparties and part nationalised banks; this offers more flexibility and will enable investments to be made more easily as the larger, more secure counterparties will generally only be in the market for investments over £5m. Similarly the ongoing impact of Brexit has resulted in smaller banks and building societies having a ratings downgrade and therefore falling outside the Council’s criteria for investment over £1m and in excess of 6 months. There may be an increase in yield. Link Asset Services have been consulted on this change and have advised there is considered to be no increased risk as based on projected investment balances there will still be a minimum spread of 6 of the highest rated counterparties.

4.6.3 The monetary limit has been increased for Local Authorities from £5m to £7m; Local Authorities have always been considered as safe counterparties having never defaulted in history. Due to the increase in PWLB borrowing rate discussed in 3.4.2 there is an increased appetite in Local Authorities for borrowing from other Local Authorities. There is no financial risk from this change and there may be an increase in yield.
4.7 Other considerations
4.7.1 Due care will be taken to consider the exposure of the Council’s total investment portfolio to non-specified investments, countries, groups and sectors.
Country limit. The Council has determined that it will only use approved counterparties from the UK and from countries with a minimum sovereign credit rating of AA+ from Fitch or equivalent. The list of countries that qualify using this credit criteria as at the date of this report are shown in Annexe A. This list will be added to, or deducted from, by officers should ratings change in accordance with this policy.
Other limits.
4.7.2 In addition:
no more than 10% will be placed with any non-UK country at any time;
limits in place above will apply to a group of companies.
4.8 Investment approach
4.8.1 As per our overall objectives, we ensure that these surplus balances are managed in a way to maximise the income potential whilst having regard to security risk.
4.8.2 The Council’s approach is influenced by numerous issues:
Cash flow – when will the Council need the funds to pay general running costs of the Council or fund capital investment activity
The vehicles allowed for investment as outlined in this strategy as referenced on 4.4.6
The rate of return on offer - Bank Rate is forecast to stay at 0.75% until March 2021 and not to rise above 1.25% until June 2022.
4.8.3 Our focus is on traditional investments e.g. deposits for up to 12 month period – this is in line with the advice from our consultants (Link Asset Services). We will also consider longer term options (Government bonds, Property Funds etc.) once the position on Commercial Investments is clear. For example, placing funds in long term investments may not be an option depending on capital expenditure and investment plans.
4.8.4 Investment treasury indicator and limit - total principal funds invested for greater than 365 days. These limits are set with regard to the Council’s

liquidity requirements and to reduce the need for early sale of an investment, and are based on the availability of funds after each year-end.
The Council is asked to approve the following treasury indicator and limit:
Upper limit on total principal sums invested for periods of longer than a year (PI12)
£000 2020/21 2021/22 2022/23
Principal sums invested for longer than 365 days
0 0 0
4.9 Investment returns expectations and benchmarking
4.9.1 The Council will use an investment benchmark to assess the investment performance of investment portfolio of 6 months LIBOR.
4.9.2 Over the medium term, the Council expects to make returns as shown in the table overleaf. The investment interest income forecast is:
2019/20 £000
2020/21 £000
2021/22 £000
2022/23 £000
2023/24 £000
300 300 240 240 240
This forecast is based on estimated balances assuming £5m is utilised on commercial investments, should this not occur then it is anticipated investment income will be in line with 2019/20.
4.9.3 This income forecast is based on treasury investments and does not include interest generated from commercial investments.
4.9.4 Security – Each counterparty the Council invests in has a risk of default (a calculated percentage to demonstrate the potential loss on the investment). The Council’s maximum security risk benchmark for the current portfolio, is:
0.10% historic risk of default when compared to the whole portfolio. The table below demonstrates a financial representation of how much the Council would stand to lose at 0.10%.
2019/20 Forecast
£000
2020/21 Estimate
£000
2021/22 Estimate
£000
2022/23 Estimate
£000Total Investments at 31 March
30,000 22,000 21,000 20,000
Revenue impact of risk of default at 0.10%
30 22 21 20
4.9.5 Risks arising from commercial investments will be assessed during the evaluation process as detailed in the CIS.
4.9.6 Liquidity – in respect of this area the Council seeks to maintain:

Bank overdraft - £0m
Liquid short term deposits of at least £1m available with a week’s notice.
4.9.7 Yield - local measures of yield benchmarks
Investments – internal returns above the 6 month LIBOR rate
4.10 End of Year Investment Report
4.10.1 At the end of the financial year, the Council will report on its investment activity as part of its Annual Treasury Report.

5 THE CAPITAL PRUDENTIAL AND TREASURY INDICATORS 2020/21 – 2022/23 AND MRP STATEMENT
5.1 Capital Expenditure
5.1.1 The Council’s capital expenditure plans (see 2.1.3) are the key driver of treasury management activity. The output of the capital expenditure plans is reflected in the prudential indicators, which are designed to assist members’ overview and confirm capital expenditure plans.
5.2 Minimum Revenue Provision Policy
5.2.1 Minimum revenue provision (MRP) policy statement - The Council is required to pay off an element of the accumulated General Fund capital spend each year (the CFR) through a revenue charge (the minimum revenue provision - MRP), although it is also allowed to undertake additional voluntary payments if required (voluntary revenue provision - VRP).
5.2.2 MHCLG regulations have been issued which require the full Council to approve an MRP Statement in advance of each year. A variety of options are provided to councils, so long as there is a prudent provision. The Council is recommended to approve the following MRP Statement
For capital expenditure incurred before 1 April 2008 The Council will reduce on a straight line basis over 50 years.
From 1 April 2008 for all unsupported borrowing (including PFI and finance leases) the MRP policy will be (either / and):
a) Asset life method – MRP will be based on the estimated life of the assets, in accordance with the regulations (this option must be applied for any expenditure capitalised under a Capitalisation Direction);
b) Depreciation method – MRP will follow standard depreciation accounting procedures. These options provide for a reduction in the borrowing need over approximately the asset’s life.
From 1 April 2020 for all leases where the Council is the lessee the Council will reduce in line with the lease payments over the life of the asset.
5.2.3 The new accounting standard IFRS16 requires a change in the MRP policy. From 1st April 2020 leases where the Council is the lessee (the Council will have a right to the use of lease property) will now be recognised on the balance sheet and will increase the CFR. The MRP policy will therefore include the clearing of this increase to the CFR as lease payments are made, this will be over the life of the asset.
5.2.4 MRP Overpayments - A change introduced by the revised MHCLG MRP Guidance was the allowance that any charges made over the statutory minimum revenue provision (MRP), voluntary revenue provision or overpayments, can, if needed, be reclaimed in later years if deemed necessary or prudent. In order for these sums to be reclaimed for use in the budget, this policy must disclose the cumulative overpayment made each year. Up until the 31 March 2020 the total VRP overpayments were £1.41m in 2013/14 and £0.597m in 2015/16 giving a total MRP overpayment of

£2.01m.
5.3 Affordability Prudential Indicators
5.3.1 The previous sections cover the overall capital and control of borrowing prudential indicators, but within this framework prudential indicators are required to assess the affordability of the capital investment plans. These provide an indication of the impact of the capital investment plans on the Council’s overall finances. The Council is asked to approve the following indicators:
5.3.2 Estimates of Financing Costs to Net Revenue Stream (PI1) and Actual financing costs to net revenue stream (PI2) - This indicator identifies the trend in the cost of capital (borrowing and other long term obligation costs net of investment income) against the net revenue stream.
% 2018/19
Actual
2019/20
Estimate
2020/21
Estimate
2021/22
Estimate
2022/23
Estimate
Services 3.79 3.97 4.41 4.03 3.89
The estimates of financing costs include current commitments and the proposals in the budget report. This indicator has not been split between services and commercial activities because the MRP charge for the borrowing to fund Investment Properties will not commence until 2020/21.
5.3.3 Incremental Impact of Capital Investment Decisions on Band D Council Tax (PI13). This indicator identifies the revenue costs associated with proposed changes to the three year capital programme recommended in this budget report compared to the Council’s existing approved commitments and current plans. The assumptions are based on the budget, but will invariably include some estimates, such as the level of Government support, which are not published over a three year period.
Council Tax - Band D
2018/19Actual
£
2019/20Estimate
£
2020/21Estimate
£
2021/22Estimate
£
2022/23Estimate
£Services 0.16% 0% 0.17% 0.42% 0%Commercial Investments 0% 0% 0% 1.74% 0%
5.3.4 Upper and lower of maturity structure of borrowing (fixed & variable) (P11)
These gross limits are set to reduce the Council’s exposure to large fixed rate sums falling due for refinancing, and are required for upper and lower limits.
The Council is asked to approve the following treasury indicators and limits:
Maturity structure of fixed interest rate borrowing 2020/21

Lower UpperUnder 12 months 0% 25%12 months to 2 years 0% 25%2 years to 5 years 0% 20%5 years to 10 years 0% 20%10 years and above 0% 100%Maturity structure of variable interest rate borrowing 2020/21
Lower UpperUnder 12 months 0% 25%12 months to 2 years 0% 25%2 years to 5 years 0% 20%5 years to 10 years 0% 20%10 years to 20 years 0% 100%
5.3.5 Debt to net service expenditure (PI14) - This indicator shows gross debt as a percentage of net service expenditure. Net service expenditure is considered to be a proxy for the size and financial strength of a local authority.
Services£’000
Commercial Activities
£’000Gross Debt 22,142 5,000Net Service Expenditure 38,046 38,046Debt to net service expenditure % 58% 13%
ANNEXE A1 TREASURY MANAGEMENT PRACTICES (TMP1) COUNTERPARTY AND CREDIT RISK MANAGEMENT
The MHCLG issued Investment Guidance in 2018, and this forms the structure of the Council’s policy below. These guidelines do not apply to either trust funds or pension funds which operate under a different regulatory regime.
The key intention of the Guidance is to maintain the current requirement for councils to invest prudently, and that priority is given to security and liquidity before yield. In order to facilitate this objective the guidance requires this Council to have regard to the CIPFA publication Treasury Management in the Public Services: Code of Practice and Cross-Sectoral Guidance Notes. This Council has adopted the Code and will apply its principles to all investment activity. In accordance with the Code, the Strategic Director for Resources has produced its treasury management practices (TMPs). This part, TMP 1(1), covering investment counterparty policy requires approval each year.
Annual investment strategy - The key requirements of both the Code and the investment guidance are to set an annual investment strategy, as part of its annual treasury strategy for the following year, covering the identification and approval of following:
The strategy guidelines for choosing and placing investments, particularly non-specified investments.
The principles to be used to determine the maximum periods for which funds can be committed.
Specified investments that the Council will use. These are high security (i.e. high credit rating, although this is defined by the Council, and no guidelines are given), and high liquidity investments in sterling and with a maturity of no more than a year.
Non-specified investments, clarifying the greater risk implications, identifying the general types of investment that may be used and a limit to the overall amount of various categories that can be held at any time.
The investment policy proposed for the Council is:
Strategy guidelines – The main strategy guidelines are contained in the body of the treasury strategy statement.
Specified investments – These investments are sterling investments of not more than one-year maturity, or those which could be for a longer period but where the Council has the right to be repaid within 12 months if it wishes. These are considered low risk assets where the possibility of loss of principal or investment income is small. These would include sterling investments which would not be defined as capital expenditure with:1. The UK Government (such as the Debt Management Account deposit facility, UK
treasury bills or a gilt with less than one year to maturity).2. Supranational bonds of less than one year’s duration.3. A local authority, housing association, parish council or community council.4. Pooled investment vehicles (such as money market funds) that have been
awarded a high credit rating by a credit rating agency. This covers pooled investment vehicles, such as money market funds, rated AAA by Standard and Poor’s, Moody’s and / or Fitch rating agencies.
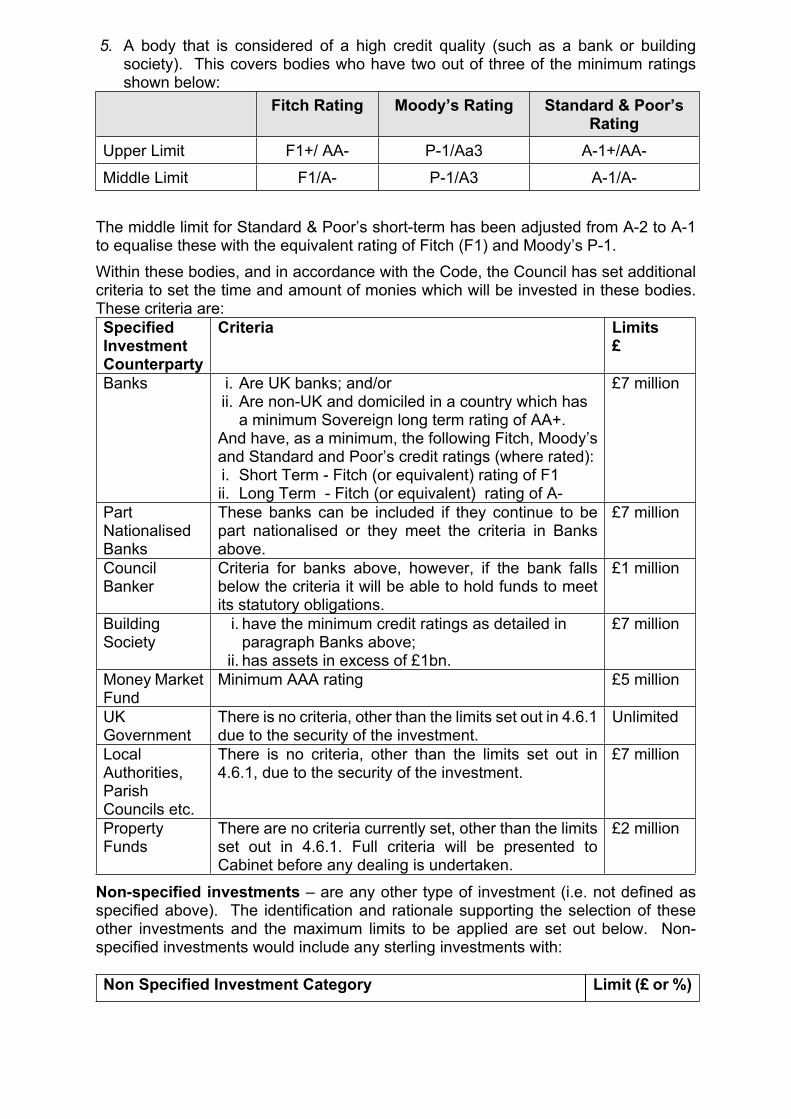
5. A body that is considered of a high credit quality (such as a bank or building society). This covers bodies who have two out of three of the minimum ratings shown below:
Fitch Rating Moody’s Rating Standard & Poor’s Rating
Upper Limit F1+/ AA- P-1/Aa3 A-1+/AA-Middle Limit F1/A- P-1/A3 A-1/A-
The middle limit for Standard & Poor’s short-term has been adjusted from A-2 to A-1 to equalise these with the equivalent rating of Fitch (F1) and Moody’s P-1.Within these bodies, and in accordance with the Code, the Council has set additional criteria to set the time and amount of monies which will be invested in these bodies. These criteria are: Specified Investment Counterparty
Criteria Limits £
Banks i. Are UK banks; and/orii. Are non-UK and domiciled in a country which has
a minimum Sovereign long term rating of AA+.And have, as a minimum, the following Fitch, Moody’s and Standard and Poor’s credit ratings (where rated):i. Short Term - Fitch (or equivalent) rating of F1ii. Long Term - Fitch (or equivalent) rating of A-
£7 million
Part Nationalised Banks
These banks can be included if they continue to be part nationalised or they meet the criteria in Banks above.
£7 million
Council Banker
Criteria for banks above, however, if the bank falls below the criteria it will be able to hold funds to meet its statutory obligations.
£1 million
Building Society
i. have the minimum credit ratings as detailed in paragraph Banks above;
ii. has assets in excess of £1bn.
£7 million
Money Market Fund
Minimum AAA rating £5 million
UK Government
There is no criteria, other than the limits set out in 4.6.1 due to the security of the investment.
Unlimited
Local Authorities, Parish Councils etc.
There is no criteria, other than the limits set out in 4.6.1, due to the security of the investment.
£7 million
Property Funds
There are no criteria currently set, other than the limits set out in 4.6.1. Full criteria will be presented to Cabinet before any dealing is undertaken.
£2 million
Non-specified investments – are any other type of investment (i.e. not defined as specified above). The identification and rationale supporting the selection of these other investments and the maximum limits to be applied are set out below. Non-specified investments would include any sterling investments with:
Non Specified Investment Category Limit (£ or %)
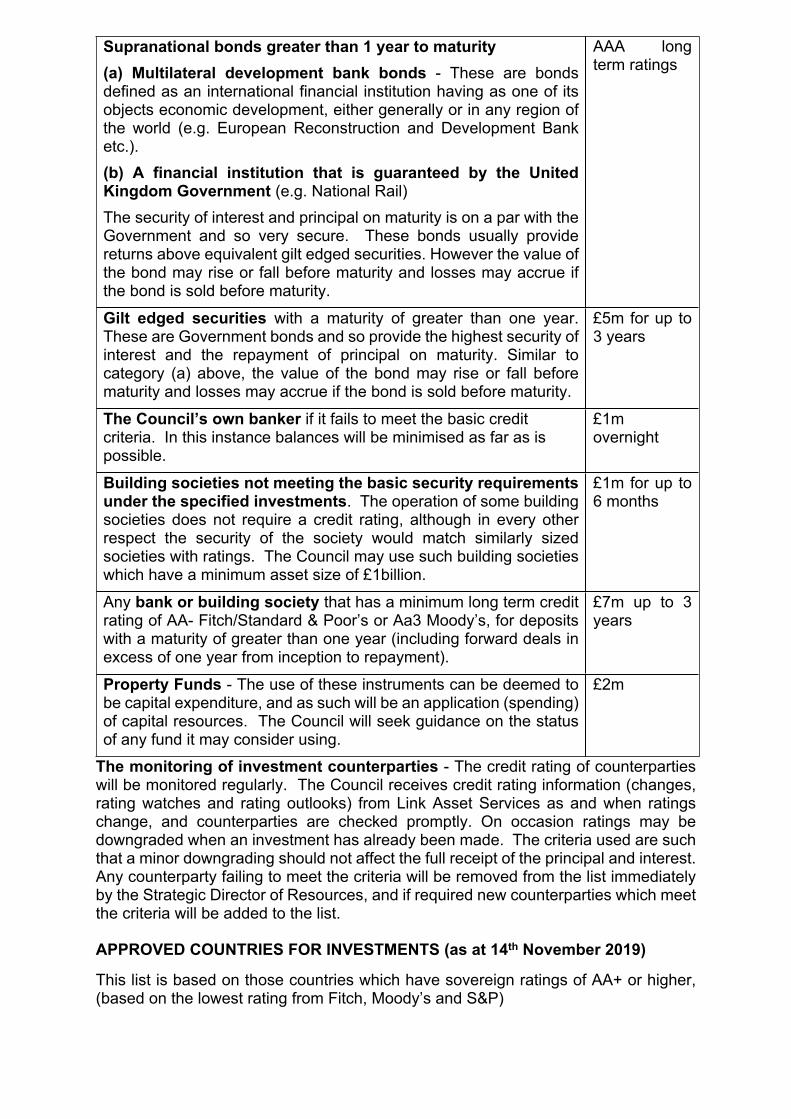
Supranational bonds greater than 1 year to maturity(a) Multilateral development bank bonds - These are bonds defined as an international financial institution having as one of its objects economic development, either generally or in any region of the world (e.g. European Reconstruction and Development Bank etc.). (b) A financial institution that is guaranteed by the United Kingdom Government (e.g. National Rail)The security of interest and principal on maturity is on a par with the Government and so very secure. These bonds usually provide returns above equivalent gilt edged securities. However the value of the bond may rise or fall before maturity and losses may accrue if the bond is sold before maturity.
AAA long term ratings
Gilt edged securities with a maturity of greater than one year. These are Government bonds and so provide the highest security of interest and the repayment of principal on maturity. Similar to category (a) above, the value of the bond may rise or fall before maturity and losses may accrue if the bond is sold before maturity.
£5m for up to 3 years
The Council’s own banker if it fails to meet the basic credit criteria. In this instance balances will be minimised as far as is possible.
£1m overnight
Building societies not meeting the basic security requirements under the specified investments. The operation of some building societies does not require a credit rating, although in every other respect the security of the society would match similarly sized societies with ratings. The Council may use such building societies which have a minimum asset size of £1billion.
£1m for up to 6 months
Any bank or building society that has a minimum long term credit rating of AA- Fitch/Standard & Poor’s or Aa3 Moody’s, for deposits with a maturity of greater than one year (including forward deals in excess of one year from inception to repayment).
£7m up to 3 years
Property Funds - The use of these instruments can be deemed to be capital expenditure, and as such will be an application (spending) of capital resources. The Council will seek guidance on the status of any fund it may consider using.
£2m
The monitoring of investment counterparties - The credit rating of counterparties will be monitored regularly. The Council receives credit rating information (changes, rating watches and rating outlooks) from Link Asset Services as and when ratings change, and counterparties are checked promptly. On occasion ratings may be downgraded when an investment has already been made. The criteria used are such that a minor downgrading should not affect the full receipt of the principal and interest. Any counterparty failing to meet the criteria will be removed from the list immediately by the Strategic Director of Resources, and if required new counterparties which meet the criteria will be added to the list.
APPROVED COUNTRIES FOR INVESTMENTS (as at 14th November 2019)
This list is based on those countries which have sovereign ratings of AA+ or higher, (based on the lowest rating from Fitch, Moody’s and S&P)

AAA Australia Canada Denmark Germany Luxembourg Netherlands Norway Singapore Sweden Switzerland
AA+ Finland U.S.A.
ANNEXE A2 - PUBLIC WORKS LOAN BOARD (PWLB) DEBT ANALYSIS
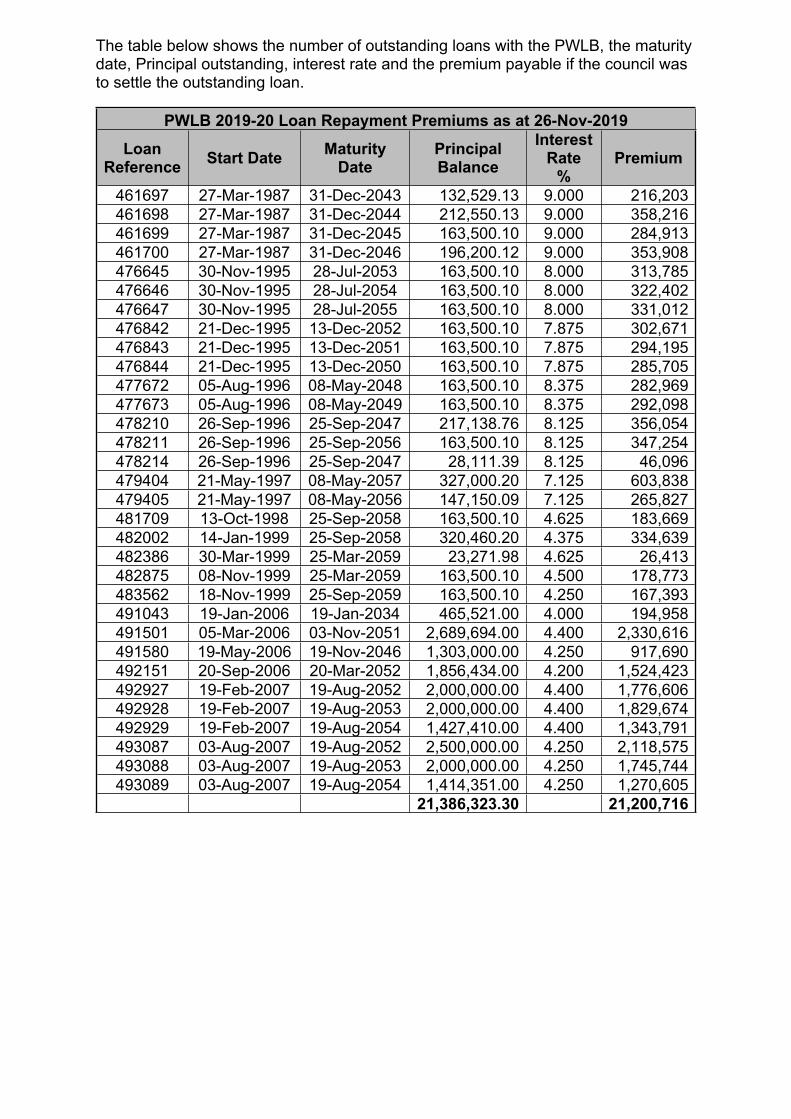
The table below shows the number of outstanding loans with the PWLB, the maturity date, Principal outstanding, interest rate and the premium payable if the council was to settle the outstanding loan.
PWLB 2019-20 Loan Repayment Premiums as at 26-Nov-2019Loan
Reference Start Date Maturity Date
Principal Balance
Interest Rate
%Premium
461697 27-Mar-1987 31-Dec-2043 132,529.13 9.000 216,203461698 27-Mar-1987 31-Dec-2044 212,550.13 9.000 358,216461699 27-Mar-1987 31-Dec-2045 163,500.10 9.000 284,913461700 27-Mar-1987 31-Dec-2046 196,200.12 9.000 353,908476645 30-Nov-1995 28-Jul-2053 163,500.10 8.000 313,785476646 30-Nov-1995 28-Jul-2054 163,500.10 8.000 322,402476647 30-Nov-1995 28-Jul-2055 163,500.10 8.000 331,012476842 21-Dec-1995 13-Dec-2052 163,500.10 7.875 302,671476843 21-Dec-1995 13-Dec-2051 163,500.10 7.875 294,195476844 21-Dec-1995 13-Dec-2050 163,500.10 7.875 285,705477672 05-Aug-1996 08-May-2048 163,500.10 8.375 282,969477673 05-Aug-1996 08-May-2049 163,500.10 8.375 292,098478210 26-Sep-1996 25-Sep-2047 217,138.76 8.125 356,054478211 26-Sep-1996 25-Sep-2056 163,500.10 8.125 347,254478214 26-Sep-1996 25-Sep-2047 28,111.39 8.125 46,096479404 21-May-1997 08-May-2057 327,000.20 7.125 603,838479405 21-May-1997 08-May-2056 147,150.09 7.125 265,827481709 13-Oct-1998 25-Sep-2058 163,500.10 4.625 183,669482002 14-Jan-1999 25-Sep-2058 320,460.20 4.375 334,639482386 30-Mar-1999 25-Mar-2059 23,271.98 4.625 26,413482875 08-Nov-1999 25-Mar-2059 163,500.10 4.500 178,773483562 18-Nov-1999 25-Sep-2059 163,500.10 4.250 167,393491043 19-Jan-2006 19-Jan-2034 465,521.00 4.000 194,958491501 05-Mar-2006 03-Nov-2051 2,689,694.00 4.400 2,330,616491580 19-May-2006 19-Nov-2046 1,303,000.00 4.250 917,690492151 20-Sep-2006 20-Mar-2052 1,856,434.00 4.200 1,524,423492927 19-Feb-2007 19-Aug-2052 2,000,000.00 4.400 1,776,606492928 19-Feb-2007 19-Aug-2053 2,000,000.00 4.400 1,829,674492929 19-Feb-2007 19-Aug-2054 1,427,410.00 4.400 1,343,791493087 03-Aug-2007 19-Aug-2052 2,500,000.00 4.250 2,118,575493088 03-Aug-2007 19-Aug-2053 2,000,000.00 4.250 1,745,744493089 03-Aug-2007 19-Aug-2054 1,414,351.00 4.250 1,270,605
21,386,323.30 21,200,716
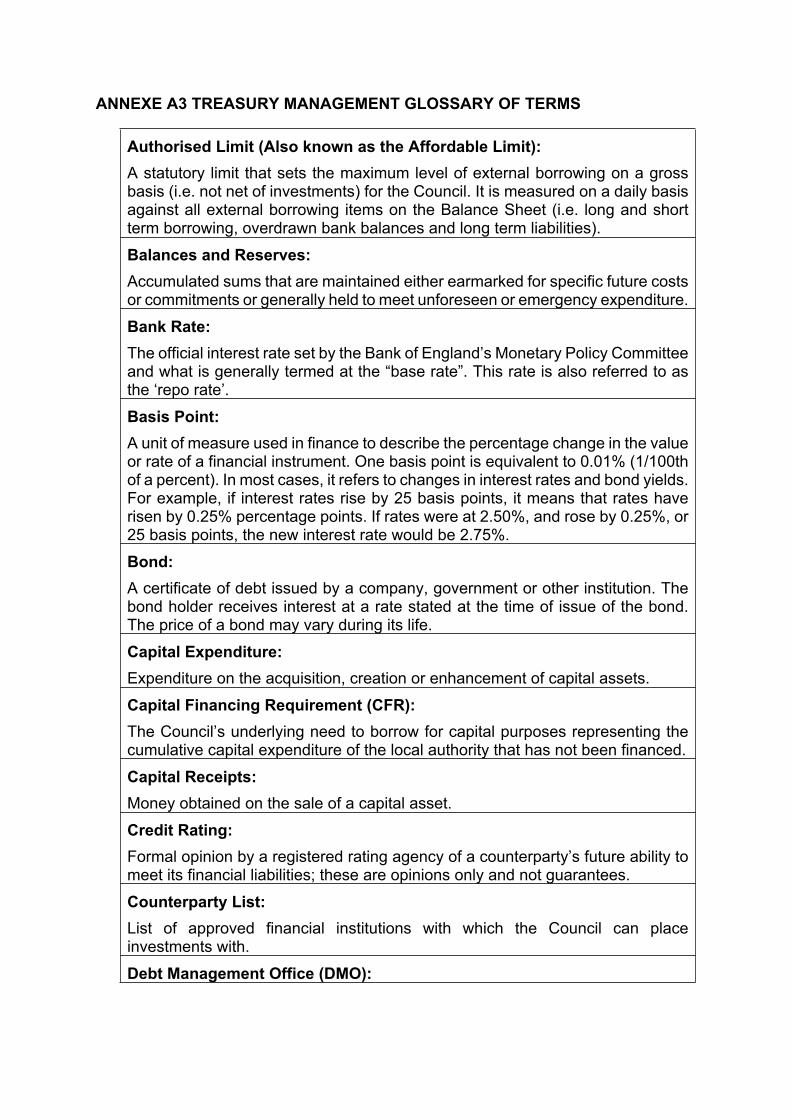
ANNEXE A3 TREASURY MANAGEMENT GLOSSARY OF TERMS
Authorised Limit (Also known as the Affordable Limit):A statutory limit that sets the maximum level of external borrowing on a gross basis (i.e. not net of investments) for the Council. It is measured on a daily basis against all external borrowing items on the Balance Sheet (i.e. long and short term borrowing, overdrawn bank balances and long term liabilities).Balances and Reserves:Accumulated sums that are maintained either earmarked for specific future costs or commitments or generally held to meet unforeseen or emergency expenditure.Bank Rate:The official interest rate set by the Bank of England’s Monetary Policy Committee and what is generally termed at the “base rate”. This rate is also referred to as the ‘repo rate’.Basis Point:A unit of measure used in finance to describe the percentage change in the value or rate of a financial instrument. One basis point is equivalent to 0.01% (1/100th of a percent). In most cases, it refers to changes in interest rates and bond yields. For example, if interest rates rise by 25 basis points, it means that rates have risen by 0.25% percentage points. If rates were at 2.50%, and rose by 0.25%, or 25 basis points, the new interest rate would be 2.75%.Bond:A certificate of debt issued by a company, government or other institution. The bond holder receives interest at a rate stated at the time of issue of the bond. The price of a bond may vary during its life.Capital Expenditure:Expenditure on the acquisition, creation or enhancement of capital assets.Capital Financing Requirement (CFR):The Council’s underlying need to borrow for capital purposes representing the cumulative capital expenditure of the local authority that has not been financed. Capital Receipts: Money obtained on the sale of a capital asset.Credit Rating:Formal opinion by a registered rating agency of a counterparty’s future ability to meet its financial liabilities; these are opinions only and not guarantees.Counterparty List: List of approved financial institutions with which the Council can place investments with.Debt Management Office (DMO):

The DMO is an Executive Agency of Her Majesty's Treasury and provides direct access for local authorities into a government deposit facility known as the DMADF. All deposits are guaranteed by HM Government and therefore have the equivalent of a sovereign triple-A credit rating.Gilts: Gilts are bonds issued by the UK Government. They take their name from ‘gilt-edged’. Being issued by the UK government, they are deemed to be very secure as the investor expects to receive the full face value of the bond to be repaid on maturity.LIBID: The London Interbank Bid Rate (LIBID) is the rate bid by banks on Eurocurrency deposits (i.e. the rate at which a bank is willing to borrow from other banks).LIBOR: The London Interbank Offered Rate (LIBOR) is the rate of interest that banks charge to lend money to each other. The British Bankers' Association (BBA) work with a small group of large banks to set the LIBOR rate each day. The wholesale markets allow banks who need money to be more fluid in the marketplace to borrow from those with surplus amounts. The banks with surplus amounts of money are keen to lend so that they can generate interest which it would not otherwise receive.Maturity: The date when an investment or borrowing is repaid.Money Market Funds (MMF): Pooled funds which invest in a range of short term assets providing high credit quality and high liquidity.Minimum Revenue Provision (MRP): An annual provision that the Council is statutorily required to set aside and charge to the Revenue Account for the repayment of debt associated with expenditure incurred on capital assets.Non Specified Investment: Investments which fall outside the CLG Guidance for Specified investments (below).Operational Boundary: This linked directly to the Council’s estimates of the CFR and estimates of other day to day cash flow requirements. This indicator is based on the same estimates as the Authorised Limit reflecting the most likely prudent but not worst case scenario but without the additional headroom included within the Authorised Limit.Prudential Code: Developed by CIPFA and introduced on 1/4/2004 as a professional code of practice to support local authority capital investment planning within a clear,

affordable, prudent and sustainable framework and in accordance with good professional practice.Prudential Indicators: Prudential indicators are a set of financial indicators and limits that are calculated in order to demonstrate that councils' capital investment plans are affordable, prudent and sustainable.They are outlined in the CIPFA Prudential Code of Practice. They are indicators that must be used to cover the categories of affordability, prudence, capital spending, external debt/borrowing and treasury management. They take the form of limits, ratios or targets which are approved by Council before 1 April each year and are monitored throughout the year on an on-going basis. A council may also choose to use additional voluntary indicators.Public Works Loans Board (PWLB): The PWLB is a statutory body operating within the United Kingdom Debt Management Office, an Executive Agency of HM Treasury. The PWLB's function is to lend money from the National Loans Fund to local authorities and other prescribed bodies, and to collect the repayments.Revenue Expenditure: Expenditure to meet the continuing cost of delivery of services including salaries and wages, the purchase of materials and capital financing charges.(Short) Term Deposits: Deposits of cash with terms attached relating to maturity and rate of return (Interest).Specified Investments: Term used in the CLG Guidance and Welsh Assembly Guidance for Local Authority Investments. Investments that offer high security and high liquidity, in sterling and for no more than one year. UK government, local authorities and bodies that have a high credit rating.Supported Borrowing: Borrowing for which the costs are supported by the government or third party.Temporary Borrowing: Borrowing to cover peaks and troughs of cash flow, not to fund capital spending.Unsupported Borrowing: Borrowing which is self-financed by the local authority. This is also sometimes referred to as Prudential Borrowing.Yield: The measure of the return on an investment.

A large print version of this document is available on request
Rutland County CouncilCatmose, Oakham, Rutland LE15 6HP
01572 722 [email protected]
www.rutland.gov.uk