Embed Size (px)
Citation preview

1
TREASURY AND FEDERAL RESERVE
FOREIGN EXCHANGE OPERATIONS
October – December 2018
The U.S. dollar, as measured by the Federal Reserve Board’s broad trade-weighted dollar index,
appreciated 1.8 percent in the fourth quarter of 2018, amid numerous cross-currents. The dollar’s
modest appreciation occurred despite a notable decline in U.S. Treasury yields—partly attributed to
the net lowering of expectations regarding the future path of the target range for the federal funds
rate—and the resultant narrowing of U.S. interest rate differentials vis-à-vis other major economies.
The dominant force supporting dollar appreciation was a sharp global sell-off in risk assets
precipitated by rising concerns about future corporate earnings as well as concerns about broader
global growth amid ongoing global trade tensions. Among major currencies, the dollar appreciated
1.2 percent against the euro and 5.6 percent against the Canadian dollar. By contrast, the dollar
depreciated 3.5 percent against the Japanese yen amid the decline in risk sentiment. The dollar was
little changed on net against the Chinese renminbi, despite notable intraquarter volatility. The Federal
Reserve and U.S. Treasury did not intervene in foreign exchange markets during the quarter.
This report, presented by Simon Potter, Executive Vice President, Federal Reserve Bank of New York, and
Manager of the System Open Market Account, describes the foreign exchange operations of the U.S. Department
of the Treasury and the Federal Reserve System for the period from October through December 2018.
Veronica Zapasnik was primarily responsible for preparation of the report.

2
123
124
125
126
127
128
129
130
123
124
125
126
127
128
129
130
June 30 July 31 August 31 September 30 October 31 November 30 December 31
BROAD TRADE-WEIGHTED U.S. DOLLAR
Index
Sources: Board of Governors of the Federal Reserve System; Bloomberg L.P.
Index
Chart 1
1.11
1.12
1.13
1.14
1.15
1.16
1.17
1.18
1.19
1.11
1.12
1.13
1.14
1.15
1.16
1.17
1.18
1.19
June 30 July 31 August 31 September 30 October 31 November 30 December 31
EURO–U.S. DOLLAR EXCHANGE RATE
Dollars per euro
Source: Bloomberg L.P.
Dollars per euro
Chart 2

3
109
110
111
112
113
114
115
109
110
111
112
113
114
115
June 30 July 31 August 31 September 30 October 31 November 30 December 31
U.S. DOLLAR–JAPANESE YEN EXCHANGE RATE
Yen per dollar
Source: Bloomberg L.P.
Yen per dollar
Chart 3
-4.0 -3.0 -2.0 -1.0 0.0 1.0 2.0 3.0 4.0 5.0 6.0 7.0
Japanese yen
New Zealand dollar
Swedish krona
Swiss franc
Euro
Danish krone
British pound
Australian dollar
Canadian dollar
Norwegian krone
U.S. DOLLAR PERFORMANCE AGAINST G-10 CURRENCIES DURING THE FOURTH QUARTER
Chart 4
PercentSource: Bloomberg L.P.
U.S .dollar appreciation

4
U.S. DOLLAR APPRECIATES AMID GLOBAL RISK SELL-OFF DESPITE DOWNWARD
SHIFT IN MARKET-IMPLIED EXPECTATIONS FOR THE U.S. POLICY RATE
The U.S. dollar, as measured by the Federal Reserve Board’s broad trade-weighted dollar index,
appreciated 1.8 percent in the fourth quarter of 2018, marking a 7.5 percent rise for the full year.1
The dollar faced pressure in the quarter from competing cross-currents that served to moderate its
appreciation. The modest appreciation occurred despite a significant decline in U.S. Treasury yields
and the corresponding narrowing of shorter-dated U.S. interest rate differentials vis-à-vis other major
economies, which typically would support dollar depreciation. U.S. interest rates declined notably
more than foreign rates; for example, two-year U.S. Treasury yields decreased 33 basis points over
the quarter, as compared with a 9 basis point decline in their German two-year counterparts.
The dominant force supporting dollar appreciation was a sharp global sell-off in risk assets amid a
deterioration in risk sentiment. The sell-off in risk assets featured a 14 percent decline in the S&P 500
1 The broad trade-weighted dollar index comprises twenty-six currencies, including major developed market currencies and the currencies of other important trading partners of the United States, including emerging markets. The major currency trade-weighted dollar index, which comprises seven widely traded developed market currencies, appreciated 1.9 percent in the fourth quarter.
1.9
2.0
2.1
2.2
2.3
2.4
2.5
88.0
88.5
89.0
89.5
90.0
90.5
91.0
91.5
92.0
92.5
93.0
June 30 July 31 August 31 September 30 October 31 November 30 December 31
TRADE-WEIGHTED MAJOR U.S. DOLLAR AND WEIGHTED DEVELOPED MARKET INTEREST RATE DIFFERENTIAL
Trade-weighted major U.S. dollar (left scale)
Weighted two-year yield differential (right scale)
Index
Sources: Bloomberg L.P.; Board of Governors of the Federal Reserve System; New York Fed staff calculations.
Chart 5
Percent

5
equity index and a 2 percentage point increase in U.S. high-yield credit spreads.2 These moves were
precipitated by a confluence of factors, including increasing concerns about the outlook for
corporate earnings, the persistence of heightened global trade tensions, and broader global growth
concerns. Market participants noted that a perceived escalation of U.S.-China trade tensions,
combined with a slowdown in Chinese economic growth and weaker-than-expected economic data
in Europe, had increased downside risks to the global growth outlook. These concerns began to be
reflected in U.S. corporate earnings communications, with numerous companies lowering guidance
for their future earnings. The increased downside risks to global demand, combined with concerns
about rising crude oil supply, also contributed to a nearly 35 percent decline in Brent crude oil futures
prices in the quarter.
However, the primary offsetting force weighing on the dollar was a significant re-pricing lower of
market-implied expectations for the future path of U.S. monetary policy, which market participants
largely attributed to their net interpretation of multiple Federal Reserve communications during the
quarter amid the equity market sell-off and tightening in U.S. financial conditions. Despite the
FOMC’s 25 basis point increase in the federal funds target range at its December meeting, the
market-implied path of policy, as measured by implied interest rates on federal funds and Eurodollar
2 As measured using the Bloomberg Barclays U.S. corporate high yield average option-adjusted spread index.
30
35
40
45
50
55
60
65
70
75
80
2,200
2,300
2,400
2,500
2,600
2,700
2,800
2,900
3,000
June 30 July 31 August 31 September 30 October 31 November 30 December 31
S&P 500 EQUITY INDEX AND BRENT CRUDE OIL FUTURES
S&P 500 equity index (left scale)
Brent crude oil futures contract (right scale)
Index
Sources: Bloomberg L.P.; Board of Governors of the Federal Reserve System; New York Fed staff calculations.
Chart 6
Dollars

6
futures contracts, flattened significantly over the second half of the quarter. As of year-end 2018
these measures implied no further increases in the effective federal funds rate during 2019, compared
with an increase of around 50 basis points implied immediately following the November FOMC
meeting.
In terms of economic data, key U.S. data releases remained relatively robust compared with those
of other major economies. Market participants noted that U.S. economic data—including third-
quarter GDP, industrial production, the ISM non-manufacturing index, and the October
Employment Situation report—generally printed above median consensus forecasts. Analysts’
economic forecasts for the United States were relatively stable in the quarter amid downward
revisions to growth forecasts for Europe, Japan, and China, further supporting dollar appreciation.
Meanwhile, central banks in other advanced economies—including the euro area, the United
Kingdom, and Japan—continued to maintain their respective accommodative policy stances. While
expectations for the timing of policy normalization in some of these economies shifted further into
the future, particularly in the euro area, the magnitude of the downward shift in U.S. policy
expectations late in the quarter was nonetheless greater than the change in market-implied policy rate
expectations abroad, resulting in offsetting depreciation pressure on the dollar.
Among major U.S. trading partners, the greatest contributor to the trade-weighted dollar’s
appreciation in the fourth quarter was the Canadian dollar, reflecting that currency’s sizable
1.8
2.0
2.2
2.4
2.6
2.8
3.0
1.8
2.0
2.2
2.4
2.6
2.8
3.0
Aug2018
Nov2018
Feb2019
May2019
Aug2019
Nov2019
Feb2020
May2020
Aug2020
Nov2020
Feb2021
May2021
Aug2021
Yield
MARKET-IMPLIED RATES ON FEDERAL FUNDS FUTURES
December 31, 2018
September 28, 2018
Source: Bloomberg L.P.
Yield
Chart 7

7
depreciation as well as its relatively large weighting in the index. The U.S. dollar appreciated
5.6 percent against the Canadian dollar, which was attributed in large part to the significant decline in
crude oil prices over the quarter, given Canada’s status as a major oil exporter. Market participants
largely attributed the oil price decline to a rapid increase in global crude oil supply, with the world’s
three largest oil producers—Saudi Arabia, Russia, and the United States—reaching record-high
production levels in November. However, even after the early December announcement of
production cuts led by the Organization of Petroleum Exporting Countries (OPEC), oil prices
continued to decline as market participants focused on increased downside risks to oil demand
stemming from emerging market weakness and uncertainty around U.S.-China trade relations.
INCREASED GLOBAL RISK AVERSION DRIVES JAPANESE YEN APPRECIATION
Consistent with reduced global risk sentiment, the dollar depreciated 3.5 percent against the Japanese
yen in the fourth quarter. After trading in a relatively narrow range against the dollar in October and
November, the yen appreciated notably in December amid heightened volatility in financial markets.
Market participants noted that the yen’s late-quarter appreciation was consistent with the trend often
observed during periods of reduced risk sentiment in financial markets, whereby Japanese investors
tend to repatriate funds held in unhedged foreign-denominated assets. Indeed, according to balance
of payments data released by Japan’s Ministry of Finance, Japanese investors sold foreign assets on a
net basis in December, putting appreciation pressure on the yen.
With respect to Japanese monetary policy, consensus expectations for the path of Bank of Japan
policy—that the bank will maintain the current low level of interest rates for an extended period—
were unchanged in the fourth quarter.
EURO DEPRECIATES AMID SLOWING ECONOMIC GROWTH
The U.S. dollar appreciated 1.2 percent against the euro in the fourth quarter amid slowing European
economic growth, political uncertainty in the region, and global risk-off sentiment. The euro’s
modest depreciation occurred despite a narrowing of shorter-dated interest rate differentials between
the United States and core euro-area economies—with German rates declining notably less than U.S.
rates—which typically would support euro appreciation.
At the start of the quarter, the euro depreciated and Italian government bond spreads to German
equivalents widened amid a heightened focus on Italy’s budget negotiations with the European
Union (EU). The Italian government proposed a budget that was formally rejected by the European
Commission in late October, although concerns eased later in the quarter as an agreement was

8
ultimately reached in December. Despite the improvement in sentiment on this front, the euro
remained weighed down against the dollar in December as concerns about weakening economic data
became the foremost investor concern.
Indeed, increasing signs of slowing economic activity in the euro area contributed to the euro’s
depreciation and added to investor concerns about global growth. Specifically, third-quarter euro-area
GDP printed weaker than median consensus expectations and major European countries saw a
downward trend in their Purchasing Managers’ Index (PMI) data. Market-implied expectations for a
policy rate increase by the European Central Bank (ECB) shifted to the second half of 2020 from
early 2020, driven by investor concerns about a global growth slowdown. The ECB left its key policy
rates unchanged at its October and December meetings, as expected.
CHINESE RENMINBI SEES INTRAQUARTER VOLATILITY IN ASSOCIATION WITH
GLOBAL TRADE TENSIONS
After depreciating nearly 4 percent against the dollar in the third quarter of 2018, the renminbi
continued that trend in the first two months of the fourth quarter, depreciating a further 1.3 percent
in October and November. However, the currency significantly reversed trend in December,
appreciating 1.2 percent, to end the quarter little changed against the dollar on net.
6.55
6.60
6.65
6.70
6.75
6.80
6.85
6.90
6.95
7.00
7.05
6.55
6.60
6.65
6.70
6.75
6.80
6.85
6.90
6.95
7.00
7.05
June 30 July 31 August 31 September 30 October 31 November 30 December 31
U.S. DOLLAR–CHINESE RENMINBI EXCHANGE RATERenminbi per dollar
Source: Bloomberg L.P.
Renminbi per dollar
Chart 8

9
According to market participants, the renminbi’s depreciation at the start of the quarter reflected
increased concerns about the persistence of heightened U.S.-China trade tensions, an ongoing
slowdown in Chinese economic growth, and steps taken by the People’s Bank of China to ease
monetary policy. Economic data releases—including industrial production, fixed asset investment,
and manufacturing PMI—continued to decelerate and print below median consensus forecasts
during the quarter. Consistent with this deceleration in growth, Chinese authorities pursued
additional fiscal and monetary policy easing measures, including a 100 basis point reduction in banks’
reserve requirement ratio in October, which put further depreciation pressure on the renminbi.
The renminbi’s depreciation earlier in the quarter retraced almost entirely in December as the
bilateral meeting between the U.S. and Chinese presidents at the G20 summit was perceived as
constructive in regard to potentially resolving some of the outstanding issues related to trade. Indeed,
following the G20 summit, the Chinese renminbi appreciated 1.8 percent against the U.S. dollar over
a two-day period, the largest two-day appreciation for the currency pair since China’s shift from a
fixed dollar peg to a managed floating exchange rate in 2005. While noting that uncertainty remains,
market participants characterized the progress as stemming from the United States’ agreement to
delay a previously planned increase in the tariff rate on $200 billion in Chinese imports by an
additional two months, to March 1, as well as announcements by China that it would import more
U.S. goods and move forward with a series of stricter consequences for intellectual property
violations.
BROADER EMERGING MARKET CURRENCIES LESS AFFECTED BY RISK AVERSION;
COMMODITY-SENSITIVE CURRENCIES REACT TO OIL PRICE DECLINES
Emerging market currencies in aggregate, as measured by the JP Morgan Emerging Markets
Currency Index, were relatively little changed against the dollar in the fourth quarter. However,
idiosyncratic factors and commodity price declines prompted divergence in the performance of
specific currencies. The relatively more muted movement in exchange rates in the fourth quarter was
in marked contrast with the notable depreciation in many emerging market currencies earlier in the
year, as these currencies had faced pressure partly stemming from rising U.S. interest rates.
Additionally, emerging market equities declined over the quarter, though to a lesser extent than those
of developed markets. Market participants attributed the more favorable dynamics in emerging
market assets to relatively more attractive valuations compared with developed markets, as well as the
lowering of expectations for FOMC rate increases.
Among major emerging market trading partners, the U.S. dollar appreciated 4.7 percent against the
Mexican peso amid uncertainty about the policies of Mexico’s new administration, which prompted
some market participants to lower their forecasts for the country’s economic growth. Elsewhere,

10
after depreciating precipitously in the third quarter—by 32 percent and 43 percent, respectively—the
Turkish lira and Argentine peso appreciated 15 percent and 10 percent, respectively, against the
U.S. dollar in the fourth quarter, as near-term investor concerns about these emerging markets’
economic policies and external funding vulnerabilities receded somewhat.
Meanwhile, the 35 percent decline in Brent crude oil prices during the quarter affected the
currencies of both oil-exporting and oil-importing emerging markets. The lower oil price was
consistent with the depreciation in the currencies of major oil exporters, with the Russian ruble and
Colombian peso depreciating 5.5 percent and 8.9 percent against the dollar, respectively. By contrast,
the currencies of countries reliant on oil imports appreciated against the dollar over the quarter, with
the Indian rupee and Indonesian rupiah each appreciating nearly 4 percent.
BRITISH POUND DEPRECIATES AMID BREXIT-RELATED UNCERTAINTY
The British pound experienced volatility and depreciated 2.1 percent against the U.S. dollar on net,
amid ongoing uncertainty and deteriorating sentiment regarding the potential outcome of the United
Kingdom’s withdrawal from the European Union (“Brexit”). In the first half of the quarter,
-14.0 -12.0 -10.0 -8.0 -6.0 -4.0 -2.0 0.0 2.0 4.0 6.0 8.0 10.0 12.0
Turkish lira
Argentine peso
Brazilian real
Indian rupee
Indonesian rupiah
Singapore dollar
Malaysian ringgit
Taiwanese dollar
Chinese renminbi
Korean won
Polish zloty
South African rand
Mexican peso
Chilean peso
Russian ruble
Colombian peso
U.S. DOLLAR PERFORMANCE AGAINST EMERGING MARKET CURRENCIES DURING THE FOURTH QUARTER
Chart 9
U.S .dollar appreciation
Percent
Source: Bloomberg L.P.

11
negotiations between the U.K. and EU did not result in an agreement on the arrangements for
withdrawal and the EU president noted that a “no-deal” outcome was increasingly likely, which
together generated negative investor sentiment that was viewed as driving pound depreciation.
In mid-November, several U.K. cabinet ministers resigned, stating that they were unable to
support Prime Minister May’s draft Withdrawal Agreement reached with the EU. The resignations
were perceived by market participants as increasing uncertainty about both the U.K’s domestic
political environment and the outlook for an eventual withdrawal outcome—leading the pound to
depreciate 1.7 percent on the day.
Even though the U.K. and EU announced an official agreement on an Article 50 deal in late
November, the prime minister’s subsequent postponement of the parliamentary vote on the
agreement added to the negative risk sentiment in the pound. Further elevated political uncertainty in
the U.K. continued to pose challenges to the consolidation of a parliamentary majority to support the
agreement. Indeed, the quarter ended with a high degree of uncertainty around the eventual outcome
of the U.K.’s withdrawal from the EU.
1.23
1.25
1.27
1.29
1.31
1.33
1.35
1.23
1.25
1.27
1.29
1.31
1.33
1.35
June 30 July 31 August 31 September 30 October 31 November 30 December 31
BRITISH POUND–U.S. DOLLAR EXCHANGE RATEDollars per pound
Source: Bloomberg L.P.
Dollars per pound
Chart 10

12
FOREIGN EXCHANGE SWAP MARKET GENERALLY STABLE; BASIS SPREADS
NARROW AT YEAR-END
During the fourth quarter, three-month foreign exchange swap basis spreads of key U.S. dollar
currency pairs temporarily widened when these contracts began to capture higher funding costs over
the turn of the year—amid pre-funding activity from market participants—and returned to near zero
later in the quarter. According to market participants, the return of swap basis spreads to near zero
reflected two factors. First, the continued flattening of the U.S. Treasury yield curve observed for
most of 2018 reduced the relative return of U.S. dollar assets, resulting in lower demand for dollar
funding and hedging in the foreign exchange swap market. Second, market participants cited banks’
ongoing adjustment to changes in the regulatory environment and the resultant corresponding
improvement to their balance sheet management.
-110
-90
-70
-50
-30
-10
10
-110
-90
-70
-50
-30
-10
10
June 2016 December 2016 June 2017 December 2017 June 2018 December 2018
FOREIGN EXCHANGE SWAP-IMPLIED BASIS SPREADS
Euro–U.S. dollar three-month
U.S. dollar–yen three-month
Basis points
Source: Bloomberg L.P.
Chart 11
Basis points

13
TREASURY AND FEDERAL RESERVE FOREIGN EXCHANGE HOLDINGS
The Federal Reserve and U.S. Treasury did not undertake any intervention operations during the
quarter. As of December 31, the value of the U.S. Treasury’s Exchange Stabilization Fund (ESF)
foreign-currency-denominated assets totaled $21 billion, comprised of euro and yen holdings. The
Federal Reserve System Open Market Account (SOMA) holdings of foreign-currency-denominated
assets also totaled $21 billion, comprised of euro and yen holdings.
Foreign Exchange Reserve Holdings
The Federal Reserve and U.S. Treasury invest their foreign currency reserves, which are held in the
SOMA and the ESF, in a variety of instruments that yield market rates of return in their respective
currencies and have a high degree of liquidity and credit quality. The Authorization for Foreign
Currency Operations defines the permitted investments for the SOMA foreign currency portfolio.
The Open Market Trading Desk of the Federal Reserve Bank of New York (the Desk) utilizes an
investment framework for the management of the foreign currency assets. The framework involves a
routine affirmation of objectives and constraints from policymakers. The Desk then utilizes an
investment approach designed to meet those objectives to maximize return subject to maintaining
sufficient liquidity and a high degree of safety.
In terms of the composition of foreign currency reserves, a significant portion of the Federal
Reserve and U.S. Treasury’s foreign exchange reserves remained invested on an outright basis in
German, French, Dutch, and Japanese government securities. Foreign currency reserves may also be
invested at the Bank for International Settlements and in instruments at other official institutions,
such as the Deutsche Bundesbank, the Banque de France, and the Bank of Japan. To the greatest
extent practicable, the investments are split evenly between the SOMA and the ESF.
As of December 31, the euro reserves held by both the SOMA and the ESF totaled $24.9 billion, a
decrease from $25.3 billion, owing to foreign exchange translation effects as the dollar appreciated
against the euro. Cash held in euro-denominated deposits at official institutions decreased to
$12.8 billion from $13.7 billion, while direct holdings of euro-denominated government securities
increased to $12.1 billion from $11.5 billion. The amount of yen-denominated deposits and
government securities held by the SOMA and the ESF increased to $17 billion from $16.5 billion at
quarter-end, which was mostly attributable to the appreciation of the yen against the dollar.
Consistent with the current Authorization for Foreign Currency Operations, the Desk conducts
small-value exercises for the foreign currency reserves as a matter of prudent advance planning. No
inference about policy should be drawn from these exercises. In the fourth quarter, the Desk
conducted a small-value sale of a yen-denominated government security and entered into a yen-
denominated repurchase agreement.

14
Liquidity Swap Arrangements with Foreign Central Banks
As of December 31, the European Central Bank had $4.2 billion and the Bank of Japan had
$10 million of swaps outstanding, respectively. The Bank of Canada, Bank of England, and Swiss
National Bank did not have any dollar swaps outstanding at the end of the quarter.

15
Table 1
FOREIGN CURRENCY HOLDINGS OF U.S. MONETARY AUTHORITIES BASED ON CURRENT EXCHANGE RATES Millions of U.S. Dollars
Changes in Balances by Source
Carrying Value, September 30,
2018a
Net Purchases and Salesb
Investment Earningsc
Realized
Gains/Losses on Salesd
Unrealized Gains/Losses on Foreign Currency
Revaluatione
Carrying Value, December 31,
2018a
Federal Reserve System Open Market Account (SOMA)
Euro 12,646 0 (7) 0 (181) 12,458
Japanese yen 8,236 0 0 0 284 8,520
Total 20,882 0 (7) 0 103 20,979
Changes in Balances by Source
Carrying Value, September 30,
2018a
Net Purchases and Salesb
Investment Earningsc
Realized Gains/Losses
on Salesd
Unrealized Gains/Losses on Foreign Currency
Revaluatione
Carrying Value, December 31,
2018a
U.S. Treasury Exchange Stabilization Fund (ESF)
Euro 12,627 0 (7) 0 (180) 12,439
Japanese yen 8,236 0 0 0 284 8,520
Total 20,863 0 (7) 0 103 20,959
Note: Figures may not sum to totals because of rounding.
a Carrying value of the reserve asset position includes interest accrued on foreign currency, which is based on the “day of” accrual method.
b Net purchases and sales include foreign currency purchases related to official activity, as well as repayments and warehousing.
c Investment earnings include accrued interest and amortization on outright holdings.
d Gains and losses on sales are calculated using average cost.
e Reserve asset balances are revalued daily at the noon buying rates.
16
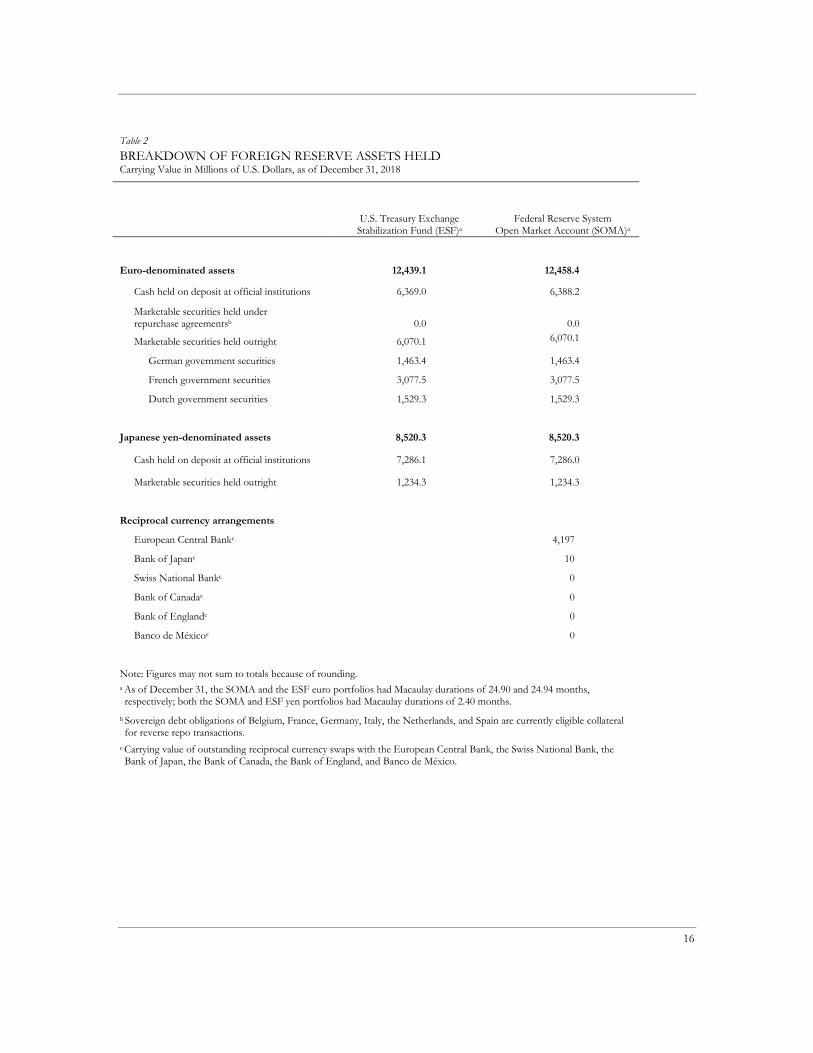
Table 2
BREAKDOWN OF FOREIGN RESERVE ASSETS HELD Carrying Value in Millions of U.S. Dollars, as of December 31, 2018
U.S. Treasury Exchange
Stabilization Fund (ESF)a
Federal Reserve System
Open Market Account (SOMA)a
Euro-denominated assets 12,439.1 12,458.4
Cash held on deposit at official institutions 6,369.0 6,388.2
Marketable securities held under repurchase agreementsb
0.0
0.0
Marketable securities held outright 6,070.1 6,070.1
German government securities 1,463.4 1,463.4
French government securities 3,077.5 3,077.5
Dutch government securities 1,529.3 1,529.3
Japanese yen-denominated assets 8,520.3 8,520.3
Cash held on deposit at official institutions 7,286.1 7,286.0
Marketable securities held outright 1,234.3 1,234.3
Reciprocal currency arrangements
European Central Bankc 4,197
Bank of Japanc 10
Swiss National Bankc 0
Bank of Canadac 0
Bank of Englandc 0
Banco de Méxicoc 0
Note: Figures may not sum to totals because of rounding.
a As of December 31, the SOMA and the ESF euro portfolios had Macaulay durations of 24.90 and 24.94 months, respectively; both the SOMA and ESF yen portfolios had Macaulay durations of 2.40 months.
b Sovereign debt obligations of Belgium, France, Germany, Italy, the Netherlands, and Spain are currently eligible collateral for reverse repo transactions.
c Carrying value of outstanding reciprocal currency swaps with the European Central Bank, the Swiss National Bank, the Bank of Japan, the Bank of Canada, the Bank of England, and Banco de México.

17
Table 3
RECIPROCAL CURRENCY ARRANGEMENTS Millions of U.S. Dollars
Institution
Amount of Facility
Outstanding as of December 31, 2018
Federal Reserve System Open Market Account (SOMA)
Reciprocal currency arrangement
Bank of Canada 2,000 0
Banco de México 3,000 0
Standing dollar liquidity swap arrangement
European Central Bank No preset limit 4,197
Swiss National Bank No preset limit 0
Bank of Japan No preset limit 10
Bank of Canada No preset limit 0
Bank of England No preset limit 0
No preset limit 4,207
Standing foreign currency liquidity swap arrangements
European Central Bank No preset limit 0
Swiss National Bank No preset limit 0
Bank of Japan No preset limit 0
Bank of Canada No preset limit 0
Bank of England No preset limit 0
No preset limit 0
U.S. Treasury Exchange Stabilization Fund (ESF)
Banco de México 3,000 0
3,000 0