Embed Size (px)
Citation preview

1
Network Bridge Deck Surface Friction Testing: Issues and Performance Evaluation 1
2
3
4
Shuo Li, Ph.D., PE, Research Engineer 5
Division of Research and Development 6
Indiana Department of Transportation 7
West Lafayette, IN 47906 8
Tel: (765) 4631521 9
Email: [email protected] 10
11
Guangyuan Zhao, Graduate Research Assistant 12
Department of Building Construction Management 13
Purdue University 14
West Lafayette, IN 47907 15
Tel: 765-494-5602 16
Email: [email protected] 17
18
Junlin Liang, Ph.D., Visiting Scholar 19
Department of Building Construction Management 20
Purdue University 21
West Lafayette, IN 47907 22
Tel: 765-494-5602 23
Email: [email protected] 24
25
And 26
27
Yi Jiang, Ph.D., .P.E., Professor 28
Department of Building Construction Management 29
Purdue University 30
West Lafayette, IN 47907 31
Tel: 765-494-5602 32
Email: [email protected] 33
34
35
36
Submitted on July 31, 2014 to TRB 94th
Annual Meeting 37
38
39
40
Word count: 5261 (3511 words + 4 tables + 3 figures) 41
42
43
44

2
ABSTRACT 45
46
Bridges play a significant role in providing safe and efficient roadway transportation. Friction 47
performance on bridge decks is believed to be critical due to potential early freezing of 48
precipitation on the deck surface and because accidents on bridges, in a confined space, may 49
create more significant mobility issues. In addition, bridge deck friction is becoming one of the 50
key factors in bridge deck preventative maintenance. As a result, the friction performance of 51
bridge decks is becoming an increasing concern. The Indiana Department of Transportation 52
(INDOT) formally started annual inventory bridge deck friction testing at the network level in 53
2013, which has resulted in additional efforts to enhance travel safety. This paper presents the 54
test procedures utilized by INDOT to undertake annual inventory friction testing for bridge decks 55
at the network level. In particular, this paper addresses the critical issues associated with friction 56
testing on bridge decks, including test reliability, accuracy, and network performance evaluation. 57
It was concluded that a single friction test in accordance with ASTM E274 is capable of 58
providing a reliable test result to accurately characterize the deck surface friction performance 59
for a typical bridge. In addition, it was found that bridge decks on interstates tend to have more 60
friction issues than those on conventional roads such as US highways and State routes. 61
62
63
64
65
66
67
68
69
70
71
72
73
74
75
76
77
78
79
80
81
82
83
84
85
86
87
88
89

3
INTRODUCTION 90
91
The Indiana Department of Transportation (INDOT) conducts annual network inventory 92
pavement friction testing every year to ensure public travel safety, particularly to reduce wet 93
pavement skidding crashes. Also, the friction test results have been used by INDOT pavement 94
engineers to assess candidates for pavement resurfacing and preservation treatments. However, 95
like other state transportation departments, the INDOT network pavement friction inventory test 96
program was initially established to cover roadway mainline pavements. Some critical locations, 97
including bridge decks and interchange ramp pavements, might have been overlooked in the past 98
due to the limitations of technologies and resources. In 2008, as an initiative to address potential 99
concerns over ramp pavement friction performance, the INDOT Division of Research and 100
Development (R&D) conducted friction testing on a total of 42 selected interstate ramps that 101
account for approximately 13% of total interchange of ramps in Indiana. It was found that for 102
these tested interchange ramps, the 15th
percentile friction number was 29 that was measured 103
with the standard smooth tire at 40 mph. This was extended to indicates that overall, the 104
interchange ramp pavements in Indiana were in good friction conditions and capable of 105
providing sufficient skid-resistance in wet weather (1). 106
However, it was not until recently that INDOT started annual inventory friction testing on 107
bridge decks at the network level. No other state transportation agencies have been reported to 108
conduct annual inventory bridge deck friction testing so far. It is well known that most state 109
transportation agencies have been conducting annual inventory pavement friction testing using a 110
locked trailer in accordance with the ASTM Standard E274-97, Standard Test Method for Skid 111
Resistance of Paved Surfaces Using a Full-Scale Tire (2). This method is intended to evaluate 112
pavement test sections of uniform age and uniform composition subjected essentially to uniform 113
tire pressure and does not specifically address the friction measurement of bridge decks. In 114
addition, the calculation of friction or skid number is made in lights of the horizontal and vertical 115
forces recorded over a time interval of 1.0 to 3.0 s (typically 1.5 s for INDOT’s friction test 116
trailers). In other words, the test section should be on average 90 to 150 feet (30 to 45 meters) 117
long for friction testing, depending on the test speed. This makes it difficult for the operator to 118
judge if a bridge is long enough to conduct the test while travelling at a test speed that typically 119
varies between 30 and 50 mph (48 and 80 km/h). 120
Bridges play a significant role in providing safe and efficient roadway transportation. 121
Friction numbers on bridge decks are believed to be critical due to potential early freezing of 122
precipitation on the bridge deck surface and because accidents on bridges, in a confined space, 123
may create significant mobility issues. In addition, bridge deck friction is becoming one of the 124
key factors in bridge preventative maintenance, particularly bridge deck surface treatment. As a 125
result, the frictional performance of bridge decks is becoming an increasing concern. The 126
INDOT Division of Research and Development conducted field trials to evaluate the feasibility 127
of annual inventory bridge deck friction testing in 2012. Due to the success of test trials, the 128
INDOT formally started annual inventory bridge deck testing in 2013. All bridge deck locations 129
with friction numbers equal to or lower than 25 were reported to the corresponding districts for 130
necessary actions. This paper presents the test procedures utilized by INDOT to undertake annual 131
inventory friction testing for bridge decks at the network level. To the authors’ knowledge, this 132
kind of information may be very useful for other state transportation departments that are 133
interested in providing seamless friction information to cover not only mainline pavements, but 134
bridge decks as well. 135
136
4
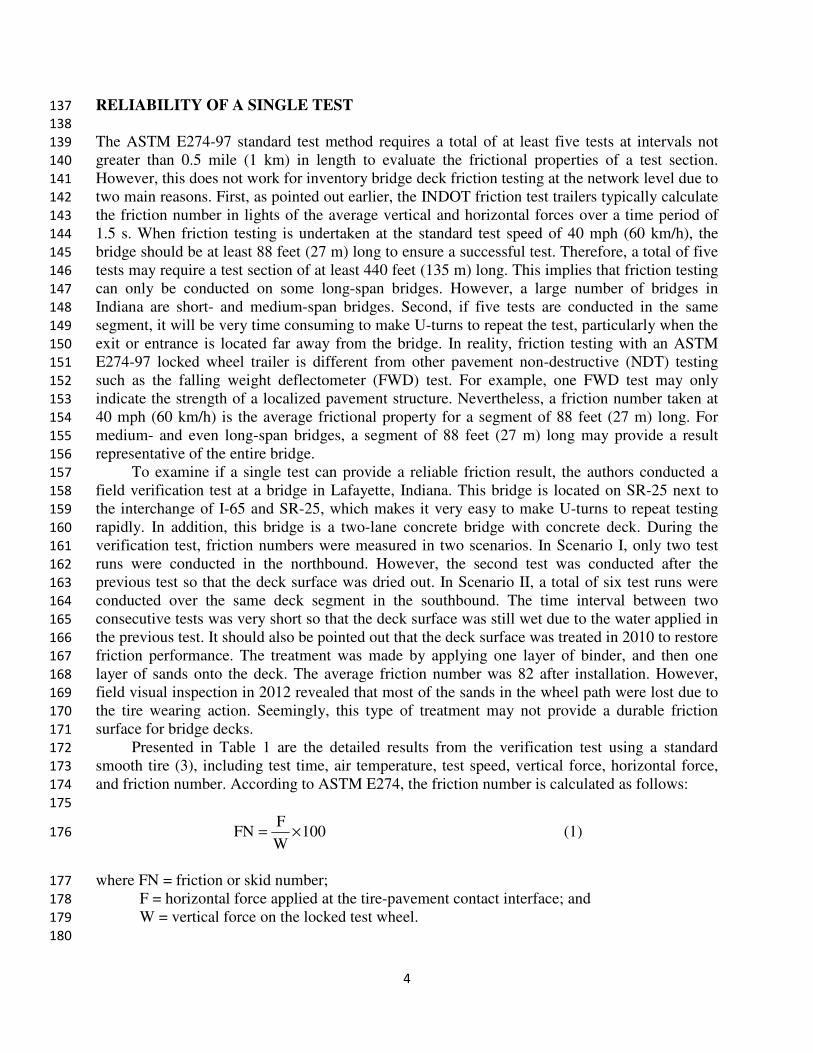
RELIABILITY OF A SINGLE TEST 137
138
The ASTM E274-97 standard test method requires a total of at least five tests at intervals not 139
greater than 0.5 mile (1 km) in length to evaluate the frictional properties of a test section. 140
However, this does not work for inventory bridge deck friction testing at the network level due to 141
two main reasons. First, as pointed out earlier, the INDOT friction test trailers typically calculate 142
the friction number in lights of the average vertical and horizontal forces over a time period of 143
1.5 s. When friction testing is undertaken at the standard test speed of 40 mph (60 km/h), the 144
bridge should be at least 88 feet (27 m) long to ensure a successful test. Therefore, a total of five 145
tests may require a test section of at least 440 feet (135 m) long. This implies that friction testing 146
can only be conducted on some long-span bridges. However, a large number of bridges in 147
Indiana are short- and medium-span bridges. Second, if five tests are conducted in the same 148
segment, it will be very time consuming to make U-turns to repeat the test, particularly when the 149
exit or entrance is located far away from the bridge. In reality, friction testing with an ASTM 150
E274-97 locked wheel trailer is different from other pavement non-destructive (NDT) testing 151
such as the falling weight deflectometer (FWD) test. For example, one FWD test may only 152
indicate the strength of a localized pavement structure. Nevertheless, a friction number taken at 153
40 mph (60 km/h) is the average frictional property for a segment of 88 feet (27 m) long. For 154
medium- and even long-span bridges, a segment of 88 feet (27 m) long may provide a result 155
representative of the entire bridge. 156
To examine if a single test can provide a reliable friction result, the authors conducted a 157
field verification test at a bridge in Lafayette, Indiana. This bridge is located on SR-25 next to 158
the interchange of I-65 and SR-25, which makes it very easy to make U-turns to repeat testing 159
rapidly. In addition, this bridge is a two-lane concrete bridge with concrete deck. During the 160
verification test, friction numbers were measured in two scenarios. In Scenario I, only two test 161
runs were conducted in the northbound. However, the second test was conducted after the 162
previous test so that the deck surface was dried out. In Scenario II, a total of six test runs were 163
conducted over the same deck segment in the southbound. The time interval between two 164
consecutive tests was very short so that the deck surface was still wet due to the water applied in 165
the previous test. It should also be pointed out that the deck surface was treated in 2010 to restore 166
friction performance. The treatment was made by applying one layer of binder, and then one 167
layer of sands onto the deck. The average friction number was 82 after installation. However, 168
field visual inspection in 2012 revealed that most of the sands in the wheel path were lost due to 169
the tire wearing action. Seemingly, this type of treatment may not provide a durable friction 170
surface for bridge decks. 171
Presented in Table 1 are the detailed results from the verification test using a standard 172
smooth tire (3), including test time, air temperature, test speed, vertical force, horizontal force, 173
and friction number. According to ASTM E274, the friction number is calculated as follows: 174
175
100W
FFN ×= (1) 176
where FN = friction or skid number; 177
F = horizontal force applied at the tire-pavement contact interface; and 178
W = vertical force on the locked test wheel. 179
180

5
TABLE 1 Results of Reliability Verification Test 181
Scenario Test Run Test Time Air Temp.
(oF)
Vert. Force
(lbs)
Hor. Force
(lbs) FN
I 1st 9:59 74 1058 244 23.1
2nd
10:21 75 1046 249 23.8
II 1st 10:01 75 1043 253 24.2
2nd
10:04 75 1044 238 22.8
3rd
10:08 75 1050 225 21.5
4th
10:11 75 1053 211 20.0
5th
10:14 75 1065 204 19.1
6th
10:18 75 1039 207 19.9
182
Eq. 1 is established with respect to the classic Coulomb’s friction law. However, care 183
should be taken to measure both F and W when friction testing is conducted on the curves or 184
grades. It is shown that in Scenario I, the friction number taken in the second test is very close to 185
that in the first test. This is because that the second test was conducted roughly 22 minutes after 186
the first test, and the deck surface wetted in the first test was completely dried out. In Scenario II, 187
however, the first test produced the greatest friction number, and the fourth test produced the 188
least friction number, which is mainly due to the effect of water applied during testing. Because 189
the subsequent test was conducted shortly (less than 4 minutes) after the previous test, the water 190
applied in the previous test remained on the surface, resulting in a thicker water film in the 191
subsequent test. In reality, this is illustrated by the vertical and horizontal force measurements. 192
For these five tests, the variations between the vertical forces were all less than 11.5%, except for 193
the fifth test, in which, the vertical force was 2.4% greater than that in the forth test. However, 194
the horizontal forces exhibited a decreasing trend of around -5%, which continued until the fifth 195
test. The horizontal force in the sixth test was slightly greater than that in the fifth test. This 196
indicates that the effect of remained water became negligible in the sixth test. Overall, the 197
friction number taken in the first test in the southbound is very close to those in the northbound. 198
It can be concluded that a single test is capable of providing a friction number that is reliable for 199
inventory bridge deck friction test at the network level. 200
201
ACCURACY OF A SINGLE TEST 202
203
INDOT inventory friction test program requires that the low friction numbers together with their 204
locations should be reported to districts for necessary actions. Therefore, the accuracy of test 205
result, particularly low friction numbers, is of great importance for decision making. A great 206
effort has been made by INDOT to enhance the repeatability and reproducibility of the network 207
pavement inventory friction test (4). To validate the accuracy of a single test result, surface 208
texture testing was conducted on a bridge with concrete deck on I-90. In reality, the purpose of 209
the texture test was two-fold. First, during the bridge deck test trials at the network level, this 210
bridge exhibited poor friction performance. Therefore, the texture test was conducted to verify 211
the surface friction so as to provide the detailed information at the project level. Second, it was 212
intended by the authors to convince the bridge engineers the accuracy of the inventory bridge 213
deck friction test at the network level. It is well known that the surface texture test produces the 214
mean profile depth (5) used to characterize the surface macro-texture that has been proven to be 215

the dominant factor affecting surface frictional properties216
this paper, the mean profile depth 217
information on this laser scanner can be found elsewhere 218
utilized in each test to cover a nominal 219
Presented in Table 2 are the 220
(FN) was measured on July 9, 2012221
measured on September 27, 2012. 222
MPD is 0.172 mm. It has been reported 223
pavement friction (7). To the authors’ knowledge, this is probably due mainly to the lack of 224
information on the surface micro225
However, a general rule of thumb is that FN decreases as MPD decreases. 226
when a pavement surface exhibits 227
smooth tire (8), its surface MPD is typi228
that while the bridge deck exhibited good integrity, the deck surface in the wheel path 229
middle lane had experienced medium polishing as shown in Figure 230
concluded that a single test is capable of producing 231
friction performance. In reality, 232
Figure 2 shows the 3-D graphs of the macro233
micro-texture varies differently from the macro234
micro-textures. Since the laser scanner is only capable of capturing the micro235
wavelength ranging between 0.03 mm and 0.5 mm, the author236
remarks. 237
238
TABLE 2 Bridge Deck Surface Friction and Texture Test Results239
Type of Test
Surface Friction 07/09/2012
Surface Texture 09/27/2012
240
241
FIGURE 1 Photo of the bridge deck for texture scan testing242
6
the dominant factor affecting surface frictional properties at high speed and in wet weather
ofile depth measurements were made using a laser scanner. The detailed
information on this laser scanner can be found elsewhere (6). In this paper, ten scan lines were
nominal scan area of 100 mm long and 75 mm wide.
the surface friction and texture test results. The friction number
(FN) was measured on July 9, 2012, and the surface texture mean profile depth (MPD) was
measured on September 27, 2012. It is shown that the measured FN is 22.7 and the
has been reported that the macro-texture is a poor predictor
. To the authors’ knowledge, this is probably due mainly to the lack of
information on the surface micro-texture, particularly when pavement surface is very smooth.
a general rule of thumb is that FN decreases as MPD decreases. It was indicated
exhibits a friction number of around 20 measured at 40 mph
its surface MPD is typically less than 0.25 mm. Also, visual inspection revealed
bridge deck exhibited good integrity, the deck surface in the wheel path
had experienced medium polishing as shown in Figure 1. Therefore, it can be
a single test is capable of producing accurate test result on the deck surface
friction performance. In reality, the authors did examine both the macro- and micro
D graphs of the macro-texture and micro-texture scans. Apparen
texture varies differently from the macro-texture, which decides the roles of macro
. Since the laser scanner is only capable of capturing the micro
wavelength ranging between 0.03 mm and 0.5 mm, the authors are hesitant to make conclusive
2 Bridge Deck Surface Friction and Texture Test Results
Test Date Test Parameter Average of Results
07/09/2012 FN 22.7
09/27/2012 MPD 0.172 mm
hoto of the bridge deck for texture scan testing
and in wet weather. In
using a laser scanner. The detailed
ten scan lines were
00 mm long and 75 mm wide.
The friction number
mean profile depth (MPD) was
It is shown that the measured FN is 22.7 and the measured
texture is a poor predictor of overall
. To the authors’ knowledge, this is probably due mainly to the lack of
avement surface is very smooth.
t was indicated that
at 40 mph with a
visual inspection revealed
bridge deck exhibited good integrity, the deck surface in the wheel path in the
Therefore, it can be
on the deck surface
and micro-textures.
. Apparently, the
, which decides the roles of macro- and
. Since the laser scanner is only capable of capturing the micro-textures with a
s are hesitant to make conclusive
2 Bridge Deck Surface Friction and Texture Test Results
Average of Results
hoto of the bridge deck for texture scan testing

243
(a) Macro-texture 244
FIGURE 2 3-D graphs of the macro245
246
NETWORK BRIDGE DECK FRICTION PERFOR247
248
There are about 6066 bridges on the 249
medium- and long-span bridges. A bridge is defined as a structure having an opening of more 250
than 20 feet (9). However, the classifications of short251
on the type of bridges and superstructure252
bridges in three different categories. 253
than 88 feet, which are not long enough for a single 254
having a deck length of 88 to 150 feet, which are long enough for 255
bridges in Category III are those bridges 256
one or more tests may be conducted for th257
and bridge conditions. It should be pointed that the 258
purpose of this task. In reality, field friction testing may be conducted at variable speeds. 259
Therefore, the required length for a single test change260
261
TABLE 3 Number262
Bridge Category
I
II
III
263
As mentioned earlier, INDOT starte264
2013. A total of 1225 bridges were successfully tested, including 970 bridges on interstates, 12265
bridges on US highways, and 130 bridges on State routes, which ac266
of all bridges and 30% of the bridges in categories II and III. During field testing, the typical test 267
speeds utilized by INDOT are 30 mph, 40 mph, and 50 mph. The target test speed is 40 mph to 268
7
texture (b) Micro-texture
D graphs of the macro- and micro-textures generated by the laser scanner
DECK FRICTION PERFORMANCE
on the public roads under INDOT’s jurisdiction, including short
span bridges. A bridge is defined as a structure having an opening of more
However, the classifications of short-, medium, and long-span bridges depends
e of bridges and superstructure materials. Presented in Table 2 are the numbers of
bridges in three different categories. Category I consists of bridges having a deck length of
not long enough for a single friction test. Category II includes bridges
of 88 to 150 feet, which are long enough for a single friction
bridges in Category III are those bridges having a deck length of more than 150 feet. Apparently,
one or more tests may be conducted for the bridges in category III, which depends on the traffic
It should be pointed that the above categories are defined
task. In reality, field friction testing may be conducted at variable speeds.
length for a single test changes from speed to speed.
Numbers of Bridges under Different Categories
Bridge Category Deck Length (feet) Number
< 88 1971
88 to 150 1346
> 150 2749
As mentioned earlier, INDOT started network bridge deck inventory friction testing in
bridges were successfully tested, including 970 bridges on interstates, 12
bridges on US highways, and 130 bridges on State routes, which account for approximately 20%
the bridges in categories II and III. During field testing, the typical test
speeds utilized by INDOT are 30 mph, 40 mph, and 50 mph. The target test speed is 40 mph to
s generated by the laser scanner
, including short-,
span bridges. A bridge is defined as a structure having an opening of more
span bridges depends
Presented in Table 2 are the numbers of
having a deck length of less
ry II includes bridges
friction test. The
of more than 150 feet. Apparently,
e bridges in category III, which depends on the traffic
defined solely for the
task. In reality, field friction testing may be conducted at variable speeds.
d network bridge deck inventory friction testing in
bridges were successfully tested, including 970 bridges on interstates, 125
count for approximately 20%
the bridges in categories II and III. During field testing, the typical test
speeds utilized by INDOT are 30 mph, 40 mph, and 50 mph. The target test speed is 40 mph to

avoid possible errors from data conversion. However, the test speed of 30 269
used on 2-lane roads, and 50 mph on interstates. A speed of higher than 50 mph may be used, but 270
is not recommended, particularly on bridge decks. 271
on interstates. The results demonstrated greater var272
It was notices that when applying brake at 60 mph, the test wheel experienced greater dynamic 273
contacts with the pavement surface. In addition, applying brake at 60 mph raised concerns over 274
operation safety and damage to tire. 275
Table 3 shows the summary of bridge deck friction performance by 276
network level. The bridges on interstates demonstrated the lowest average friction number and 277
the bridges on State routes demonstrated the 278
bridges on interstates and State routes experienced the same extent of variation (see coefficient 279
of variation in Table 3). To further examine the friction performance of bridge decks on different 280
highway systems, the bridge decks were divided into five groups such as Poor (FN<20), Fair 281
(FN=20 to 25), Good (FN=25-35), Very Good (FN=35282
Figure 3. It is shown that a large portion of bridge decks with p283
located on interstates. This indicates that the bridges on interstates tend to have more issues 284
associated with the deck surface friction than t285
a concrete bridge deck state. While transverse tines are commonly produced 286
the deck surface friction performance is very sensitive to the wearing action of vehicle tires.287
288
TABLE 4 Statistics of Bridge Deck Friction 289
Highway System Average
Interstate 35.1
US Highway 41.4
State Route 47.2
290
291
FIGURE 3 Distributions of 292
293
294
8
avoid possible errors from data conversion. However, the test speed of 30 mph is commonly
lane roads, and 50 mph on interstates. A speed of higher than 50 mph may be used, but
is not recommended, particularly on bridge decks. INDOT R&D conducted trial tests at 60 mph
on interstates. The results demonstrated greater variations than those measured at lower speeds.
It was notices that when applying brake at 60 mph, the test wheel experienced greater dynamic
contacts with the pavement surface. In addition, applying brake at 60 mph raised concerns over
amage to tire.
Table 3 shows the summary of bridge deck friction performance by highway system
The bridges on interstates demonstrated the lowest average friction number and
the bridges on State routes demonstrated the highest average friction number. However, the
s on interstates and State routes experienced the same extent of variation (see coefficient
To further examine the friction performance of bridge decks on different
, the bridge decks were divided into five groups such as Poor (FN<20), Fair
35), Very Good (FN=35-45), and Excellent (FN≥
It is shown that a large portion of bridge decks with poor friction performance were
This indicates that the bridges on interstates tend to have more issues
associated with the deck surface friction than those on US highways and State routes.
While transverse tines are commonly produced on the deck surface
friction performance is very sensitive to the wearing action of vehicle tires.
of Bridge Deck Friction Numbers at Network Level
Average Standard Deviation Coefficient of Variation
35.1 10.3 29 %
41.4 9.0 22 %
47.2 13.8 29 %
Distributions of bridge decks with different friction performance
mph is commonly
lane roads, and 50 mph on interstates. A speed of higher than 50 mph may be used, but
INDOT R&D conducted trial tests at 60 mph
iations than those measured at lower speeds.
It was notices that when applying brake at 60 mph, the test wheel experienced greater dynamic
contacts with the pavement surface. In addition, applying brake at 60 mph raised concerns over
highway system at the
The bridges on interstates demonstrated the lowest average friction number and
highest average friction number. However, the
s on interstates and State routes experienced the same extent of variation (see coefficient
To further examine the friction performance of bridge decks on different
, the bridge decks were divided into five groups such as Poor (FN<20), Fair
≥45) as shown in
friction performance were
This indicates that the bridges on interstates tend to have more issues
hose on US highways and State routes. Indiana is
on the deck surface,
friction performance is very sensitive to the wearing action of vehicle tires.
at Network Level
oefficient of Variation
%
%
%
fferent friction performance

9
CONCLUSIONS AND RECOMMENDATIONS 295
296
Based on the results of the verification tests and network tests, several conclusions can be drawn 297
as follows: 298
One of the main concerns associated with friction testing on bridge decks is the length of 299
bridge (deck). If tested at the standard test speed of 40 mph, the bridge should be at least 88 feet 300
long. However, the minimum length varies with the test speed used in testing. Multiple test runs 301
were conducted to verify the reliability of bridge deck friction testing and evaluate the effect of 302
water. It can be concluded that a single test is capable of providing a friction number that is 303
reliable for inventory bridge deck friction test at the network level. 304
Surface texture was utilized to verify the accuracy of bridge deck friction testing. While 305
poor correlation between macro-texture and friction has been reported, a general rule of thumb is 306
that FN decreases as MPD decreases. In this paper, the average MPD of 0.172 is very small, 307
which agrees well with the low friction numbers. Based on the test results together with field 308
visual inspection, it can be concluded that a single test is capable of producing accurate test 309
result on the deck surface friction performance. 310
Based on the INDOT experience, network bridge deck testing may cover up to 30% of 311
bridges having a deck length of more than the minimum length. This provides very good 312
representation at the network level. In addition, it was indicated that the bridges on interstates 313
tend to have more deck surface friction issues than those on US highways and State routes. 314
It is recommended that network bridge deck friction testing should be conducted at 30 315
mph, 40 mph or 50 mph, depending on the highway speed and traffic condition. A higher speed 316
such as 60 mph is not recommended because of the potential errors, safety concerns and tire 317
damage. More effort should be made to investigate the nature and effect of micro-texture that 318
plays an important role in producing long-term friction performance with HFST overlays on 319
bridge decks. 320
321
ACKNOWLEDGMENTS 322
323
The authors recognize the support from Barry Partridge, Tim Wells and Samy Noureldin of 324
INDOT to accomplish this task. The authors would also like to thank Karen Zhu, Patrick 325
Weaver, Victor Hong, and Jaffar Golkhajeh of INDOT and Rob Ladson of ITR Concession 326
Company LLC for their help in field testing and data processing. The contents of this paper 327
reflect the views of the authors, who are responsible for the facts and the accuracy of the data 328
presented herein, and do not necessarily reflect the official views or policies of the sponsoring 329
organizations. These contents do not constitute a standard, specification, or regulation. 330
331
REFERENCES 332
333
1. Shuo Li, Karen Zhu, Samy Noureldin, and Yi Jiang (2009). ”Evaluation of Pavement Friction 334
Performance on Interchange Ramps at Network Level.” Journal of Performance of 335
Constructed Facilities, 23(2), 109–114. 336
2. ASTM E274M, 2011, “Standard Test Method for Skid Resistance of Paved Surfaces Using a 337
Full-Scale Tire,” ASTM International, West Conshohocken, PA, 2011, 338
DOI:10.1520./E0274M-11, www.astm.org. 339
10
3. ASTM E524-88, 2000, “Standard Specification for Standard Smooth Tire for Pavement Skid-340
Resistance Tests,” ASTM International, West Conshohocken, PA, 2000, DOI: 341
10.1520/E0524-88R00, www.astm.org. 342
4. Shuo Li, Samy Noureldin, and Karen Zhu (2007). “Realistic Approach for Enhancing 343
Reliability of Pavement Surface Friction Testing,” Journal of ASTM International, Vol. 3, 344
No. 9, 73-80. 345
5. ASTM E1845-09, 2009, “Standard Practice for Calculating Pavement Macrotexture Mean 346
Profile Depth,” ASTM International, West Conshohocken, PA, 2001, DOI: 1 DOI: 347
10.1520/E1845-09, www.astm.org. 348
6. Shuo Li, Samy Noureldin and Karen Zhu (2010). Safety Enhancement of the INDOT Network 349
Pavement Friction Testing Program: Macrotexture and Microtexture Testing Using Laser 350
Sensors, Final Report, FHWA/IN/JTRP-2010/25, Joint Transportation Research Program, 351
Indiana Department of Transportation and Purdue University, West Lafayette, Indiana. 352
7. N. Mike Jackson, Bouzid Choubane, Charles Holzschuher, and Salil Gokhale (2007). 353
“Measuring Pavement Friction Characteristics at Variable Speeds for Added Safety,” Journal 354
of ASTM International, Vol. 3, No. 9, 59-72. 355
8. Shuo Li, Yanna Sun, Yi Jiang, Samy Noureldin, and Todd Shields (2012). “Field Evaluation 356
of Ultrathin 4.75-mm Hot Mix Asphalt Dense-Graded Overlay: Aggregate Properties and 357
Pavement Surface Friction,” CD-ROM. TRB 91st Annual Meeting, Transportation Research 358
Board, January 22 to January 26, 2012. 359
9. 23 CFR Part 650, Subpart C-National Bridge Inspection Standards, Federal Highway 360
Administration, U.S. Department of Transportation, 2004. 361