Embed Size (px)
Citation preview
©2004 Koch Materials Company. TRB 2004 tack.ppt rev 1/11/04
1
Look Ma, No MessLook Ma, Look Ma, No MessNo Mess
New Approaches to Tack Application
TRB, January 14, 2004
TopicsTopicsTopics
• The need for a tack coat– Strains, strength &
pavement life
• Improved tack technologies– Performance-related testing
• Measuring bond strength
– Materials & construction techniques
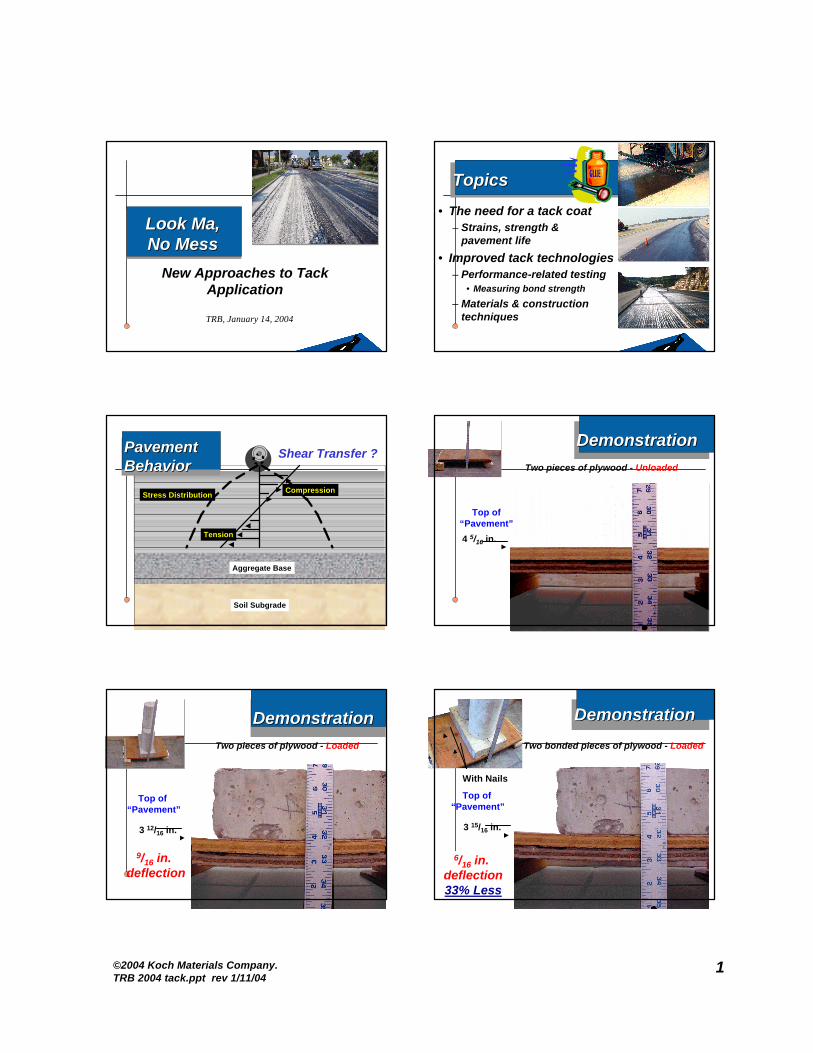
Tension
Stress Distribution
Soil Subgrade
Aggregate Base
Shear Transfer ?Pavement BehaviorPavement Pavement BehaviorBehavior
Compression
4 5/16 in.
DemonstrationDemonstrationDemonstrationTwo pieces of plywood - Unloaded
Top of “Pavement”
3 12/16 in.
Top of “Pavement”
9/16 in. deflection
DemonstrationDemonstrationDemonstrationTwo pieces of plywood - Loaded
DemonstrationDemonstrationDemonstration
Two bonded pieces of plywood - Loaded
With Nails
3 15/16 in.
Top of “Pavement”
6/16 in. deflection33% Less
©2004 Koch Materials Company. TRB 2004 tack.ppt rev 1/11/04
2
What’s the Impact of Bonding Strength?What’s the Impact of What’s the Impact of Bonding Strength?Bonding Strength?
6 in. Aggregate Base (207 MPa)
4 in. Asphalt Concrete (3447 MPa)
4 in. Asphalt Concrete (2758 MPa)
Subgrade Soil (5 & 10 ksi)(34 & 68 MPa)
9,000 & 12,000 lbs(40 & 53 kN)
VaryingDegrees of Slip(0 to 1000) Between Layers
BISAR
More Slip -More Deflection at SubgradeMore Slip More Slip --More Deflection at SubgradeMore Deflection at Subgrade
0
5
10
15
20
25
30
35
40
45
0 200 400 600 800 1000
Relative Interface Slip
Deflection at top of
Subgrade (mils) 5 ksi SG; 12000 lbs
5 ksi SG; 9000 lbs10 ksi SG; 12000 lbs10 ksi SG; 9000 lbsBond
No Bond
Increasing Deflection
More Slip -More Vertical StressMore Slip More Slip --More Vertical StressMore Vertical Stress
0
1
2
3
4
5
6
7
8
9
10
0 200 400 600 800 1000Relative Interface Slip
Vertical Stress at
Top of Subgrade
(psi)5 ksi SG; 12000 lbs5 ksi SG; 9000 lbs10 ksi SG; 12000 lbs10 ksi SG; 9000 lbsBond
No Bond
Increasing Subgrade Stress
More Slip -More StrainMore Slip More Slip --More StrainMore Strain
0
200
400
600
800
1000
1200
0 200 400 600 800 1000Relative Interface Slip
Vertical Microstrain
at Top of Subgrade 5 ksi SG; 12000 lbs
5 ksi SG; 9000 lbs10 ksi SG; 12000 lbs10 ksi SG; 9000 lbsBond
No Bond
Increasing Strain at Subgrade
More Slip -Lower Deformation LifeMore Slip More Slip --Lower Deformation LifeLower Deformation Life
0
500,000
1,000,000
1,500,000
2,000,000
2,500,000
3,000,000
0 200 400 600 800 1000
Relative Interface Slip
Repetitions to
Deform-ation
Failure, NF
5 ksi SG; 12000 lbs5 ksi SG; 9000 lbs10 ksi SG; 12000 lbs10 ksi SG; 9000 lbs
BondNo
Bond
Decreasing Deformation Life
Failure Criteria:0.5” Rut
More Slip -More AC Tensile Strain at BottomMore Slip More Slip --More AC Tensile Strain at BottomMore AC Tensile Strain at Bottom
0
50
100
150
200
250
300
0 200 400 600 800 1000
Relative Interface Slip
Horizontal Microstrain at bottom of HMA
5 ksi SG; 12000 lbs5 ksi SG; 9000 lbs10 ksi SG; 12000 lbs10 ksi SG; 9000 lbs
BondNo
Bond
Increasing AC Tensile Strain
©2004 Koch Materials Company. TRB 2004 tack.ppt rev 1/11/04
3
More Slip -More Stress mid ACMore Slip More Slip --More Stress mid ACMore Stress mid AC
-40-20
020406080
100120140160
0 200 400 600 800 1000
Relative Interface Slip
Horizontal Stress -
Mid AC (PSI)
5 ksi SG; 12000 lbs5 ksi SG; 9000 lbs10 ksi SG; 12000 lbs10 ksi SG; 9000 lbs
BondNo
Bond
Middle of AC - Not in Compression!
More Slip -More Tensile Strain mid ACMore Slip More Slip --More Tensile Strain mid ACMore Tensile Strain mid AC
0
50
100
150
200
250
300
350
0 200 400 600 800 1000
Relative Interface Slip
Horizontal Microstrain
Mid AC 5 ksi SG; 12000 lbs5 ksi SG; 9000 lbs10 ksi SG; 12000 lbs10 ksi SG; 9000 lbs
BondNo
Bond
Increasing Mid AC TENSILE Strain
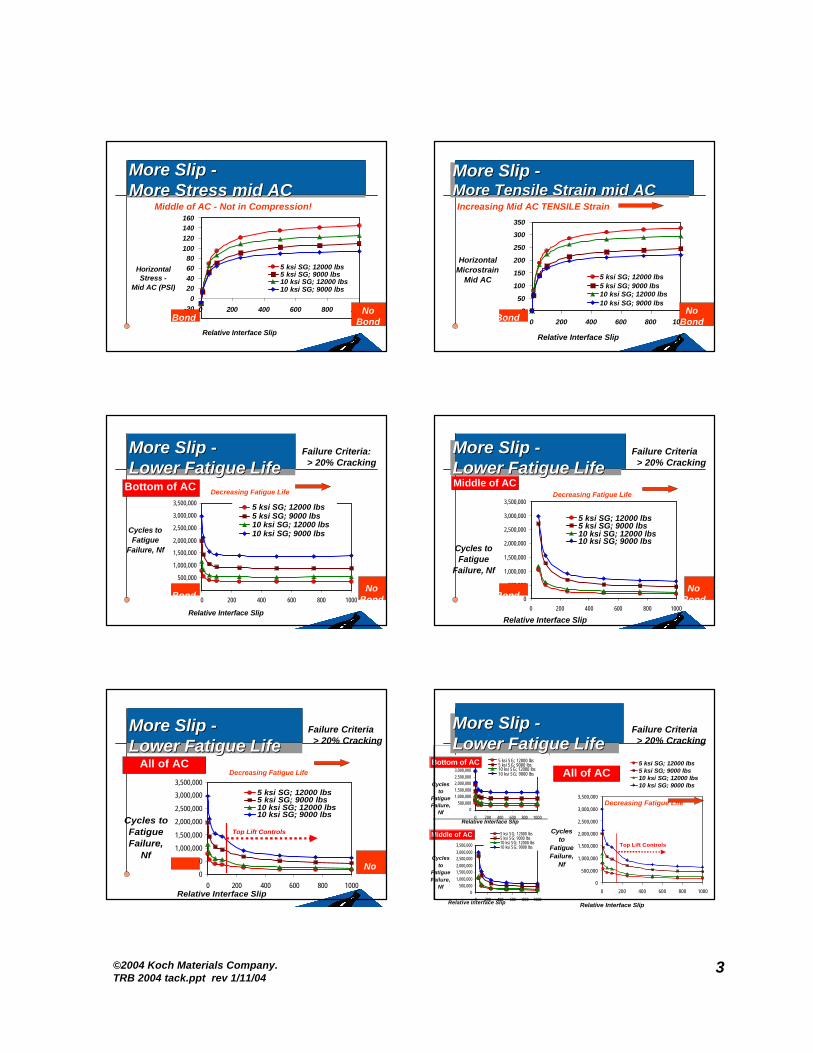
More Slip -Lower Fatigue LifeMore Slip More Slip --Lower Fatigue LifeLower Fatigue Life
0
500,000
1,000,000
1,500,000
2,000,000
2,500,000
3,000,000
3,500,000
0 200 400 600 800 1000
Relative Interface Slip
Cycles to Fatigue
Failure, Nf
5 ksi SG; 12000 lbs5 ksi SG; 9000 lbs10 ksi SG; 12000 lbs10 ksi SG; 9000 lbs
Bottom of AC
BondNo
Bond
Decreasing Fatigue Life
Failure Criteria:> 20% Cracking
More Slip -Lower Fatigue LifeMore Slip More Slip --Lower Fatigue LifeLower Fatigue Life
0
500,000
1,000,000
1,500,000
2,000,000
2,500,000
3,000,000
3,500,000
0 200 400 600 800 1000
Relative Interface Slip
Cycles to Fatigue
Failure, Nf
5 ksi SG; 12000 lbs5 ksi SG; 9000 lbs10 ksi SG; 12000 lbs10 ksi SG; 9000 lbs
Middle of AC
BondNo
Bond
Decreasing Fatigue Life
Failure Criteria> 20% Cracking
More Slip -Lower Fatigue LifeMore Slip More Slip --Lower Fatigue LifeLower Fatigue Life
Failure Criteria> 20% Cracking
0
500,000
1,000,000
1,500,000
2,000,000
2,500,000
3,000,000
3,500,000
0 200 400 600 800 1000Relative Interface Slip
Cycles to Fatigue Failure,
Nf
5 ksi SG; 12000 lbs5 ksi SG; 9000 lbs10 ksi SG; 12000 lbs10 ksi SG; 9000 lbs
All of AC
Top Lift Controls
BondNo
Bond
Decreasing Fatigue Life
Failure Criteria> 20% Cracking
0500,000
1,000,0001,500,0002,000,0002,500,0003,000,0003,500,000
0 200 400 600 800 1000Relative Interface Slip
Cycles to
Fatigue Failure,
Nf
5 ksi SG; 12000 lbs5 ksi SG; 9000 lbs10 ksi SG; 12000 lbs10 ksi SG; 9000 lbs
Bottom of AC
0500,000
1,000,000
1,500,0002,000,000
2,500,0003,000,000
3,500,000
0 200 400 600 800 1000Relative Interface Slip
Cycles to
Fatigue Failure,
Nf
5 ksi SG; 12000 lbs5 ksi SG; 9000 lbs10 ksi SG; 12000 lbs10 ksi SG; 9000 lbs
Middle of AC
0
500,000
1,000,000
1,500,000
2,000,000
2,500,000
3,000,000
3,500,000
0 200 400 600 800 1000
Relative Interface Slip
Cycles to
Fatigue Failure,
Nf
5 ksi SG; 12000 lbs5 ksi SG; 9000 lbs10 ksi SG; 12000 lbs10 ksi SG; 9000 lbs
All of AC
Top Lift Controls
Decreasing Fatigue Life
More Slip -Lower Fatigue LifeMore Slip More Slip --Lower Fatigue LifeLower Fatigue Life
©2004 Koch Materials Company. TRB 2004 tack.ppt rev 1/11/04
4
Horizontal Loads & Slip?Horizontal Loads & Slip?Horizontal Loads & Slip?
8.5” Base (1000 and 350 MPa)
2” Asphalt Concrete (3100 MPa)
1.5” Asphalt Concrete (3100 MPa)
Subgrade Soil (83 MPa)
Subgrade Soil (24.3 MPa)
- Romanoschi & Metcalf (TRB 2001)ABAQUS
17,600,00014,200AggregateLost Bond (Vert & Horiz)
31,600,000135,000AggregateFull Bond (Vert & Horiz)
33,100,000227,000AggregateFull Bond (Vertical only)
49,600,00028,000Soil Cement
Lost Bond (Vert & Horiz)
90,300,000355,000,000Soil Cement
Full Bond (Vert & Horiz)
95,300,000766,000,000Soil Cement
Full Bond(Vertical only)
Subgrade Deformation Life (reps)
Fatigue Life (Reps)Type of
BaseInterface Condition
What Affects Interface Bonding ?What Affects Interface What Affects Interface Bonding ?Bonding ?
• Temperature• Normal Stress• Application Rate• Type of Tack Material• Moisture• Aggregate interlock / milling
Improved tack technologies
Improved tack Improved tack technologiestechnologies
Performance-related testingMeasuring bond strength
Photo courtesy Florida DOT
Uzan, et. al.Direct Shear TestingUzan, et. al.Uzan, et. al.Direct Shear TestingDirect Shear Testing• 2.5 mm/min until failure• Pen 60-70• Tack Coats increase interface strength• Optimum App Rate : At 25oC, 0.22 gal/SY• Optimum App Rate : At 55oC, 0.11 gal/SY
Uzan, Livneh, and Eshed, AAPT 1978
Shear
International Bitumen Emulsion Federation
Worldwide Survey ResultsInternational Bitumen Emulsion Federation International Bitumen Emulsion Federation
Worldwide Survey ResultsWorldwide Survey Results• Design models: bond affects long-term
structural behavior• Most countries have liquid test specs• Only a few bond-strength performance
tests:– Austria: shear resistance test– Switzerland: SN 671 961 - tensile strength test– United Kingdom draft: torsion test
Chaignon, International Symposium on Asphalt Emulsion Technology, 1999
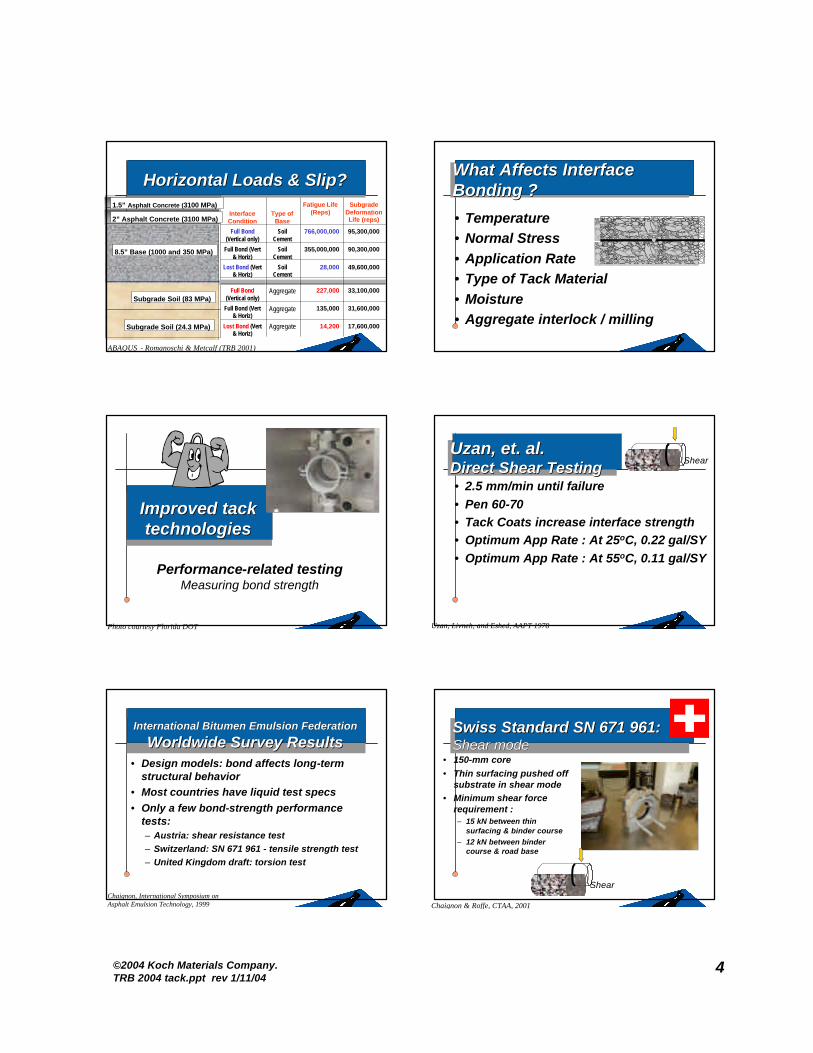
Swiss Standard SN 671 961:Shear modeSwiss Standard SN 671 961:Swiss Standard SN 671 961:Shear modeShear mode
• 150-mm core• Thin surfacing pushed off
substrate in shear mode• Minimum shear force
requirement :– 15 kN between thin
surfacing & binder course– 12 kN between binder
course & road base
Chaignon & Roffe, CTAA, 2001
Shear
©2004 Koch Materials Company. TRB 2004 tack.ppt rev 1/11/04
5
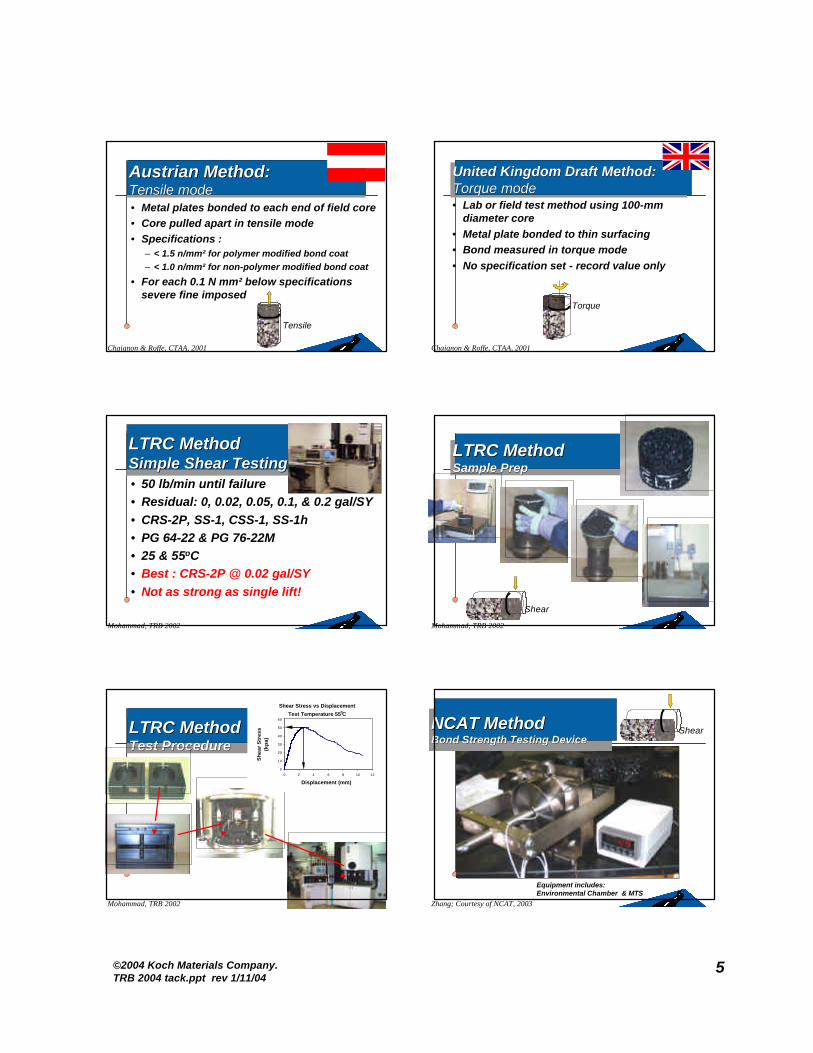
Austrian Method:Tensile modeAustrian Method:Austrian Method:Tensile modeTensile mode• Metal plates bonded to each end of field core • Core pulled apart in tensile mode• Specifications :
– < 1.5 n/mm² for polymer modified bond coat– < 1.0 n/mm² for non-polymer modified bond coat
• For each 0.1 N mm² below specifications severe fine imposed
Tensile
Chaignon & Roffe, CTAA, 2001
United Kingdom Draft Method:Torque modeUnited Kingdom Draft Method:United Kingdom Draft Method:Torque modeTorque mode• Lab or field test method using 100-mm
diameter core• Metal plate bonded to thin surfacing• Bond measured in torque mode• No specification set - record value only
Torque
Chaignon & Roffe, CTAA, 2001
LTRC Method Simple Shear TestingLTRC Method LTRC Method Simple Shear TestingSimple Shear Testing
Mohammad, TRB 2002
• 50 lb/min until failure• Residual: 0, 0.02, 0.05, 0.1, & 0.2 gal/SY• CRS-2P, SS-1, CSS-1, SS-1h• PG 64-22 & PG 76-22M• 25 & 55oC• Best : CRS-2P @ 0.02 gal/SY• Not as strong as single lift!
LTRC MethodSample PrepLTRC MethodLTRC MethodSample PrepSample Prep
Shear
Mohammad, TRB 2002
LTRC MethodTest ProcedureLTRC MethodLTRC MethodTest ProcedureTest Procedure
Shear Stress vs Displacement
Test Temperature 550C
0
10
20
30
40
50
60
0 2 4 6 8 10 12
Displacement (mm)
Sh
ear
Str
ess
(kp
a)
Mohammad, TRB 2002 Zhang; Courtesy of NCAT, 2003
NCAT MethodBond Strength Testing DeviceNCAT MethodNCAT MethodBond Strength Testing DeviceBond Strength Testing Device
Shear
Equipment includes:Environmental Chamber & MTS
©2004 Koch Materials Company. TRB 2004 tack.ppt rev 1/11/04
6
NCAT MethodLoading EquipmentNCAT MethodNCAT MethodLoading EquipmentLoading Equipment
Shear Loading Rate: 2”/minParameters: Shear strength
Shear deformationDissipated energy
Zhang; Courtesy of NCAT
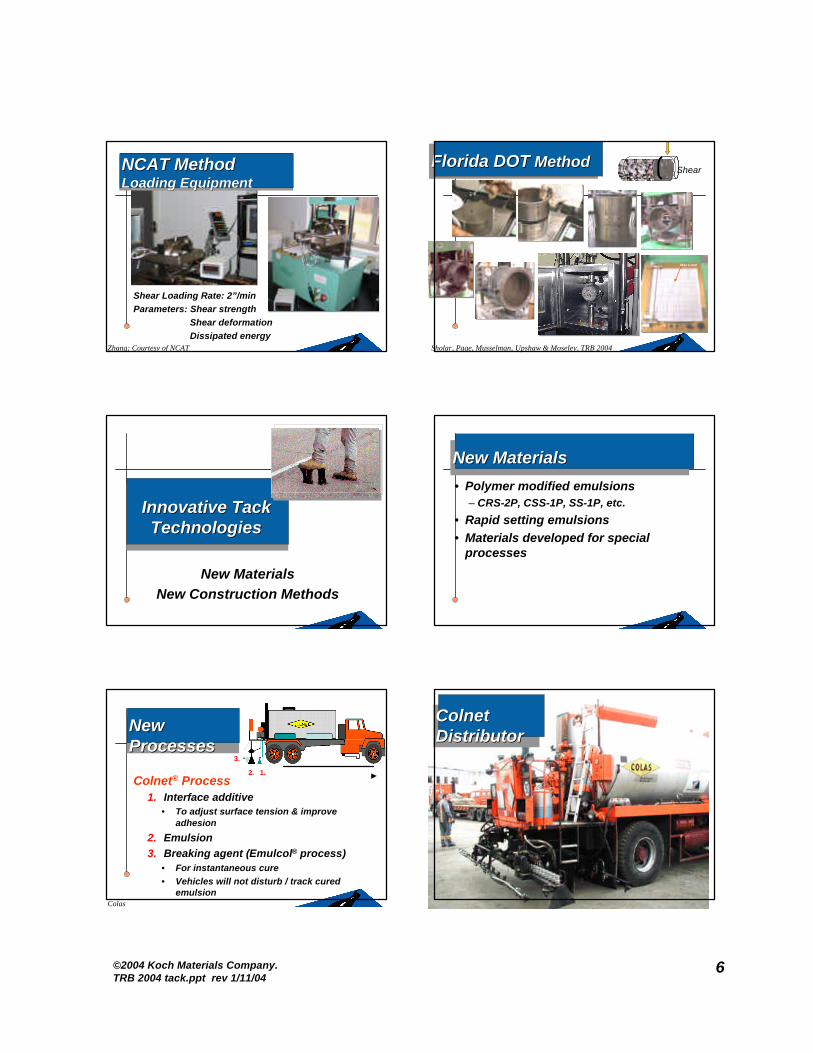
Florida DOT MethodFlorida DOT Florida DOT MethodMethod
Sholar, Page, Musselman, Upshaw & Moseley, TRB 2004
Shear
Max LoadMax LoadMax LoadMax Load
Innovative Tack Technologies
Innovative Tack Innovative Tack TechnologiesTechnologies
New MaterialsNew Construction Methods
New MaterialsNew MaterialsNew Materials
• Polymer modified emulsions– CRS-2P, CSS-1P, SS-1P, etc.
• Rapid setting emulsions• Materials developed for special
processes
Colnet® Process 1. Interface additive
• To adjust surface tension & improve adhesion
2. Emulsion3. Breaking agent (Emulcol® process)
• For instantaneous cure• Vehicles will not disturb / track cured
emulsionColas
1.2.
3.
New ProcessesNew New ProcessesProcesses
Colnet DistributorColnet Colnet DistributorDistributor
©2004 Koch Materials Company. TRB 2004 tack.ppt rev 1/11/04
7
New ProcessesNew ProcessesNew ProcessesUltrathin bonded wearing course
– Tack: Polymer emulsion membrane
– Special machine applies both tack & PMAC
– Heavier membrane application; hot AC cures emulsion
– HMA applied without
damaging membrane
– No emulsion tracking
– Traffic in <15 minutes
Emulsion applicationHMA application
One-Pass PaverOneOne--Pass PaverPass Paver
One-pass PaverOneOne--pass Paverpass Paver
Existing Pavement
The emulsion membrane “wicks up” around the HMA aggregates
9-12 µmcoating on aggregates
5/8” minimum
Depth of Mix
The UTBWC ProcessThe UTBWC ProcessThe UTBWC Process
3/16”Emulsionmembrane
depth
The emulsion cures, bonding the mix & pavement
3/8” Nominal Ag Size
UTBWC One-Pass Machine -New applications
UTBWC OneUTBWC One--Pass Machine Pass Machine --New applicationsNew applications
• Florida DOT– 2003: 5 test sections on US 27
– UTBWC (FDOT bonded asphalt concrete friction course, BACFC), FDOT FC-5 (open graded GTR crumb rubber mix), with & without special machine
– Preliminary results: one-pass machine placed materials look best
Engineering News Record, 3/3/03
UTBWC One-Pass Machine -New applications
UTBWC OneUTBWC One--Pass Machine Pass Machine --New applicationsNew applications
• Arizona– 2003: UTBWC with asphalt-rubber
binder in HMA
• Texas DOT– 2004: Thin Bonded Permeable
Friction Course (TBPFC) over PCC
©2004 Koch Materials Company. TRB 2004 tack.ppt rev 1/11/04
8
Lessons learned:Lessons learned:Lessons learned:• Bonding between lifts essential for pavement
design life
• Performance tests & specifications needed for bond strength
• Stronger binders (PMA) & faster breaking emulsions can help
• Improved construction equipment – reduces tracking – allows heavier application of modified emulsions
Thank You.Thank You.Thank You.
. . . Longer Lasting Roads
Questions?Questions?Questions?