Embed Size (px)
Citation preview

Traveltimes of Flood Waves on the New River Between Hinton and Hawks Nest, West Virginia
By D. H. Appel
Prepared in cooperation with the National Park Service and the West Virginia Geological and Economic Survey
U.S. GEOLOGICAL SURVEY WATER-SUPPLY PAPER 2225

UNITED STATES DEPARTMENT OF THE INTERIOR
JAMES G. WATT, Secretary
GEOLOGICAL SURVEY
Dallas L. Peck, Director
UNITED STATES GOVERNMENT PRINTING OFFICE 1983
For sale by Distribution Branch Text Products Section U.S. Geological Survey 604 South Pickett Street Alexandria, Virginia 22304
Library of Congress Cataloging in Publication Data
Appel, D. H.Traveltimes of flood waves on the New River between
Hinton and Hawks Nest, West Virginia.
(U.S. Geological Survey water-supply paper; 2225)Bibliography: p.Supt. of Docs, no.: I 19.13:1. Flood routing. 2. New River (N.C.-W. Va.) Floods.
3. Floods West Virginia. I. United States. National Park Service. II. West Virginia Geological and Economic Survey. III. Title. IV. Series: Geological Survey water-supply paper; 2225. GB1225.W4A66 1983 551.48'3'097547 82-600379

CONTENTSAbstract 1Introduction 2History of the area 4
General geologic history 4Recent history 4
River-flow characteristics 5Monthly and daily flows 5Traveltime 7Thurmond gaging station 11Fayettegage 12
Summary 12
FIGURES
1. General location map 22. Map of study area 33. Generalized stratigraphic column for the New River Gorge 44. Photograph of small-town depot in Gorge 55. Photograph of coal miners at Elverton 66. Bar graph of mean-monthly flows of the New River at Hinton
from 1948 to 1979 77. Bar graph of daily-flow variance for the New River at Hinton
from 1948 to 1979 88. Graph showing traveltimes of flood waves at selected stream-
flows in the New River between Hinton and Hawks Nest 99. Graph showing traveltimes of flood waves from Hinton to
selected communities in the New River Gorge 1010. River stage-streamflow rating curve for the New River at
Thurmond 1111. River stage-streamflow rating curve for the New River at the
Fayette bridge 1312. Curve relating river stage at Thurmond and Fayette 14
TABLES
1. New River miles 112. River stage-streamflow rating table for the New River at Thurmond 12
Cover photograph: Whitewater boating, one of the New River's main attractions. (Photograph from the National Park Service collection.)
Contents III

Traveltimes of Flood Waves on the New River Between Hinton and Hawks Nest, West Virginia
By D. H. Appel
Abstract
The New River Gorge National River's [a 51-mile seg ment of the New River between Hinton and Fayette (an aban doned community), W. Va.] main attraction is a combination of scenic wilderness, fishing, cultural resources, and white- water boating. However, recreational quality, safety, and use of the river depends in part upon the amount and fluctuations in streamflow, manmade and natural. During 1981 and 1982, the U.S. Geological Survey found that the flood wave travels at an average speed of 6.8 miles per hour when streamflow is 15,000 cubic feet per second and 3.5 miles per hour when streamflow is 2,200 cubic feet per second. Curves have been developed to estimate traveltimes between any two points within the National River jurisdiction.
The gaging station at Thurmond, installed as part of this study, can be called by telephone, (304) 465-0493, to deter mine river stage. The river stage can be converted to stream- flow and traveltimes.
INTRODUCTION
The New River flows northward from its head waters in North Carolina, through western Virginia, and into south-central West Virginia, where it joins the Gauley River at Gauley Bridge to form the Kanawha River (fig. 1). The New River Gorge National River was established by Public Law 95-625 on November 10, 1978, and falls within the jurisdiction of the U.S. Department of Interior, National Park Service (NPS). The NPS is responsible for conserving the outstanding natural, scenic, and historical values and objects and preserving a segment of the New River in West Virginia as a free-flowing stream for the enjoyment and benefit of present and future generations. This report, prepared for the NPS, summarizes the results of a study of the time of travel of flood waves on the 56-mile (mi) reach of river between Hinton and Hawks Nest, W. Va. (fig. 2). The New River Gorge National River falls within this reach of the river. The National River's main attraction is a combination of scenic wilderness, fishing, and ex cellent whitewater boating. Approximately 60,000 peo ple rafted on the 34-mi reach of river between Prince and Hawks Nest, W. Va., and about 100,000 hours (hr) were expended by anglers between Bluestone Dam and Meadow Creek in 1980 (fig. 2). The recreational quality and safety depends in part upon the regulated flow from Bluestone Dam and unregulated flow from the Green- brier River.
The Water Resources Division of the U.S. Geo logical Survey, in cooperation with the National Park Service and the West Virginia Geological and Economic Survey, has studied the time of travel of flood waves on the New River from Hinton to Hawks Nest. Flood waves, as used in this report, refer to any rapid rise in river stage caused by natural runoff from storms and releases from Bluestone Dam. Flood-wave traveltimes were determined by following waves from controlled releases from Bluestone Dam downstream to selected observation points, bridges, and gaging stations where temporary staff gages had been established. The results of this study can be used to predict whitewater condi tions in the boating and recreational areas. River miles for all bridges and other selected observation points above Gauley Bridge are listed in table 1. Selected mile ages are shown on figure 2. Curves presented in this report apply to wave traveltime only. They do not apply to the traveltime of dissolved contaminants that may be accidently spilled or discharged into the river.
The West Virginia Geological and Economic Sur vey provided information used in the geologic section of this report, and the U.S. Army Corps of Engineers, Huntington District, provided the special flow condi tions for the study by regulating outflow from Blue- stone Dam.
Table 1. New River miles
Miles upstream _________Location_________from Gauley Bridge
Confluence of New and GauleyRivers at Gauley Bridge--
Highway 16 bridge at Cotton Hill ----- C&O Railroad bridge at Hawks Nest Highway 82 bridge at Fayette
(Staff Gage) C&O Railroad bridge upstream fromCaperton
C&O Railroad/Highway bridge atThurmond
USGS gaging station (Thurmond) Highway 25 bridge at Stone Cliff Highway 41 bridge at Prince C&O Railroad bridge at Prince Meadow Creek (no bridge) Sandstone (no bridge) Highway 20 bridge at Hinton USGS gaging station (Hinton) Highway 3 bridge at Bellepoint Bluestone Dam
0.05.7 7.6
12.3
18.3
25.926.027.439.839.950.954.363.563.665.265.9
Introduction 1

0 25 50 75 100 125 KILOMETERS
Figure 1. General location of the New River.
2 Traveltimes of Flood Waves on the New River Between Hinton and Hawks Nest, West Virginia

38°15'
^ftm^iji^^tm -} <*»^_ ^^ &ty !^^;^-M3 1W
,.. .., '" ^.^/^ 'M : ; ' JoGV'-r-- ____,1 \ -'," .v"-"\ ^ -. \1-"^-.,../^.^W' \80°45'
20 KILOMETERS
EXPLANATION
54.3 River mile, upstream from Gauley Bridge
National river boundary
Figure 2. Study area and New River Gorge National River.
Introduction 3

HISTORY OF THE AREA
General Geologic History
The New River has cut the gorge from Hinton to Gauley Bridge, exposing rocks that permit a view and interpretation of the local geology. The river gradually drops 750 feet (ft) in elevation between Hinton and Gauley Bridge (12 ft/mi). The river flows northward; the average elevation of the surrounding ridges de creases northward; and the rocks dip northward. As the inclination or dip of the rock is greater than the fall of the river, each successive layer of rock disappears under the river as one travels northward.
The rocks exposed in the gorge (fig. 3) are cate gorized into two groups: the oldest is of Mississippian age (the Mauch Chunk Group) and the youngest is of Pennsylvanian age (the Pottsville Group). The Pottsville Group is distinctive because it contains many of the commercial coal beds in West Virginia. Figure 3 shows where selected communities are situated with respect to the stratigraphic column exposed along the river.
Total thickness of the exposed rocks is about 4,000 ft, but this is not to be confused with the maximum depth of the gorge, which is about 1,600 ft. Numerous studies worldwide indicate that it probably took 7 mil lion to 10 million years (yr) to deposit these 4,000 ft of sand, mud, coal, and sediments that were later consoli dated into rocks. Thus, each foot of rock took approxi mately 2,000 yr to accumulate. The formations exposed in the gorge span a time in the Earth's history from about 320 million to 330 million yr ago.
The dominant rocks in the gorge are nonmarine shale and sandstone. These are clastic rocks derived from the deposition of sediments eroded from preexist ing rocks. Some are coarse grained, such as the Prince- ton Formation, whereas others, such as shale beds, are very fine grained. The coal, on the other hand, was formed from the deposition and compaction of dead plants and trees, some of which can still be identified in the coal. The characteristics of the rocks and fossils indicate the depositional environment and, to some degree, the source material of the clastic material. A highland to the southeast, approximately where the Blue Ridge Mountains are today, was the major source of sediments for these rocks.
The information presented in this section was based on written communication from Peter Lessing of the West Virginia Geological and Economic Survey (1982).
More detailed geologic information of the area is available in reports published by the West Virginia Geo logical and Economic Survey and from the U.S. Geo logical Survey.
FORMATION
XXX
LLJ CC
(J
0 N0LJJ_l
Q_
.
k/V
S/X/S XV XV XV XV XV XV /X
Q
O DCLLJD_
Z
Z
_J
Z
LJJ D_
QOCCLJJD_
Z
EQ.
(/)0)
0)
s
k/VA
\S V
0-D0CC0LLJ
C/3
OQ_
Q_DOQC0
2D IO
IO
<
/S/sJ
' ^* \S \S ^f ^
KANAWHA
NEW RIVER
POCAHONTAS
BLUESTONE
PRINCETON
HINTON
BLUEFIELD
VX\XXXV/X/V/
SELECTED COMMUNITIESAND THEIR RELATIVEPOSITION IN THESTRATIGRAPHIC COLUMN
Hawks Nest
Fayette
Caperton
Stonecliff
Prince
Meadow Creek Hinton
Sandstone
Figure 3. Generalized stratigraphic column for the New River Gorge, W. Va. (Modified from Peter Lessing, written commun., 1982.)
Recent History
The New River Gorge was discovered by early set tlers in approximately 1671. By the 1800's, settlers num bered in the few thousands. From 1869 to 1873, the Chesapeake and Ohio Railroad constructed a main line along the bottom of the gorge for hauling coal. The rail road opened the valuable coal fields for commercial development, and over a dozen small towns were built in the gorge. The railroad depot at Fire Creek (fig. 4) was typical in the area.
Thurmond is one of those towns still in existence. Originally, it had no roads leading to it, and the railroad
4 Traveltimes of Flood Waves on the New River Between Hinton and Hawks Nest, West Virginia

Figure 4. Small-town depot in gorge. (Photograph from National Park Service Collection.)
tracks were the main street. This town was reportedly the commercial and social center of the New River coal fields. In the 1930's, business began moving from the gorge to the towns on the plateau, causing the decline and eventual abandonment of most of the gorge's boom towns. The peak year for coal production was 1947, when approximately 4,800 miners were working in the gorge (fig. 5). In contrast, only about 600 miners worked the same area in 1968 because of increased mechanization in the mines and a depressed coal mar ket. As mining and population decreased, the economy correspondingly decreased. Thousands of acres of farm land have reverted to forest, and the area is now in a more natural state than it was 30 years ago.
More detailed information concerning the history of the New River Gorge can be obtained from the Na tional Park Service and the West Virginia Department of Culture and History, Archives and History Branch.
RIVER-FLOW CHARACTERISTICS
Monthly and Daily Flows
The best whitewater boating in this reach of the New River is when the river flows between 3,000 and 15,000 cubic feet per second (ftVs). The whitewater- boating season is generally between April and October. The bar graph (fig. 6) shows the mean-monthly flows of the New River at Hinton (mile 63.6) from 1948 to 1979. Flow characteristics at Hinton are representative of those at Thurmond. The graph also shows general river- flow conditions at Hinton; maximum flow is from February to April, whereas minimum flow is from July to September. Note that monthly-mean flows fluctuate widely from year to year. For example, monthly-mean flow in March ranged from 7,380 ftVs in 1976 to 32,400
River-Flow Characteristics 5

1 E n I I 5'
Figu
re 5
. C
oal
min
ers
at E
lver
ton.
(P
hoto
grap
h Fr
om N
atio
nal
Par
k S
ervi
ce C
olle
ctio
n.)

35,000
30.000
O 25,000Zo (JLLJ
CC LLJ Q_
20.000LJJ LL.
OmD Oz 15,000
O
LU CC. I- C/5 10,000 -I
EXPLANATION
MAXIMUM MONTHLY MEAN
MEAN MONTHLY
MINIMUM MONTHLY MEAN
5000
Jan. Feb. Mar. Apr. May June July Aug. Sept. Oct. Nov. Dec.
Figure 6. Mean-monthly flows of the New River at Hinton from 1948 to 1979.
ftVs in 1955; the mean-monthly flow in March from 1948 to 1979 was 16,200 ftVs.
The daily-mean flows can be expected to fluctuate even more widely than the monthly-mean flows. Figure 7 shows the average number of days per month that flow either exceeds 16,000 ftVs or is less than 2,800 ftVs at Hinton from 1948 to 1979.
Traveltime
The stage (height of water surface above some arbitrary datum) and flow of the New River in the gorge are affected by operation of Bluestone Dam on the New River and unregulated flow from the Greenbrier River.
River-Flow Characteristics 7

EXPLANATION
AVERAGE NUMBER OF DAYS PER MONTH FLOW WAS LESS THAN 2800ft 3/S
AVERAGE NUMBER OF DAYS PER MONTH FLOW EXCEEDED 16,000 ft 3/S
Jan. Feb. Mar. Apr. May I June July Aug. Sept. Oct. Nov.
MONTHS
Figure 7. Daily-flow variance of the New River at Hinton from 1948 to 1979.
Dec.
River stage and flow can change rapidly from rainfall and from operation of the dam. Therefore, for recrea tion and safety, it is important to users of the river to know the approximate time a flood wave takes to travel down the river.
Traveltimes of flood waves from Bluestone Dam to Hawks Nest were determined by following controlled releases from the dam as they moved downstream through the New River Gorge. Traveltime data were col lected at seven sites for two flow rates (2,200 and 15,000 ftVs) from November 1981 to February 1982. Travel- times of several selected waves were also computed from gaging-station records from Hinton and Thurmond.
The time for a flood wave to move from Hinton (mile 63.6) to any point as far downstream as Fayette at
four different flow rates and to Hawks Nest at 15,000 ftVs is shown in figure 8. Traveltimes for streamflows less than 15,000 ftVs between Fayette and Hawks Nest were not determined because the operation of the powerplant and dam at Hawks Nest distorts the flood wave. Figure 8 can be used to compute approximate traveltimes between any two points in the 51-mi reach of river between Hinton and Fayette at flows between 2,200 and 15,000 ftVs. When the streamflow is 15,000 ftVs, a flood wave travels between Hinton and Fayette in 7.5 hours at an average speed of 6.8 mi/hr. However, when streamflow is 2,200 ftVs, the average speed is only 3.5 mi/hr.
Figure 9 shows the time for a wave to travel from Hinton to Sandstone (mile 54.3), Meadow Creek (mile
8 Traveltimes of Flood Waves on the New River Between Hinton and Hawks Nest, West Virginia

Nl '3I/MI1 13AVH1
River-Flow Characteristics 9
4000 8000 12,000 16,000 20,000 24,000
NEW RIVER FLOW, IN CUBIC FEET PER SECOND (SEE TABLE 2 FOR EQUIVALENT STAGE)
Figure 9. Traveltimes of flood waves from Hinton to selected communities in the New River Gorge.
10 Traveltimes of Flood Waves on the New River Between Hinton and Hawks Nest, West Virginia

50.9), Prince (mile 39.8), Thurmond (mile 26.0), and Fayette (mile 12.3).
Note that the time-of-travel information in this report is for flood waves only. It is not the traveltime of a contaminant that may be accidentally spilled or dis charged into the river.
Thurmond Gaging Station
A gaging station was installed at Thurmond (mile 26.0) as part of this study because most boat trips begin near this point. Equipment at the gaging station con tinuously records the river stage or height. The station is also equipped with a telemeter, which is an instrument which, when called by telephone, will transmit river- stage information as a series of beeps. The streamflow or discharge of the river is periodically measured by a current meter at the Stone Cliff highway bridge (mile 27.4) upstream from Thurmond. Figure 10 shows the relation between streamflow, in cubic feet per second, and river stage, in feet, at the New River at Thurmond. The curve can be used to determine river flow at any stage. An example of the use of figure 10 is as follows: enter the river stage on the vertical scale at 6.0 ft, move horizontally to the curve, and then move vertically down to the streamflow scale at 6,300 ftVs.
Table 2 is simply a tabular display of the rating curve shown in figure 10. Minor changes in the river
stage-streamflow relationship may occur as a result of extreme floods; however, traveltimes will be relatively unaffected. If actual streamflow is needed, contact the National Park Service, National River Headquarters, or the U.S. Geological Survey in Charleston, W. Va.
As an aid to the NPS, rafters, and fishermen, river stage and (or) flow at Thurmond can now be determined by telephoning the telemeter (304) 465-0493. The tele phone signal will consist of four sets of beeps, and river stage can be determined by counting the number of beeps in each set. The number of beeps in each set cor respond to the four digits that constitute river stage. Examples are as follows:
River stage Telephone transmission
08.21
11.20
-(0) one long beep, pause (8) eight short beeps, pause (2) two short beeps, pause (1) one short beep, circuit disconnects
-(1) one short beep, pause(1) one short beep, pause(2) two short beeps, pause(0) one long beep, circuit disconnects
Thus, river flow can be determined by the river stage information (above) and the rating curve shown in figure 10 and the tabular display in table 2.
18
16
14
r-UJm 12 LL '
10ill
05
CCLJJ «
10,000 20,000 30,000 40,000 50,000 60,000
STREAM FLOW, IN CUBIC FEET PER SECOND
70,000 80,000
Figure 10. River stage-streamflow rating curve for the New River at Thurmond.
River-Flow Characteristics 11
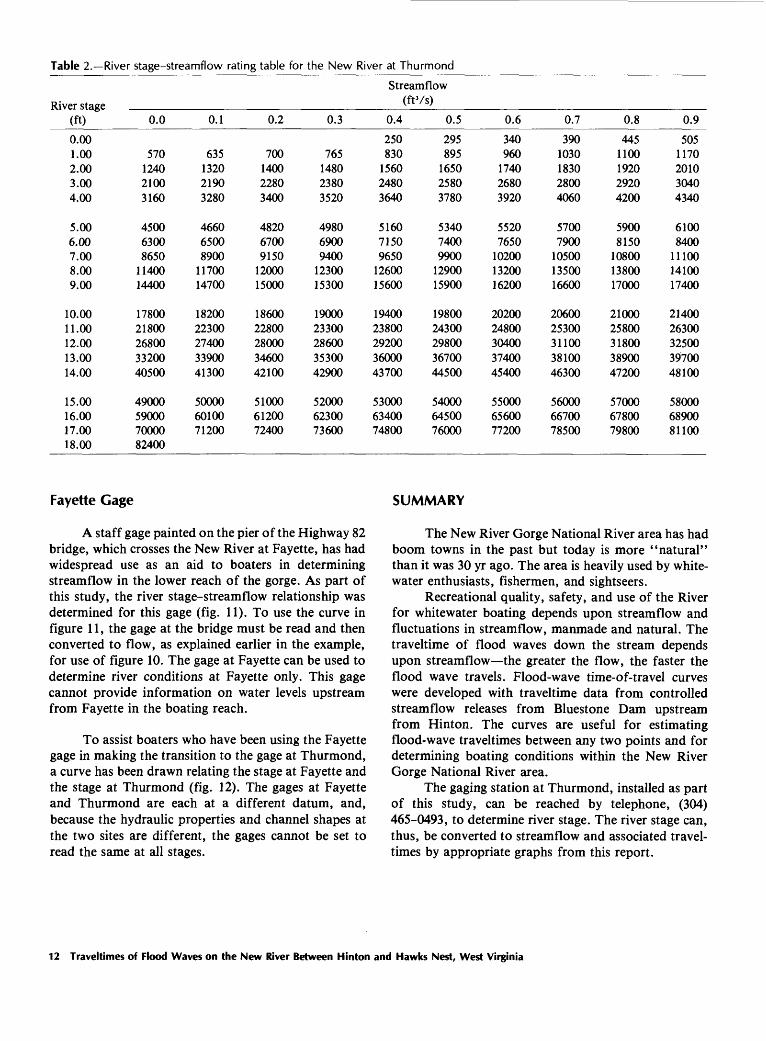
Table 2. River stage-streamflow rating table for the New River at Thurmond
River stage (ft)
0.001.002.003.004.00
5.006.007.008.009.00
10.0011.0012.0013.0014.00
15.0016.0017.0018.00
Streamflow (ftVs)
0.0
570124021003160
4500630086501140014400
1780021800268003320040500
49000590007000082400
0.1
635132021903280
4660650089001170014700
1820022300274003390041300
500006010071200
0.2
700140022803400
4820670091501200015000
1860022800280003460042100
510006120072400
0.3
765148023803520
4980690094001230015300
1900023300286003530042900
520006230073600
0.4
250830156024803640
5160715096501260015600
1940023800292003600043700
530006340074800
0.5
295895165025803780
5340740099001290015900
1980024300298003670044500
540006450076000
0.6
340960174026803920
55207650102001320016200
2020024800304003740045400
550006560077200
0.7
3901030183028004060
57007900105001350016600
2060025300311003810046300
560006670078500
0.8
4451100192029204200
59008150108001380017000
2100025800318003890047200
570006780079800
0.9
5051170201030404340
61008400111001410017400
2140026300325003970048100
580006890081100
Fayette Gage
A staff gage painted on the pier of the Highway 82 bridge, which crosses the New River at Fayette, has had widespread use as an aid to boaters in determining Streamflow in the lower reach of the gorge. As part of this study, the river stage-streamflow relationship was determined for this gage (fig. 11). To use the curve in figure 11, the gage at the bridge must be read and then converted to flow, as explained earlier in the example, for use of figure 10. The gage at Fayette can be used to determine river conditions at Fayette only. This gage cannot provide information on water levels upstream from Fayette in the boating reach.
To assist boaters who have been using the Fayette gage in making the transition to the gage at Thurmond, a curve has been drawn relating the stage at Fayette and the stage at Thurmond (fig. 12). The gages at Fayette and Thurmond are each at a different datum, and, because the hydraulic properties and channel shapes at the two sites are different, the gages cannot be set to read the same at all stages.
SUMMARY
The New River Gorge National River area has had boom towns in the past but today is more "natural" than it was 30 yr ago. The area is heavily used by white- water enthusiasts, fishermen, and sightseers.
Recreational quality, safety, and use of the River for whitewater boating depends upon Streamflow and fluctuations in Streamflow, manmade and natural. The traveltime of flood waves down the stream depends upon Streamflow the greater the flow, the faster the flood wave travels. Flood-wave time-of-travel curves were developed with traveltime data from controlled Streamflow releases from Bluestone Dam upstream from Hinton. The curves are useful for estimating flood-wave traveltimes between any two points and for determining boating conditions within the New River Gorge National River area.
The gaging station at Thurmond, installed as part of this study, can be reached by telephone, (304) 465-0493, to determine river stage. The river stage can, thus, be converted to Streamflow and associated travel- times by appropriate graphs from this report.
12 Traveltimes of Flood Waves on the New River Between Hinton and Hawks Nest, West Virginia

LJJ U_
24
22
20
18
14
UJ O 12
10
CE 8
10,000 20,000 30,000 40,000 50,000 60,000 70,000
STREAM FLOW, IN CUBIC FEET PER SECOND
80,000 90,000
Figure 11. River stage-streamflow rating curve for the New River at the Fayette (Highway 82) bridge. (Staff gage on pier.)
Summary 13

STAGE AT THURMOND, IN FEET
| O to t* <J> 00 O NJ -Pk O> 00 C
/
/> ^
//X'
x
//
u /X/
^^
^^
^
1-2 0 2 4 6 8 10 12 14 16 18 20 22 24 2f
STAGE AT FAYETTE, IN FEET
Figure 12. Curve relating river stage at Thurmond and Fayette.
14 Traveltimes of Flood Waves on the New River Between Hinton and Hawks Nest, West Virginia
6U.S. GOVERNMENT PRINTING OFFICE: 19 83-381-614/552