Embed Size (px)
Citation preview

Proprietary & Confidential
The Travelers Companies, Inc.2015 Investor Day: A Deeper Dive into Data & Analytics
1August 13, 2015

Proprietary & Confidential
Agenda
Travelers Data, Analytics, and Science AdvantageDoreen Spadorcia – Vice Chairman and CEO, PI and BSI
Chronic Pain, Predictive Modeling, Geospatial Analysis, and Certified LocationsErik Roen – Vice President, Claim Business Intelligence and AnalyticsEric Nelson – Senior Vice President, Catastrophe Underwriting RiskJim Young – Vice President, Business Insurance Business Intelligence
CyberTom Kunkel – Executive Vice President and President, BSI
Alan Schnitzer – Vice Chairman and CEO, BII
Closing RemarksAlan Schnitzer – Vice Chairman and CEO, BII
Welcome
Break
Q & A
Lunch
Claim University, Risk Control Lab, and Catastrophe Command Center ToursClaim University and Risk Control Experts
2

Proprietary & Confidential
IntroductionAlan Schnitzer, Vice Chairman and CEO, Business and International Insurance
3

Proprietary & Confidential 4
Long‐Term Financial Strategy
Meaningful and sustainable competitive advantages
Generation of top tier earnings
and capital substantially in excess of growth
needs
Balanced approach to rightsizing capital and
growing book value per share
over time
CREATE SHAREHOLDER VALUEObjective: Mid‐Teens Operating ROE Over Time

Proprietary & Confidential
Data, Analytics & Science in the BusinessDoreen Spadorcia, Vice Chairman and CEO, Personal Insurance and Bond & Specialty Insurance
5

Proprietary & Confidential
Our Data & Analytics Conversations With You…
2009
Granular Business Metrics Extended to Underwriters & Agents
Profitability Pricing Segmentation Loss Trends Expense & Agency Performance
2010
Interactive Real‐Time DashboardsExtended to Front‐Line
AE Dashboard – Portfolio Mgmt Product Profitability Life Cycle Claim Efficiencies & Effectiveness
2011
Advanced Predictive AnalyticsConnected to Automated Business Rules
Risk Selection Pricing Segmentation Underwriting Sophistication Automated Select Underwriting
2014
Geospatial CapabilitiesConnected to Business Intelligence
Medical Marketplace Insights Medical Fraud Detection Chronic Pain Predictive Modeling
Sustained Competitive Advantage 6

Proprietary & Confidential
Since Then…
INFORMATION
CONSUMER BEHAVIORS
TECHNOLOGY ADVANCEMENTS
More, Different, Connected and Smart…
7

Proprietary & Confidential
Relative Business Performance
• Consistently outperform industry
• Nearly $4 billion of net written premiums
• Market leader, with 8% market share
Industry
109%
94%
Statutory Combined Ratio: 2010‐20142
• Consistently outperform industry
• Nearly $7.5 billion of direct written premiums
• Top 5 company, with 5% market share
Industry
99%95%
Statutory Combined Ratio: 2010‐20143
Workers’ Compensation Property1
81Property includes: Allied Lines , Boiler & Machinery, Burglary & Theft, Commercial Multiple Peril (Non‐Liability), Earthquake, Fire, Homeowners Multiple Peril and Inland Marine 2Source: SNL Financial 3Source: AM Best

Proprietary & Confidential
Leveraging Data, Analytics & ScienceMore…and New Ways To Positively Impact Business Performance
•Risk Selection•Risk Assessment•Pricing•Products & Services
Right Businessat the Right Price
•Assignment Optimization•Evaluation / Estimation Accuracy•Optimal Resolution & Payout• Fraud Detection
Right Expertiseat the Right Time
•Consumer & Agent Intimacy / Education•Targeted Marketing •Distribution Channels•Workforce Readiness
Right Engagementat the Right Place
CYBER
GEOSPATIAL
PREPARE & PREVENT
Maximize the Utility & Value of Insight
9

Proprietary & Confidential
Managing The Science…
• 1,600+ Dedicated Business Intelligence Experts• ~200 Data Scientists• Robust Development Program• Academic Analytic Acumen Partnership
Expertise
• Enterprise BI&A Org Design• Embedded Business Unit BI&A Expertise • Continuous Insight Loop Process
Talent &Governance
• Dedicated Knowledge & Experiment Facilities• Hadoop Big Data Environment• Advanced Data Center • Industry Leading Visualization Tools • Virtual Reality Technologies
Capabilities
TALENT
INSIGHT LOOP
INFRASTRUCTURE
Expertise. Focus. Commitment.
10

Proprietary & Confidential
…and the Art
Analytical Thinking:Identifies current or future problems or opportunities, analyzes, synthesizes and compares information to understand issues, identifies cause/effect relationships and explores alternative solutions to support sound decision making.
• 30,000+ Travelers Employees• Seeking Opportunities To Improve• Skills To Do It
Culture
CORE COMPETENCIES
Inventive Culture of Continuous Improvement
11

Proprietary & Confidential
Bringing Them All Together
TALENT INFRASTRUCTURE
CAPABILITIES CULTURE
Sustaining our Competitive Advantage
12

Proprietary & Confidential
Thank You
Erik Roen – Pain Management
Eric Nelson – Hail Dashboard Applications
Jim Young – Risk Exposure & Opportunity
Tom Kunkel – Cyber Products & Services
Pat Gee & Henry Edinger – Claim U & National Catastrophe Center
Marty Henry & John Machnicki – Risk Control & Forensics Lab
Data, Analytics & Science In Action
13

Proprietary & Confidential
Predictive Modeling for Chronic PainErik Roen, Vice President, Claim Business Intelligence & Analytics
14

Proprietary & Confidential
Business Use Case – Chronic Pain Analysis
Data Analytics Talent
Assignment Fraud Subrogation Resolution Frequency/Severity Attorney Quality Medical
Early Identification of Chronic Pain
Claim Capabilities
15

Proprietary & Confidential
Chronic Pain…Where we were
What Happened?
Why Did It Happen?
Descriptive Analytics (Historical)
Diagnostic Analytics (Historical)
• Impacts 116 million Americans
• Chronic Pain prevents 20% of TRV claimants from returning to work in a timely fashion
• Took 6‐9 months to identify Chronic Pain
Analytic Value
Analytic Continuum
16

Proprietary & Confidential
A predictive model which seeks to identify injured employees most likely to decompensate into chronic pain.
Art: Creating the Mind Shift Science: Data & Analytics
Predictive model
All Claims
Claims likely to decompensate into chronic pain
Diaries sent for these claims
Earlier course corrections ‐ Out
of the box approach and solutions
Utilizing resources creatively
Looking at claims
differently
Structured workflow and processes with new customized plans based upon the predictors to target treatment earlier.
Chronic Pain Opportunity
Goal: Early identification to get the injured worker healthy and back to work
17

Proprietary & Confidential
Business Processes
Machine Generated
Human Sourced
Structured
External
Unstructured
Internal
TransactionHistoryClaim
AttributesReserve Levels
Motor VehicleRecordsMoody’s
ComparativeRaters
Social MediaPublic RecordsWeb PagesSensor Data
Ad ImpressionsWeather
ClickstreamsServer LogsTelematicsE‐mail
Claim NotesPhone LogsPhotos
Big Data: What are we talking about?Science: Data & Analytics
18

Proprietary & Confidential
Business Processes
Machine Generated
Human Sourced
Structured
External
Unstructured
Internal
Treatment VariablesClaimant Demographics
Co‐MorbiditiesClaim & Policy Information
Physician & Claimant Information
Geo‐Location Data
Social MediaWearables
Claim NotesE‐mail
Phone LogsPhotos
Need for Big Data in Chronic PainScience: Data & Analytics
19
Proprietary & Confidential
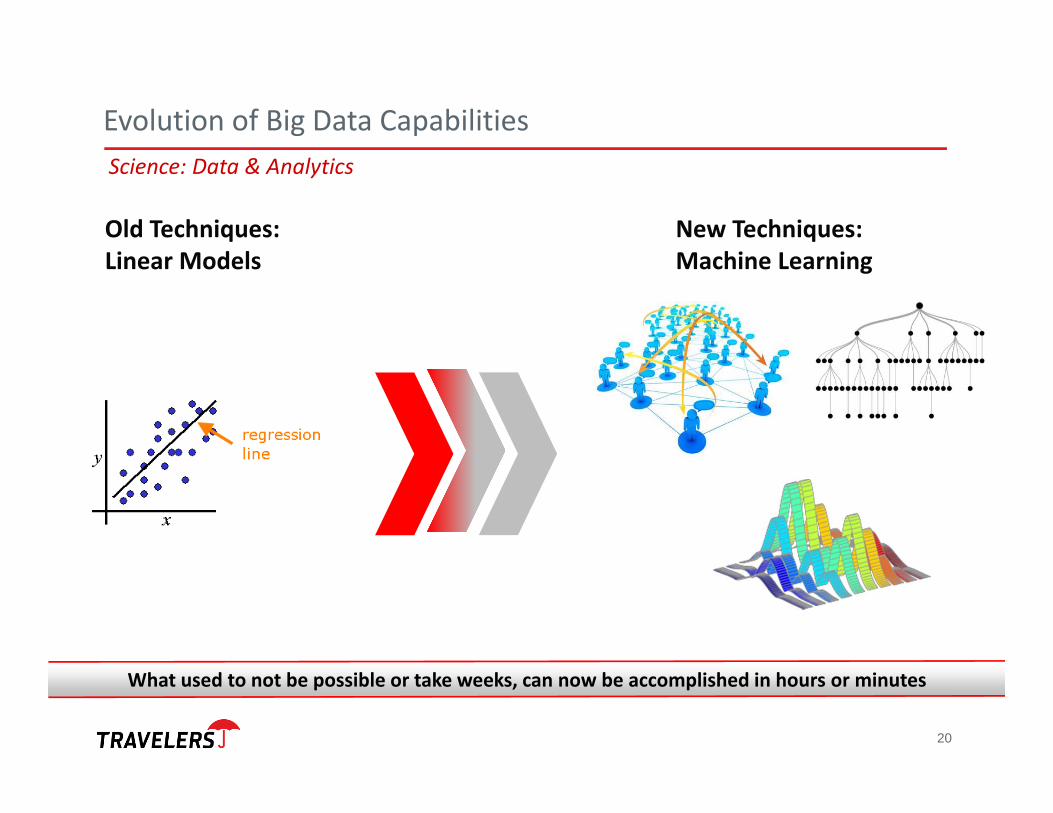
New Techniques: Machine Learning
Old Techniques: Linear Models
Science: Data & Analytics
Evolution of Big Data Capabilities
What used to not be possible or take weeks, can now be accomplished in hours or minutes
20

Proprietary & Confidential
Healthcare Research ExperienceGroup Health ActuaryHealthcare EconomistBiostatisticianMedical Data Experts
Talent
Evolution of Prescriptive AnalyticsArt: Creating the Mind Shift
Advancements with Big Data based on more than technology; also requires talent to implement
21

Proprietary & Confidential
Analytic Continuum Categories
Information Delivery Actionable Insight
What Happened?
Why Did It Happen? Happen?
What Could Happen?
Analytic Value
Descriptive Analytics (Historical)
Diagnostic Analytics (Historical)
Prescriptive Analytics
Predictive Analytics
What Should We Do?
Prescriptive Analytics (Pro-active)Predictive
Analytics (Real-time)Diagnostic
Analytics (Historical)
Predictive Analytics (Real‐time)
“The Science”
Prescriptive Analytics (Pro‐active)
“The Art”
New “Early Severity Predictor”:(Prospective)
Old Model:(Retrospective)
Chronic Pain Evolution
Result: Can now start identifying CP claims at age 30‐60 days instead of 6‐9 months
Patent Pending22

Proprietary & Confidential
Early Severity Predictor in Action: One Example1
Prior “Flagging” Model• Pain driver identified – no• Interventions – general aimed at reducing opioid use
• Subsequent diagnosis – chronic pain• Subsequent treatment – fusion surgery; spinal cord stimulator; long term opioid use
• MCU Oversight – yes • Current work status – temporary total disability
• Current financials – Total incurred ‐ $2.9 million– Total paid ‐ $547,000
New “Predictive” Model• Pain driver identified – yes• Interventions – specific based on musculoskeletal pain driver (physical therapy & home exercise program)
• Subsequent diagnosis – low back strain resolved
• Subsequent treatment – released from treatment
• MCU Oversight – no • Current work status – return to work full duty
• Current financials– Total incurred ‐ $47,000– Total paid ‐ $32,000
Claim Facts• Injured body part – low back• Initial diagnosis – low back strain• Initial treatment – injections, opioids, recommendation for spinal cord stimulator
231. Impact of ESP model on CP claims will vary based on model capture rates, program acceptance rates, and actual savings rates resulting from claim practices on a case-by-case basis.

Proprietary & Confidential
Data & Analytics Across the Enterprise
Re‐using capabilities across multiple areas.
Medical Data Uses: • Fraud Models• Assignment Models• Bodily Injury Severity Models• Product & Pricing• Loss Analytics
Analytic Techniques: • Pricing Models• Claim Models• Risk Management
24

Proprietary & Confidential
Geospatial Analysis and Certified LocationsEric Nelson, Senior Vice President CAT Underwriting Risk | Jim Young, Vice President BI Business Intelligence
25
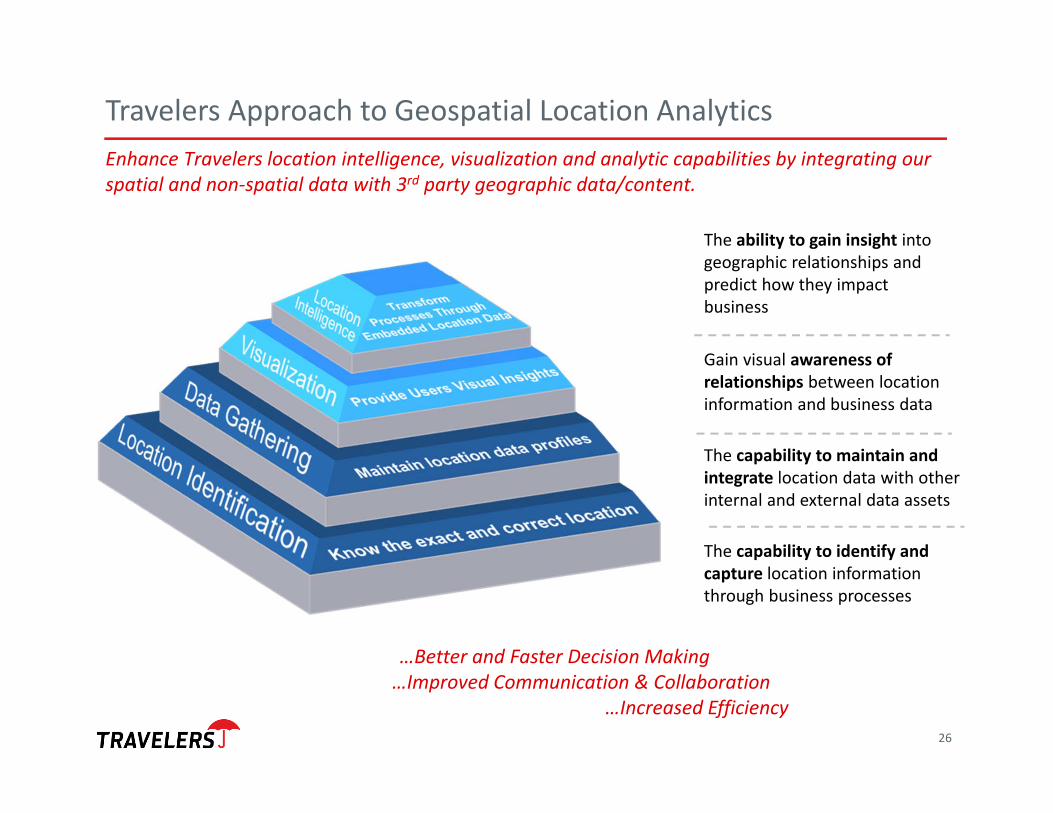
Gain visual awareness of relationships between location information and business data
The ability to gain insight into geographic relationships and predict how they impact business
The capability to maintain and integrate location data with other internal and external data assets
…Better and Faster Decision Making…Improved Communication & Collaboration
…Increased Efficiency
Enhance Travelers location intelligence, visualization and analytic capabilities by integrating our spatial and non‐spatial data with 3rd party geographic data/content.
The capability to identify and capture location information through business processes
Travelers Approach to Geospatial Location Analytics
26

What is Geospatial Analysis?
Geospatial analysis is an approach to applying statistical analysis and other informational techniques to data which has a geographical or geospatial aspect.
• Overlaying multiple geospatial layers to perform advanced analysis• Publishing and sharing geo‐content across the enterprise• Accessing thousands of external mapping layers without having to store them• Integrating Travelers and 3rd party data
Key Capabilities
27
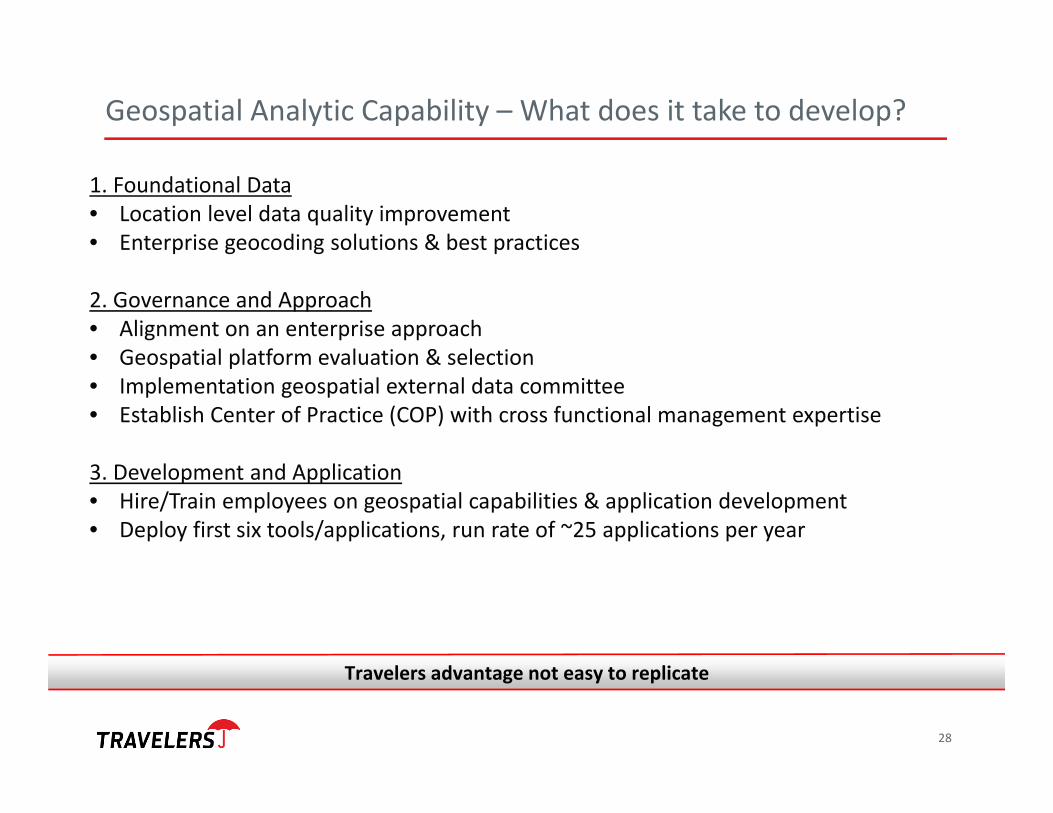
Geospatial Analytic Capability – What does it take to develop?
1. Foundational Data • Location level data quality improvement • Enterprise geocoding solutions & best practices
2. Governance and Approach• Alignment on an enterprise approach • Geospatial platform evaluation & selection• Implementation geospatial external data committee • Establish Center of Practice (COP) with cross functional management expertise
3. Development and Application• Hire/Train employees on geospatial capabilities & application development • Deploy first six tools/applications, run rate of ~25 applications per year
Travelers advantage not easy to replicate
28

Business Use Case – Hail Geospatial Analysis
Utilize geospatial analysis to improve:
Claim Efficiency• How do we most effectively deploy resources?• How can we triage the claim cause of loss and date of occurrence?
Pricing & Underwriting• How do we adequately price the exposure?• How should we react to weather volatility?• What are the most effective tools/processes for our front line underwriters?
Aggregation of Risk• How do we evaluate concentration & corresponding risk/reward?
29
Proprietary & Confidential
USECASE Claim: Hail Dashboard
30

Challenge: Increase in Weather (Hail) Volatility
Radar Based Data – 1 Inch HailFrequency Relativity
With recent weather volatility, how do you develop efficient claim staffing models?
31

Application of the Hail Dashboard
• Assess the impact of damaging hail events across multiple policies
• Assist with appropriate staffing models by event
• Provide a consistent and common operating view of hail events
Patent Pending
Spatial visualizations of radar‐based hail models overlaid with policy and claim locations can improve our ability to:
“Laser focus” on where and who to deploy: “Used to take a week to develop a storm footprint we now get instantly”
32

Placeholder for Demo
33

Catastrophe Models – Business Application• Aggregation of Risk• Enterprise Risk Management – Capital Models• Reinsurance Purchase Decisioning• Input to Ratemaking• Input to Annual Financial Plans
Example: Catastrophe Modeling for Hail
Broader Application of Hail Dashboard – Pricing and Underwriting
34

Challenge: Model Comparisons of Hail Hazard
Vendor A ‐ Out‐Of‐Box Vendor B ‐ Out‐Of‐Box
Dallas Example• How do you price the business?• How do you underwrite?• How do you evaluate loss event scenarios?
3rd party models output can vary significantly ‐ Dallas is a good example of a divergent opinion
35

The Advantage of Travelers Geospatial Capability
2009‐2015
Hail Dashboard ‐ Radar Data
1995‐2014
NOAA / Storm Prediction Center
Advanced analytics and geospatial tools enable rapid and more sophisticated insights
In geospatial environment, Travelers is able to integrate multiple 3rd party data sources and models to create a proprietary view of risk
36

TRV Relativity (Hail)
TRV Hazard Relativity
Better understanding of risk = smarter pricing, smarter underwriting and better returns
37

Proprietary & Confidential
USECASE Business Insurance: Certified Locations
38
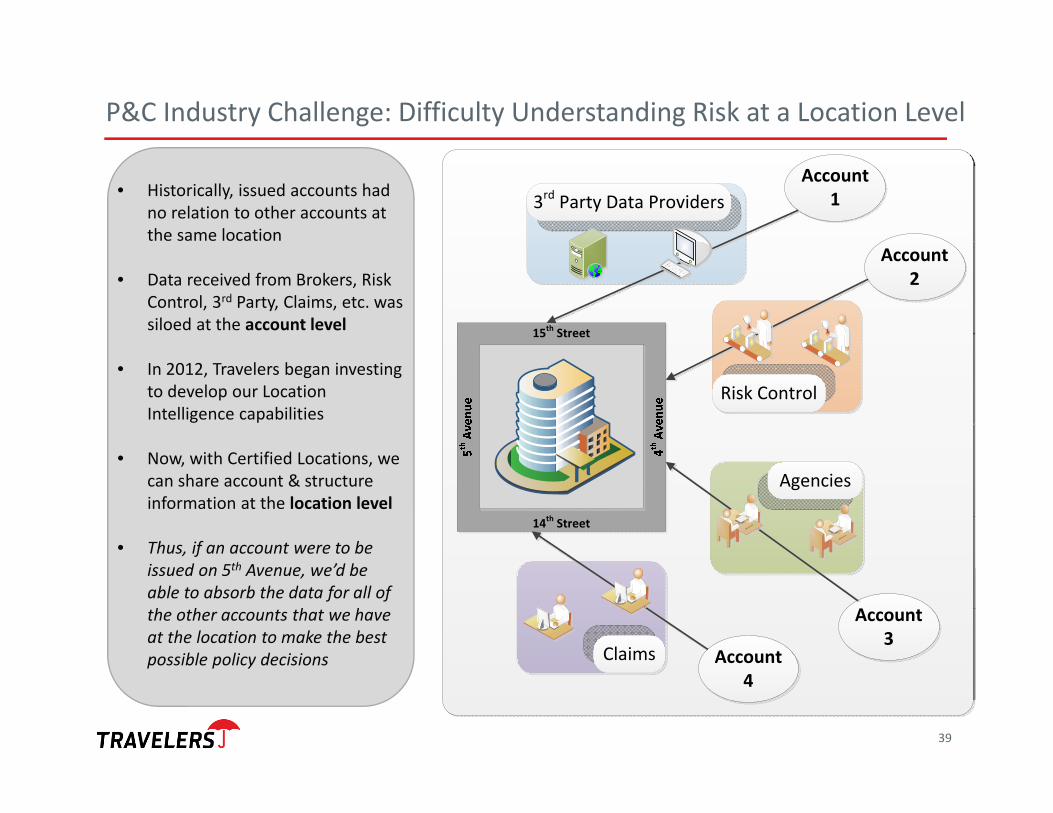
P&C Industry Challenge: Difficulty Understanding Risk at a Location Level
• Historically, issued accounts had no relation to other accounts at the same location
• Data received from Brokers, Risk Control, 3rd Party, Claims, etc. was siloed at the account level
• In 2012, Travelers began investing to develop our Location Intelligence capabilities
• Now, with Certified Locations, we can share account & structure information at the location level
• Thus, if an account were to be issued on 5th Avenue, we’d be able to absorb the data for all of the other accounts that we have at the location to make the best possible policy decisions
Account 1
Account 2
Account 3
15th Street
14th Street
Agencies
Claims
3rd Party Data Providers
Risk Control
Account 4
39

Location Data Business ProblemBroker submitted addresses and data is inconsistent
Address City State Construction Year Built201 W 43rd Street New York NY Fire Resistive 1989
175 West 42nd New York NY Frame 1989
177 West 42nd Street New York NY Fire Resistive 2007
177 W 42nd Street New York NY Masonry 1999
179 West 42nd Street New York NY Masonry 2007
1441 Broadway New York NY Fire Resistive 1989
1441 Broadway Avenue New York NY Masonry 2007
1443 Broadway New York NY Frame 2007
584 7th Avenue New York NY Frame 1999
584 Seventh Avenue New York NY Fire Resistive 2007
586 7th Avenue New York NY Frame 1989
4 Times Square New York NY Masonry 1989
4 Times Sq. New York NY Fire Resistive 1999
Using latitude and longitude, a computer can’t tell this is one building
40

Certified Locations Uniquely Identifies Locations
• With intelligent use of geospatial technology, Certified Locations determines the defined building area and the number of structures in the building area
• Travelers currently has four U.S. and International patents pending related to the utilization of geospatial information
Creates the ability to leverage information about a location for any relevant business decision
41

Real Life Example
370 Anyplace Ave, NY, NY(aka 122 E Number St.)
Individual and Aggregate Risk Control
• 46 current accounts in one building across 4 business units
• 30 accounts filed claims in a 7/18/07 event, totaling more than $4 million
• Risk control reports done for only certain addresses at building, not shared across accounts
42

Target State ‐ Data sharing enables single location view
370 Anyplace Ave, NY, NY(aka 122 E Number St.)
Structure Summary
Year Built 1929 Number of Floors 26 Total Area (sq. ft) 289,000 Construction Class 6 ‐ Fire Resistive Fire Protection Sprinklered
Nbr of Businesses Present 34 Nbr of Unique Occupancies 14 Nbr of Businesses in Appetite 26
Flood Risk Score 10 (Low) Earthquake Exposure Score 0.9 (Excellent) Storm Surge Score 8 (Very Low) Wildfire Score Low Tornado Score 20 Hail Score 40 Hurricane Score 50 CAT All Peril Score 20
Current Accounts (Historical) 38 (110) Risk Control Reports 1 Claim Files 7 Total Insured Value $12,202,210 Terrorism Monitoring Area Yes Date Last Risk Control Report 3/6/2012
Structural Attributes Value
Business Attributes
Environmental Attributes
Travelers Summary
43
Proprietary
Proprietary

The Overall Opportunity for a Multi‐line Carrier
Retail – Small Commercial
Condos – Personal Insurance
Offices ‐Middle Market
Shared Information Leveraged:• Risk Control reports• Loss/claim information• Hazards• Concentration &
aggregation• Environmental &
structural attributes
Applicable Business Processes:• Underwriting• Pricing • Sales/prospects• Risk/CAT Management
Financial Benefits:• Loss ratio• Expense savings
Nationa
lPrope
rtyhas the
entire
building
44

Placeholder for Demo
45

Travelers – Analytic Advantage
Revenue Growth • New business prospecting• Identification of underpenetrated regions • More accurate coverage calculations and counseling to insureds• Retaining and growing existing customers
Profitability• Better risk evaluation and underwriting decisions• More granular and targeted pricing• More efficient and effective deployment of risk and claim professionals• Advanced catastrophe management capabilities
46

Cyber Tom Kunkel, Executive Vice President, President Bond & Specialty Insurance
47

What is Cyber Coverage?
48

What is Cyber Coverage?
• Companies are legally obligated to protect certain information that they collect and store
• Type of data compromised is often personally identifiable information (PII) of employees, customers and business partners
• When that data gets compromised, the company may face liability suits, as well as costs for forensic investigations, required notifications, public relations and related legal advice, etc.
• Data can be compromised in many different ways through hacking, employee mistakes, lost devices, or even a misplaced paper document
PII
49

Additional Cyber Coverages Available…
Regulatory Defense Expenses
Covers claims brought against an Insured by governmental entities for the failure to protect personal information; may include fines and penalties
Communications and Media Liability
Claims for plagiarism / defamation on material disseminated via electronic means, e.g. email, website
Loss of income due to systems being down from cyber attack or extra expense due to disruption, e.g. other internet provider
Business Interruption
Additional Features
Data Restoration, Cyber Extortion, Telecommunications Fraud, Funds Transfer Fraud, and Computer Fraud
50

29%
13%
11%11%
10%
9%
5%4%
3% 2%3% Hacker ‐29%
Staff Mistake ‐ 13%
Rogue Employee ‐ 11%
Malware/Virus ‐ 11%
Lost/Stolen Laptop/Device ‐ 10%
Paper Records ‐ 9%
Improper Data Collection ‐ 5%
Theft of Hardware ‐ 4%
Theft of Money ‐ 3%
Systems Glitch ‐ 2%
Other ‐ 3%
Percentage of Claims by Cause of Loss
Source: NetDiligence Cyber Claims Study 2014 51

How Big is the Cyber Insurance Market?
52
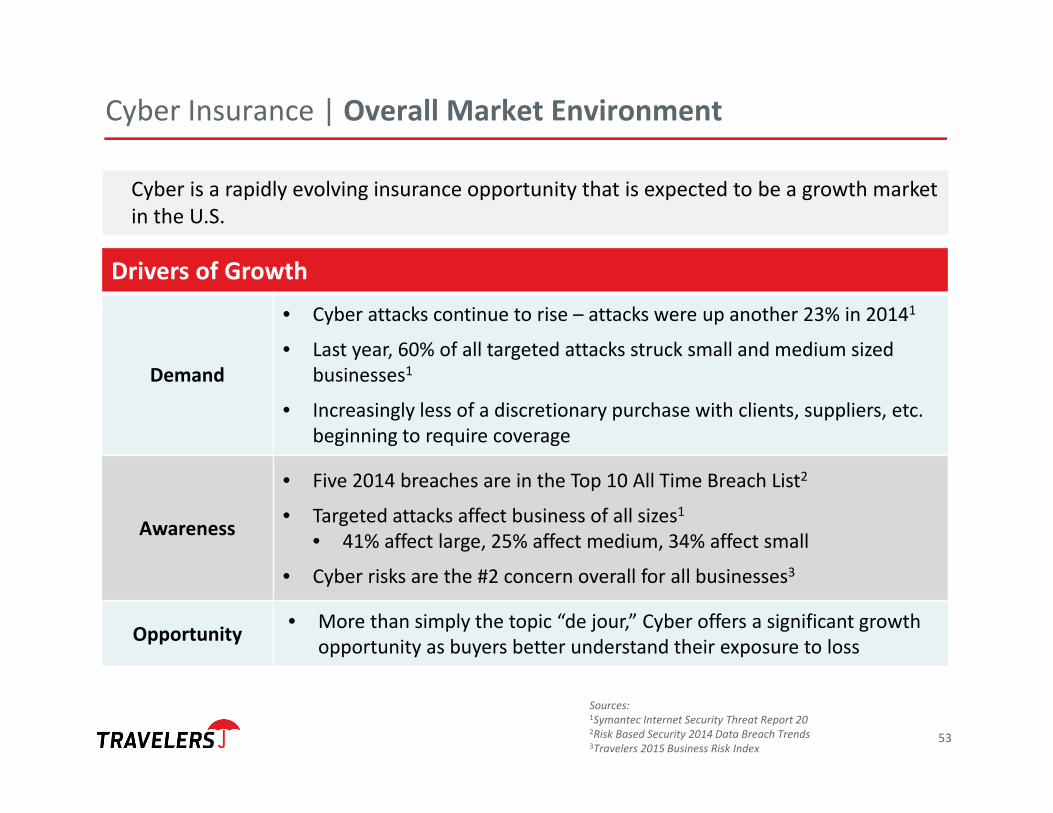
Cyber Insurance | Overall Market Environment
Cyber is a rapidly evolving insurance opportunity that is expected to be a growth market in the U.S.
Drivers of Growth
Demand
• Cyber attacks continue to rise – attacks were up another 23% in 20141
• Last year, 60% of all targeted attacks struck small and medium sized businesses1
• Increasingly less of a discretionary purchase with clients, suppliers, etc. beginning to require coverage
Awareness
• Five 2014 breaches are in the Top 10 All Time Breach List2
• Targeted attacks affect business of all sizes1• 41% affect large, 25% affect medium, 34% affect small
• Cyber risks are the #2 concern overall for all businesses3
Opportunity • More than simply the topic “de jour,” Cyber offers a significant growth opportunity as buyers better understand their exposure to loss
Sources: 1Symantec Internet Security Threat Report 202Risk Based Security 2014 Data Breach Trends3Travelers 2015 Business Risk Index
53

U.S. Industry Cyber Premium Growth($,B)
Source: The Betterley Report, D&P Analysis (2012, 2013, 2014)
2012 2013 2014 2019 (Projection)
Cyber Insurance Market Landscape
54
Rapid Growth – Rich Opportunity

Travelers Cyber Products
55

Travelers Cyber Experience…
19861st Technology E&O Product
20061st Community Bank Cyber Product
19991st Cyber/Data Breach Product For Technology Companies
2010 Expanded Cyber/Data
Breach Product To All Industries
2013Small Business Cyber Product &eRisk Hub Portal
20071st Breach Remediation Expense Coverage
2014Ranked #1– PC360
2014Ranked #1– PC360
Travelers Cyber Experience
30 Years Understanding & Monitoring The Exposure
56

• Enterprise Approach to Governance:─ Enterprise Underwriting
─ Enterprise Product
─ Claim
─ Risk Control
─ Enterprise Risk Committee
• Breadth and Depth of Expertise:─ Product Underwriters
─ Regulatory Analysts
─ Technologists
─ Fraud Detectives
─ Forensic Scientists
─ Legal Counsel
─ Risk Managers
─ Claim Professionals
─ Public Policy Representatives
Travelers Cyber Governance and Expertise
200+ risk professionals engaged
Backgrounds: FBI, Cisco, HP, ISO, McAfee, Symantec, Mandiant, and others
Average tenure: 20 years
Engagement at all levels of company across business units and functional areas
57

CyberRisk
Bond & Specialty
• Broad target market
•Typical limit $1 million
• Specialized underwriting
Select
• Entry level product
•Typical limit $25,000
• Straight‐through issue
Cyber First Essentials
CyberFirst
Travelers Cyber Product Suite
CyberFirst
Technology
•Tailored to technology industry
•Typical limit $1 million
•Specialized underwriting
CyberFirstEssentials
450+ SIC Codes Represented
Insured Revenue Range <$100k ‐ $100B
9,000+ Cyber Policies In Force
58

Cyber | Product Profile and Underwriting Control
Product Profile
• All Travelers Cyber products are Claims‐Made
• Defense expenses are included in the limit
• Deductibles/Retentions used
• Reinsurance used opportunistically
Underwriting Controls
• Underwriting requirements vary depending on product, coverage options and limits
• Select CyberFirst Essentials has basic requirements for limits under $50K
• Broader coverage and/or higher limits require intensive underwriting
59

Cyber | Gross Written Premium Trend Line
TRV Growing with Market Opportunity
60
$17
$23
$30
$40
$10
$15
$20
$25
$30
$35
$40
$45
2011 2012 2013 2014
GWP in M
illions
Cyber GWP (Consolidated)

Travelers Claim Service
61

Travelers Comprehensive & Rapid Cyber Breach Response
Breach Coach Consultation to Determine: Is a forensics investigation needed? Are breach notifications required? What is the potential for legal action, fines, penalties? What to do for next steps?
Expert Claim Service Defense Costs & Liability for Damages Claim Professionals Experienced with Cyber Claims Practiced & Knowledgeable Legal Counsel Expertly assist our clients with:
Hiring Forensics & Breach Investigators Breach Notifications Credit Monitoring & ID Fraud Services Notification & Call Center Services Selection & Reimbursement for Public Relations Firm
62

Cyber | Value Added Online Services
Learning Center White Papers & Articles Technical Bulletins Industry Studies Webinars & Seminars Trends and Statistics
24/7 Availability of:
Prevention Benefits
Post‐Event Response Benefits
News Center Security & Compliance News Latest Data Breach News Dark Reading News Statutory, Regulatory, Case Law Updates
Resources Calculators to Estimate Potential Losses Tools to Build Privacy Controls Risk Control Checklist Other Prepare & Prevent Resources
63

Additional InformationAdditional Information
Appendix
64

65
Explanatory NoteThis presentation contains, and management may make, certain “forward-looking statements” within the meaning of the Private Securities Litigation Reform Act of 1995. All statements, other than statements of historical facts, may be forward-looking statements. Words such as “may,” “will,” “should,” “likely,” “anticipates,” “expects,” “intends,” “plans,” “projects,” “believes,” “estimates” and similar expressions are used to identify these forward-looking statements. Examples of our forward-looking statements include statements relating to our future financial condition and operating results, our share repurchase plans, future pension plan contributions, potential margins, potential returns, the sufficiency of our reserves, the impact of emerging claim issues and litigation, the cost and availability of reinsurance coverage, catastrophe losses, the impact of investment, economic and underwriting conditions and our strategic initiatives.We caution investors that such statements are subject to risks and uncertainties, many of which are difficult to predict and generally beyond the Company’s control, that could cause actual results to differ materially from those expressed in, or implied or projected by, the forward-looking information and statements. Some of the factors that could cause actual results to differ include, but are not limited to, the following:
• Catastrophe losses; • Financial market disruption or economic downturn; • Changes to our claims and claim adjustment expense reserves; • The performance of our investment portfolio; • Asbestos and environmental claims and related litigation; • Mass tort claims; • Emerging claim and coverage issues; • Competition, including the impact of competition on our strategic initiatives and new products; • Consolidation within the insurance industry could alter the competitive environment in which the Company operates, which may impact the Company’s premium
volume, the rate it can charge for its products, and the terms on which its products are offered;• The collectability and availability of reinsurance coverage; • Credit risk we face in insurance operations and investment activities, including under reinsurance or structured settlements; • The federal, state and international regulatory environment; • A downgrade in our claims-paying or financial strength ratings; • The inability of our insurance subsidiaries to pay dividends to our holding company in sufficient amounts; • Disruptions to our relationships with our independent agents and brokers; • Risks associated with developing new products or expanding in targeted markets; • Risks associated with our use of pricing and capital models; • Limits to the effectiveness of our information technology systems; • Difficulties with our technology, data and network security and/or outsourcing relationships, including cloud-based; • Risks associated with our business outside of the United States, including regulatory risks; • Loss of or restrictions placed on the use of underwriting criteria, such as credit scoring, or other data or methodologies, in the pricing and underwriting of
insurance products;• Risks associated with acquisitions, and integration of acquired businesses;• Limits to the effectiveness of our compliance controls; • Our ability to hire and retain qualified employees; • Company may be unable to protect and enforce its own intellectual property or may be subject to claims for infringing the intellectual property of others;• Changes to existing accounting standards;• Changes in tax laws that adversely impact our investment portfolio or operating results; and• Factors impacting the operation of our repurchase plans
For a more detailed discussion of these factors, see the information under "Risk Factors" and “Management’s Discussion and Analysis of Financial Condition and Results of Operations” in our most recent Form 10-K and Form 10-Q filed with the Securities and Exchange Commission. Our forward-looking statements speak only as of the date of this presentation or as of the date they are made, and we undertake no obligation to update those statements.
65

Disclosure
In this presentation, we may refer to some non-GAAP financial measures. For a reconciliation of these measures to the most comparable GAAP measures and a glossary of financial measures, we refer you to the press release and financial supplement that we have made available in connection with this presentation and our most recent annual report on Form 10-K filed with the Securities and Exchange Commission (SEC). See the “For Investors” section at Travelers.com.
For further information, please see Travelers reports filed with the SEC pursuant to the Securities Exchange Act of 1934 which are available at the SEC’s website (www.sec.gov).
Copies of this presentation and the accompanying webcast are publicly available on the Travelers website (www.travelers.com). This presentation should be read with the accompanying webcast and related press release and financial supplement.
From time to time, Travelers may use its website and/or social media outlets, such as Facebook and Twitter, as distribution channels of material company information. Financial and other important information regarding the company is routinely accessible through and posted on our website at http://investor.travelers.com, our Facebook page at https://www.facebook.com/travelers and our Twitter account (@Travelers) at https://twitter.com/Travelers. In addition, you may automatically receive email alerts and other information about Travelers when you enroll your email address by visiting the Email Notification section at http://investor.travelers.com.
66

Additional InformationAdditional Information
The Travelers Companies, Inc.
67