Embed Size (px)
Citation preview

TRAVEL & TOURISMECONOMIC IMPACT 2019WORLD

“Yet again, the strong economic performance of Travel & Tourism proves the power of the sector as a tool for governments to generate prosperity while creating jobs around the world.”Gloria Guevara Manzo, President & CEOWorld Travel & Tourism Council
For more information, please contact:
ROCHELLE TURNER | Research [email protected]
ECO
NO
MIC
IM
PACT
201
9
NEJC JUS | Economic Research [email protected]

As one of the world’s largest economic sectors, Travel & Tourism creates jobs, drives exports, and generates prosperity across the world. The sector, comprised of a wide range of industries, aims to serve and support domestic, international, business and leisure visitors. Companies, large and small, in
industries ranging from accommodation and transportation to food & beverage, retail and culture and sports & recreation, all strive to create products and services that bring people together, support communities and celebrate the wonders that our world can offer.
In its annual analysis quantifying the global economic and employment impact of Travel & Tourism in 185 countries and 25 regions, the World Travel & Tourism Council’s (WTTC) research reveals that the sector accounted for 10.4% of global GDP and 319 million jobs, or 10% of total employment in 2018. The division of overall spend is firmly weighted towards the leisure market, which represented 78.5% of the total compared with 21.5% for business spend, and the sector accounted for 6.5% of total global exports and 27.2% of total global service exports. Domestic tourism, which represented 71.2% of all tourism spending in 2018 and had the strongest growth in developing nations, continues to support opportunities by spreading development and regional economic benefits and building national pride.
The continued rise in the number of middle class households and the solid growth in global consumer spending once again enabled the Travel & Tourism sector’s growth to reach 3.9%, outpacing the global economy for the eighth consecutive year. The USA, China, Japan, Germany and the UK were the top five markets in 2018, collectively representing 47% of the global Travel & Tourism GDP.
Across the regions in 2018, Asia-Pacific remained a strong performer, growing by 6.4%, but North Africa’s performance – with 8.6% year on year growth – is particularly notable. This growth not only showcases the sector’s resilience and capacity to bounce back from security shocks, but also its ability to spread its benefits widely across the world. In effect, Ethiopia, Ecuador, St Kitts and Nevis, Egypt and Turkey led the world for Travel & Tourism GDP growth in 2018.
This growth, in turn, enables job creation. Travel & Tourism, which already supports one in every ten jobs on the planet, and has accounted for one in five of all jobs created across the world over the past five years, is a dynamic engine of employment opportunities. Jobs in Travel & Tourism particularly support women, youth and other, often marginalised groups of society.
Factors influencing the flow of travellers around the world, such as a destination’s attractiveness and its currency strength, will continue to affect traveller behaviour in the coming year. Undoubtedly, new developments will emerge alongside these existing factors. As some nations look increasingly inward, Travel & Tourism becomes even more critical as an engine of economic development and as a vehicle for sharing cultures and building mutual understanding.
The most effective policy and investment decisions are made with empirical evidence. For nearly 30 years, WTTC has been proud to provide the only global comparative evidence base for Travel & Tourism’s economic performance. This data empowers both public and private bodies to make sound economic decisions that can support sustainable and inclusive growth and provides the comparative evidence to analyse the impacts. As a result, governments across the world are better able to strategically plan and develop more effective policies, enhance their decision-making relating to investment, and further cooperate with the private sector to ensure the Travel & Tourism sector provides the greatest opportunities for societies to prosper.
Gloria Guevara ManzoPresident & CEO
TRAVEL & TOURISM ECONOMIC IMPACT 2019
FOREWORD
Cover: Maarten van den Heuvel, UnspashInside cover: Rye Jessen, Unsplash
10.4%Travel & Tourism GDP as a percentage of global GDP.
319mJobs are supported by Travel & Tourism. This is 10% of global employment.
1/5 of all global net jobs created over the last five years within the Travel & Tourism sector.
THE ECONOMIC IMPACT OF GLOBAL TRAVEL & TOURISM
3.9%Direct Travel & Tourism GDP growth in 2018.
CONTENTS
THE ECONOMIC IMPACT OF TRAVEL & TOURISM MARCH 2019
FOREWORD
2019 ANNUAL RESEARCH: KEY HIGHLIGHTS 1
DEFINING THE ECONOMIC CONTRIBUTION OF TRAVEL & TOURISM 2
TRAVEL & TOURISM’S CONTRIBUTION TO GDP 3
TRAVEL & TOURISM’S CONTRIBUTION TO EMPLOYMENT 4
VISITOR EXPORTS AND INVESTMENT 5
DIFFERENT COMPONENTS OF TRAVEL & TOURISM 6
SUMMARY TABLES: ESTIMATES & FORECASTS 7
THE ECONOMIC CONTRIBUTION OF TRAVEL & TOURISM: REAL 2018 PRICES 8
THE ECONOMIC CONTRIBUTION OF TRAVEL & TOURISM: NOMINAL PRICES 9
THE ECONOMIC CONTRIBUTION OF TRAVEL & TOURISM: GROWTH 10
GLOSSARY 11
METHODOLOGICAL NOTE 12
REGIONS, SUB-REGIONS & COUNTRIES 13

2.33.1
5.6
7.2CARIBBEAN15.5%62 BN
NORTH AMERICA8.2%1.9 TN
AFRICA8.5%194 BN
EUROPE9.7%2.2 TN
LATIN AMERICA8.7%336 BN
NORTH EAST ASIA 9.6%2.1 TN
MIDDLE EAST8.7%237 BN
SOUTH ASIA8.8%296 BN
SOUTH EAST ASIA12.6%373 BN
OCEANIA12.2%206 BN
2.1
2.4
0.66.6
6.23.5
SECTOR GDP GROWTH 2018 (%)
TRAVEL & TOURISMCONTRIBUTION TO GDP
TOTAL GDP CONTRIBUTION (US$) % WHOLE ECONOMY GDP % T&T GDP GROWTH
1 UNITED STATES2 CHINA3 JAPAN4 GERMANY5 UNITED KINGDOM6 ITALY7 FRANCE8 INDIA9 SPAIN10 MEXICO11 AUSTRALIA12 BRAZIL13 CANADA14 THAILAND15 TURKEY
2018 T&T CONTRIBUTION TO GDP (US$ BN)
2018 T&T GDPGROWTH (%)**
DOMESTIC SPEND, % SHARE OF TOTAL, 2018
1,5951,50936834531127526624721120915415311111096
2.27.33.61.21.03.24.16.72.42.43.23.12.96.015.0
81.285.882.585.284.476.265.787.244.885.276.193.876.319.838.6
INTERNATIONAL SPEND, % SHARE OF TOTAL, 2018
LEISURE SPEND, % SHARE OF TOTAL, 2018
BUSINESS SPEND, % SHARE OF TOTAL, 2018
18.814.217.514.815.623.834.312.855.214.823.96.223.780.261.4
71.381.468.583.165.979.180.594.888.594.184.487.963.790.687.4
28.718.631.516.934.120.919.55.211.55.915.612.136.39.412.6
* Growth highlighted in green when it is above global T&T GDP growth of 3.9%
**Growth highlighted in green when it is above global T&T GDP growth of 3.9%Source: Oxford Economics for World Travel & Tourism Council
¹This data includes the direct, indirect, and induced impact of Travel & TourismAll data as of February 2019, unless otherwise statedFigures are in real 2018 prices and exchange rates
TRAVEL & TOURISM REGIONAL PERFORMANCE, 2018*
A CLOSER LOOK
GLOBAL GDP GROWTH 2018 (%)
While the financial services sector grew strongest in 2018, Travel & Tourism's growth at 3.9% still strongly outperformed the global economy (3.2%).
BREAKDOWN OF GLOBAL TRAVEL & TOURISM SPENDING
INTERNATIONAL
DOMESTIC
71.2%
28.8%
BUSINESS
LEISURE
78.5%
21.5%
CONTRIBUTION TO GLOBAL GDP 2018 (US$8.8 TN)
10.4%
OF ALL JOBS IN 2018 (319 MILLION)
1 / 103.9 TRAVEL & TOURISM
3.2 WHOLE ECONOMYOF ALL NEW JOBS CREATED OVER THE LAST FIVE YEARS
1 / 5
TRAVEL & TOURISM ECONOMIC IMPACT 2019 | 1
●
●
●
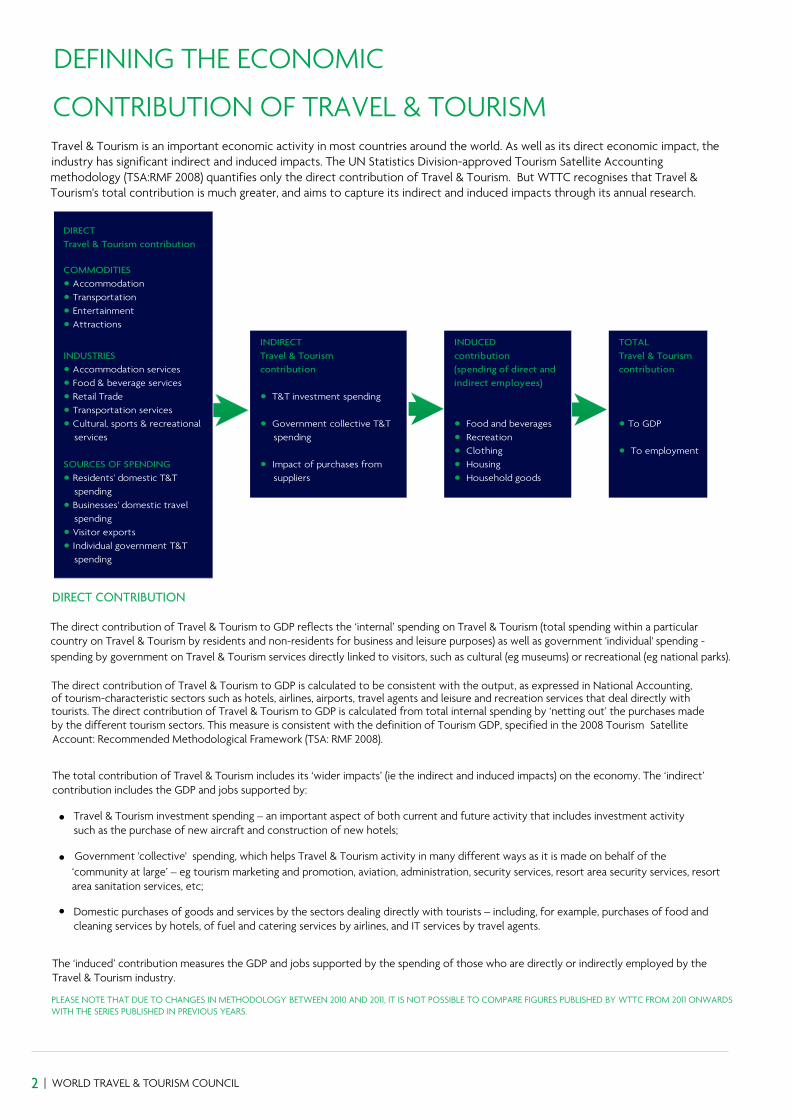
DEFINING THE ECONOMIC
CONTRIBUTION OF TRAVEL & TOURISMTravel & Tourism is an important economic activity in most countries around the world. As well as its direct economic impact, the industry has significant indirect and induced impacts. The UN Statistics Division-approved Tourism Satellite Accounting methodology (TSA:RMF 2008) quantifies only the direct contribution of Travel & Tourism. But WTTC recognises that Travel & Tourism's total contribution is much greater, and aims to capture its indirect and induced impacts through its annual research.
DIRECT CONTRIBUTION
The direct contribution of Travel & Tourism to GDP reflects the ‘internal’ spending on Travel & Tourism (total spending within a particular
spending by government on Travel & Tourism services directly linked to visitors, such as cultural (eg museums) or recreational (eg national parks).
The direct contribution of Travel & Tourism to GDP is calculated to be consistent with the output, as expressed in National Accounting,
tourists. The direct contribution of Travel & Tourism to GDP is calculated from total internal spending by ‘netting out’ the purchases madeby the different tourism sectors. This measure is consistent with the definition of Tourism GDP, specified in the 2008 Tourism Satellite
The total contribution of Travel & Tourism includes its ‘wider impacts’ (ie the indirect and induced impacts) on the economy. The ‘indirect’ contribution includes the GDP and jobs supported by:
Travel & Tourism investment spending – an important aspect of both current and future activity that includes investment activitysuch as the purchase of new aircraft and construction of new hotels;
Government 'collective' spending, which helps Travel & Tourism activity in many different ways as it is made on behalf of the
Domestic purchases of goods and services by the sectors dealing directly with tourists – including, for example, purchases of food and cleaning services by hotels, of fuel and catering services by airlines, and IT services by travel agents.
The ‘induced’ contribution measures the GDP and jobs supported by the spending of those who are directly or indirectly employed by the Travel & Tourism industry.
PLEASE NOTE THAT DUE TO CHANGES IN METHODOLOGY BETWEEN 2010 AND 2011, IT IS NOT POSSIBLE TO COMPARE FIGURES PUBLISHED BY WTTC FROM 2011 ONWARDS WITH THE SERIES PUBLISHED IN PREVIOUS YEARS.
country on Travel & Tourism by residents and non-residents for business and leisure purposes) as well as government 'individual' spending -
of tourism-characteristic sectors such as hotels, airlines, airports, travel agents and leisure and recreation services that deal directly with
Account: Recommended Methodological Framework (TSA: RMF 2008).
‘community at large’ – eg tourism marketing and promotion, aviation, administration, security services, resort area security services, resort area sanitation services, etc;
DIRECTTravel & Tourism contribution
COMMODITIES● Accommodation● Transportation● Entertainment● Attractions
INDIRECT INDUCED TOTAL INDUSTRIES Travel & Tourism contribution Travel & Tourism ● Accommodation services contribution (spending of direct and contribution● Food & beverage services indirect employees)● Retail Trade ● T&T investment spending● Transportation services● Cultural, sports & recreational ● Government collective T&T ● Food and beverages ● To GDP services spending ● Recreation
● Clothing ● To employmentSOURCES OF SPENDING ● Impact of purchases from ● Housing ● Residents' domestic T&T suppliers ● Household goods spending● Businesses' domestic travel spending● Visitor exports● Individual government T&T spending
2 | WORLD TRAVEL & TOURISM COUNCIL

WORLD: DIRECT CONTRIBUTION OF TRAVEL & TOURISM TO GDP
WORLD:TOTAL CONTRIBUTION OF TRAVEL & TOURISM TO GDP
1 All values are in constant 2018 prices & exchange rates
TRAVEL & TOURISM'S CONTRIBUTIONTO GDP1
The direct contribution of Travel & Tourism to GDP in 2018 was USD2,750.7bn (3.2% of GDP). This is forecast to rise by 3.6% to USD2,849.2bn in 2019.This primarily reflects the economic activity generated by industries such as hotels, travel agents, airlines and other passenger transportation
The direct contribution of Travel & Tourism to GDP is expected to grow by 3.6% pa to USD4,065.0bn (3.5% of GDP) by 2029.
0
500
1,000
1,500
2,000
2,500
3,000
3,500
4,000
4,500
2009
2010
2011
2012
2013
2014
2015
2016
2017
2018
2019
2029
2029
CONSTANT 2018 USDBN % OF WHOLE ECONOMY GDP
0.0
0.5
1.0
1.5
2.0
2.5
3.0
3.5
4.0
2009
2010
2011
2012
2013
2014
2015
2016
2017
2018
2019
2029
2029
see page 2) was USD8,811.0bn in 2018 (10.4% of GDP) and is expected to grow by 3.6% to USD9,126.7bn (10.4% of GDP) in 2019.
It is forecast to rise by 3.7% pa to USD13,085.7bn by 2029 (11.5% of GDP).
CONSTANT 2018 USDBN
Direct Indirect Induced
0
2,000
4,000
6,000
8,000
10,000
12,000
14,000
2018 2019 202920290.0
2.0
4.0
6.0
8.0
10.0
12.0
14.0
2018 2019 20292028
Direct Indirect Induced
The total contribution of Travel & Tourism to GDP (including wider effects from investment, the supply chain and induced income impacts,
% OF WHOLE ECONOMY GDP
services (excluding commuter services). But it also includes, for example, the activities of the restaurant and leisure industries directly supported by tourists.
TRAVEL & TOURISM ECONOMIC IMPACT 2019 | 3

WORLD: DIRECT CONTRIBUTION OF TRAVEL & TOURISM TO EMPLOYMENT
WORLD:TOTAL CONTRIBUTION OF TRAVEL & TOURISM TO EMPLOYMENT
Travel & Tourism generated 122,891,000 jobs directly in 2018 (3.8% of total employment) and this is forecast to grow by 2.2% in 2019 to 125,595,000
commuter services). It also includes, for example, the activities of the restaurant and leisure industries directly supported by tourists.
By 2029, Travel & Tourism will account for 154,060,000 jobs directly, an increase of 2.1% pa over the next ten years.
0
20,000
40,000
60,000
80,000
100,000
120,000
140,000
160,000
180,000
2009
2010
2011
2012
2013
2014
2015
2016
2017
2018
2019
2029
'000 JOBS % OF WHOLE ECONOMY EMPLOYMENT
3.2
3.4
3.6
3.8
4.0
4.2
4.4
2009
2010
2011
2012
2013
2014
2015
2016
2017
2018
2019
2029
The total contribution of Travel & Tourism to employment (including wider effects from investment, the supply chain and induced income
By 2029, Travel & Tourism is forecast to support 420,659,000 jobs (11.7% of total employment), an increase of 2.5% pa over the period.
'000 JOBS
Direct Indirect Induced
0
50,000
100,000
150,000
200,000
250,000
300,000
350,000
400,000
450,000
2018 2019 202920290.0
2.0
4.0
6.0
8.0
10.0
12.0
14.0
2018 2019 20292029
Direct Indirect Induced
see page 2) was 318,811,000 jobs in 2018 (10.0% of total employment). This is forecast to rise by 2.9% in 2019 to 328,208,000 jobs (10.1% of total employment).
2029
2029
TRAVEL & TOURISM'S CONTRIBUTIONTO EMPLOYMENT
% OF WHOLE ECONOMY EMPLOYMENT
(3.9% of total employment). This includes employment by hotels, travel agents, airlines and other passenger transportation services (excluding
4 | WORLD TRAVEL & TOURISM COUNCIL

VISITOR EXPORTS
WORLD:VISITOR EXPORTS AND INTERNATIONAL TOURIST ARRIVALS
INVESTMENT
WORLD:CAPITAL INVESTMENT IN TRAVEL & TOURISM
1 All values are in constant 2018 prices & exchange rates
FOREIGN VISITOR EXPORTS (LHS)
VISITOR EXPORTS AND INVESTMENT1
Money spent by foreign visitors to a country (or visitor exports) is a key component of the direct contribution of Travel & Tourism. In 2018, the world generated USD1,643.2bn in visitor exports. In 2019, this is expected to grow by 4.0%, and the world is expected to attract 1,484,910,000 international tourist arrivals.
By 2029, international tourist arrivals are forecast to total 2,196,090,000, generating expenditure of USD2,483.9bn, an increase of 3.8% pa.
CONSTANT 2018 USDBN FOREIGN VISITOR EXPORTS AS % OF TOTAL EXPORTS
0.0
1.0
2.0
3.0
4.0
5.0
6.0
7.0
8.0
2009
2010
2011
2012
2013
2014
2015
2016
2017
2018
2019
2029
2029
Travel & Tourism is expected to have attracted capital investment of USD940.9bn in 2018. This is expected to rise by 4.4% in 2019, and rise by 4.2% pa over the next ten years to USD1,489.5bn in 2029.
Travel & Tourism’s share of total national investment will rise from 4.4% in 2019 to 5.0% in 2029.
CONSTANT 2018 USDBN
0
200
400
600
800
1,000
1,200
1,400
1,600
2009
2010
2011
2012
2013
2014
2015
2016
2017
2018
2019
2029
2029
0.0
1.0
2.0
3.0
4.0
5.0
6.0
2009
2010
2011
2012
2013
2014
2015
2016
2017
2018
2019
2029
2029
% OF WHOLE ECONOMY INVESTMENT
mn
FOREIGN TOURIST ARRIVALS (RHS)
0
417
834
1,251
1,668
2,085
2,502
0
500
1,000
1,500
2,000
2,500
3,000
2009
2010
2011
2012
2013
2014
2015
2016
2017
2018
2019
2029
2029
TRAVEL & TOURISM ECONOMIC IMPACT 2019 | 5

Direct
Induced
Indirect
Indirect is the
36.7%
8.4%
6.4% 1 All values are in constant 2018 prices & exchange rates
Leisure spending
78.5%Business spending
21.5%
Foreign visitor spending
28.8%Domestic spending
71.2%
31.2%
17.3%
collective
51.5%
sum of: (a) Supply chain
(b) Investment
(c) Government
DIFFERENT COMPONENTS OFTRAVEL & TOURISM1
WORLDTRAVEL & TOURISM'S CONTRIBUTION TO GDP:BUSINESS VS LEISURE, 2018 Leisure travel spending (inbound and domestic)
generated 78.5% of direct Travel & Tourism GDP in 2018 (USD4,475.3bn) compared with 21.5% for business travel spending (USD1,228.0bn).
Business travel spending is expected to grow by 3.0% in 2019 to USD1,265.4bn, and rise by 3.2% pa to USD1,735.1bn in 2029.
Leisure travel spending is expected to grow by 3.8% in 2019 to USD4,646.6bn, and rise by 3.9% pa to USD6,780.7bn in 2029.
WORLD
DOMESTIC VS FOREIGN, 2018TRAVEL & TOURISM'S CONTRIBUTION TO GDP:
Domestic travel spending generated 71.2% of direct Travel & Tourism GDP in 2018 compared with 28.8% for visitor exports (ie foreign visitor spending or international tourism receipts).
Domestic travel spending is expected to grow by 3.5% in 2019 to USD4,203.8bn, and rise by 3.7% pa to USD6,031.9bn in 2029.
Visitor exports are expected to grow by 4.0% in 2019 to USD1,708.2bn, and rise by 3.8% pa to USD2,483.9bn in 2029.
a
bc
WORLDBREAKDOWN OF TRAVEL & TOURISM'S
The Travel & Tourism industry contributes to GDP and employment in many ways as detailed on page 2.
The total contribution of Travel & Tourism to GDP is three times greater than its direct contribution.
TOTAL CONTRIBUTION TO GDP, 2018
6 | WORLD TRAVEL & TOURISM COUNCIL

2019
WORLD USDbn % of total Growth2 % of total Growth3
Direct contribution to GDP 2,750.7 3.2 3.6 4,065.0 3.5 3.6
Total contribution to GDP 8,811.0 10.4 3.6 13,085.7 11.5 3.7
Direct contribution to employment4 122,891 3.8 2.2 154,060 4.3 2.1
Total contribution to employment4 318,811 10.0 2.9 420,659 11.7 2.5
Visitor exports 1,643.2 6.5 4.0 2,483.9 7.2 3.8
Domestic spending 4,060.1 4.8 3.5 6,031.9 5.3 3.7
Leisure spending 4,475.3 2.5 3.8 6,780.7 2.8 3.9
Business spending 1,228.0 0.7 3.0 1,735.1 0.7 3.2
Capital investment 940.9 4.4 4.4 1,489.5 5.0 4.212018 constant prices & exchange rates; 22019 real growth adjusted for inflation (%); 32019-2029 annualised real growth adjusted for inflation (%); 4'000 jobs
2018 2018 2029USDbn
SUMMARY TABLES:
ESTIMATES & FORECASTS
1 1
% of total refers to each indicator's share of the relevant whole economy indicator such as GDP and employment. Visitor exports is shown relative to total exports of goods and services.Domestic spending is expressed relative to whole economy GDP. For leisure and business spending, their direct contribution to Travel & Tourism GDP is calculated as a share of whole economy GDP (the sum of these shares equals the direct contribution). Investment is relative to whole economy investment.
TRAVEL & TOURISM ECONOMIC IMPACT 2019 | 7

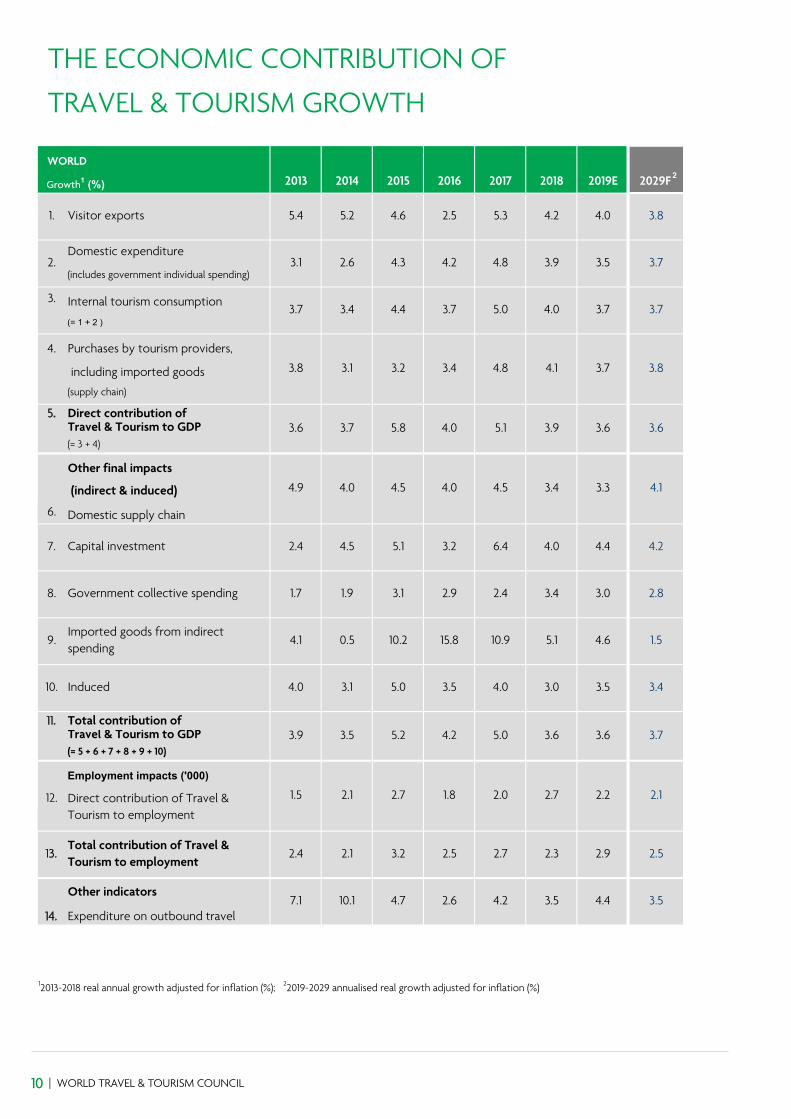
2013 2014 2015 2016 2017 2018 2019E 2029F
Domestic expenditure
(includes government individual spending)
3. Internal tourism consumption
(= 1 + 2 )
4. Purchases by tourism providers,
including imported goods (supply chain)
5. Direct contribution of Travel & Tourism to GDP(= 3 + 4)
Other final impacts
(indirect & induced)
6. Domestic supply chain
11. Total contribution of Travel & Tourism to GDP(= 5 + 6 + 7 + 8 + 9 + 10)
Employment impacts ('000)
12.
Other indicators
14. Expenditure on outbound travel
WORLD
(USDbn, real 2018 prices)
1. Visitor exports 1,327.9 1,397.6 1,462.4 1,498.8 1,577.7 1,643.2 1,708.2 2,483.9
2. 3,339.5 3,427.5 3,576.3 3,725.8 3,906.0 4,060.1 4,203.8 6,031.9
4,667.5 4,825.1 5,038.7 5,224.6 5,483.7 5,703.4 5,912.0 8,515.8
-2,461.8 -2,537.4 -2,618.1 -2,706.9 -2,836.9 -2,952.7 -3,062.8 -4,450.8
2,205.6 2,287.7 2,420.6 2,517.8 2,646.8 2,750.7 2,849.2 4,065.0
2,235.0 2,323.6 2,427.9 2,526.0 2,640.0 2,730.2 2,820.9 4,208.1
7. Capital investment 750.2 784.3 824.2 850.5 905.0 940.9 982.4 1,489.5
8. Government collective spending 412.4 420.2 433.4 446.1 456.6 472.4 486.3 640.7
9.Imported goods from indirect spending
263.3 264.7 291.6 337.7 374.6 393.8 411.9 476.7
10. Induced 1,270.2 1,309.5 1,374.7 1,422.3 1,479.2 1,523.0 1,576.0 2,205.6
7,136.6 7,389.9 7,772.4 8,100.3 8,502.2 8,811.0 9,126.7 13,085.7
109,985 112,291 115,297 117,336 119,627 122,891 125,595 154,060Direct contribution of Travel & Tourism to employment
13.Total contribution of Travel & Tourism to employment
281,112 287,040 296,101 303,431 311,703 318,811 328,208 420,659
1,173.3 1,291.3 1,351.7 1,386.8 1,445.2 1,495.1 1,560.9 2,200.1
THE ECONOMIC CONTRIBUTION OFTRAVEL & TOURISM: REAL 2018 PRICES
8 | WORLD TRAVEL & TOURISM COUNCIL

2013 2014 2015 2016 2017 2018 2019E 2029F
Domestic expenditure
(includes government individual spending)
3. Internal tourism consumption
(= 1 + 2 )
4. Purchases by tourism providers,
including imported goods (supply chain)
5. Direct contribution of Travel & Tourism to GDP(= 3 + 4)
Other final impacts
(indirect & induced)
6. Domestic supply chain
11. Total contribution of Travel & Tourism to GDP(= 5 + 6 + 7 + 8 + 9 + 10)
Employment impacts ('000)
12.
Other indicators
14. Expenditure on outbound travel
Historical data for concepts has been benchmarked to match reported TSA data where available.
WORLD
(USDbn, nominal prices)
1. Visitor exports 1,363.1 1,438.9 1,386.7 1,404.2 1,519.2 1,643.2 1,738.5 3,345.4
2. 3,501.2 3,580.1 3,429.3 3,522.2 3,792.5 4,060.1 4,260.1 8,350.0
4,864.3 5,019.1 4,816.0 4,926.4 5,311.7 5,703.4 5,998.6 11,695.4
-2,559.5 -2,630.8 -2,495.0 -2,545.3 -2,743.8 -2,952.7 -3,105.7 -2,559.5
2,304.8 2,388.3 2,320.9 2,381.1 2,567.9 2,750.7 2,892.9 5,562.8
2,322.5 2,407.4 2,320.4 2,374.7 2,551.1 2,730.2 2,855.6 5,878.2
7. Capital investment 781.2 811.9 791.2 806.6 879.9 940.9 997.4 2,053.0
8. Government collective spending 429.0 434.5 412.7 423.3 443.6 472.4 493.9 870.6
9.Imported goods from indirect spending
266.7 268.9 279.6 316.9 361.0 393.9 419.6 638.0
10. Induced 1,328.0 1,363.9 1,319.2 1,347.5 1,437.2 1,523.0 1,598.8 3,028.3
7,432.2 7,674.8 7,444.0 7,650.2 8,240.7 8,811.0 9,258.3 18,031.0
109,985 112,291 115,297 117,336 119,627 122,891 125,595
13.Total contribution of Travel & Tourism to employment
281,112 287,040 296,101 303,431
1,393.1 1,495.1 1,582.6 3,040.5
154,060Direct contribution of Travel & Tourism to employment
311,703 318,811
*Concepts shown in this table align with the standard table totals as described in the 2008 Tourism Satellite Account: Recommended Methodological Framework (TSA: RMF 2008) developed by the United Nations Statistical Division (UNSD), the Statistical Office of the European Communities (EUROSTAT), the Organisation for Economic Co-operation and Development (OECD) and the World Tourism Organization (UNWTO).
328,208 420,659
1,245.1 1,356.0 1,289.6 1,297.1
THE ECONOMIC CONTRIBUTION OF
TRAVEL & TOURISM: NOMINAL PRICES
TRAVEL & TOURISM ECONOMIC IMPACT 2019 | 9
2013 2014 2015 2016 2017 2018 2019E 2029F
Domestic expenditure
(includes government individual spending)
3. Internal tourism consumption
(= 1 + 2 )
4. Purchases by tourism providers,
including imported goods (supply chain)
5. Direct contribution of Travel & Tourism to GDP(= 3 + 4)
Other final impacts
(indirect & induced)
6. Domestic supply chain
11. Total contribution of Travel & Tourism to GDP(= 5 + 6 + 7 + 8 + 9 + 10)
Employment impacts ('000)
12.
Other indicators
14. Expenditure on outbound travel
WORLD
Growth1 (%)
1. Visitor exports 5.4 5.2 4.6 2.5 5.3 4.2 4.0 3.8
2. 3.1 2.6 4.3 4.2 4.8 3.9 3.5 3.7
3.7 3.4 4.4 3.7 5.0 4.0 3.7 3.7
3.8 3.1 3.2 3.4 4.8 4.1 3.7 3.8
3.6 3.7 5.8 4.0 5.1 3.9 3.6 3.6
4.9 4.0 4.5 4.0 4.5 3.4 3.3 4.1
7. Capital investment 2.4 4.5 5.1 3.2 6.4 4.0 4.4 4.2
8. Government collective spending 1.7 1.9 3.1 2.9 2.4 3.4 3.0 2.8
9.Imported goods from indirect spending
4.1 0.5 10.2 15.8 10.9 5.1 4.6 1.5
10. Induced 4.0 3.1 5.0 3.5
3.9 3.5 5.2 4.2 5.0 3.6
2.7 2.2
4.0 3.0 3.5 3.4
2.7 2.3
3.6 3.7
1.5 2.1 2.7 1.8 2.0
4.4 3.5
2.1Direct contribution of Travel & Tourism to employment
13.Total contribution of Travel & Tourism to employment
2.4 2.1 3.2 2.5
12013-2018 real annual growth adjusted for inflation (%); 22019-2029 annualised real growth adjusted for inflation (%)
2.9 2.5
7.1 10.1 4.7 2.6 4.2 3.5
THE ECONOMIC CONTRIBUTION OFTRAVEL & TOURISM GROWTH
2
10 | WORLD TRAVEL & TOURISM COUNCIL

GLOSSARYKEY DEFINITIONS
TRAVEL & TOURISMRelates to the activity of travellers on trips outside their usual environment with a duration of less than one year. Economic activity related to all aspects of such trips is measured within the research.
DIRECT CONTRIBUTION TO GDPGDP generated by industries that deal directly with tourists, including hotels, travel agents, airlines and other passenger transport services, as well as the activities of restaurant and leisure industries that deal directly with tourists. It is equivalent to total internal Travel & Tourism spending (see below) within a country less the purchases made by those industries (including imports). In terms of the UN’s Tourism Satellite Account methodology it is consistent with total GDP calculated in table 6 of the TSA: RMF 2008.
DIRECT CONTRIBUTION TO EMPLOYMENTThe number of direct jobs within Travel & Tourism. This is consistent with total employment calculated in table 7 of the TSA: RMF 2008.
TOTAL CONTRIBUTION TO GDPGDP generated directly by the Travel & Tourism sector plus its indirect and induced impacts (see below).
TOTAL CONTRIBUTION TO EMPLOYMENTThe number of jobs generated directly in the Travel & Tourism sector plus the indirect and induced contributions (see below).
DIRECT SPENDING IMPACTS
VISITOR EXPORTSSpending within the country by international tourists for both business and leisure trips, including spending on transport, but excluding international spending on education. This is consistent with total inbound tourism expenditure in table 1 of the TSA: RMF 2008.
DOMESTIC TRAVEL & TOURISM SPENDINGSpending within a country by that country’s residents for both business and leisure trips. Multi-use consumer durables are not included since they are not purchased solely for tourism purposes. This is consistent with total domestic tourism expenditure in table 2 of the TSA: RMF 2008. Outbound spending by residents abroad is not included here, but is separately identified according to the TSA: RMF 2008 (see below).
GOVERNMENT INDIVIDUAL SPENDINGSpending by government on Travel & Tourism services directly linked to visitors, such as cultural services (eg museums) or recreational services (eg national parks).
INTERNAL TOURISM CONSUMPTIONTotal revenue generated within a country by industries that deal directly with tourists including visitor exports, domestic spending and government individual spending. This does not include spending abroad by residents. This is consistent with total internal tourism expenditure in table 4 of the TSA: RMF 2008.
BUSINESS TRAVEL & TOURISM SPENDINGSpending on business travel within a country by residents and international visitors.
LEISURE TRAVEL & TOURISM SPENDINGSpending on leisure travel within a country by residents and international visitors.
INDIRECT AND INDUCED IMPACTS
INDIRECT CONTRIBUTIONThe contribution to GDP and jobs of the following three factors:
• CAPITAL INVESTMENT: Includes capital investment spending by all industries directly involved in Travel & Tourism. This also constitutes investment spending by other industries on specific tourism assets such as new visitor accommodation and passenger transport equipment, as well as restaurants and leisure facilities for specific tourism use. This is consistent with total tourism gross fixed capital formation in table 8 of the TSA: RMF 2008.
• GOVERNMENT COLLECTIVE SPENDING: Government spending in support of general tourism activity. This can include national as well as regional and local government spending. For example, it includes tourism promotion, visitor information services, administrative services and other public services. This is consistent with total collective tourism consumption in table 9 of TSA: RMF 2008.
• SUPPLY-CHAIN EFFECTS: Purchases of domestic goods and services directly by different industries within Travel & Tourism as inputs to their final tourism output.
INDUCED CONTRIBUTIONThe broader contribution to GDP and employment of spending by those who are directly or indirectly employed by Travel & Tourism.
OTHER INDICATORS
OUTBOUND EXPENDITURESpending outside the country by residents on all trips abroad. This is fully aligned with total outbound tourism expenditure in table 3 of the TSA: RMF 2008.
FOREIGN VISITOR ARRIVALSThe number of arrivals of foreign visitors, including same-day and overnight visitors (tourists) to the country.
TRAVEL & TOURISM ECONOMIC IMPACT 2019 | 11

METHODOLOGICAL NOTEWTTC has an on-going commitment to align its economic impact research with the UN Statistics Division-approved 2008 Tourism Satellite Account: Recommended Methodological Framework (TSA:RMF 2008). This involves the benchmarking of country reports to official, published TSAs, including for countries which are reporting data for the first time, as well as existing countries reporting an additional year’s data. New country TSAs incorporated this year include Botswana, Macao, Malta, South Korea and Uruguay, bringing our total of countries in our benchmarking dataset to 63. Our TSA benchmarked countries now cover 85% of global direct T&T GDP.
WTTC coverage includes data on 185 countries and reports on 25 other regions, sub-regions and economic and geographic groups. This year, there are 10 reports for special economic and geographic groups.
ECONOMIC AND GEOGRAPHIC GROUPS
APEC (ASIA-PACIFIC ECONOMIC COOPERATION)Australia, Brunei, Canada, Chile, China, Hong Kong, Indonesia, Japan, South Korea, Malaysia, Mexico, New Zealand, Papua New Guinea, Peru, Philippines, Russian Federation, Singapore, Taiwan, Thailand, USA, Vietnam.
FORMER NETHERLANDS ANTILLESBonaire, Curacao, Sint Maarten, Saba and Sint Eustatius.
G20Argentina, Australia, Brazil, Canada, China, European Union, France*, Germany*, India, Indonesia, Italy*, Japan, Mexico, Russian Federation, Saudi Arabia, South Africa, South Korea, Turkey, UK*, USA.
GCC (GULF COOPERATION COUNCIL)Bahrain, Kuwait, Oman, Qatar, Saudi Arabia, UAE.
OAS (ORGANIZATION OF AMERICAN STATES)Argentina, Antigua and Barbuda, Bahamas, Barbados, Belize, Bolivia, Brazil, Canada, Chile, Colombia, Costa Rica, Cuba, Dominican Republic, Dominica, Ecuador, El Salvador, Grenada, Guatemala, Guyana, Haiti, Honduras, Jamaica, Mexico, St Kitts and Nevis, Nicaragua, Panama, Paraguay, Peru, St Lucia, St Vincent and the Grenadines, Suriname, Trinidad and Tobago, USA, Uruguay.
OECD (ORGANISATION FOR ECONOMIC CO-OPERATION AND DEVELOPMENT)Australia, Austria, Belgium, Canada, Chile, Czech Republic, Denmark, Estonia, Finland, France, Germany, Greece, Hungary, Iceland, Ireland, Israel, Italy, Japan, South Korea, Latvia, Lithuania, Luxembourg, Mexico, Netherlands, New Zealand, Norway, Poland, Portugal, Slovak Republic, Slovenia, Spain, Sweden, Switzerland, Turkey, UK, USA.
(OIC) ORGANISATION FOR ISLAMIC COOPERATION**Albania, Algeria, Azerbaijan, Bahrain, Bangladesh, Benin, Brunei Darussalam, Burkina Faso, Cameroon, Chad, Comoros, Egypt, Gabon, Gambia, Guinea, Guyana, Indonesia, Iran, Iraq, Ivory Coast, Jordan, Kazakhstan, Kuwait, Kyrgyzstan, Lebanon, Libya, Malaysia, Maldives, Mali, Morocco, Mozambique, Niger, Nigeria, Oman, Pakistan, Qatar, Saudi Arabia, Senegal, Sierra Leone, Sudan, Suriname, Syria, Tajikistan, Togo, Tunisia, Turkey, UAE, Uganda, Uzbekistan, Yemen.
OTHER OCEANIAAmerican Samoa, Cook Islands, French Polynesia, Guam, Marshall Islands, Micronesia (Federated States of), New Caledonia, Niue, Northern Mariana Islands, Palau, Samoa, Tuvalu.
PACIFIC ALLIANCEChile, Colombia, Mexico, Peru.
SADC (SOUTHERN AFRICAN DEVELOPMENT COMMUNITY)Angola, Botswana, Democratic Republic of Congo (DRC), Eswatini, Lesotho, Madagascar, Malawi, Mauritius, Mozambique, Namibia, Seychelles, South Africa, Tanzania, Zambia, Zimbabwe.
* included in European Union** no data for Afghanistan, Djibouti, Guinea-Bissau, Mauritania, Palestine, Somalia or Turkmenistan
12 | WORLD TRAVEL & TOURISM COUNCIL

ECONOMIC IMPACT REPORTSREGIONS, SUB REGIONS &COUNTRIES
WORLD
REG
ION
SUB
REG
ION
COUNTRY
AFR
ICA
NO
RTH
AFR
ICA
Algeria
Egypt
Libya
Morocco
Tunisia
SUB-
SAH
ARA
N
Angola
Benin
Botswana
Burkina Faso
Burundi
Cameroon
Cape Verde
Central African Republic
Chad
Comoros
Congo
Cote d'Ivoire
Democratic Republic of Congo
Eswatini
Ethiopia
Gabon
Gambia
Ghana
Guinea
Kenya
Lesotho
Madagascar
Malawi
Mali
Mauritius
Mozambique
Namibia
Niger
Nigeria
Reunion
Rwanda
Sao Tome and Principe
Senegal
Seychelles
Sierra Leone
South Africa
Sudan
Tanzania
Togo
Uganda
Zambia
Zimbabwe
REG
ION
SUB
REG
ION
COUNTRY
ASI
A-PA
CIF
IC
NO
RTH
EAST
ASI
A
China
Hong Kong
Japan
South Korea
Macau
Mongolia
Taiwan
CEN
TRA
L A
SIA Kazakhstan
Kyrgyzstan
Tajikistan
Uzbekistan
OC
EAN
IA
Australia
Fiji
Kiribati
New Zealand
Papua New Guinea
Solomon Islands
Tonga
Vanuatu
Other Oceanic States
SOU
TH A
SIA
Bangladesh
India
Maldives
Nepal
Pakistan
Sri Lanka
SOU
THEA
ST A
SIA
(ASE
AN
)
Brunei Darussalam
Cambodia
Indonesia
Laos
Malaysia
Myanmar
Philippines
Singapore
Thailand
Vietnam
EURO
PE
EURO
PEA
N U
NIO
N
Austria
Belgium
Bulgaria
Croatia
Cyprus
Czech Republic
Denmark
Estonia
Finland
France
Germany
Greece
REG
ION
SUB
REG
ION
COUNTRY
AM
ERIC
AS
CA
RIBB
EAN
Anguilla
Antigua and Barbuda
Aruba
Bahamas
Barbados
Bermuda
British Virgin Islands
Cayman Islands
Cuba
Dominica
Dominican Republic
Former Netherland Antillies
Grenada
Guadeloupe
Haiti
Jamaica
Martinique
Puerto Rico
St Kitts and Nevis
St Lucia
St Vincent and the Grenadines
Trinidad and Tobago
US Virgin Islands
LATI
N A
MER
ICA
Argentina
Belize
Bolivia
Brazil
Chile
Colombia
Costa Rica
Ecuador
El Salvador
Guatemala
Guyana
Honduras
Nicaragua
Panama
Paraguay
Peru
Suriname
Uruguay
Venezuela
NO
RTH
A
MER
ICA Canada
Mexico
USA
REG
ION
SUB-
REG
ION
COUNTRY
EURO
PE
EURO
PEA
N U
NIO
N
Hungary
Ireland
Italy
Latvia
Lithuania
Luxembourg
Malta
Netherlands
Poland
Portugal
Romania
Slovakia
Slovenia
Spain
Sweden
UK
OTH
ER E
URO
PE
Albania
Armenia
Azerbaijan
Belarus
Bosnia and Herzegovina
Georgia
Iceland
Moldova
Montenegro
North Macedonia
Norway
Russian Federation
Serbia
Switzerland
Turkey
Ukraine
MID
DLE
EA
ST
Bahrain
Iran
Iraq
Israel
Jordan
Kuwait
Lebanon
Oman
Qatar
Saudi Arabia
Syria
United Arab Emirates
Yemen
TRAVEL & TOURISM ECONOMIC IMPACT 2019 | 13

The World Travel & Tourism Council is the global authority on the economic and social contribution of Travel & Tourism.
WTTC promotes sustainable growth for the Travel & Tourism sector, working with governments and international institutions to create jobs, to drive exports and to generate prosperity. Council Members are the Chairs, Presidents and Chief Executives of the world’s leading private sector Travel & Tourism businesses.
Together with Oxford Economics, WTTC produces annual research that shows Travel & Tourism to be one of the world’s largest sectors, supporting over 319 million jobs and generating 10.4% of global GDP in 2018. Comprehensive reports quantify, compare and forecast the economic impact of Travel & Tourism on 185 economies around the world. In addition to individual country fact sheets, and fuller country reports, WTTC produces a world report highlighting global trends and 25 further reports that focus on regions, sub-regions and economic and geographic groups.
To download reports or data, please visit www.wttc.org
Assisting WTTC to Provide Tools for Analysis, Benchmarking, Forecasting and Planning.
Oxford Economics is a leader in global forecasting and quantitative analysis. Our worldwide client base comprises more than 1,500 international corporations, financial institutions, government organisations, and universities.
Headquartered in Oxford, with offices around the world, we employ 400 staff, including 250 economists and analysts. Our best-in-class global economic and industry models and analytical tools give us an unmatched ability to forecast external market trends and assess their economic, social and business impact. For more information, visit www.oxfordeconomics.com
Contributing data to the WTTC Economic Impact Model
STR is the source for premium hotel data benchmarking, analytics and marketplace insights. STR provides data that is reliable, confidential, accurate and actionable, and their comprehensive solutions empower clients to strategize and compete within their markets. The company’s range of products includes data-driven solutions, thorough analytics and unrivalled marketplace insights, all built to fuel business growth and help clients make better operational and financial decisions. STR maintains a presence in 15 countries and collects data for over 62,000 hotels across 180 countries.
ForwardKeys analyses more than 17m flight booking transactions a day, drawing data from all the major global air reservation systems and selected airlines and tour operators. This information is enhanced with further independent data sets, including flight search and official government statistics, plus data science to paint a picture of who is travelling where and when. ForwardKeys’ analytics are used by traveller-focussed businesses worldwide to monitor and anticipate traveller arrivals from a particular origin market at a specific time. This analysis enables parties to anticipate the impact of events, better manage their staffing levels, fine tune supply requirements, adjust and measure the effectiveness of their marketing efforts and anticipate future market trends.
14 | WORLD TRAVEL & TOURISM COUNCIL

© World Travel & Tourism Council: Travel & Tourism Economic Impact 2019 - March 2019. All rights reserved.
The copyright laws of the United Kingdom allow certain uses of this content without our (i.e. the copyright owner’s) permission. You are permitted to use limited extracts of this content, provided such use is fair and when such use is for non-commercial research, private study, review or news reporting. The following acknowledgment must also be used, whenever our content is used relying on this “fair dealing” exception:“Source: World Travel and Tourism Council: Travel & Tourism Economic Impact 2019 - March 2019. All rights reserved.”
If your use of the content would not fall under the “fair dealing” exception described above, you are permitted to use this content in whole or in part for non-commercial or commercial use provided you comply with the Attribution, Non-Commercial 4.0 International Creative Commons Licence. In particular, the content is not amended and the following acknowledgment is used, whenever our content is used:“Source: World Travel and Tourism Council: Economic Impact 2019 - March 2019. All rights reserved. Licensed under the Attribution, Non-Commercial 4.0 International Creative Commons Licence.”
You may not apply legal terms or technological measures that legally restrict others from doing anything this license permits.
Inside cover: Juan Di Nella, Unsplash

THE AUTHORITY ON WORLD TRAVEL & TOURISMWORLD TRAVEL & TOURISM COUNCIL (WTTC), The Harlequin Building, 65 Southwark Street, London SE1 0HR, United KingdomTel: +44 (0) 207 481 8007 | Email: [email protected] | www.wttc.org