Embed Size (px)
Citation preview

Promet – Traffic&Transportation, Vol. 22, 2010, No. 1, 23-27 23
T. Berta, Á. Török: Travel Time Reduction due to Infrastructure Development in Hungary
TAMAS BERTAE-mail: [email protected] Division for Road Safety and Traffic Engineering ÁDÁM TÖRÖK, Ph.D.E-mail: [email protected] Division for Transport Policy and Economics KTI - Institute for Transport Sciences Than Karoly 3-5, H-1111 Budapest, Republic of Hungary
Traffic on Motorways Preliminary Communication
Accepted: Mar. 11, 2009 Approved: Feb. 02, 2010
TRAVEL TIME REDUCTION DUE TO INFRASTRUCTURE DEVELOPMENT IN HUNGARY
ABSTRACT
The main scope of this paper is to present the formu-lation and visualization of shortening travel time in road transport due to the improvement of road network in Hun-gary. The formulation of the travel time based model has been developed by the authors. The paper also presents the demonstration of the results. The approach followed is quite innovatory in terms of visualization. The travel times were taken into account as opposed to geographical distances. Also, graph theory is used in order to calculate the matrix of “travel time” distances. The data from more than 30 cities were included in the model so as to make it quite represen-tative for Hungary.
KEYWORDS
road transportation, reduction of travel time, positive exter-nal effect
1. INTRODUCTION
The aim of this paper is to present the travel time shortening due to the improvement of road transport infrastructure development in Hungary. The duties of State Motorway Management Company are the op-eration and maintenance of the parts of Hungary’s high speed road network under its management, as well as the control of road-use authorization on toll sections [1]. To put it in numbers, this means manag-ing of 666.5km of motorways and 129.1km of other roads, as well as 301.4km of junction access and exit roads and the slip roads leading to motorway services, 113 rest areas themselves, and over 1000 separate bridge sections (Figure 1). On 555.1km of the motor-ways managed by the company all the motor-vehicle categories have to pay toll, and on 69.5km only those vehicles with a total weight of over 3.5 tons are liable for the charge.
2. TRAVEL TIME REDUCTION MODELLING
For the analyses and calculation of the model, the travel times between the cities were needed. The trav-el time variable is a good operational measure of ef-fectiveness of traffic systems [2]. For greater accuracy of the results the actual travel time has been calcu-lated with the usage of motorway system and without the usage of motorway system as opposed to the “geo-graphic” (or straight line) distances. In mathematics and computer science, graph theory is the study of graphs that are mathematical structures used to mod-el pairwise relations between objects from a certain collection [3]. A “graph” in this context refers to a col-lection of vertices and a collection of edges that con-nect pairs of vertices [4]. In our case we have the ver-tices as ports and the edges as routes between them. A graph may be undirected, meaning that there is no distinction between the two vertices associated with each edge, or its edges may be directed from one ver-tex to another. In the Euclidean space, the distance be-tween two points is given by the Euclidean distance (2-norm distance). For point A (a1 , a2 , … , an) and point B (b1 , b2 , … , bn) the distance between A and B is de-fined as 2-norm distance given by (1):
d a bAB i ii
n
1
2= -
=
e o/ (1)
In the Cartesian coordinates, the distance between two points is the length of the line segment between them (2):
d x y x x y yij j i j i2 2 2 2= + = +D D - -^ ^ ^ ^h h h h (2)
where (xi , yi) are the coordinates of starting and (xj , yj) are the coordinates of ending points of measurement and vice versa.
This gives the distance between two points as mea-sured with a ruler (straight line). When building a city distance model the problem lies in the fact that the 2-norm “Cartesian” distance does not model the real-

T. Berta, Á. Török: Travel Time Reduction due to Infrastructure Development in Hungary
24 Promet – Traffic&Transportation, Vol. 22, 2010, No. 1, 23-27
ity, because road transportation does not necessarily take the “shortest” path, as it depends on the infra-structure. That is the reason why the “Cartesian” dis-tance was changed to “travel time” distance. “Travel time” distance describes the elapsed time between cities i and j, by the route between them being either a motorway system or a non-motorway system. The “travel time” distance matrix Dr between m cities is given by:
D dd
d
d
dd
00
0r r j
r m
r j
r jm
r j
r jm1
1
1 1
= > H (3)
where Dr is a symmetric and square matrix, rdij is the travel time distance between cities i and j and r is a system parameter (motorway or non-motorway sys-tem).
The number of pairs of points ( )m m21-
is the number of independent elements in the travel time distance matrix. In order to build up a graph from the travel times, the relative coordinates of the cities have been calculated. Multidimensional scaling (MDS) was used, which is a set of related statistical techniques often used in data visualization. MDS is a special case of ordination. An MDS algorithm starts with a matrix
(matrix of travel time distances in this case), and then assigns a “location” of each vertex in a low-dimension-al space suitable for graphing. Relation (4) describes the matrix Dr as a matrix of Euclidian distances based on the relative coordinates of ports (vertices) in the graph.
This is based on the same method as the way in which the computer calculates the place of vertices or cities compared to other vertices or cities. Since we used an MDS algorithm, relation (4) and the travel time distance between the cities, instead of the Euclidean ones, we had to compare the observed distances with the calculated data from MDS, in order to make sure our above model is valid. Measuring “the goodness-of-fit” was therefore necessary. The most common mea-sure used to evaluate how well (or how poorly) a par-ticular configuration reproduces the observed data (in this case the distance matrix) is the so called “stress measure”. The raw “stress value” { of configuration (5) is defined by:
( )d f,
r ij iji j
m2
1={ d-
=
6 @/ (5)
where rdij stands for the reproduced distances from relative coordinates {(rxk, ryk), k=1,…m}, dij are the
Fig 1 Geographical map of Hungaryure -
Source: Eötvös University, Department of Cartography and Geoinformatics, Laszlo ZENTAI, 2000
D x x y yx x y y
x x y y
x x y y
x x y yx x y y
00
0r r r j r r j
r r m r r m
r j r r j r
r j r m r j r m
r m r r m r
r m r j r m r j12
12
12
12
12
12
2 2
12
12
2 2= +
+
+
+
+
+- -
- -
- -
- -
- -
- -^ ^^
^ ^^
^ ^^
^ ^^
^ ^^
^ ^^h h h
h h h
h h h
h h h
h h h
h h h> H (4)

Promet – Traffic&Transportation, Vol. 22, 2010, No. 1, 23-27 25
T. Berta, Á. Török: Travel Time Reduction due to Infrastructure Development in Hungary
input data (i.e., observed average travel time with-out the possibility of traffic jam) and f(dij) indicates a monotone transformation of the observed data. Transformation f transforms the travel time that has been measured between the cities using either mo-torway system or non-motorway system into a relative distance. A monotone transformation is a transfor-mation that preserves the inequalities of its argu-ments, i.e. if f is a monotone transformation, then: if x > y, then f(x) > f(y). We have calculated relative coordinates of vertices (cities) from the travel time between them. From the relative coordinates a rela-tive distance can be calculated. The relative distance
was compared with the observed travel time. Thus, the smaller the stress value, the better is the fit of the reproduced distance matrix that is based on the relative coordinates to the observed distance matrix that is based on the travel time (in this case the value of { was 0.1 [-] for motorway system and 0.05 [-] in the case when motorway system does not exist). Mea-surement unit [-] is a relative unit distance followed from the relative coordinates and it presents the dis-tance which can be reached by driving for an hour at an average velocity. If the matrix of reproduced dis-tances is the same as the matrix of values f(dij) , the difference { would be zero.
Travel time without motorway system [min] Travel time without motorway system [min]
500 500400 400300 300200 200100 1000 0
5 5
4 4
3 3
2 2
1 1
0 0
Re
lati
ve
dis
tan
ce
[-]
Re
lati
ve
dis
tan
ce
[-]
Figure 2a and 2b - Shepard diagram of transformation between d and with (2a) (R =0.89)
and without (2b) (R =0.863) the motorway systemr ij ijd 2
2
Figure 3 - Modified map of Hungary according to travel time with motorway system
T. Berta, Á. Török: Travel Time Reduction due to Infrastructure Development in Hungary
26 Promet – Traffic&Transportation, Vol. 22, 2010, No. 1, 23-27
As an additional way of checking, a Shepard dia-gram was produced, i.e. a plot between the repro-duced distances from relative coordinates plotted on the vertical (Y) axis versus the measured time plotted on the horizontal (X) axis. This is shown in Figures 2a and 2b.
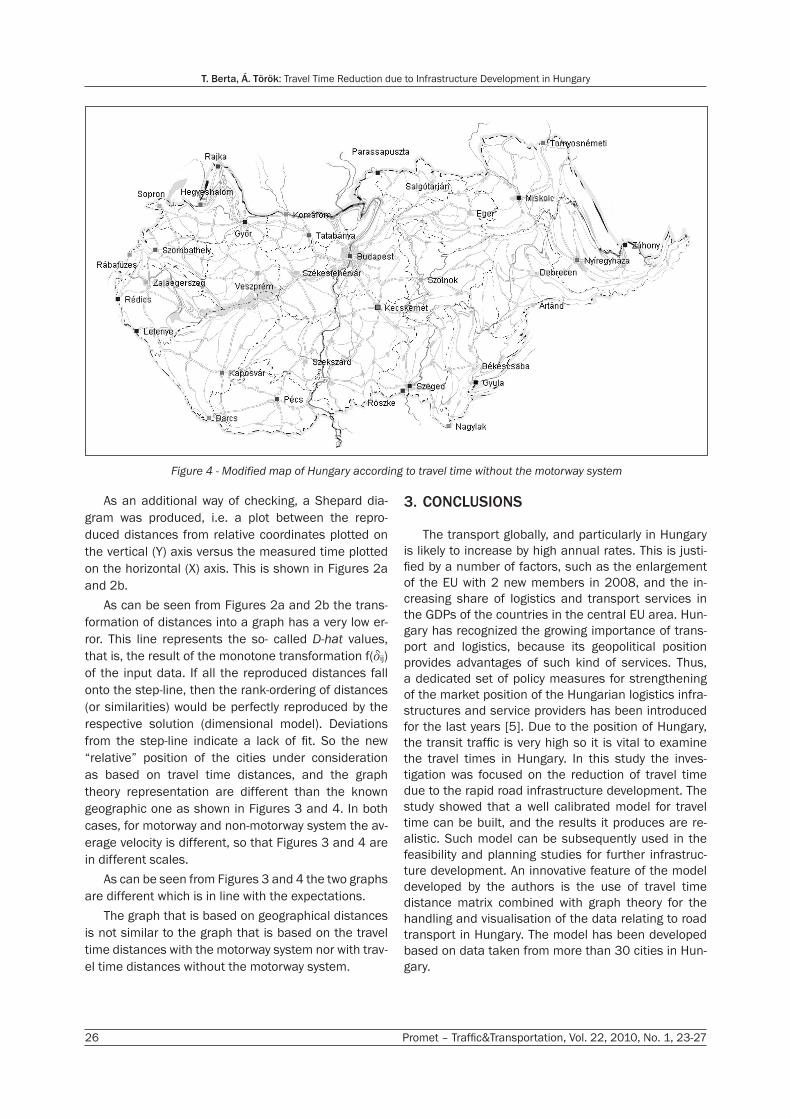
As can be seen from Figures 2a and 2b the trans-formation of distances into a graph has a very low er-ror. This line represents the so- called D-hat values, that is, the result of the monotone transformation f(dij) of the input data. If all the reproduced distances fall onto the step-line, then the rank-ordering of distances (or similarities) would be perfectly reproduced by the respective solution (dimensional model). Deviations from the step-line indicate a lack of fit. So the new “relative” position of the cities under consideration as based on travel time distances, and the graph theory representation are different than the known geographic one as shown in Figures 3 and 4. In both cases, for motorway and non-motorway system the av-erage velocity is different, so that Figures 3 and 4 are in different scales.
As can be seen from Figures 3 and 4 the two graphs are different which is in line with the expectations.
The graph that is based on geographical distances is not similar to the graph that is based on the travel time distances with the motorway system nor with trav-el time distances without the motorway system.
3. CONCLUSIONS
The transport globally, and particularly in Hungary is likely to increase by high annual rates. This is justi-fied by a number of factors, such as the enlargement of the EU with 2 new members in 2008, and the in-creasing share of logistics and transport services in the GDPs of the countries in the central EU area. Hun-gary has recognized the growing importance of trans-port and logistics, because its geopolitical position provides advantages of such kind of services. Thus, a dedicated set of policy measures for strengthening of the market position of the Hungarian logistics infra-structures and service providers has been introduced for the last years [5]. Due to the position of Hungary, the transit traffic is very high so it is vital to examine the travel times in Hungary. In this study the inves-tigation was focused on the reduction of travel time due to the rapid road infrastructure development. The study showed that a well calibrated model for travel time can be built, and the results it produces are re-alistic. Such model can be subsequently used in the feasibility and planning studies for further infrastruc-ture development. An innovative feature of the model developed by the authors is the use of travel time distance matrix combined with graph theory for the handling and visualisation of the data relating to road transport in Hungary. The model has been developed based on data taken from more than 30 cities in Hun-gary.
Figure 4 - Modified map of Hungary according to travel time without the motorway system

Promet – Traffic&Transportation, Vol. 22, 2010, No. 1, 23-27 27
T. Berta, Á. Török: Travel Time Reduction due to Infrastructure Development in Hungary
TAMAS BERTAE-mail: [email protected] Közlekedésbiztonségi és Forgalomtechnikai Tagozat Dr. ÁDÁM TÖRÖKE-mail: [email protected] Közlekedéspolitikai és -gazdasági Tagozat KTI - Közlekedéstudományi Intézet Than Karoly 3-5, H-1111 Budapest, Magyar Köztársaság
ABSZTRAKT
AZ UTAZÁSI IDŐ CSÖKKENÉSE A MAGYAR GYORSFORGALMI ÚTHÁLÓZATFEJLESZTÉS KÖVETKEZTÉBEN
Cikkünk célja az gyorsforgalmi úthálózat fejlesztés követ-keztében létrejövő utazási idő rövidülés matematikai mod-ellezésének és megjelenítésnek bemutatása A matematikai model alapját egy honnan-hová utazási idő matrix képezi. A cikk továbbá tartalmazza az eredmények bemutatását, Cik-künkben az utazási idő és a földrajzi távolság között feszülő ellentétet próbáltuk gráf elméleti alapon feloldani. Az alapa-datokat több mint 30 magyar város felhasználásával gener-álták a szerzők.
KULCSSZAVAK
közúti közlekedés, utazási idő rövidülése, pozítív externális hatás
LITERATURE
[1] Mészáros F.: Acceptability as an important precondi-tion of transport policy implementation, with special re-gard to Hungary as a newly accessing country, Schrift-enreihe der Deutschen Verkehrswissenschaftlichen Gesellschaft. Budapest, Magyarország, 2003.07.02-2003.07.06. Berlin, 2004.
[2] J.-S. Yang: Application of the Kalman filter to arte-rial travel time prediction: A special event case study, Control and intelligent systems, ISSN 1480-1752, 2007, vol. 35, no1, pp. 79-85.
[3] Giannopoulos, G., Aifadopoulou, G., Torok, A.: Port Choice Model for the Transshipment of Containers in Eastern Mediterranean, TRB 87th Annual Meeting. Washington, USA, 2008. pp. 25-40 . Paper #08-1517.
[4] Dienstel, R.: Graph Theory, Springer-Verlag Heidelberg, New York 2005,
[5] Bokor, Z.: Hungary: role of the state in intermodal transport logistics services. Logistics and Transport Focus, vol. 9, no. 8, 2007, pp. 37-41.