Embed Size (px)
Citation preview

Travel Patterns and Trends (chapter 2)
Oğuz BeniceTHS 52131Introduction To Tourism IndustryFall 2005

International and regional travel trends such as 1. visitor arrivals2. tourism receipts3. top destinations4. tourism expenditures...will be examined in this chapter.
Introduction

The understanding of trends is important as they provide an indication to what is likely to occur in the future for planning and marketing a touristic destination.
External factors including political, demographic, social and technological changes will also be considered.
Introduction
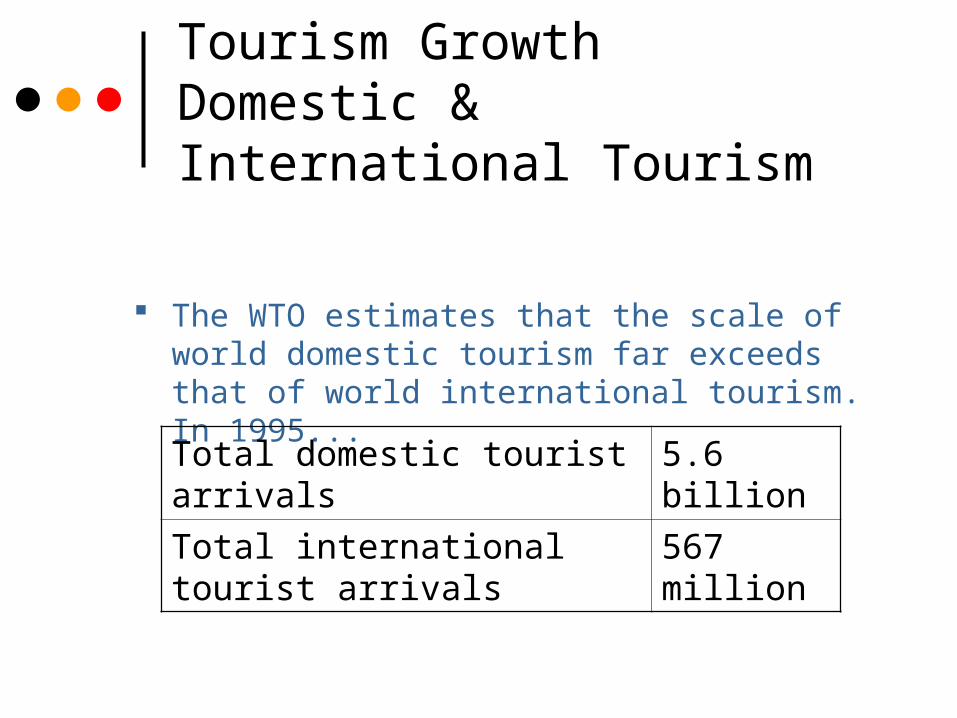
The WTO estimates that the scale of world domestic tourism far exceeds that of world international tourism. In 1995...
Tourism GrowthDomestic & International Tourism
Total domestic tourist arrivals 5.6 billion
Total international tourist arrivals
567 million

The Boom in international tourist arrivals around the globe is relatively new. Statistics & projects:
Tourism GrowthTotal International Arrivals
1950 25 million people
1970 160 million people
2000 702 million people
2020 1.600 million people
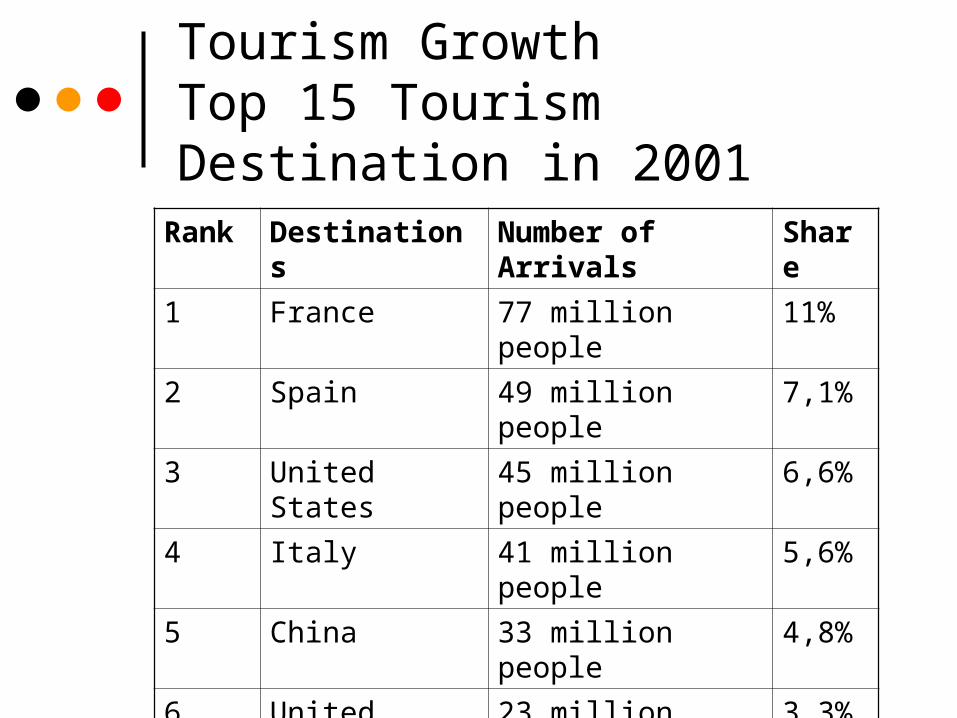
Tourism GrowthTop 15 Tourism Destination in 2001
Rank Destinations Number of Arrivals Share
1 France 77 million people 11%
2 Spain 49 million people 7,1%
3 United States 45 million people 6,6%
4 Italy 41 million people 5,6%
5 China 33 million people 4,8%
6 United Kingdom 23 million people 3,3%
7 Russan Fed. 22 million people 3%
8 Mexico 20 million people 2,9%
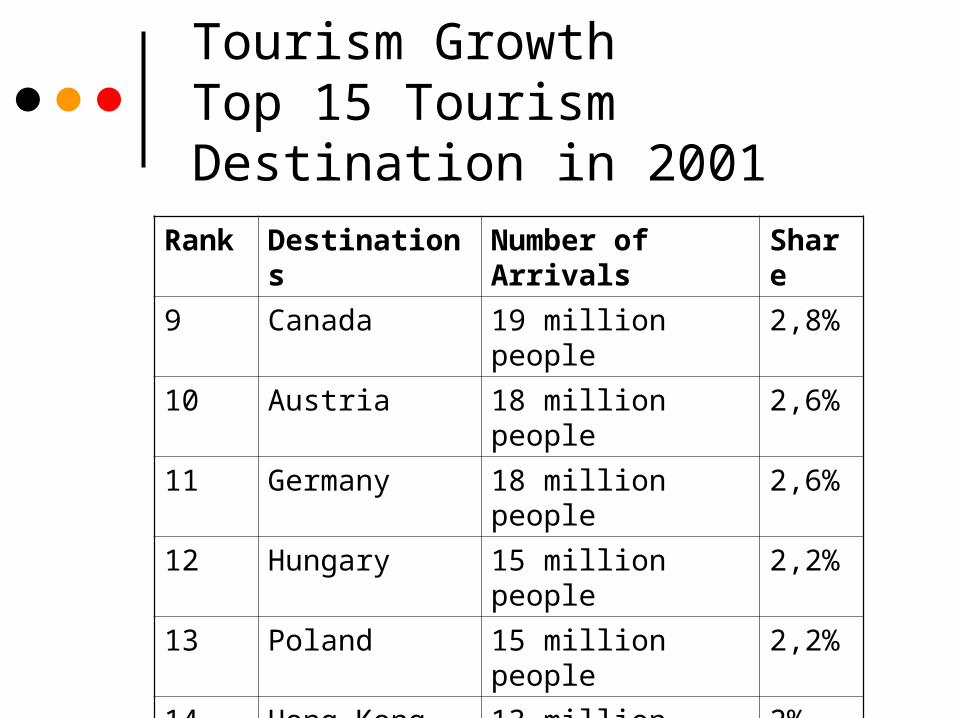
Tourism GrowthTop 15 Tourism Destination in 2001
Rank Destinations Number of Arrivals
Share
9 Canada 19 million people 2,8%
10 Austria 18 million people 2,6%
11 Germany 18 million people 2,6%
12 Hungary 15 million people 2,2%
13 Poland 15 million people 2,2%
14 Hong Kong 13 million people 2%
15 Greece 13 million people 2%
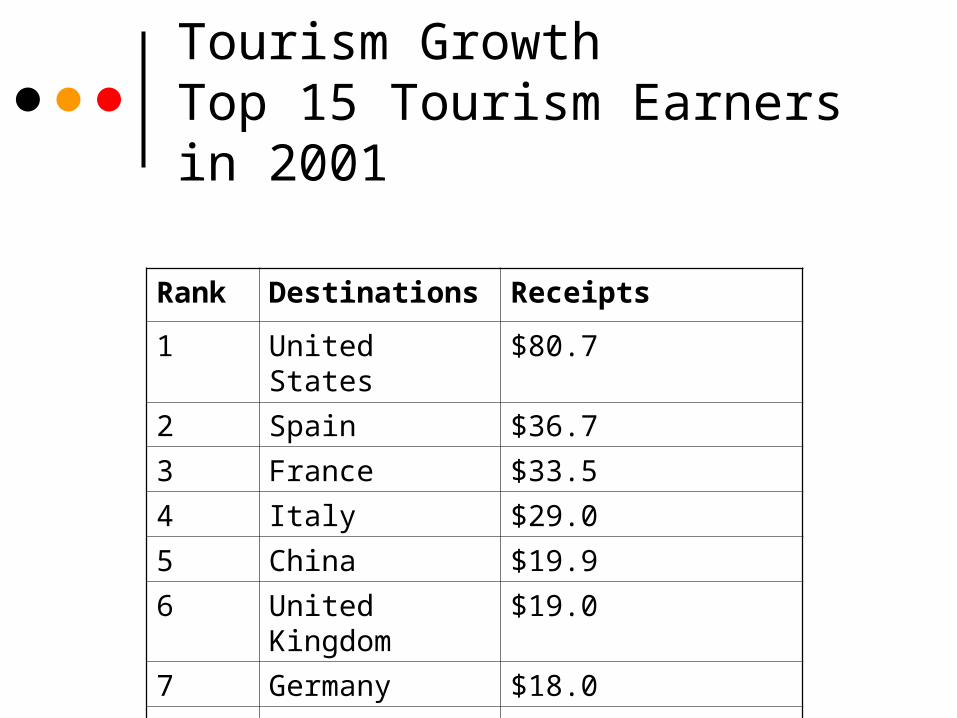
Tourism GrowthTop 15 Tourism Earners in 2001
Rank Destinations Receipts
1 United States $80.7
2 Spain $36.7
3 France $33.5
4 Italy $29.0
5 China $19.9
6 United Kingdom $19.0
7 Germany $18.0
8 Canada $19.9
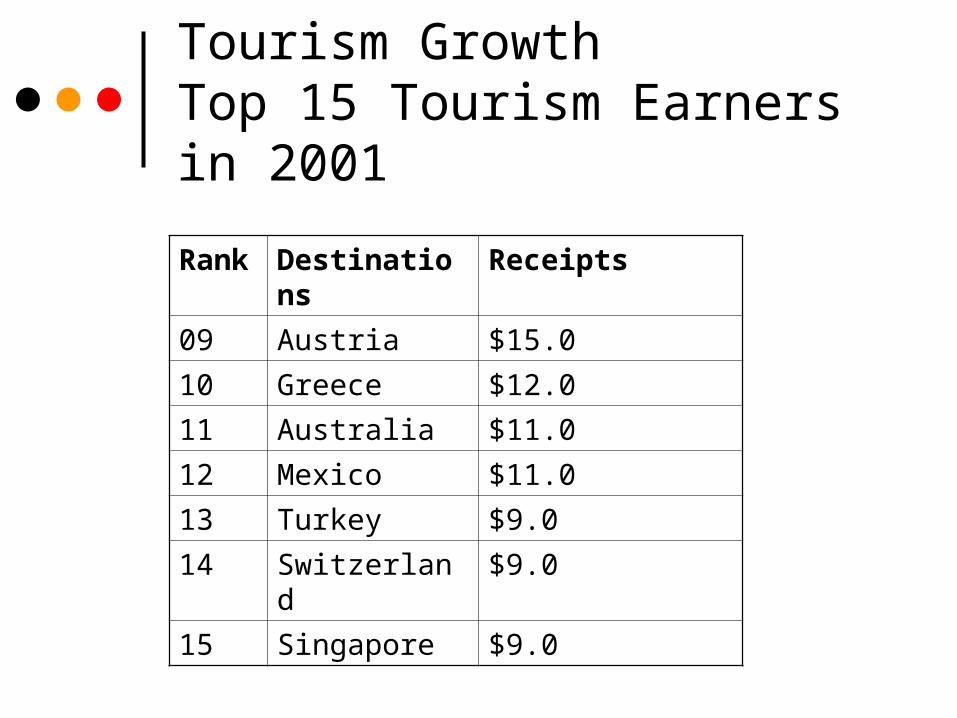
Tourism GrowthTop 15 Tourism Earners in 2001
Rank Destinations Receipts
09 Austria $15.0
10 Greece $12.0
11 Australia $11.0
12 Mexico $11.0
13 Turkey $9.0
14 Switzerland $9.0
15 Singapore $9.0
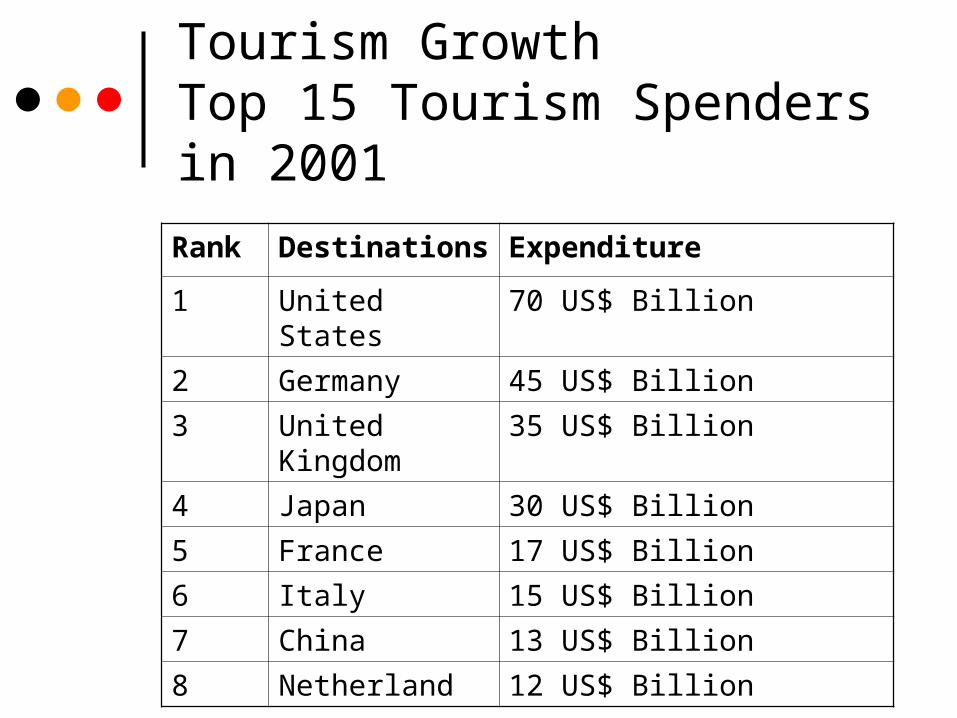
Tourism GrowthTop 15 Tourism Spenders in 2001
Rank Destinations Expenditure
1 United States 70 US$ Billion
2 Germany 45 US$ Billion
3 United Kingdom 35 US$ Billion
4 Japan 30 US$ Billion
5 France 17 US$ Billion
6 Italy 15 US$ Billion
7 China 13 US$ Billion
8 Netherland 12 US$ Billion

Tourism GrowthTop 15 Tourism Spenders in 2001
Rank Destinations Expenditure
09 Canada 12 US$ Billion
10 Belgium 10 US$ Billion
11 Austria 9 US$ Billion
12 Korea 7 US$ Billion
13 Sweeden 7 US$ Billion
14 Switzerland 7 US$ Billion
15 Taiwan 6 US$ Billion
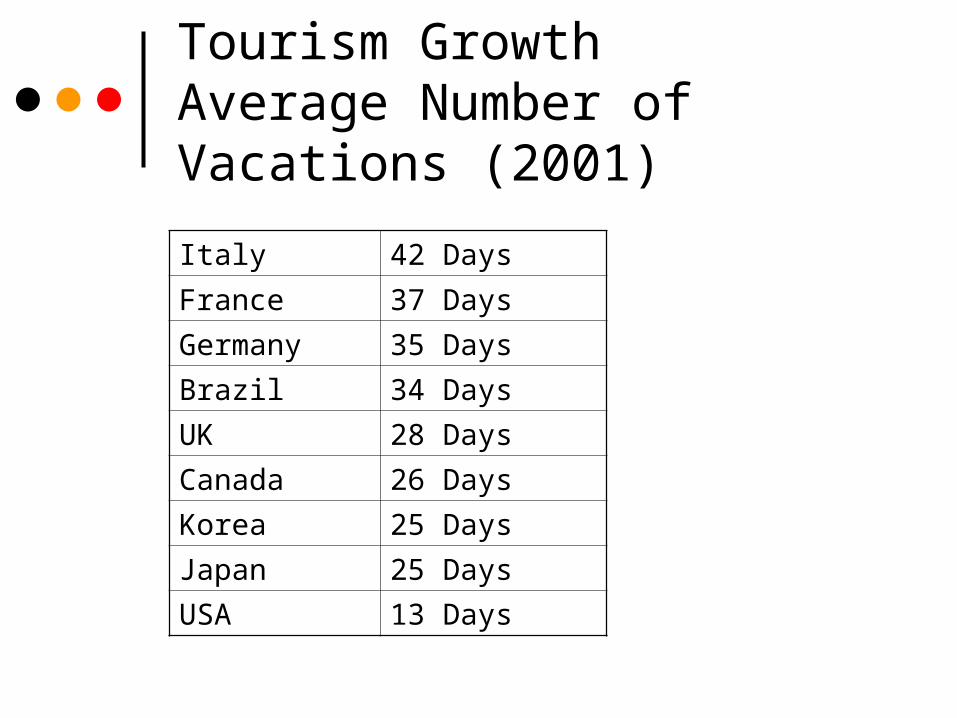
Tourism GrowthAverage Number of Vacations (2001)
Italy 42 Days
France 37 Days
Germany 35 Days
Brazil 34 Days
UK 28 Days
Canada 26 Days
Korea 25 Days
Japan 25 Days
USA 13 Days
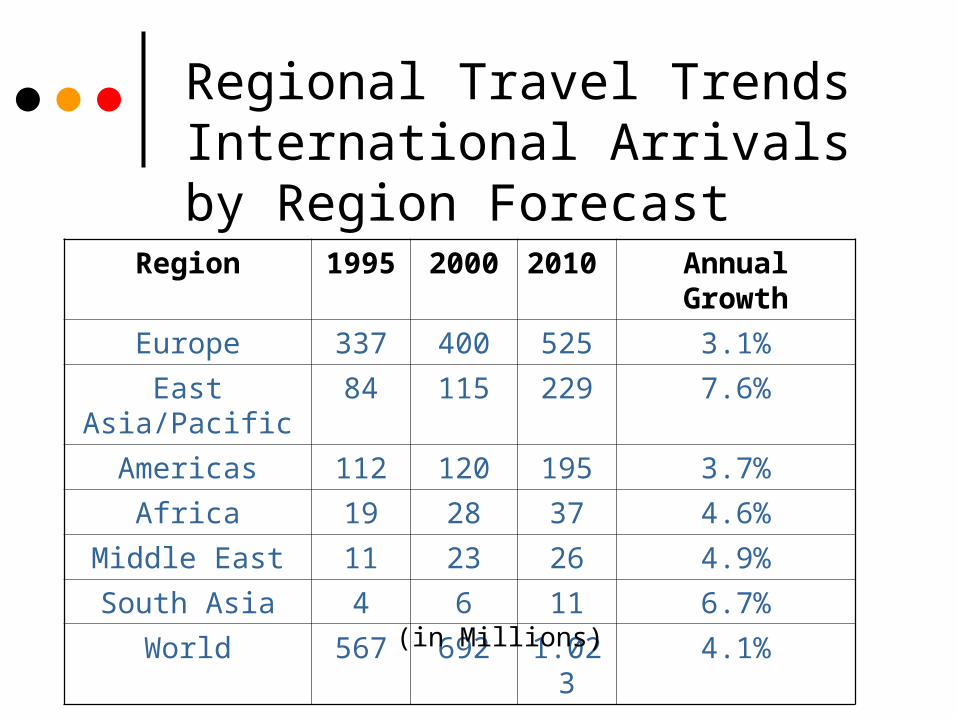
Regional Travel TrendsInternational Arrivals by Region Forecast
Region 1995 2000 2010 Annual Growth
Europe 337 400 525 3.1%
East Asia/Pacific 84 115 229 7.6%
Americas 112 120 195 3.7%
Africa 19 28 37 4.6%
Middle East 11 23 26 4.9%
South Asia 4 6 11 6.7%
World 567 692 1.023 4.1%
(in Millions)

As a region, Europe is the world’s number one destination.
In 1995, the region attracted two-thirds of all international tourist arrivals.
It is also the leader in intra-regional travel: it is estimated that 80% of the visitors to Europe are other Europeans.
Regional Travel TrendsEurope
Leading destinations are: France, Spain, Italy
However there is a decrease in the growth rates of foreign arrivals, attributed to saturation levels and poor exchange rates.
As a sub-region within Europe, the Eastern Mediterranean countries, such as Turkey and Israel and central European sub-region will be in increase of arrival growth rate.
Regional Travel TrendsEurope
The growth of travel in East Asia and the Pacific has been particularly rapid.
From a region with arrivals totaling fewer than 100.000 in 1950, 7.2 million in 1970, 88 million international arrivals in 1995.
The forecast shows East Asia and the Pacific moving ahead of the Americas, ranking second in 2010.
Regional Travel TrendsAsia and the Pacific

Top destinations include China, Hong Kong, Singapore.
Indonesia, Malaysia, Cambodia and Vietnam will continue to grow as well.
China has the potential to be a particularly rich source of outbound travelers, with its rapidly expanding economy.
Regional Travel TrendsAsia and the Pacific
South Asia region has made impressive development in recent years, starting at a smaller base.
The region is compromised of India, Sri Lanka, Maldives (based on its beach resorts), Nepal (which offers special interest tourism), İran,
Bangladesh.
Since 1993, the regional growth rate was three times higher than the world average.
Regional Travel TrendsSouth Asia
The USA and Canada, like western Europe have reached their peak, meaning that growth for outbound tourism will slow.
Intra-regional tourism dominates: In 1995, 75% of total arrivals were intra regional tourist flows.
Cuba & Mexico experienced the quickest growth rate of all the countries of the Americas.
Regional Travel TrendsAmericas

The Middle East was the fastest growing region for 1995.
Top destinations include Egypt and also Jordan, Bahrain and Lebanon.
Rapid growth was explained by a renewed interest in cultural tourism and an increase of political stability in the region.
Regional Travel TrendsMiddle East
Africa is a problematic tourist destination: political instability, military disturbances, health apprehension have discouraged travelers.
One exception: South Africa enjoyed growth in both leisure and travel business.
For the future, Africa needs improving political stability.
Regional Travel TrendsAfrica
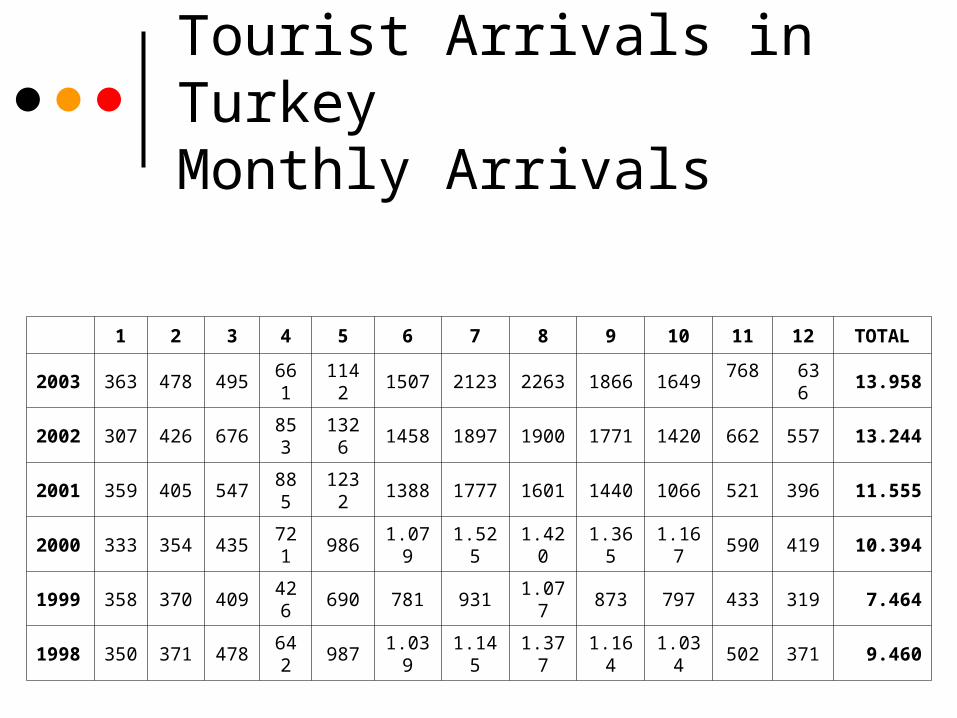
Tourist Arrivals in Turkey Monthly Arrivals
1 2 3 4 5 6 7 8 9 10 11 12 TOTAL
2003 363 478 495 661 1142 1507 2123 2263 1866 1649 768 636 13.958
2002 307 426 676 853 1326 1458 1897 1900 1771 1420 662 557 13.244
2001 359 405 547 885 1232 1388 1777 1601 1440 1066 521 396 11.555
2000 333 354 435 721 986 1.079 1.525 1.420 1.365 1.167 590 419 10.394
1999 358 370 409 426 690 781 931 1.077 873 797 433 319 7.464
1998 350 371 478 642 987 1.039 1.145 1.377 1.164 1.034 502 371 9.460
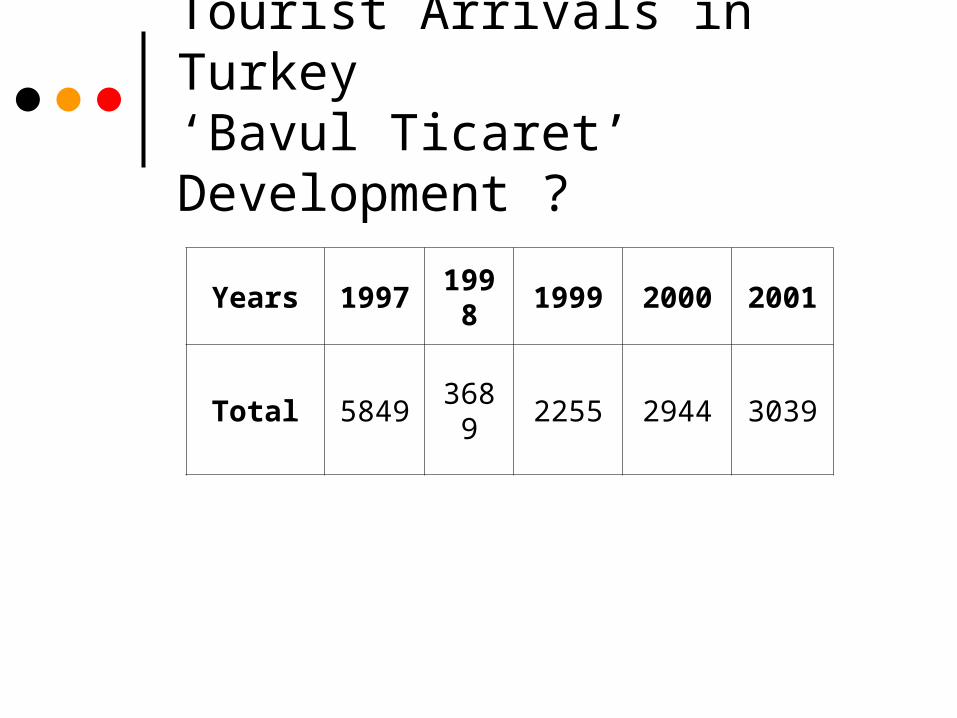
Tourist Arrivals in Turkey‘Bavul Ticaret’ Development ?
Years 1997 1998 1999 2000 2001
Total 5849 3689 2255 2944 3039

Tourist Arrivals in TurkeyWhere they come from ? (part 1)
2000 % 2001 % 2002 %
Germany 2.277.502 21,8 2.884.051 24,8 3.480.844 26,3
Russian Fed. 1.383.110 13,3 1.430.039 12,3 1.658.699 12,5
UK 915.285 8,8 845.536 7,3 1.040.228 7,9
Netherlands 440.290 4,2 632.975 5,5 871.560 6,6
Bulgaria 381.697 3,7 540.452 4,7 833.848 6,3
France 449.545 4,3 524.170 4,5 522.808 3,9
Iran 380.877 3,7 327.146 2,8 432.224 3,3
Austria 320.582 3,1 360.363 3,1 376.995 2,8
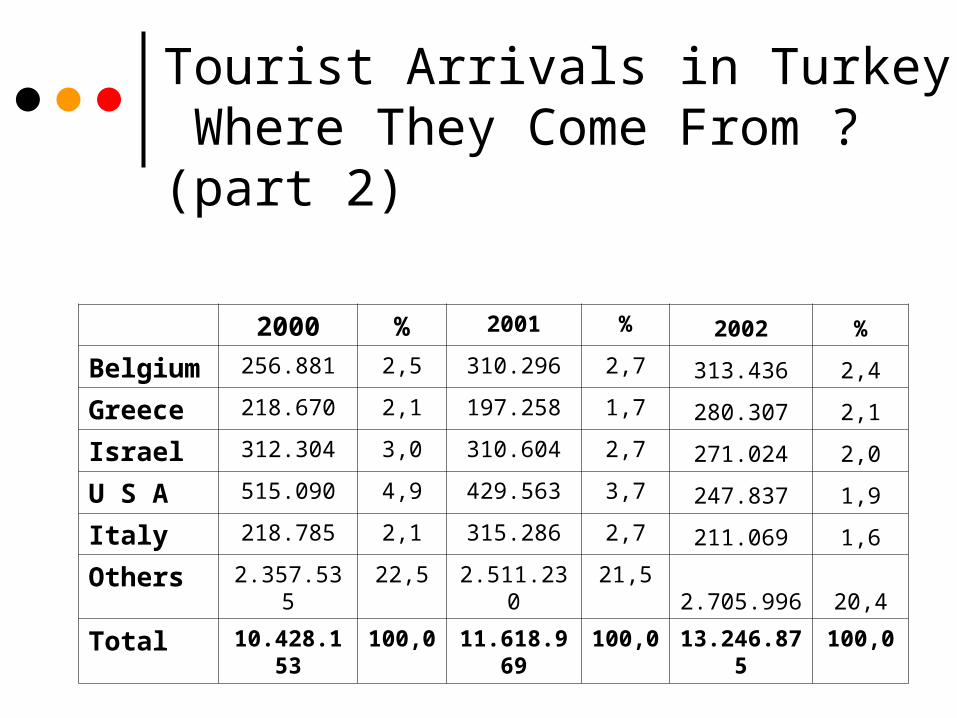
Tourist Arrivals in Turkey Where They Come From ? (part 2)
2000 % 2001 % 2002 %
Belgium 256.881 2,5 310.296 2,7 313.436 2,4
Greece 218.670 2,1 197.258 1,7 280.307 2,1
Israel 312.304 3,0 310.604 2,7 271.024 2,0
U S A 515.090 4,9 429.563 3,7 247.837 1,9
Italy 218.785 2,1 315.286 2,7 211.069 1,6
Others 2.357.535 22,5 2.511.230 21,5 2.705.996 20,4
Total 10.428.153 100,0 11.618.969 100,0 13.246.875 100,0
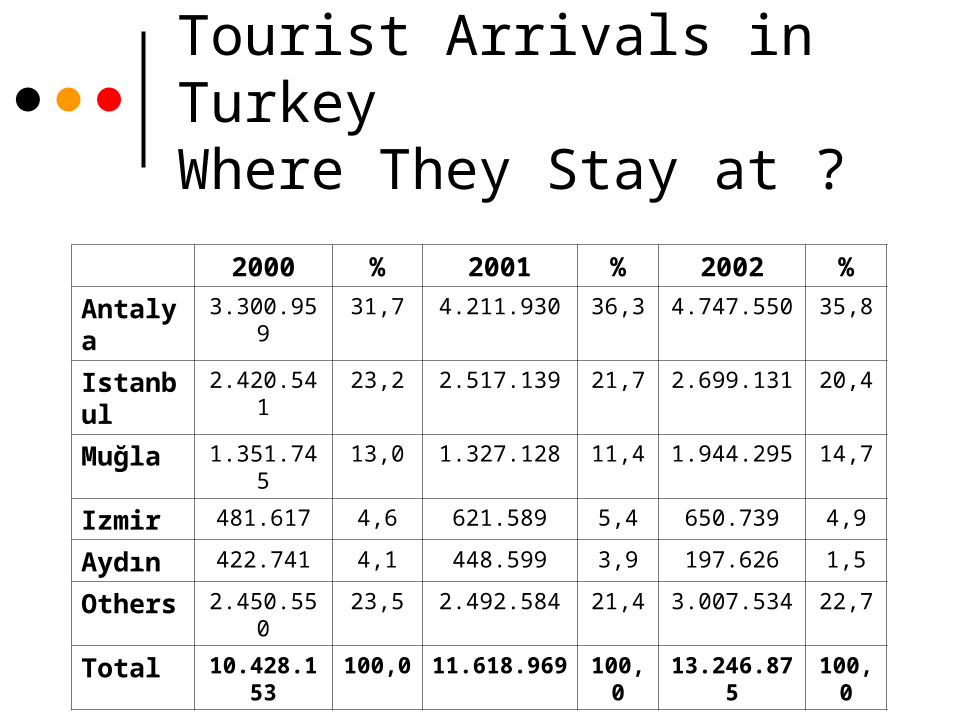
Tourist Arrivals in TurkeyWhere They Stay at ?
2000 % 2001 % 2002 %
Antalya 3.300.959 31,7 4.211.930 36,3 4.747.550 35,8
Istanbul 2.420.541 23,2 2.517.139 21,7 2.699.131 20,4
Muğla 1.351.745 13,0 1.327.128 11,4 1.944.295 14,7
Izmir 481.617 4,6 621.589 5,4 650.739 4,9
Aydın 422.741 4,1 448.599 3,9 197.626 1,5
Others 2.450.550 23,5 2.492.584 21,4 3.007.534 22,7
Total 10.428.153 100,0 11.618.969 100,0 13.246.875 100,0
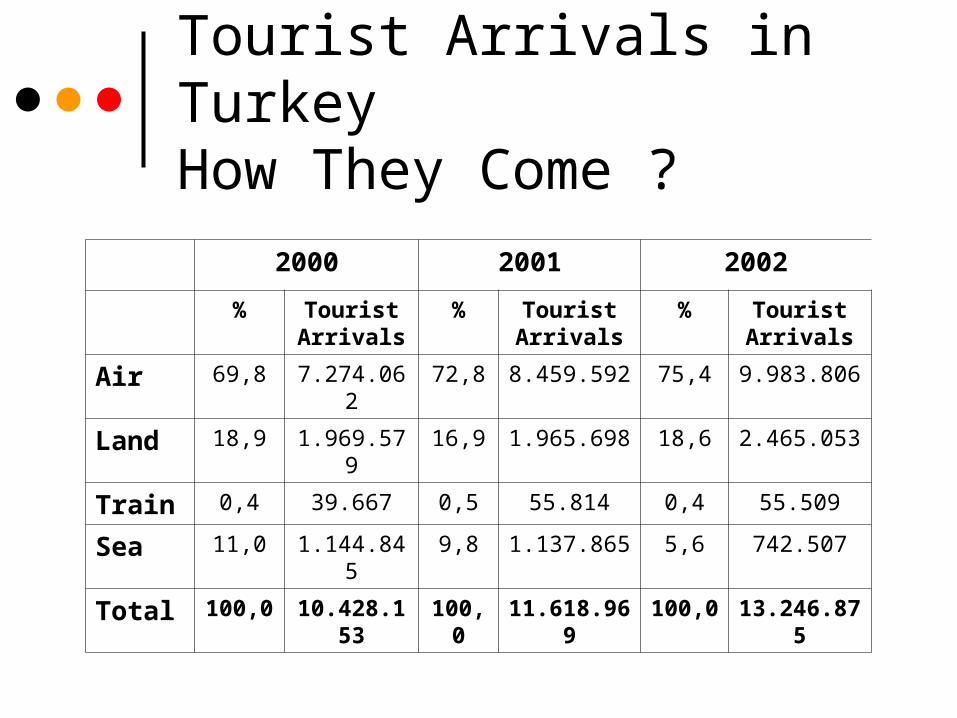
Tourist Arrivals in TurkeyHow They Come ?
2000 2001 2002
% Tourist Arrivals
% Tourist Arrivals
% Tourist Arrivals
Air 69,8 7.274.062 72,8 8.459.592 75,4 9.983.806
Land 18,9 1.969.579 16,9 1.965.698 18,6 2.465.053
Train 0,4 39.667 0,5 55.814 0,4 55.509
Sea 11,0 1.144.845 9,8 1.137.865 5,6 742.507
Total 100,0 10.428.153 100,0 11.618.969 100,0 13.246.875
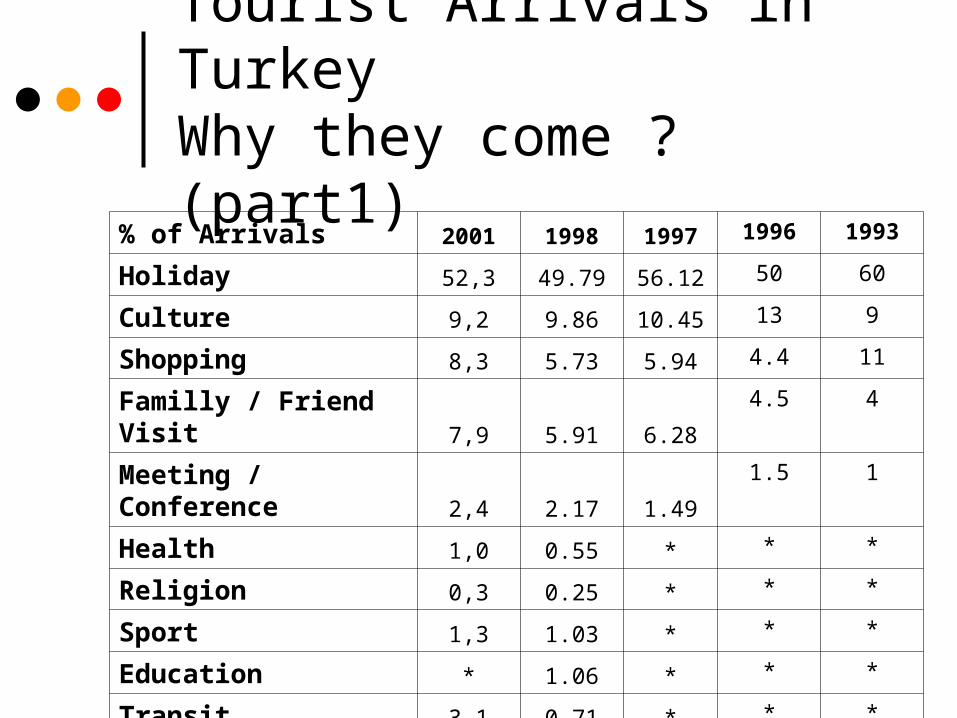
Tourist Arrivals in TurkeyWhy they come ? (part1)
% of Arrivals 2001 1998 1997 1996 1993
Holiday 52,3 49.79 56.12 50 60
Culture 9,2 9.86 10.45 13 9
Shopping 8,3 5.73 5.94 4.4 11
Familly / Friend Visit 7,9 5.91 6.28 4.5 4
Meeting / Conference 2,4 2.17 1.49 1.5 1
Health 1,0 0.55 * * *
Religion 0,3 0.25 * * *
Sport 1,3 1.03 * * *
Education * 1.06 * * *
Transit 3,1 0.71 * * *

Tourist Arrivals in TurkeyWhy they come ? (part2)
2001 1998 1997 1996 1993
Work * 8.90 5.51 10 6
Business * 6.10 6.7 4.8 3.5
Fairs 5,0 4.81 3.91 4.3 2

Tourist Arrivals in TurkeyWhat Motivates to Choose Turkey ?
Price % 25
Discover Turkish People % 20
General Interest for Turkey % 19
Cultural Events % 15
Cheap Shopping % 15
Job Opportunities % 6
Quality İtems % 3
Turkish Food % 2
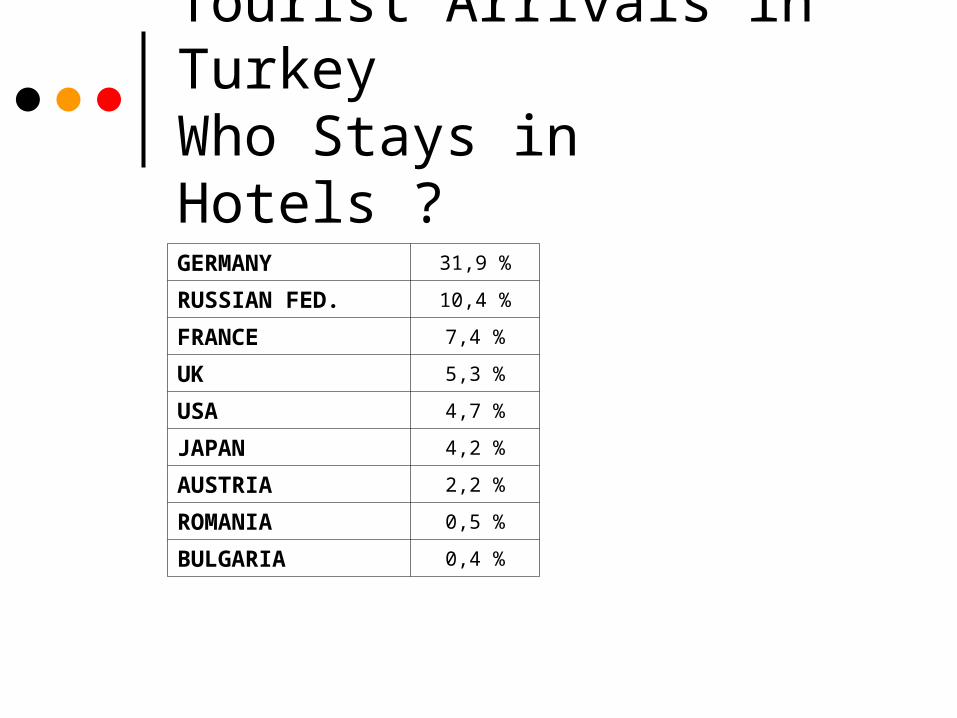
Tourist Arrivals in TurkeyWho Stays in Hotels ?
GERMANY 31,9 %
RUSSIAN FED. 10,4 %
FRANCE 7,4 %
UK 5,3 %
USA 4,7 %
JAPAN 4,2 %
AUSTRIA 2,2 %
ROMANIA 0,5 %
BULGARIA 0,4 %
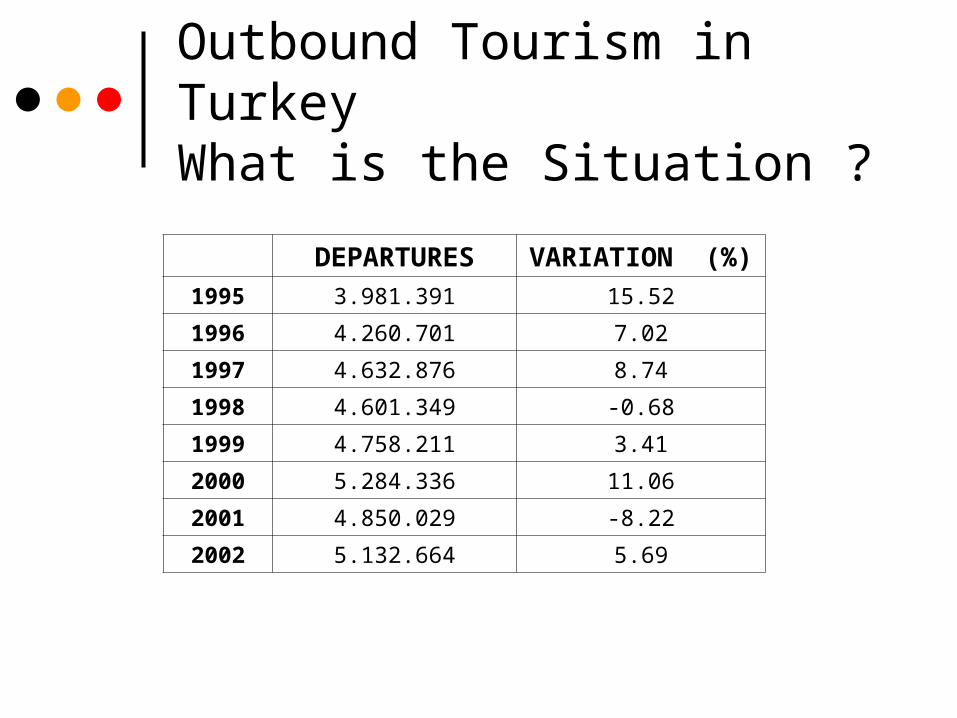
Outbound Tourism in TurkeyWhat is the Situation ?
DEPARTURES VARIATION (%)
1995 3.981.391 15.52
1996 4.260.701 7.02
1997 4.632.876 8.74
1998 4.601.349 -0.68
1999 4.758.211 3.41
2000 5.284.336 11.06
2001 4.850.029 -8.22
2002 5.132.664 5.69


![[enter] Designing a Restaurant Atmosphere Oğuz Benice Bilkent University School of Tourism & Hotel Management](https://img.pdfslide.us/doc/110x75/5518aca1550346c31f8b4d38/enter-designing-a-restaurant-atmosphere-oguz-benice-bilkent-university-school-of-tourism-hotel-management.jpg)