Embed Size (px)
Citation preview

1
Trash Receptacle Placement: Philadelphia Behavioral Science Research Protocol
August 2017 - May 2018
The Effect of Various Public Waste Receptacle Numbers on Litter and Staff Time
The goal of this project is to address the litter problem in Philadelphia by attempting to determine the number of public trash receptacles that optimizes trash disposal in receptacles as opposed to litter and illegal dumping. This experiment contributes to the debate as to whether increasing or decreasing the number of trash receptacles in an area reduces litter and decreases the amount of staff time spent on cleaning up litter and other waste.
PhiladelphiaCity of
2
The Cabinet will also use insights learned from this
experiment to plan for future placement or removal of receptacles in public spaces.
Executive SummaryFrom August 2017 to May 2018, the City’s GovLabPHL
team worked in partnership with the Zero Waste and
Litter Cabinet and researchers from local academic
institutions to test the effect of various public waste
receptacle quantities on the amount of litter and
the number of hours staff spend picking up trash.
Specifically, this experiment examined how increasing
or decreasing the number of public trash receptacles in
an area impacts trash collected from within remaining
receptacles, trash collected as litter, staff hours spent
picking up litter, and the litter index (a new metric for
measuring litter) for the area.
The study involved trash receptacles at four parks and
four commercial corridors. Each location was planned
to receive a manipulation that decreased their number
of trash receptacles, a manipulation that increased their
number of receptacles, and two non-treatment periods
that returned the study location to its original number of
trash receptacles. Baseline data were collected previous
to the first manipulation, and survey data, trash weight
measurements, and the litter index provided metrics to
evaluate the outcome. During the experimental period,
two commercial corridors were unable to complete
the experiment, and therefore data was unavailable or
incomplete for these locations.
The results showed that the effect of differing the
number of receptacles on trash was varied and
inconclusive. The study saw both decreases and
increases in the amount of trash collected in locations
where trash receptacles were increased and decreased.
The results did show that when trash receptacles
decreased, trash collected as litter increased and staff
time spent on collecting litter also increased. Data
on observed litter and via the litter index revealed
mixed results on whether or not increased number of
receptacles alters the amount of litter in an area.
The Zero Waste and Litter Cabinet intends to use the
outcomes of this study to make the economic and
operational justification based on litter reduction and
reduction in staff hours picking up litter to increase
the number of publicly accessible waste receptacles
across many assets such as commercial corridors, parks,
recreation centers and other highly trafficked streets.
The Cabinet will also use insights learned from this
experiment to plan for future placement or removal of
receptacles in public spaces. Lastly, these experiment
results will be used to encourage commercial
businesses to “adopt-a-receptacle” to decrease litter
around their businesses.

3
Background 4
Relevant Literature 5
Partner Organizations 6
Study Design 7
Project Timeline 10
Financial Considerations 11
Outcomes 11
Data Variables and Collection 11
Hypotheses 11
Analysis Plan 11
Results 12
Ethical Concerns 19
Recommendations 19
Follow-up 20
Acknowledgments 21
Appendix A: Waste Collection Tracking Slip 22
Table of Contents
4
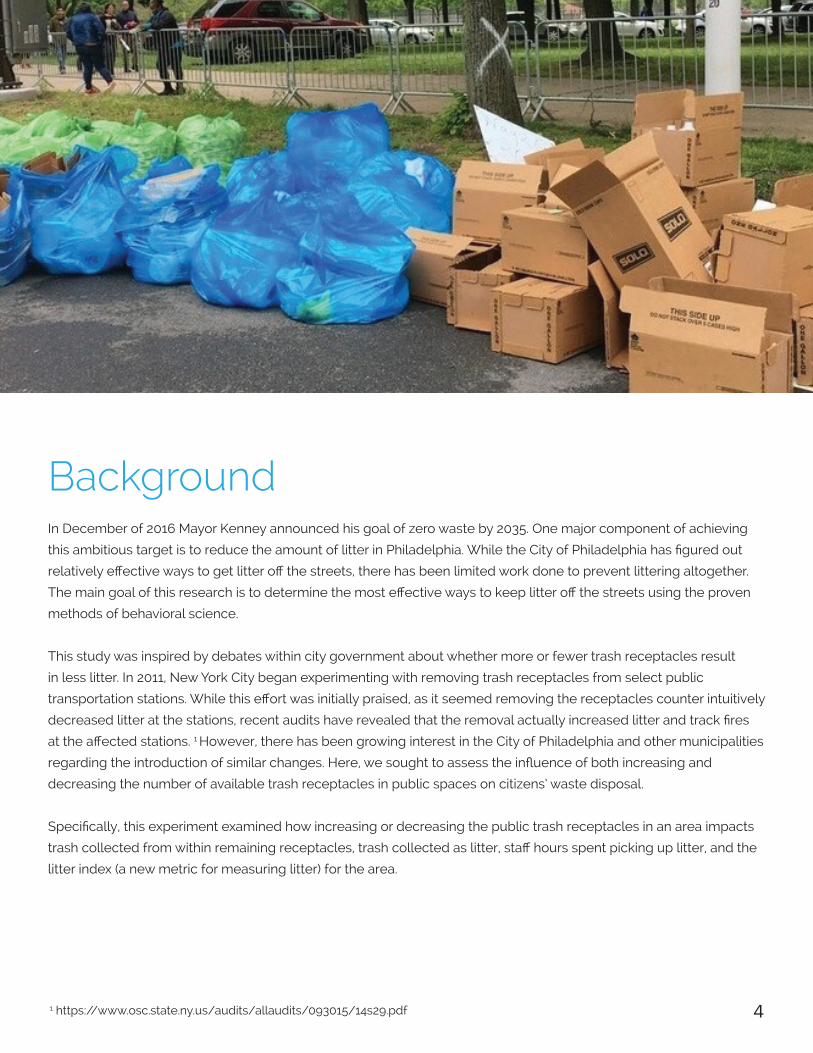
BackgroundIn December of 2016 Mayor Kenney announced his goal of zero waste by 2035. One major component of achieving
this ambitious target is to reduce the amount of litter in Philadelphia. While the City of Philadelphia has figured out
relatively effective ways to get litter off the streets, there has been limited work done to prevent littering altogether.
The main goal of this research is to determine the most effective ways to keep litter off the streets using the proven
methods of behavioral science.
This study was inspired by debates within city government about whether more or fewer trash receptacles result
in less litter. In 2011, New York City began experimenting with removing trash receptacles from select public
transportation stations. While this effort was initially praised, as it seemed removing the receptacles counter intuitively
decreased litter at the stations, recent audits have revealed that the removal actually increased litter and track fires
at the affected stations. 1 However, there has been growing interest in the City of Philadelphia and other municipalities
regarding the introduction of similar changes. Here, we sought to assess the influence of both increasing and
decreasing the number of available trash receptacles in public spaces on citizens’ waste disposal.
Specifically, this experiment examined how increasing or decreasing the public trash receptacles in an area impacts
trash collected from within remaining receptacles, trash collected as litter, staff hours spent picking up litter, and the
litter index (a new metric for measuring litter) for the area.
1 https://www.osc.state.ny.us/audits/allaudits/093015/14s29.pdf

5
Anderson, Siwan, and Patrick Francois (1997). Environmental cleanliness as a public good: welfare and policy implications of nonconvex preferences. Journal of Environmental Economics and Management, 34(3), 256-274.
Cialdini, R.B., Reno, R.R., & Kallgren, C.A. (1990). A focus theory of normative conduct: Recycling the concept of norms to reduce littering in public places. Journal of Personality and Social Psychology, 58, 1015-1026.
Finnie, W. C. (1973). Field experiments in litter control. Environment and Behavior, 5(2), 123-144.
Grasmick, Harold G., Robert J. Bursik, and Karyl A. Kinsey (1991). Shame and embarrassment as deterrents to noncompliance with the law the case of an anti-littering campaign. Environment and Behavior, 23(2), 233-251.
Huffman, Kim T., et al. (1995). Litter reduction a review and integration of the literature. Environment and Behavior, 27(2), 153-183.
Luyben, Paul D., and Jon S. Bailey (1979). Newspaper recycling: The effects of rewards and proximity of containers. Environment and behavior, 11(4), 539-557.
Reiter, Susan M., and William Samuel (1980). Littering as a function of prior litter and the presence or absence of prohibitive signs. Journal of Applied Social Psychology, 10(1), 45-55.
Robinson, S.N. (1976). Littering behavior in public places. Environment and Behavior, 8, 363-384.
Schultz, P.W., Bator, R.J., Large, L.B., Bruni, C.M., & Tabanico, J.J. (2013). Littering in context: Personal and environmental predictors of littering behavior. Environment and Behavior, 45, 35-59.
Sibley, C.G., & Liu, J.H. (2003). Differentiating active and passive littering: A two-stage process model of littering behavior in public spaces. Environment and
Behavior, 35, 415-433.
Relevant Literature
CollaboratorsCrystal ReeckTemple [email protected]
Dan HopkinsUniversity of [email protected]
Syon BhanotSwarthmore [email protected]
Nic EspositoManaging Director’s [email protected]
Anjali ChainaniMayor’s Policy [email protected]

6
City of Philadelphia Partners
Mayor’s Policy Office and GovLabPHL
Zero Waste and Litter Cabinet (departments involved from the cabinet listed below)
- Managing Director’s Office
- Mayor’s Office
- Department of Health
- Department of Commerce
- Streets and Sanitation Department
- Office of Sustainability
- Philly 311
Research Institutions
Temple University
University of Pennsylvania
Swarthmore College
Non-profit Organizations
Keep Philadelphia Beautiful
Fairmount CDC
Francisville Neighborhood Development Corporation
North Broad Renaissance
Partner OrganizationsThis project involved the cooperation and expertise of
multiple private and public partners.

7
Study Design
8
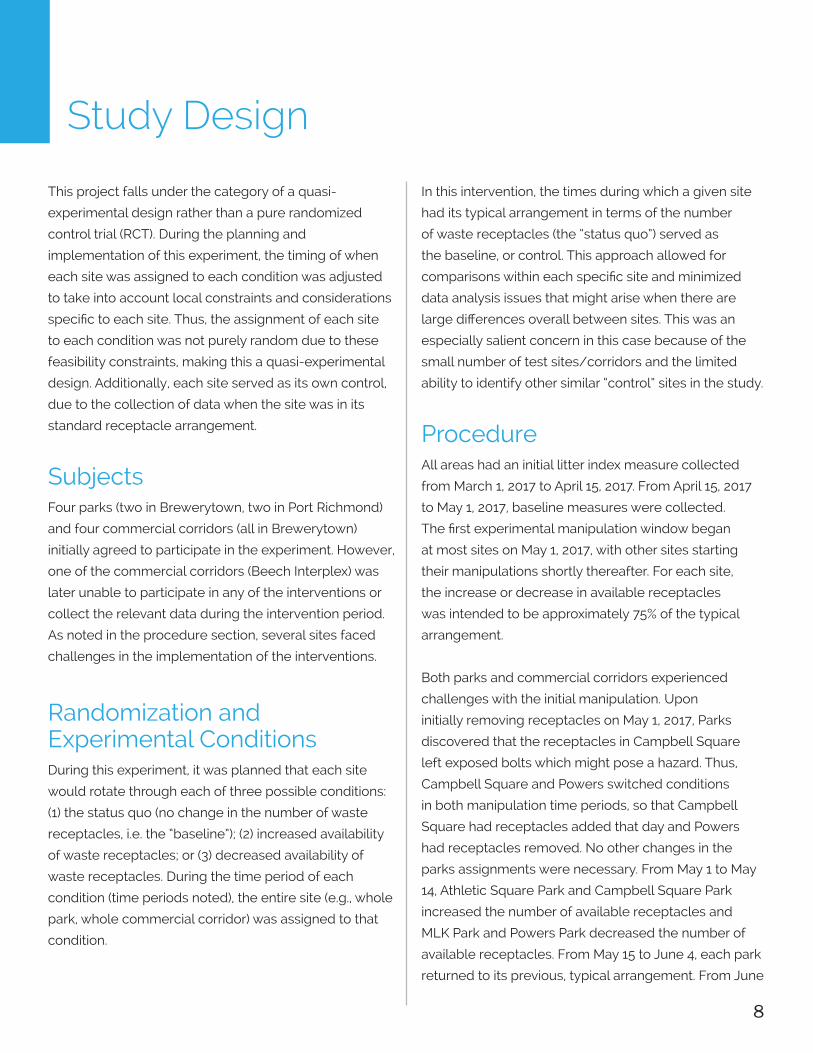
This project falls under the category of a quasi-
experimental design rather than a pure randomized
control trial (RCT). During the planning and
implementation of this experiment, the timing of when
each site was assigned to each condition was adjusted
to take into account local constraints and considerations
specific to each site. Thus, the assignment of each site
to each condition was not purely random due to these
feasibility constraints, making this a quasi-experimental
design. Additionally, each site served as its own control,
due to the collection of data when the site was in its
standard receptacle arrangement.
Subjects Four parks (two in Brewerytown, two in Port Richmond)
and four commercial corridors (all in Brewerytown)
initially agreed to participate in the experiment. However,
one of the commercial corridors (Beech Interplex) was
later unable to participate in any of the interventions or
collect the relevant data during the intervention period.
As noted in the procedure section, several sites faced
challenges in the implementation of the interventions.
Randomization and Experimental ConditionsDuring this experiment, it was planned that each site
would rotate through each of three possible conditions:
(1) the status quo (no change in the number of waste
receptacles, i.e. the “baseline”); (2) increased availability
of waste receptacles; or (3) decreased availability of
waste receptacles. During the time period of each
condition (time periods noted), the entire site (e.g., whole
park, whole commercial corridor) was assigned to that
condition.
Study Design
In this intervention, the times during which a given site
had its typical arrangement in terms of the number
of waste receptacles (the “status quo”) served as
the baseline, or control. This approach allowed for
comparisons within each specific site and minimized
data analysis issues that might arise when there are
large differences overall between sites. This was an
especially salient concern in this case because of the
small number of test sites/corridors and the limited
ability to identify other similar “control” sites in the study.
ProcedureAll areas had an initial litter index measure collected
from March 1, 2017 to April 15, 2017. From April 15, 2017
to May 1, 2017, baseline measures were collected.
The first experimental manipulation window began
at most sites on May 1, 2017, with other sites starting
their manipulations shortly thereafter. For each site,
the increase or decrease in available receptacles
was intended to be approximately 75% of the typical
arrangement.
Both parks and commercial corridors experienced
challenges with the initial manipulation. Upon
initially removing receptacles on May 1, 2017, Parks
discovered that the receptacles in Campbell Square
left exposed bolts which might pose a hazard. Thus,
Campbell Square and Powers switched conditions
in both manipulation time periods, so that Campbell
Square had receptacles added that day and Powers
had receptacles removed. No other changes in the
parks assignments were necessary. From May 1 to May
14, Athletic Square Park and Campbell Square Park
increased the number of available receptacles and
MLK Park and Powers Park decreased the number of
available receptacles. From May 15 to June 4, each park
returned to its previous, typical arrangement. From June
9
Study Design
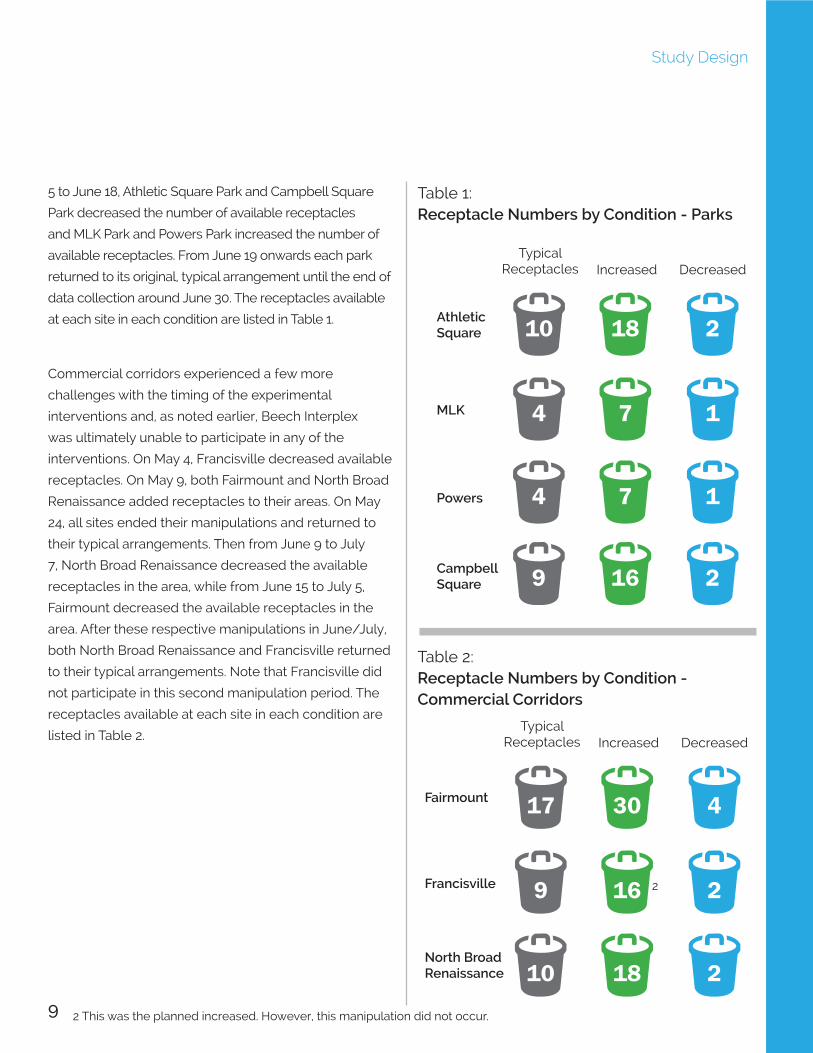
5 to June 18, Athletic Square Park and Campbell Square
Park decreased the number of available receptacles
and MLK Park and Powers Park increased the number of
available receptacles. From June 19 onwards each park
returned to its original, typical arrangement until the end of
data collection around June 30. The receptacles available
at each site in each condition are listed in Table 1.
Commercial corridors experienced a few more
challenges with the timing of the experimental
interventions and, as noted earlier, Beech Interplex
was ultimately unable to participate in any of the
interventions. On May 4, Francisville decreased available
receptacles. On May 9, both Fairmount and North Broad
Renaissance added receptacles to their areas. On May
24, all sites ended their manipulations and returned to
their typical arrangements. Then from June 9 to July
7, North Broad Renaissance decreased the available
receptacles in the area, while from June 15 to July 5,
Fairmount decreased the available receptacles in the
area. After these respective manipulations in June/July,
both North Broad Renaissance and Francisville returned
to their typical arrangements. Note that Francisville did
not participate in this second manipulation period. The
receptacles available at each site in each condition are
listed in Table 2.
Table 1: Receptacle Numbers by Condition - Parks
Table 2: Receptacle Numbers by Condition - Commercial Corridors
Typical Receptacles
Athletic Square 10
9
4
4
2
2
1
1
18
16
7
7
Campbell Square
MLK
Powers
Increased Decreased
Typical Receptacles
Fairmount 17
10
9
4
2
2
30
18
16Francisville
North Broad Renaissance
Increased Decreased
2 This was the planned increased. However, this manipulation did not occur.
2

10
Project Timeline
MAYAPRIL JUNE JULY
Baselines were measured for 7 sites
Increased the # of receptacles Decreased the # of receptacles
Manipulation 1May 1 - May 14ATHLETIC SQUARECAMPBELL SQUARE
Manipulation 2June 5 - June 18ATHLETIC SQUARECAMPBELL SQUARE
Manipulation 1May 9 - May 23FAIRMOUNTNORTH BROAD RENAISSANCE
Manipulation 2June 9 - July 7NORTH BROAD RENAISSANCE
Manipulation 2June 15 - July 5FAIRMOUNT
Manipulation 1May 1 - May 14MLK POWERS
Manipulation 1May 4 - May 23FRANCISVILLE
No ManipulationJune 19 - June 30 ATHLETIC SQUAREPOWERSCAMPBELL SQUARE
June 9 - June 30 MLK
No ManipulationMay 15 - June 4 ATHLETIC SQUAREMLKPOWERSCAMPBELL SQUARE
May 24 - June 14 FAIRMOUNT
May 24 - June 9 FRANCISVILLE
May 24 - June 8 NORTH BOARD RENAISSANCE
2017
Manipulation 2June 5 - June 18MLK POWERS
All areas had an initial litter index measure collected from March 1, 2017 to April 15, 2017. From April 15, 2017 to May 1,
2017, baseline measures were collected. The first experimental manipulation window began at most sites on May 1,
2017, with other sites starting their manipulations shortly thereafter.
11
Financial ConsiderationsThere were no significant added expenditures associated
with this project. If receptacles were added to areas,
these receptacles were supplied through existing Streets
Department stock. All receptacles were also removed
or added by existing staff, who were already assigned
to these waste receptacle duties. The City did pay for
incidental labor costs for servicing/emptying additional
trash receptacles during the trial period.
However, our intention was to use some of the data
from the experiment, such as time spent servicing a
greater or lesser number of receptacles as well as time
spent picking up more or less litter, to make the financial
argument for why policymakers should either increase
or decrease public waste receptacles in certain areas.
One major impediment to adding more public waste
receptacles is having adequate staff to ensure that
these receptacles are emptied properly. The goal of
these experiments was to give the Zero Waste and Litter
Cabinet the clearest possible data on the costs and
impact of adding or removing public waste receptacles.
OutcomesThe key outcomes were: trash collected from receptacles,
trash collected as litter, staff hours spent cleaning, number
of pieces of litter in area (estimate from city personnel), and
the litter index. Complaint data and subjective reports were
also available from residents and staff.
Data Variables and CollectionEach week, the staff at each site recorded the amount
of trash collected as litter, the amount of trash collected
from receptacles, and the number of staff hours spent
cleaning, using the forms provided (see appendix A).
These data were recorded for each day the staff were
on site. Approximately once a week, there was also a
litter index measure for each site. One member of the
Commerce Department completed this measure for the
commercial corridors, while the park staff completed
these measures for the park sites. For the commercial
corridors, the hope was to obtain data from Big Belly
trash cans (solar powered compacting trash cans)
to determine how much trash was in receptacles.
Ultimately, informal data about the number and tenor of
complaints was shared to index resident response.
Analysis PlanIn this experiment, each site serves as its own control
(i.e. when the site has the typical arrangement of
receptacles) and its own point of comparison for each
condition. Additionally, given the small number of
sites examined, formal statistical analyses were less
appropriate in this case. Instead, data were collected and
analyzed using more basic statistical methods, and also
were qualitatively examined and interpreted.
It was predicted that increasing the number of receptacles
would decrease litter, whereas decreasing the number of receptacles would increase litter.
Hypotheses
12
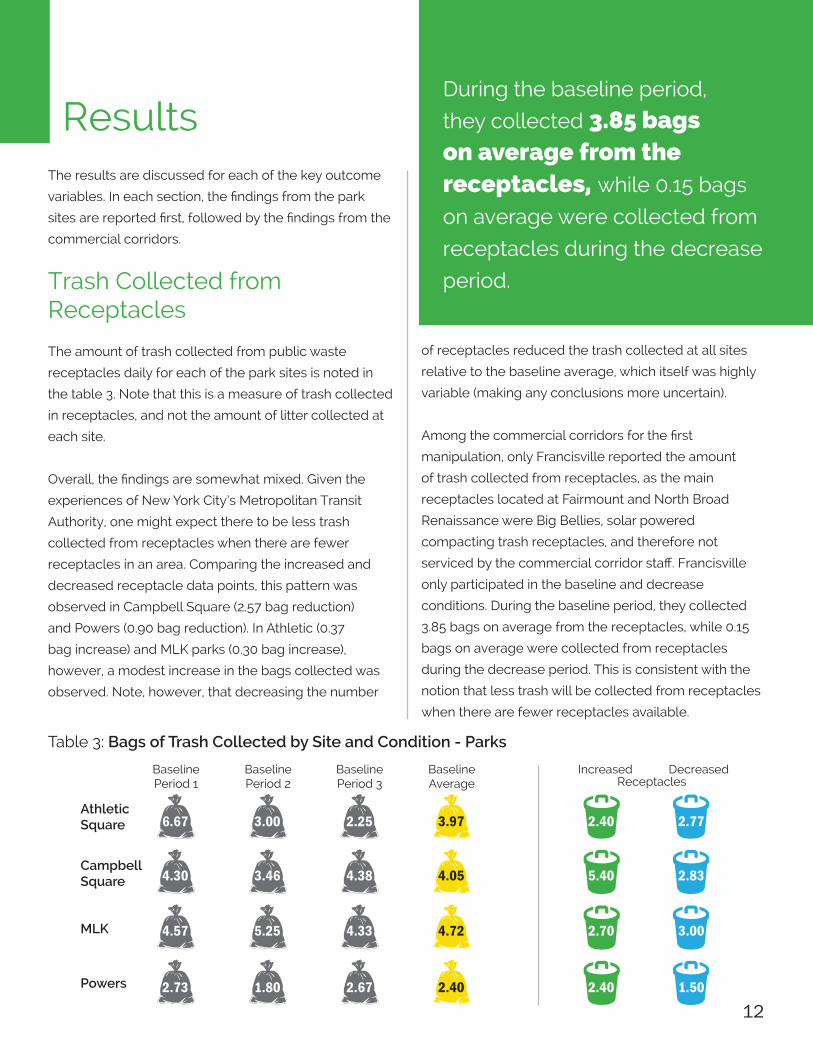
ResultsDuring the baseline period,
they collected 3.85 bags on average from the receptacles, while 0.15 bags
on average were collected from
receptacles during the decrease
period.
Table 3: Bags of Trash Collected by Site and Condition - Parks
of receptacles reduced the trash collected at all sites
relative to the baseline average, which itself was highly
variable (making any conclusions more uncertain).
Among the commercial corridors for the first
manipulation, only Francisville reported the amount
of trash collected from receptacles, as the main
receptacles located at Fairmount and North Broad
Renaissance were Big Bellies, solar powered
compacting trash receptacles, and therefore not
serviced by the commercial corridor staff. Francisville
only participated in the baseline and decrease
conditions. During the baseline period, they collected
3.85 bags on average from the receptacles, while 0.15
bags on average were collected from receptacles
during the decrease period. This is consistent with the
notion that less trash will be collected from receptacles
when there are fewer receptacles available.
The results are discussed for each of the key outcome
variables. In each section, the findings from the park
sites are reported first, followed by the findings from the
commercial corridors.
Trash Collected from Receptacles
The amount of trash collected from public waste
receptacles daily for each of the park sites is noted in
the table 3. Note that this is a measure of trash collected
in receptacles, and not the amount of litter collected at
each site.
Overall, the findings are somewhat mixed. Given the
experiences of New York City’s Metropolitan Transit
Authority, one might expect there to be less trash
collected from receptacles when there are fewer
receptacles in an area. Comparing the increased and
decreased receptacle data points, this pattern was
observed in Campbell Square (2.57 bag reduction)
and Powers (0.90 bag reduction). In Athletic (0.37
bag increase) and MLK parks (0.30 bag increase),
however, a modest increase in the bags collected was
observed. Note, however, that decreasing the number
BaselinePeriod 1
BaselinePeriod 2
BaselinePeriod 3
BaselineAverage
IncreasedReceptacles
Decreased
2.77
2.83
3.00
1.5030
Athletic Square
Campbell Square
MLK
Powers
2.40
5.40
2.70
2.40
3.97
4.05
4.72
2.40
2.25
4.38
4.33
2.67
3.00
3.46
5.25
1.80
6.67
4.30
4.57
2.73

13
Trash Collected as LitterBecause the overall amount of trash varied across
each site and each time period, we examined litter as
a percentage of the trash collected at each site. Higher
numbers indicated more trash was littered, whereas
lower numbers indicate more trash was properly
disposed. The percentage of trash that was collected as
litter daily for each of the park sites is noted in the table 4.
We expected more litter to be observed in the decrease
compared to the increase condition. This pattern was
observed at both Campbell Square (7.5% increase
in litter) and Powers (13.1% increase in litter). The
percentage of trash collected as litter was somewhat
stable at Athletic (0.9% decrease in litter), while there
was an observed decrease in litter at MLK (6.51%
decrease in litter). Averaging across all sites, decreasing
the number of available receptacles increased the
percentage of trash collected as litter daily by 2.9%
each (compared to increasing the number of available
receptacles).
Among the commercial corridors, a clearer pattern
regarding litter emerged. Although Francisville only
collected data during the baseline and decrease
periods, the percentage of trash that was collected as
litter versus from a receptacle increased dramatically
when there were fewer available receptacles, to 95.84%
from 39.37%. Fairmount did not have data available for
the amount of trash collected from receptacles, since
they did not service the receptacles. The overall number
of bags of trash collected as litter increased slightly
when the number of receptacles was decreased (5.38
bags) compared to when it was increased (5.33 bags).
Although representing a change of .05 bags, noise from
the data and the limited sample size makes the change
vulnerable to fluctuation.
The percentage of trash that was collected as litter versus from a
receptacle increased dramatically when there were fewer available receptacles
Table 4: Litter as a Percentage of Total Trash by Site and Condition - Parks
Results
BaselinePeriod 1
BaselinePeriod 2
BaselinePeriod 3
BaselineAverage
IncreasedReceptacles
Decreased
Athletic Square
Campbell Square
MLK
Powers
36.84%
21.10%
33.38%
29.46%
44.24%
49.42%
40.00%
35.71%
40.00%
46.15%
37.16%
29.37%
48.94%
42.55%
43.75%
29.41%
48.03%
50.00%
37.24%
42.53%
39.46%
40.56%
37.11%
31.10%
14
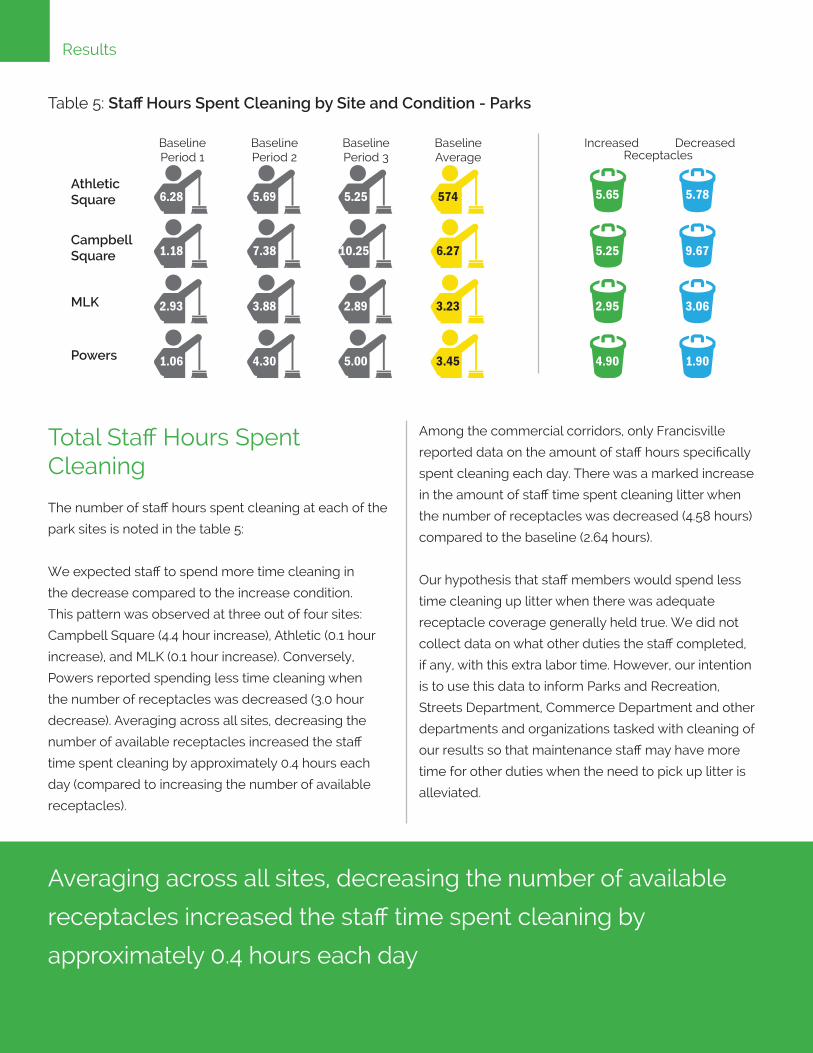
Total Staff Hours Spent Cleaning
The number of staff hours spent cleaning at each of the
park sites is noted in the table 5:
We expected staff to spend more time cleaning in
the decrease compared to the increase condition.
This pattern was observed at three out of four sites:
Campbell Square (4.4 hour increase), Athletic (0.1 hour
increase), and MLK (0.1 hour increase). Conversely,
Powers reported spending less time cleaning when
the number of receptacles was decreased (3.0 hour
decrease). Averaging across all sites, decreasing the
number of available receptacles increased the staff
time spent cleaning by approximately 0.4 hours each
day (compared to increasing the number of available
receptacles).
Among the commercial corridors, only Francisville
reported data on the amount of staff hours specifically
spent cleaning each day. There was a marked increase
in the amount of staff time spent cleaning litter when
the number of receptacles was decreased (4.58 hours)
compared to the baseline (2.64 hours).
Our hypothesis that staff members would spend less
time cleaning up litter when there was adequate
receptacle coverage generally held true. We did not
collect data on what other duties the staff completed,
if any, with this extra labor time. However, our intention
is to use this data to inform Parks and Recreation,
Streets Department, Commerce Department and other
departments and organizations tasked with cleaning of
our results so that maintenance staff may have more
time for other duties when the need to pick up litter is
alleviated.
Table 5: Staff Hours Spent Cleaning by Site and Condition - Parks
Averaging across all sites, decreasing the number of available
receptacles increased the staff time spent cleaning by
approximately 0.4 hours each day
Results
BaselinePeriod 1
BaselinePeriod 2
BaselinePeriod 3
BaselineAverage
IncreasedReceptacles
Decreased
Athletic Square
Campbell Square
MLK
Powers
6.28
1.18
2.93
1.06
5.69
7.38
3.88
4.30
5.25
10.25
2.89
5.00
5.65
5.25
2.95
4.90
5.78
9.67
3.06
1.90
574
6.27
3.23
3.45
15
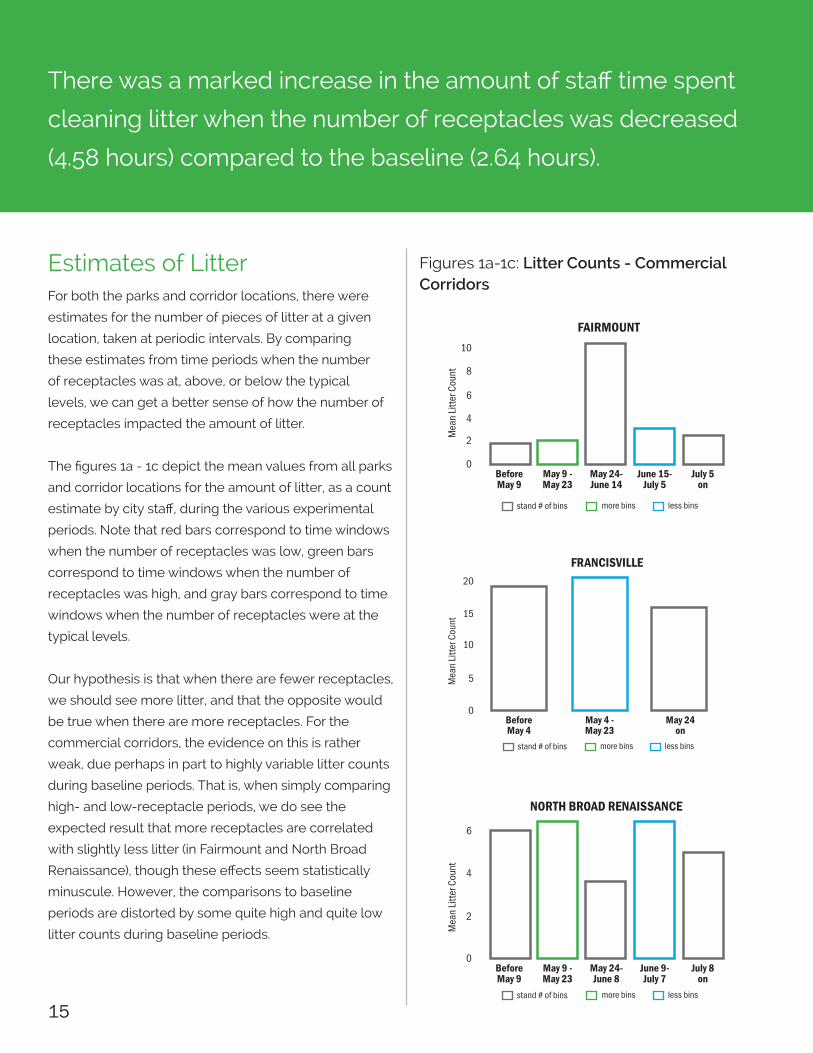
Estimates of LitterFor both the parks and corridor locations, there were
estimates for the number of pieces of litter at a given
location, taken at periodic intervals. By comparing
these estimates from time periods when the number
of receptacles was at, above, or below the typical
levels, we can get a better sense of how the number of
receptacles impacted the amount of litter.
The figures 1a - 1c depict the mean values from all parks
and corridor locations for the amount of litter, as a count
estimate by city staff, during the various experimental
periods. Note that red bars correspond to time windows
when the number of receptacles was low, green bars
correspond to time windows when the number of
receptacles was high, and gray bars correspond to time
windows when the number of receptacles were at the
typical levels.
Our hypothesis is that when there are fewer receptacles,
we should see more litter, and that the opposite would
be true when there are more receptacles. For the
commercial corridors, the evidence on this is rather
weak, due perhaps in part to highly variable litter counts
during baseline periods. That is, when simply comparing
high- and low-receptacle periods, we do see the
expected result that more receptacles are correlated
with slightly less litter (in Fairmount and North Broad
Renaissance), though these effects seem statistically
minuscule. However, the comparisons to baseline
periods are distorted by some quite high and quite low
litter counts during baseline periods.
Figures 1a-1c: Litter Counts - Commercial Corridors
There was a marked increase in the amount of staff time spent
cleaning litter when the number of receptacles was decreased
(4.58 hours) compared to the baseline (2.64 hours).
Before May 9
stand # of bins more bins less bins
May 9 - May 23
May 24-June 14
FAIRMOUNT
June 15-July 5
July 5 on
10
8
6
4
2
0
Before May 4
stand # of bins more bins less bins
May 4 - May 23
May 24 on
FRANCISVILLE20
5
10
15
0
Before May 9
stand # of bins more bins less bins
May 9 - May 23
May 24-June 8
NORTH BROAD RENAISSANCE
June 9-July 7
July 8 on
6
2
4
0

16
Figures 2a-2d: Litter Counts - Parks
Figures 3a-3c: Litter Index - Commercial Corridors
Meanwhile, for the park locations, the hypothesized
pattern played out for low-receptacle-number periods
in three of the four sites, namely Athletic, Campbell,
and MLK, where much more litter was observed when
there were fewer receptacles. However, the results for
high-receptacle-number periods relative to the baseline
turned up more mixed findings; that is, more receptacles
do not seem to be clearly associated with less litter than
the typical “baseline” number of receptacles.
Before May 1
stand # of bins more bins less bins
May 1 - May 14
May 15-June 4
ATHLETIC SQUARE
June 5-June 18
June 19 on
500
400
300
200
100
0
Before May 1
stand # of bins more bins less bins
May 1 - May 14
May 15-June 4
CAMPBELL SQUARE
June 5-June 18
June 19 on
100
80
60
40
20
0
Before May 1
stand # of bins more bins less bins
May 1 - May 14
May 15-June 4
MLK
June 5-June 18
June 19 on
250
200
150
100
50
0
Before May 1
stand # of bins more bins less bins
May 1 - May 14
May 15-June 4
POWERS
June 5-June 18
June 19 on
25
20
15
10
5
0
Before May 9
stand # of bins more bins less bins
May 9 - May 23
May 24-June 14
FAIRMOUNT
June 15-July 5
July 6 on
1.5
1
.5
0
Before May 4
stand # of bins more bins less bins
May 4 - May 23
May 24 on
FRANCISVILLE
0
1.5
1
.5
Before May 9
stand # of bins more bins less bins
May 9 - May 23
May 24-June 8
NORTH BROAD RENAISSANCE
June 9-July 7
July 8 on
1.5
1
.5
0
Results
17
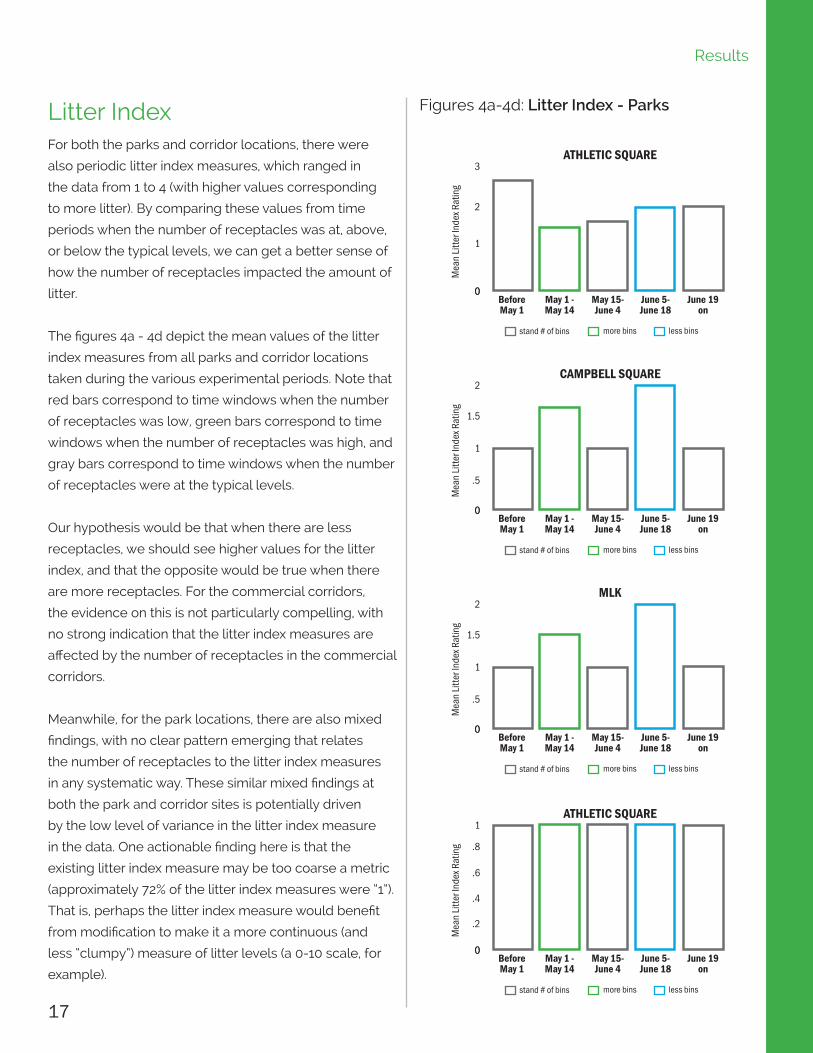
Figures 4a-4d: Litter Index - ParksLitter IndexFor both the parks and corridor locations, there were
also periodic litter index measures, which ranged in
the data from 1 to 4 (with higher values corresponding
to more litter). By comparing these values from time
periods when the number of receptacles was at, above,
or below the typical levels, we can get a better sense of
how the number of receptacles impacted the amount of
litter.
The figures 4a - 4d depict the mean values of the litter
index measures from all parks and corridor locations
taken during the various experimental periods. Note that
red bars correspond to time windows when the number
of receptacles was low, green bars correspond to time
windows when the number of receptacles was high, and
gray bars correspond to time windows when the number
of receptacles were at the typical levels.
Our hypothesis would be that when there are less
receptacles, we should see higher values for the litter
index, and that the opposite would be true when there
are more receptacles. For the commercial corridors,
the evidence on this is not particularly compelling, with
no strong indication that the litter index measures are
affected by the number of receptacles in the commercial
corridors.
Meanwhile, for the park locations, there are also mixed
findings, with no clear pattern emerging that relates
the number of receptacles to the litter index measures
in any systematic way. These similar mixed findings at
both the park and corridor sites is potentially driven
by the low level of variance in the litter index measure
in the data. One actionable finding here is that the
existing litter index measure may be too coarse a metric
(approximately 72% of the litter index measures were “1”).
That is, perhaps the litter index measure would benefit
from modification to make it a more continuous (and
less “clumpy”) measure of litter levels (a 0-10 scale, for
example).
Before May 1
stand # of bins more bins less bins
May 1 - May 14
May 15-June 4
ATHLETIC SQUARE
June 5-June 18
June 19 on
1
0
3
2
0
Before May 1
stand # of bins more bins less bins
May 1 - May 14
May 15-June 4
CAMPBELL SQUARE
June 5-June 18
June 19 on
0
1
0
2
1.5
.5
Before May 1
stand # of bins more bins less bins
May 1 - May 14
May 15-June 4
MLK
June 5-June 18
June 19 on
00
1
2
1.5
.5
Before May 1
stand # of bins more bins less bins
May 1 - May 14
May 15-June 4
ATHLETIC SQUARE
June 5-June 18
June 19 on
00
1
.8
.6
.4
.2
Results
18
Complaints and Other Subjective Outcomes
The Cabinet worked with Parks and Recreation and Streets Department public relations staff to track comments on
both social media and those sent directly to the department. Although there was not a large volume of complaints,
the few that were received were quite passionate in nature. All comments came when receptacles were taken away.
Some examples include:
• A resident of Campbell Square used very obscene language in a social media post that called into question the
competency of City government for taking receptacles away.
• Some business owners in Powers Park reported dog owners putting dog waste in a USPS mailbox to protest the
removal of receptacles.
• The Streets Department received irate social media messages that questioned why the Big Bellies were still
wrapped.
On the converse, Campbell Square maintenance employees received many thanks from the neighbors when
more receptacles were added. This subjective feedback followed the previously observed trend that residents in
Philadelphia want more trash receptacles in their public spaces and exhibited frustrations when these receptacles
are removed.
Results
19
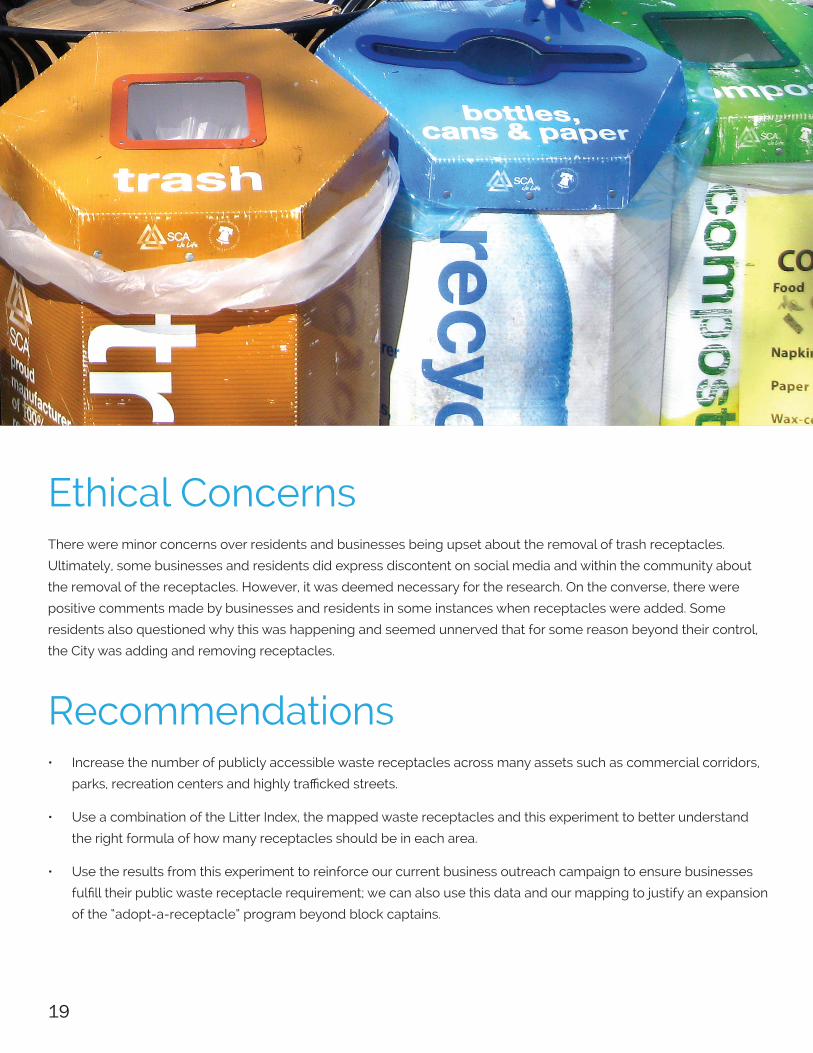
Ethical ConcernsThere were minor concerns over residents and businesses being upset about the removal of trash receptacles.
Ultimately, some businesses and residents did express discontent on social media and within the community about
the removal of the receptacles. However, it was deemed necessary for the research. On the converse, there were
positive comments made by businesses and residents in some instances when receptacles were added. Some
residents also questioned why this was happening and seemed unnerved that for some reason beyond their control,
the City was adding and removing receptacles.
Recommendations• Increase the number of publicly accessible waste receptacles across many assets such as commercial corridors,
parks, recreation centers and highly trafficked streets.
• Use a combination of the Litter Index, the mapped waste receptacles and this experiment to better understand
the right formula of how many receptacles should be in each area.
• Use the results from this experiment to reinforce our current business outreach campaign to ensure businesses
fulfill their public waste receptacle requirement; we can also use this data and our mapping to justify an expansion
of the “adopt-a-receptacle” program beyond block captains.

20
Follow-UpA major impetus for conducting this experiment was an
operational debate that occurs in many City operating
departments that deal with trash between the adding
and removing of public waste receptacles. Some
operations staff err on the side of public opinion that
Philadelphia needs more public waste receptacles,
while others disagree and feel that removing
receptacles will prevent household trash dumping and
force people to either hold onto their trash or waste
less. The Zero Waste and Litter Cabinet and other City
operating departments intend to use the outcomes
from this experiment to craft policy and regulation in the
following three areas:
1. We intend to use the data from the experiment to
make the economic and operational justification
based on litter reduction and reduction in staff hours
picking up litter to increase the number of publicly
accessible waste receptacles across many assets
such as commercial corridors, parks, recreation
centers and other highly trafficked streets.
2. The Office of Innovation Technology, which
is responsible for the Litter Index, is currently
mapping all public waste receptacles in the
City of Philadelphia. Although our overall goal
is to increase receptacles, in some areas where
there is an abundance of receptacles, we may
need to decrease to the right number for proper
maintenance of all receptacles. The Zero Waste
and Litter Cabinet will use a combination of the
Litter Index, the mapped waste receptacles and this
experiment to better understand the right formula of
how many receptacles should be in each area.
3. There are certain businesses, such as those that
sell prepared or packaged food, that are required
to have public waste receptacles in front of their
businesses. We also have a program for block
captains to “adopt-a-receptacle”, which allows block
captains to legally place public waste receptacles
on the street. The Zero Waste and Litter Cabinet will
use the results from this experiment to reinforce
our current business outreach campaign to ensure
businesses fulfill their public waste receptacle
requirement. We can also use this data and our
mapping to justify an expansion of the “adopt-a-
receptacle” program beyond block captains.
21
AcknowledgmentsThe project team would like to thank Yuan Huang and Nandi O’Connor
from the Mayor’s Policy Office; Susan Buck, Ed Kreeger, Warren
Gillis, and the Parks and Recreation Staff of Districts 2 and 6 for their
data collection and support; research assistants Tiger Brown, Justin
Innacone, and Yevgeniy Olkhov; and 2018 summer policy fellows
Mehra den Braven and Henry Feinstein for their editorial contributions.
Without them, none of this would be possible.
22
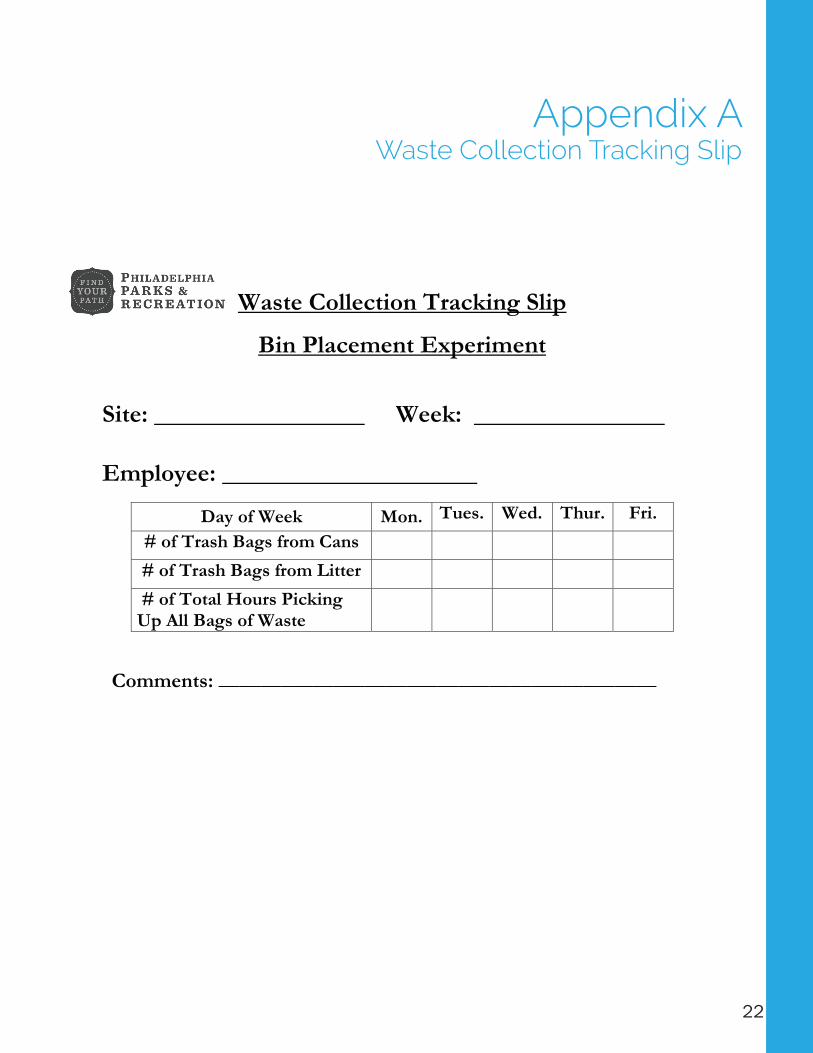
Appendix AWaste Collection Tracking Slip
Waste Collection Tracking Slip
Bin Placement Experiment
Site: Week:
Employee:
Day of Week Mon. Tues. Wed. Thur. Fri. # of Trash Bags from Cans
# of Trash Bags from Litter # of Total Hours Picking Up All Bags of Waste
Comments: __________________________________________

![JOHANSSON WING DRAWING INDEX LIGHTING SCHEDULE … browser/addendum_2... · special purpose power receptacle [+ 18''] double duplex receptacle [above counter] duplex receptacle [above](https://img.pdfslide.us/doc/110x75/6038ccb23acbd8464b522a89/johansson-wing-drawing-index-lighting-schedule-browseraddendum2-special-purpose.jpg)