Embed Size (px)
Citation preview
TRASH AND DEBRIS IN THE WEST RIVERNRCA Student: Jahlyn Lowndes1; Community Partner: Kendall Barbery2
1Sound School; 2Save the SoundABSTRACTIn the West River Watershed, trash and debris is a growing issue. The West River is impaired for recreation and aquatic life due to bacteria from stormwater runoff and other sources. In 2015, Save the Sound (my community partner) and the West River Watershed Coalition completed a watershed management plan for the river and its tributaries. As a part of the watershed planning process, over 20 volunteers walked and canoed 21 miles of stream throughout the watershed to survey physical stream conditions (Fig. 1)—such as bank erosion, riparian vegetation, channel morphology, water color, odor, and trash and debris accumulation. Trash and illegal dumping, which contribute to bacterial pollution, were identified as a problem throughout the watershed. This project reviews data collected by volunteers in 2015 with a focus on the problem of trash and illegal dumping; maps the trash “hot spots”; and make recommendations to the watershed coalition and Save the Sound to help them address trash and illegal dumping. Our hope is to identify the areas with high accumulation of trash and gain an understanding of how the trash got there (illegal dumping, stormwater outfalls, etc.). In addition to evaluating the information collected by the volunteers, I went into some of these areas to observe in-stream conditions. I also collected macroinvertebrate samples in three stream segments to evaluate water quality and the effects of the pollution. With the information we collected in this project we hope to put some actions in place to address these issues and hopefully eliminate them in the near future.
USING ARCGIS TO IDENTIFY TRASH PROBLEM AREAS IN A WATERSHEDMapping Data
What can this tell us?
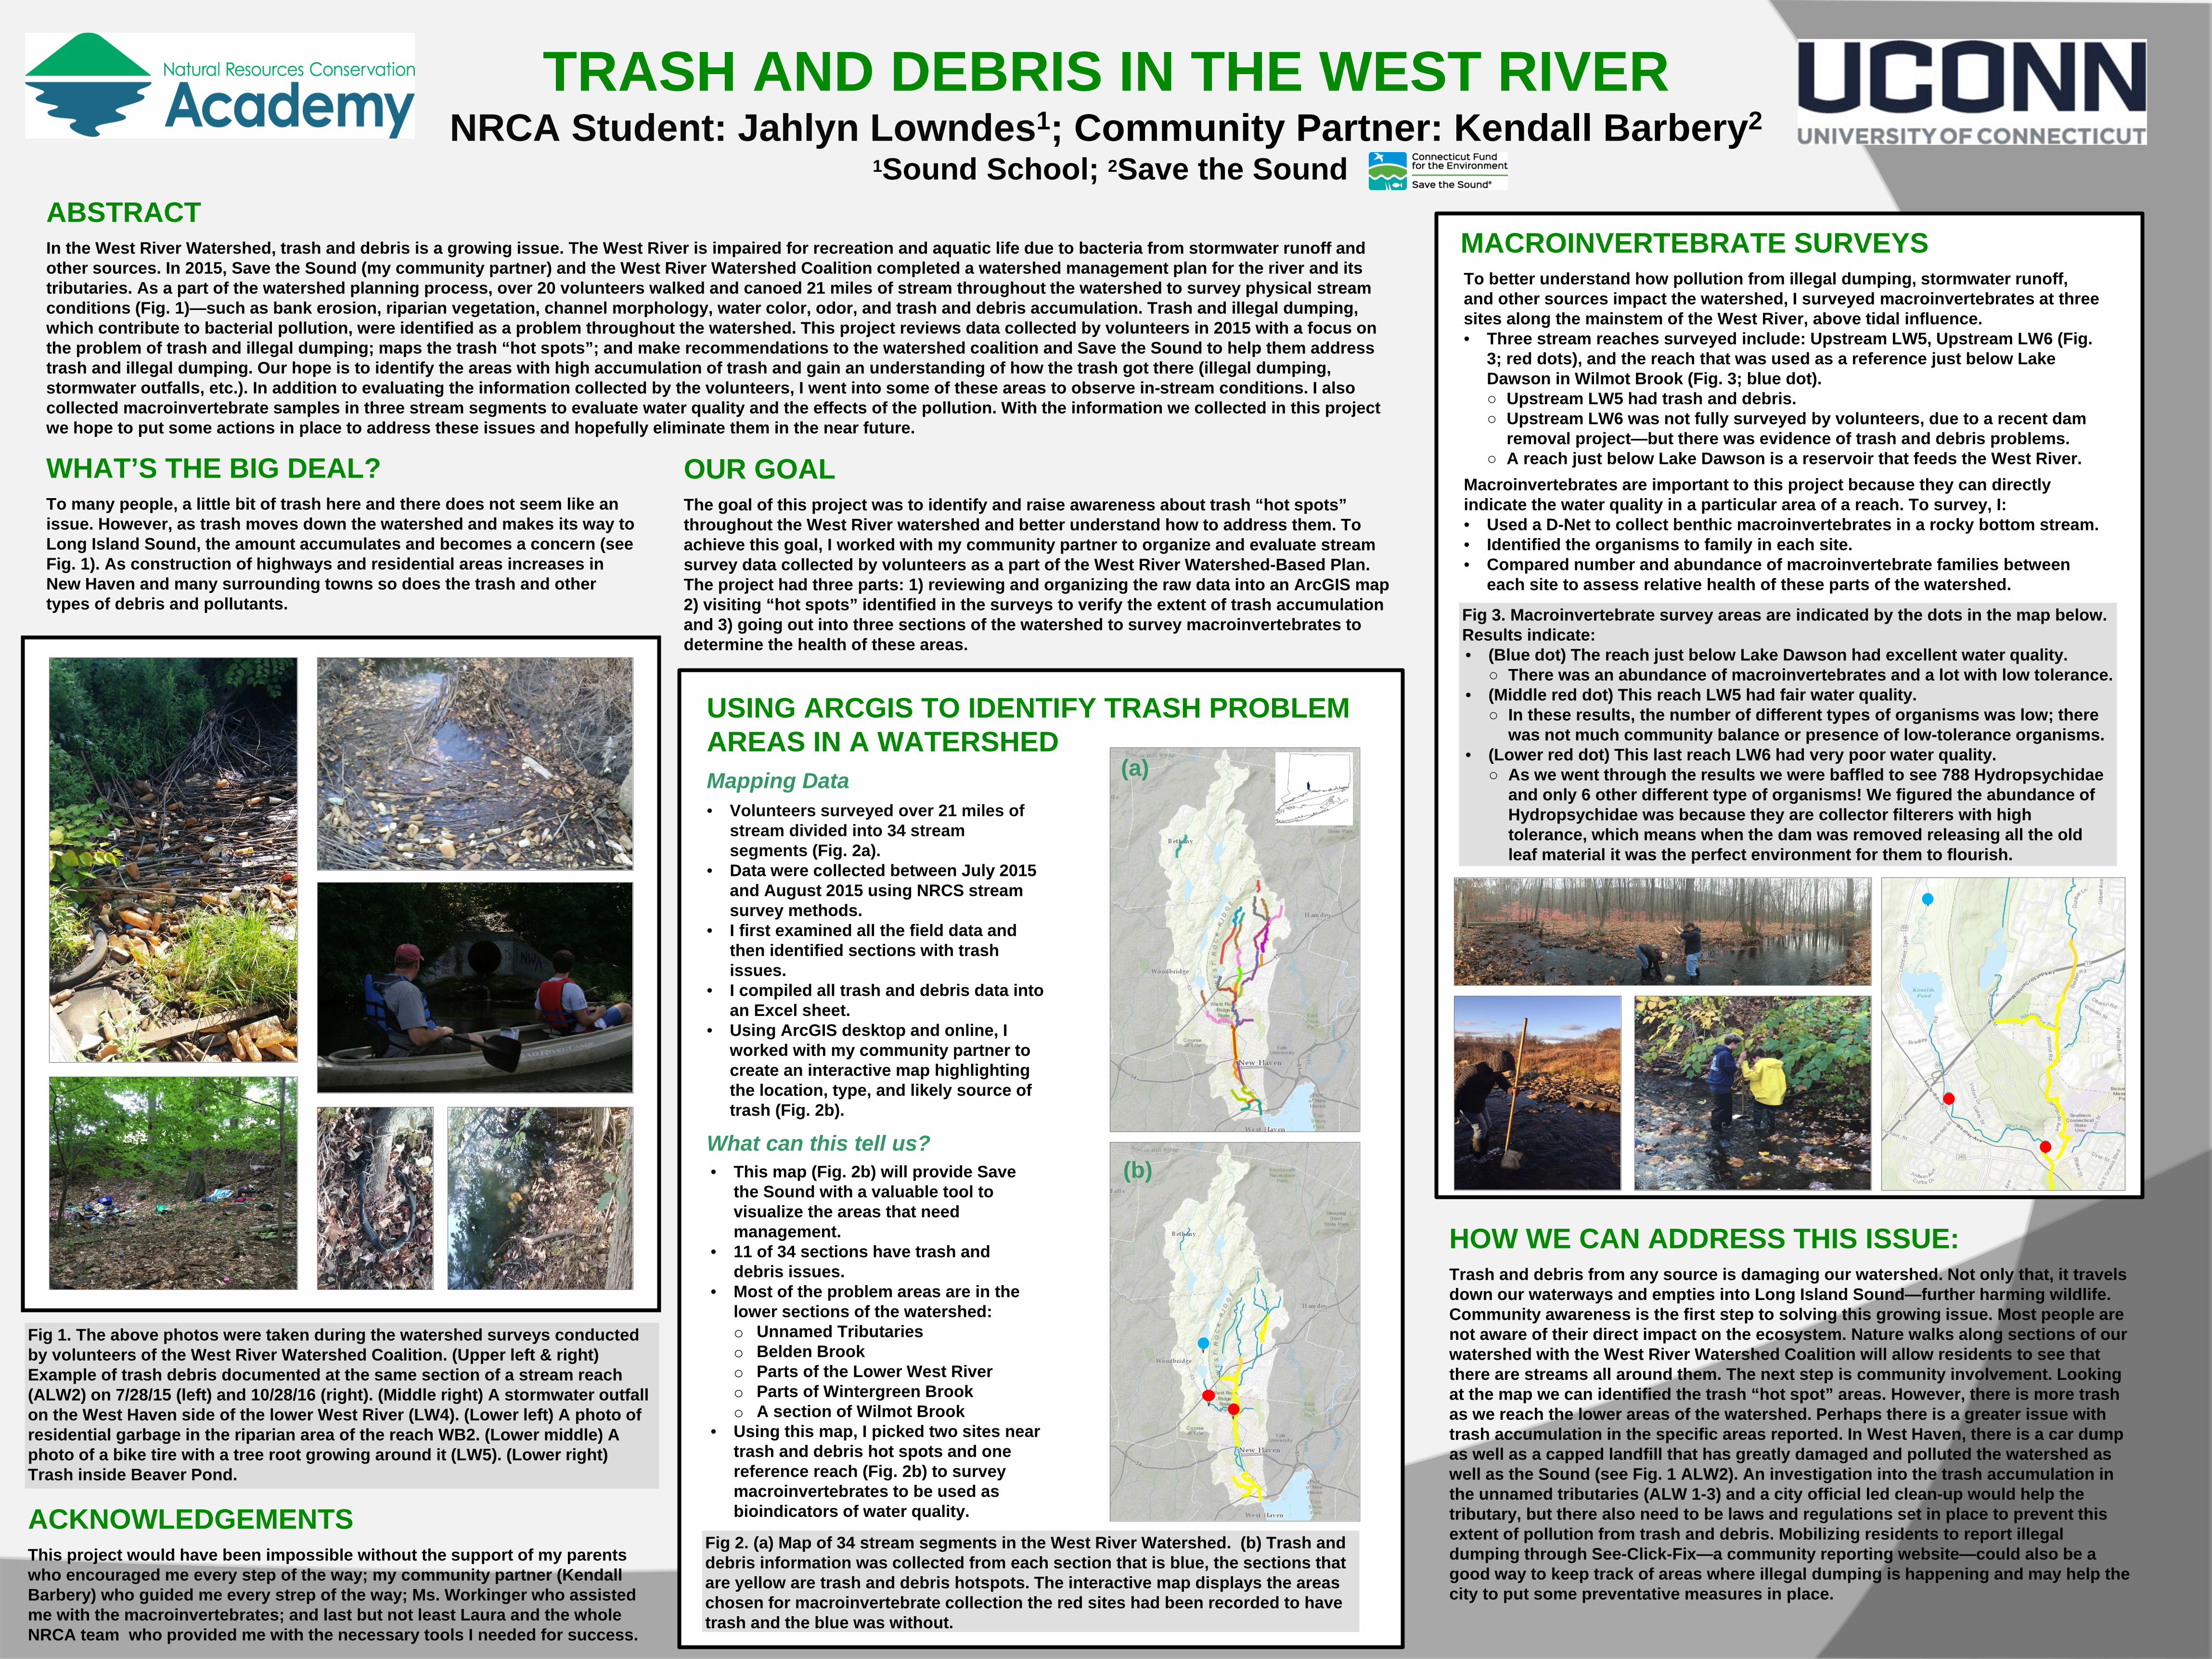
Fig 1. The above photos were taken during the watershed surveys conducted by volunteers of the West River Watershed Coalition. (Upper left & right) Example of trash debris documented at the same section of a stream reach (ALW2) on 7/28/15 (left) and 10/28/16 (right). (Middle right) A stormwater outfall on the West Haven side of the lower West River (LW4). (Lower left) A photo of residential garbage in the riparian area of the reach WB2. (Lower middle) A photo of a bike tire with a tree root growing around it (LW5). (Lower right) Trash inside Beaver Pond.
HOW WE CAN ADDRESS THIS ISSUE: Trash and debris from any source is damaging our watershed. Not only that, it travels down our waterways and empties into Long Island Sound—further harming wildlife. Community awareness is the first step to solving this growing issue. Most people are not aware of their direct impact on the ecosystem. Nature walks along sections of our watershed with the West River Watershed Coalition will allow residents to see that there are streams all around them. The next step is community involvement. Looking at the map we can identified the trash “hot spot” areas. However, there is more trash as we reach the lower areas of the watershed. Perhaps there is a greater issue with trash accumulation in the specific areas reported. In West Haven, there is a car dump as well as a capped landfill that has greatly damaged and polluted the watershed as well as the Sound (see Fig. 1 ALW2). An investigation into the trash accumulation in the unnamed tributaries (ALW 1-3) and a city official led clean-up would help the tributary, but there also need to be laws and regulations set in place to prevent this extent of pollution from trash and debris. Mobilizing residents to report illegal dumping through See-Click-Fix—a community reporting website—could also be a good way to keep track of areas where illegal dumping is happening and may help the city to put some preventative measures in place.
ACKNOWLEDGEMENTSThis project would have been impossible without the support of my parents who encouraged me every step of the way; my community partner (Kendall Barbery) who guided me every strep of the way; Ms. Workinger who assisted me with the macroinvertebrates; and last but not least Laura and the whole NRCA team who provided me with the necessary tools I needed for success.
WHAT’S THE BIG DEAL?To many people, a little bit of trash here and there does not seem like an issue. However, as trash moves down the watershed and makes its way to Long Island Sound, the amount accumulates and becomes a concern (see Fig. 1). As construction of highways and residential areas increases in New Haven and many surrounding towns so does the trash and other types of debris and pollutants.
OUR GOALThe goal of this project was to identify and raise awareness about trash “hot spots” throughout the West River watershed and better understand how to address them. To achieve this goal, I worked with my community partner to organize and evaluate stream survey data collected by volunteers as a part of the West River Watershed-Based Plan. The project had three parts: 1) reviewing and organizing the raw data into an ArcGIS map 2) visiting “hot spots” identified in the surveys to verify the extent of trash accumulation and 3) going out into three sections of the watershed to survey macroinvertebrates to determine the health of these areas.
• Volunteers surveyed over 21 miles of stream divided into 34 stream segments (Fig. 2a).
• Data were collected between July 2015 and August 2015 using NRCS stream survey methods.
• I first examined all the field data and then identified sections with trash issues.
• I compiled all trash and debris data into an Excel sheet.
• Using ArcGIS desktop and online, I worked with my community partner to create an interactive map highlighting the location, type, and likely source of trash (Fig. 2b).
• This map (Fig. 2b) will provide Save the Sound with a valuable tool to visualize the areas that need management.
• 11 of 34 sections have trash and debris issues.
• Most of the problem areas are in the lower sections of the watershed: o Unnamed Tributarieso Belden Brooko Parts of the Lower West River o Parts of Wintergreen Brooko A section of Wilmot Brook
• Using this map, I picked two sites near trash and debris hot spots and one reference reach (Fig. 2b) to survey macroinvertebrates to be used as bioindicators of water quality.
Fig 2. (a) Map of 34 stream segments in the West River Watershed. (b) Trash and debris information was collected from each section that is blue, the sections that are yellow are trash and debris hotspots. The interactive map displays the areas chosen for macroinvertebrate collection the red sites had been recorded to have trash and the blue was without.
(a)
(b)
MACROINVERTEBRATE SURVEYS To better understand how pollution from illegal dumping, stormwater runoff, and other sources impact the watershed, I surveyed macroinvertebrates at three sites along the mainstem of the West River, above tidal influence.• Three stream reaches surveyed include: Upstream LW5, Upstream LW6 (Fig.
3; red dots), and the reach that was used as a reference just below Lake Dawson in Wilmot Brook (Fig. 3; blue dot).○ Upstream LW5 had trash and debris.○ Upstream LW6 was not fully surveyed by volunteers, due to a recent dam
removal project—but there was evidence of trash and debris problems.○ A reach just below Lake Dawson is a reservoir that feeds the West River.
Macroinvertebrates are important to this project because they can directly indicate the water quality in a particular area of a reach. To survey, I:• Used a D-Net to collect benthic macroinvertebrates in a rocky bottom stream.• Identified the organisms to family in each site.• Compared number and abundance of macroinvertebrate families between
each site to assess relative health of these parts of the watershed.
Fig 3. Macroinvertebrate survey areas are indicated by the dots in the map below. Results indicate:• (Blue dot) The reach just below Lake Dawson had excellent water quality.
○ There was an abundance of macroinvertebrates and a lot with low tolerance.• (Middle red dot) This reach LW5 had fair water quality.
○ In these results, the number of different types of organisms was low; there was not much community balance or presence of low-tolerance organisms.
• (Lower red dot) This last reach LW6 had very poor water quality. ○ As we went through the results we were baffled to see 788 Hydropsychidae
and only 6 other different type of organisms! We figured the abundance of Hydropsychidae was because they are collector filterers with high tolerance, which means when the dam was removed releasing all the old leaf material it was the perfect environment for them to flourish.