Embed Size (px)
Citation preview
Transverse Crack Propagation of JPCP as Related to PCC Toughness
Will Hansen, Principal Investigator, and Elin A. Jensen, Research Assistant
Final Report prepared for Michigan Department of Transportation
University of Michigan Department of Civil
and Environmental Engineering Pavement Research Center of Excellence Ann Arbor, MI 48105
August 2001
ii
ACKNOWLEDGEMENT
The research team would like to thank the MDOT TAG members for their project suggestions and guidance. In particular, the research team would like to thank MDOT TAG chairperson John Staton for his help in carrying out this project, and the MDOT TAG members Curtis Bleech, Douglas Branch, Michael Eacker, and David Smiley for their help throughout this project. The research team would also like to thank MTS Systems Corporation, Minnesota, for the unique contribution as co-designers of the large-scale slab testing system. Several undergraduate and graduate students have worked as part-time helpers on this project during concrete casting and testing. Their contribution to the success is greatly acknowledged.
DISCLAIMER
This document is disseminated under the sponsorship of the Michigan Department of Transportation (MDOT) in the interest of information exchange. MDOT assumes no liability for the reports contents or use thereof. This document does not constitute a standard, specification, or regulation.
iii
EXECUTIVE SUMMARY
MDOT-UM PRCE Project “Transverse Crack Propagation of JPCP as Related to PCC Toughness”
This thirty six month laboratory study had two major objectives: • Quantify the effects of coarse aggregate type, maximum particle size, and
concrete age on the continued crack susceptibility of partially cracked concrete slabs.
• Quantify the relationship of coarse aggregate type and size on load transfer efficiency (LTE), as it relates to crack-width, for fully cracked JPCP slabs.
MDOT’s series 6AA gradation was tested alone and blended with a larger, 50 mm top-size coarse aggregate. Seven aggregate sources were investigated; three limestones, a dolomitic limestone, a blast- furnace slag, and two glacial gravels. The project had two phases. In phase one the resistance to cracking was determined using a test setup with 100 x 200 x 965 mm beams. Concrete strength and fracture properties were determined at three different ages; 7 days, 28 days and 91 days. The fracture properties from the beams were used to evaluate the impact of a partial edge crack found in some jointed plain concrete pavements (JPCP) projects undergoing premature cracking. In phase two, the LTE characteristics of a full-size slab were measured using a testing system that replicated wheel loading of a complete JPCP structure. The measured fracture properties were entered in a model to predict the tensile resistance of a partially cracked slab. Fracture analysis showed that a partial width, mid-slab transverse crack has a major negative, non-linear, affect on remaining tensile strength for a typical pavement cross section. Coarse aggregate contributes with a variation of about 36 percent in the strength capacity as measured using PCC toughness. The PCC fracture toughness values ranged from 55 to 78 MPa/(mm½) at 28 days. Beams containing glacial gravel were found to yield the highest fracture toughness, while the beams containing limestone and blast-furnace slag yielded the lowest values. However, concrete containing crushed limestone or slag coarse aggregate developed higher early tensile strength (tested at 7 days), which is likely associated with improved paste-aggregate bond. Therefore, these concretes in an un-cracked structure should have more resistance to cracking within the first 7 days. In contrast, at 28 days no strength differences were found, so long term benefits are likely nil. This study also found that aggregate interlock properties across a crack, as determined by LTE, for a typical MDOT concrete pavement on a 3G or 4G open-graded drainage course (OGDC) were similar. Long-term testing (>1.5 million cycles) measured crack faulting to be less than 0.7 mm using a Georgia faultmeter. With the exception of the blend with 50 mm top size, glacial gravel, no significant difference in long-term LTE was obtained. The large gravel particles maintained a high LTE at any crack width up to 2.5 mm. The improved load transfer was associated with a rougher crack texture, as the large gravel particles did not fracture in contrast to the limestone and slag particles.
iv
TABLE OF CONTENTS
1. Introduction .......................................................................................................... 1 2. Effects of Coarse Aggregate on JPCP Transverse Cracking................................ 3 2.1 Concrete Fracture ................................................................................................. 3 2.1.1 Concrete Fracture Toughness............................................................................... 5 2.1.2 Fracture Toughness Approximated from Fracture Energy .................................. 6 2.1.3 Fracture Toughness Approximated from the Effective Crack Model.................. 6 2.2 The Role of Coarse Aggregates in Fracture Behavior of Pavement Concrete..... 7 2.3 The Role of Coarse Aggregates in the Mechanical Performance of Transverse Joints and Cracks in Concrete Pavement ............................................................. 8 2.3.1 Mechanism of Aggregate Interlock...................................................................... 9 2.3.2 Material Characteristics Affecting Aggregate Interlock .................................... 10 2.3.3 Other factors affecting transverse cracks ........................................................... 14 3. Experimental Materials ...................................................................................... 17 3.1 Project Phases..................................................................................................... 17 3.2 Coarse Aggregates Sources Evaluated in Phase 1 ............................................. 20 3.3 Coarse Aggregate Sources Evaluated in Phase 2 ............................................... 23 3.4 Mix Designs ....................................................................................................... 25 3.5 PCC Specimens.................................................................................................. 26 4. Specialized Test Procedures used in Phase 1 and Phase 2................................. 28 4.1 Test Procedure and Calculation of Fracture Energy .......................................... 28 4.1.1 Fracture Mechanic Properties............................................................................. 28 4.1.2 Test Procedures for Fracture Energy Testing..................................................... 29 4.1.3 Test Specimen .................................................................................................... 30 4.1.4 Calculations........................................................................................................ 31 4.2. Test Procedure for Load Transfer Properties of Transverse Cracks in Slabs-on-Grade................................................................................................... 32 4.2.1 Cross Section View of Slab Set-up .................................................................... 33 4.2.2 Subbase and Base Properties.............................................................................. 35 4.2.3 Test Set-up for Slab Testing............................................................................... 36 5. Effect of Coarse Aggregate Gradation and Type on Concretes Resistance to Cracking ......................................................................................................... 42 5.1. Concrete and Fracture Mechanics ...................................................................... 42 5.2. Results from Beam and Cylinder Testing .......................................................... 43 5.2.1. Development of Strength ................................................................................... 45 5.2.2. Interrelation between Compressive Strength and Splitting Tensile Strength and Elastic Modulus ........................................................................................... 46 5.3. Effect of Coarse Aggregate on the Concretes’ Fracture Energy........................ 47 5.3.1. Load-Deflection Curve for Concrete Beams Containing Different Coarse Aggregate ............................................................................................... 48
v
5.3.2. Coarse Aggregate Type and Fracture Energy .................................................... 48 5.3.3. Coarse Aggregate Size and Fracture Energy...................................................... 50 5.4. Fracture Toughness and Concrete Coarse Aggregate ........................................ 51 5.4.1. Development of Fracture Toughness versus Concrete Age ............................... 53 5.5. Fracture of Highway Concrete Slabs ................................................................. 53 5.5.1. Effect of Tensile Strength on Slab Cracking in Slabs without Cracks .............. 53 5.5.2. Effect of Fracture Toughness on Cracking in a Slab Containing an Edge Crack ......................................................................................................... 54 5.6. Fracture Surface and Fracture Energy................................................................ 56 5.7. Fracture Energy and Aggregates Resistance to Wear ........................................ 57 6. The Effect of Coarse Aggregate Type and Size on the Load Transfer Properties
of Transverse Cracks in JPCP’s ......................................................................... 59 6.1. Large-Scale Testing of Cracked JPCP’s on Grade............................................. 59 6.2. PCC Properties ................................................................................................... 63 6.3. Foundation Condition......................................................................................... 65 6.4. Verification of Deflection Magnitudes .............................................................. 65 6.4.1. Deflection Correction due to Slab Lift ............................................................... 65 6.4.2. Comparison of Measured and Estimated Deflection.......................................... 66 6.4.3. Soil Stresses due to Slab Deflection................................................................... 66 6.5. Slab Deflections and Crack Width ..................................................................... 67 6.6. Load Transfer and Crack Width......................................................................... 71 6.7. Mechanism of Slab Deflection under Wheel Loading ....................................... 74 6.7.1. Crack Slack and Sliding ..................................................................................... 74 6.7.2. Crack Dilation .................................................................................................... 75 6.7.3. Combined Evaluation of Slack and Sliding ....................................................... 77 6.7.4. The Effect of Crack Opening and Closing on Load Transfer ............................ 79 6.8. Crack Load Transfer versus Number of Loading Cycles................................... 79 6.9. Faulting Development ........................................................................................ 80 7. Conclusions, Recommendations and Project Benefits to MDOT....................... 82 7.1 Project Objectives ............................................................................................... 82 7.2 Project Scope....................................................................................................... 82 7.3 Major Findings .................................................................................................... 83 7.4 Recommendations and Project Benefits to MDOT............................................. 88 References ........................................................................................................... 90
1
Chapter 1. Introduction
Premature transverse cracking has occurred in recent jointed plain concrete pavement (JPCP) projects in Michigan. Other states such as Iowa, Indiana and Pennsylvania have also reported premature transverse cracking in their JPCPs. To date the root cause(s) have not been clearly determined. It is a concern to State Highway Agencies (SHA’s) as JPCP’s are not intended to develop midslab transverse cracking at any time as it may lead to associated distresses such as spalling and faulting from heavy vehicle loading. Spalling result in costly repair and rehabilitation. The premature transverse cracking in Michigan was found to start at the outer edge initiating at the slab surface. Many of these cracks quickly propagated from short shallow depth edge cracks to full-width, full-depth, working cracks. A large number of contributing factors could have played a major role in this such as unfavorable environmental conditions during paving and construction and materials problems. The purpose of this project was to determine the effect of coarse aggregate type in the Portland Cement Concrete (PCC) on crack resistance in uncracked and cracked concrete. Research Approach A two-phase laboratory study was developed as part of the Michigan Department of Transportation (MDOT) Pavement Research Center of Excellence (PRCE) program. Phase one was developed to determine the crack resistance of a typical highway mix (i.e. Grade 1P) in the presence of a crack. Variables were coarse aggregate type and concrete age. Phase two of the laboratory investigation consisted of quantifying the aggregate interlock properties of fully cracked concrete slabs, 250 mm (10 in.) thick, resting on a typical Michigan foundation (i.e. 100 mm Open-Graded Base Course (OGDC), while monitoring and determining the foundation stability in terms of faulting. Further, the potential benefits of using larger coarse aggregate size (>25 mm) in the PCC mix was investigated as well. Special test facilities were developed to conduct this project requiring large scale notched beam testing in closed-loop control in order to determine the total load-deflection response. This was required in order to quantify fracture properties as related to the contribution from the coarse aggregate. In phase two, the load transfer efficiency (LTE) characteristics of a full-size slab were measured using a testing system that replicated wheel loading of a complete JPCP structure. Load transfer properties across a transverse crack can be evaluated using conventional analysis techniques of the relative deflections on either side of the crack. These techniques are widely accepted and used when evaluating field data obtained from non-destructive testing (NDT) using Falling Weight Deflectometer (FWD.)
2
However, it is apparent that the partial width cracks reduces the slabs fatigue life due to the reduced cross section area. However, many of the partial width edge cracks as observed in the field should not have developed in fatigue cracking if analysis is based on the theory of elasticity. The presence of the cracks in the slabs obviously reduces the load carrying capacity beyond that indicated by theory of elasticity and described by the material’s tensile strength. A specialized theory, fracture mechanics, has been developed over the last decades to determine the effect of cracks in concrete structures with different material compositions. Several avenues of fracture mechanics have been exploited in this work. MDOT Technical Advisory Group The sponsoring agent, MDOT, formed an internal technical advisory group. The group members were Mr. John Staton (chair person), Mr. Curtis Bleech, Mr. Douglas Branch, Mr. Michael Eacker and Mr. David Smiley.
3
Chapter 2. Effects of Coarse Aggregate on JPCP Transverse Cracking
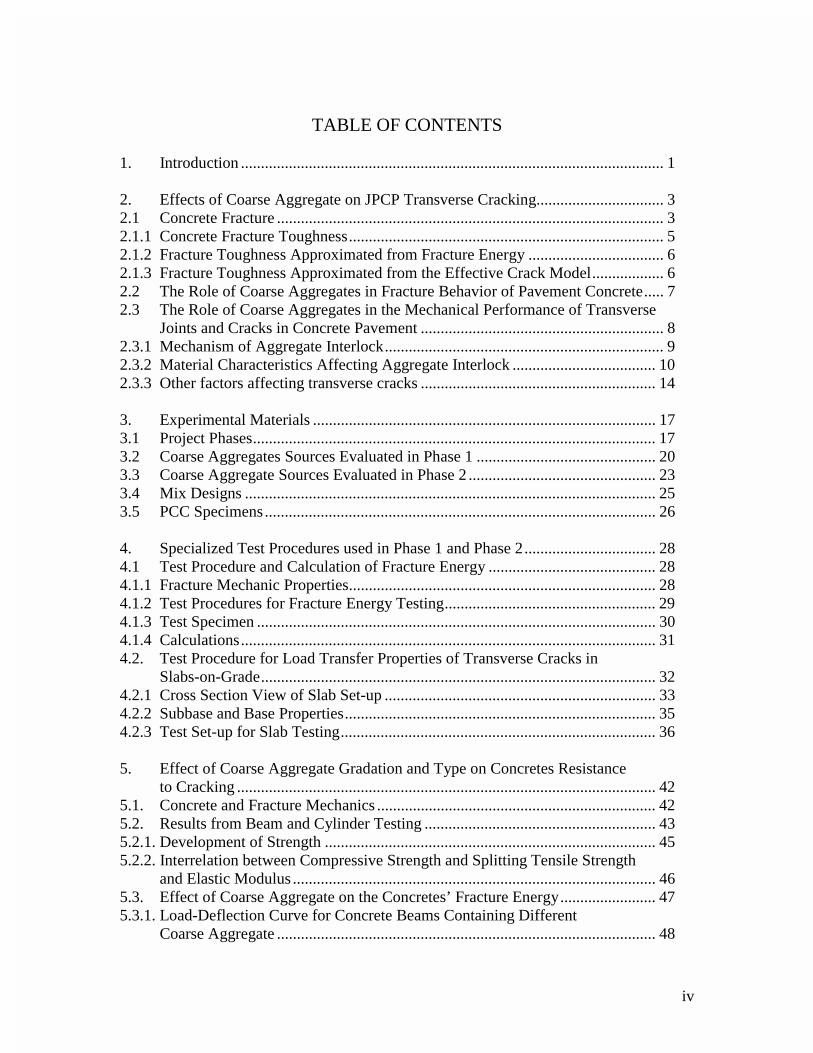
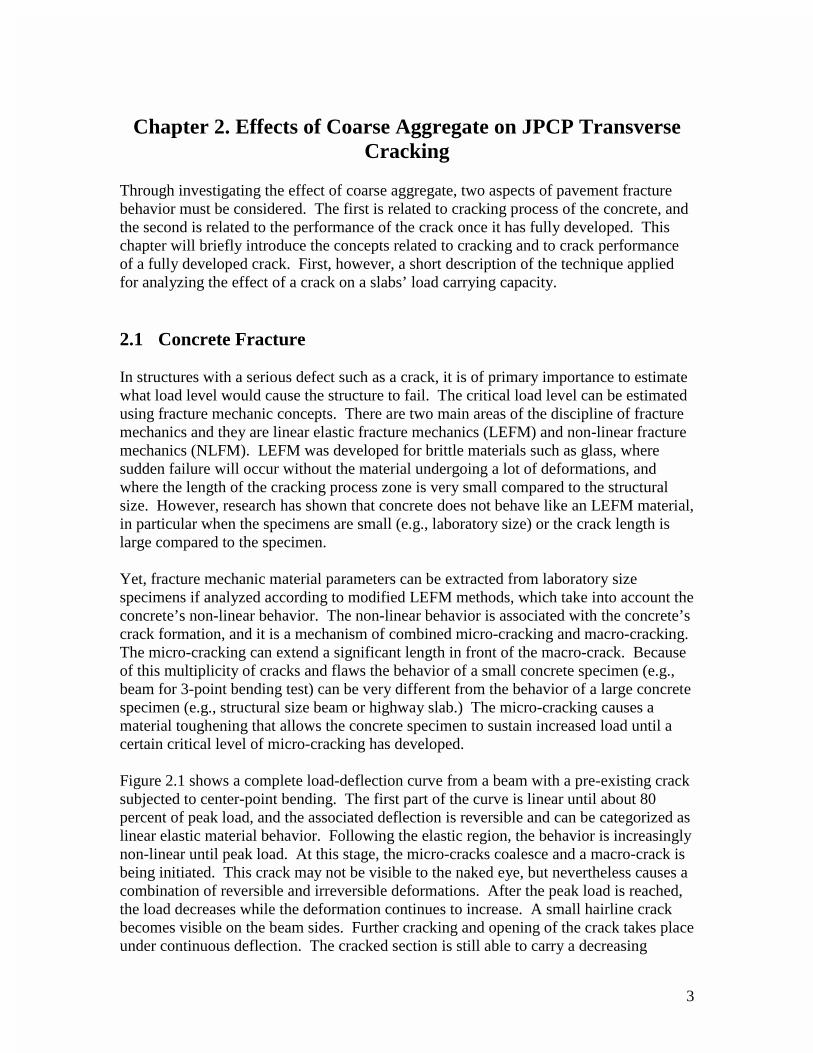
Through investigating the effect of coarse aggregate, two aspects of pavement fracture behavior must be considered. The first is related to cracking process of the concrete, and the second is related to the performance of the crack once it has fully developed. This chapter will briefly introduce the concepts related to cracking and to crack performance of a fully developed crack. First, however, a short description of the technique applied for analyzing the effect of a crack on a slabs’ load carrying capacity. 2.1 Concrete Fracture In structures with a serious defect such as a crack, it is of primary importance to estimate what load level would cause the structure to fail. The critical load level can be estimated using fracture mechanic concepts. There are two main areas of the discipline of fracture mechanics and they are linear elastic fracture mechanics (LEFM) and non-linear fracture mechanics (NLFM). LEFM was developed for brittle materials such as glass, where sudden failure will occur without the material undergoing a lot of deformations, and where the length of the cracking process zone is very small compared to the structural size. However, research has shown that concrete does not behave like an LEFM material, in particular when the specimens are small (e.g., laboratory size) or the crack length is large compared to the specimen. Yet, fracture mechanic material parameters can be extracted from laboratory size specimens if analyzed according to modified LEFM methods, which take into account the concrete’s non-linear behavior. The non-linear behavior is associated with the concrete’s crack formation, and it is a mechanism of combined micro-cracking and macro-cracking. The micro-cracking can extend a significant length in front of the macro-crack. Because of this multiplicity of cracks and flaws the behavior of a small concrete specimen (e.g., beam for 3-point bending test) can be very different from the behavior of a large concrete specimen (e.g., structural size beam or highway slab.) The micro-cracking causes a material toughening that allows the concrete specimen to sustain increased load until a certain critical level of micro-cracking has developed. Figure 2.1 shows a complete load-deflection curve from a beam with a pre-existing crack subjected to center-point bending. The first part of the curve is linear until about 80 percent of peak load, and the associated deflection is reversible and can be categorized as linear elastic material behavior. Following the elastic region, the behavior is increasingly non-linear until peak load. At this stage, the micro-cracks coalesce and a macro-crack is being initiated. This crack may not be visible to the naked eye, but nevertheless causes a combination of reversible and irreversible deformations. After the peak load is reached, the load decreases while the deformation continues to increase. A small hairline crack becomes visible on the beam sides. Further cracking and opening of the crack takes place under continuous deflection. The cracked section is still able to carry a decreasing
4
amount of tensile stresses until the crack has deteriorated beyond a certain crack width. The beam will continue to carry load until the cracked cross section has been reduced to a minimum where the beam fails under its own weight.
Figure 2.1 Load-deflection curve from a notched laboratory size beam subjected to center-point bending along with beam and test configuration.
A cornerstone of fracture mechanics is the crack driving forces, which from a global point of view can be represented by the amount of energy required for creating a new crack surface. Considering figure 2.1, it is clear that the energy consumed during cracking is represented by the measured non-linear deformation. This energy is denoted as the concretes fracture energy, GF. One way to determine the fracture energy, GF, required for cracking is to take the area under the complete curve (work-of-fracture) and divide it with the cracked cross section area (RILEM, 1985). Another way is to determine the energy at peak due to non-linear deformation and divide that with the cross section that has cracked at that point. The cracked section at peak is presented by the difference between the effective and original notch length. The effective crack length is the original length of the notch and an additional length representing the degradation caused by micro-cracking in front of the crack tip. Determining the effective crack length is not a straightforward process as it cannot be directly measured on the beam, but it must be estimated mathematically. The effective crack model proposed by Nallathambi and Karihaloo (1986) is one model that can estimate the effective crack length. In general, the fracture energy as determined by the second approach yields lower values than those reached in the first approach when obtained on laboratory size beams. Yet, the values obtained from the two approaches will asymptotically go toward the same value when the specimens become larger and/or the original crack length shorter (Hillerborg et
Self Weight
Work of Fracture
Load
Deflection
P,δ
Original crack length, a0
Original crack length = a0
Effective crack length at peak= ae
5
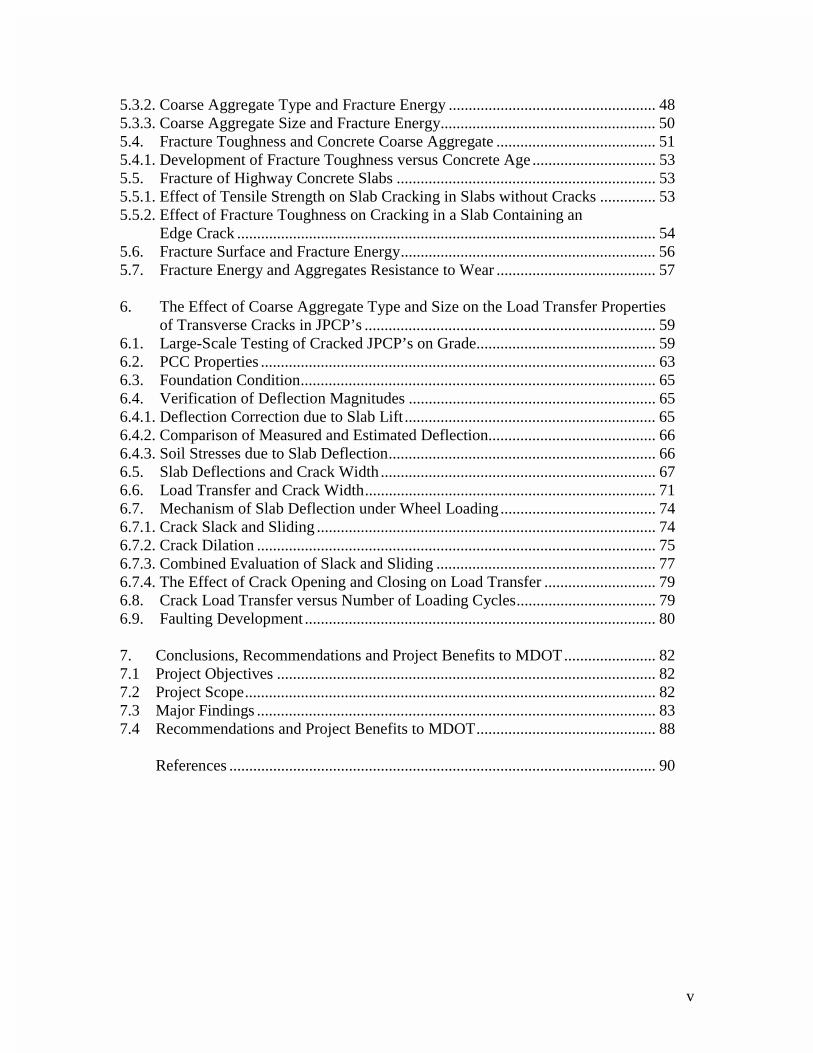
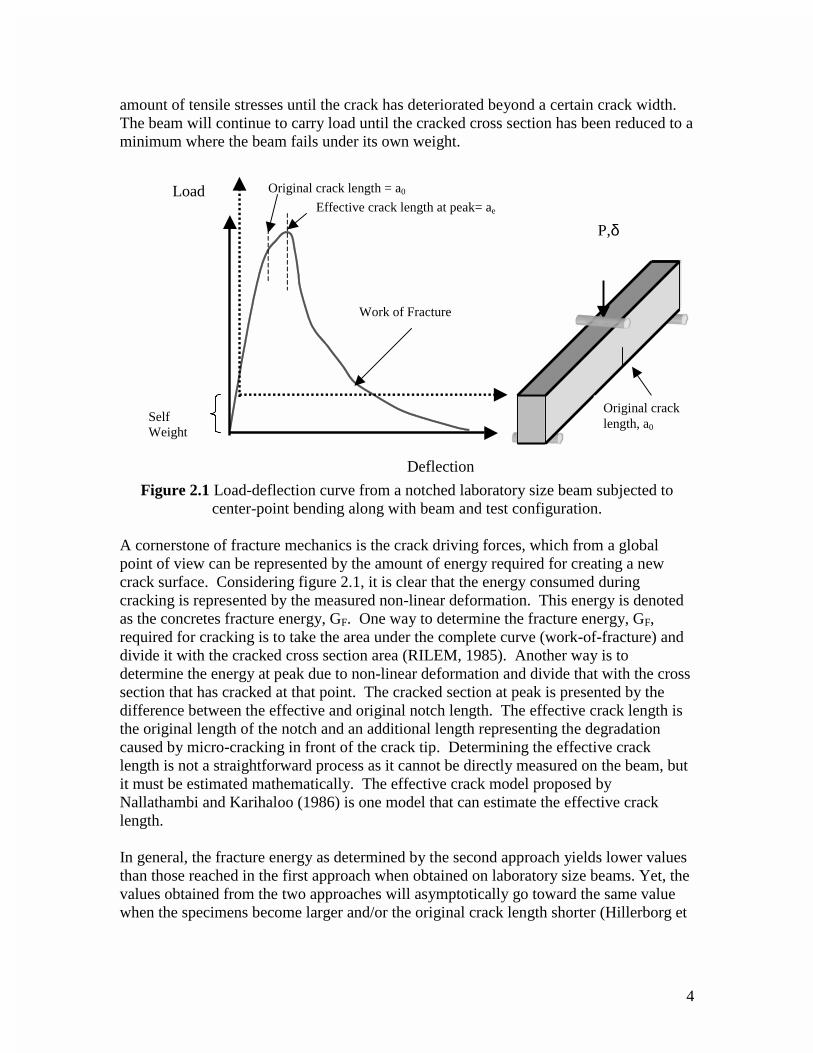
al., 1976). The difference between the approaches is due to the concrete’s inhomogeneity as it contains coarse aggregates. This indicates that GF determined from the measured complete load-deflection curve of a laboratory size beam is representative of the fracture process of a large concrete structure. Hence, fracture mechanic material properties as obtained on laboratory size specimens can be applied with LEFM analysis to a large structure. 2.1.1 Concrete Fracture Toughness The presence of a crack in an elastic body leads to a significant change in its stress state. In materials that can be described by LEFM the stress conditions in the region near the crack are independent of the shape of the specimen and the loading conditions. Therefore, for mathematical convenience a parameter denoted as the stress intensity factor, KI, which depends on the geometry of the body and the remote loading causing the crack to open, was introduced. The crack will start to propagate in an unstable manner when KI reaches the critical stress intensity factor, KIC, where KIC is a material property such as strength. Sudden failure occurs when KI = KIC. In concrete KIC is often called fracture toughness. Stress intensity factors, KI, are functions of the applied load, boundary conditions, crack length, and structural geometry. For materials and specimens that can be modeled by LEFM the specimen’s KI can be determined from e.g., finite element analysis. Not all geometries render themselves for a simple closed-form solution. However, for notched beams a closed-form solution is available. The specimen is loaded gradually until the crack starts to propagate and the corresponding maximum load, Pmax, is determined. The general test arrangement of the notched beam in center-point bending is shown in figure 2.2. The critical stress intensity factor, KIC, or fracture toughness for this geometry can be calculated as
( ) aWaY
BW
SPK IC 2
max
4
6= (2.1)
Where a is the crack length, B is the width of the beam, W is the height of the beam, S is the span of the beam, and Y(a/W) is a function of geometry. For a notched beam subjected to center-point bending Y(a/W) can be approximated to
( ) ( ) ( ) ( ) ( )4
4
3
3
2
210 WaAW
aAWaAW
aAAWaY ++++= (2.2)
Where the Ai coefficients depend on the S/W ratio. For further detail it is recommended to consult the literature (e.g., Karihaloo, 1995, Shah et al., 1995).
6
Figure 2.2 Test arrangement for a notched beam subjected to center-point bending. 2.1.2 Fracture Toughness Approximated from Fracture Energy According to LEFM a relation between the crack driving forces GF and KIC can be written as
EGK FIC (= (2.3)
This approach can easily be applied when GF is determined from the complete load-displacement curve of a concrete specimen – the first approach discussed above. In this work GF is determined according to a non-linear approach, and KIC estimated from this value is applicable for large concrete structures when analyzed according to LEFM. 2.1.3 Fracture Toughness Approximated from the Effective Crack Model Determining GF from the peak load and displacement alone is complicated by the need to determine the effective crack length due to micro-cracking. Several approximate nonlinear fracture models have been suggested to determine KIC. Among these are the two-parameter model (Jenq and Shah, 1985), the effective crack model (Nallathambi and Karihaloo, 1986), and the size-effect model (Bazant and Kazemi, 1990). In this work the fracture toughness is estimated using the effective crack model as the data available lend themselves to that approach. The effective crack model determines the fracture toughness of concrete using center-point bend beams and it includes the effect of pre-peak nonlinear behavior of a real structure containing a real crack of length, a0 through an equivalent elastic structure containing a real crack of effective length ae > a0. The effective crack length is calculated based on the secant stiffness of the real concrete specimen at peak. Interested readers are referred to the literature for details. To determine the fracture toughness, the effective crack length corresponding to peak load, Pmax, and associated deflection, dp is to be calculated. A relation is established between dp and Pmax as a function of the specimen geometry and loading condition (it is assumed that the specimen dead weight has been accounted for.)
+
−
+
=
W
aF
W
S
BE
P
S
W
S
W
W
S
BE
P ep 2
2
max
323
max
2
984.070.21
4δ (2.4)
P
P/2 P/2 S
W
B
a
7
Where F2(ae/W) is
∫=
W
a
es
e
dxxxYW
aF
0
2 )( (2.5)
Where x is ae/W, and Y(x) is the geometry function for a center-point bend beam (equation 2.2). In the cases where the concrete’s elastic modulus, E, is known the value of the function F2(ae/W) is determined such that the calculated and measured deflection at peak are equal. Based on the value of F2(ae/W), ae can be determined through trial and error. By using ae and Pmax the value of KC can be determined from equation (2.1). KC determined from ae is higher than if it had been determined based on a0. 2.2 The Role of Coarse Aggregates in Fracture Behavior of Pavement
Concrete Concrete strength cannot alone predict the concrete fracture behavior because the behavior is largely affected by the material characteristics and in particular by the coarse aggregate type, size, and content. A number of studies have been performed evaluating the effect of coarse aggregate properties on the concrete fracture properties (e.g. Petersson, 1981; Kleinschrodt and Winkler, 1986; de Larrard and Malier, 1992; Kan and Swartz, 1995; Zhou et al., 1995; and Giaccio and Zerbino, 1998). It is important to keep in mind that the framework for these studies was traditional structural concrete and not paving concrete (i.e., the maximum coarse aggregate size investigated were typically 8 to 16 mm) The concrete fracture energy is given by a combination of the fracture energy of the matrix and the coarse aggregate. For normal strength concrete, the coarse aggregates form the most significant component with a contribution of approximately 85 percent. In other words, the aggregate interlock (bridging and frictional effects) has a significant effect (e.g., Peterson, 1981, de Larrard and Malier, 1992; and Bache and Vinding, 1990/1992). The coarse aggregate is found to be the most important factor for fracture energy. Petersson (1981) reported that the difference in fracture energies lie in the effective crack path. For stronger aggregates the crack runs around the aggregate, whereas for weaker aggregates the crack penetrates and fractures the aggregates. The crack path also depends on the paste-aggregate bond. It is commonly believed that cracks penetrate the coarse aggregate in cases where the properties at the interface, the zone between the coarse aggregate and the matrix, are
8
close to the matrix properties, as in high strength concrete (ACI 363R-7). However, experimental and numerical results reported in the literature show that the phenomenon of crack patterns through or around the aggregates is more complex (e.g. Vervuurt, 1997; and Mohamed and Hansen, 1999). Results show that for increasing interface-to-matrix strength ratio (approaching 1) the specimen peak tensile capacity increases while the aggregate and matrix properties remain constant. At the same time, it was shown for interface-to-matrix strength ratios approaching 1, that the crack penetrates the coarse aggregates when the aggregate tensile strength is lower than that of the matrix. This occurs irrespective of the fracture energy ratio between the aggregate and the matrix. Yet, the overall specimen ‘toughness’ increases when aggregate-to-matrix fracture energy ratio increases. Furthermore, in the cases where the tensile strength of the aggregate equals the strength of the matrix, the fracture energy ratio between the aggregate and the matrix is the dominating factor for whether or not the crack penetrates the aggregates. For ratios lower than 1, cracks will penetrate the aggregates, and for ratios higher than 1 the crack will not penetrate the aggregates. Increasing the aggregate size also tend to improve the fracture properties. Studies reported by Petersson (1981), Kleinschrodt and Winkler (1986), and Karihaloo (1995) showed that increasing the coarse aggregate size increases the fracture energy. Karihaloo states that the increased fracture energy is due to the effect of aggregates as “crack obstacles.” The crack has to change directions to pass around the aggregates, and this requires additional energy compared to that required for a straight-line crack. It was found that only the post-peak response is affected and that increasing aggregate size allows more energy to be absorbed by the concrete. It has been suggested that a higher volume concentration of particles (aggregates) which are stronger and stiffer than the matrix would also increase the fracture energy (Monterio and Helene, 1994; and Bache and Vinding, 1992). Petersson (1981) did a limited study with cement to aggregate ratio from 0.4, 0.5, and 0.6. He found that the fracture energy did increase with increasing aggregate fraction, but the elastic modulus was more significantly affected. Karihaloo (1995) illustrated that aggregate textures affect the fracture energy. However, in contrast to aggregate type, size, and content, the aggregate shape and angularity tend to affect the peak area more than the tail area. Crushed materials tend to reach higher peak stress than rounded materials. In general, the effect of aggregate shape and angularity has less impact on fracture energy than the aggregate type and size. 2.3 The Role of Coarse Aggregates in the Mechanical Performance of
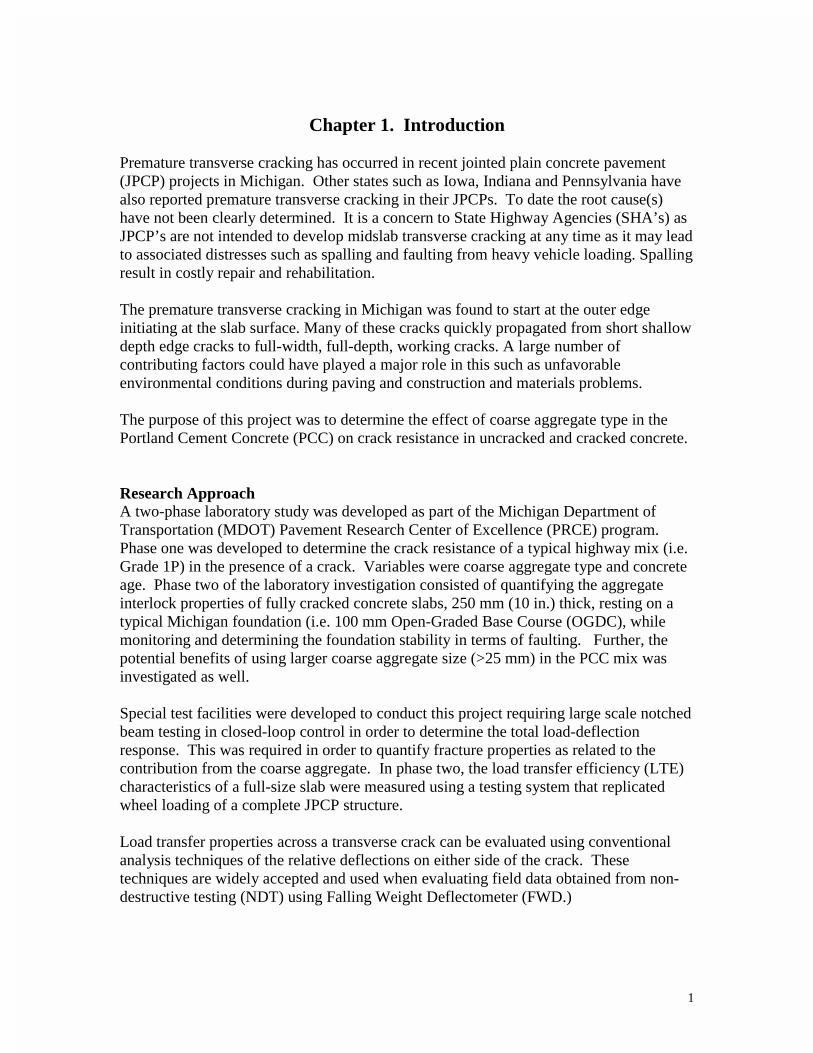
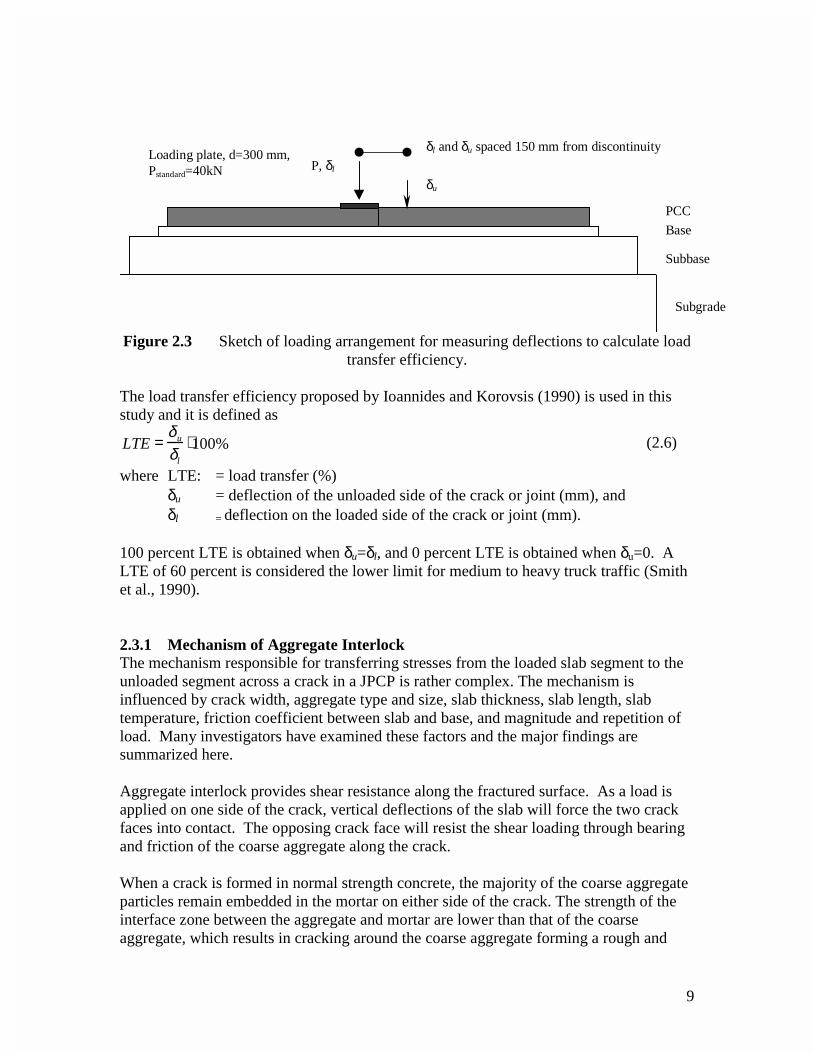
Transverse Joints and Cracks in Concrete Pavement Traditionally, the effectiveness of aggregate interlock is quantified through the load transfer efficiency (LTE). Load transfer efficiency is a relative measure of the deflections on either side of the crack or joint. Figure 2.3 show a sketch of the typical loading arrangement used in the field for determining the deflections to calculate LTE.
9
PCC
Base
Subbase
Subgrade
P, δl
δu
δl and δu spaced 150 mm from discontinuityLoading plate, d=300 mm,Pstandard=40kN
Figure 2.3 Sketch of loading arrangement for measuring deflections to calculate load transfer efficiency.
The load transfer efficiency proposed by Ioannides and Korovsis (1990) is used in this study and it is defined as
LTE =δu
δl
⋅100% (2.6)
where LTE: = load transfer (%) δu = deflection of the unloaded side of the crack or joint (mm), and δl = deflection on the loaded side of the crack or joint (mm).
100 percent LTE is obtained when δu=δl, and 0 percent LTE is obtained when δu=0. A LTE of 60 percent is considered the lower limit for medium to heavy truck traffic (Smith et al., 1990). 2.3.1 Mechanism of Aggregate Interlock The mechanism responsible for transferring stresses from the loaded slab segment to the unloaded segment across a crack in a JPCP is rather complex. The mechanism is influenced by crack width, aggregate type and size, slab thickness, slab length, slab temperature, friction coefficient between slab and base, and magnitude and repetition of load. Many investigators have examined these factors and the major findings are summarized here. Aggregate interlock provides shear resistance along the fractured surface. As a load is applied on one side of the crack, vertical deflections of the slab will force the two crack faces into contact. The opposing crack face will resist the shear loading through bearing and friction of the coarse aggregate along the crack. When a crack is formed in normal strength concrete, the majority of the coarse aggregate particles remain embedded in the mortar on either side of the crack. The strength of the interface zone between the aggregate and mortar are lower than that of the coarse aggregate, which results in cracking around the coarse aggregate forming a rough and
10
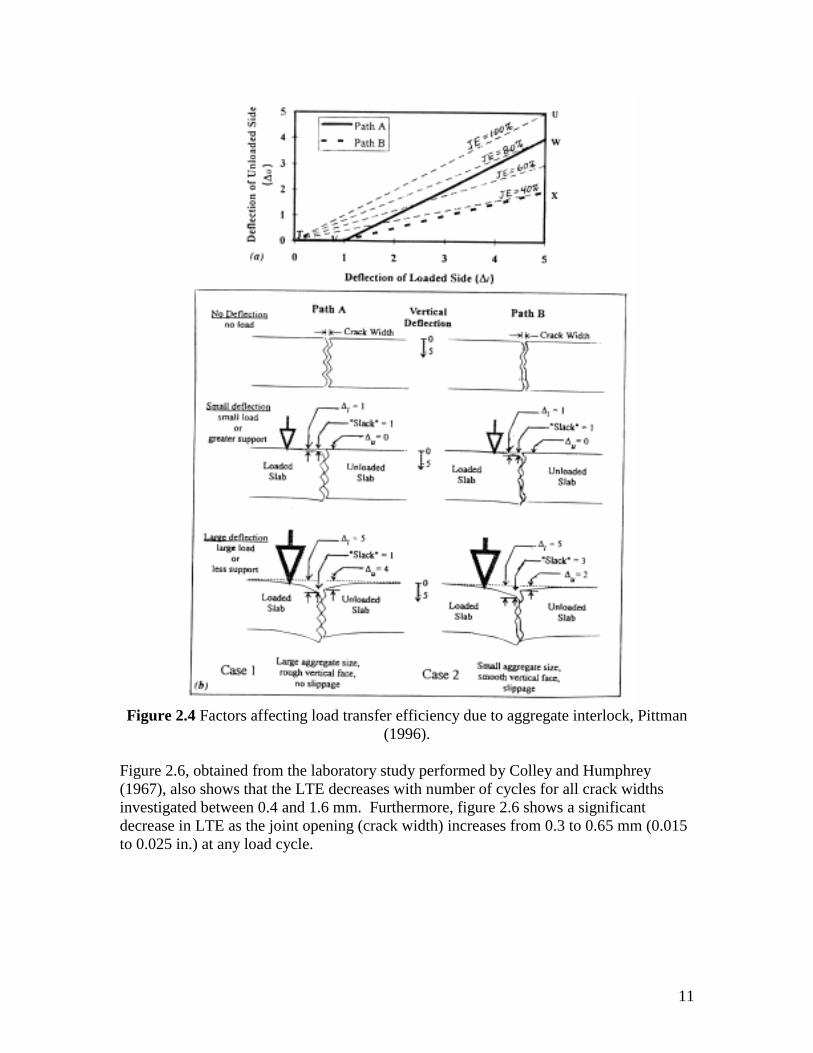
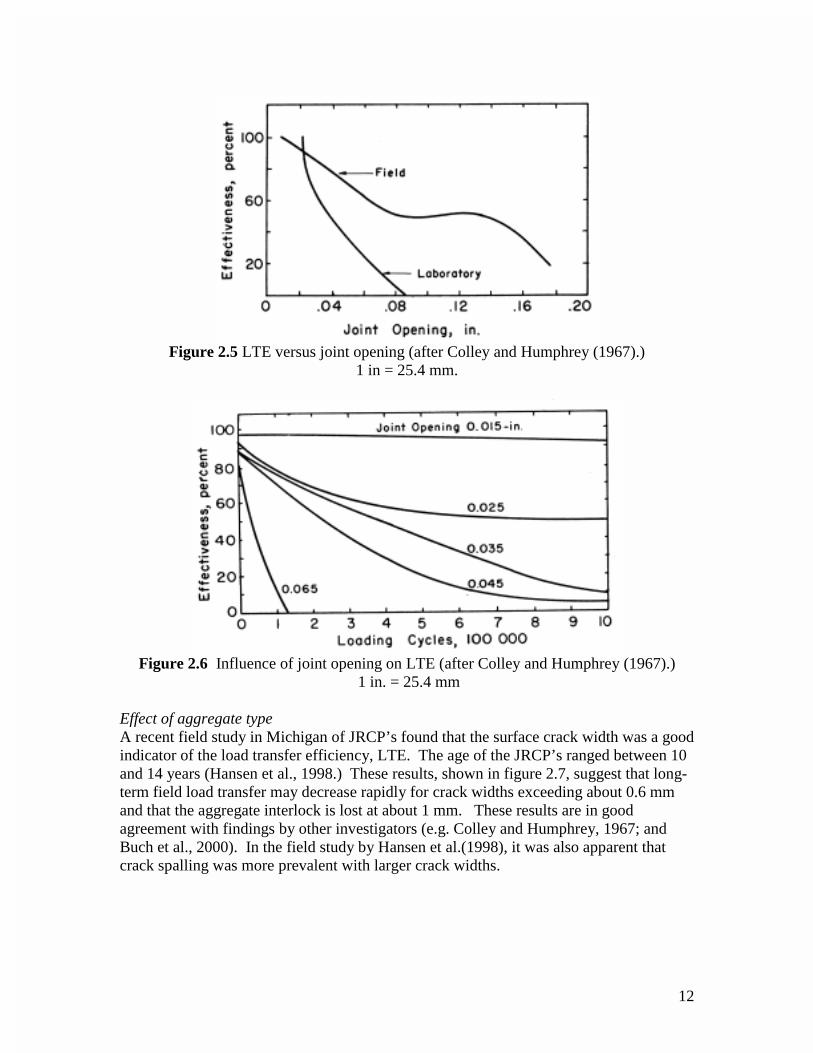
irregular crack surface. However, if the coarse aggregate is weaker than that of the interface zone, the crack will penetrate through the aggregate resulting in a straight and smoother crack surface. Figure 2.4 illustrates the effect of load level and overall crack roughness on aggregate interlock (Pittman, 1996). The figure shows two cases of load transfer efficiency where Case 1 relates to large aggregate size, rough vertical crack face, and no slippage, and Case 2 relates to small aggregate size, smooth vertical face, and slippage. In Case 1 the crack width is so large that the two crack faces are not in contact during the unloaded condition. As load is applied, the loaded segment deflects a certain distance before touching the unloaded slab side. This initial deflection is denoted as “slack,” and is a function of crack width. As the load is increased, the loaded slab segment and the unloaded slab segment deflect at the same rate, which indicates high crack face bearing and friction resulting in good load transfer. The load transfer starts at zero for a small load and increases to 80 percent for a large load. Case 2 represents a crack of the same width as in Case 1. However, after the “slack” is overcome, the unloaded side deflects, but slips along the crack face under continuous loading. The load transfer starts at zero and ends at 40 percent. 2.3.2 Material Characteristics Affecting Aggregate Interlock Effect of crack width Evaluation of visual distress surveys made in the field show that the crack widths of the individual cracks vary from hairline to about 1 mm for non-deteriorated transverse cracks. For spalled cracks, the surface crack width is difficult to measure and it is likely very large (e.g. Hansen et al., 1998). Colley and Humphrey (1967) showed that LTE decreases as the joint opening increases (no dowels). This trend was found for both field and laboratory testing. Figure 2.5 shows LTE versus joint opening. These field data are obtained on slabs with thickness’ of 225 mm, joint spacing from 4.6-9.2 m, and modulus of subgrade reaction ranging from 40–52 kPa/mm. The figure shows that the LTE’s obtained in laboratory testing are considerably less than those obtained from field data. However, the overall behavior follows the same trend. Hansen et al. (1998) obtained the same overall trend for Michigan JRCP’s.
11
Figure 2.4 Factors affecting load transfer efficiency due to aggregate interlock, Pittman
(1996). Figure 2.6, obtained from the laboratory study performed by Colley and Humphrey (1967), also shows that the LTE decreases with number of cycles for all crack widths investigated between 0.4 and 1.6 mm. Furthermore, figure 2.6 shows a significant decrease in LTE as the joint opening (crack width) increases from 0.3 to 0.65 mm (0.015 to 0.025 in.) at any load cycle.
12
Figure 2.5 LTE versus joint opening (after Colley and Humphrey (1967).)
1 in = 25.4 mm.
Figure 2.6 Influence of joint opening on LTE (after Colley and Humphrey (1967).)
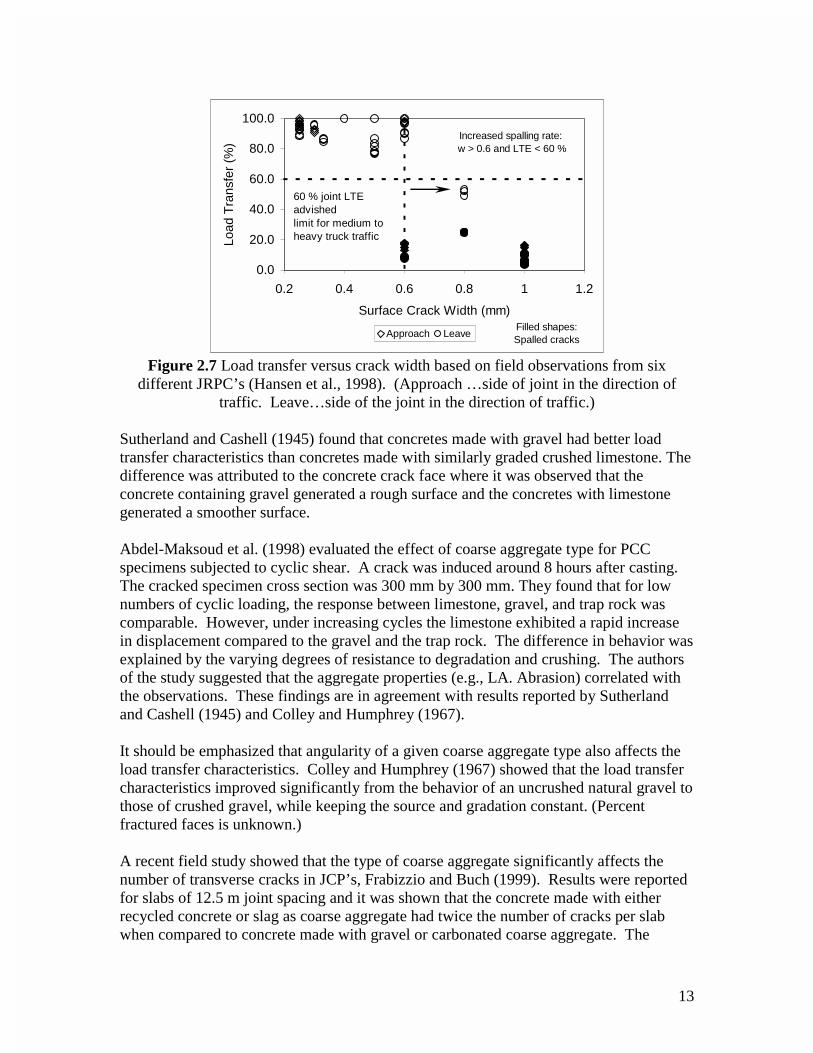
1 in. = 25.4 mm Effect of aggregate type A recent field study in Michigan of JRCP’s found that the surface crack width was a good indicator of the load transfer efficiency, LTE. The age of the JRCP’s ranged between 10 and 14 years (Hansen et al., 1998.) These results, shown in figure 2.7, suggest that long-term field load transfer may decrease rapidly for crack widths exceeding about 0.6 mm and that the aggregate interlock is lost at about 1 mm. These results are in good agreement with findings by other investigators (e.g. Colley and Humphrey, 1967; and Buch et al., 2000). In the field study by Hansen et al.(1998), it was also apparent that crack spalling was more prevalent with larger crack widths.
13
0.0
20.0
40.0
60.0
80.0
100.0
0.2 0.4 0.6 0.8 1 1.2
Surface Crack Width (mm)
Load
Tra
nsfe
r (%
)
Approach LeaveFilled shapes: Spalled cracks
Increased spalling rate: w > 0.6 and LTE < 60 %
60 % joint LTE advished limit for medium to heavy truck traffic
Figure 2.7 Load transfer versus crack width based on field observations from six
different JRPC’s (Hansen et al., 1998). (Approach …side of joint in the direction of traffic. Leave…side of the joint in the direction of traffic.)
Sutherland and Cashell (1945) found that concretes made with gravel had better load transfer characteristics than concretes made with similarly graded crushed limestone. The difference was attributed to the concrete crack face where it was observed that the concrete containing gravel generated a rough surface and the concretes with limestone generated a smoother surface. Abdel-Maksoud et al. (1998) evaluated the effect of coarse aggregate type for PCC specimens subjected to cyclic shear. A crack was induced around 8 hours after casting. The cracked specimen cross section was 300 mm by 300 mm. They found that for low numbers of cyclic loading, the response between limestone, gravel, and trap rock was comparable. However, under increasing cycles the limestone exhibited a rapid increase in displacement compared to the gravel and the trap rock. The difference in behavior was explained by the varying degrees of resistance to degradation and crushing. The authors of the study suggested that the aggregate properties (e.g., LA. Abrasion) correlated with the observations. These findings are in agreement with results reported by Sutherland and Cashell (1945) and Colley and Humphrey (1967). It should be emphasized that angularity of a given coarse aggregate type also affects the load transfer characteristics. Colley and Humphrey (1967) showed that the load transfer characteristics improved significantly from the behavior of an uncrushed natural gravel to those of crushed gravel, while keeping the source and gradation constant. (Percent fractured faces is unknown.) A recent field study showed that the type of coarse aggregate significantly affects the number of transverse cracks in JCP’s, Frabizzio and Buch (1999). Results were reported for slabs of 12.5 m joint spacing and it was shown that the concrete made with either recycled concrete or slag as coarse aggregate had twice the number of cracks per slab when compared to concrete made with gravel or carbonated coarse aggregate. The
14
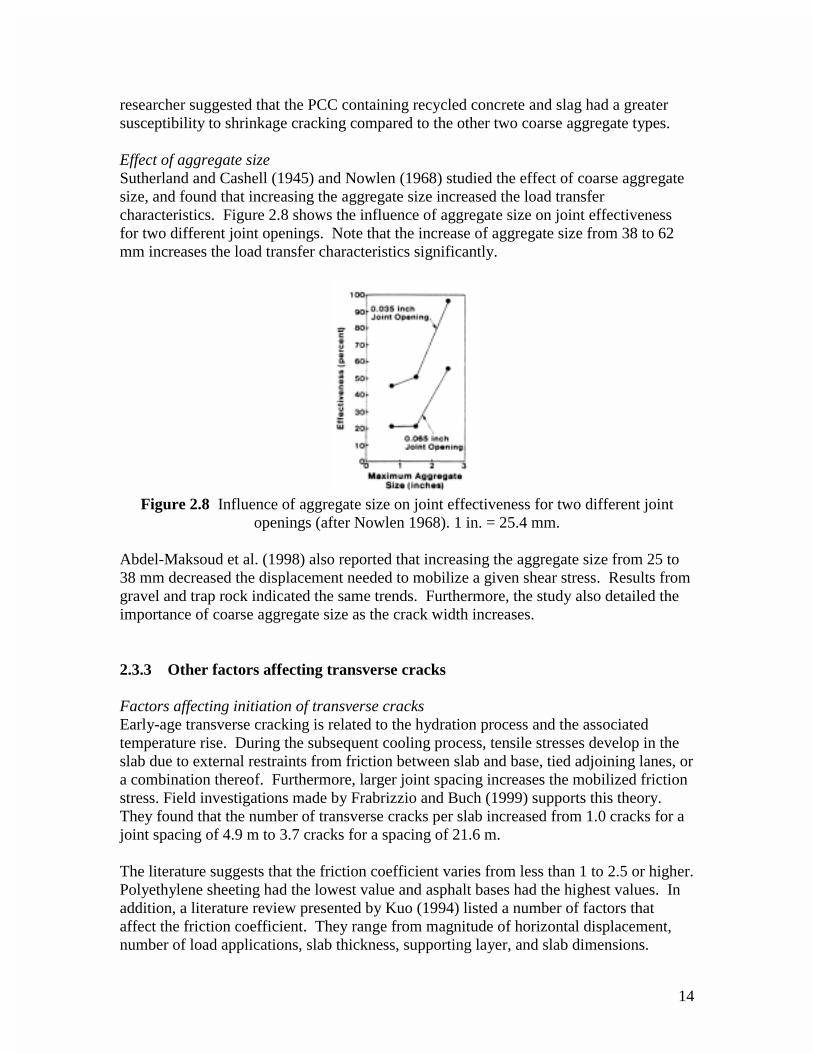
researcher suggested that the PCC containing recycled concrete and slag had a greater susceptibility to shrinkage cracking compared to the other two coarse aggregate types. Effect of aggregate size Sutherland and Cashell (1945) and Nowlen (1968) studied the effect of coarse aggregate size, and found that increasing the aggregate size increased the load transfer characteristics. Figure 2.8 shows the influence of aggregate size on joint effectiveness for two different joint openings. Note that the increase of aggregate size from 38 to 62 mm increases the load transfer characteristics significantly.
Figure 2.8 Influence of aggregate size on joint effectiveness for two different joint
openings (after Nowlen 1968). 1 in. = 25.4 mm. Abdel-Maksoud et al. (1998) also reported that increasing the aggregate size from 25 to 38 mm decreased the displacement needed to mobilize a given shear stress. Results from gravel and trap rock indicated the same trends. Furthermore, the study also detailed the importance of coarse aggregate size as the crack width increases. 2.3.3 Other factors affecting transverse cracks Factors affecting initiation of transverse cracks Early-age transverse cracking is related to the hydration process and the associated temperature rise. During the subsequent cooling process, tensile stresses develop in the slab due to external restraints from friction between slab and base, tied adjoining lanes, or a combination thereof. Furthermore, larger joint spacing increases the mobilized friction stress. Field investigations made by Frabrizzio and Buch (1999) supports this theory. They found that the number of transverse cracks per slab increased from 1.0 cracks for a joint spacing of 4.9 m to 3.7 cracks for a spacing of 21.6 m. The literature suggests that the friction coefficient varies from less than 1 to 2.5 or higher. Polyethylene sheeting had the lowest value and asphalt bases had the highest values. In addition, a literature review presented by Kuo (1994) listed a number of factors that affect the friction coefficient. They range from magnitude of horizontal displacement, number of load applications, slab thickness, supporting layer, and slab dimensions.
15
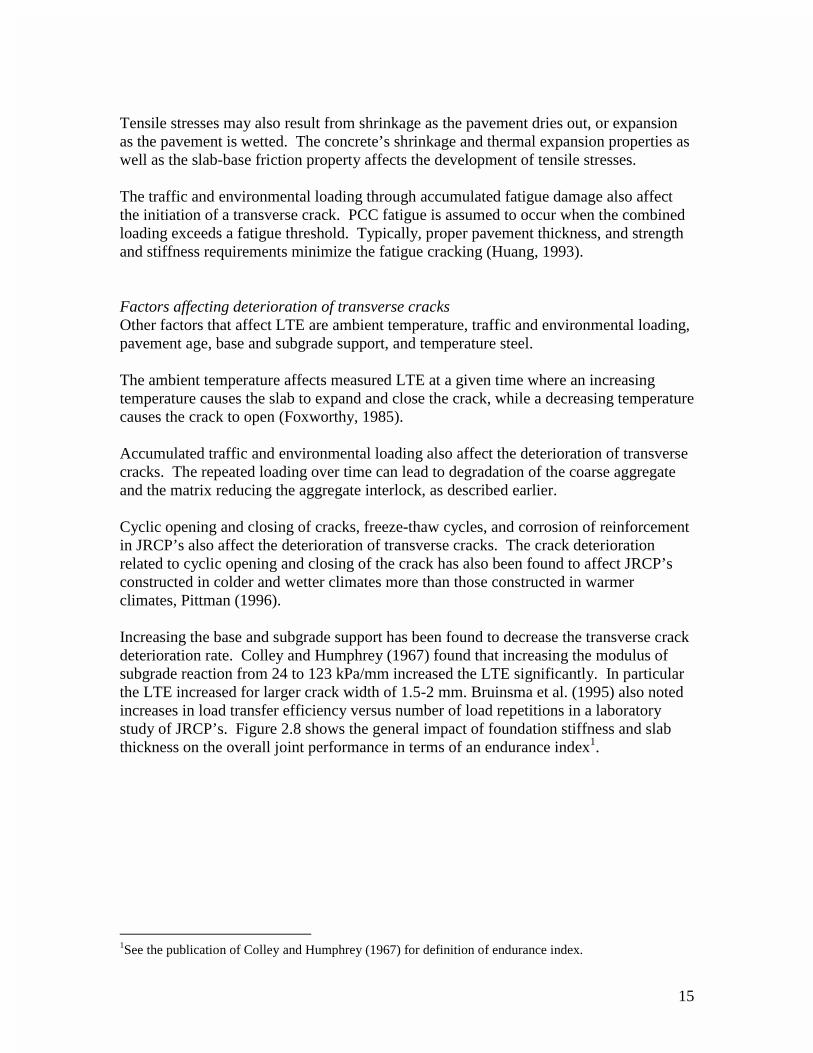
Tensile stresses may also result from shrinkage as the pavement dries out, or expansion as the pavement is wetted. The concrete’s shrinkage and thermal expansion properties as well as the slab-base friction property affects the development of tensile stresses. The traffic and environmental loading through accumulated fatigue damage also affect the initiation of a transverse crack. PCC fatigue is assumed to occur when the combined loading exceeds a fatigue threshold. Typically, proper pavement thickness, and strength and stiffness requirements minimize the fatigue cracking (Huang, 1993). Factors affecting deterioration of transverse cracks Other factors that affect LTE are ambient temperature, traffic and environmental loading, pavement age, base and subgrade support, and temperature steel. The ambient temperature affects measured LTE at a given time where an increasing temperature causes the slab to expand and close the crack, while a decreasing temperature causes the crack to open (Foxworthy, 1985). Accumulated traffic and environmental loading also affect the deterioration of transverse cracks. The repeated loading over time can lead to degradation of the coarse aggregate and the matrix reducing the aggregate interlock, as described earlier. Cyclic opening and closing of cracks, freeze-thaw cycles, and corrosion of reinforcement in JRCP’s also affect the deterioration of transverse cracks. The crack deterioration related to cyclic opening and closing of the crack has also been found to affect JRCP’s constructed in colder and wetter climates more than those constructed in warmer climates, Pittman (1996). Increasing the base and subgrade support has been found to decrease the transverse crack deterioration rate. Colley and Humphrey (1967) found that increasing the modulus of subgrade reaction from 24 to 123 kPa/mm increased the LTE significantly. In particular the LTE increased for larger crack width of 1.5-2 mm. Bruinsma et al. (1995) also noted increases in load transfer efficiency versus number of load repetitions in a laboratory study of JRCP’s. Figure 2.8 shows the general impact of foundation stiffness and slab thickness on the overall joint performance in terms of an endurance index1.
1See the publication of Colley and Humphrey (1967) for definition of endurance index.
16
Figure 2.8 Influence of base stiffness on endurance (after Colley and Humphrey (1967).)
1 in. = 25.4 mm. 100 pci = 27 kPa/mm. In JRCP’s, the amount of tempearture steel was also found to positively effect the load transfer efficiency. However, this study focuses on JPCP’s and a detailed discussion of temperature steel is outside the scope of this study.
17
Chapter 3. Experimental Materials
From the preceding literature review it is clear that aggregate type and gradation are significant factors affecting the concrete fracture behavior as well as the effectiveness of the aggregate interlock during shear loading of a fully developed crack. As discussed in chapter 2, the interrelations between the matrix and the aggregates control how the fracture patterns will form. The main focus of this study is the behavior related to premature cracking induced after the initial joints typically form. At this stage, the matrix has gained significant strength and may cause cracking through a weaker aggregate type. 3.1 Project Phases The laboratory investigation conducted in this project was divided into phase 1 and phase 2. Phase 1 covers the initial aggregate evaluation and categorization based on fracture beam tests. Phase 2 covers slab testing as well as associated beam testing for full categorization of the coarse aggregates. Phase 1: Investigation of fracture properties of pavement concretes containing different coarse aggregate types and sizes. Task 1: The effects of aggregate type and size on fracture behavior will be studied
for: 25 mm max. aggregate size using the following aggregate sources Bundy Hill (Pit # 30-35) – glacial gravel.
Rockwood (Pit # 58-8) – dolomitic limestone. Silica (Pit # 93-3) – limestone. Levy Slag (Pit # 82-22) – blast furnace slag. Martin Aggregates (Pit # 19-55) – glacial gravel. The particle size distribution corresponding to a 6A or 6AA gradation (Gradation according to specifications by the Michigan Department of Transportation, MDOT, with 25-mm nominal max. size)
50 mm max. aggregate size:
Martin Aggregates (Pit # 19-55) – glacial gravel. Rockwood (Pit # 58-8) – dolomitic limestone.
18
Large size blend with size distribution of 40 percent by weight large size aggregates gradation (> 19 mm) and 60 percent 6AA gradation.
The original proposal for phase 1 and task 1 was modified. The evaluation of the blast furnace slag for large size blend was eliminated, as the large size aggregate was not available at the time of testing. Five, instead of four sources were selected for evaluation of the 6AA gradation with a 25mm maximum aggregate size. A glacial gravel was added to the test variables. The PCC fracture behavior was determined from notched beam tests and cylinders. Fracture energy will be obtained from beams. The beam height is 200 mm, the width is 100 mm, and the span length is 965 mm (8x4x38 inches). The notch, 100 mm (4 inches) deep, is saw-cut prior to testing. The procedure is adapted after RILEM (1985). Compressive strength, elastic modulus, and splitting tensile strength were obtained from 150 by 300-mm (6 by 12 in) cylinders according to current American Standard for Testing and Materials, ASTM. Three specimens were used for each test. Standard curing time was 28 days. Task 2: Effect of the development of fracture behavior will be studied for
25 mm max. aggregate size: Bundy Hill (Pit # 30-35) – glacial gravel. Rockwood (Pit # 58-8) – dolomitic limestone. Silica (Pit # 93-3) – limestone. Levy Slag (Pit # 82-22) – blast furnace slag. Martin Aggregates (Pit # 19-55) – glacial gravel.
50 mm max. aggregate size:
Martin Aggregates (Pit # 19-55) – glacial gravel. Rockwood (Pit # 58-8) – dolomitic limestone.
The tests were performed according to the same procedures as listed above. The curing times were 7 and 91 days. The original proposal for phase 1 and task 2 was modified. The evaluation of the blast furnace slag for large size blend was eliminated, as the large size aggregate was not available at the time of testing. Five, instead of three sources were selected for evaluation of the 6AA gradation with a 25mm maximum aggregate size. A glacial gravel and a limestone source were added to the test variables. Phase 2: Investigation of load transfer characteristics across a crack in a PCC slab resting on a 100 mm open graded drainage course (OGDC), a 400 mm sand subbase. The slab is 3.05 m (10 ft.) long, 1.83 m (6 ft.) wide, and 250 mm (10 in.) thick. A total of seven slabs were investigated.
19
Task 1: Evaluate the initiation of a top-down transverse crack at midslab, and
evaluate its load transfer characteristics for increasing crack width when the crack is subjected to a equivalent single axle tire load. Concretes with the following aggregate characteristics will be investigated.
25 mm max. aggregate size:
Levy Slag (Pit # 82-22) – blast furnace slag. Martin Aggregates (Pit # 19-55) – glacial gravel.
Michigan Limestone (Pit # 71-3) - limestone 50 mm max. aggregate size:
Levy Slag (Pit # 82-22) – blast furnace slag. Martin Aggregates (Pit # 19-55) – glacial gravel. Presque Isle (Pit # 71-47) - limestone
Task 2: Evaluate the effect of repeated joint opening and closing on the load
transfer properties 25 mm max. aggregate size:
Levy Slag (Pit # 82-22) – blast furnace slag. Martin Aggregates (Pit # 19-55) – glacial gravel.
Michigan Limestone (Pit # 71-3) - limestone 50 mm max. aggregate size:
Levy Slag (Pit # 82-22) – blast furnace slag. Martin Aggregates (Pit # 19-55) – glacial gravel. Presque Isle (Pit # 71-47) - limestone
Task 3: Evaluate the effect of base types (MDOT Class 3G versus class 4G) on the
load transfer properties 25 mm max. aggregate size:
Levy Slag (Pit # 82-22) – blast furnace slag. The tasks for phase 2 were modified during the project. Initially 8 slabs were to be tested at four individual crack widths (e.g., 0.3, 0.45, 0.6, and 1.0 mm). However, during testing of the first slabs it was determined that additional crack widths needed to be tested in order to cover a larger range of load transfer. It was decided to increase the number of cracks widths to eight or nine per slab (typically 0.3, 0.45, 0.6, 0.9, 1.2, 1.6, 2.0 and 2.5 mm). This increased the number of load repetitions per slab about 50 percent, and due to time constraints the last slab was elimiated. Subtask: 6 fracture beams per slab are tested and evaluated.
20
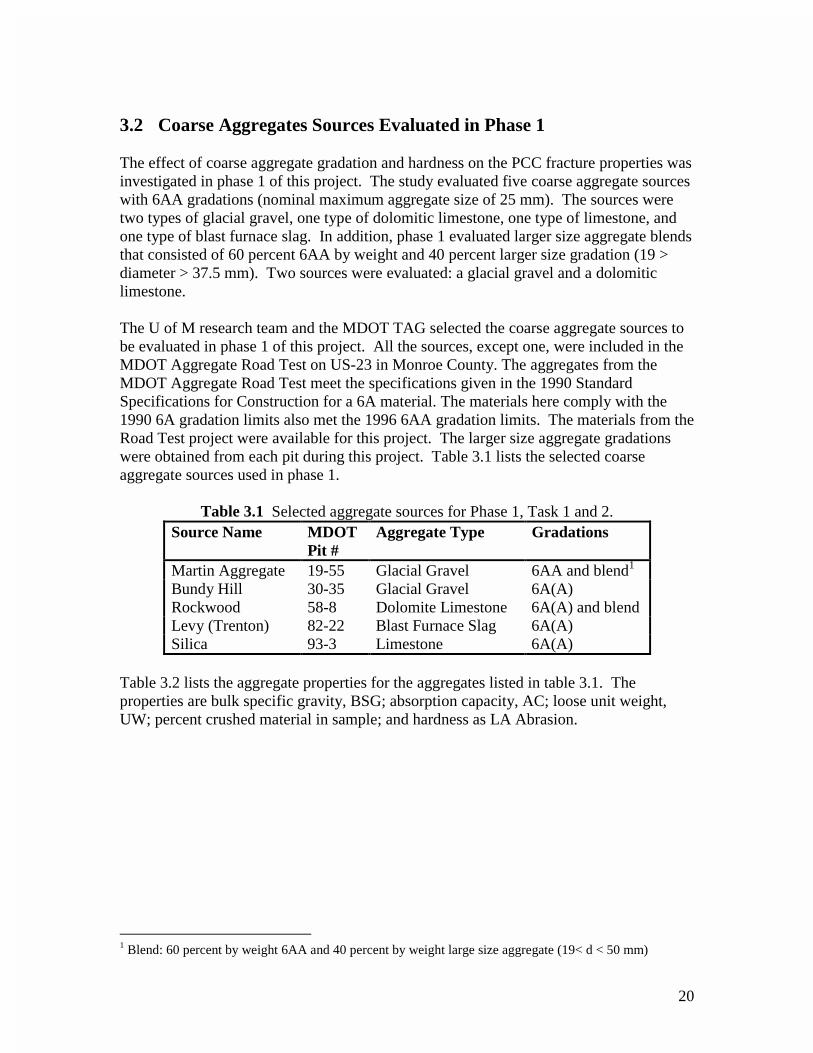
3.2 Coarse Aggregates Sources Evaluated in Phase 1 The effect of coarse aggregate gradation and hardness on the PCC fracture properties was investigated in phase 1 of this project. The study evaluated five coarse aggregate sources with 6AA gradations (nominal maximum aggregate size of 25 mm). The sources were two types of glacial gravel, one type of dolomitic limestone, one type of limestone, and one type of blast furnace slag. In addition, phase 1 evaluated larger size aggregate blends that consisted of 60 percent 6AA by weight and 40 percent larger size gradation (19 > diameter > 37.5 mm). Two sources were evaluated: a glacial gravel and a dolomitic limestone. The U of M research team and the MDOT TAG selected the coarse aggregate sources to be evaluated in phase 1 of this project. All the sources, except one, were included in the MDOT Aggregate Road Test on US-23 in Monroe County. The aggregates from the MDOT Aggregate Road Test meet the specifications given in the 1990 Standard Specifications for Construction for a 6A material. The materials here comply with the 1990 6A gradation limits also met the 1996 6AA gradation limits. The materials from the Road Test project were available for this project. The larger size aggregate gradations were obtained from each pit during this project. Table 3.1 lists the selected coarse aggregate sources used in phase 1.
Table 3.1 Selected aggregate sources for Phase 1, Task 1 and 2. Source Name MDOT
Pit # Aggregate Type Gradations
Martin Aggregate 19-55 Glacial Gravel 6AA and blend1 Bundy Hill 30-35 Glacial Gravel 6A(A) Rockwood 58-8 Dolomite Limestone 6A(A) and blend Levy (Trenton) 82-22 Blast Furnace Slag 6A(A) Silica 93-3 Limestone 6A(A)
Table 3.2 lists the aggregate properties for the aggregates listed in table 3.1. The properties are bulk specific gravity, BSG; absorption capacity, AC; loose unit weight, UW; percent crushed material in sample; and hardness as LA Abrasion.
1 Blend: 60 percent by weight 6AA and 40 percent by weight large size aggregate (19< d < 50 mm)
21
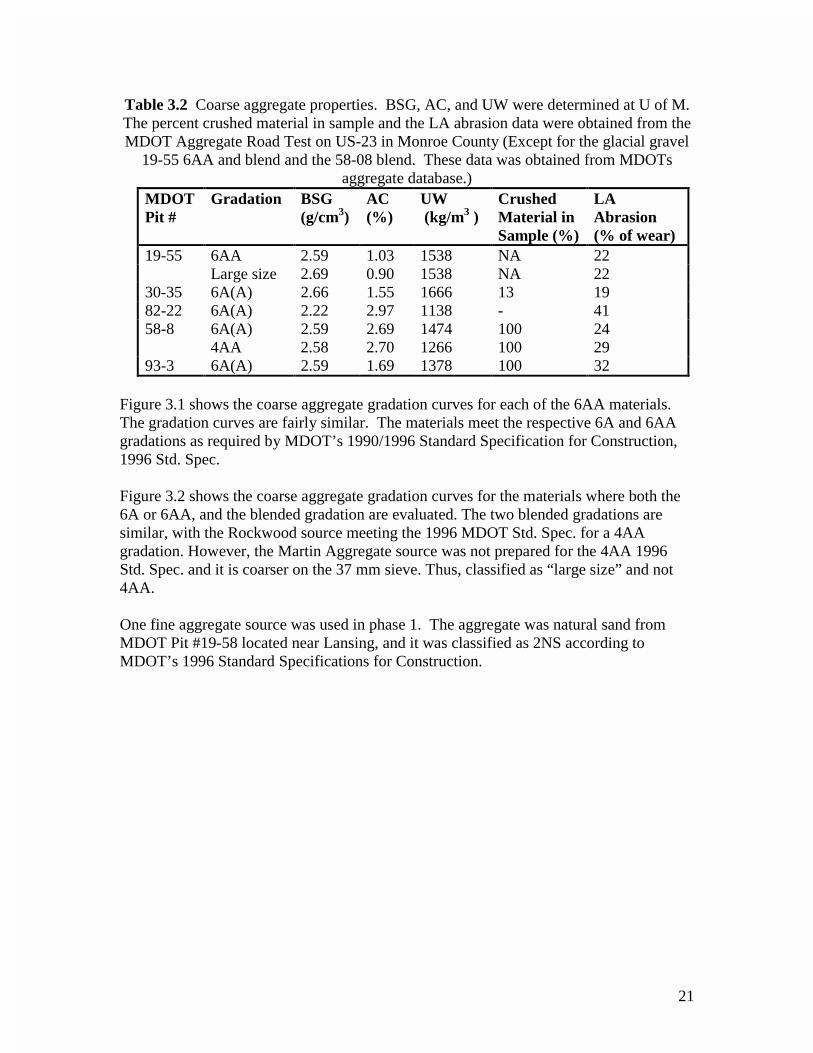
Table 3.2 Coarse aggregate properties. BSG, AC, and UW were determined at U of M. The percent crushed material in sample and the LA abrasion data were obtained from the MDOT Aggregate Road Test on US-23 in Monroe County (Except for the glacial gravel
19-55 6AA and blend and the 58-08 blend. These data was obtained from MDOTs aggregate database.)
MDOT Pit #
Gradation BSG (g/cm3)
AC (%)
UW (kg/m3 )
Crushed Material in Sample (%)
LA Abrasion (% of wear)
19-55 6AA 2.59 1.03 1538 NA 22 Large size 2.69 0.90 1538 NA 22 30-35 6A(A) 2.66 1.55 1666 13 19 82-22 6A(A) 2.22 2.97 1138 - 41 58-8 6A(A) 2.59 2.69 1474 100 24 4AA 2.58 2.70 1266 100 29 93-3 6A(A) 2.59 1.69 1378 100 32
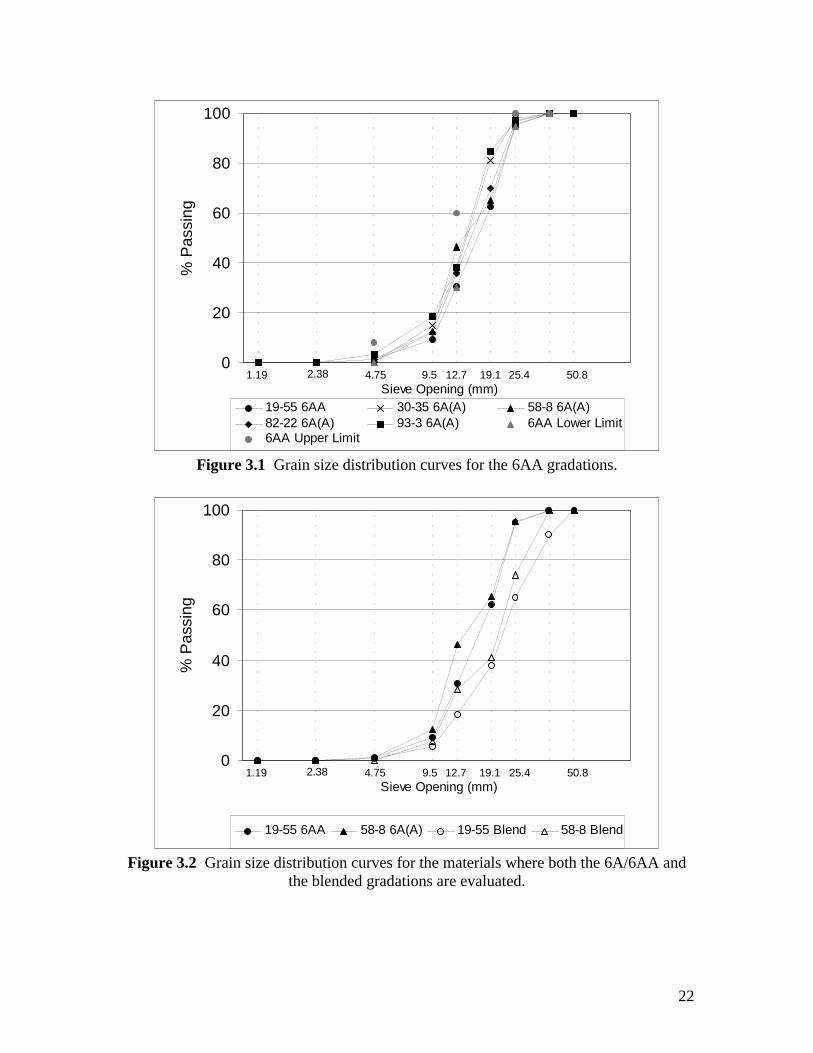
Figure 3.1 shows the coarse aggregate gradation curves for each of the 6AA materials. The gradation curves are fairly similar. The materials meet the respective 6A and 6AA gradations as required by MDOT’s 1990/1996 Standard Specification for Construction, 1996 Std. Spec. Figure 3.2 shows the coarse aggregate gradation curves for the materials where both the 6A or 6AA, and the blended gradation are evaluated. The two blended gradations are similar, with the Rockwood source meeting the 1996 MDOT Std. Spec. for a 4AA gradation. However, the Martin Aggregate source was not prepared for the 4AA 1996 Std. Spec. and it is coarser on the 37 mm sieve. Thus, classified as “large size” and not 4AA. One fine aggregate source was used in phase 1. The aggregate was natural sand from MDOT Pit #19-58 located near Lansing, and it was classified as 2NS according to MDOT’s 1996 Standard Specifications for Construction.
22
0
20
40
60
80
100
Sieve Opening (mm)
% P
assi
ng
19-55 6AA 30-35 6A(A) 58-8 6A(A)82-22 6A(A) 93-3 6A(A) 6AA Lower Limit6AA Upper Limit
50.825.419.112.79.54.752.381.19
Figure 3.1 Grain size distribution curves for the 6AA gradations.
0
20
40
60
80
100
Sieve Opening (mm)
% P
assi
ng
19-55 6AA 58-8 6A(A) 19-55 Blend 58-8 Blend
50.825.419.112.79.54.752.381.19
Figure 3.2 Grain size distribution curves for the materials where both the 6A/6AA and
the blended gradations are evaluated.
23
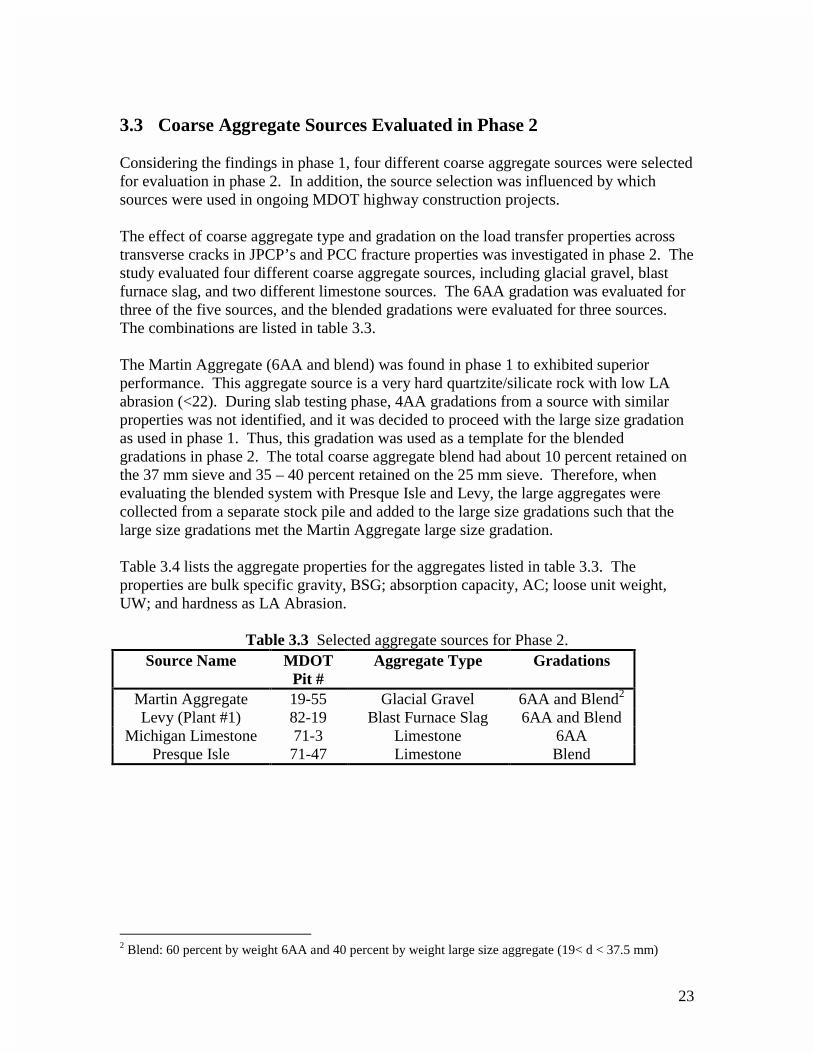
3.3 Coarse Aggregate Sources Evaluated in Phase 2 Considering the findings in phase 1, four different coarse aggregate sources were selected for evaluation in phase 2. In addition, the source selection was influenced by which sources were used in ongoing MDOT highway construction projects. The effect of coarse aggregate type and gradation on the load transfer properties across transverse cracks in JPCP’s and PCC fracture properties was investigated in phase 2. The study evaluated four different coarse aggregate sources, including glacial gravel, blast furnace slag, and two different limestone sources. The 6AA gradation was evaluated for three of the five sources, and the blended gradations were evaluated for three sources. The combinations are listed in table 3.3. The Martin Aggregate (6AA and blend) was found in phase 1 to exhibited superior performance. This aggregate source is a very hard quartzite/silicate rock with low LA abrasion (<22). During slab testing phase, 4AA gradations from a source with similar properties was not identified, and it was decided to proceed with the large size gradation as used in phase 1. Thus, this gradation was used as a template for the blended gradations in phase 2. The total coarse aggregate blend had about 10 percent retained on the 37 mm sieve and 35 – 40 percent retained on the 25 mm sieve. Therefore, when evaluating the blended system with Presque Isle and Levy, the large aggregates were collected from a separate stock pile and added to the large size gradations such that the large size gradations met the Martin Aggregate large size gradation. Table 3.4 lists the aggregate properties for the aggregates listed in table 3.3. The properties are bulk specific gravity, BSG; absorption capacity, AC; loose unit weight, UW; and hardness as LA Abrasion.
Table 3.3 Selected aggregate sources for Phase 2. Source Name MDOT
Pit # Aggregate Type Gradations
Martin Aggregate 19-55 Glacial Gravel 6AA and Blend2 Levy (Plant #1) 82-19 Blast Furnace Slag 6AA and Blend
Michigan Limestone 71-3 Limestone 6AA Presque Isle 71-47 Limestone Blend
2 Blend: 60 percent by weight 6AA and 40 percent by weight large size aggregate (19< d < 37.5 mm)
24
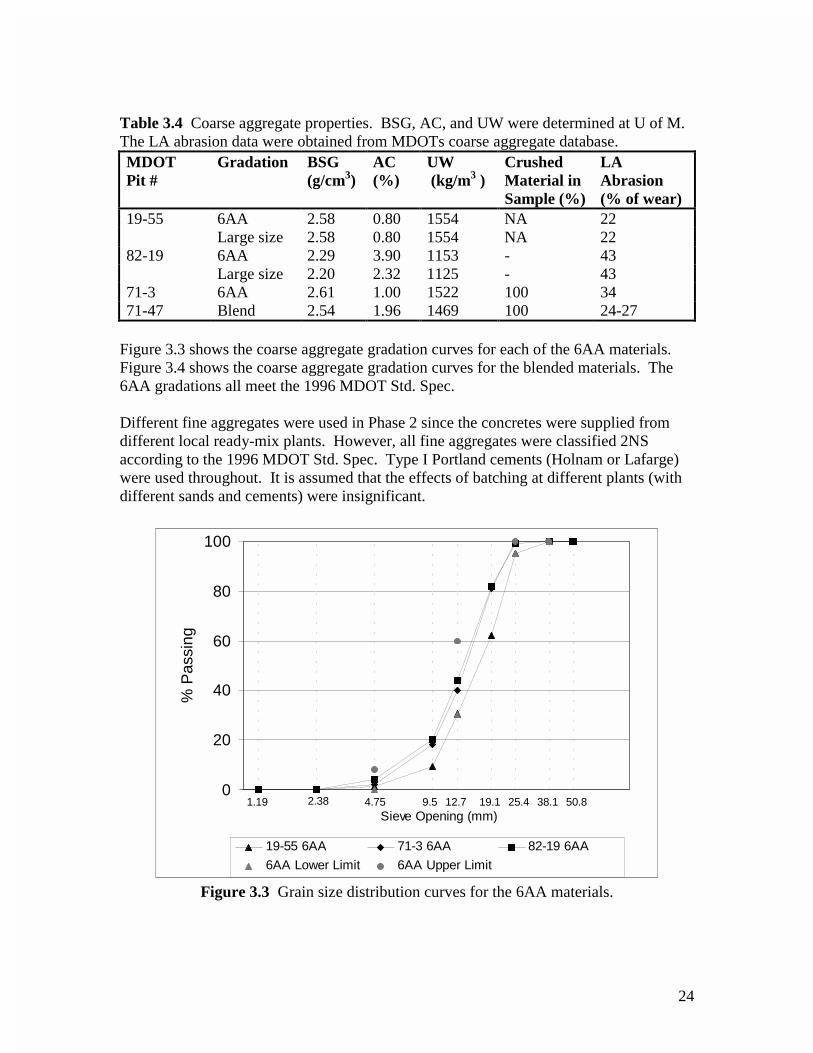
Table 3.4 Coarse aggregate properties. BSG, AC, and UW were determined at U of M. The LA abrasion data were obtained from MDOTs coarse aggregate database. MDOT Pit #
Gradation BSG (g/cm3)
AC (%)
UW (kg/m3 )
Crushed Material in Sample (%)
LA Abrasion (% of wear)
19-55 6AA 2.58 0.80 1554 NA 22 Large size 2.58 0.80 1554 NA 22 82-19 6AA 2.29 3.90 1153 - 43 Large size 2.20 2.32 1125 - 43 71-3 6AA 2.61 1.00 1522 100 34 71-47 Blend 2.54 1.96 1469 100 24-27
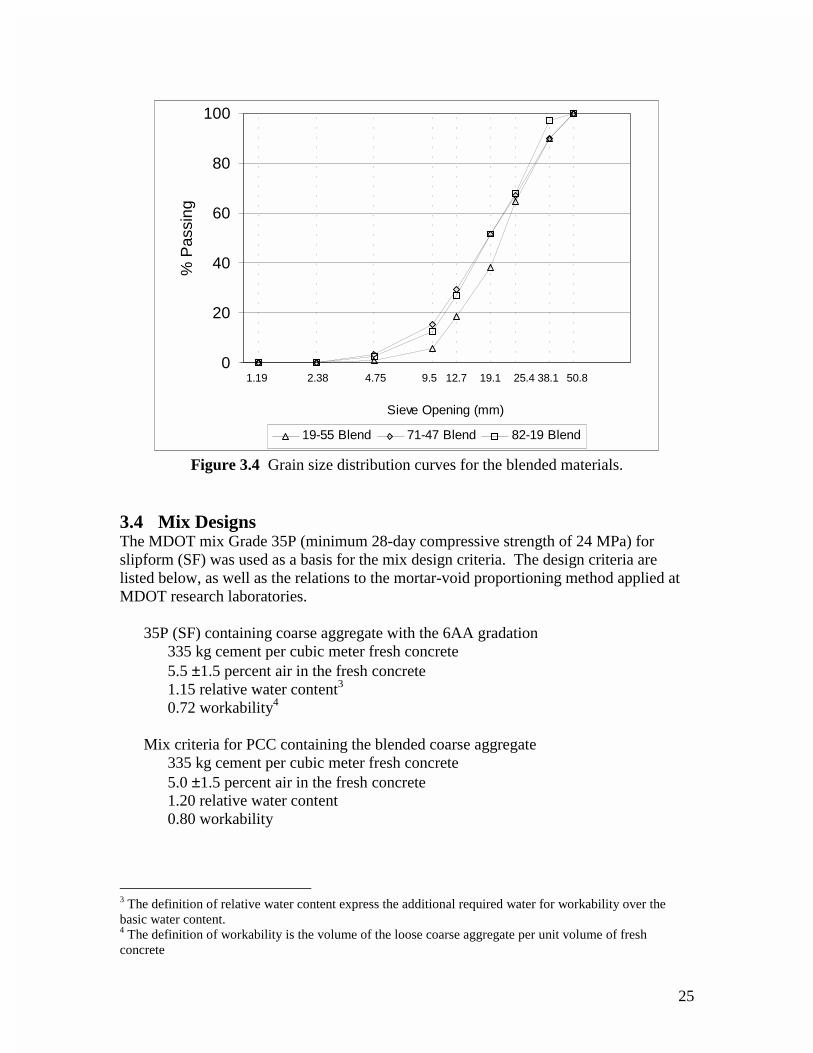
Figure 3.3 shows the coarse aggregate gradation curves for each of the 6AA materials. Figure 3.4 shows the coarse aggregate gradation curves for the blended materials. The 6AA gradations all meet the 1996 MDOT Std. Spec. Different fine aggregates were used in Phase 2 since the concretes were supplied from different local ready-mix plants. However, all fine aggregates were classified 2NS according to the 1996 MDOT Std. Spec. Type I Portland cements (Holnam or Lafarge) were used throughout. It is assumed that the effects of batching at different plants (with different sands and cements) were insignificant.
0
20
40
60
80
100
Sieve Opening (mm)
% P
assi
ng
19-55 6AA 71-3 6AA 82-19 6AA
6AA Lower Limit 6AA Upper Limit
50.838.125.419.112.79.54.752.381.19
Figure 3.3 Grain size distribution curves for the 6AA materials.
25
0
20
40
60
80
100
Sieve Opening (mm)
% P
assi
ng
19-55 Blend 71-47 Blend 82-19 Blend
50.838.125.419.112.79.54.752.381.19
Figure 3.4 Grain size distribution curves for the blended materials.
3.4 Mix Designs The MDOT mix Grade 35P (minimum 28-day compressive strength of 24 MPa) for slipform (SF) was used as a basis for the mix design criteria. The design criteria are listed below, as well as the relations to the mortar-void proportioning method applied at MDOT research laboratories.
35P (SF) containing coarse aggregate with the 6AA gradation 335 kg cement per cubic meter fresh concrete 5.5 ±1.5 percent air in the fresh concrete 1.15 relative water content3 0.72 workability4
Mix criteria for PCC containing the blended coarse aggregate
335 kg cement per cubic meter fresh concrete 5.0 ±1.5 percent air in the fresh concrete 1.20 relative water content 0.80 workability
3 The definition of relative water content express the additional required water for workability over the basic water content. 4 The definition of workability is the volume of the loose coarse aggregate per unit volume of fresh concrete
26
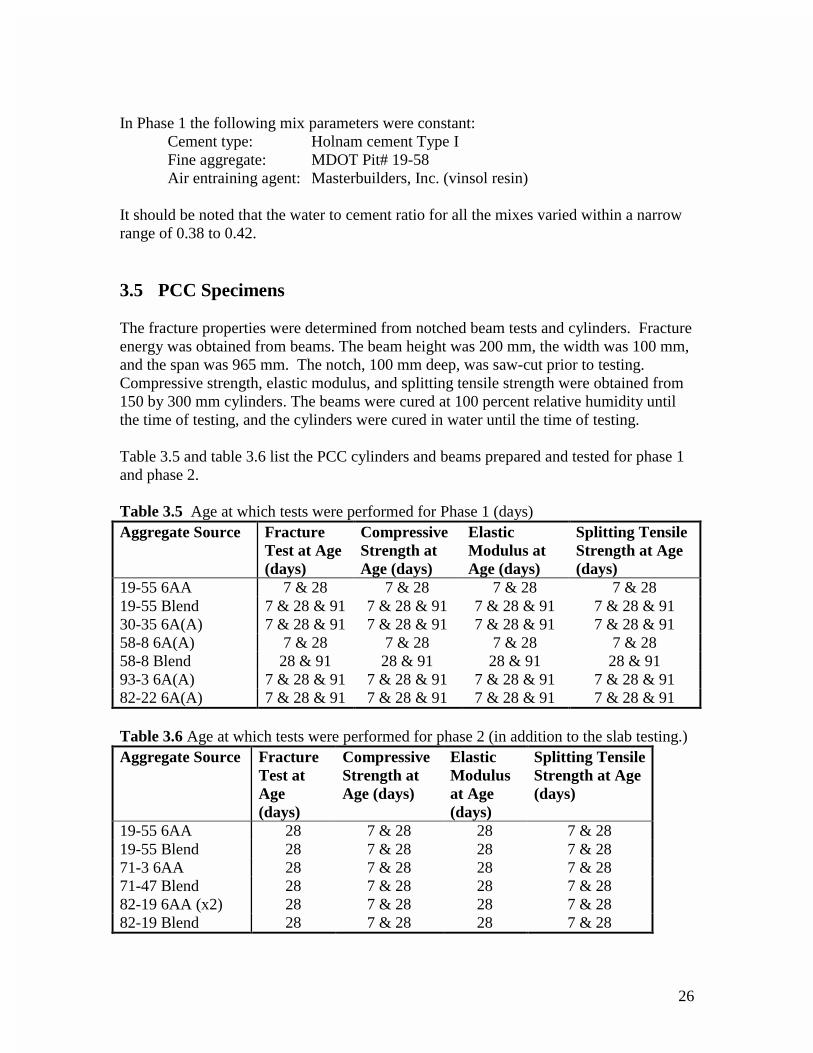
In Phase 1 the following mix parameters were constant: Cement type: Holnam cement Type I Fine aggregate: MDOT Pit# 19-58 Air entraining agent: Masterbuilders, Inc. (vinsol resin) It should be noted that the water to cement ratio for all the mixes varied within a narrow range of 0.38 to 0.42. 3.5 PCC Specimens The fracture properties were determined from notched beam tests and cylinders. Fracture energy was obtained from beams. The beam height was 200 mm, the width was 100 mm, and the span was 965 mm. The notch, 100 mm deep, was saw-cut prior to testing. Compressive strength, elastic modulus, and splitting tensile strength were obtained from 150 by 300 mm cylinders. The beams were cured at 100 percent relative humidity until the time of testing, and the cylinders were cured in water until the time of testing. Table 3.5 and table 3.6 list the PCC cylinders and beams prepared and tested for phase 1 and phase 2. Table 3.5 Age at which tests were performed for Phase 1 (days) Aggregate Source Fracture
Test at Age (days)
Compressive Strength at Age (days)
Elastic Modulus at Age (days)
Splitting Tensile Strength at Age (days)
19-55 6AA 7 & 28 7 & 28 7 & 28 7 & 28 19-55 Blend 7 & 28 & 91 7 & 28 & 91 7 & 28 & 91 7 & 28 & 91 30-35 6A(A) 7 & 28 & 91 7 & 28 & 91 7 & 28 & 91 7 & 28 & 91 58-8 6A(A) 7 & 28 7 & 28 7 & 28 7 & 28 58-8 Blend 28 & 91 28 & 91 28 & 91 28 & 91 93-3 6A(A) 7 & 28 & 91 7 & 28 & 91 7 & 28 & 91 7 & 28 & 91 82-22 6A(A) 7 & 28 & 91 7 & 28 & 91 7 & 28 & 91 7 & 28 & 91 Table 3.6 Age at which tests were performed for phase 2 (in addition to the slab testing.) Aggregate Source Fracture
Test at Age (days)
Compressive Strength at Age (days)
Elastic Modulus at Age (days)
Splitting Tensile Strength at Age (days)
19-55 6AA 28 7 & 28 28 7 & 28 19-55 Blend 28 7 & 28 28 7 & 28 71-3 6AA 28 7 & 28 28 7 & 28 71-47 Blend 28 7 & 28 28 7 & 28 82-19 6AA (x2) 28 7 & 28 28 7 & 28 82-19 Blend 28 7 & 28 28 7 & 28
27
The mechanical properties were performed according to the following standards. • PCC compressive strength according to ASTM C 39. • PCC elastic modulus according to ASTM C 469. • PCC splitting tensile strength according to ASTM C 496 • PCC fracture energy as outlined in RILEM 50-FCM.
28
Chapter 4. Specialized Test Procedures used in Phase 1 and Phase 2
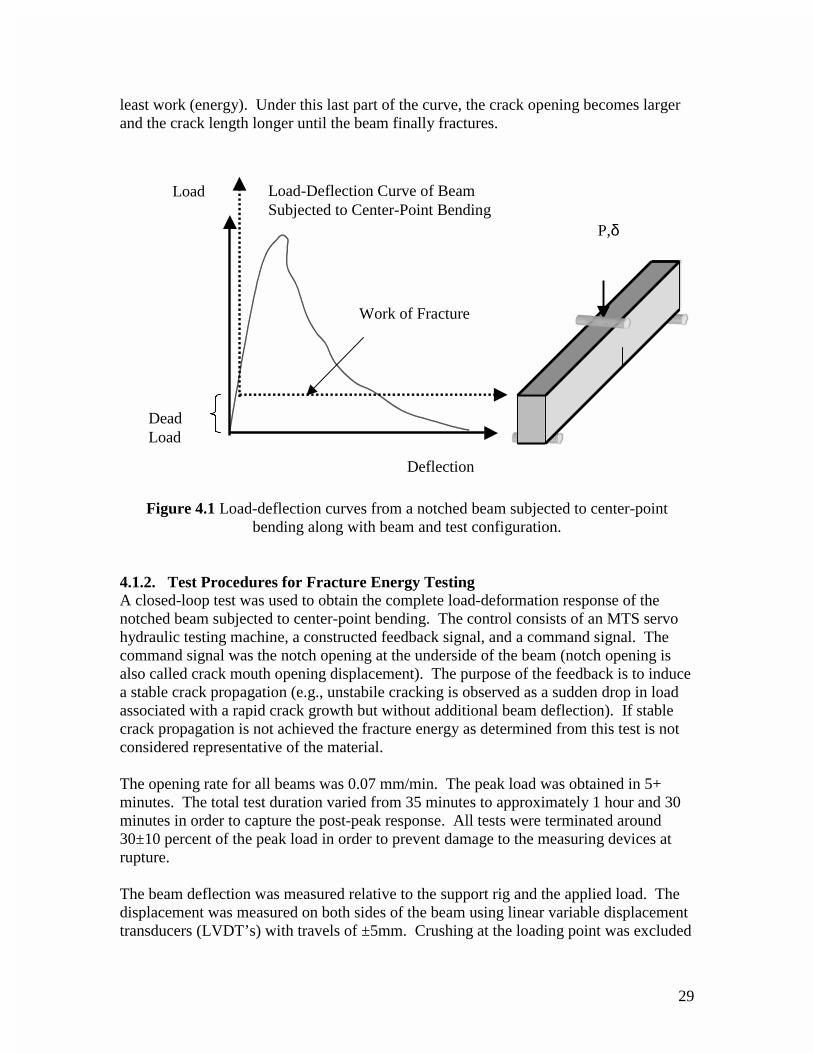
Several of the tests performed in phase 1 and phase 2 of this project are not traditionally executed at industrial research laboratories. This chapter describes in detail the test procedures and calculation methods. First, the testing facility and test procedure are described for determining the PCC’s resistance to crack propagation and the method for calculating the fracture properties PCC fracture energy and fracture toughness. This test is performed in both phase 1 and phase 2. Second, the testing facility and the test procedures used in the large-scale slab testing program are described. The tests include load transfer, modulus of subgrade reaction, slab separation, and free edge loading. These tests are performed in phase 2. 4.1. Test Procedure and Calculation of Fracture Energy The following section offers a definition of the fracture energy, which is a fracture property that represents the work required to completely separate the material into two. The parameter, fracture energy, is the most common parameter used in the literature when comparing the fracture behavior of different concretes. The fracture energy can quantify the effect of a material characteristic and its levels on the concrete fracture behavior. 4.1.1. Fracture Mechanic Properties The PCC fracture energy is proposed as a method to quantify the quality of the coarse aggregate in the concrete. Fracture energy can be determined from the complete load-deflection response of a notched beam subjected to center-point bending such as illustrated in figure 4.1 (RILEM, 1985). The procedure is described in several textbooks (Karihaloo, 1995; and Shah et al., 1995). GF calculated from this test is sometimes referred to as specific fracture energy, however, this report will use the term fracture energy. The notch ensures the location of cracking and the development of only one macro crack. The material outside the crack plane is only slightly affected by the crack propagation. The property, GF, is the area under the load-deflection curve (work-of-fracture) divided by the initial cross-section area at the notch. The beam is tested in displacement control in order to determine the complete load-deflection curve. This method of determining fracture energy fall in the category of NLFM as it considers the complete and stabile development of crack. When the crack meets an aggregate particle it may be stopped until tensile overloading occurs where either the aggregate or the aggregate/matrix bond fails and crack propagation continues. A crack will always propagate in the direction that requires the
29
least work (energy). Under this last part of the curve, the crack opening becomes larger and the crack length longer until the beam finally fractures.
Figure 4.1 Load-deflection curves from a notched beam subjected to center-point bending along with beam and test configuration.
4.1.2. Test Procedures for Fracture Energy Testing A closed-loop test was used to obtain the complete load-deformation response of the notched beam subjected to center-point bending. The control consists of an MTS servo hydraulic testing machine, a constructed feedback signal, and a command signal. The command signal was the notch opening at the underside of the beam (notch opening is also called crack mouth opening displacement). The purpose of the feedback is to induce a stable crack propagation (e.g., unstabile cracking is observed as a sudden drop in load associated with a rapid crack growth but without additional beam deflection). If stable crack propagation is not achieved the fracture energy as determined from this test is not considered representative of the material. The opening rate for all beams was 0.07 mm/min. The peak load was obtained in 5+ minutes. The total test duration varied from 35 minutes to approximately 1 hour and 30 minutes in order to capture the post-peak response. All tests were terminated around 30±10 percent of the peak load in order to prevent damage to the measuring devices at rupture. The beam deflection was measured relative to the support rig and the applied load. The displacement was measured on both sides of the beam using linear variable displacement transducers (LVDT’s) with travels of ±5mm. Crushing at the loading point was excluded
Load-Deflection Curve of Beam Subjected to Center-Point Bending
Dead Load
Work of Fracture
Load
Deflection
P,δ
30
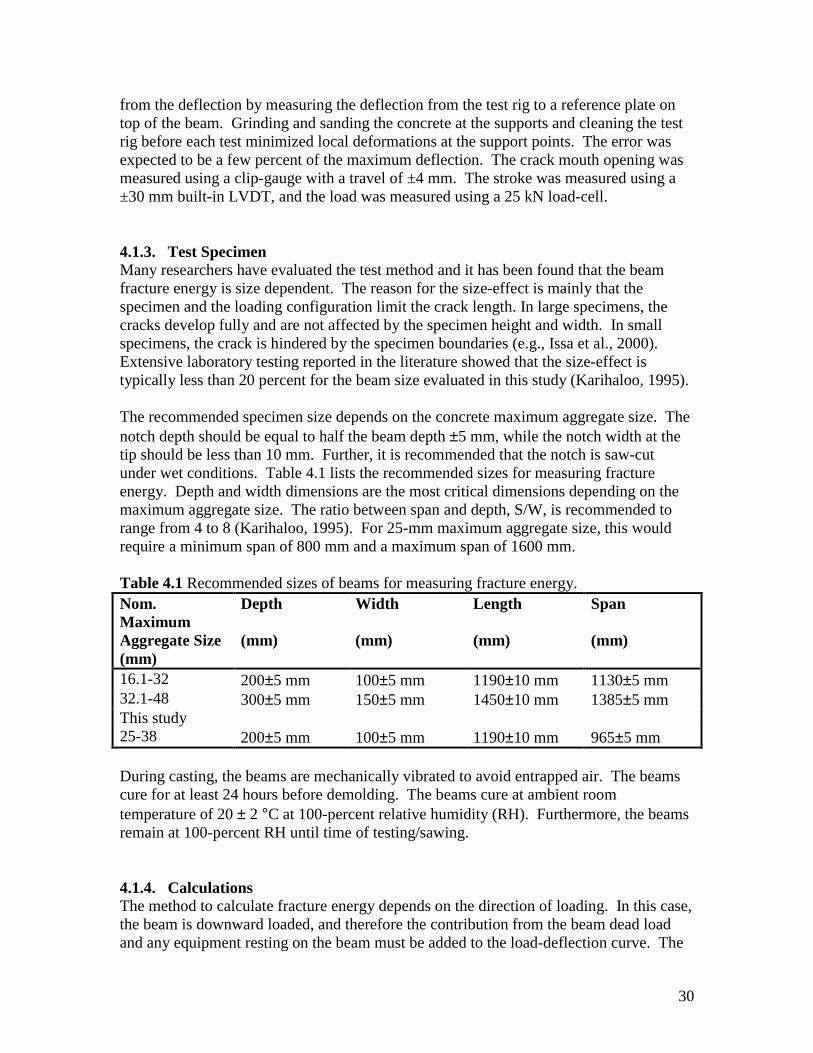
from the deflection by measuring the deflection from the test rig to a reference plate on top of the beam. Grinding and sanding the concrete at the supports and cleaning the test rig before each test minimized local deformations at the support points. The error was expected to be a few percent of the maximum deflection. The crack mouth opening was measured using a clip-gauge with a travel of ±4 mm. The stroke was measured using a ±30 mm built-in LVDT, and the load was measured using a 25 kN load-cell. 4.1.3. Test Specimen Many researchers have evaluated the test method and it has been found that the beam fracture energy is size dependent. The reason for the size-effect is mainly that the specimen and the loading configuration limit the crack length. In large specimens, the cracks develop fully and are not affected by the specimen height and width. In small specimens, the crack is hindered by the specimen boundaries (e.g., Issa et al., 2000). Extensive laboratory testing reported in the literature showed that the size-effect is typically less than 20 percent for the beam size evaluated in this study (Karihaloo, 1995). The recommended specimen size depends on the concrete maximum aggregate size. The notch depth should be equal to half the beam depth ±5 mm, while the notch width at the tip should be less than 10 mm. Further, it is recommended that the notch is saw-cut under wet conditions. Table 4.1 lists the recommended sizes for measuring fracture energy. Depth and width dimensions are the most critical dimensions depending on the maximum aggregate size. The ratio between span and depth, S/W, is recommended to range from 4 to 8 (Karihaloo, 1995). For 25-mm maximum aggregate size, this would require a minimum span of 800 mm and a maximum span of 1600 mm. Table 4.1 Recommended sizes of beams for measuring fracture energy. Nom. Maximum Aggregate Size (mm)
Depth (mm)
Width (mm)
Length (mm)
Span (mm)
16.1-32 200±5 mm 100±5 mm 1190±10 mm 1130±5 mm 32.1-48 300±5 mm 150±5 mm 1450±10 mm 1385±5 mm This study 25-38 200±5 mm 100±5 mm 1190±10 mm 965±5 mm During casting, the beams are mechanically vibrated to avoid entrapped air. The beams cure for at least 24 hours before demolding. The beams cure at ambient room temperature of 20 ± 2 °C at 100-percent relative humidity (RH). Furthermore, the beams remain at 100-percent RH until time of testing/sawing. 4.1.4. Calculations The method to calculate fracture energy depends on the direction of loading. In this case, the beam is downward loaded, and therefore the contribution from the beam dead load and any equipment resting on the beam must be added to the load-deflection curve. The
31
additional load is transformed into an equivalent single point load acting at the center and is added to the measured load. At the same time the associated deflection from this load is estimated using the initial slope of the measured load-deflection curve. The fracture energy is calculated from the work-of-fracture. The fracture energy can be calculated as:
( ) ( )A
FFGGG
loaddeadi
loaddeadiloaddead
FmeasuredFF
∑ −−− +⋅+
=+=δδ
(4.1)
where GF is the fracture energy (N/mm or N/m); Fi is the load at point i (N); δi is the deflection at point i (mm); Fdead load is the load associated with the beam dead load (N); δdead load is the associated estimated deflection (mm), and A is the initial cross section area at the notch (mm2). The test is typically terminated before complete beam separation occurs. Therefore, it is necessary to estimate the remaining part of the load-deflection curve in order to obtain GF. This part of the curve corresponds to the area from the last measured deflection to the deflection at zero-load. The energy can be estimated using an analytical beam model for fictitious crack propagation assuming a parabolic descending branch (Ulfkjær et al., 1990). Note this is also an NLFM model however based on the Hillerborg concepts. The load-deflection relation is:
Fi = Flast ⋅δlast
δi
, Fi ≥ Flast (4.2)
where Flast is the last measured load (N), and δlast is the associated deflection (mm). Integrating this relation from δlast to δ ⇒ ∞ yields:
GFtail =
Flast ⋅ δlast
A (N/mm or N/m) (4.3)
This contribution is added to the previous calculated fracture energy. 4.2. Test Procedure for Load Transfer Properties of Transverse
Cracks in Slabs-on-Grade The effects of the coarse aggregate properties on the load transfer properties across a transverse crack in a slab-on-grade were determined in phase 2. The goal was to obtain the load transfer properties in a laboratory facility that as much as possible resembles idealized field conditions. Considering experience gained from laboratory studies (e.g., Colley and Humphrey, 1967; Bruinsma et al., 1995; and Buch et al., 2000) reported in the literature the following conditions were established as critical for the success of the testing program:
32
• The laboratory slab deflections should resemble field slab deflections for similar foundation stiffnesses.
• The slab length of either side of the crack should approach 1.50 m (60 in.) to achieve a realistic deflection basin.
• The range of crack width investigated should represent the crack widths observed in the field.
• The weakened section should be as thick as possible to obtain the largest possible effective slab thickness.
• The loading point should be at least 0.6 m (2 feet) from the shoulders. • The loading point should be lined up with the transverse crack such that free edge
deflection can be compared with Westergaard’s closed-form solution. • The slab-base interaction should resemble field conditions. • Loss of support at the cracks should be quantified if occurring. • The crack should be generated vertically through the slab thickness – tensile cracking
along a weakened section. • The transverse crack should be generated at an age later than where the transverse
joints would normally form, and where the effect of aggregate source on the fracture pattern would be detectable.
• The joint spacing should be able to remain constant during loading. To fulfill these criteria a large-scale slab testing facility is needed, where the slab can be cast directly on the foundation. In addition, the slab must permanently be attached to a horizontal actuator such that joint displacement can be fixed during testing (e.g., if constant load is applied a significant crack opening and closing will occur during the wheel load application.) This aspect will be discussed in detail in the analysis of the slab data. A large-scale slab testing facility was specially developed to accommodate the criteria established for the testing program. The test equipment was developed as a joint venture between the University of Michigan and the MTS Systems Corporation. Figure 4.2 shows the overview of the testing facility. It consists of a horizontal and a vertical frame, that each serves as reactions for the horizontal and vertical actuator, respectively. The maximum capacity of the horizontal actuator was 1100 kN in compression and 550 kN in tension with a stroke of ±76 mm (±3 in.). The vertical load maximum compression capacity was 49 kN with a stroke of ±63 mm (±2.5 in.). The actuator capacities was selected such that the vertical load would be able to simulate ½ ESAL equal to 40 kN (9000 lbs), and such that the horizontal actuator would be able to create the transverse crack in a PCC with a tensile strength of about 1.0 to 1.5 MPa. This maximum stress level was assumed adequate to create the transverse crack when the concrete was about 7 to 10 days old.
33
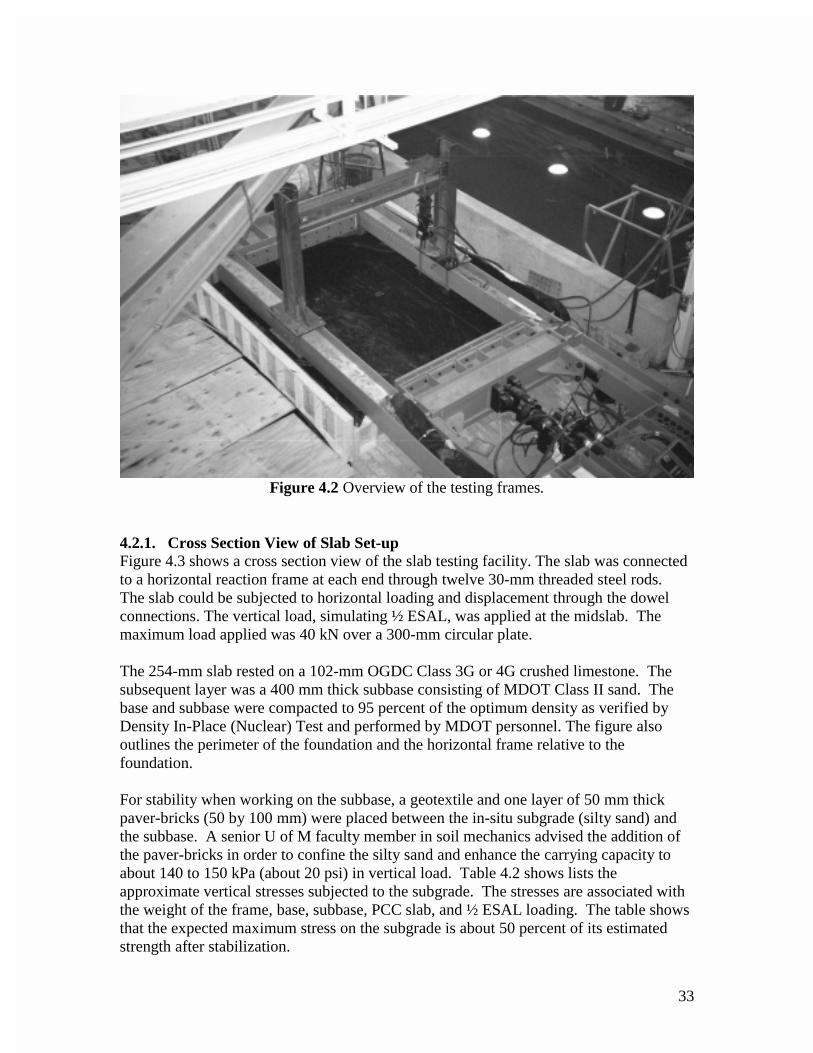
Figure 4.2 Overview of the testing frames.
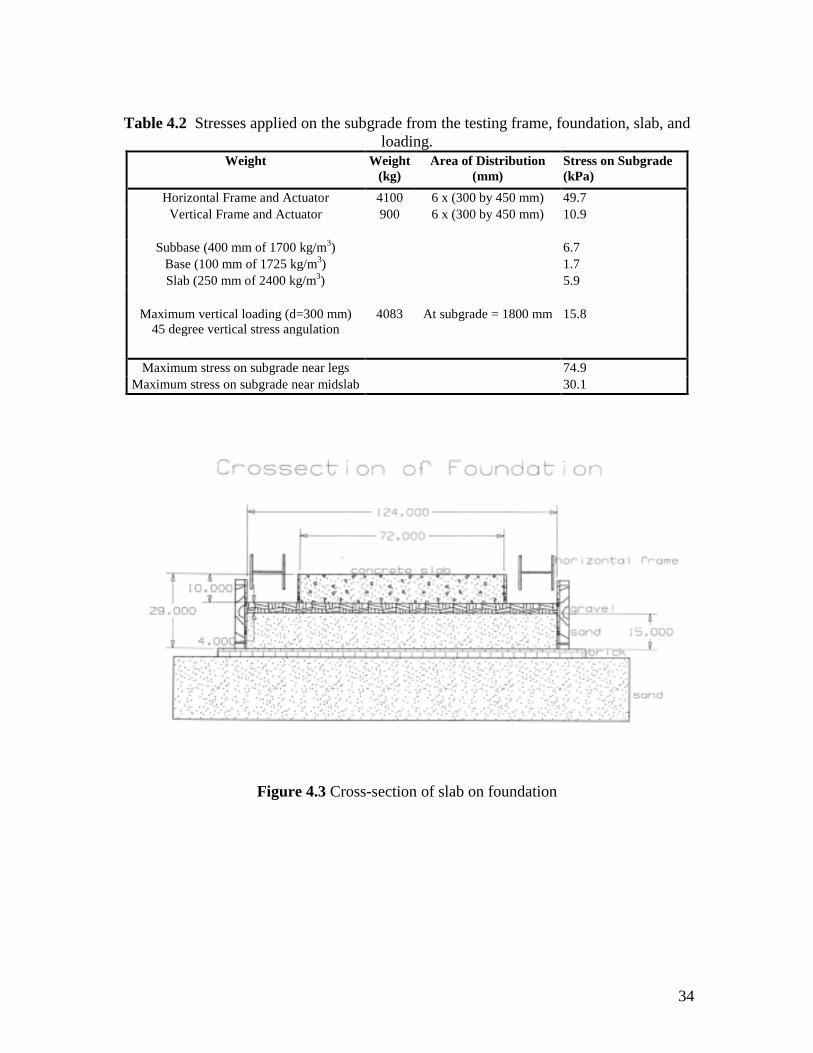
4.2.1. Cross Section View of Slab Set-up Figure 4.3 shows a cross section view of the slab testing facility. The slab was connected to a horizontal reaction frame at each end through twelve 30-mm threaded steel rods. The slab could be subjected to horizontal loading and displacement through the dowel connections. The vertical load, simulating ½ ESAL, was applied at the midslab. The maximum load applied was 40 kN over a 300-mm circular plate. The 254-mm slab rested on a 102-mm OGDC Class 3G or 4G crushed limestone. The subsequent layer was a 400 mm thick subbase consisting of MDOT Class II sand. The base and subbase were compacted to 95 percent of the optimum density as verified by Density In-Place (Nuclear) Test and performed by MDOT personnel. The figure also outlines the perimeter of the foundation and the horizontal frame relative to the foundation. For stability when working on the subbase, a geotextile and one layer of 50 mm thick paver-bricks (50 by 100 mm) were placed between the in-situ subgrade (silty sand) and the subbase. A senior U of M faculty member in soil mechanics advised the addition of the paver-bricks in order to confine the silty sand and enhance the carrying capacity to about 140 to 150 kPa (about 20 psi) in vertical load. Table 4.2 shows lists the approximate vertical stresses subjected to the subgrade. The stresses are associated with the weight of the frame, base, subbase, PCC slab, and ½ ESAL loading. The table shows that the expected maximum stress on the subgrade is about 50 percent of its estimated strength after stabilization.
34
Table 4.2 Stresses applied on the subgrade from the testing frame, foundation, slab, and
loading. Weight Weight
(kg) Area of Distribution
(mm) Stress on Subgrade (kPa)
Horizontal Frame and Actuator 4100 6 x (300 by 450 mm) 49.7 Vertical Frame and Actuator 900 6 x (300 by 450 mm) 10.9
Subbase (400 mm of 1700 kg/m3) 6.7
Base (100 mm of 1725 kg/m3) 1.7 Slab (250 mm of 2400 kg/m3)
5.9
Maximum vertical loading (d=300 mm) 45 degree vertical stress angulation
4083 At subgrade = 1800 mm 15.8
Maximum stress on subgrade near legs 74.9 Maximum stress on subgrade near midslab
30.1
Figure 4.3 Cross-section of slab on foundation
35
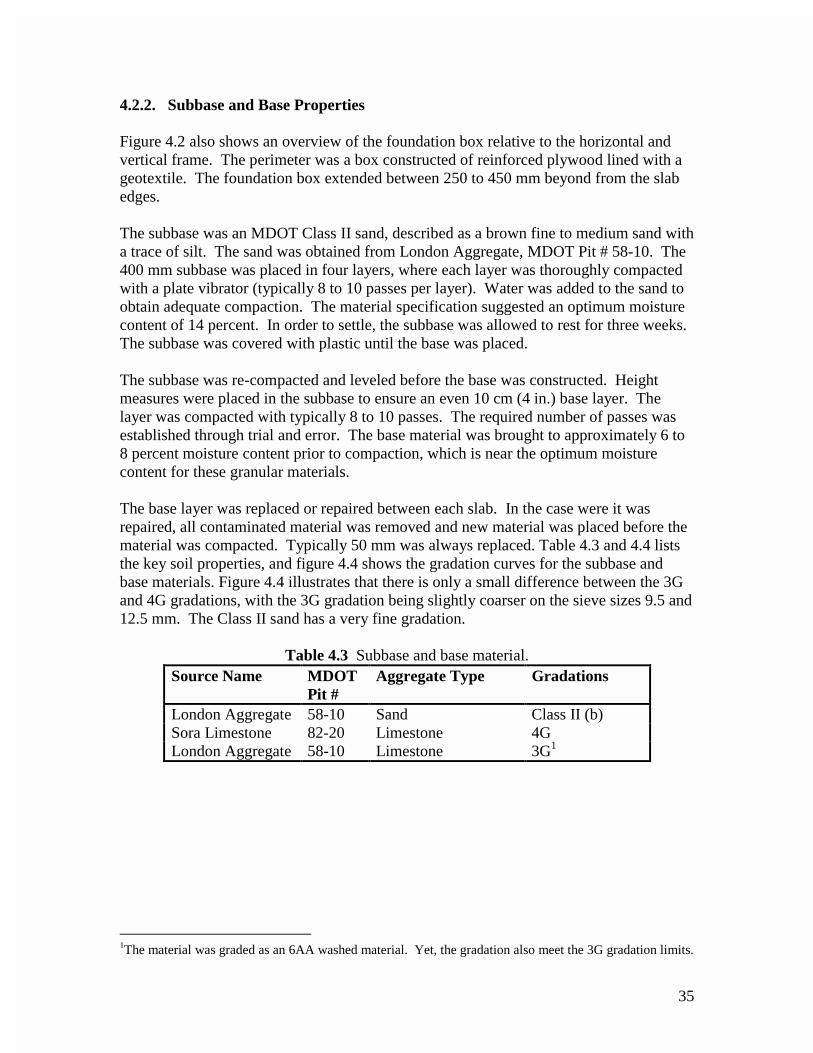
4.2.2. Subbase and Base Properties Figure 4.2 also shows an overview of the foundation box relative to the horizontal and vertical frame. The perimeter was a box constructed of reinforced plywood lined with a geotextile. The foundation box extended between 250 to 450 mm beyond from the slab edges. The subbase was an MDOT Class II sand, described as a brown fine to medium sand with a trace of silt. The sand was obtained from London Aggregate, MDOT Pit # 58-10. The 400 mm subbase was placed in four layers, where each layer was thoroughly compacted with a plate vibrator (typically 8 to 10 passes per layer). Water was added to the sand to obtain adequate compaction. The material specification suggested an optimum moisture content of 14 percent. In order to settle, the subbase was allowed to rest for three weeks. The subbase was covered with plastic until the base was placed. The subbase was re-compacted and leveled before the base was constructed. Height measures were placed in the subbase to ensure an even 10 cm (4 in.) base layer. The layer was compacted with typically 8 to 10 passes. The required number of passes was established through trial and error. The base material was brought to approximately 6 to 8 percent moisture content prior to compaction, which is near the optimum moisture content for these granular materials. The base layer was replaced or repaired between each slab. In the case were it was repaired, all contaminated material was removed and new material was placed before the material was compacted. Typically 50 mm was always replaced. Table 4.3 and 4.4 lists the key soil properties, and figure 4.4 shows the gradation curves for the subbase and base materials. Figure 4.4 illustrates that there is only a small difference between the 3G and 4G gradations, with the 3G gradation being slightly coarser on the sieve sizes 9.5 and 12.5 mm. The Class II sand has a very fine gradation.
Table 4.3 Subbase and base material. Source Name MDOT
Pit # Aggregate Type Gradations
London Aggregate 58-10 Sand Class II (b) Sora Limestone 82-20 Limestone 4G London Aggregate 58-10 Limestone 3G1
1The material was graded as an 6AA washed material. Yet, the gradation also meet the 3G gradation limits.
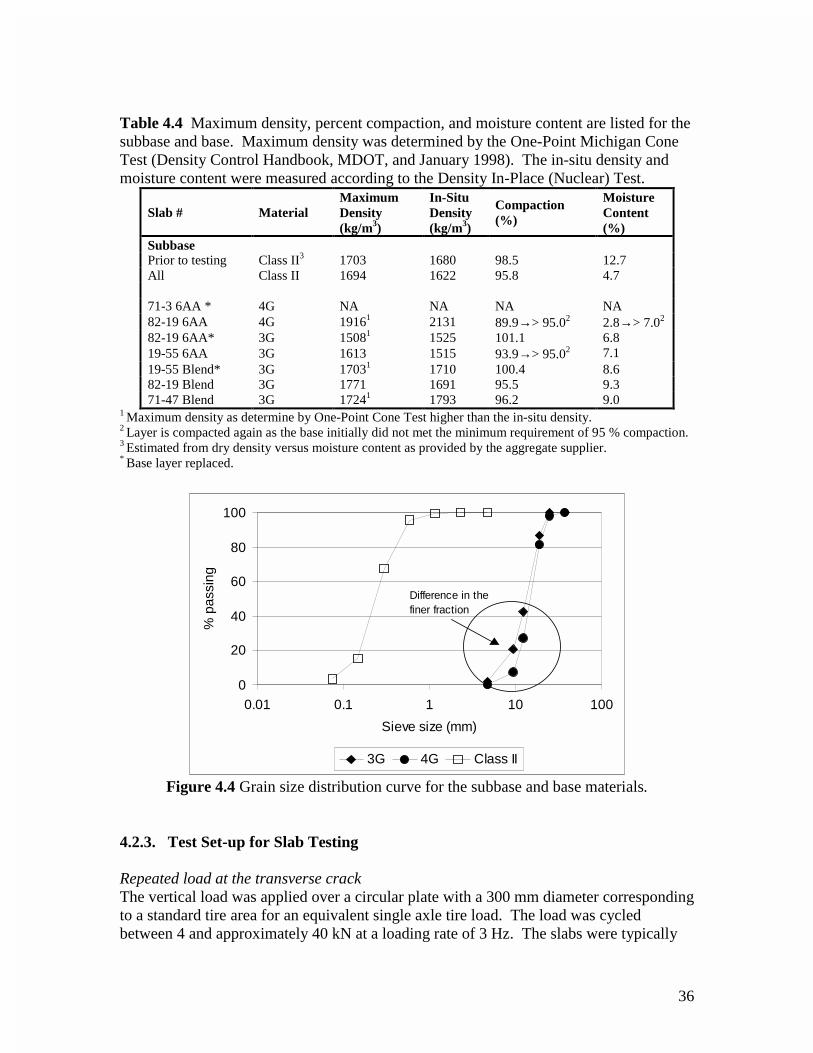
36
Table 4.4 Maximum density, percent compaction, and moisture content are listed for the subbase and base. Maximum density was determined by the One-Point Michigan Cone Test (Density Control Handbook, MDOT, and January 1998). The in-situ density and moisture content were measured according to the Density In-Place (Nuclear) Test.
Slab # Material Maximum Density (kg/m3)
In-Situ Density (kg/m3)
Compaction (%)
Moisture Content (%)
Subbase Prior to testing Class II3 1703 1680 98.5 12.7 All Class II 1694 1622 95.8 4.7 71-3 6AA * 4G NA NA NA NA 82-19 6AA 4G 19161 2131 89.9→> 95.02 2.8→> 7.02 82-19 6AA* 3G 15081 1525 101.1 6.8 19-55 6AA 3G 1613 1515 93.9→> 95.02 7.1 19-55 Blend* 3G 17031 1710 100.4 8.6 82-19 Blend 3G 1771 1691 95.5 9.3 71-47 Blend 3G 17241 1793 96.2 9.0
1 Maximum density as determine by One-Point Cone Test higher than the in-situ density. 2 Layer is compacted again as the base initially did not met the minimum requirement of 95 % compaction. 3 Estimated from dry density versus moisture content as provided by the aggregate supplier. * Base layer replaced.
0
20
40
60
80
100
0.01 0.1 1 10 100
Sieve size (mm)
% p
assi
ng
3G 4G Class II
Difference in the finer fraction
Figure 4.4 Grain size distribution curve for the subbase and base materials.
4.2.3. Test Set-up for Slab Testing Repeated load at the transverse crack The vertical load was applied over a circular plate with a 300 mm diameter corresponding to a standard tire area for an equivalent single axle tire load. The load was cycled between 4 and approximately 40 kN at a loading rate of 3 Hz. The slabs were typically
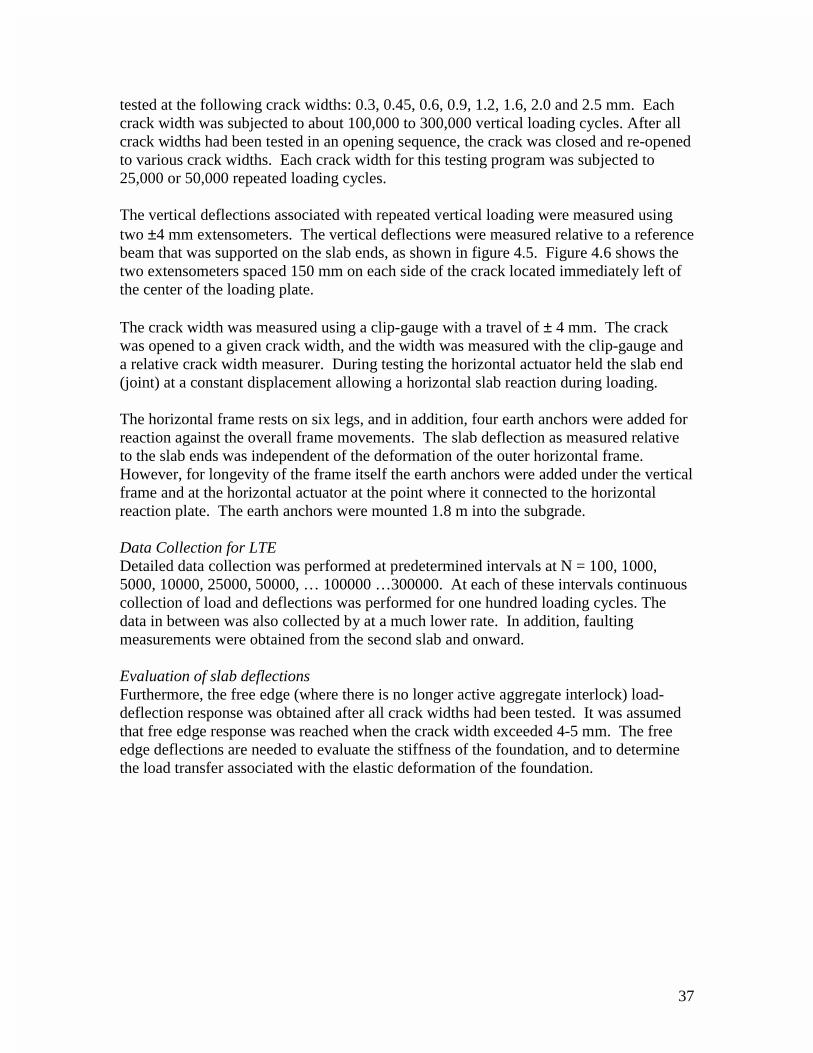
37
tested at the following crack widths: 0.3, 0.45, 0.6, 0.9, 1.2, 1.6, 2.0 and 2.5 mm. Each crack width was subjected to about 100,000 to 300,000 vertical loading cycles. After all crack widths had been tested in an opening sequence, the crack was closed and re-opened to various crack widths. Each crack width for this testing program was subjected to 25,000 or 50,000 repeated loading cycles. The vertical deflections associated with repeated vertical loading were measured using two ±4 mm extensometers. The vertical deflections were measured relative to a reference beam that was supported on the slab ends, as shown in figure 4.5. Figure 4.6 shows the two extensometers spaced 150 mm on each side of the crack located immediately left of the center of the loading plate. The crack width was measured using a clip-gauge with a travel of ± 4 mm. The crack was opened to a given crack width, and the width was measured with the clip-gauge and a relative crack width measurer. During testing the horizontal actuator held the slab end (joint) at a constant displacement allowing a horizontal slab reaction during loading. The horizontal frame rests on six legs, and in addition, four earth anchors were added for reaction against the overall frame movements. The slab deflection as measured relative to the slab ends was independent of the deformation of the outer horizontal frame. However, for longevity of the frame itself the earth anchors were added under the vertical frame and at the horizontal actuator at the point where it connected to the horizontal reaction plate. The earth anchors were mounted 1.8 m into the subgrade. Data Collection for LTE Detailed data collection was performed at predetermined intervals at N = 100, 1000, 5000, 10000, 25000, 50000, … 100000 …300000. At each of these intervals continuous collection of load and deflections was performed for one hundred loading cycles. The data in between was also collected by at a much lower rate. In addition, faulting measurements were obtained from the second slab and onward. Evaluation of slab deflections Furthermore, the free edge (where there is no longer active aggregate interlock) load-deflection response was obtained after all crack widths had been tested. It was assumed that free edge response was reached when the crack width exceeded 4-5 mm. The free edge deflections are needed to evaluate the stiffness of the foundation, and to determine the load transfer associated with the elastic deformation of the foundation.
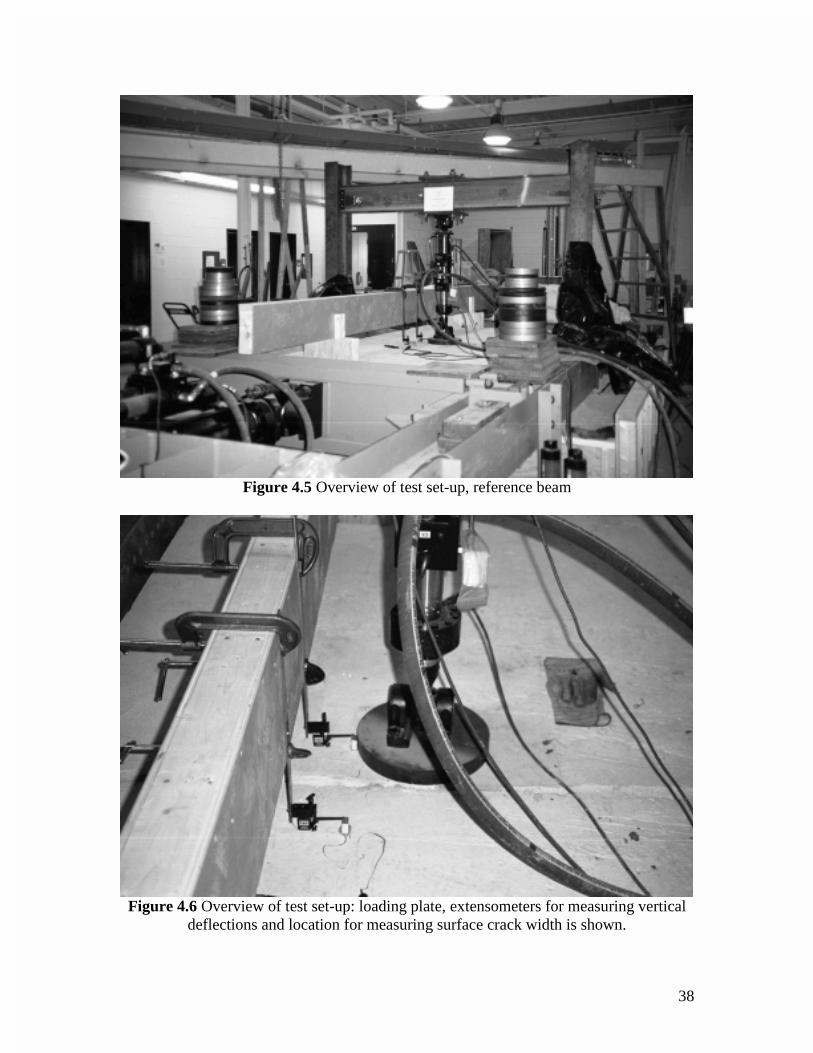
38
Figure 4.5 Overview of test set-up, reference beam
Figure 4.6 Overview of test set-up: loading plate, extensometers for measuring vertical
deflections and location for measuring surface crack width is shown.
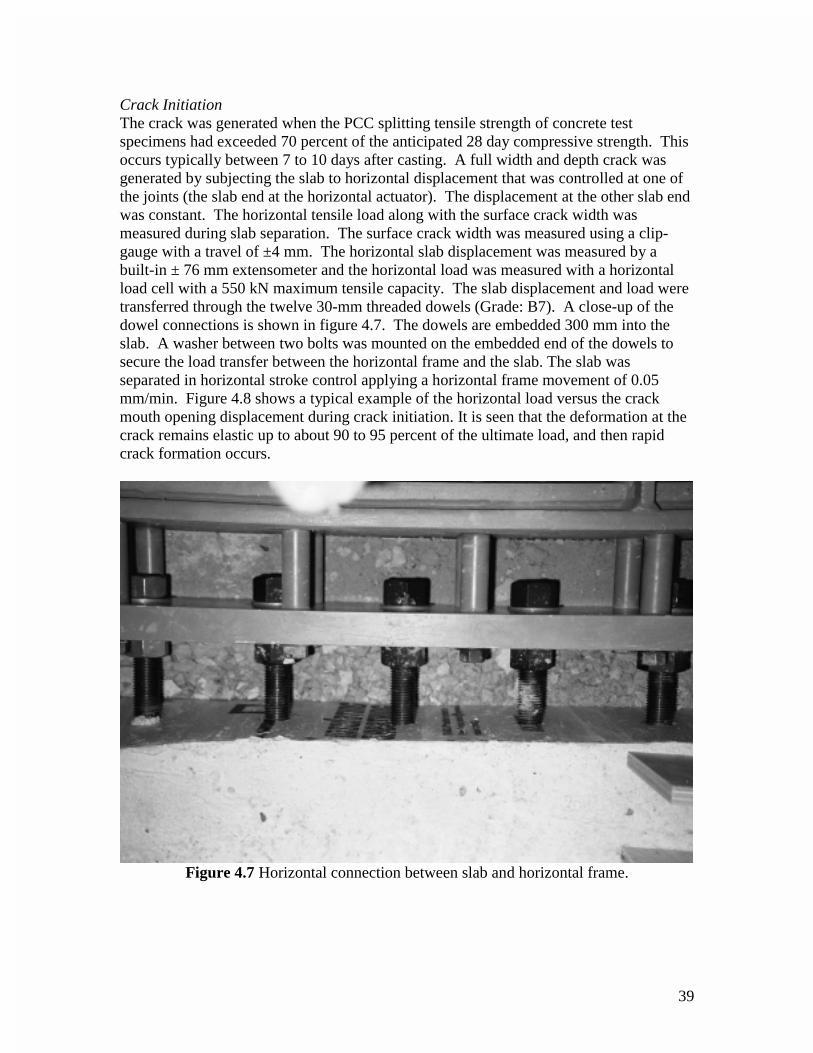
39
Crack Initiation The crack was generated when the PCC splitting tensile strength of concrete test specimens had exceeded 70 percent of the anticipated 28 day compressive strength. This occurs typically between 7 to 10 days after casting. A full width and depth crack was generated by subjecting the slab to horizontal displacement that was controlled at one of the joints (the slab end at the horizontal actuator). The displacement at the other slab end was constant. The horizontal tensile load along with the surface crack width was measured during slab separation. The surface crack width was measured using a clip-gauge with a travel of ±4 mm. The horizontal slab displacement was measured by a built-in ± 76 mm extensometer and the horizontal load was measured with a horizontal load cell with a 550 kN maximum tensile capacity. The slab displacement and load were transferred through the twelve 30-mm threaded dowels (Grade: B7). A close-up of the dowel connections is shown in figure 4.7. The dowels are embedded 300 mm into the slab. A washer between two bolts was mounted on the embedded end of the dowels to secure the load transfer between the horizontal frame and the slab. The slab was separated in horizontal stroke control applying a horizontal frame movement of 0.05 mm/min. Figure 4.8 shows a typical example of the horizontal load versus the crack mouth opening displacement during crack initiation. It is seen that the deformation at the crack remains elastic up to about 90 to 95 percent of the ultimate load, and then rapid crack formation occurs.
Figure 4.7 Horizontal connection between slab and horizontal frame.
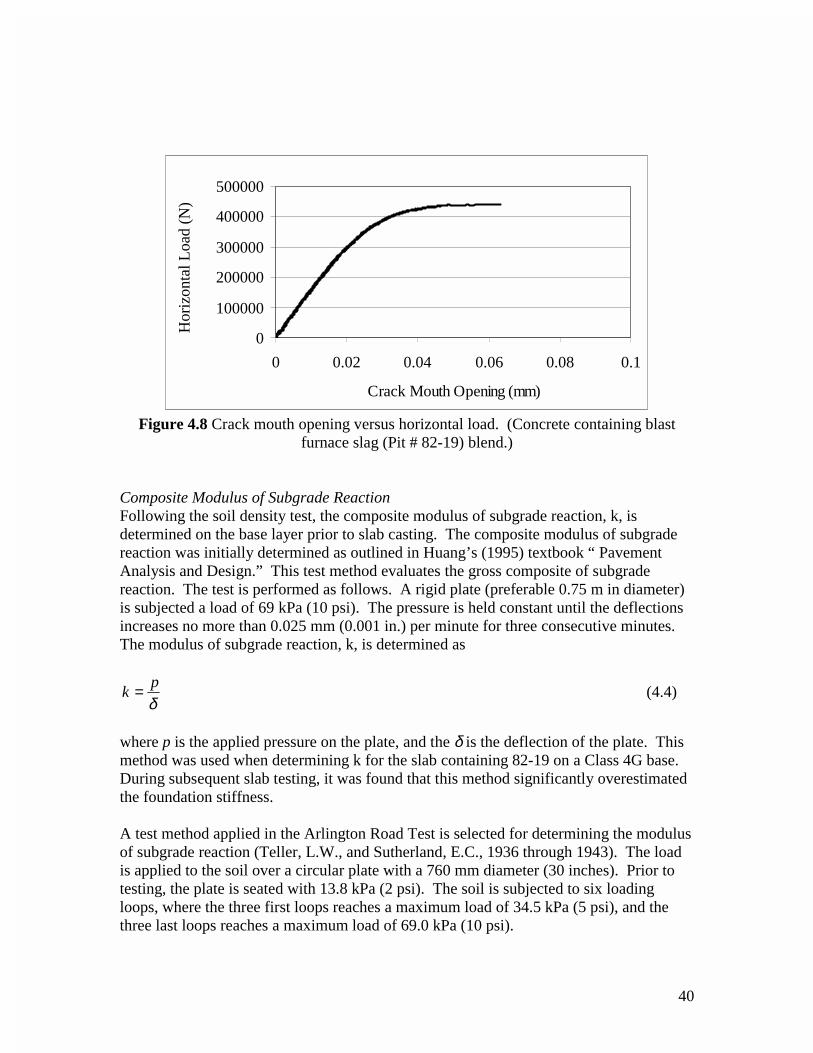
40
0
100000
200000
300000
400000
500000
0 0.02 0.04 0.06 0.08 0.1
Crack Mouth Opening (mm)
Hor
izon
tal L
oad
(N)
Figure 4.8 Crack mouth opening versus horizontal load. (Concrete containing blast
furnace slag (Pit # 82-19) blend.) Composite Modulus of Subgrade Reaction Following the soil density test, the composite modulus of subgrade reaction, k, is determined on the base layer prior to slab casting. The composite modulus of subgrade reaction was initially determined as outlined in Huang’s (1995) textbook “ Pavement Analysis and Design.” This test method evaluates the gross composite of subgrade reaction. The test is performed as follows. A rigid plate (preferable 0.75 m in diameter) is subjected a load of 69 kPa (10 psi). The pressure is held constant until the deflections increases no more than 0.025 mm (0.001 in.) per minute for three consecutive minutes. The modulus of subgrade reaction, k, is determined as
δp
k = (4.4)
where p is the applied pressure on the plate, and the δ is the deflection of the plate. This method was used when determining k for the slab containing 82-19 on a Class 4G base. During subsequent slab testing, it was found that this method significantly overestimated the foundation stiffness. A test method applied in the Arlington Road Test is selected for determining the modulus of subgrade reaction (Teller, L.W., and Sutherland, E.C., 1936 through 1943). The load is applied to the soil over a circular plate with a 760 mm diameter (30 inches). Prior to testing, the plate is seated with 13.8 kPa (2 psi). The soil is subjected to six loading loops, where the three first loops reaches a maximum load of 34.5 kPa (5 psi), and the three last loops reaches a maximum load of 69.0 kPa (10 psi).
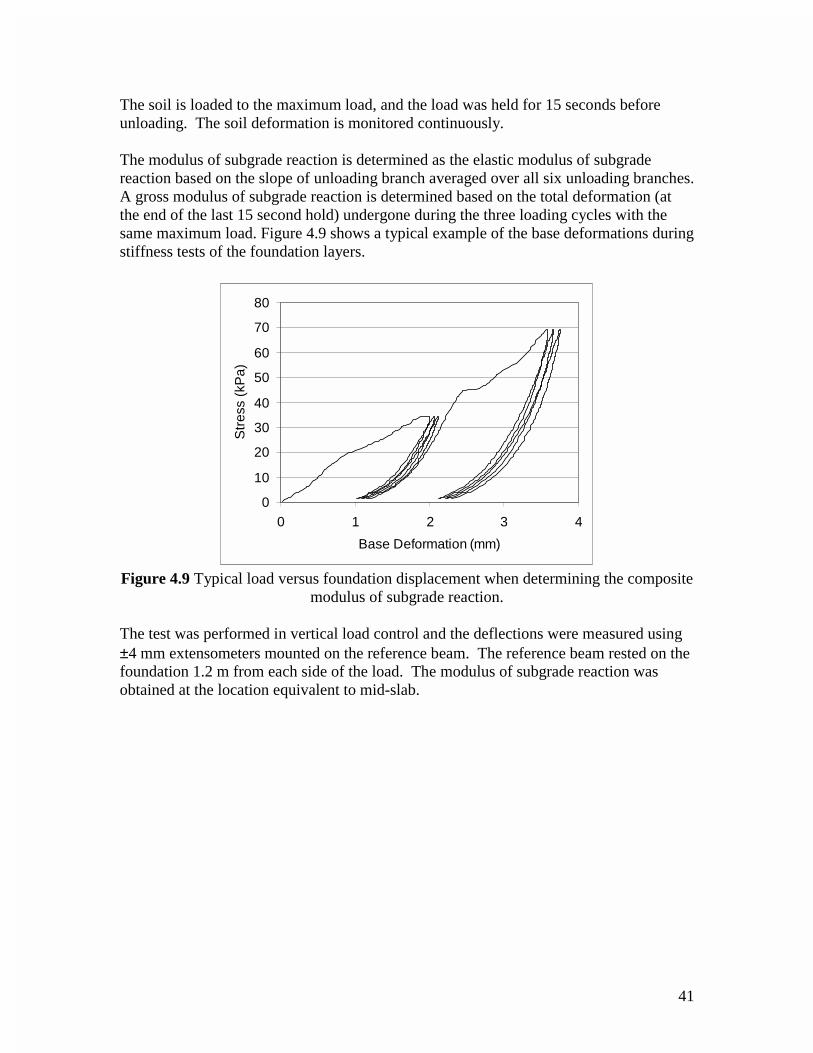
41
The soil is loaded to the maximum load, and the load was held for 15 seconds before unloading. The soil deformation is monitored continuously. The modulus of subgrade reaction is determined as the elastic modulus of subgrade reaction based on the slope of unloading branch averaged over all six unloading branches. A gross modulus of subgrade reaction is determined based on the total deformation (at the end of the last 15 second hold) undergone during the three loading cycles with the same maximum load. Figure 4.9 shows a typical example of the base deformations during stiffness tests of the foundation layers.
0
10
20
30
40
50
60
70
80
0 1 2 3 4
Base Deformation (mm)
Str
ess
(kP
a)
Figure 4.9 Typical load versus foundation displacement when determining the composite
modulus of subgrade reaction. The test was performed in vertical load control and the deflections were measured using ±4 mm extensometers mounted on the reference beam. The reference beam rested on the foundation 1.2 m from each side of the load. The modulus of subgrade reaction was obtained at the location equivalent to mid-slab.
42
Chapter 5. Effect of Coarse Aggregate Gradation and Type on Concretes Resistance to Cracking
5.1. Concrete and Fracture Mechanics Pavement researchers have over the last decade increasingly exploited fracture mechanics to determine the critical stress levels, that can be applied to cracked concrete highway slabs. Work conducted by Zollinger et al. (1993) and Soares and Zollinger (1997) focused on the requirements for sawcut depth and timing for jointed concrete pavements (JCP’s.) They utilized existing closed-form linear elastic fracture mechanic (LEFM) solutions for determining the critical load level at which a plate with a surface crack would fracture. Ramsamooj et al. (1998) developed LEFM solutions for more generalized truck loading conditions based on weight functions. Soares and Zollinger (1997) also illustrated the effect of coarse aggregate type (gravel versus limestone) on the sawcut depth and timing, and found that the limestone concrete had higher early age (6 to 12 hours) resistance to cracking, hence sawcut timing and depth was more critical for this concrete. In general, the available data on highway concretes’ resistance to cracking at any age are scarce. This chapter focuses on determining the fracture properties of concretes as related to premature cracking but not to early age joint formation. The range of fracture energy and fracture toughness values is determined for typical Michigan highway concretes containing different coarse aggregate types. In addition, the development of fracture toughness with concrete age (7, 28, and 91 days) is investigated. Furthermore, the impact of the concretes’ fracture toughness values on the critical slab stress as well as critical crack length is illustrated. A total of 18 mixes and age combination were tested in this phase of the project. Three beams for fracture test and six cylinders for compressive strength, splittng tensile strength, and elastic modulus were tested in each combination. The fracture properties can be determined from the complete load-deflection curve from a test beam notched at midspan. The effective beam dimensions are 965 mm in length, 102 mm in width, and 204 mm in height, with a 100 mm notch at the bottom side of the beam. See also chapter 4. Results show that the fracture energy, which determines the resistance to crack propagation, for a highway concrete mix is controlled primarily by the coarse aggregate type (source). Differences of a factor of 2 were obtained between aggregates with differences in these properties. Concretes containing the glacial gravels (Martin Aggregate MDOT Pit # 19-55 and Bundy Hill MDOT Pit # 30-35), yielded the highest resistance values around 170 N/m. The concretes containing dolomitic limestone (Rockwood MDOT Pit # 58-8) fall in the intermittent region around 140 N/m, and concretes containing limestone (Silica MDOT Pit # 93-3) and the blast furnace slag (Levy MDOT Pit # 82-22) yielded the lowest resistance values around 80 -120 N/m.
43
Concretes with increasing aggregate top-size from 25 to 37 mm only showed a small increase increase in the fracture energy. This is seen in conjunction with the coefficient of variation for this test of about 15 percent. The fracture toughness, or resistance to cracking, ranged from 47 to 78 MPa/mm½ for the concretes ranging from 7 to 91 days. The resistance to cracking is linearly proportional to the amount of stress that can be applied to a concrete slab before it will crack. The fracture toughness is proportional to the square root of the product of the fracture energy and the elastic modulus. However the fracture energy is the controlling parameter. This should be seen in the context that the fracture energy ranges two folds whereas the elastic modulus only varies 5 to 10 percent from mix to mix of concretes containing different coarse aggregate types. In general the concretes with high fracture energy also yields the highest elastic modulus. The effect of coarse aggregate type and size on the fracture properties of highway concretes are in general agreement with results obtained in the literature. The following sections discuss the results obtained in this study. 5.2. Results from Beam and Cylinder Testing Tables 5.1 and 5.2 list the mechanical properties for the five different aggregate sources and two aggregate sizes evaluated in phase 1 of this study. The average values are listed along with standard deviation, and variation coefficient1. All mixes exceed the 28-day compressive strength design requirement of 24 MPa. Note that the variation coefficient for GF range as high as 23 percent for glacial gravel concrete and 16 percent for limestone and blast furnace slag concrete. This higher variation for beam tests is expected (for gravel concrete in particular) and is in agreement with the literature (e.g., Petersson, 1981; Giaccio and Zerbino, 1998; and Kleinschrodt and Winkler, 1986.) Despite the higher variation, the increased GF is repeatable for these mixes.
1 The standard deviation and coefficient of variation are omitted when only results from two beams were accepted.
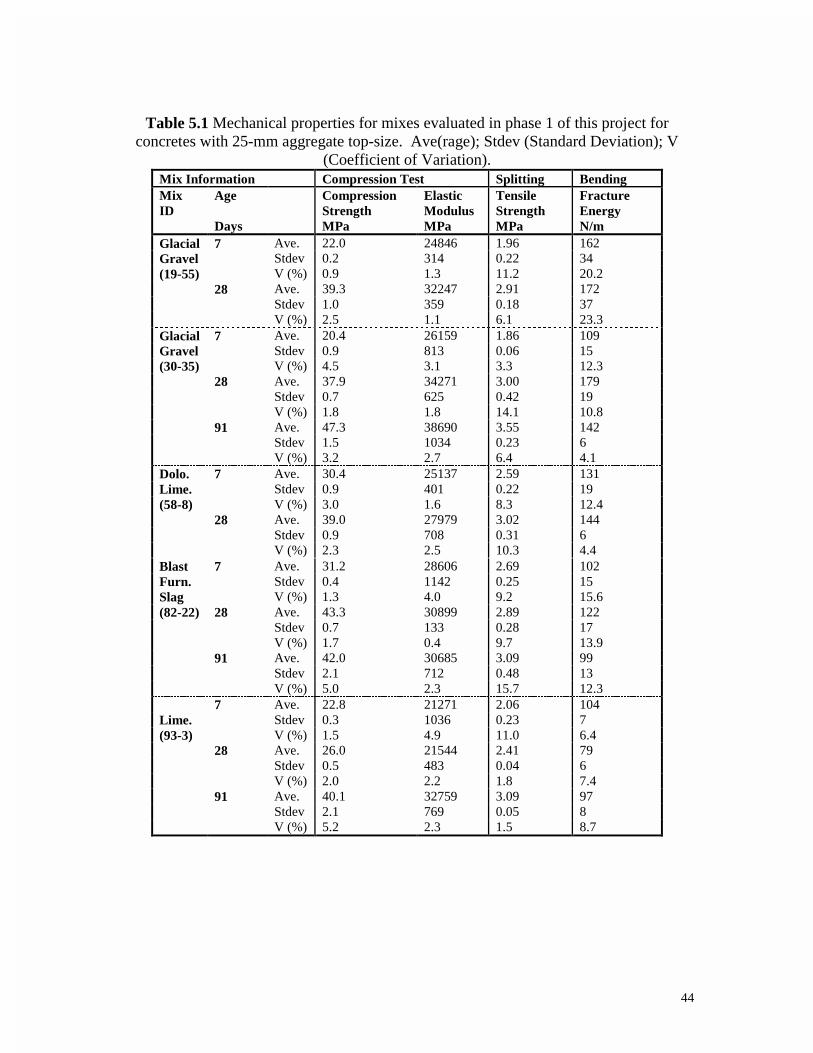
44
Table 5.1 Mechanical properties for mixes evaluated in phase 1 of this project for
concretes with 25-mm aggregate top-size. Ave(rage); Stdev (Standard Deviation); V (Coefficient of Variation).
Mix Information Compression Test Splitting Bending Mix ID
Age Days
Compression Strength MPa
Elastic Modulus MPa
Tensile Strength MPa
Fracture Energy N/m
Glacial 7 Ave. 22.0 24846 1.96 162 Gravel Stdev 0.2 314 0.22 34 (19-55) V (%) 0.9 1.3 11.2 20.2 28 Ave. 39.3 32247 2.91 172 Stdev 1.0 359 0.18 37 V (%) 2.5 1.1 6.1 23.3 Glacial 7 Ave. 20.4 26159 1.86 109 Gravel Stdev 0.9 813 0.06 15 (30-35) V (%) 4.5 3.1 3.3 12.3 28 Ave. 37.9 34271 3.00 179 Stdev 0.7 625 0.42 19 V (%) 1.8 1.8 14.1 10.8 91 Ave. 47.3 38690 3.55 142 Stdev 1.5 1034 0.23 6 V (%) 3.2 2.7 6.4 4.1 Dolo. 7 Ave. 30.4 25137 2.59 131 Lime. Stdev 0.9 401 0.22 19 (58-8) V (%) 3.0 1.6 8.3 12.4 28 Ave. 39.0 27979 3.02 144 Stdev 0.9 708 0.31 6 V (%) 2.3 2.5 10.3 4.4 Blast 7 Ave. 31.2 28606 2.69 102 Furn. Stdev 0.4 1142 0.25 15 Slag V (%) 1.3 4.0 9.2 15.6 (82-22) 28 Ave. 43.3 30899 2.89 122 Stdev 0.7 133 0.28 17 V (%) 1.7 0.4 9.7 13.9 91 Ave. 42.0 30685 3.09 99 Stdev 2.1 712 0.48 13 V (%) 5.0 2.3 15.7 12.3 7 Ave. 22.8 21271 2.06 104 Lime. Stdev 0.3 1036 0.23 7 (93-3) V (%) 1.5 4.9 11.0 6.4 28 Ave. 26.0 21544 2.41 79 Stdev 0.5 483 0.04 6 V (%) 2.0 2.2 1.8 7.4 91 Ave. 40.1 32759 3.09 97 Stdev 2.1 769 0.05 8 V (%) 5.2 2.3 1.5 8.7
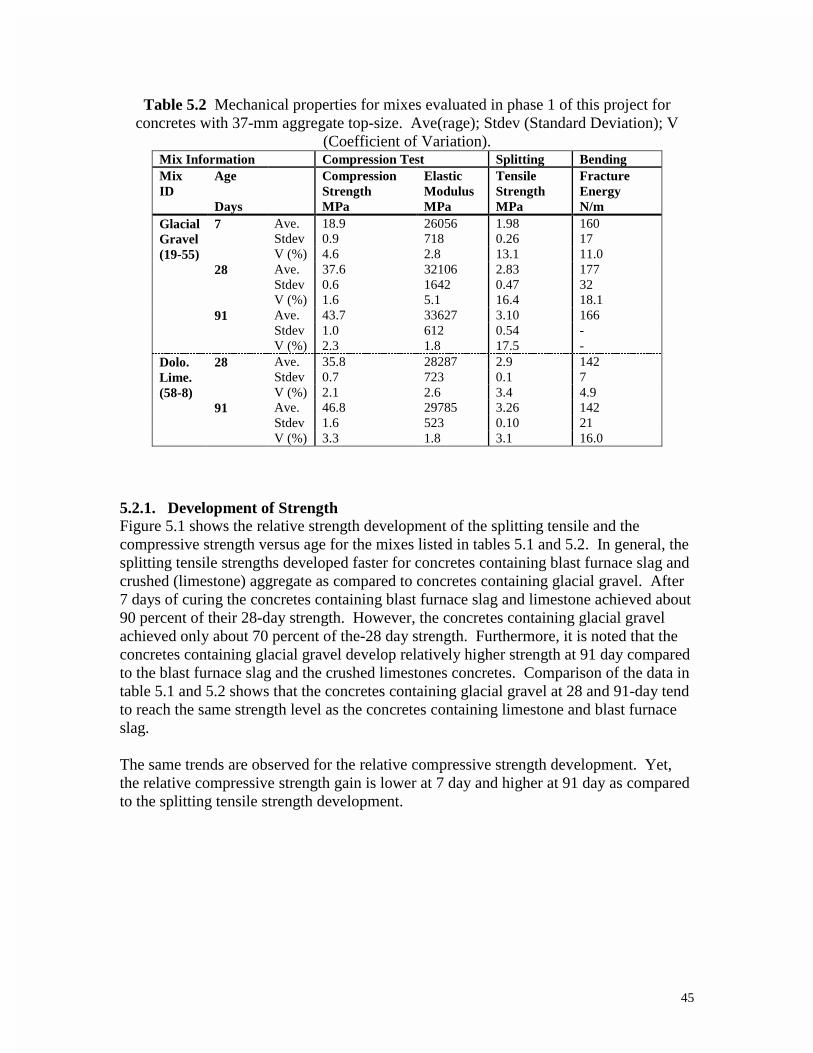
45
Table 5.2 Mechanical properties for mixes evaluated in phase 1 of this project for concretes with 37-mm aggregate top-size. Ave(rage); Stdev (Standard Deviation); V
(Coefficient of Variation). Mix Information Compression Test Splitting Bending Mix ID
Age Days
Compression Strength MPa
Elastic Modulus MPa
Tensile Strength MPa
Fracture Energy N/m
Glacial 7 Ave. 18.9 26056 1.98 160 Gravel Stdev 0.9 718 0.26 17 (19-55) V (%) 4.6 2.8 13.1 11.0 28 Ave. 37.6 32106 2.83 177 Stdev 0.6 1642 0.47 32 V (%) 1.6 5.1 16.4 18.1 91 Ave. 43.7 33627 3.10 166 Stdev 1.0 612 0.54 - V (%) 2.3 1.8 17.5 - Dolo. 28 Ave. 35.8 28287 2.9 142 Lime. Stdev 0.7 723 0.1 7 (58-8) V (%) 2.1 2.6 3.4 4.9 91 Ave. 46.8 29785 3.26 142 Stdev 1.6 523 0.10 21 V (%) 3.3 1.8 3.1 16.0
5.2.1. Development of Strength Figure 5.1 shows the relative strength development of the splitting tensile and the compressive strength versus age for the mixes listed in tables 5.1 and 5.2. In general, the splitting tensile strengths developed faster for concretes containing blast furnace slag and crushed (limestone) aggregate as compared to concretes containing glacial gravel. After 7 days of curing the concretes containing blast furnace slag and limestone achieved about 90 percent of their 28-day strength. However, the concretes containing glacial gravel achieved only about 70 percent of the-28 day strength. Furthermore, it is noted that the concretes containing glacial gravel develop relatively higher strength at 91 day compared to the blast furnace slag and the crushed limestones concretes. Comparison of the data in table 5.1 and 5.2 shows that the concretes containing glacial gravel at 28 and 91-day tend to reach the same strength level as the concretes containing limestone and blast furnace slag. The same trends are observed for the relative compressive strength development. Yet, the relative compressive strength gain is lower at 7 day and higher at 91 day as compared to the splitting tensile strength development.
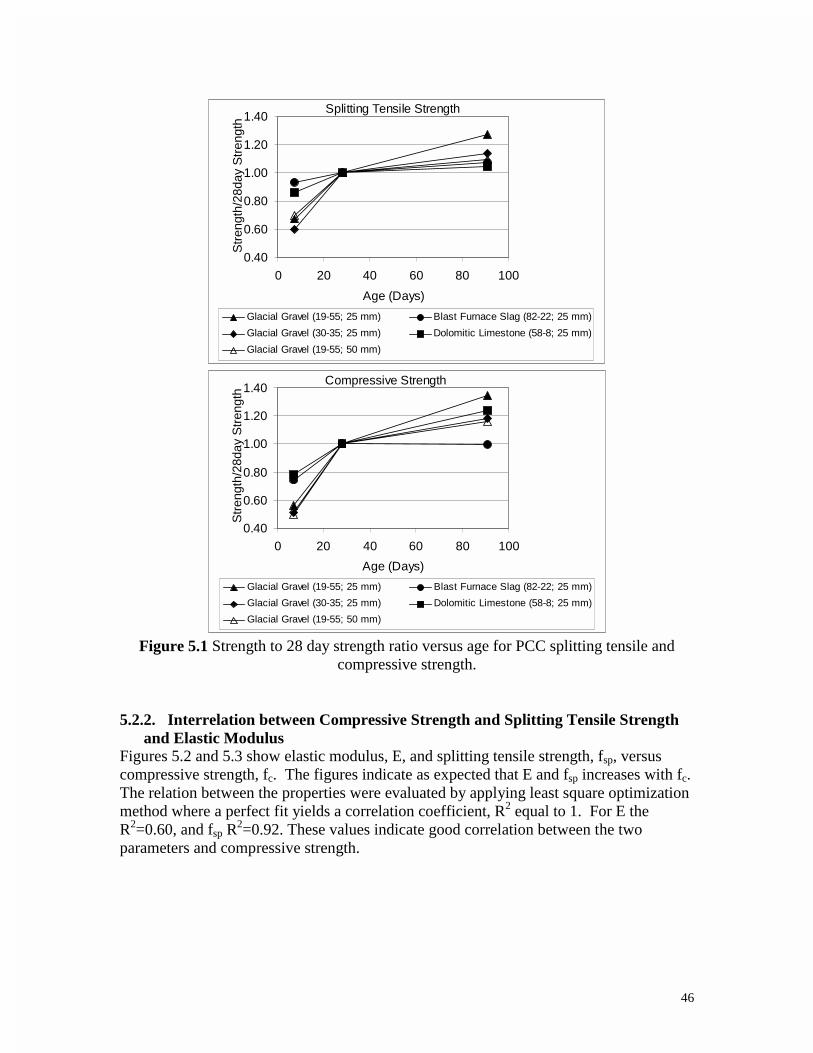
46
0.40
0.60
0.80
1.00
1.20
1.40
0 20 40 60 80 100
Age (Days)
Str
engt
h/28
day
Str
engt
h
Glacial Gravel (19-55; 25 mm) Blast Furnace Slag (82-22; 25 mm)
Glacial Gravel (30-35; 25 mm) Dolomitic Limestone (58-8; 25 mm)
Glacial Gravel (19-55; 50 mm)
Splitting Tensile Strength
0.40
0.60
0.80
1.00
1.20
1.40
0 20 40 60 80 100
Age (Days)
Str
engt
h/28
day
Str
engt
h
Glacial Gravel (19-55; 25 mm) Blast Furnace Slag (82-22; 25 mm)
Glacial Gravel (30-35; 25 mm) Dolomitic Limestone (58-8; 25 mm)
Glacial Gravel (19-55; 50 mm)
Compressive Strength
Figure 5.1 Strength to 28 day strength ratio versus age for PCC splitting tensile and
compressive strength. 5.2.2. Interrelation between Compressive Strength and Splitting Tensile Strength
and Elastic Modulus Figures 5.2 and 5.3 show elastic modulus, E, and splitting tensile strength, fsp, versus compressive strength, fc. The figures indicate as expected that E and fsp increases with fc. The relation between the properties were evaluated by applying least square optimization method where a perfect fit yields a correlation coefficient, R2 equal to 1. For E the R2=0.60, and fsp R
2=0.92. These values indicate good correlation between the two parameters and compressive strength.
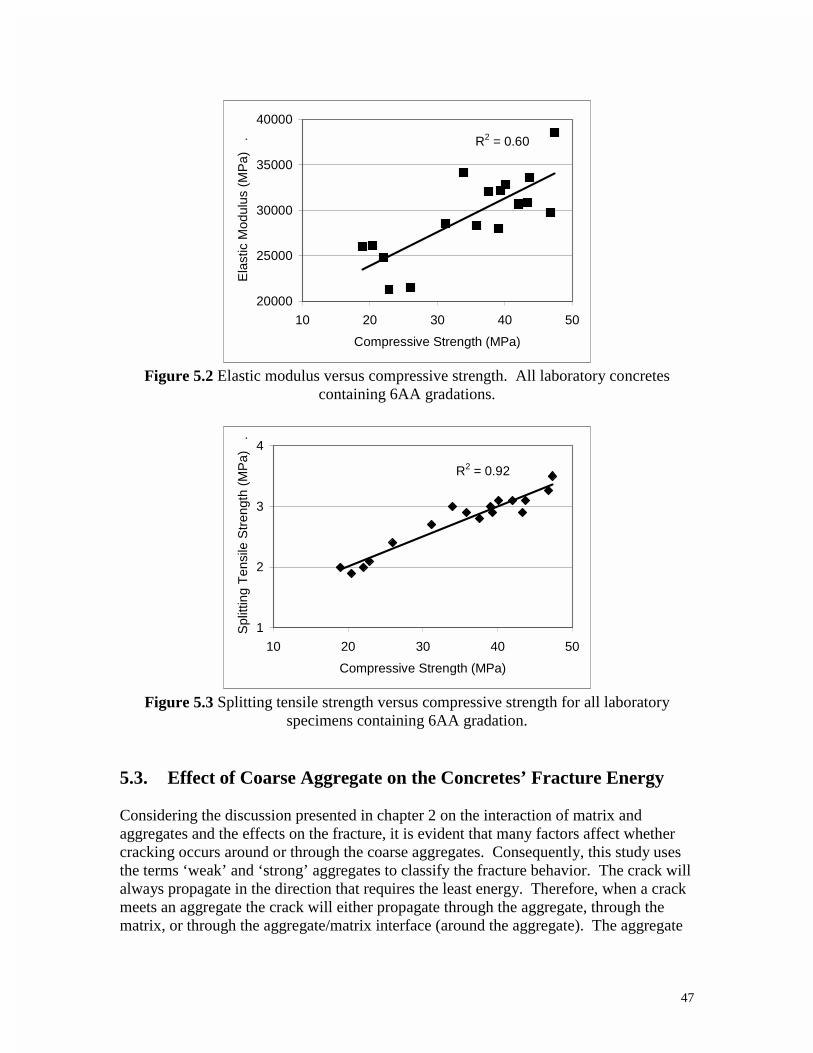
47
R2 = 0.60
20000
25000
30000
35000
40000
10 20 30 40 50
Compressive Strength (MPa)
Ela
stic
Mod
ulus
(M
Pa)
.
Figure 5.2 Elastic modulus versus compressive strength. All laboratory concretes
containing 6AA gradations.
R2 = 0.92
1
2
3
4
10 20 30 40 50
Compressive Strength (MPa)
Spl
ittin
g T
ensi
le S
tren
gth
(MP
a)
.
Figure 5.3 Splitting tensile strength versus compressive strength for all laboratory
specimens containing 6AA gradation.
5.3. Effect of Coarse Aggregate on the Concretes’ Fracture Energy Considering the discussion presented in chapter 2 on the interaction of matrix and aggregates and the effects on the fracture, it is evident that many factors affect whether cracking occurs around or through the coarse aggregates. Consequently, this study uses the terms ‘weak’ and ‘strong’ aggregates to classify the fracture behavior. The crack will always propagate in the direction that requires the least energy. Therefore, when a crack meets an aggregate the crack will either propagate through the aggregate, through the matrix, or through the aggregate/matrix interface (around the aggregate). The aggregate
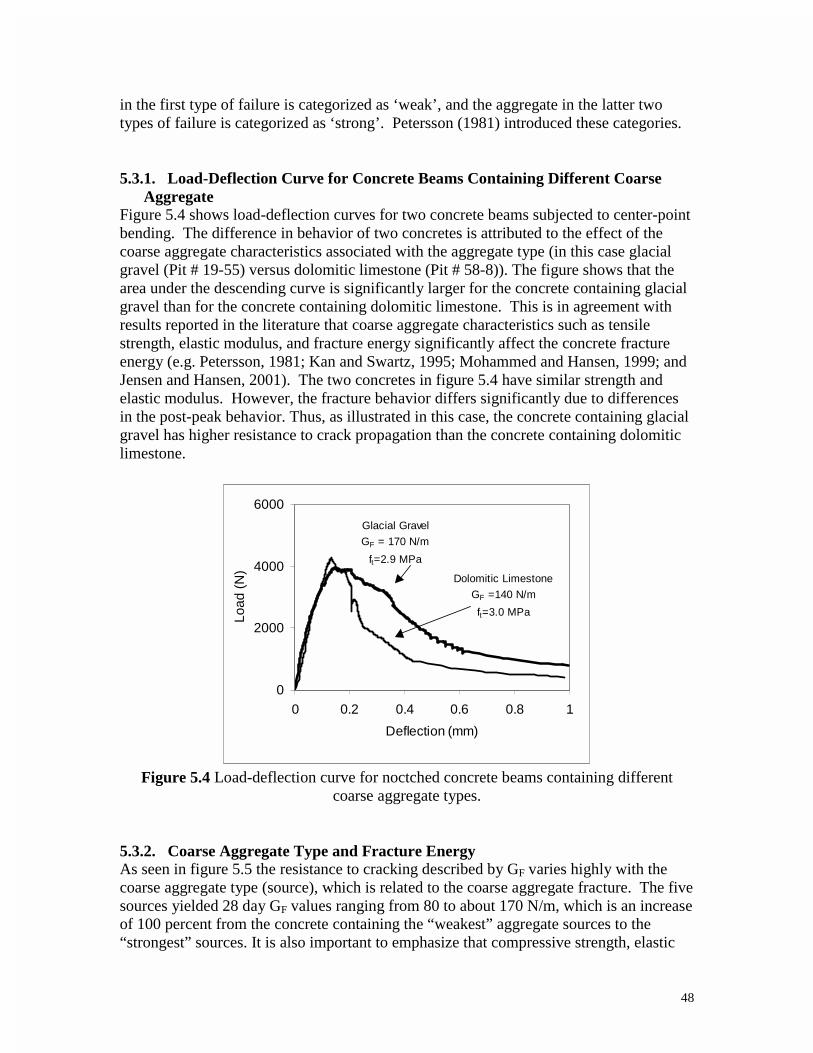
48
in the first type of failure is categorized as ‘weak’, and the aggregate in the latter two types of failure is categorized as ‘strong’. Petersson (1981) introduced these categories. 5.3.1. Load-Deflection Curve for Concrete Beams Containing Different Coarse
Aggregate Figure 5.4 shows load-deflection curves for two concrete beams subjected to center-point bending. The difference in behavior of two concretes is attributed to the effect of the coarse aggregate characteristics associated with the aggregate type (in this case glacial gravel (Pit # 19-55) versus dolomitic limestone (Pit # 58-8)). The figure shows that the area under the descending curve is significantly larger for the concrete containing glacial gravel than for the concrete containing dolomitic limestone. This is in agreement with results reported in the literature that coarse aggregate characteristics such as tensile strength, elastic modulus, and fracture energy significantly affect the concrete fracture energy (e.g. Petersson, 1981; Kan and Swartz, 1995; Mohammed and Hansen, 1999; and Jensen and Hansen, 2001). The two concretes in figure 5.4 have similar strength and elastic modulus. However, the fracture behavior differs significantly due to differences in the post-peak behavior. Thus, as illustrated in this case, the concrete containing glacial gravel has higher resistance to crack propagation than the concrete containing dolomitic limestone.
0
2000
4000
6000
0 0.2 0.4 0.6 0.8 1
Deflection (mm)
Load
(N
)
Glacial Gravel
GF = 170 N/m
ft=2.9 MPa
Dolomitic Limestone
GF =140 N/m
ft=3.0 MPa
Figure 5.4 Load-deflection curve for noctched concrete beams containing different
coarse aggregate types. 5.3.2. Coarse Aggregate Type and Fracture Energy As seen in figure 5.5 the resistance to cracking described by GF varies highly with the coarse aggregate type (source), which is related to the coarse aggregate fracture. The five sources yielded 28 day GF values ranging from 80 to about 170 N/m, which is an increase of 100 percent from the concrete containing the “weakest” aggregate sources to the “strongest” sources. It is also important to emphasize that compressive strength, elastic
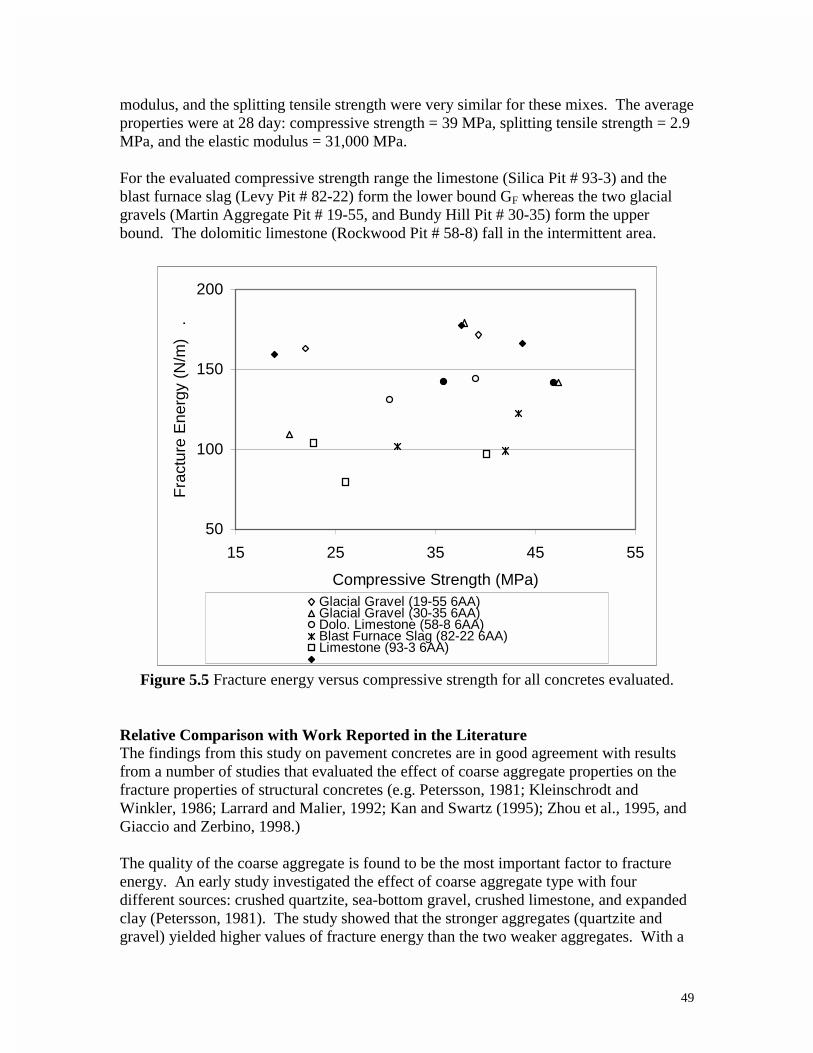
49
modulus, and the splitting tensile strength were very similar for these mixes. The average properties were at 28 day: compressive strength = 39 MPa, splitting tensile strength = 2.9 MPa, and the elastic modulus = 31,000 MPa. For the evaluated compressive strength range the limestone (Silica Pit # 93-3) and the blast furnace slag (Levy Pit # 82-22) form the lower bound GF whereas the two glacial gravels (Martin Aggregate Pit # 19-55, and Bundy Hill Pit # 30-35) form the upper bound. The dolomitic limestone (Rockwood Pit # 58-8) fall in the intermittent area.
50
100
150
200
15 25 35 45 55
Compressive Strength (MPa)
Fra
ctur
e E
nerg
y (N
/m)
.
Glacial Gravel (19-55 6AA)Glacial Gravel (30-35 6AA)Dolo. Limestone (58-8 6AA)Blast Furnace Slag (82-22 6AA)Limestone (93-3 6AA)
Figure 5.5 Fracture energy versus compressive strength for all concretes evaluated.
Relative Comparison with Work Reported in the Literature The findings from this study on pavement concretes are in good agreement with results from a number of studies that evaluated the effect of coarse aggregate properties on the fracture properties of structural concretes (e.g. Petersson, 1981; Kleinschrodt and Winkler, 1986; Larrard and Malier, 1992; Kan and Swartz (1995); Zhou et al., 1995, and Giaccio and Zerbino, 1998.) The quality of the coarse aggregate is found to be the most important factor to fracture energy. An early study investigated the effect of coarse aggregate type with four different sources: crushed quartzite, sea-bottom gravel, crushed limestone, and expanded clay (Petersson, 1981). The study showed that the stronger aggregates (quartzite and gravel) yielded higher values of fracture energy than the two weaker aggregates. With a
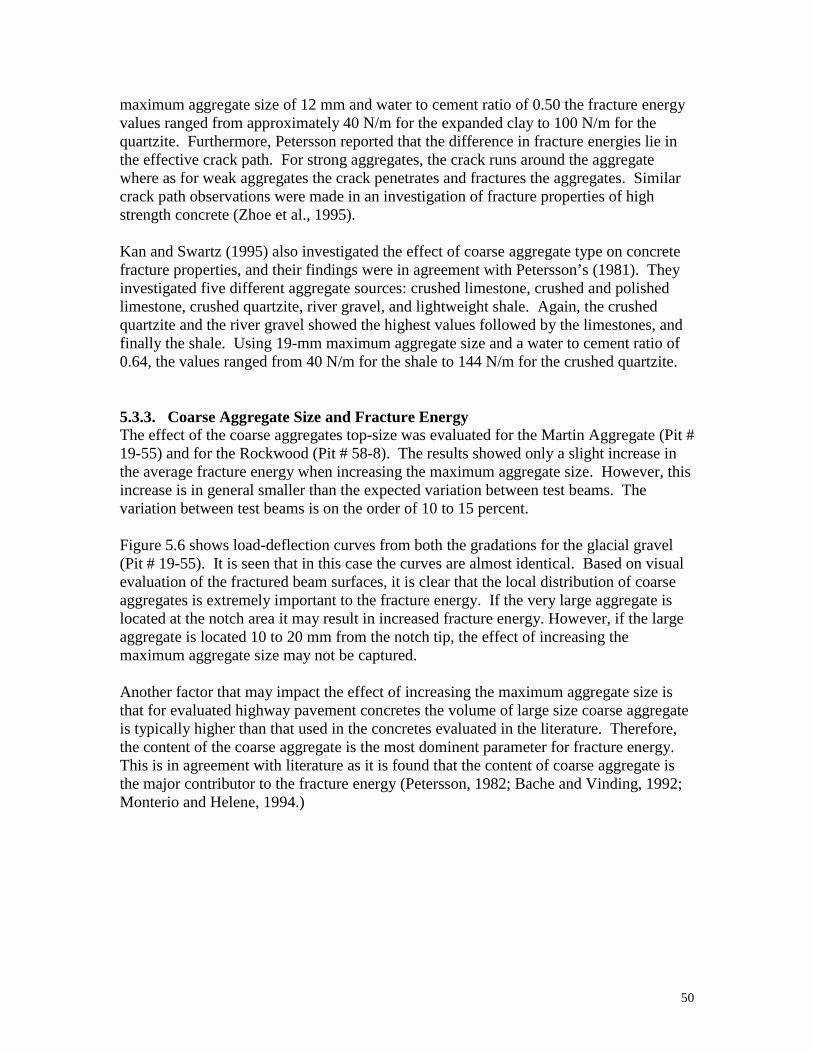
50
maximum aggregate size of 12 mm and water to cement ratio of 0.50 the fracture energy values ranged from approximately 40 N/m for the expanded clay to 100 N/m for the quartzite. Furthermore, Petersson reported that the difference in fracture energies lie in the effective crack path. For strong aggregates, the crack runs around the aggregate where as for weak aggregates the crack penetrates and fractures the aggregates. Similar crack path observations were made in an investigation of fracture properties of high strength concrete (Zhoe et al., 1995). Kan and Swartz (1995) also investigated the effect of coarse aggregate type on concrete fracture properties, and their findings were in agreement with Petersson’s (1981). They investigated five different aggregate sources: crushed limestone, crushed and polished limestone, crushed quartzite, river gravel, and lightweight shale. Again, the crushed quartzite and the river gravel showed the highest values followed by the limestones, and finally the shale. Using 19-mm maximum aggregate size and a water to cement ratio of 0.64, the values ranged from 40 N/m for the shale to 144 N/m for the crushed quartzite. 5.3.3. Coarse Aggregate Size and Fracture Energy The effect of the coarse aggregates top-size was evaluated for the Martin Aggregate (Pit # 19-55) and for the Rockwood (Pit # 58-8). The results showed only a slight increase in the average fracture energy when increasing the maximum aggregate size. However, this increase is in general smaller than the expected variation between test beams. The variation between test beams is on the order of 10 to 15 percent. Figure 5.6 shows load-deflection curves from both the gradations for the glacial gravel (Pit # 19-55). It is seen that in this case the curves are almost identical. Based on visual evaluation of the fractured beam surfaces, it is clear that the local distribution of coarse aggregates is extremely important to the fracture energy. If the very large aggregate is located at the notch area it may result in increased fracture energy. However, if the large aggregate is located 10 to 20 mm from the notch tip, the effect of increasing the maximum aggregate size may not be captured. Another factor that may impact the effect of increasing the maximum aggregate size is that for evaluated highway pavement concretes the volume of large size coarse aggregate is typically higher than that used in the concretes evaluated in the literature. Therefore, the content of the coarse aggregate is the most dominent parameter for fracture energy. This is in agreement with literature as it is found that the content of coarse aggregate is the major contributor to the fracture energy (Petersson, 1982; Bache and Vinding, 1992; Monterio and Helene, 1994.)
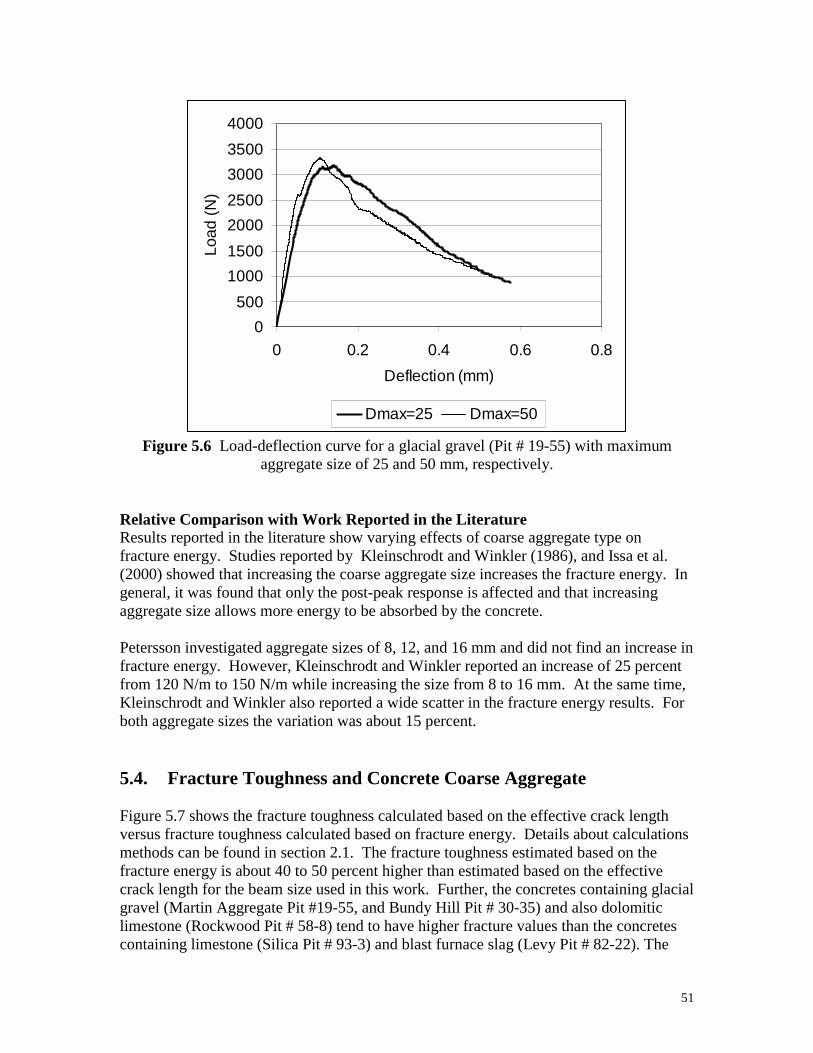
51
0
500
1000
1500
2000
2500
3000
3500
4000
0 0.2 0.4 0.6 0.8
Deflection (mm)
Load
(N
)
Dmax=25 Dmax=50
Figure 5.6 Load-deflection curve for a glacial gravel (Pit # 19-55) with maximum aggregate size of 25 and 50 mm, respectively.
Relative Comparison with Work Reported in the Literature Results reported in the literature show varying effects of coarse aggregate type on fracture energy. Studies reported by Kleinschrodt and Winkler (1986), and Issa et al. (2000) showed that increasing the coarse aggregate size increases the fracture energy. In general, it was found that only the post-peak response is affected and that increasing aggregate size allows more energy to be absorbed by the concrete. Petersson investigated aggregate sizes of 8, 12, and 16 mm and did not find an increase in fracture energy. However, Kleinschrodt and Winkler reported an increase of 25 percent from 120 N/m to 150 N/m while increasing the size from 8 to 16 mm. At the same time, Kleinschrodt and Winkler also reported a wide scatter in the fracture energy results. For both aggregate sizes the variation was about 15 percent. 5.4. Fracture Toughness and Concrete Coarse Aggregate Figure 5.7 shows the fracture toughness calculated based on the effective crack length versus fracture toughness calculated based on fracture energy. Details about calculations methods can be found in section 2.1. The fracture toughness estimated based on the fracture energy is about 40 to 50 percent higher than estimated based on the effective crack length for the beam size used in this work. Further, the concretes containing glacial gravel (Martin Aggregate Pit #19-55, and Bundy Hill Pit # 30-35) and also dolomitic limestone (Rockwood Pit # 58-8) tend to have higher fracture values than the concretes containing limestone (Silica Pit # 93-3) and blast furnace slag (Levy Pit # 82-22). The
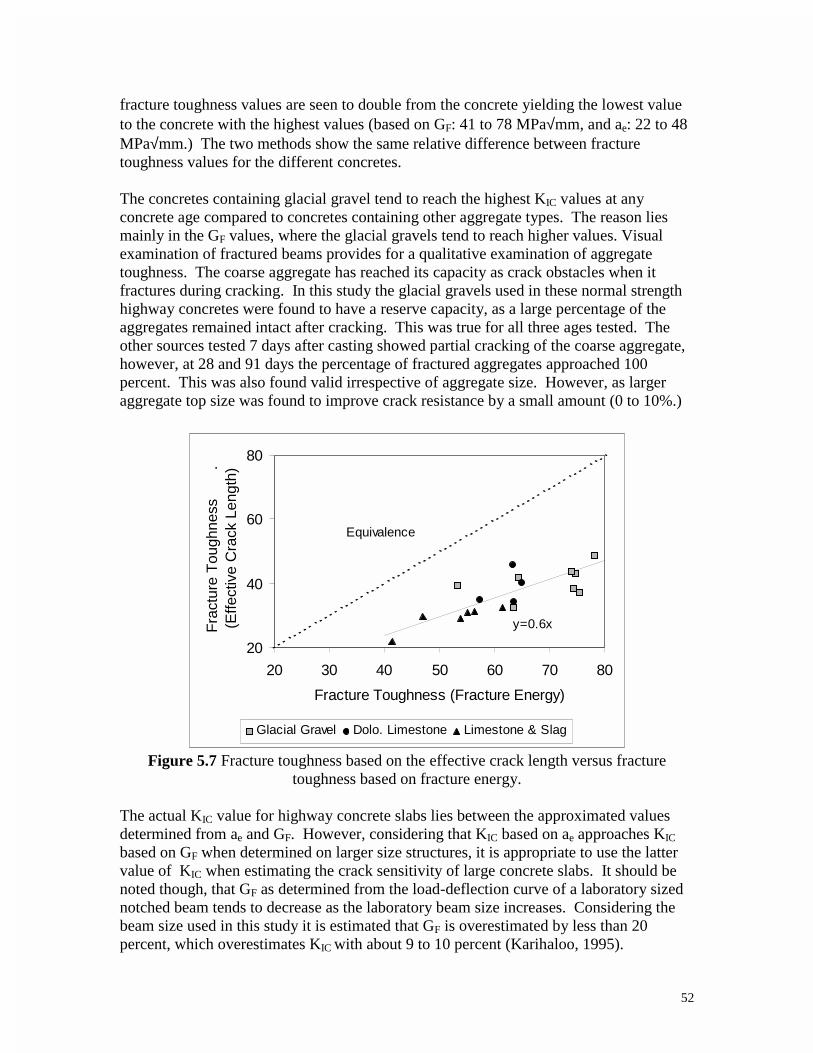
52
fracture toughness values are seen to double from the concrete yielding the lowest value to the concrete with the highest values (based on GF: 41 to 78 MPa√mm, and ae: 22 to 48 MPa√mm.) The two methods show the same relative difference between fracture toughness values for the different concretes. The concretes containing glacial gravel tend to reach the highest KIC values at any concrete age compared to concretes containing other aggregate types. The reason lies mainly in the GF values, where the glacial gravels tend to reach higher values. Visual examination of fractured beams provides for a qualitative examination of aggregate toughness. The coarse aggregate has reached its capacity as crack obstacles when it fractures during cracking. In this study the glacial gravels used in these normal strength highway concretes were found to have a reserve capacity, as a large percentage of the aggregates remained intact after cracking. This was true for all three ages tested. The other sources tested 7 days after casting showed partial cracking of the coarse aggregate, however, at 28 and 91 days the percentage of fractured aggregates approached 100 percent. This was also found valid irrespective of aggregate size. However, as larger aggregate top size was found to improve crack resistance by a small amount (0 to 10%.)
20
40
60
80
20 30 40 50 60 70 80
Fracture Toughness (Fracture Energy)
Fra
ctur
e T
ough
ness
.(E
ffect
ive
Cra
ck L
engt
h)
Glacial Gravel Dolo. Limestone Limestone & Slag
Equivalence
y=0.6x
Figure 5.7 Fracture toughness based on the effective crack length versus fracture
toughness based on fracture energy. The actual KIC value for highway concrete slabs lies between the approximated values determined from ae and GF. However, considering that KIC based on ae approaches KIC based on GF when determined on larger size structures, it is appropriate to use the latter value of KIC when estimating the crack sensitivity of large concrete slabs. It should be noted though, that GF as determined from the load-deflection curve of a laboratory sized notched beam tends to decrease as the laboratory beam size increases. Considering the beam size used in this study it is estimated that GF is overestimated by less than 20 percent, which overestimates KIC with about 9 to 10 percent (Karihaloo, 1995).
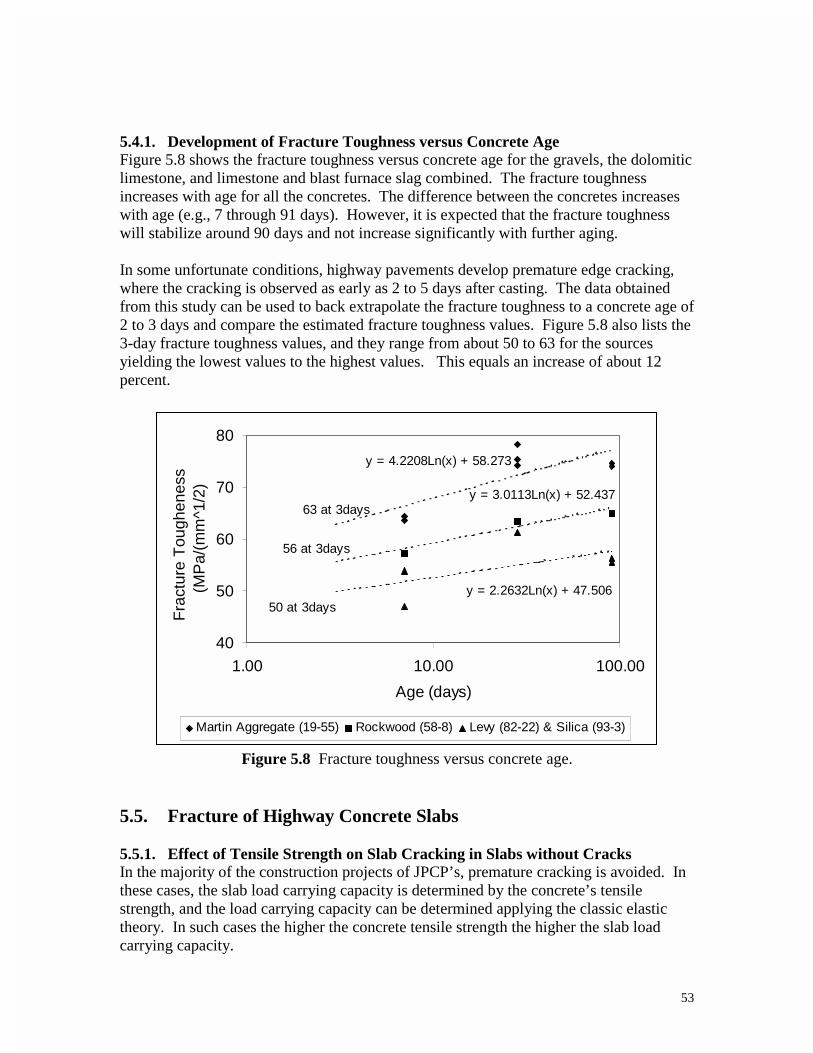
53
5.4.1. Development of Fracture Toughness versus Concrete Age Figure 5.8 shows the fracture toughness versus concrete age for the gravels, the dolomitic limestone, and limestone and blast furnace slag combined. The fracture toughness increases with age for all the concretes. The difference between the concretes increases with age (e.g., 7 through 91 days). However, it is expected that the fracture toughness will stabilize around 90 days and not increase significantly with further aging. In some unfortunate conditions, highway pavements develop premature edge cracking, where the cracking is observed as early as 2 to 5 days after casting. The data obtained from this study can be used to back extrapolate the fracture toughness to a concrete age of 2 to 3 days and compare the estimated fracture toughness values. Figure 5.8 also lists the 3-day fracture toughness values, and they range from about 50 to 63 for the sources yielding the lowest values to the highest values. This equals an increase of about 12 percent.
y = 4.2208Ln(x) + 58.273
y = 3.0113Ln(x) + 52.437
y = 2.2632Ln(x) + 47.506
40
50
60
70
80
1.00 10.00 100.00
Age (days)
Fra
ctur
e T
ough
enes
s
(MP
a/(m
m^1
/2)
Martin Aggregate (19-55) Rockwood (58-8) Levy (82-22) & Silica (93-3)
63 at 3days
56 at 3days
50 at 3days
Figure 5.8 Fracture toughness versus concrete age.
5.5. Fracture of Highway Concrete Slabs 5.5.1. Effect of Tensile Strength on Slab Cracking in Slabs without Cracks In the majority of the construction projects of JPCP’s, premature cracking is avoided. In these cases, the slab load carrying capacity is determined by the concrete’s tensile strength, and the load carrying capacity can be determined applying the classic elastic theory. In such cases the higher the concrete tensile strength the higher the slab load carrying capacity.
54
Figure 5.1 shows the relative strength development of the splitting tensile strength versus age. In general, the splitting tensile strengths developed faster for concretes containing blast furnace slag and crushed aggregate as compared to concretes containing glacial gravel. After 7 days of curing the concretes containing blast furnace slag and limestone achieved about 90 percent of their 28-day strength. However, the concretes containing glacial gravel achieved only about 70 percent of the28-day strength. Furthermore, it is noted that the concretes containing glacial gravel develop relatively higher strength at 91 day compared to the blast furnace slag and the crushed limestones concretes. In absolute terms the splitting tensile strength for the concretes containing glacial gravels was about 40 percent lower at 7 days compared to the concretes containing blast furnace slag and limestone. At 28 days there was no longer a distinct difference. The same trends are observed for the relative compressive strength development. Yet, the relative compressive strength gain is lower at 7 days and higher at 91 days as compared to the splitting tensile strength development. These data can also be back extrapolated to show the relative strength 2 to 3 days after concrete casting. Assuming that the 3-day difference is larger or equal to the 7-day difference, concretes containing e.g., blast furnace slag or crushed rock would have a 40 percent higher load carrying capacity in an uncracked slab compared to a concrete slab containing gravel. This is also in agreement with the findings on early age fracture toughness of highway concrete made by Soares and Zollinger (1997). They found that the concrete containing limestone was tougher than gravel concretes based on testing 6 and 12 hours after casting. At this early age the concrete strength and stiffness is dominated by the bond development between the matrix and the aggregates. Since crushed rock is known to develop bond faster than that of a gravel aggregate, early age fracture toughness and strength are expected to be higher for the concretes containing crushed rock and manufactured aggregates compared to the concrete containing gravel. However, the behavior reverses at later ages as illustrated in figures 5.7 and 5.8. 5.5.2. Effect of Fracture Toughness on Cracking in a Slab Containing an Edge
Crack A highway slab is a complicated structure due to the interaction between the slab and the foundation (e.g., friction and support). However, for evaluating the effect of edge cracks in highway concrete slabs, an existing closed form solution can be applied to illustrate the effect of a crack on the approximated failure load for a uni-axial tensile plate with a single-edge crack. Figure 5.9 shows the schematics of the plate with a single-edge crack.
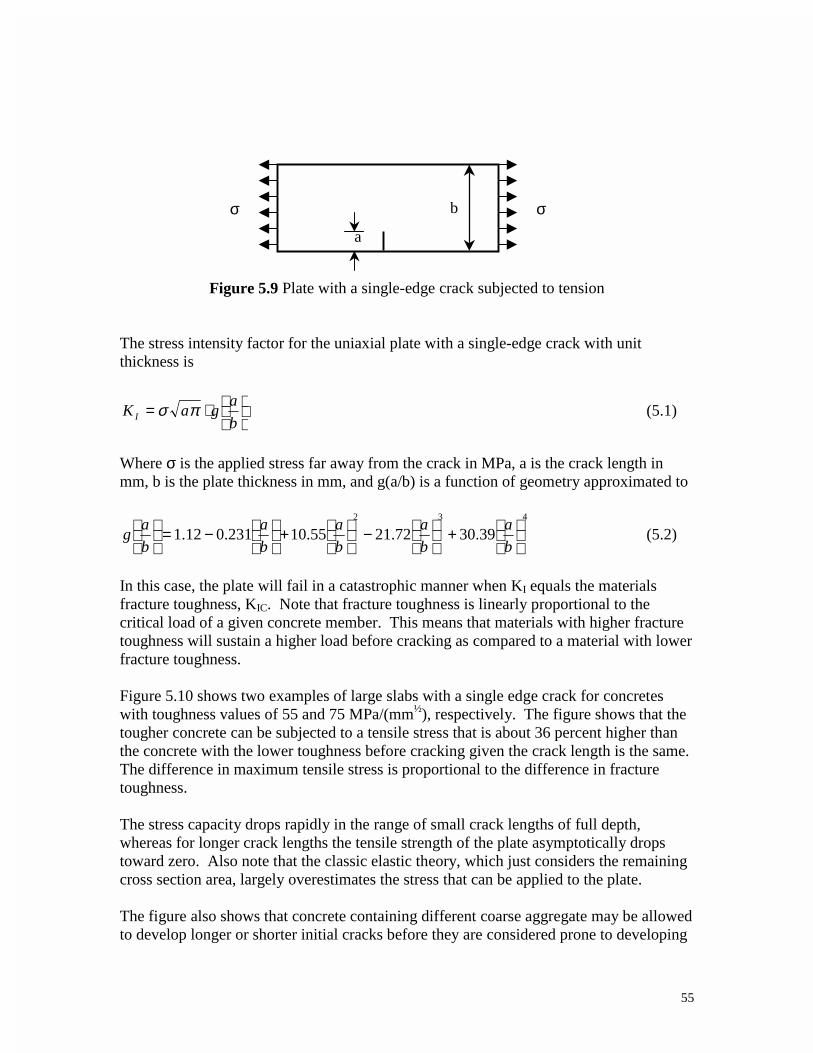
55
Figure 5.9 Plate with a single-edge crack subjected to tension The stress intensity factor for the uniaxial plate with a single-edge crack with unit thickness is
⋅=
b
agaK I πσ (5.1)
Where σ is the applied stress far away from the crack in MPa, a is the crack length in mm, b is the plate thickness in mm, and g(a/b) is a function of geometry approximated to
432
39.3072.2155.10231.012.1
+
−
+
−=
b
a
b
a
b
a
b
a
b
ag (5.2)
In this case, the plate will fail in a catastrophic manner when KI equals the materials fracture toughness, KIC. Note that fracture toughness is linearly proportional to the critical load of a given concrete member. This means that materials with higher fracture toughness will sustain a higher load before cracking as compared to a material with lower fracture toughness. Figure 5.10 shows two examples of large slabs with a single edge crack for concretes with toughness values of 55 and 75 MPa/(mm½), respectively. The figure shows that the tougher concrete can be subjected to a tensile stress that is about 36 percent higher than the concrete with the lower toughness before cracking given the crack length is the same. The difference in maximum tensile stress is proportional to the difference in fracture toughness. The stress capacity drops rapidly in the range of small crack lengths of full depth, whereas for longer crack lengths the tensile strength of the plate asymptotically drops toward zero. Also note that the classic elastic theory, which just considers the remaining cross section area, largely overestimates the stress that can be applied to the plate. The figure also shows that concrete containing different coarse aggregate may be allowed to develop longer or shorter initial cracks before they are considered prone to developing
b
a
σ σ
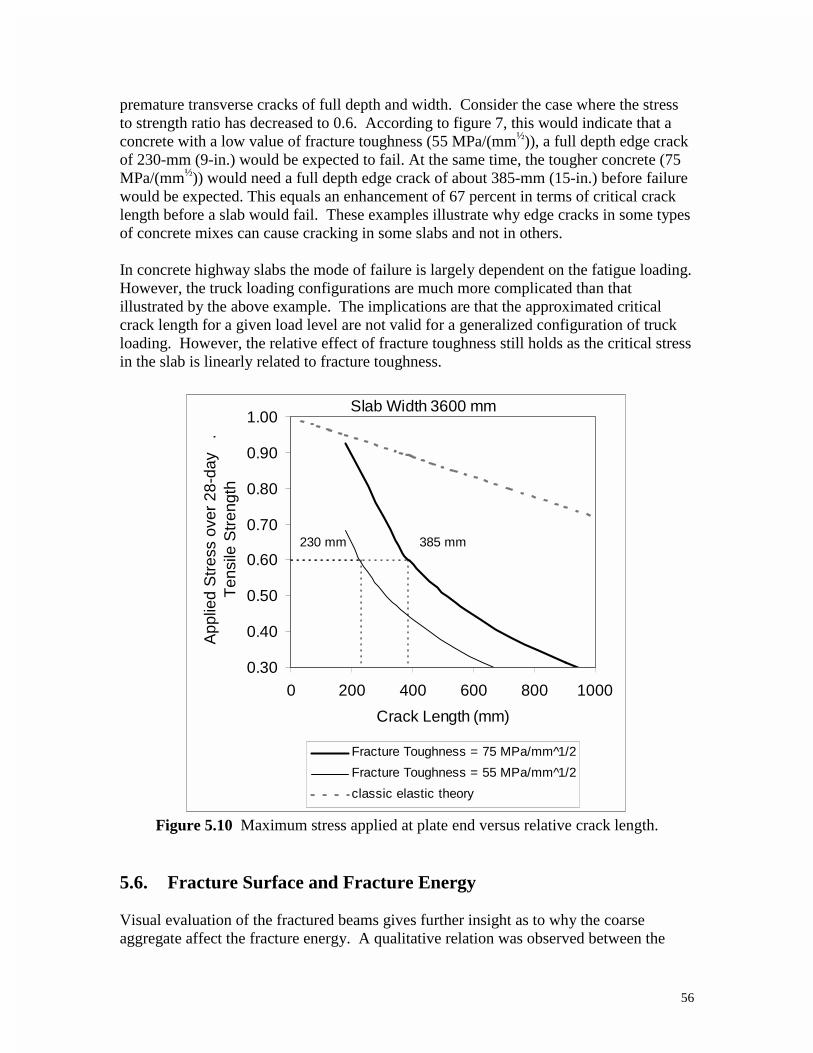
56
premature transverse cracks of full depth and width. Consider the case where the stress to strength ratio has decreased to 0.6. According to figure 7, this would indicate that a concrete with a low value of fracture toughness (55 MPa/(mm½)), a full depth edge crack of 230-mm (9-in.) would be expected to fail. At the same time, the tougher concrete (75 MPa/(mm½)) would need a full depth edge crack of about 385-mm (15-in.) before failure would be expected. This equals an enhancement of 67 percent in terms of critical crack length before a slab would fail. These examples illustrate why edge cracks in some types of concrete mixes can cause cracking in some slabs and not in others. In concrete highway slabs the mode of failure is largely dependent on the fatigue loading. However, the truck loading configurations are much more complicated than that illustrated by the above example. The implications are that the approximated critical crack length for a given load level are not valid for a generalized configuration of truck loading. However, the relative effect of fracture toughness still holds as the critical stress in the slab is linearly related to fracture toughness.
0.30
0.40
0.50
0.60
0.70
0.80
0.90
1.00
0 200 400 600 800 1000
Crack Length (mm)
App
lied
Str
ess
over
28-
day
.T
ensi
le S
tren
gth
Fracture Toughness = 75 MPa/mm 1̂/2
Fracture Toughness = 55 MPa/mm 1̂/2
classic elastic theory
Slab Width 3600 mm
230 mm 385 mm
Figure 5.10 Maximum stress applied at plate end versus relative crack length.
5.6. Fracture Surface and Fracture Energy Visual evaluation of the fractured beams gives further insight as to why the coarse aggregate affect the fracture energy. A qualitative relation was observed between the
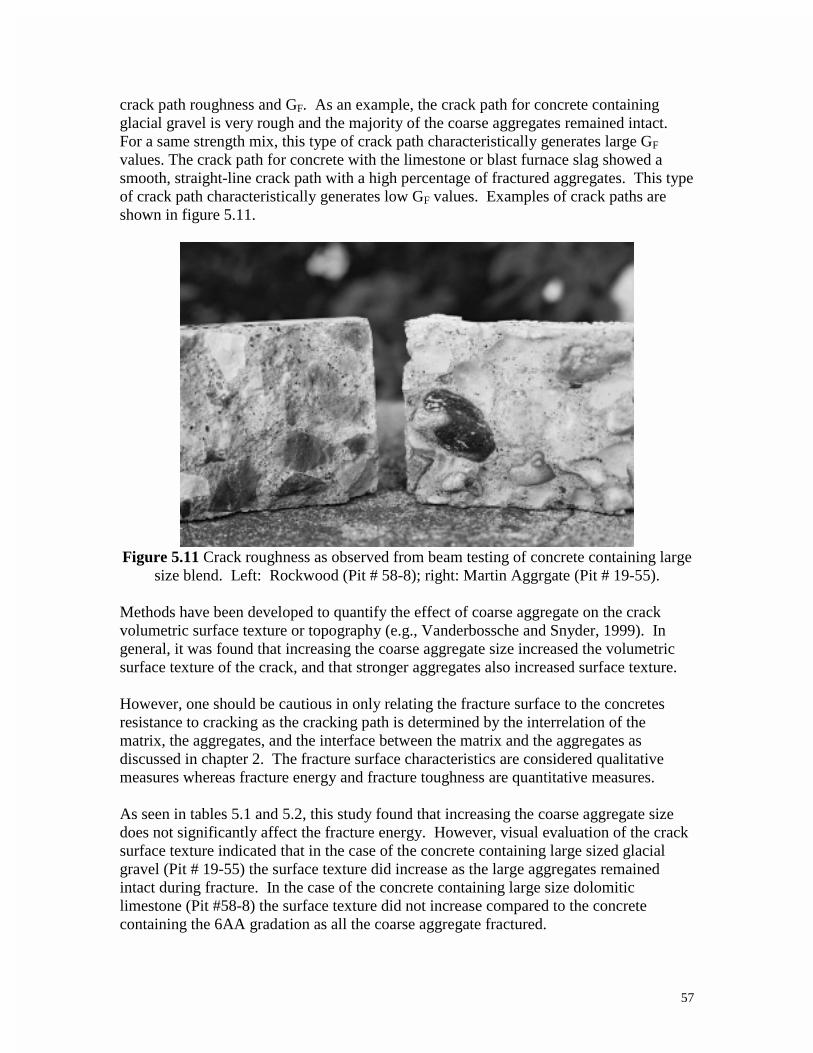
57
crack path roughness and GF. As an example, the crack path for concrete containing glacial gravel is very rough and the majority of the coarse aggregates remained intact. For a same strength mix, this type of crack path characteristically generates large GF values. The crack path for concrete with the limestone or blast furnace slag showed a smooth, straight-line crack path with a high percentage of fractured aggregates. This type of crack path characteristically generates low GF values. Examples of crack paths are shown in figure 5.11.
Figure 5.11 Crack roughness as observed from beam testing of concrete containing large
size blend. Left: Rockwood (Pit # 58-8); right: Martin Aggrgate (Pit # 19-55). Methods have been developed to quantify the effect of coarse aggregate on the crack volumetric surface texture or topography (e.g., Vanderbossche and Snyder, 1999). In general, it was found that increasing the coarse aggregate size increased the volumetric surface texture of the crack, and that stronger aggregates also increased surface texture. However, one should be cautious in only relating the fracture surface to the concretes resistance to cracking as the cracking path is determined by the interrelation of the matrix, the aggregates, and the interface between the matrix and the aggregates as discussed in chapter 2. The fracture surface characteristics are considered qualitative measures whereas fracture energy and fracture toughness are quantitative measures. As seen in tables 5.1 and 5.2, this study found that increasing the coarse aggregate size does not significantly affect the fracture energy. However, visual evaluation of the crack surface texture indicated that in the case of the concrete containing large sized glacial gravel (Pit # 19-55) the surface texture did increase as the large aggregates remained intact during fracture. In the case of the concrete containing large size dolomitic limestone (Pit #58-8) the surface texture did not increase compared to the concrete containing the 6AA gradation as all the coarse aggregate fractured.
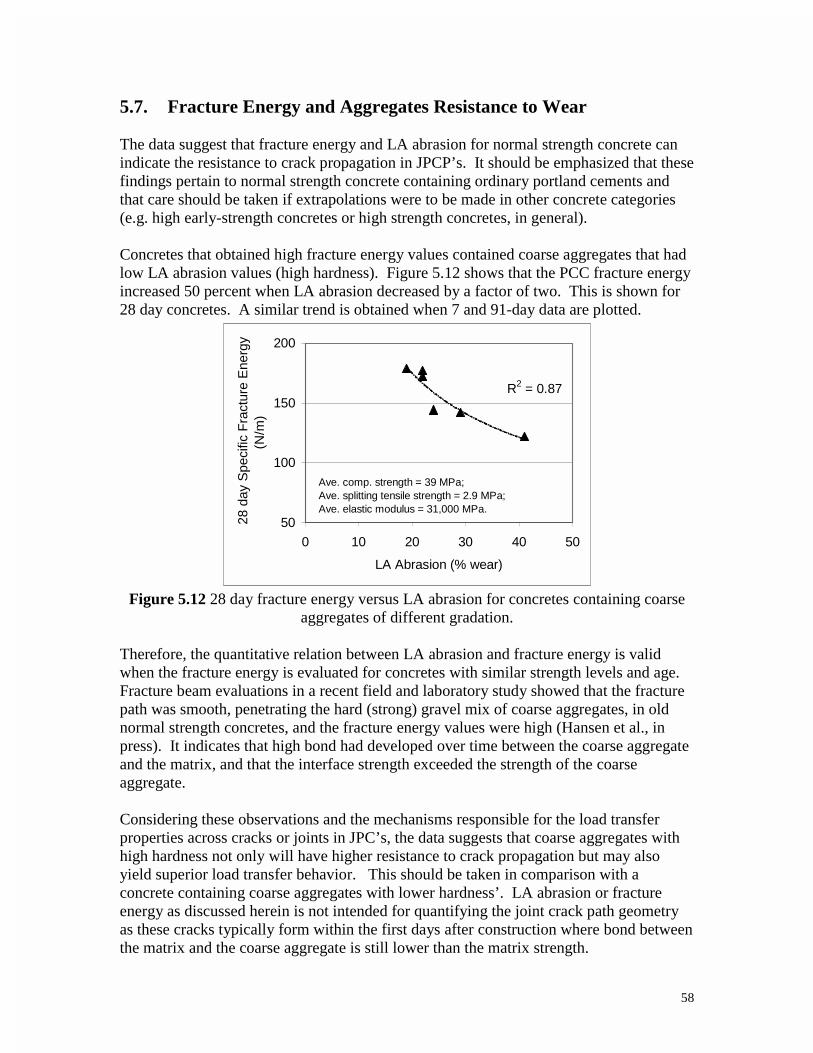
58
5.7. Fracture Energy and Aggregates Resistance to Wear The data suggest that fracture energy and LA abrasion for normal strength concrete can indicate the resistance to crack propagation in JPCP’s. It should be emphasized that these findings pertain to normal strength concrete containing ordinary portland cements and that care should be taken if extrapolations were to be made in other concrete categories (e.g. high early-strength concretes or high strength concretes, in general). Concretes that obtained high fracture energy values contained coarse aggregates that had low LA abrasion values (high hardness). Figure 5.12 shows that the PCC fracture energy increased 50 percent when LA abrasion decreased by a factor of two. This is shown for 28 day concretes. A similar trend is obtained when 7 and 91-day data are plotted.
R2 = 0.87
50
100
150
200
0 10 20 30 40 50
LA Abrasion (% wear)
28
day
Spe
cific
Fra
ctur
e E
nerg
y (N
/m)
Ave. comp. strength = 39 MPa;Ave. splitting tensile strength = 2.9 MPa;Ave. elastic modulus = 31,000 MPa.
Figure 5.12 28 day fracture energy versus LA abrasion for concretes containing coarse
aggregates of different gradation. Therefore, the quantitative relation between LA abrasion and fracture energy is valid when the fracture energy is evaluated for concretes with similar strength levels and age. Fracture beam evaluations in a recent field and laboratory study showed that the fracture path was smooth, penetrating the hard (strong) gravel mix of coarse aggregates, in old normal strength concretes, and the fracture energy values were high (Hansen et al., in press). It indicates that high bond had developed over time between the coarse aggregate and the matrix, and that the interface strength exceeded the strength of the coarse aggregate. Considering these observations and the mechanisms responsible for the load transfer properties across cracks or joints in JPC’s, the data suggests that coarse aggregates with high hardness not only will have higher resistance to crack propagation but may also yield superior load transfer behavior. This should be taken in comparison with a concrete containing coarse aggregates with lower hardness’. LA abrasion or fracture energy as discussed herein is not intended for quantifying the joint crack path geometry as these cracks typically form within the first days after construction where bond between the matrix and the coarse aggregate is still lower than the matrix strength.
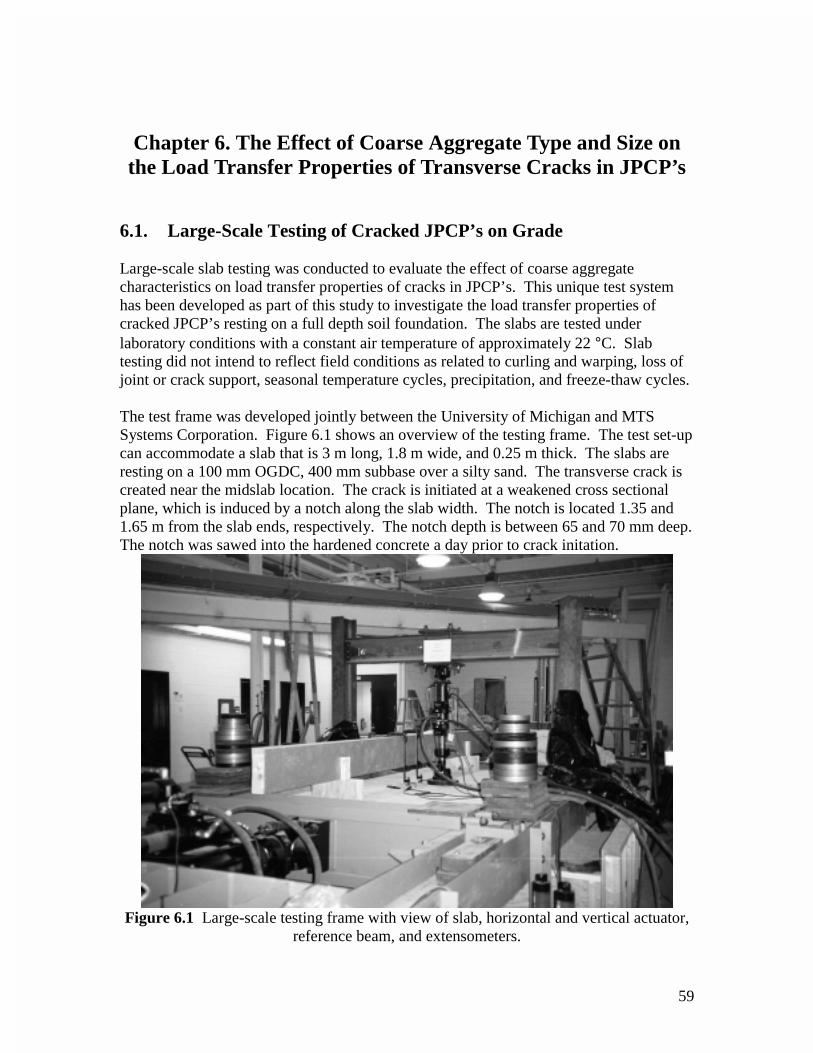
59
Chapter 6. The Effect of Coarse Aggregate Type and Size on the Load Transfer Properties of Transverse Cracks in JPCP’s
6.1. Large-Scale Testing of Cracked JPCP’s on Grade Large-scale slab testing was conducted to evaluate the effect of coarse aggregate characteristics on load transfer properties of cracks in JPCP’s. This unique test system has been developed as part of this study to investigate the load transfer properties of cracked JPCP’s resting on a full depth soil foundation. The slabs are tested under laboratory conditions with a constant air temperature of approximately 22 °C. Slab testing did not intend to reflect field conditions as related to curling and warping, loss of joint or crack support, seasonal temperature cycles, precipitation, and freeze-thaw cycles. The test frame was developed jointly between the University of Michigan and MTS Systems Corporation. Figure 6.1 shows an overview of the testing frame. The test set-up can accommodate a slab that is 3 m long, 1.8 m wide, and 0.25 m thick. The slabs are resting on a 100 mm OGDC, 400 mm subbase over a silty sand. The transverse crack is created near the midslab location. The crack is initiated at a weakened cross sectional plane, which is induced by a notch along the slab width. The notch is located 1.35 and 1.65 m from the slab ends, respectively. The notch depth is between 65 and 70 mm deep. The notch was sawed into the hardened concrete a day prior to crack initation.
Figure 6.1 Large-scale testing frame with view of slab, horizontal and vertical actuator,
reference beam, and extensometers.
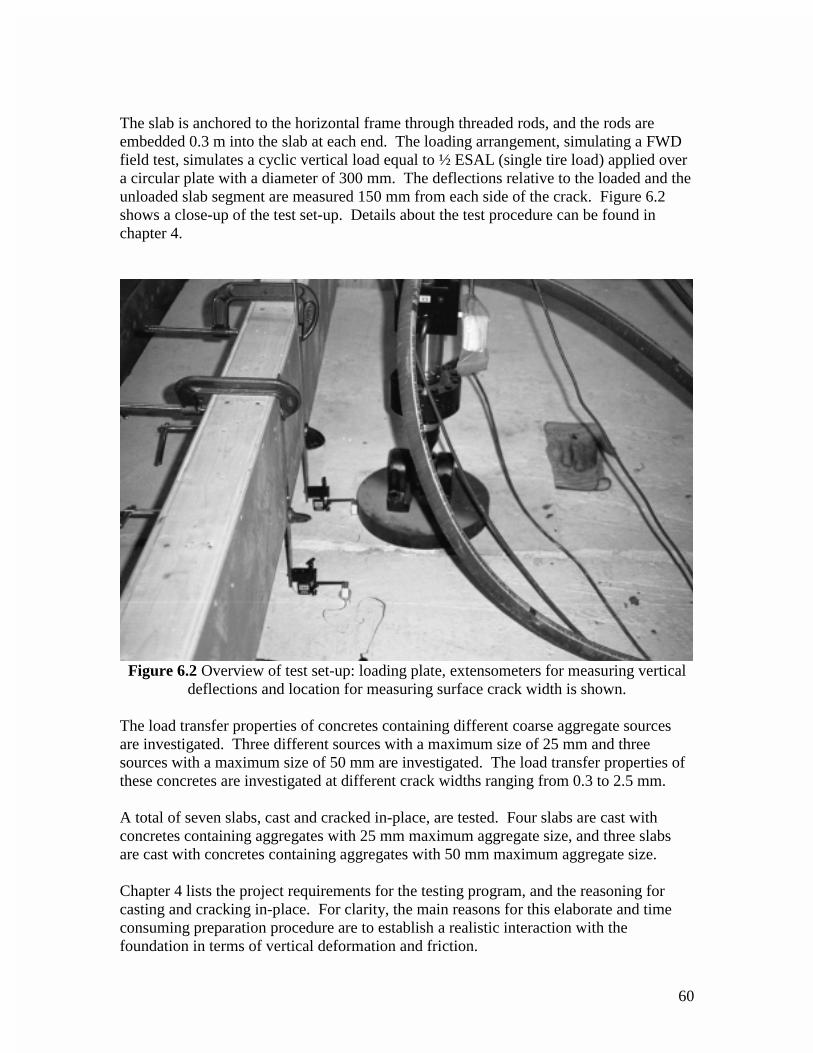
60
The slab is anchored to the horizontal frame through threaded rods, and the rods are embedded 0.3 m into the slab at each end. The loading arrangement, simulating a FWD field test, simulates a cyclic vertical load equal to ½ ESAL (single tire load) applied over a circular plate with a diameter of 300 mm. The deflections relative to the loaded and the unloaded slab segment are measured 150 mm from each side of the crack. Figure 6.2 shows a close-up of the test set-up. Details about the test procedure can be found in chapter 4.
Figure 6.2 Overview of test set-up: loading plate, extensometers for measuring vertical
deflections and location for measuring surface crack width is shown. The load transfer properties of concretes containing different coarse aggregate sources are investigated. Three different sources with a maximum size of 25 mm and three sources with a maximum size of 50 mm are investigated. The load transfer properties of these concretes are investigated at different crack widths ranging from 0.3 to 2.5 mm. A total of seven slabs, cast and cracked in-place, are tested. Four slabs are cast with concretes containing aggregates with 25 mm maximum aggregate size, and three slabs are cast with concretes containing aggregates with 50 mm maximum aggregate size. Chapter 4 lists the project requirements for the testing program, and the reasoning for casting and cracking in-place. For clarity, the main reasons for this elaborate and time consuming preparation procedure are to establish a realistic interaction with the foundation in terms of vertical deformation and friction.
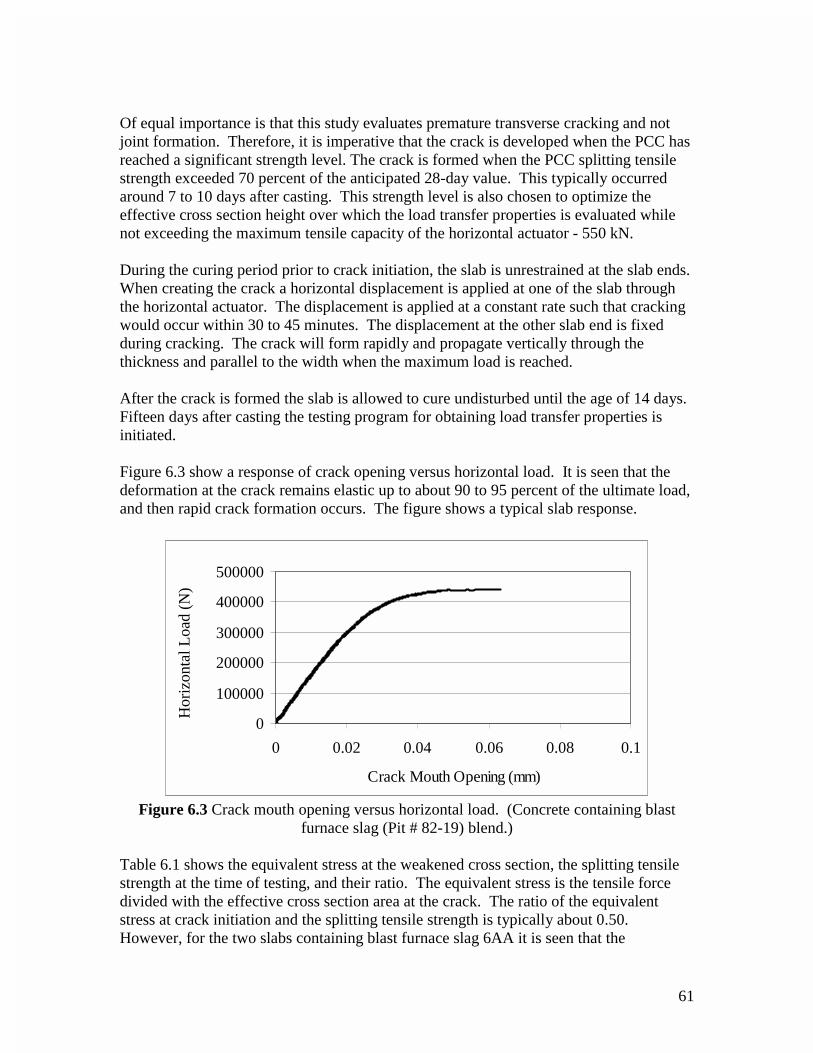
61
Of equal importance is that this study evaluates premature transverse cracking and not joint formation. Therefore, it is imperative that the crack is developed when the PCC has reached a significant strength level. The crack is formed when the PCC splitting tensile strength exceeded 70 percent of the anticipated 28-day value. This typically occurred around 7 to 10 days after casting. This strength level is also chosen to optimize the effective cross section height over which the load transfer properties is evaluated while not exceeding the maximum tensile capacity of the horizontal actuator - 550 kN. During the curing period prior to crack initiation, the slab is unrestrained at the slab ends. When creating the crack a horizontal displacement is applied at one of the slab through the horizontal actuator. The displacement is applied at a constant rate such that cracking would occur within 30 to 45 minutes. The displacement at the other slab end is fixed during cracking. The crack will form rapidly and propagate vertically through the thickness and parallel to the width when the maximum load is reached. After the crack is formed the slab is allowed to cure undisturbed until the age of 14 days. Fifteen days after casting the testing program for obtaining load transfer properties is initiated. Figure 6.3 show a response of crack opening versus horizontal load. It is seen that the deformation at the crack remains elastic up to about 90 to 95 percent of the ultimate load, and then rapid crack formation occurs. The figure shows a typical slab response.
0
100000
200000
300000
400000
500000
0 0.02 0.04 0.06 0.08 0.1
Crack Mouth Opening (mm)
Hor
izon
tal L
oad
(N)
Figure 6.3 Crack mouth opening versus horizontal load. (Concrete containing blast
furnace slag (Pit # 82-19) blend.) Table 6.1 shows the equivalent stress at the weakened cross section, the splitting tensile strength at the time of testing, and their ratio. The equivalent stress is the tensile force divided with the effective cross section area at the crack. The ratio of the equivalent stress at crack initiation and the splitting tensile strength is typically about 0.50. However, for the two slabs containing blast furnace slag 6AA it is seen that the
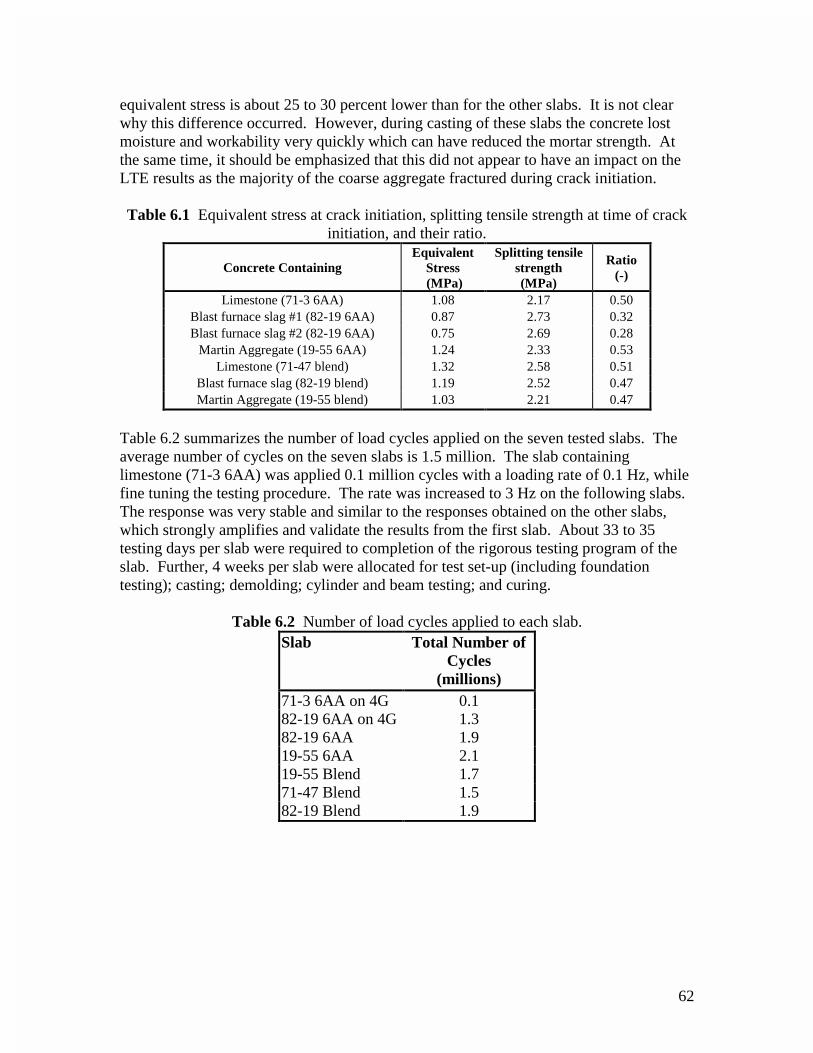
62
equivalent stress is about 25 to 30 percent lower than for the other slabs. It is not clear why this difference occurred. However, during casting of these slabs the concrete lost moisture and workability very quickly which can have reduced the mortar strength. At the same time, it should be emphasized that this did not appear to have an impact on the LTE results as the majority of the coarse aggregate fractured during crack initiation. Table 6.1 Equivalent stress at crack initiation, splitting tensile strength at time of crack
initiation, and their ratio.
Concrete Containing Equivalent
Stress (MPa)
Splitting tensile strength (MPa)
Ratio (-)
Limestone (71-3 6AA) 1.08 2.17 0.50 Blast furnace slag #1 (82-19 6AA) 0.87 2.73 0.32 Blast furnace slag #2 (82-19 6AA) 0.75 2.69 0.28
Martin Aggregate (19-55 6AA) 1.24 2.33 0.53 Limestone (71-47 blend) 1.32 2.58 0.51
Blast furnace slag (82-19 blend) 1.19 2.52 0.47 Martin Aggregate (19-55 blend) 1.03 2.21 0.47
Table 6.2 summarizes the number of load cycles applied on the seven tested slabs. The average number of cycles on the seven slabs is 1.5 million. The slab containing limestone (71-3 6AA) was applied 0.1 million cycles with a loading rate of 0.1 Hz, while fine tuning the testing procedure. The rate was increased to 3 Hz on the following slabs. The response was very stable and similar to the responses obtained on the other slabs, which strongly amplifies and validate the results from the first slab. About 33 to 35 testing days per slab were required to completion of the rigorous testing program of the slab. Further, 4 weeks per slab were allocated for test set-up (including foundation testing); casting; demolding; cylinder and beam testing; and curing.
Table 6.2 Number of load cycles applied to each slab. Slab Total Number of
Cycles (millions)
71-3 6AA on 4G 0.1 82-19 6AA on 4G 1.3 82-19 6AA 1.9 19-55 6AA 2.1 19-55 Blend 1.7 71-47 Blend 1.5 82-19 Blend 1.9
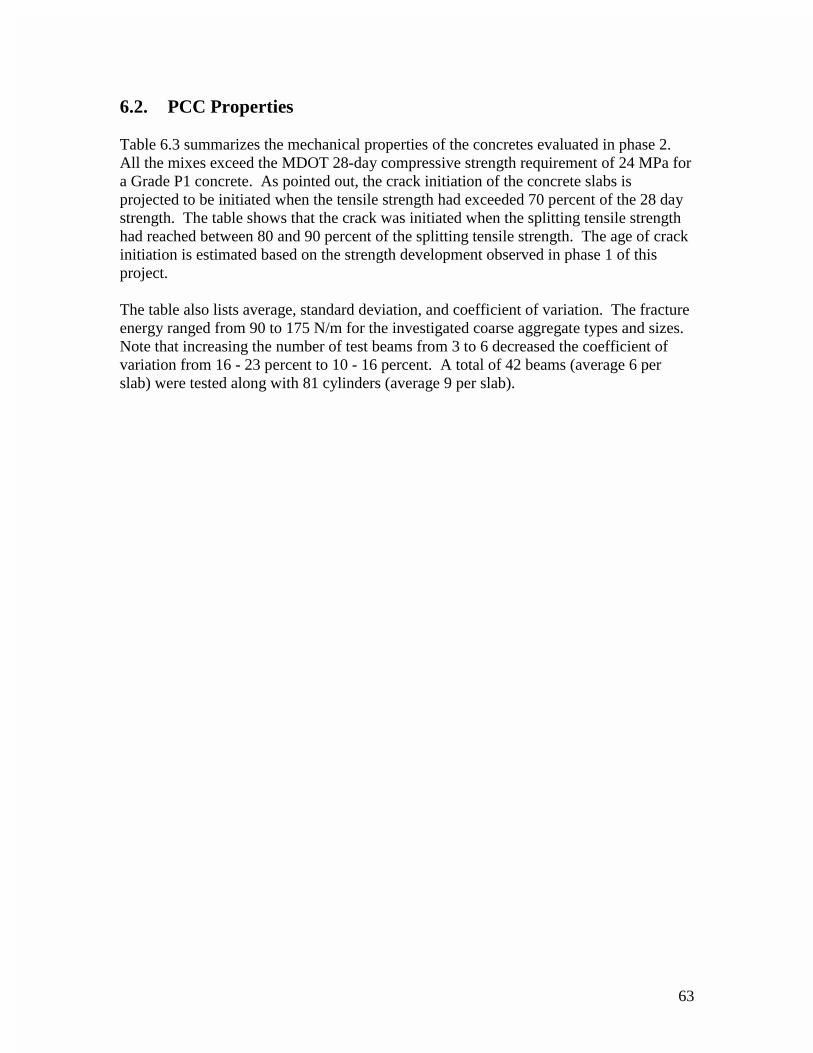
63
6.2. PCC Properties Table 6.3 summarizes the mechanical properties of the concretes evaluated in phase 2. All the mixes exceed the MDOT 28-day compressive strength requirement of 24 MPa for a Grade P1 concrete. As pointed out, the crack initiation of the concrete slabs is projected to be initiated when the tensile strength had exceeded 70 percent of the 28 day strength. The table shows that the crack was initiated when the splitting tensile strength had reached between 80 and 90 percent of the splitting tensile strength. The age of crack initiation is estimated based on the strength development observed in phase 1 of this project. The table also lists average, standard deviation, and coefficient of variation. The fracture energy ranged from 90 to 175 N/m for the investigated coarse aggregate types and sizes. Note that increasing the number of test beams from 3 to 6 decreased the coefficient of variation from 16 - 23 percent to 10 - 16 percent. A total of 42 beams (average 6 per slab) were tested along with 81 cylinders (average 9 per slab).
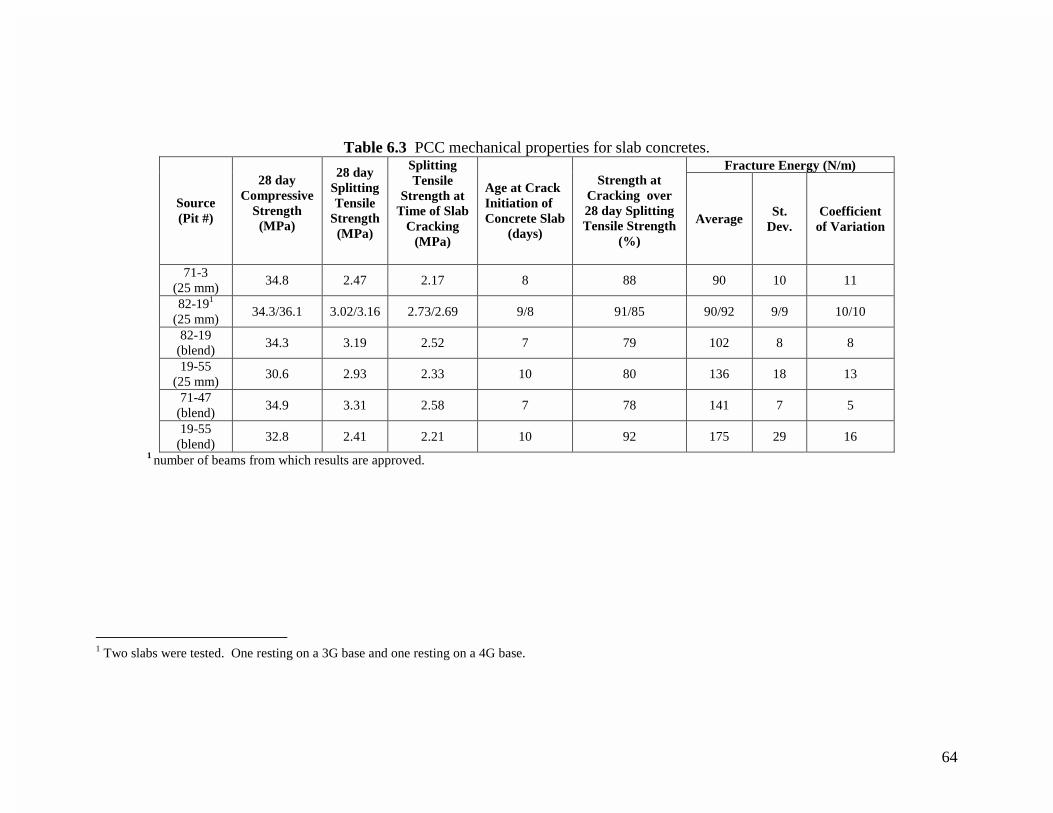
64
Table 6.3 PCC mechanical properties for slab concretes.
Fracture Energy (N/m)
Source (Pit #)
28 day Compressive
Strength (MPa)
28 day Splitting Tensile
Strength (MPa)
Splitting Tensile
Strength at Time of Slab
Cracking (MPa)
Age at Crack Initiation of Concrete Slab
(days)
Strength at Cracking over 28 day Splitting Tensile Strength
(%)
Average St.
Dev. Coefficient
of Variation
71-3 (25 mm)
34.8 2.47 2.17 8 88 90 10 11
82-191 (25 mm)
34.3/36.1 3.02/3.16 2.73/2.69 9/8 91/85 90/92 9/9 10/10
82-19 (blend)
34.3 3.19 2.52 7 79 102 8 8
19-55 (25 mm)
30.6 2.93 2.33 10 80 136 18 13
71-47 (blend)
34.9 3.31 2.58 7 78 141 7 5
19-55 (blend)
32.8 2.41 2.21 10 92 175 29 16
1 number of beams from which results are approved.
1 Two slabs were tested. One resting on a 3G base and one resting on a 4G base.
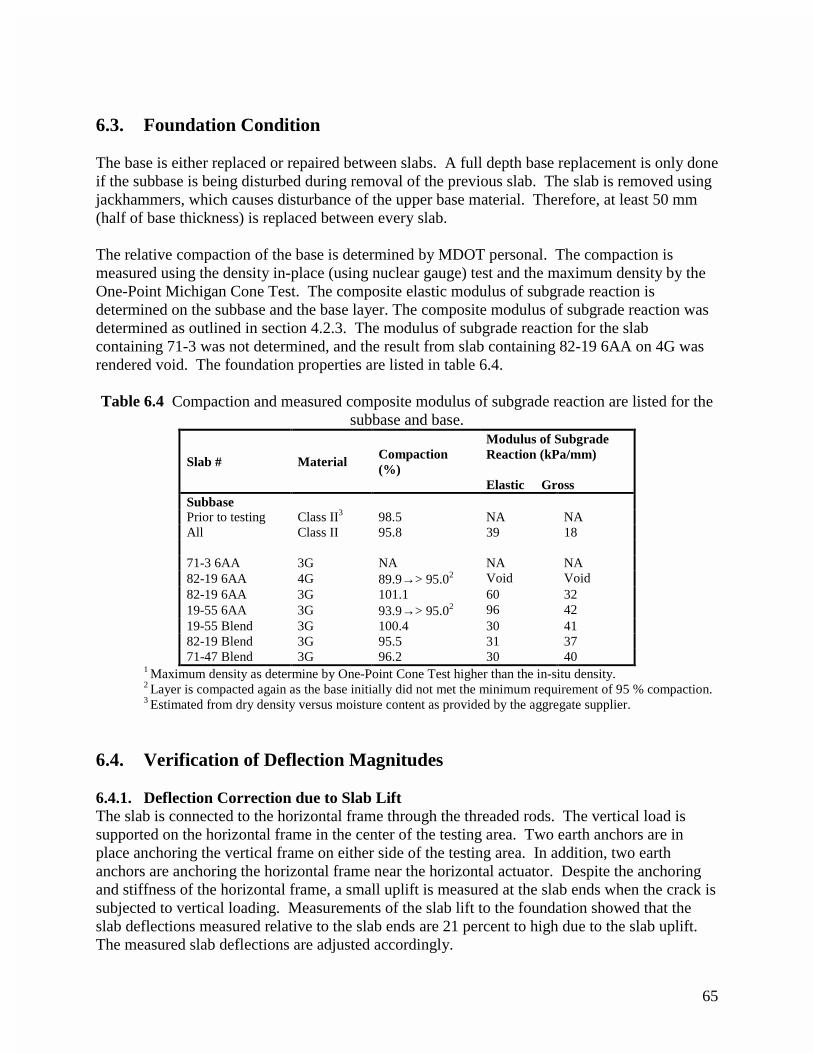
65
6.3. Foundation Condition The base is either replaced or repaired between slabs. A full depth base replacement is only done if the subbase is being disturbed during removal of the previous slab. The slab is removed using jackhammers, which causes disturbance of the upper base material. Therefore, at least 50 mm (half of base thickness) is replaced between every slab. The relative compaction of the base is determined by MDOT personal. The compaction is measured using the density in-place (using nuclear gauge) test and the maximum density by the One-Point Michigan Cone Test. The composite elastic modulus of subgrade reaction is determined on the subbase and the base layer. The composite modulus of subgrade reaction was determined as outlined in section 4.2.3. The modulus of subgrade reaction for the slab containing 71-3 was not determined, and the result from slab containing 82-19 6AA on 4G was rendered void. The foundation properties are listed in table 6.4. Table 6.4 Compaction and measured composite modulus of subgrade reaction are listed for the
subbase and base.
Slab # Material Compaction (%)
Modulus of Subgrade Reaction (kPa/mm) Elastic Gross
Subbase Prior to testing Class II3 98.5 NA NA All Class II 95.8 39 18 71-3 6AA 3G NA NA NA 82-19 6AA 4G 89.9→> 95.02 Void Void 82-19 6AA 3G 101.1 60 32 19-55 6AA 3G 93.9→> 95.02 96 42 19-55 Blend 3G 100.4 30 41 82-19 Blend 3G 95.5 31 37 71-47 Blend 3G 96.2 30 40
1 Maximum density as determine by One-Point Cone Test higher than the in-situ density. 2 Layer is compacted again as the base initially did not met the minimum requirement of 95 % compaction. 3 Estimated from dry density versus moisture content as provided by the aggregate supplier.
6.4. Verification of Deflection Magnitudes 6.4.1. Deflection Correction due to Slab Lift The slab is connected to the horizontal frame through the threaded rods. The vertical load is supported on the horizontal frame in the center of the testing area. Two earth anchors are in place anchoring the vertical frame on either side of the testing area. In addition, two earth anchors are anchoring the horizontal frame near the horizontal actuator. Despite the anchoring and stiffness of the horizontal frame, a small uplift is measured at the slab ends when the crack is subjected to vertical loading. Measurements of the slab lift to the foundation showed that the slab deflections measured relative to the slab ends are 21 percent to high due to the slab uplift. The measured slab deflections are adjusted accordingly.
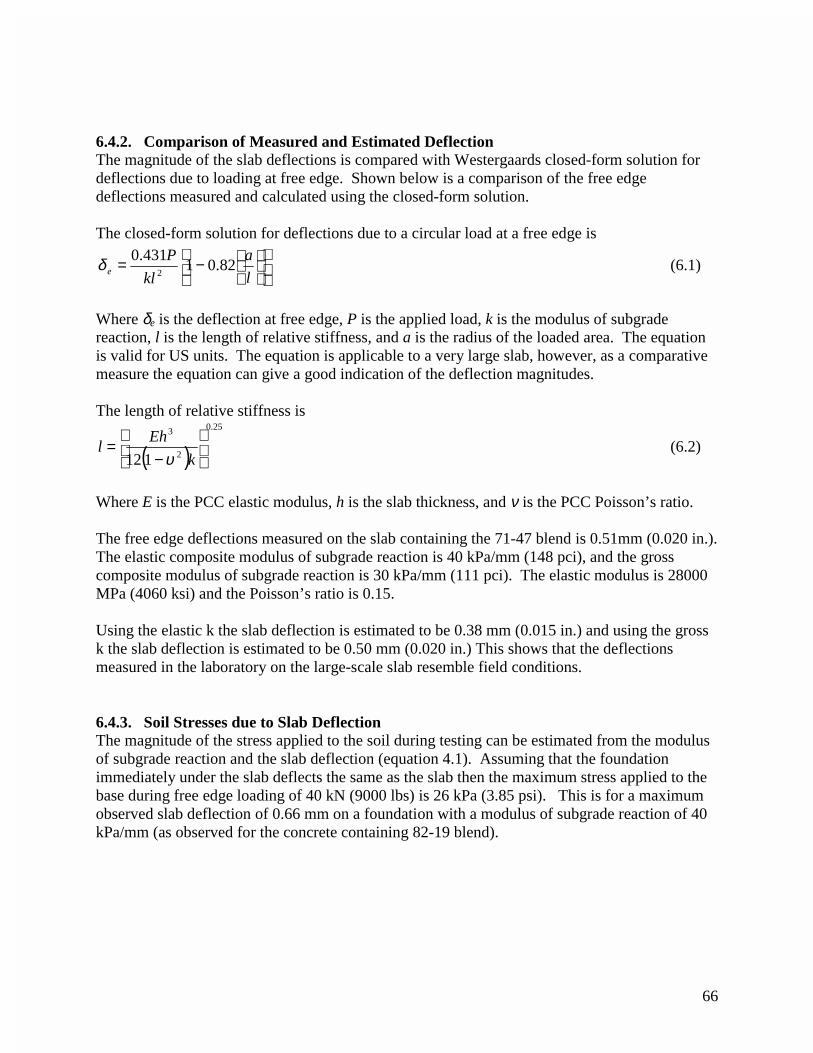
66
6.4.2. Comparison of Measured and Estimated Deflection The magnitude of the slab deflections is compared with Westergaards closed-form solution for deflections due to loading at free edge. Shown below is a comparison of the free edge deflections measured and calculated using the closed-form solution. The closed-form solution for deflections due to a circular load at a free edge is
−=
l
a
kl
Pe 82.01
431.02
δ (6.1)
Where δe is the deflection at free edge, P is the applied load, k is the modulus of subgrade reaction, l is the length of relative stiffness, and a is the radius of the loaded area. The equation is valid for US units. The equation is applicable to a very large slab, however, as a comparative measure the equation can give a good indication of the deflection magnitudes. The length of relative stiffness is
( )25.0
2
3
112
−
=k
Ehl
υ (6.2)
Where E is the PCC elastic modulus, h is the slab thickness, and ν is the PCC Poisson’s ratio. The free edge deflections measured on the slab containing the 71-47 blend is 0.51mm (0.020 in.). The elastic composite modulus of subgrade reaction is 40 kPa/mm (148 pci), and the gross composite modulus of subgrade reaction is 30 kPa/mm (111 pci). The elastic modulus is 28000 MPa (4060 ksi) and the Poisson’s ratio is 0.15. Using the elastic k the slab deflection is estimated to be 0.38 mm (0.015 in.) and using the gross k the slab deflection is estimated to be 0.50 mm (0.020 in.) This shows that the deflections measured in the laboratory on the large-scale slab resemble field conditions. 6.4.3. Soil Stresses due to Slab Deflection The magnitude of the stress applied to the soil during testing can be estimated from the modulus of subgrade reaction and the slab deflection (equation 4.1). Assuming that the foundation immediately under the slab deflects the same as the slab then the maximum stress applied to the base during free edge loading of 40 kN (9000 lbs) is 26 kPa (3.85 psi). This is for a maximum observed slab deflection of 0.66 mm on a foundation with a modulus of subgrade reaction of 40 kPa/mm (as observed for the concrete containing 82-19 blend).
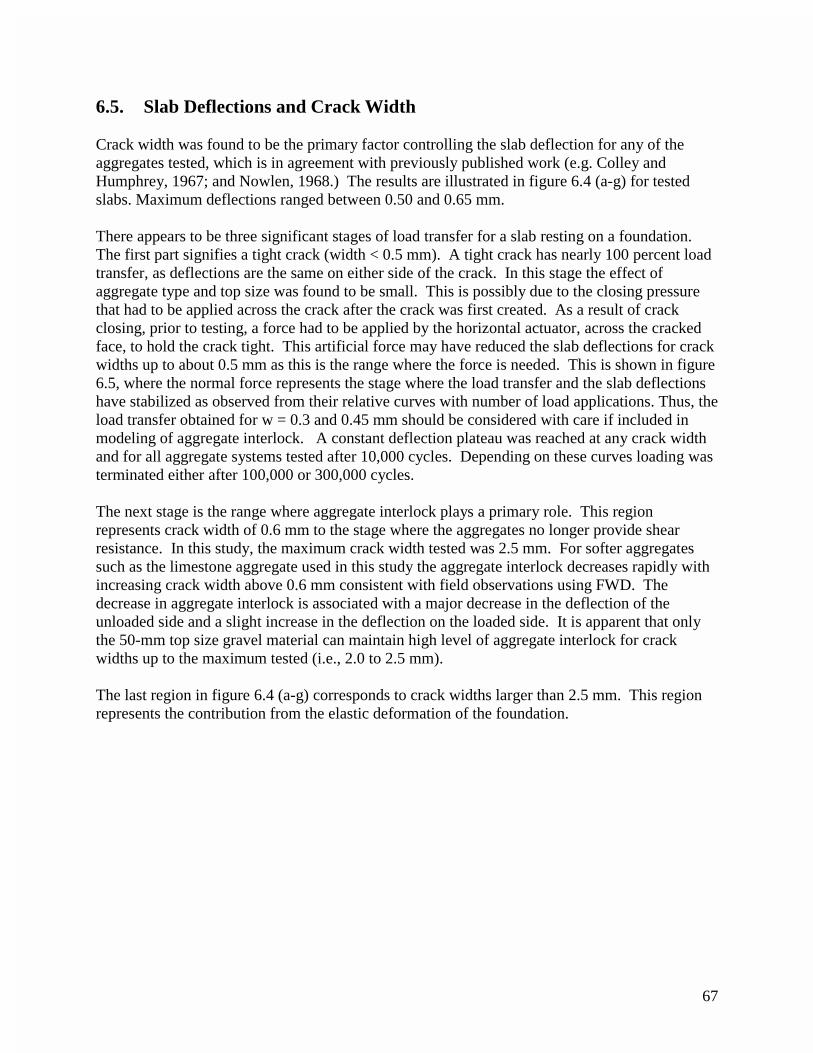
67
6.5. Slab Deflections and Crack Width Crack width was found to be the primary factor controlling the slab deflection for any of the aggregates tested, which is in agreement with previously published work (e.g. Colley and Humphrey, 1967; and Nowlen, 1968.) The results are illustrated in figure 6.4 (a-g) for tested slabs. Maximum deflections ranged between 0.50 and 0.65 mm. There appears to be three significant stages of load transfer for a slab resting on a foundation. The first part signifies a tight crack (width < 0.5 mm). A tight crack has nearly 100 percent load transfer, as deflections are the same on either side of the crack. In this stage the effect of aggregate type and top size was found to be small. This is possibly due to the closing pressure that had to be applied across the crack after the crack was first created. As a result of crack closing, prior to testing, a force had to be applied by the horizontal actuator, across the cracked face, to hold the crack tight. This artificial force may have reduced the slab deflections for crack widths up to about 0.5 mm as this is the range where the force is needed. This is shown in figure 6.5, where the normal force represents the stage where the load transfer and the slab deflections have stabilized as observed from their relative curves with number of load applications. Thus, the load transfer obtained for w = 0.3 and 0.45 mm should be considered with care if included in modeling of aggregate interlock. A constant deflection plateau was reached at any crack width and for all aggregate systems tested after 10,000 cycles. Depending on these curves loading was terminated either after 100,000 or 300,000 cycles. The next stage is the range where aggregate interlock plays a primary role. This region represents crack width of 0.6 mm to the stage where the aggregates no longer provide shear resistance. In this study, the maximum crack width tested was 2.5 mm. For softer aggregates such as the limestone aggregate used in this study the aggregate interlock decreases rapidly with increasing crack width above 0.6 mm consistent with field observations using FWD. The decrease in aggregate interlock is associated with a major decrease in the deflection of the unloaded side and a slight increase in the deflection on the loaded side. It is apparent that only the 50-mm top size gravel material can maintain high level of aggregate interlock for crack widths up to the maximum tested (i.e., 2.0 to 2.5 mm). The last region in figure 6.4 (a-g) corresponds to crack widths larger than 2.5 mm. This region represents the contribution from the elastic deformation of the foundation.
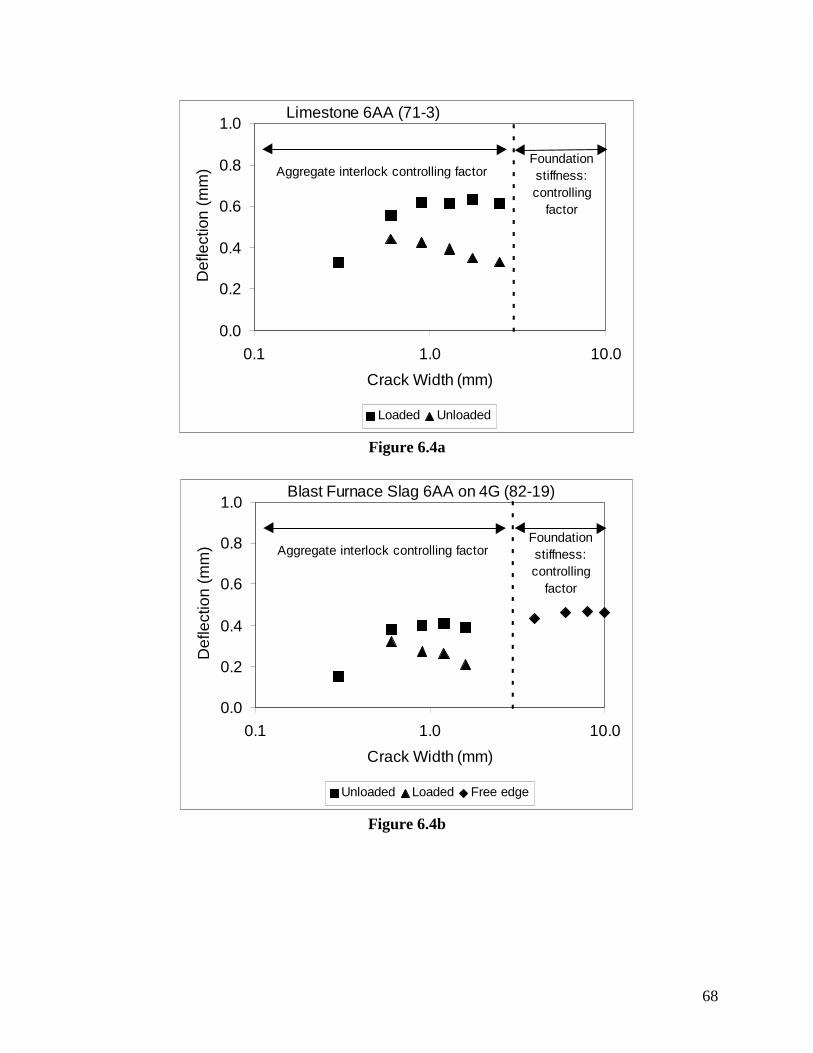
68
0.0
0.2
0.4
0.6
0.8
1.0
0.1 1.0 10.0
Crack Width (mm)
Def
lect
ion
(mm
)
Loaded Unloaded
Aggregate interlock controlling factorFoundation stiffness:controlling
factor
Limestone 6AA (71-3)
Figure 6.4a
0.0
0.2
0.4
0.6
0.8
1.0
0.1 1.0 10.0
Crack Width (mm)
Def
lect
ion
(mm
)
Unloaded Loaded Free edge
Aggregate interlock controlling factorFoundation stiffness:controlling
factor
Blast Furnace Slag 6AA on 4G (82-19)
Figure 6.4b
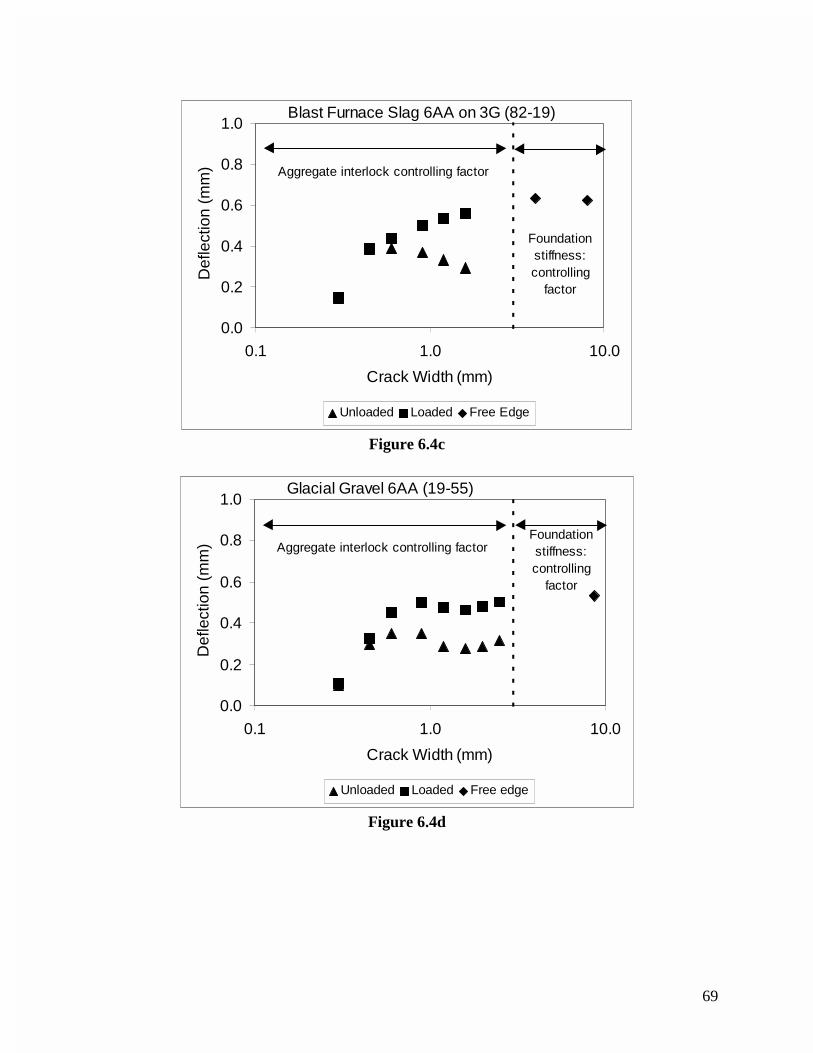
69
0.0
0.2
0.4
0.6
0.8
1.0
0.1 1.0 10.0
Crack Width (mm)
Def
lect
ion
(mm
)
Unloaded Loaded Free Edge
Aggregate interlock controlling factor
Foundation stiffness:controlling
factor
Blast Furnace Slag 6AA on 3G (82-19)
Figure 6.4c
0.0
0.2
0.4
0.6
0.8
1.0
0.1 1.0 10.0
Crack Width (mm)
Def
lect
ion
(mm
)
Unloaded Loaded Free edge
Aggregate interlock controlling factorFoundation stiffness:controlling
factor
Glacial Gravel 6AA (19-55)
Figure 6.4d
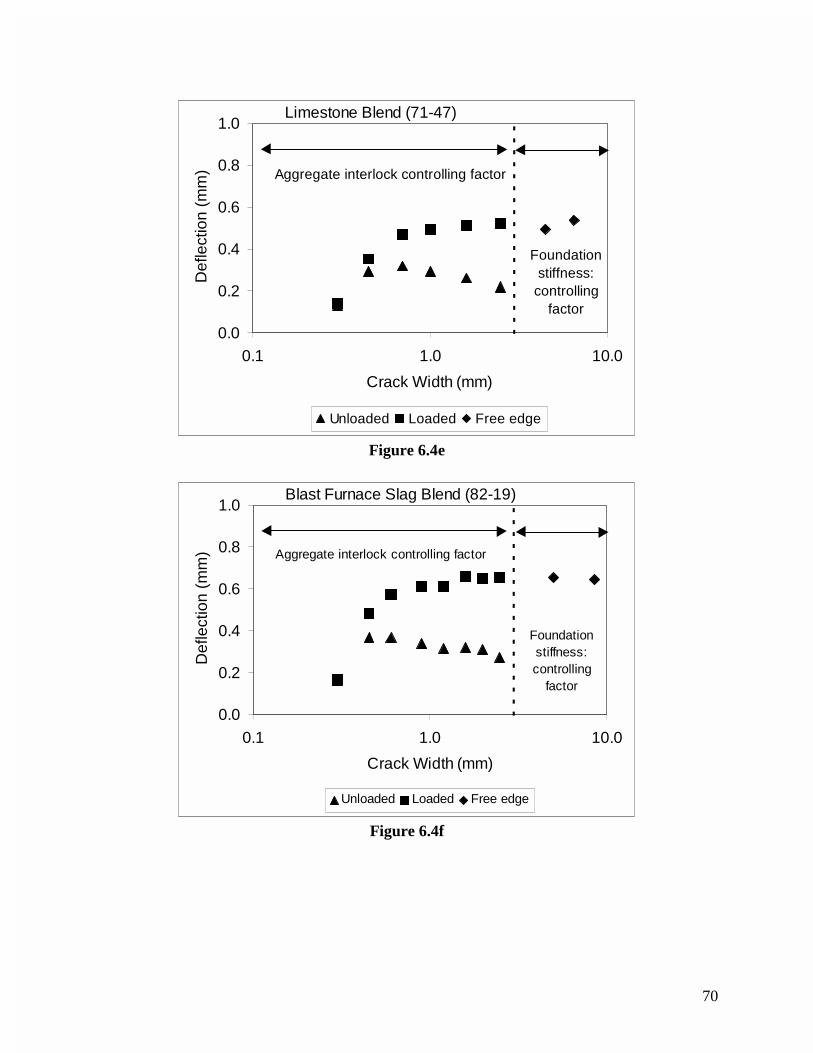
70
0.0
0.2
0.4
0.6
0.8
1.0
0.1 1.0 10.0
Crack Width (mm)
Def
lect
ion
(mm
)
Unloaded Loaded Free edge
Aggregate interlock controlling factor
Foundation stiffness:
controlling factor
Limestone Blend (71-47)
Figure 6.4e
0.0
0.2
0.4
0.6
0.8
1.0
0.1 1.0 10.0
Crack Width (mm)
Def
lect
ion
(mm
)
Unloaded Loaded Free edge
Aggregate interlock controlling factor
Foundation stiffness:controlling
factor
Blast Furnace Slag Blend (82-19)
Figure 6.4f
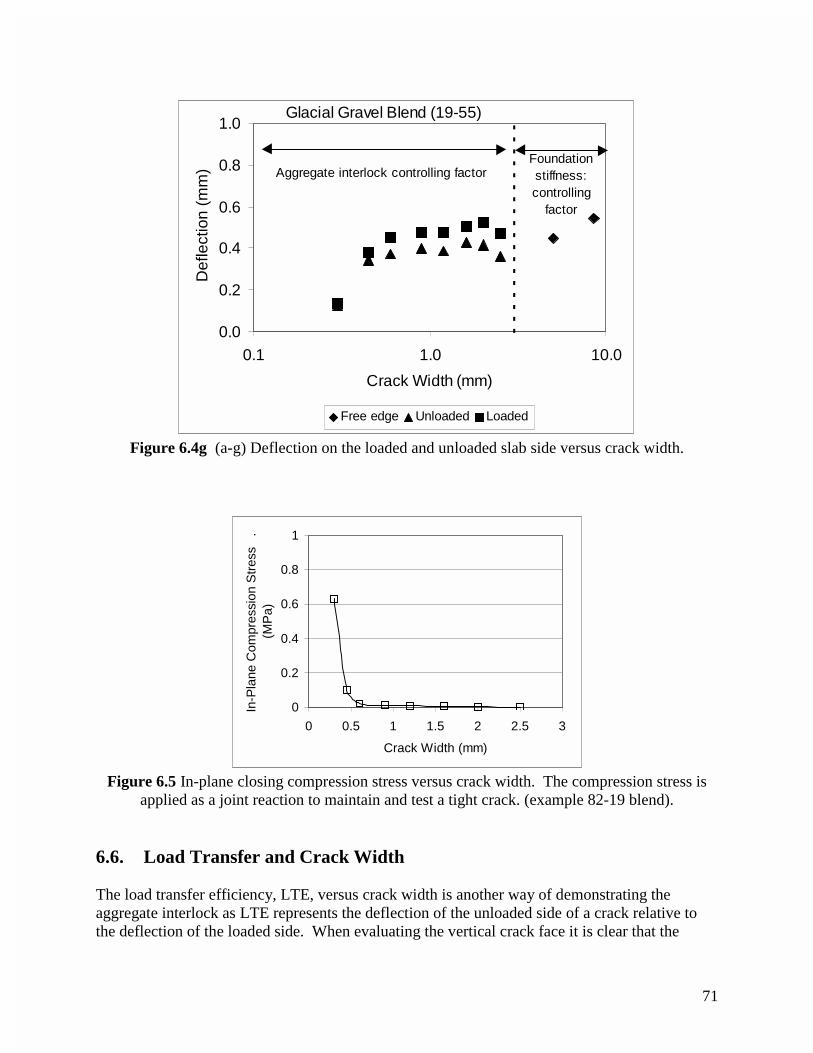
71
0.0
0.2
0.4
0.6
0.8
1.0
0.1 1.0 10.0
Crack Width (mm)
Def
lect
ion
(mm
)
Free edge Unloaded Loaded
Aggregate interlock controlling factorFoundation stiffness:controlling
factor
Glacial Gravel Blend (19-55)
Figure 6.4g (a-g) Deflection on the loaded and unloaded slab side versus crack width.
0
0.2
0.4
0.6
0.8
1
0 0.5 1 1.5 2 2.5 3
Crack Width (mm)
In-P
lane
Com
pres
sion
Str
ess
.(M
Pa)
Figure 6.5 In-plane closing compression stress versus crack width. The compression stress is
applied as a joint reaction to maintain and test a tight crack. (example 82-19 blend). 6.6. Load Transfer and Crack Width The load transfer efficiency, LTE, versus crack width is another way of demonstrating the aggregate interlock as LTE represents the deflection of the unloaded side of a crack relative to the deflection of the loaded side. When evaluating the vertical crack face it is clear that the
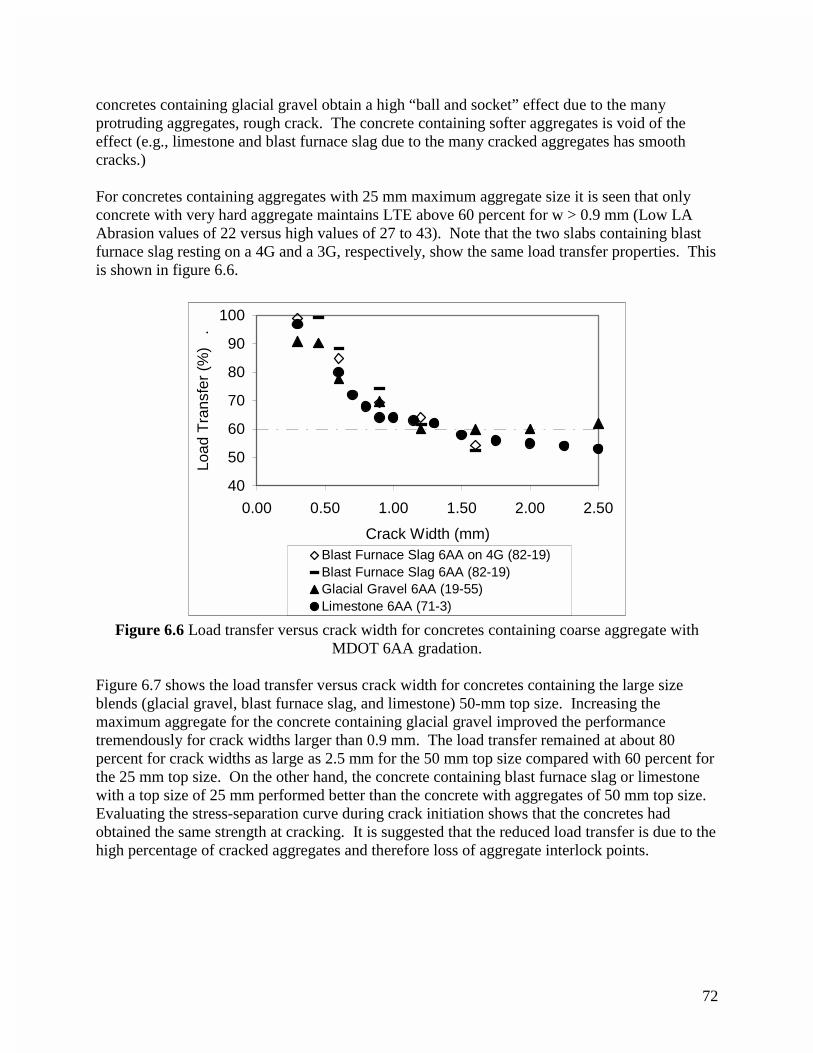
72
concretes containing glacial gravel obtain a high “ball and socket” effect due to the many protruding aggregates, rough crack. The concrete containing softer aggregates is void of the effect (e.g., limestone and blast furnace slag due to the many cracked aggregates has smooth cracks.) For concretes containing aggregates with 25 mm maximum aggregate size it is seen that only concrete with very hard aggregate maintains LTE above 60 percent for w > 0.9 mm (Low LA Abrasion values of 22 versus high values of 27 to 43). Note that the two slabs containing blast furnace slag resting on a 4G and a 3G, respectively, show the same load transfer properties. This is shown in figure 6.6.
40
50
60
70
80
90
100
0.00 0.50 1.00 1.50 2.00 2.50
Crack Width (mm)
Load
Tra
nsfe
r (%
) .
Blast Furnace Slag 6AA on 4G (82-19)Blast Furnace Slag 6AA (82-19)Glacial Gravel 6AA (19-55)Limestone 6AA (71-3)
Figure 6.6 Load transfer versus crack width for concretes containing coarse aggregate with
MDOT 6AA gradation. Figure 6.7 shows the load transfer versus crack width for concretes containing the large size blends (glacial gravel, blast furnace slag, and limestone) 50-mm top size. Increasing the maximum aggregate for the concrete containing glacial gravel improved the performance tremendously for crack widths larger than 0.9 mm. The load transfer remained at about 80 percent for crack widths as large as 2.5 mm for the 50 mm top size compared with 60 percent for the 25 mm top size. On the other hand, the concrete containing blast furnace slag or limestone with a top size of 25 mm performed better than the concrete with aggregates of 50 mm top size. Evaluating the stress-separation curve during crack initiation shows that the concretes had obtained the same strength at cracking. It is suggested that the reduced load transfer is due to the high percentage of cracked aggregates and therefore loss of aggregate interlock points.
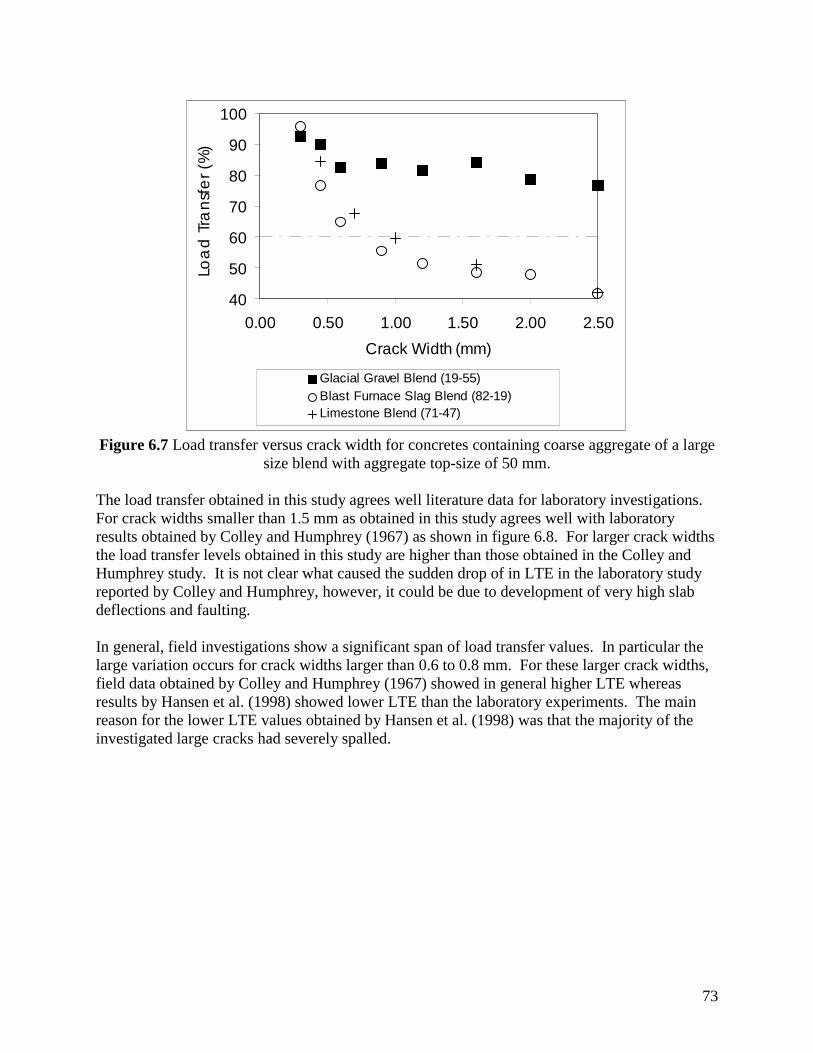
73
40
50
60
70
80
90
100
0.00 0.50 1.00 1.50 2.00 2.50
Crack Width (mm)
Loa
d T
ran
sfe
r (%
)
Glacial Gravel Blend (19-55)Blast Furnace Slag Blend (82-19)Limestone Blend (71-47)
Figure 6.7 Load transfer versus crack width for concretes containing coarse aggregate of a large
size blend with aggregate top-size of 50 mm. The load transfer obtained in this study agrees well literature data for laboratory investigations. For crack widths smaller than 1.5 mm as obtained in this study agrees well with laboratory results obtained by Colley and Humphrey (1967) as shown in figure 6.8. For larger crack widths the load transfer levels obtained in this study are higher than those obtained in the Colley and Humphrey study. It is not clear what caused the sudden drop of in LTE in the laboratory study reported by Colley and Humphrey, however, it could be due to development of very high slab deflections and faulting. In general, field investigations show a significant span of load transfer values. In particular the large variation occurs for crack widths larger than 0.6 to 0.8 mm. For these larger crack widths, field data obtained by Colley and Humphrey (1967) showed in general higher LTE whereas results by Hansen et al. (1998) showed lower LTE than the laboratory experiments. The main reason for the lower LTE values obtained by Hansen et al. (1998) was that the majority of the investigated large cracks had severely spalled.
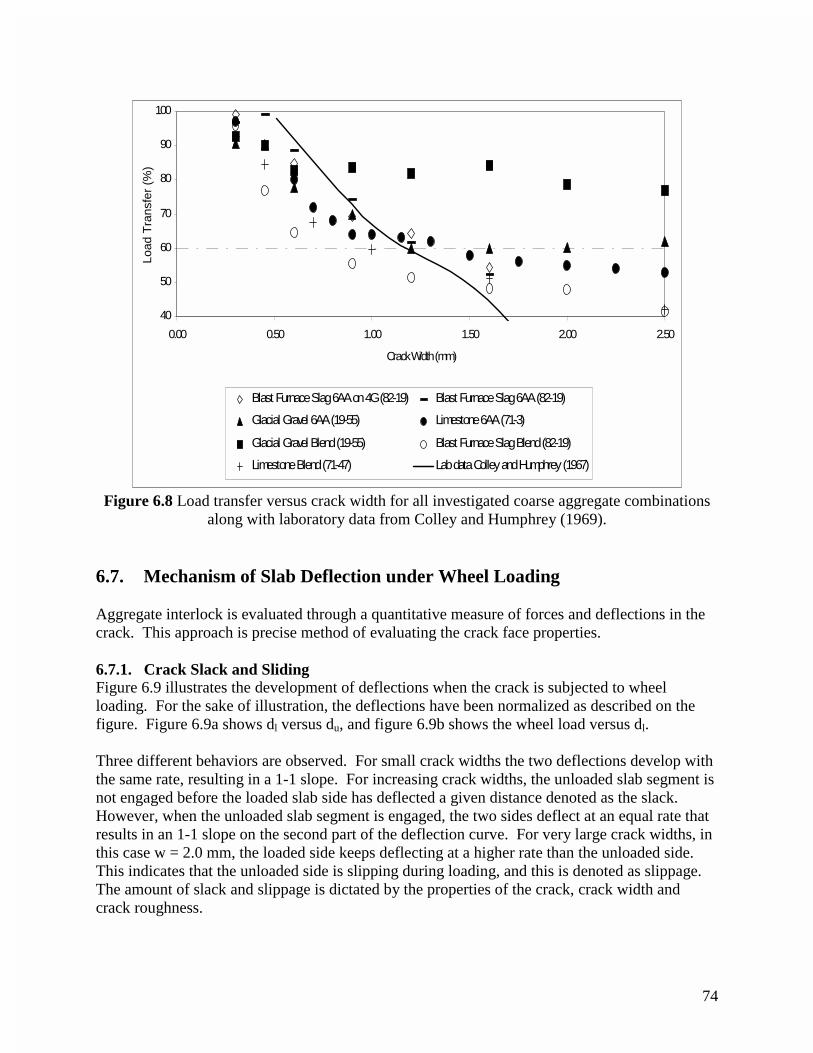
74
40
50
60
70
80
90
100
0.00 0.50 1.00 1.50 2.00 2.50
Crack Width (mm)
Load
Tra
nsfe
r (%
)
Blast Furnace Slag 6AA on 4G (82-19) Blast Furnace Slag 6AA (82-19)
Glacial Gravel 6AA (19-55) Limestone 6AA (71-3)
Glacial Gravel Blend (19-55) Blast Furnace Slag Blend (82-19)
Limestone Blend (71-47) Lab data Colley and Humphrey (1967)
Figure 6.8 Load transfer versus crack width for all investigated coarse aggregate combinations
along with laboratory data from Colley and Humphrey (1969). 6.7. Mechanism of Slab Deflection under Wheel Loading Aggregate interlock is evaluated through a quantitative measure of forces and deflections in the crack. This approach is precise method of evaluating the crack face properties. 6.7.1. Crack Slack and Sliding Figure 6.9 illustrates the development of deflections when the crack is subjected to wheel loading. For the sake of illustration, the deflections have been normalized as described on the figure. Figure 6.9a shows dl versus du, and figure 6.9b shows the wheel load versus dl. Three different behaviors are observed. For small crack widths the two deflections develop with the same rate, resulting in a 1-1 slope. For increasing crack widths, the unloaded slab segment is not engaged before the loaded slab side has deflected a given distance denoted as the slack. However, when the unloaded slab segment is engaged, the two sides deflect at an equal rate that results in an 1-1 slope on the second part of the deflection curve. For very large crack widths, in this case w = 2.0 mm, the loaded side keeps deflecting at a higher rate than the unloaded side. This indicates that the unloaded side is slipping during loading, and this is denoted as slippage. The amount of slack and slippage is dictated by the properties of the crack, crack width and crack roughness.
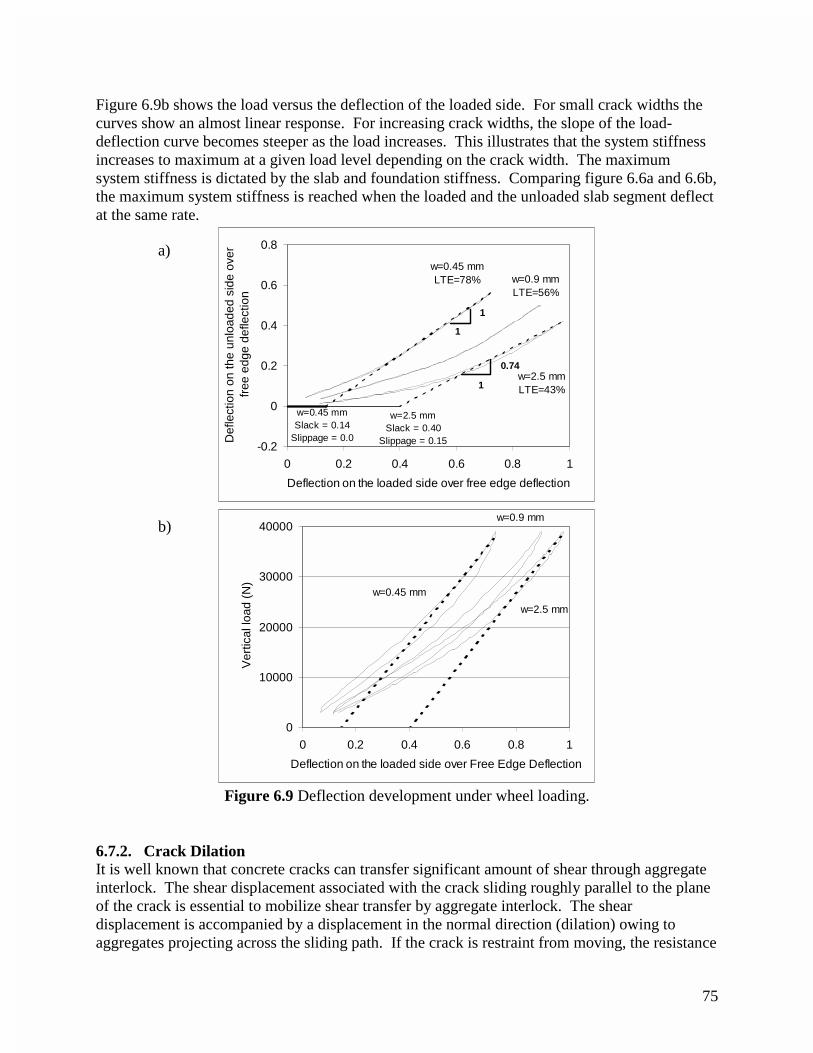
75
Figure 6.9b shows the load versus the deflection of the loaded side. For small crack widths the curves show an almost linear response. For increasing crack widths, the slope of the load-deflection curve becomes steeper as the load increases. This illustrates that the system stiffness increases to maximum at a given load level depending on the crack width. The maximum system stiffness is dictated by the slab and foundation stiffness. Comparing figure 6.6a and 6.6b, the maximum system stiffness is reached when the loaded and the unloaded slab segment deflect at the same rate.
-0.2
0
0.2
0.4
0.6
0.8
0 0.2 0.4 0.6 0.8 1
Deflection on the loaded side over free edge deflection
Def
lect
ion
on th
e un
load
ed s
ide
over
fr
ee e
dge
defle
ctio
n
w=0.45 mmLTE=78% w=0.9 mm
LTE=56%
w=2.5 mmLTE=43%
w=0.45 mmSlack = 0.14
Slippage = 0.0
1
1
w=2.5 mmSlack = 0.40
Slippage = 0.15
1
0.74
0
10000
20000
30000
40000
0 0.2 0.4 0.6 0.8 1
Deflection on the loaded side over Free Edge Deflection
Ver
tical
load
(N
)
w=0.45 mm
w=2.5 mm
w=0.9 mm
Figure 6.9 Deflection development under wheel loading.
6.7.2. Crack Dilation It is well known that concrete cracks can transfer significant amount of shear through aggregate interlock. The shear displacement associated with the crack sliding roughly parallel to the plane of the crack is essential to mobilize shear transfer by aggregate interlock. The shear displacement is accompanied by a displacement in the normal direction (dilation) owing to aggregates projecting across the sliding path. If the crack is restraint from moving, the resistance
a)
b)
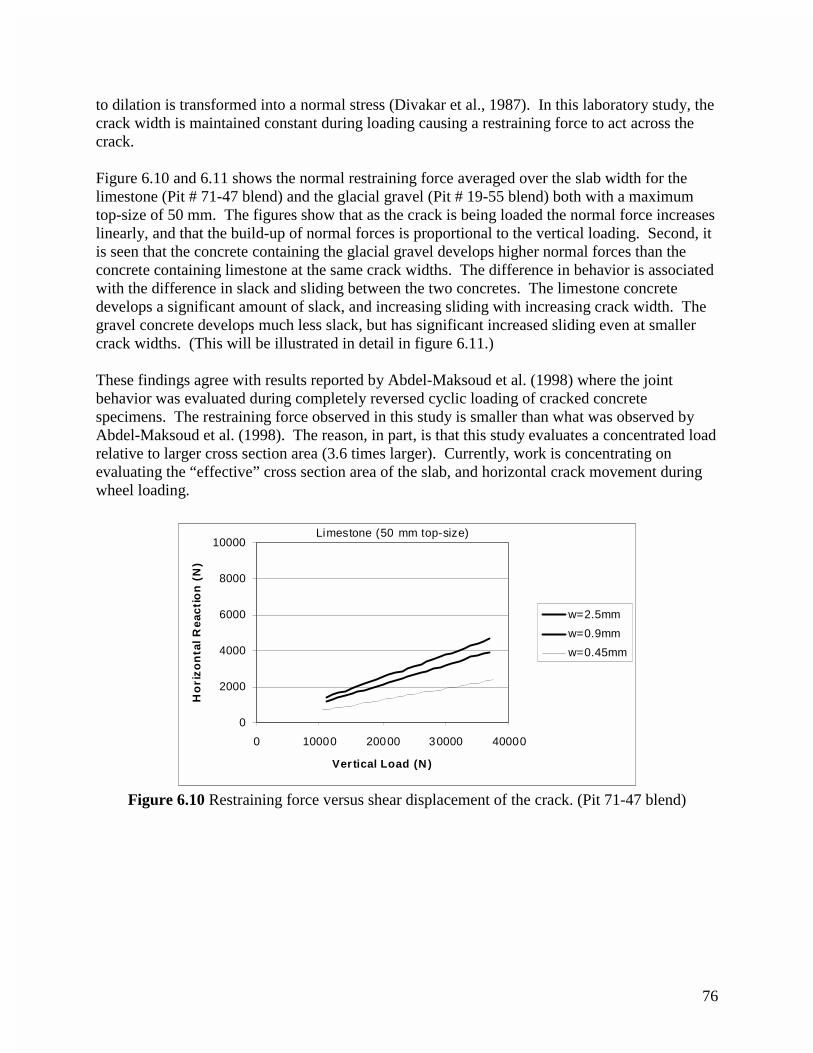
76
to dilation is transformed into a normal stress (Divakar et al., 1987). In this laboratory study, the crack width is maintained constant during loading causing a restraining force to act across the crack. Figure 6.10 and 6.11 shows the normal restraining force averaged over the slab width for the limestone (Pit # 71-47 blend) and the glacial gravel (Pit # 19-55 blend) both with a maximum top-size of 50 mm. The figures show that as the crack is being loaded the normal force increases linearly, and that the build-up of normal forces is proportional to the vertical loading. Second, it is seen that the concrete containing the glacial gravel develops higher normal forces than the concrete containing limestone at the same crack widths. The difference in behavior is associated with the difference in slack and sliding between the two concretes. The limestone concrete develops a significant amount of slack, and increasing sliding with increasing crack width. The gravel concrete develops much less slack, but has significant increased sliding even at smaller crack widths. (This will be illustrated in detail in figure 6.11.) These findings agree with results reported by Abdel-Maksoud et al. (1998) where the joint behavior was evaluated during completely reversed cyclic loading of cracked concrete specimens. The restraining force observed in this study is smaller than what was observed by Abdel-Maksoud et al. (1998). The reason, in part, is that this study evaluates a concentrated load relative to larger cross section area (3.6 times larger). Currently, work is concentrating on evaluating the “effective” cross section area of the slab, and horizontal crack movement during wheel loading.
0
2000
4000
6000
8000
10000
0 10000 20000 30000 40000
Ver tical Load (N )
Ho
riz
on
tal
Re
acti
on
(N
)
w=2.5mm
w=0.9mm
w=0.45mm
Limestone (50 mm top-size)
Figure 6.10 Restraining force versus shear displacement of the crack. (Pit 71-47 blend)
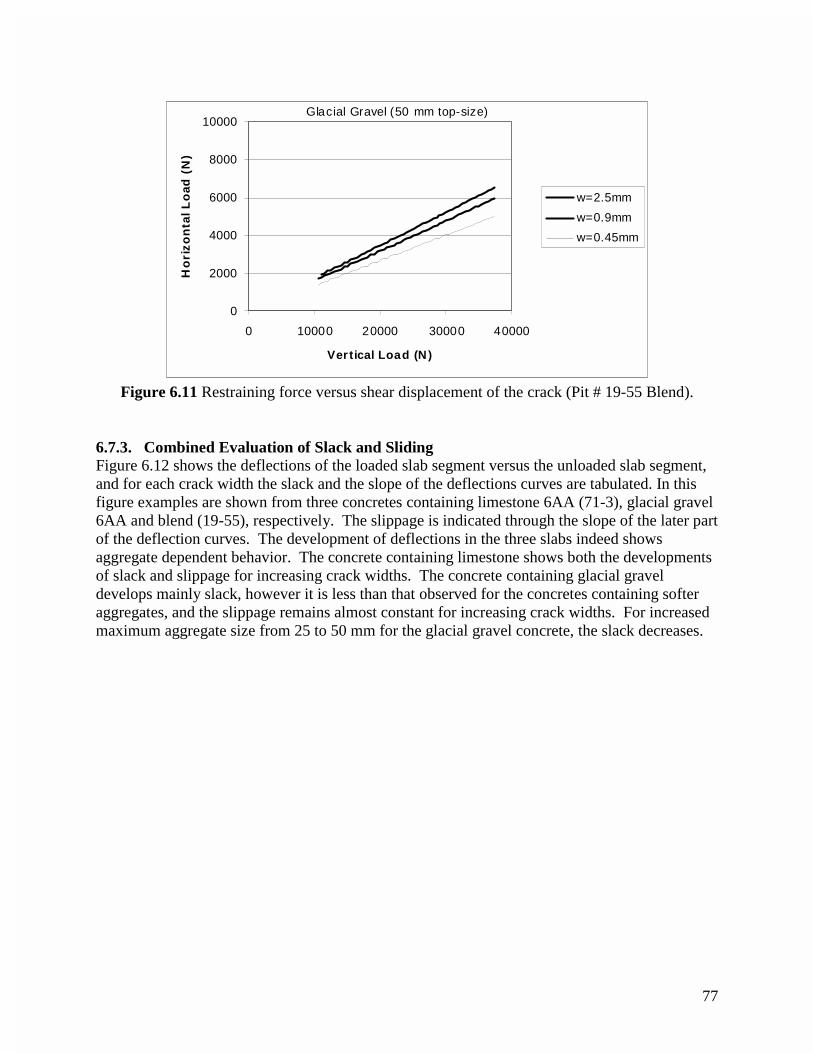
77
0
2000
4000
6000
8000
10000
0 10000 20000 30000 40000
Vertical Load (N)
Ho
rizo
nta
l Lo
ad (
N)
w=2.5mm
w=0.9mm
w=0.45mm
Glacial Gravel (50 mm top-size)
Figure 6.11 Restraining force versus shear displacement of the crack (Pit # 19-55 Blend).
6.7.3. Combined Evaluation of Slack and Sliding Figure 6.12 shows the deflections of the loaded slab segment versus the unloaded slab segment, and for each crack width the slack and the slope of the deflections curves are tabulated. In this figure examples are shown from three concretes containing limestone 6AA (71-3), glacial gravel 6AA and blend (19-55), respectively. The slippage is indicated through the slope of the later part of the deflection curves. The development of deflections in the three slabs indeed shows aggregate dependent behavior. The concrete containing limestone shows both the developments of slack and slippage for increasing crack widths. The concrete containing glacial gravel develops mainly slack, however it is less than that observed for the concretes containing softer aggregates, and the slippage remains almost constant for increasing crack widths. For increased maximum aggregate size from 25 to 50 mm for the glacial gravel concrete, the slack decreases.
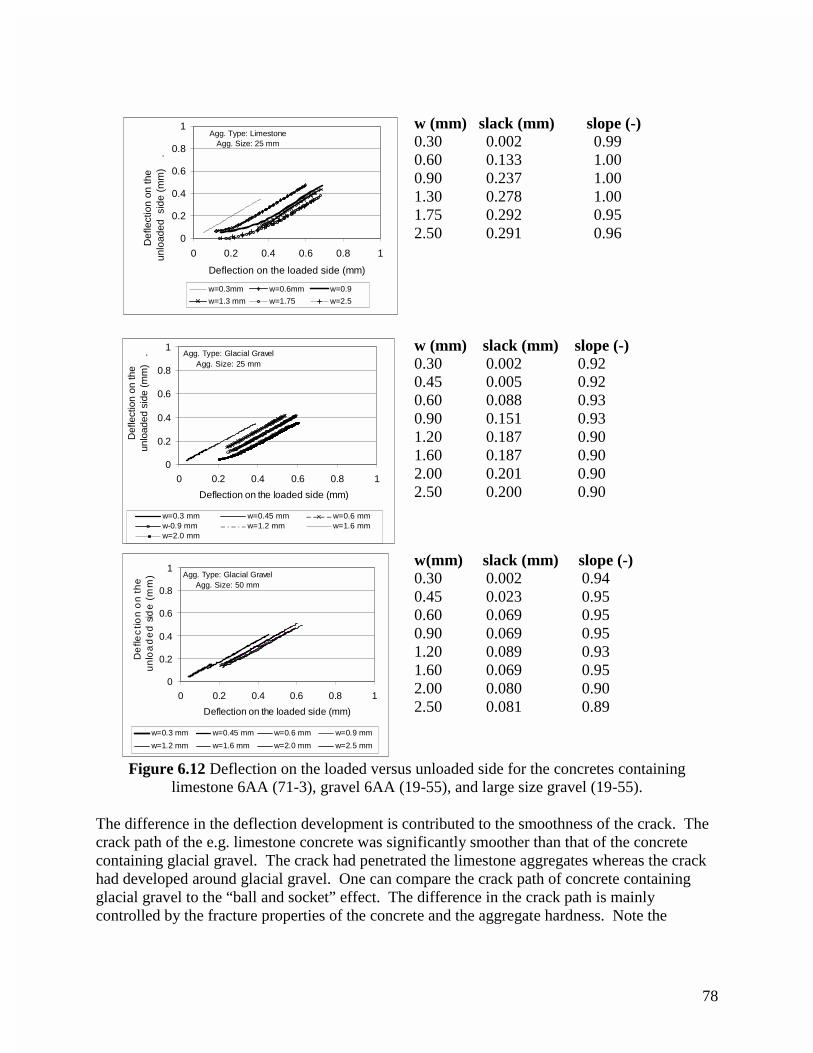
78
0
0.2
0.4
0.6
0.8
1
0 0.2 0.4 0.6 0.8 1
Deflection on the loaded side (mm)
Def
lect
ion
on th
e
un
load
ed s
ide
(mm
)
.
w=0.3mm w=0.6mm w=0.9
w=1.3 mm w=1.75 w=2.5
Agg. Type: LimestoneAgg. Size: 25 mm
w (mm) slack (mm) slope (-) 0.30 0.002 0.99 0.60 0.133 1.00 0.90 0.237 1.00 1.30 0.278 1.00 1.75 0.292 0.95 2.50 0.291 0.96
0
0.2
0.4
0.6
0.8
1
0 0.2 0.4 0.6 0.8 1
Deflection on the loaded side (mm)
Def
lect
ion
on th
e un
load
ed s
ide
(mm
) .
w=0.3 mm w=0.45 mm w=0.6 mmw-0.9 mm w=1.2 mm w=1.6 mmw=2.0 mm
Agg. Type: Glacial GravelAgg. Size: 25 mm
w (mm) slack (mm) slope (-) 0.30 0.002 0.92 0.45 0.005 0.92 0.60 0.088 0.93 0.90 0.151 0.93 1.20 0.187 0.90 1.60 0.187 0.90 2.00 0.201 0.90 2.50 0.200 0.90
0
0.2
0.4
0.6
0.8
1
0 0.2 0.4 0.6 0.8 1
Deflection on the loaded s ide (mm)
De
flec
tion
on
th
e
un
loa
de
d s
ide
(m
m)
w=0.3 mm w=0.45 mm w=0.6 mm w=0.9 mm
w=1.2 mm w=1.6 mm w=2.0 mm w=2.5 mm
Agg. Type: Glacial GravelAgg. Size: 50 mm
w(mm) slack (mm) slope (-) 0.30 0.002 0.94 0.45 0.023 0.95 0.60 0.069 0.95 0.90 0.069 0.95 1.20 0.089 0.93 1.60 0.069 0.95 2.00 0.080 0.90 2.50 0.081 0.89
Figure 6.12 Deflection on the loaded versus unloaded side for the concretes containing limestone 6AA (71-3), gravel 6AA (19-55), and large size gravel (19-55).
The difference in the deflection development is contributed to the smoothness of the crack. The crack path of the e.g. limestone concrete was significantly smoother than that of the concrete containing glacial gravel. The crack had penetrated the limestone aggregates whereas the crack had developed around glacial gravel. One can compare the crack path of concrete containing glacial gravel to the “ball and socket” effect. The difference in the crack path is mainly controlled by the fracture properties of the concrete and the aggregate hardness. Note the
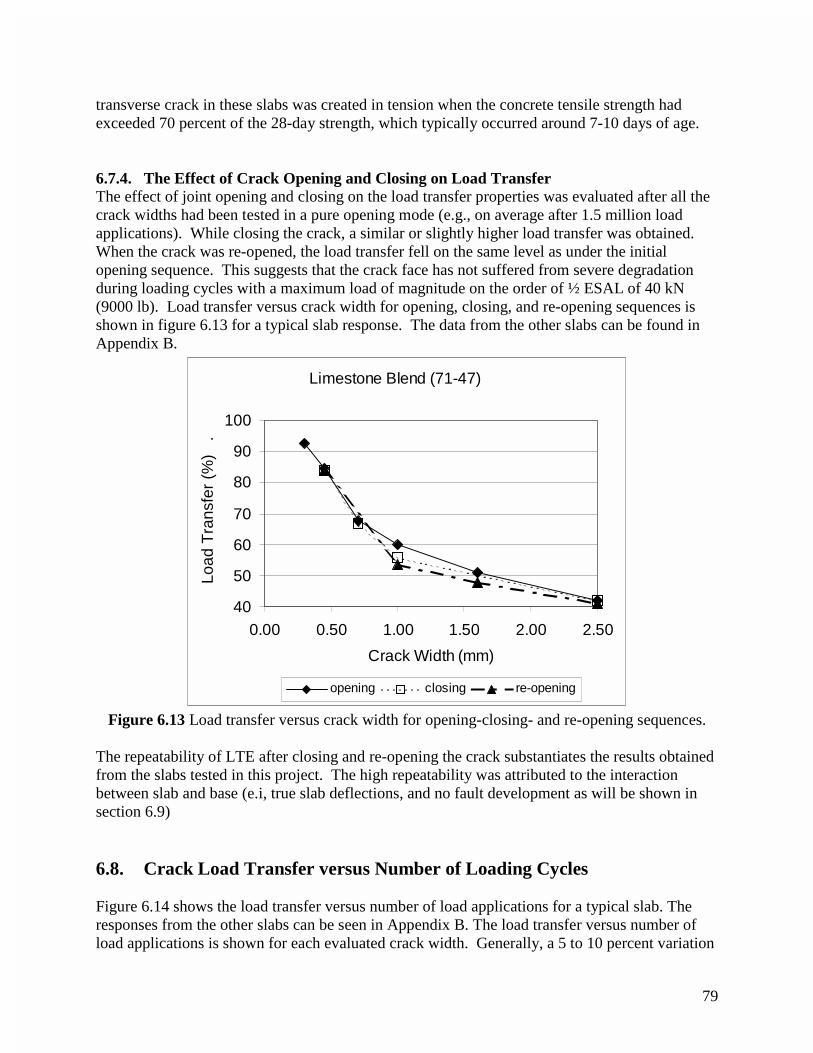
79
transverse crack in these slabs was created in tension when the concrete tensile strength had exceeded 70 percent of the 28-day strength, which typically occurred around 7-10 days of age. 6.7.4. The Effect of Crack Opening and Closing on Load Transfer The effect of joint opening and closing on the load transfer properties was evaluated after all the crack widths had been tested in a pure opening mode (e.g., on average after 1.5 million load applications). While closing the crack, a similar or slightly higher load transfer was obtained. When the crack was re-opened, the load transfer fell on the same level as under the initial opening sequence. This suggests that the crack face has not suffered from severe degradation during loading cycles with a maximum load of magnitude on the order of ½ ESAL of 40 kN (9000 lb). Load transfer versus crack width for opening, closing, and re-opening sequences is shown in figure 6.13 for a typical slab response. The data from the other slabs can be found in Appendix B.
Limestone Blend (71-47)
40
50
60
70
80
90
100
0.00 0.50 1.00 1.50 2.00 2.50
Crack Width (mm)
Load
Tra
nsfe
r (%
) .
opening closing re-opening
Figure 6.13 Load transfer versus crack width for opening-closing- and re-opening sequences. The repeatability of LTE after closing and re-opening the crack substantiates the results obtained from the slabs tested in this project. The high repeatability was attributed to the interaction between slab and base (e.i, true slab deflections, and no fault development as will be shown in section 6.9) 6.8. Crack Load Transfer versus Number of Loading Cycles Figure 6.14 shows the load transfer versus number of load applications for a typical slab. The responses from the other slabs can be seen in Appendix B. The load transfer versus number of load applications is shown for each evaluated crack width. Generally, a 5 to 10 percent variation
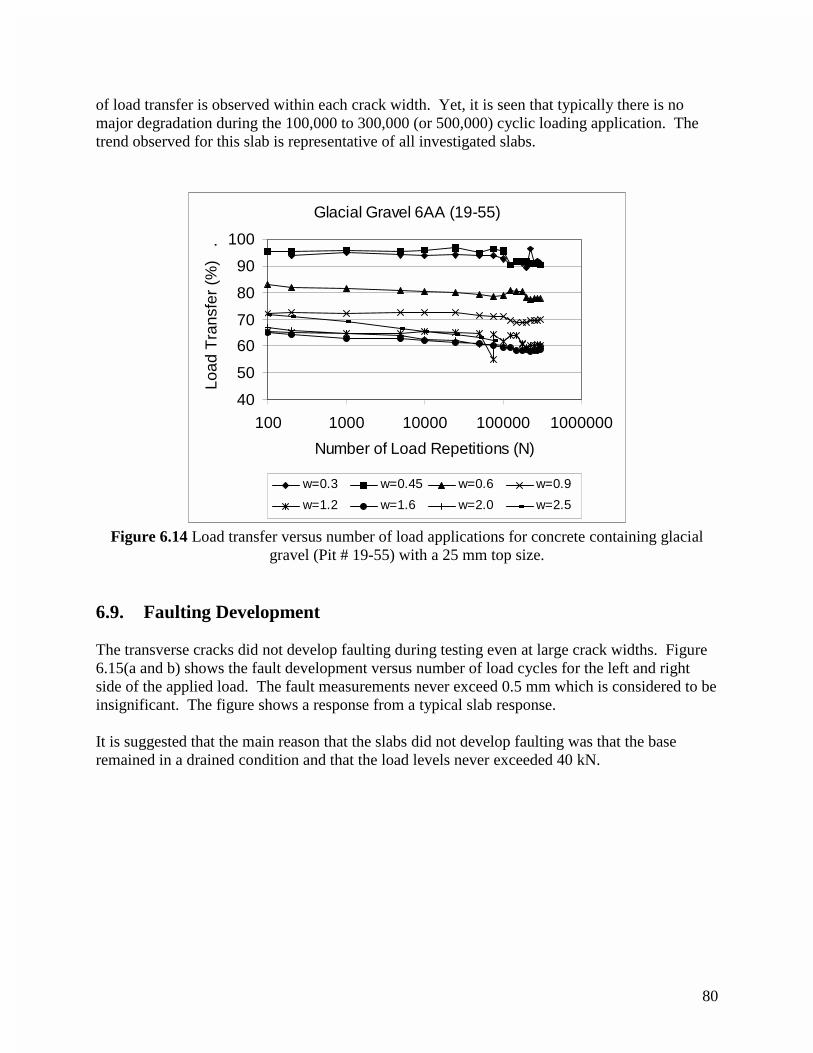
80
of load transfer is observed within each crack width. Yet, it is seen that typically there is no major degradation during the 100,000 to 300,000 (or 500,000) cyclic loading application. The trend observed for this slab is representative of all investigated slabs.
Glacial Gravel 6AA (19-55)
40
50
60
70
80
90
100
100 1000 10000 100000 1000000
Number of Load Repetitions (N)
Load
Tra
nsfe
r (%
) .
w=0.3 w=0.45 w=0.6 w=0.9
w=1.2 w=1.6 w=2.0 w=2.5
Figure 6.14 Load transfer versus number of load applications for concrete containing glacial gravel (Pit # 19-55) with a 25 mm top size.
6.9. Faulting Development The transverse cracks did not develop faulting during testing even at large crack widths. Figure 6.15(a and b) shows the fault development versus number of load cycles for the left and right side of the applied load. The fault measurements never exceed 0.5 mm which is considered to be insignificant. The figure shows a response from a typical slab response. It is suggested that the main reason that the slabs did not develop faulting was that the base remained in a drained condition and that the load levels never exceeded 40 kN.
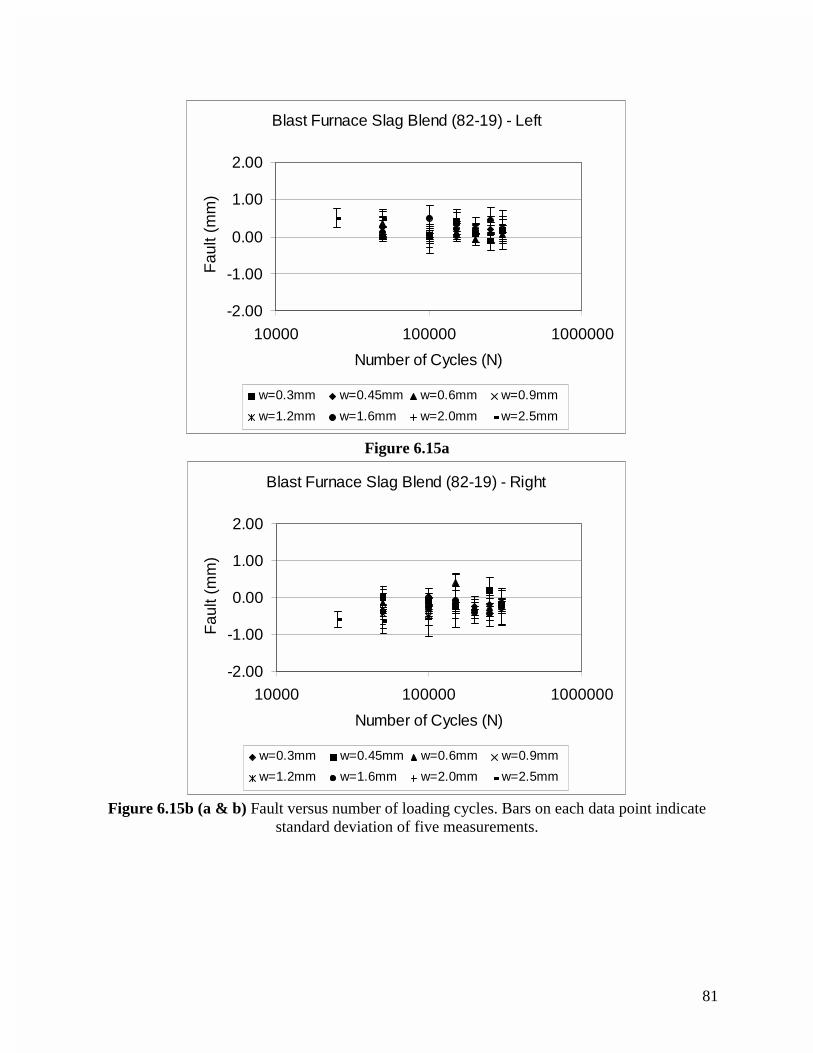
81
Blast Furnace Slag Blend (82-19) - Left
-2.00
-1.00
0.00
1.00
2.00
10000 100000 1000000
Number of Cycles (N)
Fau
lt (m
m)
w=0.3mm w=0.45mm w=0.6mm w=0.9mm
w=1.2mm w=1.6mm w=2.0mm w=2.5mm
Figure 6.15a
Blast Furnace Slag Blend (82-19) - Right
-2.00
-1.00
0.00
1.00
2.00
10000 100000 1000000
Number of Cycles (N)
Fau
lt (m
m)
w=0.3mm w=0.45mm w=0.6mm w=0.9mm
w=1.2mm w=1.6mm w=2.0mm w=2.5mm
Figure 6.15b (a & b) Fault versus number of loading cycles. Bars on each data point indicate standard deviation of five measurements.
82
Chapter 7. Conclusions and Recommendations 7.1 Project Objectives The laboratory study had two major objectives:
• Quantify the effects of coarse aggregate type, top-size, and concrete age on the concretes’ resistance to cracking. The impact of a pre-existing edge crack on a slabs’ remaining load-carrying capacity are quantified for different highway concretes.
• Quantify the effects of coarse aggregate type and size on the load transfer crack-
width relation in fully cracked JPCP. 7.2 Project Scope This project incorporated two major laboratory phases. In phase one the resistance to cracking of concrete containing a partial depth crack was investigated from notched beam tests. These beams were specially designed to accommodate large aggregate (up to 37 mm) using a test setup with 100 x 200 x 965 mm beams. The beams had a notch at mid-span. The purpose was twofold: (1) to determine the role of coarse aggregate type and size on the concretes’ resistance to cracking, and (2) to evaluate the resistance to cracking of concrete at three different ages (7, 28, and 91 days). Five different aggregate sources were investigated: Martin Aggregate (MDOT Pit # 19-55), Bundy Hill (MDOT Pit # 30-35), Rockwood (MDOT Pit # 58-8), Silica (MDOT Pit # 93-3), and Levy (MDOT Pit # 82-22). The first two sources are glacial gravels, the next two sources are limestones, and the last source is a blast furnace slag. These five sources were evaluated using the MDOT 6AA gradation (25-mm nominal maximum aggregate size). In addition, the Martin Aggregate and the Rockwood were evaluated with a large size blend (37-mm nominal maximum size). Chapter 5 presents and discusses the results of phase 1. A total of 54 beam tests were performed in phase one. In phase two, the load transfer characteristics of a fully developed crack in a JPCP was determined using a large-scale slab testing system. The variables were the coarse aggregate type and top size and the slab-base interaction. Slab dimensions were 3.6 m in length, 1.8 m in width and 250 mm in thickness. The slab was constructed on a 100-mm OGDC base and a 400-mm sandy subbase. The slab foundation was constructed directly on top of a silty sand that acted as subgrade. Three sources were evaluated with an MDOT 6AA gradation and they were Martin Aggregate (MDOT Pit # 19-55), Michigan Limestone (MDOT Pit # 71-3), and Levy (MDOT Pit # 82-19). In addition, three sources were evaluated with a large size blend, and they were Martin Aggregate (MDOT Pit # 19-55), Presque Isle (MDOT Pit # 71-3),
83
and Levy (MDOT Pit # 82-19). Both Michigan Limestone and Presque Isle are limestones. The laboratory study did not intend to reflect the effects of curling, warping, loss of slab support, and PCC shrinkage. Chapter 6 presents and discusses the results of phase 2. Mid-panel transverse cracking was achieved using a horizontal actuator with 550 kN tensile capacity attached to one end of the slab. A surface notch along the slab width of 76 mm ensured the location of the crack. The notch depth equals about ¼ the slab thickness. The crack was created when the concrete had achieved a minimum of 70 percent of the anticipated 28-day strength. This strength level was typically reached within 7 to 10 days after casting. The crack timing was determined based on results obtained in phase 1. Mid-panel cyclic vertical load tests (up to 300,000 cycles per crack) were conducted on one side of the crack (approach side) at a rate of 3 Hz and load level of 40 kN (9000 lb) to simulate ½ ESAL over a circular area with a 300-mm diameter. Several crack widths ranging from 0.3 to 2.5 mm were evaluated. Typically seven to eight crack widths were tested. The test sequence was to create a large range of load transfer levels at crack widths, which would realistically occur in the field. The slab-base interaction was investigated using two different open graded base course gradations (MDOT Class 3G and 4G). 7.3 Major Findings
• Irrespective of concrete age a crack extending 300mm (1 ft) from the outer edge of a 3600 mm (12 ft) wide slab is expected to reduce the section tensile load-carrying capacity. For concretes with high fracture toughness (i.e. KC = 75 MPa/mm½) the reduction is about 40 percent (i.e. KC = 75 MPa/mm½). For concretes with lower resistance to cracking (i.e. KC = 55 MPa/mm½) the decrease is estimated to about 60 percent. Fracture mechanics based analysis was used to show that also the slab crack length is a major parameter controlling a partially cracked slab’s remaining tensile load-carrying capacity.
The fracture toughness was determined for typical highway concretes containing different coarse aggregates and tested at three different ages. The values ranged from 47 to 78 MPa/(mm½). The fracture toughness is derived from the fracture and elastic modulus tests. Fracture toughness varies with coarse aggregate type. The concretes containing glacial gravel were found to yield the highest values at any age. The concretes containing limestone and blast furnace slag yielded the lowest values. Concretes containing dolomitic limestone fell in between the two groups. Increased fracture toughness results in increased resistance to cracking of e.g., a concrete slab with a pre-existing crack. The increase in critical load is proportional to fracture toughness.
84
Fracture toughness increased with concrete age. At 7 days the fracture toughness values range from 47 to 64 MPa/(mm½) for the five aggregate sources investigated, and at 28 and 91 days the values range from 55 to 78 MPa/(mm½). Extrapolation to very early age fracture toughness (< 3 days) can not be done as the early age fracture process is dominated by the matrix strength and interface bond, and is independent of aggregate strength and stiffness. In the case where the concrete slab has no major defects, the critical stress level can be determined using elastic theory, where the critical load level is linearly proportional to the concrete’s tensile strength. For the concretes evaluated in this work, it was found that concrete containing crushed rock or manufactured aggregates develops higher early strength (tested at 7 days) compared to that of a concrete containing glacial gravel. This indicates that in the cases where premature edge cracks can be avoided in the highway slabs, the concretes containing crushed rock or manufactured aggregates would sustain higher load levels before fracture than a concrete containing gravel.
Resistance to crack propagation was determined from fracture energy, which is the energy absorbed during complete material fracture. Fracture energy was measured on large beams of 965 mm span, 204 mm height, 102 mm width. Fracture energy values ranged between 80 and 170 N/m. The glacial gravels Martin Aggregate (MDOT Pit # 19-55) and Bundy Hill (MDOT Pit # 30-35) yielded the highest fracture energy values followed by the dolomitic limestone Rockwood (MDOT Pit # 58-8). The limestone Silica (MDOT Pit # 93-3) and the blast furnace slag (MDOT Pit # 82-22) yielded the lowest values. Visual examination of fractured beams provides for a qualitative examination of aggregate toughness. The coarse aggregate has reached its capacity as crack obstacles when it fractures during cracking. In this study the glacial gravel used in these normal strength highway concretes were found to have a reserve capacity, as a large percentage of the aggregates remained intact after cracking. This was true for all three ages tested. The other sources tested 7 days after casting showed partial cracking of the coarse aggregate, however, at 28- and 91-day the percent fracture aggregates approached 100 percent. Larger aggregate top size was found to improve crack resistance by a small amount (0 to 10%) regardless of aggregate type.
85
• Aggregate interlock properties as determined by load transfer of transverse cracks in highway concrete on OGDC follow the same trend as those obtained on DGBC.
This is verified by comparison of the load transfer data obtained in this study (on OGDC) and those obtained by Colley and Humphrey (1967) (on DGBC).
• Fault measurements across the crack showed that significant faulting did not
develop during the 1.5 to 2 million loading cycles.
In general the fault measurements fell between -0.3 to 0.3 mm for crack widths smaller or equal to 1.6 mm. For larger crack widths of 2.0 and 2.5 the fault measurement increased to a maximum of –0.7 to 0.7 mm.
• Deflection based load transfer was adequate (i.e. 60 percent or larger) and
remained constant for any number of load repetitions (300,000). These observations were made for any of the tested aggregates for crack widths up to 0.9 mm.
• Large-sized blends of strong (i.e. aggregate did not fracture during slab cracking)
aggregate were found to have excellent repeated LTE of 90 percent or higher for crack widths up to 0.9 mm.
When evaluating the vertical crack face it is clear that the concretes containing glacial gravel (MDOT Pit # 19-55) obtain a high “ball and socket” effect due to the many protruding aggregates, rough crack. Concretes containing soft or soft and large (MDOT Pit # 71-3, 71-47, and 82-19) were found to be unsuitable in terms of maintaining load transfer for crack widths exceeding about 0.9 mm. When evaluating the vertical crack face the concretes containing soft aggregates (limestone and blast furnace slag) they have many cracked aggregates and a smooth crack. This leaves these concretes void of the “ball and socket” effect.
• Load transfer was restored for all aggregate types after closing and re-opening the
cracks following testing of large crack widths.
This supports the repeatability of test results and substantiates the results obtained from the slabs tested in this project. The high repeatability was attributed to the interaction between slab and base (e.i, true slab deflections, and no fault development.)
86
The concrete containing blast furnace slag 6AA was evaluated in two slabs. The two slabs showed the same load transfer versus crack width behavior. The two slabs were resting on slightly different bases. However, both bases remained stabile during the duration of testing and caused no faulting. Further, comparison of compressive and splitting tensile strength, and fracture energy data obtained on concrete from each slab showed excellent agreement with very low coefficient of variation. Also, restored LTE suggests a minimum breakdown of the coarse aggregate during cyclic testing under laboratory conditions. This differs from observations in the field where degradation of the load transfer is observed over time (many years) due to environmental loading such as moisture in the cracks, crushing of concrete in the crack due to repeated expansion and shrinkage of the concrete. These conditions combined with the fact that the critical cross section area at the transverse crack is large indicate that the cracked slab is representative of the material. Hence, multiple repeats of slabs containing the same concrete are not critical to the validity of the test results.
• Crack width was found to be the controlling parameter of the aggregate interlock.
Deflection versus crack width results show that aggregate interlock is about 100 percent for crack widths up to about 0.45 mm and gradually decreasing depending on aggregate type and size for crack widths up to 2.5 mm. For soft aggregate, at crack widths around 0.9 to 1.2 mm the aggregate interlock falls below a critical level for high and medium truck traffic as the LTE falls below 60 percent. Aggregate interlock is comprised of at least three significant components: (1) an initial slack or gap between crack surfaces, which exists prior to loading, (2) sliding of the adjacent crack surfaces, and (3) in-plane dilation of the crack due to crack sliding if unrestrained, otherwise build-up of normal stress. The significance of dilation restraining force increases with crack width. When applying a wheel load of 40 KN a build up of normal force on the order of 4 to 6 kN was observed. Further, concretes with a rough crack face experience a significant amount of sliding even at small crack widths, hence, the restraining force is higher for concretes containing e.g. glacial gravel than limestone. These mechanisms vary with crack width and roughness. Roughness in turn is controlled by timing of cracking (i.e. PCC strength), coarse
87
aggregate type and size. Tough and large-size aggregate had reduced slack and sliding and maintained high load transfer. These mechanisms offer quantitative measures of the effect of coarse aggregate on aggregate interlock.
Additional findings:
• The load transfer obtained in this study agrees well literature data for laboratory
investigations. However, field investigations show a significant span of load transfer for similar crack widths.
For crack widths smaller than 1.5 mm as obtained in this study agrees well with results obtained by Colley and Humphrey (1967). For larger crack widths the load transfer levels obtained in this study are higher than those obtained in the same study. Field data obtained by Colley and Humphrey (1967) showed in general higher LTE whereas results by Hansen et al. (1998) showed lower LTE than the laboratory experiments. The main reason for the lower LTE values obtained by Hansen et al. (1998) was that the majority of the cracks had severely spalled at surface crack widths larger than about 0.6 mm.
• The slab deflections obtained with the large-scale slab testing system agree very well with the slab deflections predicted for edge loading using Westergaards closed-form solution.
Using the gross composite modulus of subgrade reaction to predict the slab free edge deflections show that the deflections agrees well with expected field deflections for the same foundation conditions.
• This study found no apparent effect of OGDC base type when evaluating the LTE properties or faulting development.
Concretes containing blast furnace slag 6AA gradation was placed on an OGDC base MDOT Class 3G and 4G, respectively.
88
7.4 Recommendations and Project Benefits to MDOT The major project benefit to MDOT is that the results from the testing program can aid in understanding the events occurring with PCC pavements in the field, and substantiate the need for appropriate material selection to prevent premature deterioration. In achieving the project objectives, pavement performance of future projects will be improved and greater assurance of long-term pavement quality can be achieved. Considering the conclusions drawn from this project several recommendations can be made specifically on material selections for highway pavements.
• Transverse cracks of full width and depth may be delayed if concretes yielding high fracture toughness are selected. It is recommended to select aggregate sources that in normal strength highway concrete mixes would yield high fracture energy and in turn high fracture toughness.
Aggregate sources containing quartzite, basalt, silicate, and hard dolomite are expected to be suitable sources. In this study both glacial gravels and dolomitic limestone (MDOT Pit # 19-55, Pit # 30-35, and Pit # 58-8) was found to have superior resistance to cracking compared to that of limestone and blast furnace slag. However, this study did not evaluate the aggregate’s resistance to physical and chemical deterioration. These properties should be evaluated through already established MDOT test methods. This may result in failing some gravels from a durability point of view. However, if they can met the durability requirements they would perform excellent. Other available Michigan sources that would be expected to perform well based on their mechanical properties are sources such as Bruce Mines (MDOT Pit # 95-10), Manitolin (MDOT Pit # 95-5), and Port Inland (MDOT Pit # 75-5).
• It is recommended that edge cracks in new constructions (up to 3-4 years after
construction) of JPCP’s are monitored closely to evaluate if they pose a potential for rapidly developing into transverse cracks of full width and depth.
Even small full depth edge cracks may rapidly develop into fully transverse cracks. It is recommended that edge cracks are closely monitored and coring is performed to establish if the cracks are of full depth or if they are only of partial depth. A field based performance database can be established by MDOT correlating the aggregate sources with the frequency of premature edge cracks.
89
• When constructing highway concrete pavements using large size (e.g., blends of 6AA and 4AA) aggregate gradation, it is recommended to use sources that would yield high fracture toughness, fracture energy, and high load transfer.
Aggregate sources containing quartzite, basalt, silicate, and hard dolomite are expected to be suitable sources for a large size blend. In this study, glacial gravel (MDOT Pit # 19-55) was found suitable for enhancing the load transfer properties. Other sources that would be expected to perform well based on their mechanical properties are sources such as Bruce Mines (MDOT Pit # 95-10), Manitolin (MDOT Pit # 95-5), and Port Inland (MDOT Pit # 75-5). Consideration should be made towards the aggregate sources durability properties, which may render some gravels unsuitable for highway construction. Considering the results of this project it is anticipated that using a blend of any 6AA aggregate with a hard 4AA aggregate would improve the crack load transfer properties. Suitable aggregates for the large size (4AA) gradation would be sources such as Bruce Mines (95-10), Manitolin (95-5), Port Inland (75-5), etc. It is recommended that such an approach be executed in controlled field test sites.
90
References
1990 Standard Specifications for Construction (1990), Michigan Department of Transportation (MDOT), Lansing, Michigan. 1996 Standard Specifications for Construction (1996), Michigan Department of Transportation (MDOT), Lansing, Michigan. ACI Committee 363 (1984) State-of-the Art Report on High Strength Concrete. ACI Journal, Vol. 81, No. 4, Jul.-Aug. pp. 364-411. ASTM C 39 - 94. (1995). Standard Test Method for Compressive Strength of Cylindrical Concrete Specimens. 1995 Annual Book of ASTM Standards, Vol. 04.02, Philadelphia, Pennsylvania. ASTM C 469 - 94. (1995). Standard Test Method for Modulus of Elasticity and Poisson's Ratio of Concrete in Compression. 1995 Annual Book of ASTM Standards, Vol. 04.02, Philadelphia, Pennsylvania. ASTM C 496 - 90. (1995). Standard Test Method for Splitting Tensile Strength of Cylindrical Concrete Specimens. 1995 Annual Book of ASTM Standards, Vol. 04.02, Philadelphia, Pennsylvania. Abdel-Maksoud, M.G., N. Hawkins, and E. Barenberg (1998) “Effect of Geometric and mechanical properties of concrete joints on their cyclic shear response” Presented for the 1999 Federal Aviation Administration, Technology Transfer Conference. Bache, H., H., and Vinding, I. (1990), “Fracture Mechanics in Design of Concrete Pavements,” Proceedings, Second International Workshop on the Design and Evaluation of Concrete Pavements, CROW/PIARC, Siguenza, Spain, 4-5 October, pp. 139-164, (Also CBL reprint, CtO Aalborg Portland, Denmark -- in Danish.) Bruinsma, J.E., Raja, Z.I., Snyder, M.B., and Vandenbosshe (1995) “Factors Affecting the Deterioration of Transverse Cracks in JRCP,” Final Report, Contract 90-0973, Michigan Department of Transportation, Lansing, MI. Buch, N., Frabizzio, M.A., Hiller, J.E. (2000), “Factors Affecting Shear Capacity of Transverse Cracks in Jointed Concrete Pavements (JCP)” Final Report prepared by Michigan State University, Pavement Research Center of Excellence. Submitted to Michigan Department of Transportation. Colley, B.E., and Humphrey, H.A. (1967) “Aggregate Interlock at Joints in Concrete Pavements,” Highway Research Record, No. 189, National Research Council, pp. 1-18.
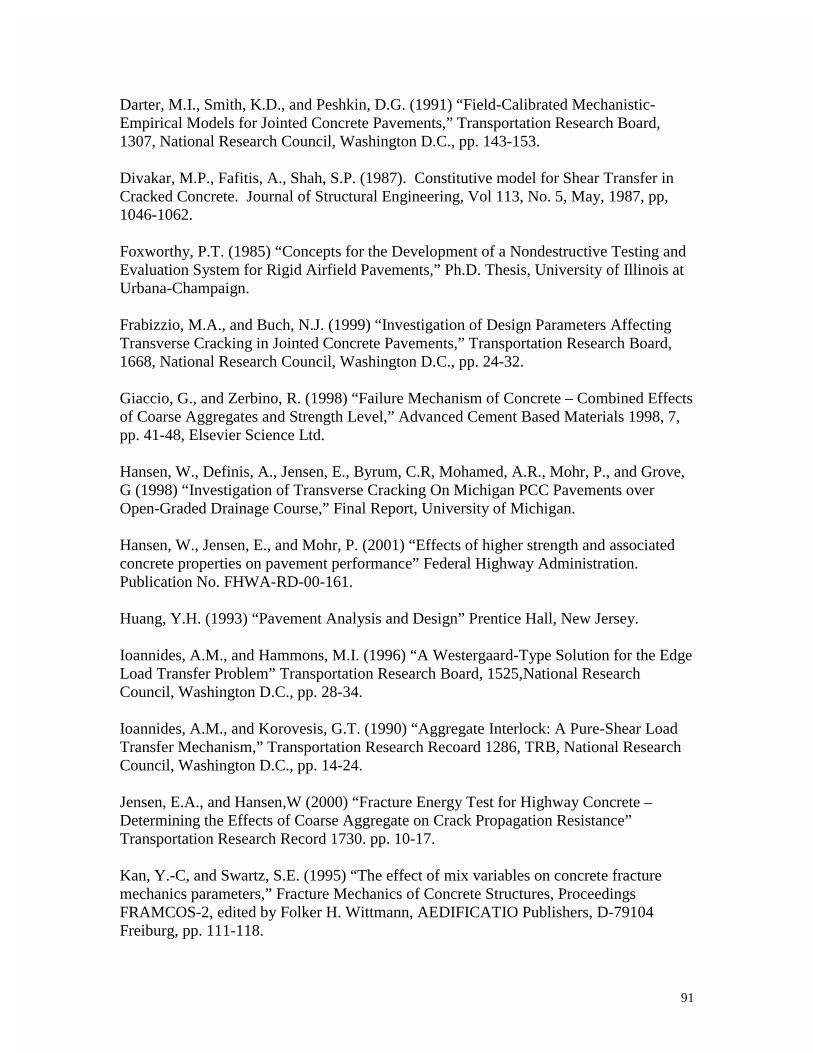
91
Darter, M.I., Smith, K.D., and Peshkin, D.G. (1991) “Field-Calibrated Mechanistic-Empirical Models for Jointed Concrete Pavements,” Transportation Research Board, 1307, National Research Council, Washington D.C., pp. 143-153. Divakar, M.P., Fafitis, A., Shah, S.P. (1987). Constitutive model for Shear Transfer in Cracked Concrete. Journal of Structural Engineering, Vol 113, No. 5, May, 1987, pp, 1046-1062. Foxworthy, P.T. (1985) “Concepts for the Development of a Nondestructive Testing and Evaluation System for Rigid Airfield Pavements,” Ph.D. Thesis, University of Illinois at Urbana-Champaign. Frabizzio, M.A., and Buch, N.J. (1999) “Investigation of Design Parameters Affecting Transverse Cracking in Jointed Concrete Pavements,” Transportation Research Board, 1668, National Research Council, Washington D.C., pp. 24-32. Giaccio, G., and Zerbino, R. (1998) “Failure Mechanism of Concrete – Combined Effects of Coarse Aggregates and Strength Level,” Advanced Cement Based Materials 1998, 7, pp. 41-48, Elsevier Science Ltd. Hansen, W., Definis, A., Jensen, E., Byrum, C.R, Mohamed, A.R., Mohr, P., and Grove, G (1998) “Investigation of Transverse Cracking On Michigan PCC Pavements over Open-Graded Drainage Course,” Final Report, University of Michigan. Hansen, W., Jensen, E., and Mohr, P. (2001) “Effects of higher strength and associated concrete properties on pavement performance” Federal Highway Administration. Publication No. FHWA-RD-00-161. Huang, Y.H. (1993) “Pavement Analysis and Design” Prentice Hall, New Jersey. Ioannides, A.M., and Hammons, M.I. (1996) “A Westergaard-Type Solution for the Edge Load Transfer Problem” Transportation Research Board, 1525,National Research Council, Washington D.C., pp. 28-34. Ioannides, A.M., and Korovesis, G.T. (1990) “Aggregate Interlock: A Pure-Shear Load Transfer Mechanism,” Transportation Research Recoard 1286, TRB, National Research Council, Washington D.C., pp. 14-24. Jensen, E.A., and Hansen,W (2000) “Fracture Energy Test for Highway Concrete – Determining the Effects of Coarse Aggregate on Crack Propagation Resistance” Transportation Research Record 1730. pp. 10-17. Kan, Y.-C, and Swartz, S.E. (1995) “The effect of mix variables on concrete fracture mechanics parameters,” Fracture Mechanics of Concrete Structures, Proceedings FRAMCOS-2, edited by Folker H. Wittmann, AEDIFICATIO Publishers, D-79104 Freiburg, pp. 111-118.
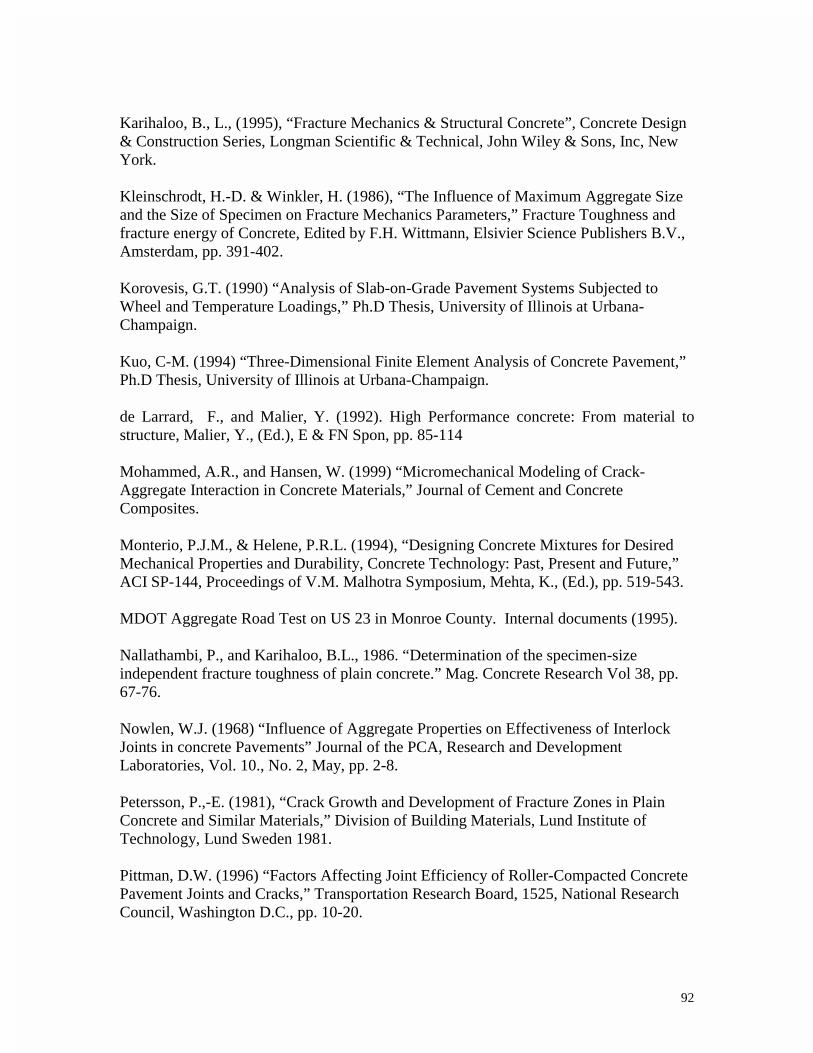
92
Karihaloo, B., L., (1995), “Fracture Mechanics & Structural Concrete”, Concrete Design & Construction Series, Longman Scientific & Technical, John Wiley & Sons, Inc, New York. Kleinschrodt, H.-D. & Winkler, H. (1986), “The Influence of Maximum Aggregate Size and the Size of Specimen on Fracture Mechanics Parameters,” Fracture Toughness and fracture energy of Concrete, Edited by F.H. Wittmann, Elsivier Science Publishers B.V., Amsterdam, pp. 391-402. Korovesis, G.T. (1990) “Analysis of Slab-on-Grade Pavement Systems Subjected to Wheel and Temperature Loadings,” Ph.D Thesis, University of Illinois at Urbana-Champaign. Kuo, C-M. (1994) “Three-Dimensional Finite Element Analysis of Concrete Pavement,” Ph.D Thesis, University of Illinois at Urbana-Champaign. de Larrard, F., and Malier, Y. (1992). High Performance concrete: From material to structure, Malier, Y., (Ed.), E & FN Spon, pp. 85-114 Mohammed, A.R., and Hansen, W. (1999) “Micromechanical Modeling of Crack-Aggregate Interaction in Concrete Materials,” Journal of Cement and Concrete Composites. Monterio, P.J.M., & Helene, P.R.L. (1994), “Designing Concrete Mixtures for Desired Mechanical Properties and Durability, Concrete Technology: Past, Present and Future,” ACI SP-144, Proceedings of V.M. Malhotra Symposium, Mehta, K., (Ed.), pp. 519-543. MDOT Aggregate Road Test on US 23 in Monroe County. Internal documents (1995). Nallathambi, P., and Karihaloo, B.L., 1986. “Determination of the specimen-size independent fracture toughness of plain concrete.” Mag. Concrete Research Vol 38, pp. 67-76. Nowlen, W.J. (1968) “Influence of Aggregate Properties on Effectiveness of Interlock Joints in concrete Pavements” Journal of the PCA, Research and Development Laboratories, Vol. 10., No. 2, May, pp. 2-8. Petersson, P.,-E. (1981), “Crack Growth and Development of Fracture Zones in Plain Concrete and Similar Materials,” Division of Building Materials, Lund Institute of Technology, Lund Sweden 1981. Pittman, D.W. (1996) “Factors Affecting Joint Efficiency of Roller-Compacted Concrete Pavement Joints and Cracks,” Transportation Research Board, 1525, National Research Council, Washington D.C., pp. 10-20.
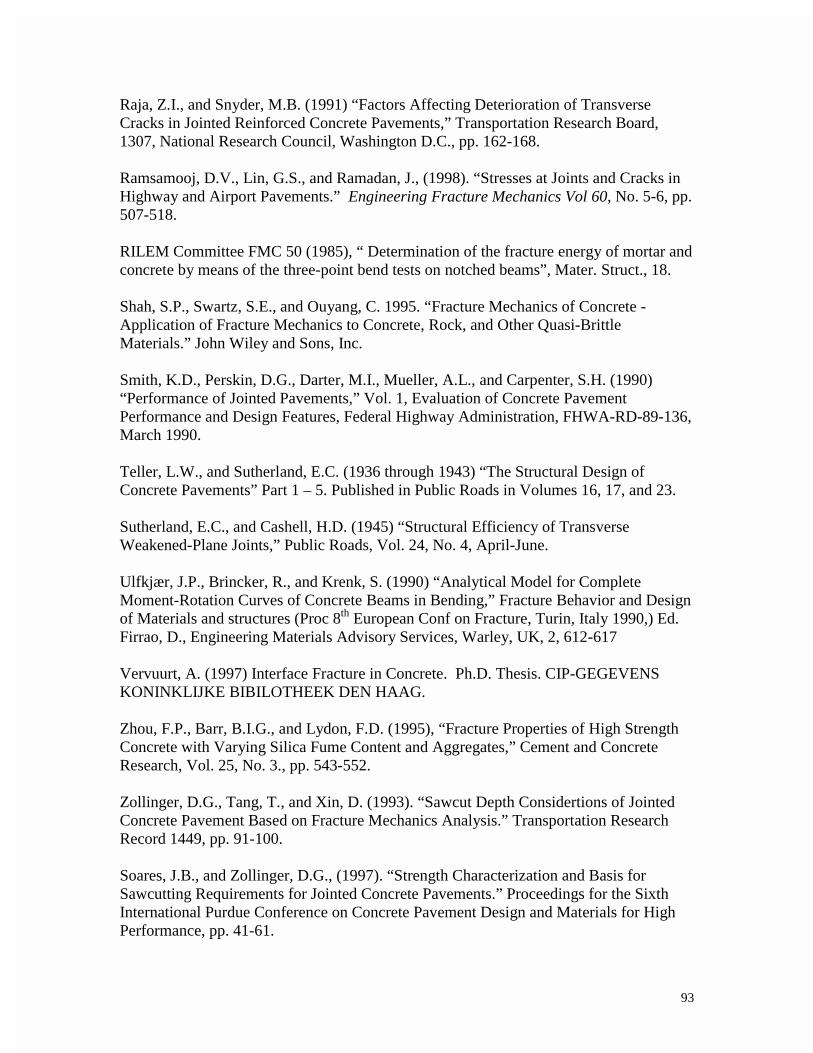
93
Raja, Z.I., and Snyder, M.B. (1991) “Factors Affecting Deterioration of Transverse Cracks in Jointed Reinforced Concrete Pavements,” Transportation Research Board, 1307, National Research Council, Washington D.C., pp. 162-168. Ramsamooj, D.V., Lin, G.S., and Ramadan, J., (1998). “Stresses at Joints and Cracks in Highway and Airport Pavements.” Engineering Fracture Mechanics Vol 60, No. 5-6, pp. 507-518. RILEM Committee FMC 50 (1985), “ Determination of the fracture energy of mortar and concrete by means of the three-point bend tests on notched beams”, Mater. Struct., 18. Shah, S.P., Swartz, S.E., and Ouyang, C. 1995. “Fracture Mechanics of Concrete - Application of Fracture Mechanics to Concrete, Rock, and Other Quasi-Brittle Materials.” John Wiley and Sons, Inc. Smith, K.D., Perskin, D.G., Darter, M.I., Mueller, A.L., and Carpenter, S.H. (1990) “Performance of Jointed Pavements,” Vol. 1, Evaluation of Concrete Pavement Performance and Design Features, Federal Highway Administration, FHWA-RD-89-136, March 1990. Teller, L.W., and Sutherland, E.C. (1936 through 1943) “The Structural Design of Concrete Pavements” Part 1 – 5. Published in Public Roads in Volumes 16, 17, and 23. Sutherland, E.C., and Cashell, H.D. (1945) “Structural Efficiency of Transverse Weakened-Plane Joints,” Public Roads, Vol. 24, No. 4, April-June. Ulfkjær, J.P., Brincker, R., and Krenk, S. (1990) “Analytical Model for Complete Moment-Rotation Curves of Concrete Beams in Bending,” Fracture Behavior and Design of Materials and structures (Proc 8th European Conf on Fracture, Turin, Italy 1990,) Ed. Firrao, D., Engineering Materials Advisory Services, Warley, UK, 2, 612-617 Vervuurt, A. (1997) Interface Fracture in Concrete. Ph.D. Thesis. CIP-GEGEVENS KONINKLIJKE BIBILOTHEEK DEN HAAG. Zhou, F.P., Barr, B.I.G., and Lydon, F.D. (1995), “Fracture Properties of High Strength Concrete with Varying Silica Fume Content and Aggregates,” Cement and Concrete Research, Vol. 25, No. 3., pp. 543-552. Zollinger, D.G., Tang, T., and Xin, D. (1993). “Sawcut Depth Considertions of Jointed Concrete Pavement Based on Fracture Mechanics Analysis.” Transportation Research Record 1449, pp. 91-100. Soares, J.B., and Zollinger, D.G., (1997). “Strength Characterization and Basis for Sawcutting Requirements for Jointed Concrete Pavements.” Proceedings for the Sixth International Purdue Conference on Concrete Pavement Design and Materials for High Performance, pp. 41-61.


![Transverse-Spin and Transverse-Momentum Effects in High ... · arXiv:1011.0909v1 [hep-ph] 3 Nov 2010 Transverse-Spin and Transverse-Momentum Effects in High-Energy Processes Vincenzo](https://img.pdfslide.us/doc/110x75/5fe72148dd320764757b53e4/transverse-spin-and-transverse-momentum-eiects-in-high-arxiv10110909v1-hep-ph.jpg)


![· Figure Il. Transverse crack-related defect in rebar [2]. Causes and solutions. Transverse cracks can form in the mould or during strengthening](https://img.pdfslide.us/doc/110x75/5afeeaed7f8b9a256b8dbcde/il-transverse-crack-related-defect-in-rebar-2-causes-and-solutions-transverse.jpg)