Embed Size (px)
Citation preview
RegulatedandNon‐RegulatedEmissionsandFuelEconomyfromConventionalDiesel,Hybrid‐ElectricDiesel,andNaturalGasTransitBusesAuthor(s):W.ScottWayne,NigelN.Clark,ABMS.Khan,MridulGautam,GregoryJ.Thompson,andDonaldW.LyonsSource: Journal of theTransportationResearch Forum, Vol. 47, No. 3 (Public Transit Special Issue2008),pp.105‐125Publishedby:TransportationResearchForumStableURL:http://www.trforum.org/journalTheTransportationResearchForum,foundedin1958,isanindependent,nonprofitorganizationoftransportationprofessionalswhoconduct,use,andbenefitfromresearch.Itspurposeistoprovideanimpartialmeetinggroundforcarriers,shippers,governmentofficials,consultants,universityresearchers,suppliers,andothersseekingexchangeofinformationandideasrelatedtobothpassengerandfreighttransportation.MoreinformationontheTransportationResearchForumcanbefoundontheWebatwww.trforum.org.
Transportation Research Forum
105
Regulated and Non-Regulated Emissions and Fuel Economy from Conventional Diesel, Hybrid-Electric Diesel, and Natural Gas Transit Busesby W. Scott Wayne, Nigel N. Clark, ABM S. Khan, Mridul Gautam, Gregory J. Thompson, and Donald W. Lyons
Distance-specificfueleconomy(FE)andemissionsofcarbonmonoxide(CO),hydrocarbons(HC),oxides of nitrogen (NOx), and particulate matter (PM) from transit buses representing diesel,retrofitteddiesel,hybrid-electricdiesel,andlean-burnnaturalgastechnologiesarepresentedinthispaper. Emissions were collected from these buses at the Washington Metropolitan Area Transport Authority (WMATA) test site in Landover, Maryland. In this program, one bus each from diesel, retrofitted diesel, hybrid-electric diesel, and natural gas technologies was tested on 17 chassiscycles and the other buses were tested on a subset of these cycles. Data show that the test cycle hasaprofoundeffectondistance-specificemissionsandFE,andrelativeemissionsperformanceoftechnology is also cycle dependant. Lean-burn natural gas buses demonstrated their low PM output, dieselengines showed lowHCoutput,benefitofexhaustfiltrationwasevident,and thepositiveeffect of hybrid-electric drive technology was most pronounced for low-speed transient cycles.
INTRODUCTION
Transit agencies across North America operate bus fleets powered primarily by diesel engines, although transit buses fueled with compressed natural gas (CNG), liquefied natural gas (LNG), and hybrid-electric drive systems have made significant penetration in recent years. A recent survey of 300 transit agencies by the American Public Transportation Association (APTA) revealed that approximately 81% transit buses are powered by conventional and clean diesel engines followed by natural gas, fueling approximately 13% of the transit buses in the United States, while LNG was employed to power approximately 2% of transit buses (APTA 2006). Hybrid-electric diesel buses represented about 1.3% of the total revenue buses in 2006, but market penetration of hybrid buses is steadily increasing. The survey found that about 23% of transit agencies in the United States have natural gas-fueled buses in their fleet. The survey also revealed that the demand for alternative fueled buses had increased significantly in recent years.
Natural gas buses (NGB) have historically produced lower oxides of nitrogen (NOx) than diesel buses. They have also produced comparatively less particulate matter (PM) and carbon monoxide (CO) emissions but suffered from a fuel economy penalty based on energy equivalence of diesel and natural gas. NGB have also produced more hydrocarbon (HC) mass than their diesel counterparts. However, most of the HC mass consisted of methane. Emissions from NGB across North America and Europe have been well-documented in numerous published studies (Wang et al. 1993; Clark et al. 1997; McCormick et al. 1999; Weaver et al. 2000; Wayne et al. 2004; and Clark et al. 2006).
Hybrid-electric diesel buses, in general, offered fuel economy (FE) advantage and produced less PM and NOx than conventional drive diesel buses. They were also found to produce low CO and HC emissions. Previous results (McKain et al. 2000; CASE 2001; Bass and Alfermann 2003; Wayne et al. 2004; Chandler and Walkowicz, 2006; and Clark et al. 2006) showed that the average NOx emissions from hybrid-electric diesel buses were about 25-30% lower than those from conventional diesel buses while average FE of the hybrid-electric diesel buses was about 20-25% higher than that from diesel buses. However, the percentage of FE benefit from the hybrid buses was route (or cycle) dependant. It has been observed that the percentage of FE benefits from hybrid-electric diesel
Regulated and Non-Regulated Emissions
106
buses was high at low-speed operation with a high count of stops per unit distance. Fundamental understanding of regenerative braking supports this finding.
This paper presents emissions and FE data from 13, 40-foot transit buses representing diesel, lean-burn natural gas, and diesel hybrid-electric technologies. The U.S. Department of Energy (DOE) and the U.S. Department of Transportation (DOT) sponsored the Center for Alternative Fuels, Engines, and Emissions (CAFEE) of West Virginia University (WVU) to conduct the program in cooperation with Washington Metropolitan Area Transit Authority (WMATA).
EMISSIONS MEASUREMENT
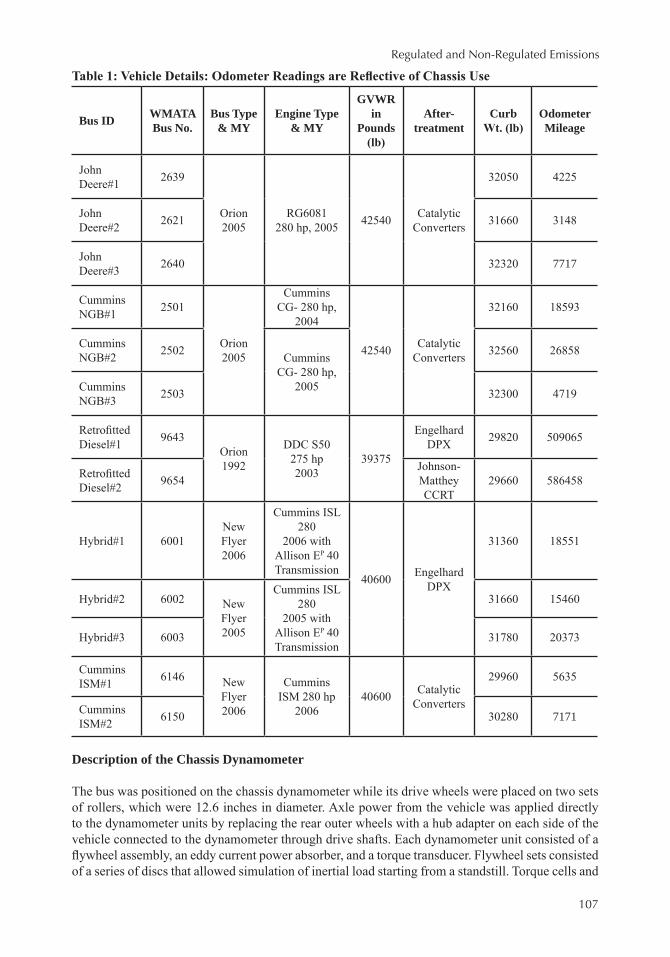
The test matrix included three Orion 2005 model year (MY) buses powered by John Deere RG6081 lean-burn natural gas engines, three Orion 2005 MY buses powered by Cummins CG-280 lean-burn natural gas engines, two Orion 1992 MY buses retrofitted with 2003 MY Detroit Diesel Corporation (DDC) Series 50 diesel engines, two 2006 MY New Flyer buses equipped with Cummins ISM 280 horsepower (hp) diesel engines, and three New Flyer hybrid-electric buses. The hybrid-electric diesel buses were powered by 2006 MY Cummins ISL diesel engines and were equipped with Allison EP40 parallel transmission systems. All diesel engines were fueled with No.1 ultra low sulfur diesel (ULSD). The John Deere and the Cummins NGB and the Cummins ISM diesel buses were equipped with catalytic converters while the hybrid-electric diesel buses and one retrofitted diesel bus were fitted with Engelhard DPX particulate filters. The other retrofitted diesel bus had the Johnson-Matthey Catalyzed Continuously Regenerating Technology (CCRT) particulate system. Salient information on the transit buses is provided in Table 1.
The John Deere buses no. 2639 and 2621, the Cummins NGB buses no. 2501 and 2502, the hybrid-electric diesel buses no. 6001 and 6002, the retrofitted diesel bus no. 9643, and the Cummins ISM diesel bus no. 6146 were tested at half load on six different drive cycles including the New York Bus Cycle (NYBus) (Clark et al. 2002), the ADEME-RATP Paris Cycle (Paris) (Coroller and Plassat 2003), the Manhattan Cycle (Man) (SAE 2002), the WMATA Cycle (Wayne et al. 2002a), the Orange County Transit Authority Cycle (OCTA) (SAE 2002), and the Braunschweig Cycle (Braun) (DieselNet 2006). The remaining buses were tested on 17 chassis cycles, including the six test cycles on which the other buses were tested. Other cycles employed were the New York Composite Cycle (NYComp) (Thompson et al. 1990), the Central Business District Cycle (CBD) (SAE 1982), the City Suburban Heavy Vehicle Cycle (CSHVC) (Nine et al. 1999), the urban segment of the European Transient Cycle (ETC-Urban) (DieselNet 2006), the Beeline Cycle (Wayne et al. 2002b), the Transient mode of the Heavy Heavy-Duty Diesel Truck Schedule (HHDDTS) (Clark et al. 2004), the Urban Dynamometer Driving Schedule (UDDS) (CFR 2005), the King County Metro Bus Cycle (KCM) (Chandler and Walkowicz, 2006), the Arterial (ART) and Commuter (COMM) phases of SAE J1376 (SAE 1982), and an Idle mode (Khan et al. 2006). Note that in this study the CSHVC was used, as a speed-time cycle, rather than the CSHVR (Nine et al. 1999), which is a speed-distance route.
DATA COLLECTION
Bus emissions were characterized with a WVU Transportable Heavy-Duty Vehicle Emissions Testing Laboratory (Translab). The Translab was moved to the WMATA test site at Landover, MD. The Translab consisted of a chassis dynamometer, an emissions analyzer trailer, and a mobile workshop to support them. It was designed to measure emissions mass in accordance with the provisions prescribed by the United States Code of Federal Regulations (CFR) Title 40, Subparts B & N of Part 86 (CFR 2005). Detailed description of the Translab can be found in technical papers by Gautam et al. (1991) and Clark et al. (1995).
Regulated and Non-Regulated Emissions
107
Table 1: Vehicle Details: Odometer Readings are Reflective of Chassis Use
Bus ID WMATA Bus No.
Bus Type & MY
Engine Type& MY
GVWR in
Pounds(lb)
After-treatment
Curb Wt. (lb)
Odometer Mileage
John Deere#1 2639
Orion2005
RG6081280 hp, 2005 42540 Catalytic
Converters
32050 4225
John Deere#2 2621 31660 3148
John Deere#3 2640 32320 7717
Cummins NGB#1 2501
Orion 2005
CumminsCG- 280 hp,
2004
42540 Catalytic Converters
32160 18593
Cummins NGB#2 2502 Cummins
CG- 280 hp, 2005
32560 26858
Cummins NGB#3 2503 32300 4719
Retrofitted Diesel#1 9643
Orion1992
DDC S50275 hp2003
39375
Engelhard DPX 29820 509065
Retrofitted Diesel#2 9654
Johnson-Matthey CCRT
29660 586458
Hybrid#1 6001New Flyer 2006
Cummins ISL 280
2006 with Allison EP 40 Transmission
40600 Engelhard DPX
31360 18551
Hybrid#2 6002 New Flyer 2005
Cummins ISL 280
2005 with Allison EP 40 Transmission
31660 15460
Hybrid#3 6003 31780 20373
Cummins ISM#1 6146 New
Flyer 2006
Cummins ISM 280 hp
2006 40600 Catalytic
Converters
29960 5635
Cummins ISM#2 6150 30280 7171
Description of the Chassis Dynamometer
The bus was positioned on the chassis dynamometer while its drive wheels were placed on two sets of rollers, which were 12.6 inches in diameter. Axle power from the vehicle was applied directly to the dynamometer units by replacing the rear outer wheels with a hub adapter on each side of the vehicle connected to the dynamometer through drive shafts. Each dynamometer unit consisted of a flywheel assembly, an eddy current power absorber, and a torque transducer. Flywheel sets consisted of a series of discs that allowed simulation of inertial load starting from a standstill. Torque cells and
Regulated and Non-Regulated Emissions
108
speed transducers measured the vehicle load while power absorbers were used to mimic tire losses and wind drag. A human driver operated the vehicle following a speed-time trace presented on a monitor. In this research, the vehicle losses were set using a coast down on the dynamometer. The coast down curve was created using the road load equation. The drag coefficient was set at 0.79, and the tire rolling resistance coefficient was set to 0.008. The rolling resistance coefficient differed from the value of 0.00938 provided in the CFR and was determined from best fit to data obtained during coast down runs in a prior Mexico City study (Clark et al. 2006).
Exhaust from the vehicle’s tailpipe was ducted into a full-scale dilution tunnel. The tunnel was 18 inches in diameter and 20 feet in length. HEPA filtered ambient air was mixed with the exhaust in the primary dilution tunnel in order to ensure that PM sample filter temperature was below 1250F for PM sampling. Heated lines were used to convey samples from the dilution tunnel to research grade analyzers. All data were corrected for background levels in the dilution air. Both CO and CO2 were measured using non-dispersive infrared analyzers (NDIR). CO data may be processed using either integration of continuous data or concentrations from a Tedler bag of dilute exhaust gas, collected over the duration of the cycle. Bag CO data have been used to prepare this report because cycle-average CO levels were low. These samples were passed through a refrigerator/dryer before they reached the analyzers. NOx was measured using a wet chemiluminescent analyzer while HC was measured using a heated flame ionization detection (HFID) method. The HC probe and line were maintained at 3750F while all other lines were maintained at 2500F to prevent condensation of moisture in the system. PM samples were taken through three sets of parallel filters located after the secondary dilution tunnel, which was attached to the primary dilution tunnel. The PM samples were collected gravimetrically in one 70 mm fluorocarbon coated glass-fiber filter holders that contain two filters in series. These filters were conditioned before and after each test and weighed in a climate-controlled enclosure at WVU using a Sartorius SE2-F microbalance to determine the gravimetric mass accumulated during the test.
RESULTS
Actual and Target Speed
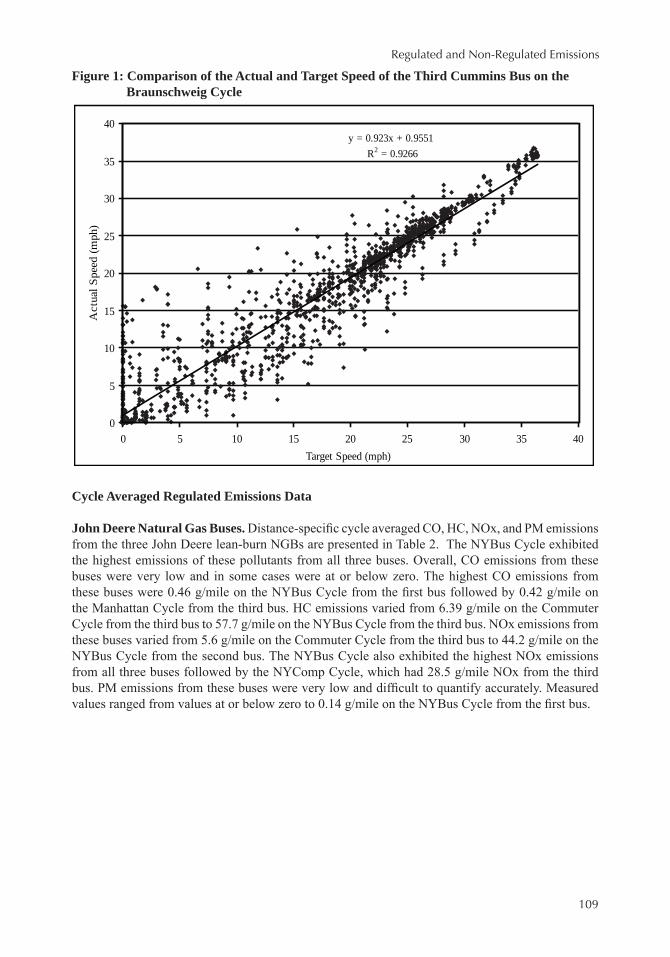
Figure 1 compares the relationship between the actual and target speed employed for the third John Deere bus on the Braunschweig cycle. The correlation between the actual and target speed resulted in R2 values of about 0.93. The driver was instructed to follow the scheduled trace as closely as possible without driving in a fashion uncharacteristic of real-world operation. Deviation from the parity line often corresponded to acceleration and deceleration events, where small misalignments in time could cause large speed deviations at a point, particularly at low speeds. The authors believe that regression for speed alone is insufficient to guarantee reproducibility but at the time of writing, no other cycle compliance protocols exist.
Regulated and Non-Regulated Emissions
109
y = 0.923x + 0.9551R2 = 0.9266
0
5
10
15
20
25
30
35
40
0 5 10 15 20 25 30 35 40Target Speed (mph)
Act
ual S
peed
(mph
)Figure 1: Comparison of the Actual and Target Speed of the Third Cummins Bus on the Braunschweig Cycle
Cycle Averaged Regulated Emissions Data
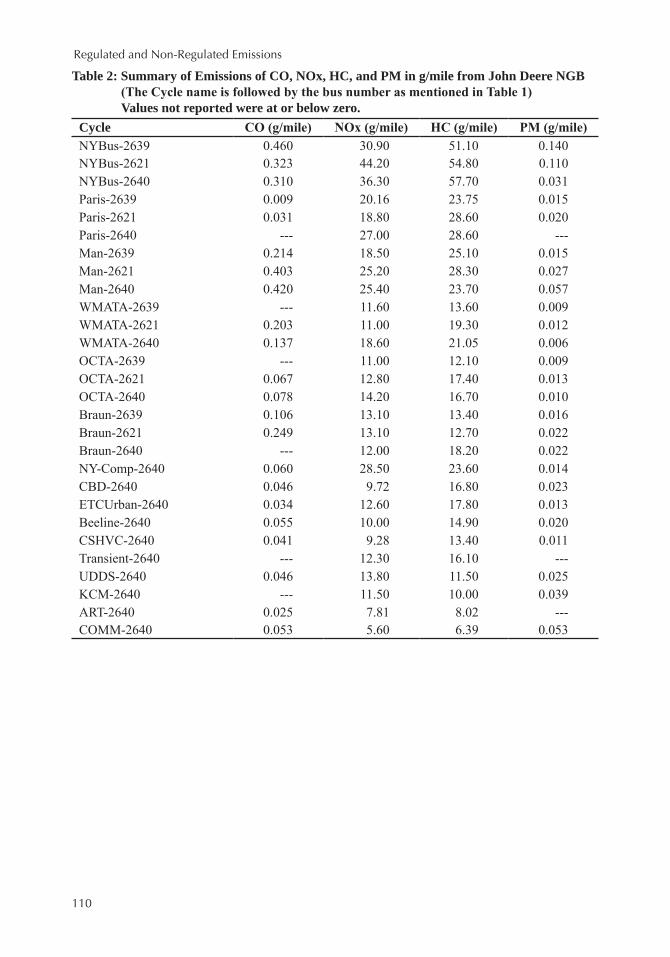
John Deere Natural Gas Buses. Distance-specific cycle averaged CO, HC, NOx, and PM emissions from the three John Deere lean-burn NGBs are presented in Table 2. The NYBus Cycle exhibited the highest emissions of these pollutants from all three buses. Overall, CO emissions from these buses were very low and in some cases were at or below zero. The highest CO emissions from these buses were 0.46 g/mile on the NYBus Cycle from the first bus followed by 0.42 g/mile on the Manhattan Cycle from the third bus. HC emissions varied from 6.39 g/mile on the Commuter Cycle from the third bus to 57.7 g/mile on the NYBus Cycle from the third bus. NOx emissions from these buses varied from 5.6 g/mile on the Commuter Cycle from the third bus to 44.2 g/mile on the NYBus Cycle from the second bus. The NYBus Cycle also exhibited the highest NOx emissions from all three buses followed by the NYComp Cycle, which had 28.5 g/mile NOx from the third bus. PM emissions from these buses were very low and difficult to quantify accurately. Measured values ranged from values at or below zero to 0.14 g/mile on the NYBus Cycle from the first bus.
Regulated and Non-Regulated Emissions
110
Table 2: Summary of Emissions of CO, NOx, HC, and PM in g/mile from John Deere NGB (The Cycle name is followed by the bus number as mentioned in Table 1)
Values not reported were at or below zero.Cycle CO (g/mile) NOx (g/mile) HC (g/mile) PM (g/mile)NYBus-2639 0.460 30.90 51.10 0.140NYBus-2621 0.323 44.20 54.80 0.110NYBus-2640 0.310 36.30 57.70 0.031Paris-2639 0.009 20.16 23.75 0.015Paris-2621 0.031 18.80 28.60 0.020Paris-2640 --- 27.00 28.60 ---Man-2639 0.214 18.50 25.10 0.015Man-2621 0.403 25.20 28.30 0.027Man-2640 0.420 25.40 23.70 0.057WMATA-2639 --- 11.60 13.60 0.009WMATA-2621 0.203 11.00 19.30 0.012WMATA-2640 0.137 18.60 21.05 0.006OCTA-2639 --- 11.00 12.10 0.009OCTA-2621 0.067 12.80 17.40 0.013OCTA-2640 0.078 14.20 16.70 0.010Braun-2639 0.106 13.10 13.40 0.016Braun-2621 0.249 13.10 12.70 0.022Braun-2640 --- 12.00 18.20 0.022NY-Comp-2640 0.060 28.50 23.60 0.014CBD-2640 0.046 9.72 16.80 0.023ETCUrban-2640 0.034 12.60 17.80 0.013Beeline-2640 0.055 10.00 14.90 0.020CSHVC-2640 0.041 9.28 13.40 0.011Transient-2640 --- 12.30 16.10 ---UDDS-2640 0.046 13.80 11.50 0.025KCM-2640 --- 11.50 10.00 0.039ART-2640 0.025 7.81 8.02 ---COMM-2640 0.053 5.60 6.39 0.053
Regulated and Non-Regulated Emissions
111
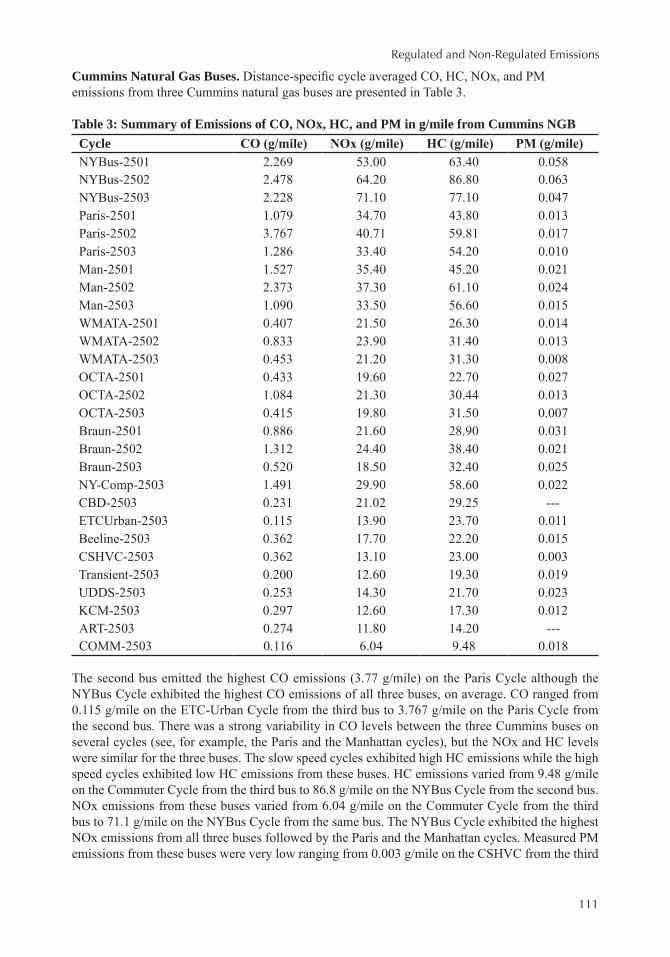
Cummins Natural Gas Buses. Distance-specific cycle averaged CO, HC, NOx, and PM emissions from three Cummins natural gas buses are presented in Table 3.
Table 3: Summary of Emissions of CO, NOx, HC, and PM in g/mile from Cummins NGBCycle CO (g/mile) NOx (g/mile) HC (g/mile) PM (g/mile)NYBus-2501 2.269 53.00 63.40 0.058NYBus-2502 2.478 64.20 86.80 0.063NYBus-2503 2.228 71.10 77.10 0.047Paris-2501 1.079 34.70 43.80 0.013Paris-2502 3.767 40.71 59.81 0.017Paris-2503 1.286 33.40 54.20 0.010Man-2501 1.527 35.40 45.20 0.021Man-2502 2.373 37.30 61.10 0.024Man-2503 1.090 33.50 56.60 0.015WMATA-2501 0.407 21.50 26.30 0.014WMATA-2502 0.833 23.90 31.40 0.013WMATA-2503 0.453 21.20 31.30 0.008OCTA-2501 0.433 19.60 22.70 0.027OCTA-2502 1.084 21.30 30.44 0.013OCTA-2503 0.415 19.80 31.50 0.007Braun-2501 0.886 21.60 28.90 0.031Braun-2502 1.312 24.40 38.40 0.021Braun-2503 0.520 18.50 32.40 0.025NY-Comp-2503 1.491 29.90 58.60 0.022CBD-2503 0.231 21.02 29.25 ---ETCUrban-2503 0.115 13.90 23.70 0.011Beeline-2503 0.362 17.70 22.20 0.015CSHVC-2503 0.362 13.10 23.00 0.003Transient-2503 0.200 12.60 19.30 0.019UDDS-2503 0.253 14.30 21.70 0.023KCM-2503 0.297 12.60 17.30 0.012ART-2503 0.274 11.80 14.20 ---COMM-2503 0.116 6.04 9.48 0.018
The second bus emitted the highest CO emissions (3.77 g/mile) on the Paris Cycle although the NYBus Cycle exhibited the highest CO emissions of all three buses, on average. CO ranged from 0.115 g/mile on the ETC-Urban Cycle from the third bus to 3.767 g/mile on the Paris Cycle from the second bus. There was a strong variability in CO levels between the three Cummins buses on several cycles (see, for example, the Paris and the Manhattan cycles), but the NOx and HC levels were similar for the three buses. The slow speed cycles exhibited high HC emissions while the high speed cycles exhibited low HC emissions from these buses. HC emissions varied from 9.48 g/mile on the Commuter Cycle from the third bus to 86.8 g/mile on the NYBus Cycle from the second bus. NOx emissions from these buses varied from 6.04 g/mile on the Commuter Cycle from the third bus to 71.1 g/mile on the NYBus Cycle from the same bus. The NYBus Cycle exhibited the highest NOx emissions from all three buses followed by the Paris and the Manhattan cycles. Measured PM emissions from these buses were very low ranging from 0.003 g/mile on the CSHVC from the third
Regulated and Non-Regulated Emissions
112
bus to 0.063 g/mile on the NYBus Cycle from the second bus. Two runs yielded PM at or below zero.
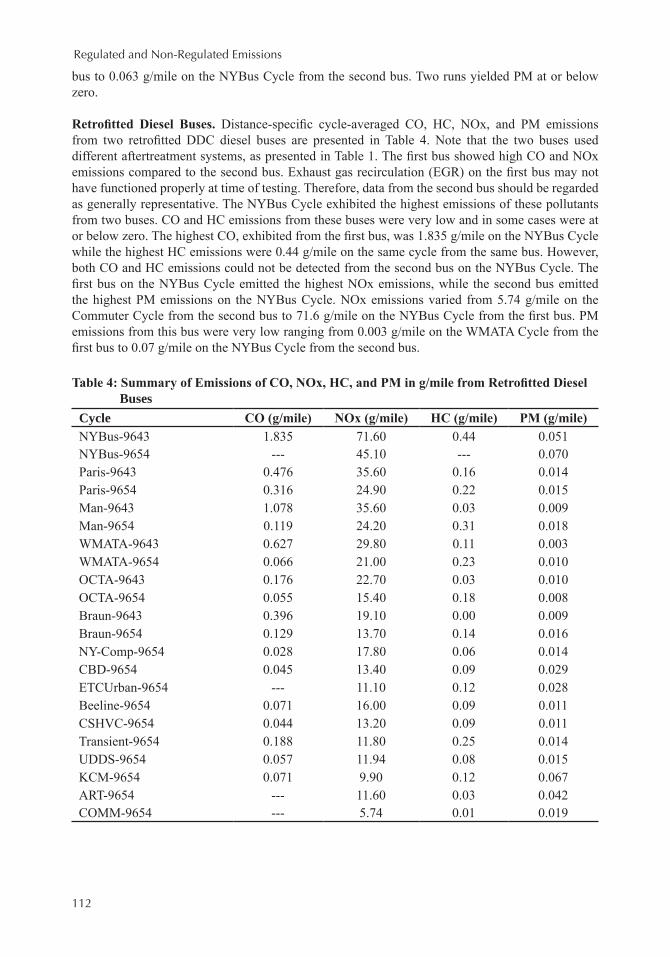
Retrofitted Diesel Buses. Distance-specific cycle-averaged CO, HC, NOx, and PM emissions from two retrofitted DDC diesel buses are presented in Table 4. Note that the two buses used different aftertreatment systems, as presented in Table 1. The first bus showed high CO and NOx emissions compared to the second bus. Exhaust gas recirculation (EGR) on the first bus may not have functioned properly at time of testing. Therefore, data from the second bus should be regarded as generally representative. The NYBus Cycle exhibited the highest emissions of these pollutants from two buses. CO and HC emissions from these buses were very low and in some cases were at or below zero. The highest CO, exhibited from the first bus, was 1.835 g/mile on the NYBus Cycle while the highest HC emissions were 0.44 g/mile on the same cycle from the same bus. However, both CO and HC emissions could not be detected from the second bus on the NYBus Cycle. The first bus on the NYBus Cycle emitted the highest NOx emissions, while the second bus emitted the highest PM emissions on the NYBus Cycle. NOx emissions varied from 5.74 g/mile on the Commuter Cycle from the second bus to 71.6 g/mile on the NYBus Cycle from the first bus. PM emissions from this bus were very low ranging from 0.003 g/mile on the WMATA Cycle from the first bus to 0.07 g/mile on the NYBus Cycle from the second bus.
Table 4: Summary of Emissions of CO, NOx, HC, and PM in g/mile from Retrofitted Diesel Buses
Cycle CO (g/mile) NOx (g/mile) HC (g/mile) PM (g/mile)NYBus-9643 1.835 71.60 0.44 0.051NYBus-9654 --- 45.10 --- 0.070Paris-9643 0.476 35.60 0.16 0.014Paris-9654 0.316 24.90 0.22 0.015Man-9643 1.078 35.60 0.03 0.009Man-9654 0.119 24.20 0.31 0.018WMATA-9643 0.627 29.80 0.11 0.003WMATA-9654 0.066 21.00 0.23 0.010OCTA-9643 0.176 22.70 0.03 0.010OCTA-9654 0.055 15.40 0.18 0.008Braun-9643 0.396 19.10 0.00 0.009Braun-9654 0.129 13.70 0.14 0.016NY-Comp-9654 0.028 17.80 0.06 0.014CBD-9654 0.045 13.40 0.09 0.029ETCUrban-9654 --- 11.10 0.12 0.028Beeline-9654 0.071 16.00 0.09 0.011CSHVC-9654 0.044 13.20 0.09 0.011Transient-9654 0.188 11.80 0.25 0.014UDDS-9654 0.057 11.94 0.08 0.015KCM-9654 0.071 9.90 0.12 0.067ART-9654 --- 11.60 0.03 0.042COMM-9654 --- 5.74 0.01 0.019
Regulated and Non-Regulated Emissions
113
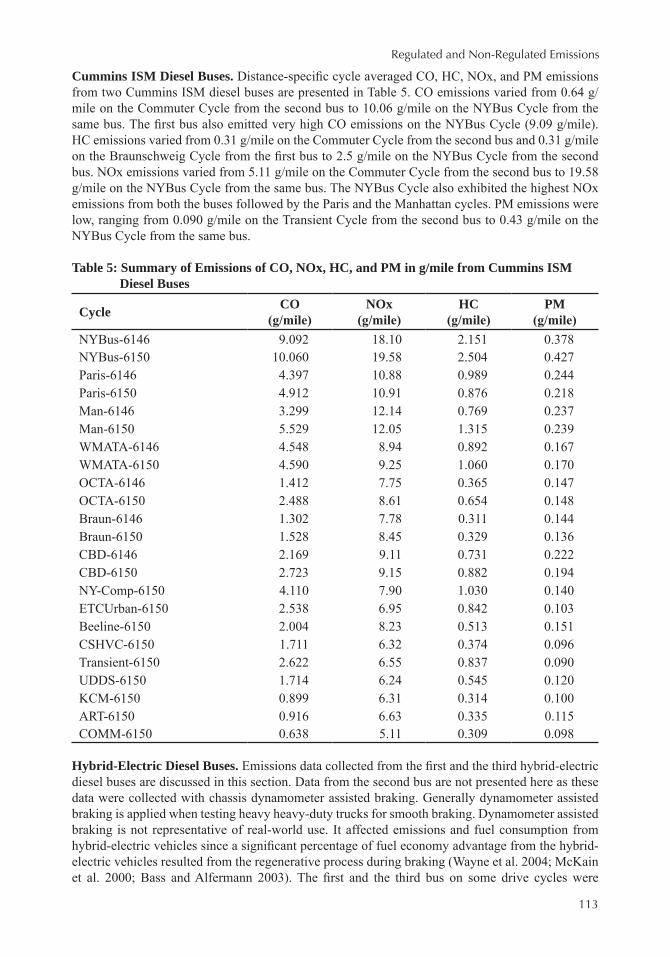
Cummins ISM Diesel Buses. Distance-specific cycle averaged CO, HC, NOx, and PM emissions from two Cummins ISM diesel buses are presented in Table 5. CO emissions varied from 0.64 g/mile on the Commuter Cycle from the second bus to 10.06 g/mile on the NYBus Cycle from the same bus. The first bus also emitted very high CO emissions on the NYBus Cycle (9.09 g/mile). HC emissions varied from 0.31 g/mile on the Commuter Cycle from the second bus and 0.31 g/mile on the Braunschweig Cycle from the first bus to 2.5 g/mile on the NYBus Cycle from the second bus. NOx emissions varied from 5.11 g/mile on the Commuter Cycle from the second bus to 19.58 g/mile on the NYBus Cycle from the same bus. The NYBus Cycle also exhibited the highest NOx emissions from both the buses followed by the Paris and the Manhattan cycles. PM emissions were low, ranging from 0.090 g/mile on the Transient Cycle from the second bus to 0.43 g/mile on the NYBus Cycle from the same bus.
Table 5: Summary of Emissions of CO, NOx, HC, and PM in g/mile from Cummins ISM Diesel Buses
Cycle CO (g/mile)
NOx (g/mile)
HC (g/mile)
PM (g/mile)
NYBus-6146 9.092 18.10 2.151 0.378NYBus-6150 10.060 19.58 2.504 0.427Paris-6146 4.397 10.88 0.989 0.244Paris-6150 4.912 10.91 0.876 0.218Man-6146 3.299 12.14 0.769 0.237Man-6150 5.529 12.05 1.315 0.239WMATA-6146 4.548 8.94 0.892 0.167WMATA-6150 4.590 9.25 1.060 0.170OCTA-6146 1.412 7.75 0.365 0.147OCTA-6150 2.488 8.61 0.654 0.148Braun-6146 1.302 7.78 0.311 0.144Braun-6150 1.528 8.45 0.329 0.136CBD-6146 2.169 9.11 0.731 0.222CBD-6150 2.723 9.15 0.882 0.194NY-Comp-6150 4.110 7.90 1.030 0.140ETCUrban-6150 2.538 6.95 0.842 0.103Beeline-6150 2.004 8.23 0.513 0.151CSHVC-6150 1.711 6.32 0.374 0.096Transient-6150 2.622 6.55 0.837 0.090UDDS-6150 1.714 6.24 0.545 0.120KCM-6150 0.899 6.31 0.314 0.100ART-6150 0.916 6.63 0.335 0.115COMM-6150 0.638 5.11 0.309 0.098
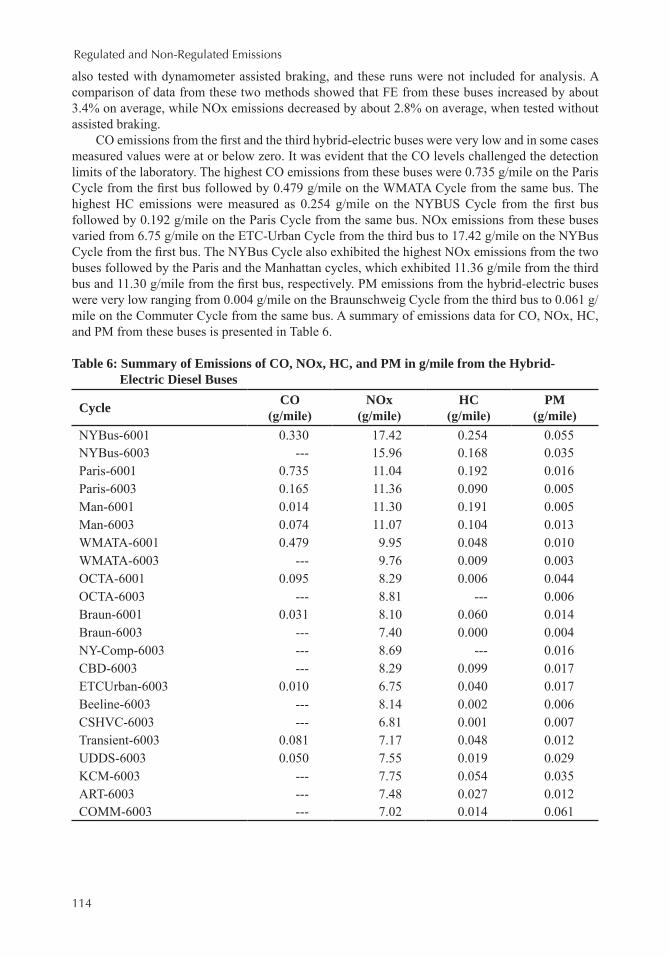
Hybrid-Electric Diesel Buses. Emissions data collected from the first and the third hybrid-electric diesel buses are discussed in this section. Data from the second bus are not presented here as these data were collected with chassis dynamometer assisted braking. Generally dynamometer assisted braking is applied when testing heavy heavy-duty trucks for smooth braking. Dynamometer assisted braking is not representative of real-world use. It affected emissions and fuel consumption from hybrid-electric vehicles since a significant percentage of fuel economy advantage from the hybrid-electric vehicles resulted from the regenerative process during braking (Wayne et al. 2004; McKain et al. 2000; Bass and Alfermann 2003). The first and the third bus on some drive cycles were
Regulated and Non-Regulated Emissions
114
also tested with dynamometer assisted braking, and these runs were not included for analysis. A comparison of data from these two methods showed that FE from these buses increased by about 3.4% on average, while NOx emissions decreased by about 2.8% on average, when tested without assisted braking.
CO emissions from the first and the third hybrid-electric buses were very low and in some cases measured values were at or below zero. It was evident that the CO levels challenged the detection limits of the laboratory. The highest CO emissions from these buses were 0.735 g/mile on the Paris Cycle from the first bus followed by 0.479 g/mile on the WMATA Cycle from the same bus. The highest HC emissions were measured as 0.254 g/mile on the NYBUS Cycle from the first bus followed by 0.192 g/mile on the Paris Cycle from the same bus. NOx emissions from these buses varied from 6.75 g/mile on the ETC-Urban Cycle from the third bus to 17.42 g/mile on the NYBus Cycle from the first bus. The NYBus Cycle also exhibited the highest NOx emissions from the two buses followed by the Paris and the Manhattan cycles, which exhibited 11.36 g/mile from the third bus and 11.30 g/mile from the first bus, respectively. PM emissions from the hybrid-electric buses were very low ranging from 0.004 g/mile on the Braunschweig Cycle from the third bus to 0.061 g/mile on the Commuter Cycle from the same bus. A summary of emissions data for CO, NOx, HC, and PM from these buses is presented in Table 6.
Table 6: Summary of Emissions of CO, NOx, HC, and PM in g/mile from the Hybrid- Electric Diesel Buses
Cycle CO (g/mile)
NOx (g/mile)
HC (g/mile)
PM (g/mile)
NYBus-6001 0.330 17.42 0.254 0.055NYBus-6003 --- 15.96 0.168 0.035Paris-6001 0.735 11.04 0.192 0.016Paris-6003 0.165 11.36 0.090 0.005Man-6001 0.014 11.30 0.191 0.005Man-6003 0.074 11.07 0.104 0.013WMATA-6001 0.479 9.95 0.048 0.010WMATA-6003 --- 9.76 0.009 0.003OCTA-6001 0.095 8.29 0.006 0.044OCTA-6003 --- 8.81 --- 0.006Braun-6001 0.031 8.10 0.060 0.014Braun-6003 --- 7.40 0.000 0.004NY-Comp-6003 --- 8.69 --- 0.016CBD-6003 --- 8.29 0.099 0.017ETCUrban-6003 0.010 6.75 0.040 0.017Beeline-6003 --- 8.14 0.002 0.006CSHVC-6003 --- 6.81 0.001 0.007Transient-6003 0.081 7.17 0.048 0.012UDDS-6003 0.050 7.55 0.019 0.029KCM-6003 --- 7.75 0.054 0.035ART-6003 --- 7.48 0.027 0.012COMM-6003 --- 7.02 0.014 0.061
Regulated and Non-Regulated Emissions
115
Fuel Economy (FE)
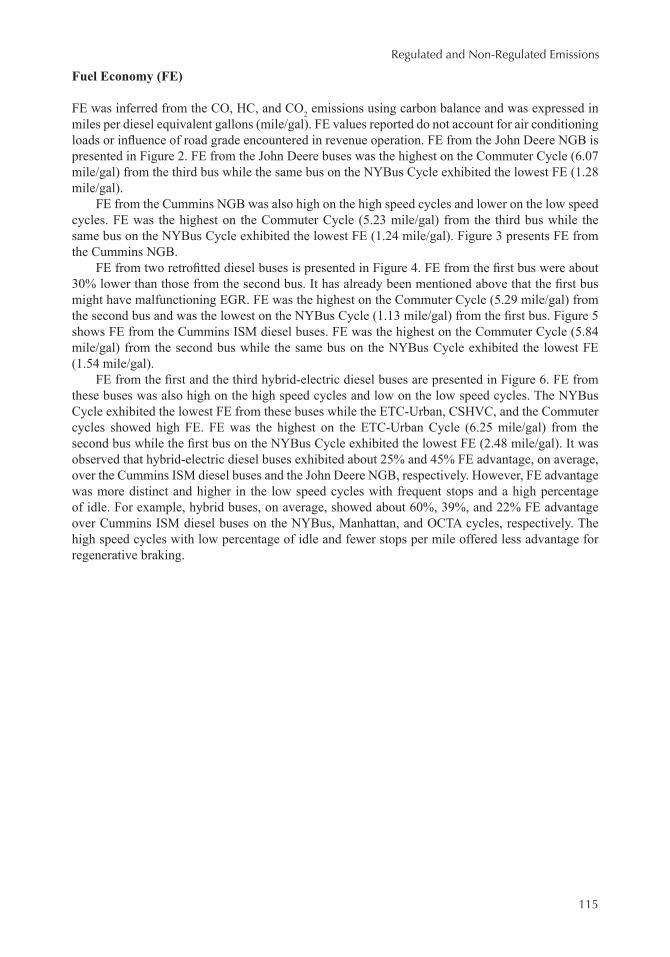
FE was inferred from the CO, HC, and CO2 emissions using carbon balance and was expressed in miles per diesel equivalent gallons (mile/gal). FE values reported do not account for air conditioning loads or influence of road grade encountered in revenue operation. FE from the John Deere NGB is presented in Figure 2. FE from the John Deere buses was the highest on the Commuter Cycle (6.07 mile/gal) from the third bus while the same bus on the NYBus Cycle exhibited the lowest FE (1.28 mile/gal).
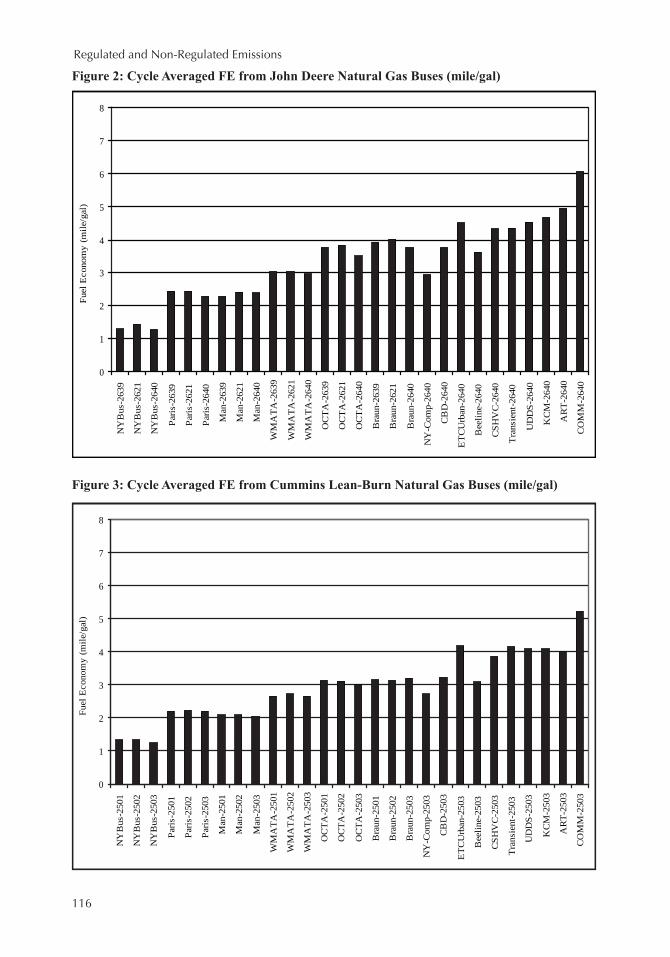
FE from the Cummins NGB was also high on the high speed cycles and lower on the low speed cycles. FE was the highest on the Commuter Cycle (5.23 mile/gal) from the third bus while the same bus on the NYBus Cycle exhibited the lowest FE (1.24 mile/gal). Figure 3 presents FE from the Cummins NGB.
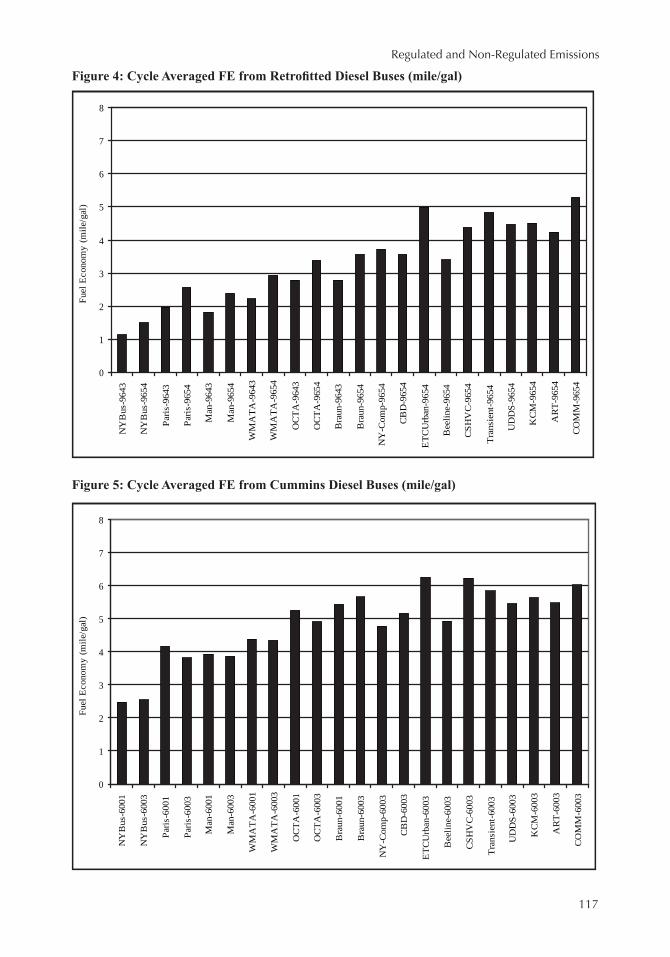
FE from two retrofitted diesel buses is presented in Figure 4. FE from the first bus were about 30% lower than those from the second bus. It has already been mentioned above that the first bus might have malfunctioning EGR. FE was the highest on the Commuter Cycle (5.29 mile/gal) from the second bus and was the lowest on the NYBus Cycle (1.13 mile/gal) from the first bus. Figure 5 shows FE from the Cummins ISM diesel buses. FE was the highest on the Commuter Cycle (5.84 mile/gal) from the second bus while the same bus on the NYBus Cycle exhibited the lowest FE (1.54 mile/gal).
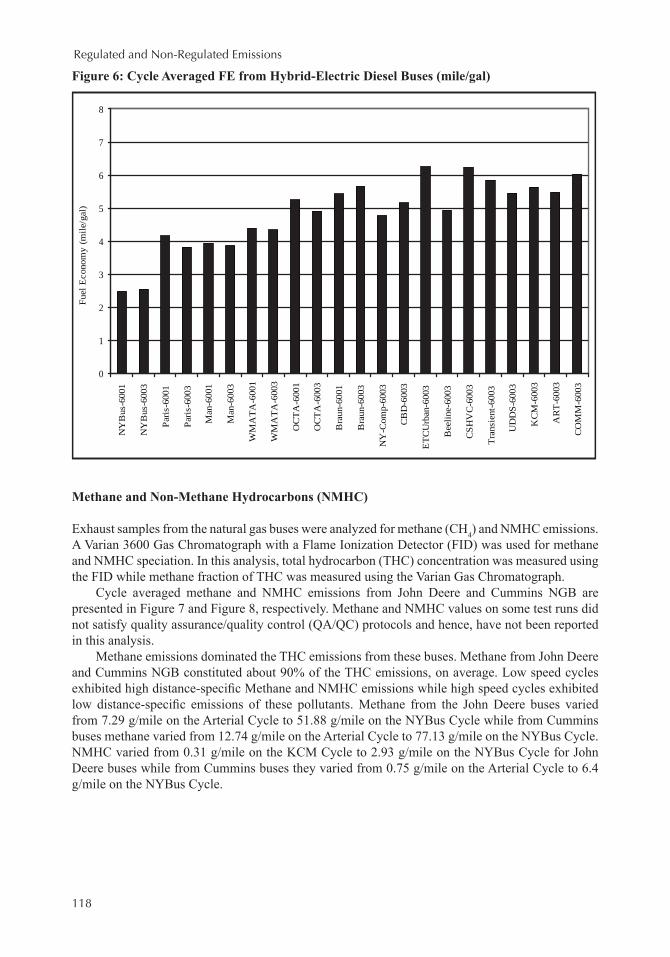
FE from the first and the third hybrid-electric diesel buses are presented in Figure 6. FE from these buses was also high on the high speed cycles and low on the low speed cycles. The NYBus Cycle exhibited the lowest FE from these buses while the ETC-Urban, CSHVC, and the Commuter cycles showed high FE. FE was the highest on the ETC-Urban Cycle (6.25 mile/gal) from the second bus while the first bus on the NYBus Cycle exhibited the lowest FE (2.48 mile/gal). It was observed that hybrid-electric diesel buses exhibited about 25% and 45% FE advantage, on average, over the Cummins ISM diesel buses and the John Deere NGB, respectively. However, FE advantage was more distinct and higher in the low speed cycles with frequent stops and a high percentage of idle. For example, hybrid buses, on average, showed about 60%, 39%, and 22% FE advantage over Cummins ISM diesel buses on the NYBus, Manhattan, and OCTA cycles, respectively. The high speed cycles with low percentage of idle and fewer stops per mile offered less advantage for regenerative braking.
Regulated and Non-Regulated Emissions
116
0
1
2
3
4
5
6
7
8N
YB
us-2
639
NY
Bus
-262
1
NY
Bus
-264
0
Paris
-263
9
Paris
-262
1
Paris
-264
0
Man
-263
9
Man
-262
1
Man
-264
0
WM
ATA
-263
9
WM
ATA
-262
1
WM
ATA
-264
0
OC
TA-2
639
OC
TA-2
621
OC
TA-2
640
Bra
un-2
639
Bra
un-2
621
Bra
un-2
640
NY
-Com
p-26
40
CB
D-2
640
ETC
Urb
an-2
640
Bee
line-
2640
CSH
VC
-264
0
Tran
sien
t-264
0
UD
DS-
2640
KC
M-2
640
AR
T-26
40
CO
MM
-264
0
Fuel
Eco
nom
y (m
ile/g
al)
0
1
2
3
4
5
6
7
8
NY
Bus
-250
1
NY
Bus
-250
2
NY
Bus
-250
3
Paris
-250
1
Paris
-250
2
Paris
-250
3
Man
-250
1
Man
-250
2
Man
-250
3
WM
ATA
-250
1
WM
ATA
-250
2
WM
ATA
-250
3
OC
TA-2
501
OC
TA-2
502
OC
TA-2
503
Bra
un-2
501
Bra
un-2
502
Bra
un-2
503
NY
-Com
p-25
03
CB
D-2
503
ETC
Urb
an-2
503
Bee
line-
2503
CSH
VC
-250
3
Tran
sien
t-25
03
UD
DS-
2503
KC
M-2
503
AR
T-25
03
CO
MM
-250
3
Fuel
Eco
nom
y (m
ile/g
al)
Figure 2: Cycle Averaged FE from John Deere Natural Gas Buses (mile/gal)
Figure 3: Cycle Averaged FE from Cummins Lean-Burn Natural Gas Buses (mile/gal)
Regulated and Non-Regulated Emissions
117
0
1
2
3
4
5
6
7
8N
YB
us-9
643
NY
Bus
-965
4
Paris
-964
3
Paris
-965
4
Man
-964
3
Man
-965
4
WM
ATA
-964
3
WM
ATA
-965
4
OC
TA-9
643
OC
TA-9
654
Bra
un-9
643
Bra
un-9
654
NY
-Com
p-96
54
CB
D-9
654
ETC
Urb
an-9
654
Bee
line-
9654
CSH
VC
-965
4
Tran
sien
t-965
4
UD
DS-
9654
KC
M-9
654
AR
T-96
54
CO
MM
-965
4
Fuel
Eco
nom
y (m
ile/g
al)
0
1
2
3
4
5
6
7
8
NY
Bus
-600
1
NY
Bus
-600
3
Paris
-600
1
Paris
-600
3
Man
-600
1
Man
-600
3
WM
ATA
-600
1
WM
ATA
-600
3
OC
TA-6
001
OC
TA-6
003
Bra
un-6
001
Bra
un-6
003
NY
-Com
p-60
03
CB
D-6
003
ETC
Urb
an-6
003
Bee
line-
6003
CSH
VC
-600
3
Tran
sien
t-60
03
UD
DS-
6003
KC
M-6
003
AR
T-60
03
CO
MM
-600
3
Fuel
Eco
nom
y (m
ile/g
al)
Figure 4: Cycle Averaged FE from Retrofitted Diesel Buses (mile/gal)
Figure 5: Cycle Averaged FE from Cummins Diesel Buses (mile/gal)
Regulated and Non-Regulated Emissions
118
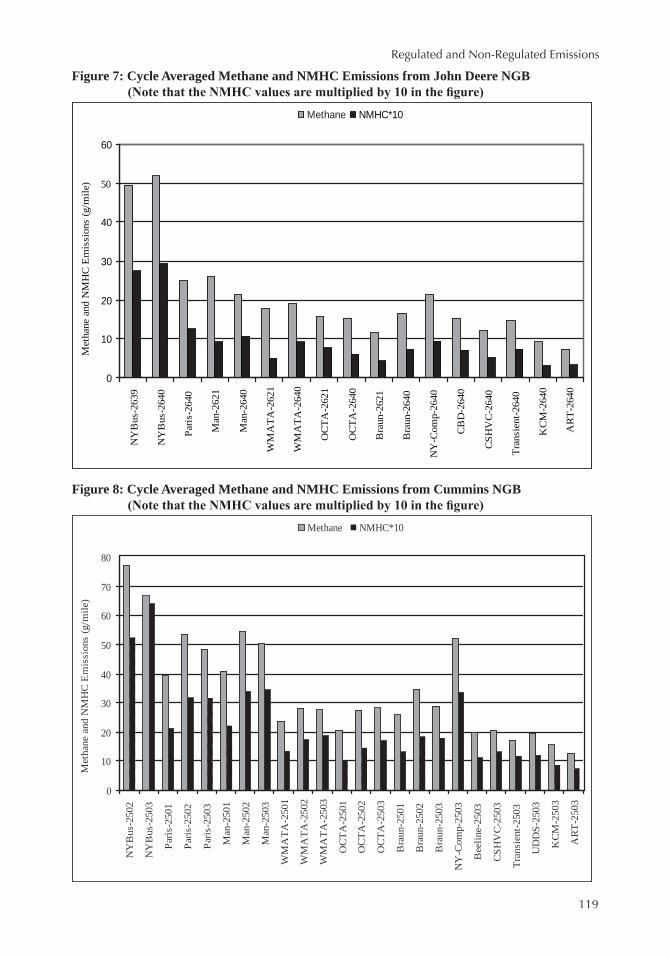
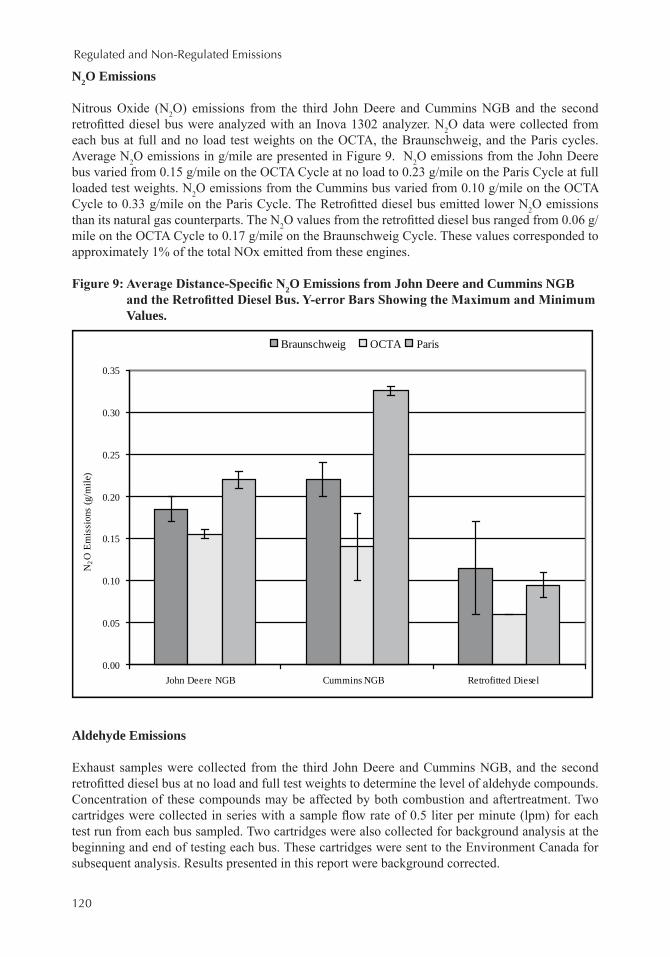
Methane and Non-Methane Hydrocarbons (NMHC)
Exhaust samples from the natural gas buses were analyzed for methane (CH4) and NMHC emissions. A Varian 3600 Gas Chromatograph with a Flame Ionization Detector (FID) was used for methane and NMHC speciation. In this analysis, total hydrocarbon (THC) concentration was measured using the FID while methane fraction of THC was measured using the Varian Gas Chromatograph.
Cycle averaged methane and NMHC emissions from John Deere and Cummins NGB are presented in Figure 7 and Figure 8, respectively. Methane and NMHC values on some test runs did not satisfy quality assurance/quality control (QA/QC) protocols and hence, have not been reported in this analysis.
Methane emissions dominated the THC emissions from these buses. Methane from John Deere and Cummins NGB constituted about 90% of the THC emissions, on average. Low speed cycles exhibited high distance-specific Methane and NMHC emissions while high speed cycles exhibited low distance-specific emissions of these pollutants. Methane from the John Deere buses varied from 7.29 g/mile on the Arterial Cycle to 51.88 g/mile on the NYBus Cycle while from Cummins buses methane varied from 12.74 g/mile on the Arterial Cycle to 77.13 g/mile on the NYBus Cycle. NMHC varied from 0.31 g/mile on the KCM Cycle to 2.93 g/mile on the NYBus Cycle for John Deere buses while from Cummins buses they varied from 0.75 g/mile on the Arterial Cycle to 6.4 g/mile on the NYBus Cycle.
0
1
2
3
4
5
6
7
8N
YB
us-6
001
NY
Bus
-600
3
Paris
-600
1
Paris
-600
3
Man
-600
1
Man
-600
3
WM
ATA
-600
1
WM
ATA
-600
3
OC
TA-6
001
OC
TA-6
003
Bra
un-6
001
Bra
un-6
003
NY
-Com
p-60
03
CB
D-6
003
ETC
Urb
an-6
003
Bee
line-
6003
CSH
VC
-600
3
Tran
sien
t-60
03
UD
DS-
6003
KC
M-6
003
AR
T-60
03
CO
MM
-600
3
Fuel
Eco
nom
y (m
ile/g
al)
Figure 6: Cycle Averaged FE from Hybrid-Electric Diesel Buses (mile/gal)
Regulated and Non-Regulated Emissions
119
0
10
20
30
40
50
60N
YB
us-2
639
NY
Bus
-264
0
Paris
-264
0
Man
-262
1
Man
-264
0
WM
ATA
-262
1
WM
ATA
-264
0
OC
TA-2
621
OC
TA-2
640
Bra
un-2
621
Bra
un-2
640
NY
-Com
p-26
40
CB
D-2
640
CSH
VC
-264
0
Tran
sien
t-264
0
KC
M-2
640
AR
T-26
40
Met
hane
and
NM
HC
Em
issi
ons
(g/m
ile)
Methane NMHC*10
Figure 7: Cycle Averaged Methane and NMHC Emissions from John Deere NGB(Note that the NMHC values are multiplied by 10 in the figure)
0
10
20
30
40
50
60
70
80
NY
Bus
-250
2
NY
Bus
-250
3
Paris
-250
1
Paris
-250
2
Paris
-250
3
Man
-250
1
Man
-250
2
Man
-250
3
WM
ATA
-250
1
WM
ATA
-250
2
WM
ATA
-250
3
OC
TA-2
501
OC
TA-2
502
OC
TA-2
503
Bra
un-2
501
Bra
un-2
502
Bra
un-2
503
NY
-Com
p-25
03
Bee
line-
2503
CSH
VC
-250
3
Tran
sien
t-250
3
UD
DS-
2503
KC
M-2
503
AR
T-25
03
Met
hane
and
NM
HC
Em
issi
ons
(g/m
ile)
Methane NMHC*10
Figure 8: Cycle Averaged Methane and NMHC Emissions from Cummins NGB(Note that the NMHC values are multiplied by 10 in the figure)
Regulated and Non-Regulated Emissions
120
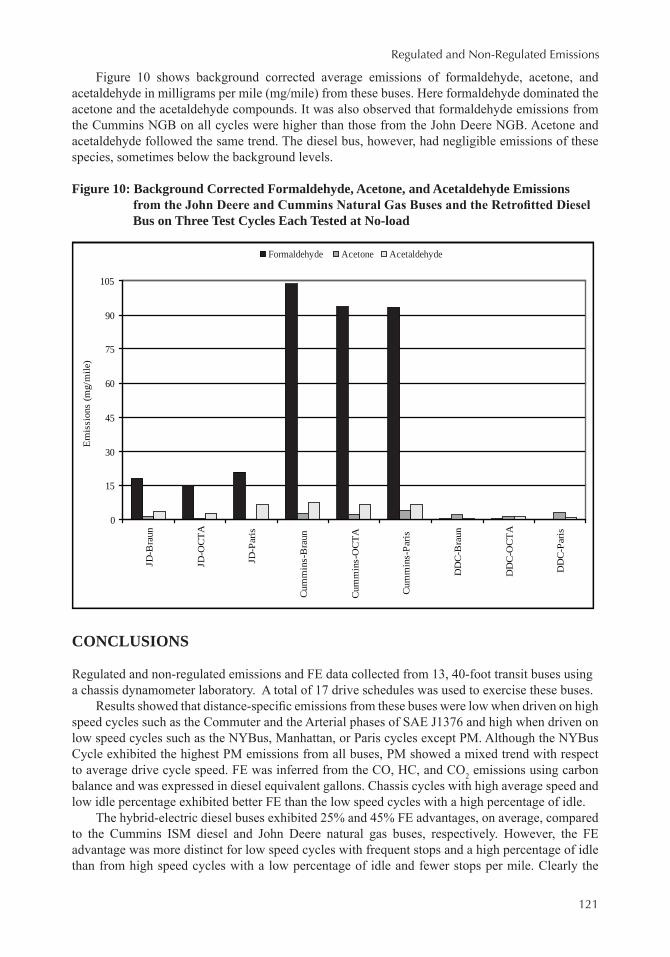
N2O Emissions
Nitrous Oxide (N2O) emissions from the third John Deere and Cummins NGB and the second retrofitted diesel bus were analyzed with an Inova 1302 analyzer. N2O data were collected from each bus at full and no load test weights on the OCTA, the Braunschweig, and the Paris cycles. Average N2O emissions in g/mile are presented in Figure 9. N2O emissions from the John Deere bus varied from 0.15 g/mile on the OCTA Cycle at no load to 0.23 g/mile on the Paris Cycle at full loaded test weights. N2O emissions from the Cummins bus varied from 0.10 g/mile on the OCTA Cycle to 0.33 g/mile on the Paris Cycle. The Retrofitted diesel bus emitted lower N2O emissions than its natural gas counterparts. The N2O values from the retrofitted diesel bus ranged from 0.06 g/mile on the OCTA Cycle to 0.17 g/mile on the Braunschweig Cycle. These values corresponded to approximately 1% of the total NOx emitted from these engines.
Figure 9: Average Distance-Specific N2O Emissions from John Deere and Cummins NGB and the Retrofitted Diesel Bus. Y-error Bars Showing the Maximum and Minimum Values.
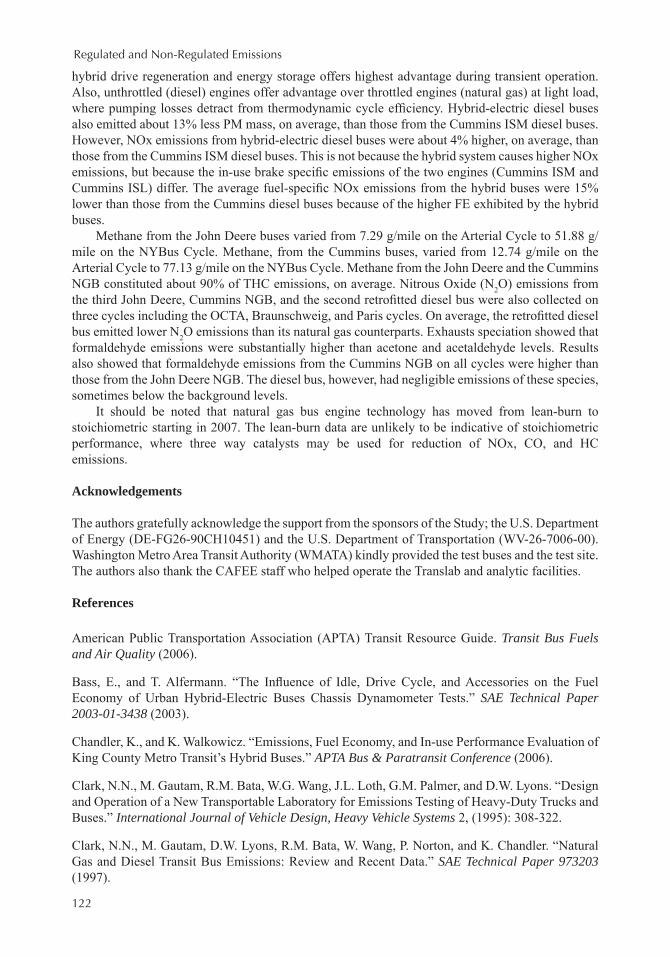
Aldehyde Emissions
Exhaust samples were collected from the third John Deere and Cummins NGB, and the second retrofitted diesel bus at no load and full test weights to determine the level of aldehyde compounds. Concentration of these compounds may be affected by both combustion and aftertreatment. Two cartridges were collected in series with a sample flow rate of 0.5 liter per minute (lpm) for each test run from each bus sampled. Two cartridges were also collected for background analysis at the beginning and end of testing each bus. These cartridges were sent to the Environment Canada for subsequent analysis. Results presented in this report were background corrected.
0.00
0.05
0.10
0.15
0.20
0.25
0.30
0.35
John Deere NGB Cummins NGB Retrofitted Diesel
N2O
Em
issi
ons
(g/m
ile)
Braunschweig OCTA Paris
Regulated and Non-Regulated Emissions
121
0
15
30
45
60
75
90
105
JD-B
raun
JD-O
CTA
JD-P
aris
Cum
min
s-B
raun
Cum
min
s-O
CTA
Cum
min
s-Pa
ris
DD
C-B
raun
DD
C-O
CTA
DD
C-P
aris
Em
issi
ons
(mg/
mile
)
Formaldehyde Acetone Acetaldehyde
Figure 10 shows background corrected average emissions of formaldehyde, acetone, and acetaldehyde in milligrams per mile (mg/mile) from these buses. Here formaldehyde dominated the acetone and the acetaldehyde compounds. It was also observed that formaldehyde emissions from the Cummins NGB on all cycles were higher than those from the John Deere NGB. Acetone and acetaldehyde followed the same trend. The diesel bus, however, had negligible emissions of these species, sometimes below the background levels.
Figure 10: Background Corrected Formaldehyde, Acetone, and Acetaldehyde Emissions from the John Deere and Cummins Natural Gas Buses and the Retrofitted Diesel Bus on Three Test Cycles Each Tested at No-load
CONCLUSIONS
Regulated and non-regulated emissions and FE data collected from 13, 40-foot transit buses using a chassis dynamometer laboratory. A total of 17 drive schedules was used to exercise these buses.
Results showed that distance-specific emissions from these buses were low when driven on high speed cycles such as the Commuter and the Arterial phases of SAE J1376 and high when driven on low speed cycles such as the NYBus, Manhattan, or Paris cycles except PM. Although the NYBus Cycle exhibited the highest PM emissions from all buses, PM showed a mixed trend with respect to average drive cycle speed. FE was inferred from the CO, HC, and CO2 emissions using carbon balance and was expressed in diesel equivalent gallons. Chassis cycles with high average speed and low idle percentage exhibited better FE than the low speed cycles with a high percentage of idle.
The hybrid-electric diesel buses exhibited 25% and 45% FE advantages, on average, compared to the Cummins ISM diesel and John Deere natural gas buses, respectively. However, the FE advantage was more distinct for low speed cycles with frequent stops and a high percentage of idle than from high speed cycles with a low percentage of idle and fewer stops per mile. Clearly the
Regulated and Non-Regulated Emissions
122
hybrid drive regeneration and energy storage offers highest advantage during transient operation. Also, unthrottled (diesel) engines offer advantage over throttled engines (natural gas) at light load, where pumping losses detract from thermodynamic cycle efficiency. Hybrid-electric diesel buses also emitted about 13% less PM mass, on average, than those from the Cummins ISM diesel buses. However, NOx emissions from hybrid-electric diesel buses were about 4% higher, on average, than those from the Cummins ISM diesel buses. This is not because the hybrid system causes higher NOx emissions, but because the in-use brake specific emissions of the two engines (Cummins ISM and Cummins ISL) differ. The average fuel-specific NOx emissions from the hybrid buses were 15% lower than those from the Cummins diesel buses because of the higher FE exhibited by the hybrid buses.
Methane from the John Deere buses varied from 7.29 g/mile on the Arterial Cycle to 51.88 g/mile on the NYBus Cycle. Methane, from the Cummins buses, varied from 12.74 g/mile on the Arterial Cycle to 77.13 g/mile on the NYBus Cycle. Methane from the John Deere and the Cummins NGB constituted about 90% of THC emissions, on average. Nitrous Oxide (N2O) emissions from the third John Deere, Cummins NGB, and the second retrofitted diesel bus were also collected on three cycles including the OCTA, Braunschweig, and Paris cycles. On average, the retrofitted diesel bus emitted lower N2O emissions than its natural gas counterparts. Exhausts speciation showed that formaldehyde emissions were substantially higher than acetone and acetaldehyde levels. Results also showed that formaldehyde emissions from the Cummins NGB on all cycles were higher than those from the John Deere NGB. The diesel bus, however, had negligible emissions of these species, sometimes below the background levels.
It should be noted that natural gas bus engine technology has moved from lean-burn to stoichiometric starting in 2007. The lean-burn data are unlikely to be indicative of stoichiometric performance, where three way catalysts may be used for reduction of NOx, CO, and HC emissions.
Acknowledgements
The authors gratefully acknowledge the support from the sponsors of the Study; the U.S. Department of Energy (DE-FG26-90CH10451) and the U.S. Department of Transportation (WV-26-7006-00). Washington Metro Area Transit Authority (WMATA) kindly provided the test buses and the test site. The authors also thank the CAFEE staff who helped operate the Translab and analytic facilities.
References
American Public Transportation Association (APTA) Transit Resource Guide. Transit Bus Fuels and Air Quality (2006).
Bass, E., and T. Alfermann. “The Influence of Idle, Drive Cycle, and Accessories on the Fuel Economy of Urban Hybrid-Electric Buses Chassis Dynamometer Tests.” SAE Technical Paper 2003-01-3438 (2003).
Chandler, K., and K. Walkowicz. “Emissions, Fuel Economy, and In-use Performance Evaluation of King County Metro Transit’s Hybrid Buses.” APTA Bus & Paratransit Conference (2006).
Clark, N.N., M. Gautam, R.M. Bata, W.G. Wang, J.L. Loth, G.M. Palmer, and D.W. Lyons. “Design and Operation of a New Transportable Laboratory for Emissions Testing of Heavy-Duty Trucks and Buses.” International Journal of Vehicle Design, Heavy Vehicle Systems 2, (1995): 308-322.
Clark, N.N., M. Gautam, D.W. Lyons, R.M. Bata, W. Wang, P. Norton, and K. Chandler. “Natural Gas and Diesel Transit Bus Emissions: Review and Recent Data.” SAE Technical Paper 973203 (1997).
Regulated and Non-Regulated Emissions
123
Clark, N.N., A. Tehranian, R.P. Jarrett, and R.D. Nine. “Translation of Distance-Specific Emissions Rates between Different Heavy-Duty Vehicle Chassis Test Schedules.” SAE Technical Paper No. 2002-01-1754 (2002).
Clark, N.N., M. Gautam, W.S. Wayne, W. Riddle, R.D. Nine, D.W. Lyons, and S. Xu. “Examination of Heavy Heavy-Duty Diesel Truck Chassis Dynamometer Schedule.” SAE Paper 2004-01-2904 (2004).
Clark, N.N., E.R. Borrell, D.L. McKain, V.H. Paramo, W.S. Wayne, W. Vergara, R. A. Barnett, M. Gautam, G. Thompson, D.W. Lyons, and L. Schipper. “Evaluation of Emissions from New and In-Use Transit Buses in Mexico City.” Paper No. 06-1092, 85th Annual Meeting of the Transportation Research Board (2006).Code of Federal Regulations (CFR), Part 86, Subpart N, Title 40. U.S. Government Printing Office, Washington, D.C. (2005).
The Connecticut Academy of Science and Engineering (CASE). “A Study of Bus Propulsion Technologies Applicable in Connecticut.” A Report for the Connecticut Department of Transportation and CTTransitTM (2001).
Coroller, P. and G. Plassat. “Comparative Study on Exhaust Emissions from Diesel and CNG-Powered Urban Buses.” Proceedings of the Diesel Engine Emissions Reduction Conference (DEER) (2003).
DieselNet. Test Cycles, http://www.dieselnet.com/standards/cycles/etc.html, (Accessed Aug. 10, 2006).
Gautam, M., N. Clark, D. Lyons, T. Jr. Long, A. Howell, J. Loth, G.M. Palmer, W.G. Wang, and R.M. Bata. “Design Overview of a Heavy Duty Mobile Vehicle Emissions Testing Laboratory.” ASME DE - 40, Advanced Automotive Technologies (1991): 199-207.
Khan, ABM S., N.N. Clark, G.J. Thompson, W.S. Wayne, M. Gautam, D.W. Lyons, and D. Hawelti. “Idle Emissions from Heavy-Duty Diesel Vehicles–Review and Recent Data.” Journal of the Air & Waste Management Association 56, (2006): 1404-1419.
McCormick, R.L., M.S. Graboski, T. Alleman, A.M. Herring, and P. Nelson. “In-Use Emissions from Natural Gas Fuelled Heavy-Duty Vehicles.” SAE Technical Paper 1999-01-1507 (1999).
McKain D.L., N.N. Clark, T.H. Balon, P.J. Moynihan, S.A. Lynch, and T.C. Webb. “Characterization of Emissions from Hybrid-Electric and Conventional Transit Buses.” SAE Technical Paper 2000-01-2011 (2000).
Nine, R.D., N.N. Clark, J.J. Daley, and C.M. Atkinson. “Development of a Heavy-Duty Chassis Dynamometer Driving Route.” Proceedings of the Institute of Mechanical Engineers, Part D., Journal of Automobile Engineers 213, (1999): 561-574.
Society of Automotive Engineering (SAE) Document No. J1376. Fuel Economy Measurement Test (Engineering Type) for Trucks and Buses (1982).
Society of Automotive Engineers (SAE) Document No. J2711. SAE Standard J2711 Recommended Practice for Measuring Fuel Economy and Emissions of Hybrid-Electric and Conventional Heavy-Duty Vehicle (2002).
Thompson, E.D., M. Ansari, and G.A. Eberhard. “A Truck and Bus Chassis Dynamometer Developed for Fuels and Lubricants Research.” SAE Technical Paper 902112 (1990).
Regulated and Non-Regulated Emissions
124
Wang, W., M. Gautam, X. Sun, R. Bata, N. Clark, G.M. Palmer, and D. Lyons. “Emissions Comparisons of Twenty-Six Heavy-Duty Vehicles Operated on Conventional and Alternative Fuels.” SAE Technical Paper 932952 (1993).
Wayne, W.S., N.N. Clark, R.D. Nine, and S. Rosepiler. “Washington Metropolitan Area Transit Authority Diesel Emissions Control Retrofit Project.” Final Report by the West Virginia University, Morgantown, WV (2002a).
Wayne, W.S., R. Nine, N.N. Clark, and J.J. Schiavone. “Diesel Engine Retrofit Program, Interim Task Report: Emissions Results.” Presented to Westchester County Department of Transportation, (2002b).
Wayne, W.S., N.N. Clark, R.D. Nine, and D. Elefante. “A Comparison of Emissions and Fuel Economy from Hybrid-Electric and Conventional Drive Transit Buses.” Energy & Fuels 18 (1), (2004): 257-270.
Weaver, C.S., S.H. Turner, M.V. Balam-Almanza, and R. Gable. “Comparison of In-Use Emissions from Diesel and Natural Gas Trucks and Buses.” SAE Technical Paper 2000-01-3473 (2000).
Definitions, Acronyms, Abbreviations
APTA American Public Transportation AssociationART Arterial CycleBRAUN Braunschweig CycleCAFEE Center for Alternative Fuels, Engines, and EmissionsCBD Central Business District CycleCCRT Catalyzed Continuously Regenerating TechnologyCFR Code of Federal Regulations CNG Compressed natural gasCO Carbon MonoxideCO2 Carbon DioxideCOMM Commuter CycleCSHVC City Suburban Heavy Vehicle Cycle DDC Detroit Diesel CorporationDOE U.S. Department of EnergyDOT U.S. Department of TransportationEGR Exhaust Gas Recirculation ETC-Urban Urban Segment of the European Transient CycleFE Fuel Economyg/mile Grams per MileHC HydrocarbonsHFID Heated Flame Ionization DetectionHHDDTS Heavy Heavy-Duty Truck Driving ScheduleKCM King County Metro Bus CycleLNG Liquefied Natural GasMan Manhattan Drive Cyclemile/gal Miles per Diesel Equivalent GallonMY Model YearN2O Nitrous OxideNDIR Non Dispersive Infrared AnalyzersNGB Natural Gas BusesNMHC Non-Methane Hydrocarbons
Regulated and Non-Regulated Emissions
125
NOx Oxides of NitrogenNYBus New York Bus CycleNYComp New York Composite CycleOCTA Orange County Transit Authority PM Particulate MatterTRANSLAB Transportable Heavy-Duty Vehicle Emissions Testing Laboratory UDDS Urban Dynamometer Driving ScheduleULSD Ultra Low Sulfur DieselWMATA Washington Metro Area Transit Authority
ABM Siddiq Khan received his bachelors degree in military science from Bangladesh Military Academy in 1990 and in mechanical engineering from Bangladesh University of Engineering & Technology in 1997. He has served the Electrical and Mechanical Engineering (EME) School of Bangladesh Army as an instructor and has commanded an EME Workshop Company. After retiring from the BangladeshArmy, he joined theWorld Bank fundedAirQualityManagementProject(AQMP)inBangladeshasavehicleemissionsconsultantin2003.HereceivedhisM.S.inMechanical Engineering from West Virginia University in 2005. Presently he is pursuing his Ph.D. degree in Mechanical Engineering Department at West Virginia University.
Nigel Clark is the George Berry Chair of Engineering at West Virginia University. His interests include the measurement of emissions from heavy-duty vehicles, locomotives and ships. He is presenly conducting research on hybrid vehicles and engine emissions reduction. Clark is a Fellow of the Society of Automotive Engineers and a former National Science Foundation Presidential Young Investigator.
Gregory Thompson is an assistant professor in the Mechanical and Aerospace Engineering DepartmentatWestVirginiaUniversity.Thompsonhas10yearsofexperienceinthemeasurementofemissionsfromheavy-dutyengineswithspecificexperienceinfuelpropertyeffectsonemissions.His experience includes themeasurement and analyses of regulated and unregulated emissionsspecies using conventional and novel measurement techniques.
W. Scott Wayne is an assistant professor in the Mechanical and Aerospace Engineering Department at West Virginia University and director of the WVU Transportable Heavy-Duty Vehicle Emissions TestingLaboratory.Waynehasextensiveexperienceintestingandevaluatingemissionsfromheavy-duty on-highway engine/vehicles, marine engines, locomotive engines and off-road engines and equipment including emissions testing facility design, fabrication and operation. Wayne is very familiar with engine/vehicle emissions measurement techniques and instrumentation and has conducted several emissions and performance evaluations of hybrid-electric transit buses including series drive diesel-hybrid buses and gasoline-hybrid buses.
Donald W. Lyons is a professor in the Mechanical and Aerospace Engineering Department at West Virginia University. In 1989, Lyons began the research program at West Virginia University in the fieldoftransportationfuels,enginesandemissions.Overtheyearsthisprogramhasreceivedmorethan $75 million in research contract funding.