Embed Size (px)
Citation preview
TransportationData BookEnergy
Edition 36
Transportation Energy Data Book
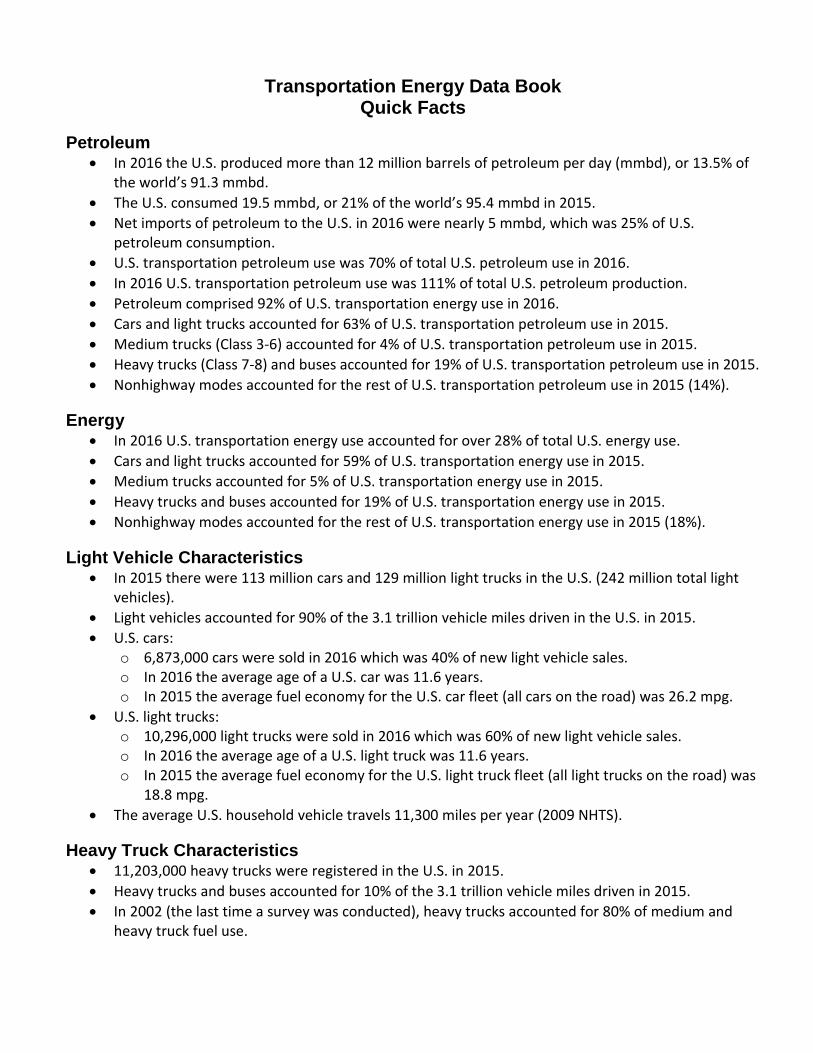
Quick Facts Petroleum
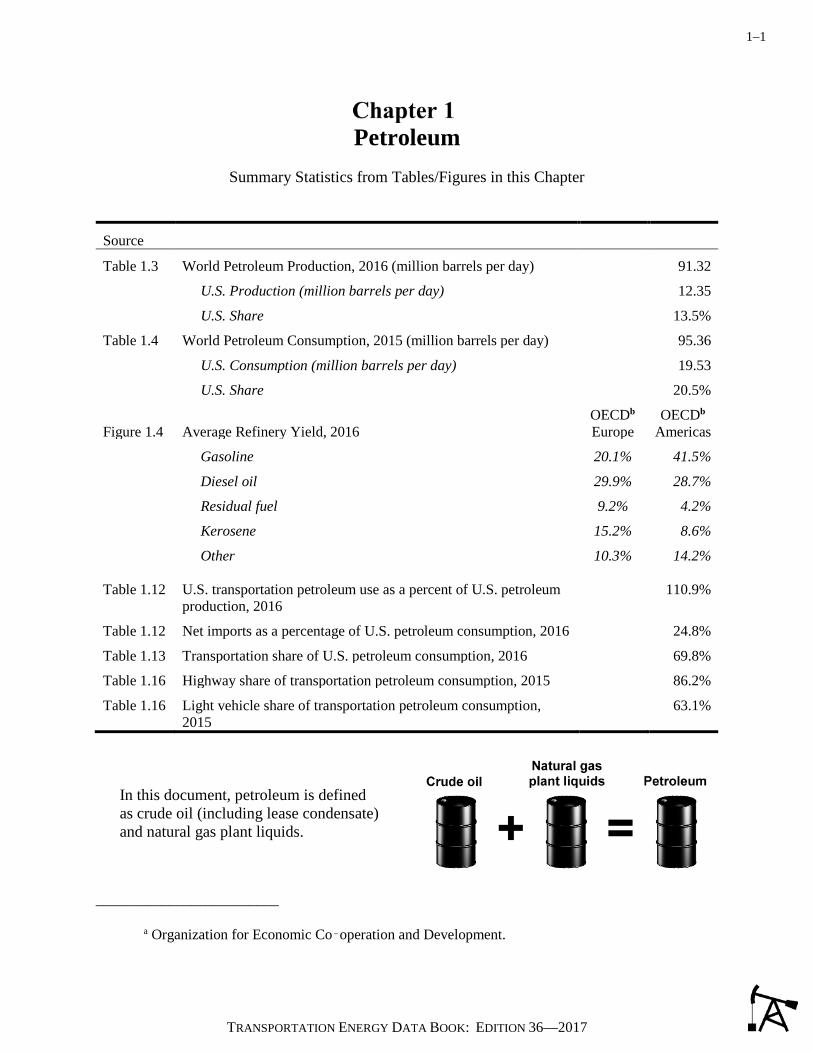
• In 2016 the U.S. produced more than 12 million barrels of petroleum per day (mmbd), or 13.5% of the world’s 91.3 mmbd.
• The U.S. consumed 19.5 mmbd, or 21% of the world’s 95.4 mmbd in 2015. • Net imports of petroleum to the U.S. in 2016 were nearly 5 mmbd, which was 25% of U.S.
petroleum consumption. • U.S. transportation petroleum use was 70% of total U.S. petroleum use in 2016. • In 2016 U.S. transportation petroleum use was 111% of total U.S. petroleum production. • Petroleum comprised 92% of U.S. transportation energy use in 2016. • Cars and light trucks accounted for 63% of U.S. transportation petroleum use in 2015. • Medium trucks (Class 3-6) accounted for 4% of U.S. transportation petroleum use in 2015. • Heavy trucks (Class 7-8) and buses accounted for 19% of U.S. transportation petroleum use in 2015. • Nonhighway modes accounted for the rest of U.S. transportation petroleum use in 2015 (14%).
Energy
• In 2016 U.S. transportation energy use accounted for over 28% of total U.S. energy use. • Cars and light trucks accounted for 59% of U.S. transportation energy use in 2015. • Medium trucks accounted for 5% of U.S. transportation energy use in 2015. • Heavy trucks and buses accounted for 19% of U.S. transportation energy use in 2015. • Nonhighway modes accounted for the rest of U.S. transportation energy use in 2015 (18%).
Light Vehicle Characteristics
• In 2015 there were 113 million cars and 129 million light trucks in the U.S. (242 million total light vehicles).
• Light vehicles accounted for 90% of the 3.1 trillion vehicle miles driven in the U.S. in 2015. • U.S. cars:
o 6,873,000 cars were sold in 2016 which was 40% of new light vehicle sales. o In 2016 the average age of a U.S. car was 11.6 years. o In 2015 the average fuel economy for the U.S. car fleet (all cars on the road) was 26.2 mpg.
• U.S. light trucks: o 10,296,000 light trucks were sold in 2016 which was 60% of new light vehicle sales. o In 2016 the average age of a U.S. light truck was 11.6 years. o In 2015 the average fuel economy for the U.S. light truck fleet (all light trucks on the road) was
18.8 mpg. • The average U.S. household vehicle travels 11,300 miles per year (2009 NHTS).
Heavy Truck Characteristics
• 11,203,000 heavy trucks were registered in the U.S. in 2015. • Heavy trucks and buses accounted for 10% of the 3.1 trillion vehicle miles driven in 2015. • In 2002 (the last time a survey was conducted), heavy trucks accounted for 80% of medium and
heavy truck fuel use.

ORNL/TM-2017/513 (Edition 36 of ORNL-5198)
Center for Transportation Analysis Energy and Transportation Science Division
TRANSPORTATION ENERGY DATA BOOK: EDITION 36
Stacy C. Davis Susan E. Williams
Oak Ridge National Laboratory
Robert G. Boundy Roltek, Inc.
December 2017
Transportation Energy Data Book: Edition 36 can be found online at:
cta.ornl.gov/data
Prepared for the Vehicle Technologies Office
Office of Energy Efficiency and Renewable Energy U.S. Department of Energy
Prepared by the Oak Ridge National Laboratory
Oak Ridge, Tennessee 37831-6073 Managed by
UT-BATTELLE, LLC for the
U.S. DEPARTMENT OF ENERGY under Contract No. DE-AC05-00OR22725

DOCUMENT AVAILABILITY Reports produced after January 1, 1996, are generally available free via US Department of Energy (DOE) SciTech Connect. Website http://www.osti.gov/scitech/ Reports produced before January 1, 1996, may be purchased by members of the public from the following source: National Technical Information Service 5285 Port Royal Road Springfield, VA 22161 Telephone 703-605-6000 (1-800-553-6847) TDD 703-487-4639 Fax 703-605-6900 E-mail [email protected] Website http://www.ntis.gov/help/ordermethods.aspx Reports are available to DOE employees, DOE contractors, Energy Technology Data Exchange representatives, and International Nuclear Information System representatives from the following source: Office of Scientific and Technical Information PO Box 62 Oak Ridge, TN 37831 Telephone 865-576-8401 Fax 865-576-5728 E-mail [email protected]
Website http://www.osti.gov/contact.html
This report was prepared as an account of work sponsored by an agency of the United States Government. Neither the United States Government nor any agency thereof, nor any of their employees, makes any warranty, express or implied, or assumes any legal liability or responsibility for the accuracy, completeness, or usefulness of any information, apparatus, product, or process disclosed, or represents that its use would not infringe privately owned rights. Reference herein to any specific commercial product, process, or service by trade name, trademark, manufacturer, or otherwise, does not necessarily constitute or imply its endorsement, recommendation, or favoring by the United States Government or any agency thereof. The views and opinions of authors expressed herein do not necessarily state or reflect those of the United States Government or any agency thereof.

Users of the Transportation Energy Data Book are encouraged to comment on errors,
omissions, emphases, and organization of this report to one of the persons listed below.
Requests for additional complementary copies of this report, additional data, or information on
an existing table should be referred to Ms. Stacy Davis, Oak Ridge National Laboratory.
Stacy C. Davis
Oak Ridge National Laboratory National Transportation Research Center
2360 Cherahala Boulevard Knoxville, Tennessee 37932 Telephone: (865) 946-1256
FAX: (865) 946-1541 E-mail: [email protected]
Website Location: cta.ornl.gov/data
Rachael Nealer Vehicle Technologies Office
Energy Efficiency and Renewable Energy Department of Energy, EE-3V
Forrestal Building 1000 Independence Avenue, S.W.
Washington, D.C. 20585 Telephone: (202) 586-3916
FAX: (202) 586-1600 E-mail: [email protected]
Website Location: energy.gov/eere/vehicles
Spreadsheets of the tables in the Transportation Energy Data Book
include data for years not presented in the published document.
Spreadsheets can be found on the web at:
cta.ornl.gov/data

Find useful data and information in other U.S. Department of Energy, Office of Energy Efficiency and Renewable Energy products. Vehicle Technologies Market Report: cta.ornl.gov/vtmarketreport Light Duty Electric Drive Vehicles: www.anl.gov/energy-systems/project/light-duty-electric-drive-vehicles-monthly-sales-updates Transportation-Related Consumer Preference Data www.nrel.gov/transportation/consumer-data.html
Subscribe to the Vehicle Technologies Fact of the Week: energy.gov/eere/vehicles/transportation-fact-week

v
TRANSPORTATION ENERGY DATA BOOK: EDITION 36—2017
TABLE OF CONTENTS FOREWORD ........................................................................................................................... xix ACKNOWLEDGMENTS ......................................................................................................... xxi ABSTRACT ......................................................................................................................... xxiii INTRODUCTION......................................................................................................................xxv CHAPTER 1 PETROLEUM ................................................................................................1–1 Table 1.1 Proved Reserves of Crude Oil and Natural Gas, 1980–2015............................1–2 Table 1.2 World Crude Oil Production, 1960–2016 .........................................................1–3 Table 1.3 World Petroleum Production, 1973–2016 ........................................................1–4 Table 1.4 World Petroleum Consumption, 1960–2015 ....................................................1–5 Figure 1.1 World Oil Reserves, Production, and Consumption, 1980 ...............................1–6 Figure 1.2 World Oil Reserves, Production, and Consumption, 1993 ...............................1–6 Figure 1.3 World Oil Reserves, Production, and Consumption, 2015 ...............................1–7 Table 1.5 World Oil Reserves, Production, and Consumption, 1980, 1993 and 2015 .....1–7 Table 1.6 U.S. Petroleum Imports, 1960–2016.................................................................1–8 Table 1.7 Imported Crude Oil by Country of Origin, 1973-2016 .....................................1–9 Table 1.8 Crude Oil Supplies, 1973-2016.......................................................................1–10 Figure 1.4 Refinery Gross Output by World Region, 2006 and 2016 ..............................1–11 Table 1.9 U.S. Refinery Input of Crude Oil and Petroleum Products, 1987–2015.........1–12 Table 1.10 U.S. Refinery Yield of Petroleum Products from a Barrel of Crude Oil, 1978–2016.......................................................................................................1–13 Table 1.11 United States Petroleum Production, Imports, and Exports, 1950–2016 .......1–14 Table 1.12 Petroleum Production and Transportation Petroleum Consumption in Context, 1950–2016 ........................................................................................1–15

vi
TRANSPORTATION ENERGY DATA BOOK: EDITION 36—2017
Figure 1.5 United States Petroleum Production and Consumption – All Sectors, 1973–2050.......................................................................................................1–16 Figure 1.6 United States Petroleum Production and Transportation Consumption, 1970–2050.......................................................................................................1–17 Table 1.13 Consumption of Petroleum by End-Use Sector, 1973–2016 ..........................1–18 Table 1.14 Highway Transportation Petroleum Consumption by Mode, 1970–2015 ......1–19 Table 1.15 Nonhighway Transportation Petroleum Consumption by Mode, 1970–2015.......................................................................................................1–20 Table 1.16 Transportation Petroleum Use by Mode, 2014–2015 .....................................1–21 CHAPTER 2 ENERGY .........................................................................................................2–1 Figure 2.1 World Consumption of Primary Energy, 2014 .................................................2–2 Table 2.1 U.S. Consumption of Total Energy by End-Use Sector, 1973–2016 ...............2–3 Table 2.2 Distribution of Energy Consumption by Source, 1973 and 2016 .....................2–4 Table 2.3 Distribution of Transportation Energy Consumption by Source, 1950–2016.........................................................................................................2–5 Figure 2.2 World Natural Gas Reserves, Production, and Consumption, 1980 ................2–6 Figure 2.3 World Natural Gas Reserves, Production, and Consumption, 1997 ................2–6 Figure 2.4 World Natural Gas Reserves, Production, and Consumption, 2015 ................2–7 Table 2.4 World Natural Gas Reserves, Production, and Consumption, 1980, 1997, and 2015 ..................................................................................................2–7 Figure 2.5 Natural Gas Production and Reserves for the Top Ten Natural Gas Producing Countries, 2015 ...............................................................................2–8 Table 2.5 Alternative Fuel and Oxygenate Consumption, 2005–2011 .............................2–9 Table 2.6 Fuel Ethanol and Biodiesel Production, Net Imports, and Consumption, 1981–2016.......................................................................................................2–10 Table 2.7 Domestic Consumption of Transportation Energy by Mode and Fuel Type, 2015 ..............................................................................................2–11
vii
TRANSPORTATION ENERGY DATA BOOK: EDITION 36—2017
Figure 2.6 Domestic Consumption of Transportation Energy by Mode and Fuel Type, 2015 .......................................................................................................2–12 Table 2.8 Transportation Energy Use by Mode, 2014–2015 ..........................................2–13 Table 2.9 Highway Transportation Energy Consumption by Mode, 1970–2015 ...........2–14 Table 2.10 Nonhighway Transportation Energy Consumption by Mode, 1970–2015 .....2–15 Table 2.11 Off-Highway Transportation-Related Fuel Consumption from the Nonroad Model, 2015 .....................................................................................2–16 Table 2.12 Fuel Consumption from Lawn and Garden Equipment, 2015 ........................2–17 Table 2.13 Highway Usage of Gasoline and Diesel, 1973–2015 .....................................2–18 Table 2.14 Passenger Travel and Energy Use, 2015 .........................................................2–19 Table 2.15 Energy Intensities of Highway Passenger Modes, 1970–2015 .......................2–20 Table 2.16 Energy Intensities of Nonhighway Passenger Modes, 1970–2015 .................2–21 Figure 2.7 Energy Intensity of Light Rail Transit Systems, 2015 .....................................2–22 Figure 2.8 Energy Intensity of Heavy Rail Systems, 2015................................................2–23 Figure 2.9 Energy Intensity of Commuter Rail Systems, 2015 .........................................2–23 Table 2.17 Energy Intensities of Freight Modes, 1970–2015 ...........................................2–24 CHAPTER 3 ALL HIGHWAY VEHICLES AND CHARACTERISTICS .....................3–1 Table 3.1 World Production of Cars and Trucks, 2000 and 2015 ....................................3–2 Figure 3.1 World Car Production, 1983–2015 ..................................................................3–3 Figure 3.2 World Truck and Bus Production, 1983–2015 .................................................3–3 Table 3.2 Car Registrations for Selected Countries, 1960–2015 ......................................3–4 Table 3.3 Truck and Bus Registrations for Selected Countries, 1960–2015 ....................3–5 Table 3.4 U.S. Cars and Trucks in Use, 1970–2015 .........................................................3–7 Figure 3.3 Vehicles per Thousand People: U.S. (Over Time) Compared to Other Countries (in 2005 and 2015) ...........................................................................3–8

viii
TRANSPORTATION ENERGY DATA BOOK: EDITION 36—2017
Table 3.5 Vehicles per Thousand People in Selected Countries/Regions, 2005 and 2015 .................................................................................................3–10 Table 3.6 Vehicles per Thousand People in the United States, 1990–2015 ...................3–11 Table 3.7 Shares of Highway Vehicle-Miles Traveled by Vehicle Type, 1970–2015.......................................................................................................3–12 Table 3.8 Cars in Operation by Age, 1970, 2000, and 2013 ...........................................3–13 Table 3.9 Trucks in Operation by Age, 1970, 2000, and 2013 .......................................3–14 Table 3.10 U.S. Average Vehicle Age, 1995–2016 ..........................................................3–15 Table 3.11 New Retail Vehicle Sales, 1970–2016............................................................3–16 Table 3.12 Survival Rates for Cars and Light Trucks by Vehicle Age ............................3–17 Table 3.13 Annual Mileage for Cars and Light Trucks by Vehicle Age ..........................3–18 Table 3.14 Heavy Truck Scrappage and Survival Rates, 1970, 1980, and 1990 Model Years ....................................................................................................3–19 CHAPTER 4 LIGHT VEHICLES AND CHARACTERISTICS ......................................4–1 Table 4.1 Summary Statistics for Cars, 1970–2015..........................................................4–3 Table 4.2 Summary Statistics for Two-Axle, Four-Tire Trucks, 1970–2015 ...................4–4 Table 4.3 Summary Statistics for Light Vehicles, 1970–2014 .........................................4–5 Table 4.4 Summary Statistics on Class 1, Class 2a, and Class 2b Light Trucks ..............4–6 Table 4.5 Sales Estimates of Class 1, Class 2a, and Class 2b Light Trucks, 1989–1999.........................................................................................................4–6 Table 4.6 New Retail Car Sales in the United States, 1970–2016 ....................................4–7 Table 4.7 New Retail Sales of Trucks 10,000 Pounds GVW and Less in the United States, 1970–2016 .................................................................................4–8 Table 4.8 Production, Production Shares, and Production-Weighted Fuel Economies of New Domestic and Import Cars, Model Years 1975–2016..........................4–9 Table 4.9 Definition of Car Sport Utility Vehicles in Model Year 2016 ........................4–10 Table 4.10 Production, Production Shares, and Production-Weighted Fuel Economies of New Domestic and Import Light Trucks, Model Years 1975–2016 ..........4–11
ix
TRANSPORTATION ENERGY DATA BOOK: EDITION 36—2017
Table 4.11 Production and Production-Weighted Fuel Economies of New Domestic and Import Cars, Light Trucks and Light Vehicles, Model Years 1975–2016.......................................................................................................4–12 Table 4.12 Light Vehicle Production Shares, Model Years 1975–2016 ..........................4–13 Figure 4.1 Light Vehicle Production Shares, Model Years 1975–2016 ...........................4–14 Table 4.13 Production-Weighted Engine Size of New Domestic and Import Cars, Model Years 1975–2016 .................................................................................4–15 Table 4.14 Production-Weighted Engine Size of New Domestic and Import Light Trucks, Model Years 1975–2016 ..........................................................4–16 Table 4.15 Production-Weighted Loaded Vehicle Weight of New Domestic and Import Cars, Model Years 1975–2016 .......................................................................4–17 Table 4.16 Production-Weighted Loaded Vehicle Weight of New Domestic and Import Light Trucks, Model Years 1975–2016 ..........................................................4–18 Table 4.17 Average Material Consumption for a Domestic Light Vehicle, Model Years 1995, 2000, and 2015 ...........................................................................4–19 Table 4.18 New Light Vehicle Dealerships and Sales, 1970–2016 ..................................4–20 Table 4.19 Conventional Refueling Stations, 1993–2013 ................................................4–21 Table 4.20 Fuel Economy and Carbon Dioxide Emissions Standards, MY 2012–2025 ...............................................................................................4–22 Table 4.21 Fuel Economy and Carbon Dioxide Targets for Model Year 2025 ................4–23 Table 4.22 Car Corporate Average Fuel Economy (CAFE) Standards versus Sales-Weighted Fuel Economy Estimates, 1978–2017 ..................................4–24 Table 4.23 Light Truck Corporate Average Fuel Economy (CAFE) Standards versus Sales-Weighted Fuel Economy Estimates, 1978–2017 .......................4–25 Table 4.24 Corporate Average Fuel Economy (CAFE) Fines Collected, 1983–2014 ......4–26 Table 4.25 The Gas Guzzler Tax on New Cars ................................................................4–27 Table 4.26 List of Model Year 2016 Cars with Gas Guzzler Taxes .................................4–28 Table 4.27 Tax Receipts from the Sale of Gas Guzzlers, 1980–2015 ..............................4–30 Table 4.28 Fuel Economy by Speed, Autonomie Model Results .....................................4–31 Table 4.29 Fuel Economy by Speed, 1973, 1984, 1997, and 2012 Studies ......................4–32

x
TRANSPORTATION ENERGY DATA BOOK: EDITION 36—2017
Figure 4.2 Fuel Economy by Speed, 1973, 1984, 1997, and 2012 Studies and Autonomie Model Results ...............................................................................4–33 Table 4.30 Driving Cycle Attributes .................................................................................4–34 Figure 4.3 City Driving Cycle ..........................................................................................4–35 Figure 4.4 Highway Driving Cycle...................................................................................4–35 Figure 4.5 Air Conditioning (SC03) Driving Cycle .........................................................4–36 Figure 4.6 Cold Temperature (Cold FTP) Driving Cycle ................................................4–36 Figure 4.7 High Speed (US06) Driving Cycle ..................................................................4–37 Figure 4.8 New York City Driving Cycle ..........................................................................4–38 Figure 4.9 Representative Number Five Driving Cycle ...................................................4–38 Table 4.31 Comparison of U.S., European, and Japanese Driving Cycles Attributes ......4–39 Table 4.32 Example of Differing Results Using the U.S., European, and Japanese Driving Cycles .................................................................................4–40 CHAPTER 5 HEAVY VEHICLES AND CHARACTERISTICS .....................................5–1 Table 5.1 Summary Statistics for Class 3-8 Single-Unit Trucks, 1970–2015 ..................5–2 Table 5.2 Summary Statistics for Class 7-8 Combination Trucks, 1970–2015 ................5–3 Table 5.3 New Retail Truck Sales by Gross Vehicle Weight, 1970–2016 .......................5–4 Table 5.4 Truck Statistics by Gross Vehicle Weight Class, 2002 ....................................5–6 Table 5.5 Truck Harmonic Mean Fuel Economy by Size Class, 1992, 1997, and 2002 ............................................................................................................5–6 Table 5.6 Truck Statistics by Size, 2002 ...........................................................................5–7 Table 5.7 Percentage of Trucks by Size Ranked by Major Use, 2002 .............................5–8 Table 5.8 Percentage of Trucks by Fleet Size and Primary Fueling Facility, 2002..........5–9 Table 5.9 Share of Trucks by Major Use and Primary Fueling Facility, 2002 ...............5–10 Figure 5.1 Distribution of Trucks over 26,000 lb by Vehicle-Miles Traveled..................5–11

xi
TRANSPORTATION ENERGY DATA BOOK: EDITION 36—2017
Figure 5.2 Share of Heavy Trucks with Selected Electronic Features, 2002 ..................5–12
Table 5.10 Effect of Terrain on Class 8 Truck Fuel Economy .........................................5–14
Table 5.11 Fuel Economy for Class 8 Trucks as Function of Speed and Tractor-Trailer Tire Combination ...................................................................5–15
Figure 5.3 Class 8 Truck Fuel Economy as a Function of Speed and Tractor-Trailer Tire Combination and Percentage of Total Distance Traveled as a Function of Speed ...........................................................................................5–16
Figure 5.4 Class 8 Truck Percent of Total Fuel Consumed as a Function of Speed and Tractor-Trailer Tire Combination ...........................................................5–17
Table 5.12 Class 8 Truck Weight by Component .............................................................5–18
Table 5.13 Gross Vehicle Weight vs. Empty Vehicle Weight..........................................5–19
Figure 5.5 Distribution of Class 8 Trucks by On-Road Vehicle Weight, 2008 ................5–20
Table 5.14 Value of Goods Shipped in the United States: Comparison of the 1993, 1997, 2002, 2007, and 2012 Commodity Flow Surveys...............................5–22
Table 5.15 Tons of Freight in the United States: Comparison of the 1993, 1997, 2002, 2007, and 2012 Commodity Flow Surveys...........................................5–23
Table 5.16 Growth of Ton-Miles in the United States: Comparison of the 1993, 1997, 2002, 2007, and 2012 Commodity Flow Surveys .................................5–24
Table 5.17 Average Miles per Shipment in the United States: Comparison of the 1993, 1997, 2002, 2007, and 2012 Commodity Flow Surveys.......................5–25
CHAPTER 6 ALTERNATIVE FUEL AND ADVANCED TECHNOLOGY VEHICLES AND CHARACTERISTICS ....................................................6–1
Table 6.1 Estimates of Alternative Fuel Highway Vehicles Made Available, 2004-2015 .........................................................................................................6–3
Table 6.2 Hybrid and Plug-In Vehicle Sales, 1999–2016.................................................6–4
Table 6.3 Alternative Fuel Transit Vehicles, 2016 ...........................................................6–5
Table 6.4 E85 Flex-Fuel Vehicles Available by Manufacturer, Model Year 2017 ..........6–6
Table 6.5 B20, CNG, and LPG Vehicles Available by Manufacturer, Model Year 2017 ..............................................................................................6–7
xii
TRANSPORTATION ENERGY DATA BOOK: EDITION 36—2017
Table 6.6 Hybrid-Electric Vehicles Available by Manufacturer, Model Year 2017 ..............................................................................................6–8 Table 6.7 Electric-Drive Vehicles Available by Manufacturer, Model Year 2017 ..........6–9 Table 6.8 Number of Alternative Fuel Vehicle Models Available, 1991–2017 .............6–10 Table 6.9 Hybrid-Electric Medium/Heavy Trucks and Buses Available by Manufacturer, 2017 .........................................................................................6–11 Table 6.10 Electric-Drive Medium/Heavy Trucks and Buses Available by Manufacturer, 2017 .........................................................................................6–12 Table 6.11 Number of Alternative Refuel Sites by State and Fuel Type, 2017................6–13 Table 6.12 Number of Alternative Refuel Stations, 1992–2016.......................................6–14 Figure 6.1 Clean Cities Coalitions ...................................................................................6–15 Table 6.13 Properties of Conventional and Alternative Liquid Fuels ..............................6–16 Table 6.14 Properties of Conventional and Alternative Gaseous Fuels ...........................6–17 CHAPTER 7 FLEET VEHICLES AND CHARACTERISTICS ........................................7–1 Figure 7.1 Fleet Vehicles in Service as of January 1, 2016 ...............................................7–2 Table 7.1 Fleet Vehicles in Service, 2006–2016 ..............................................................7–3 Table 7.2 Average Length of Time Commercial Fleet Vehicles Are in Service, 2015.....................................................................................................7–4 Table 7.3 Average Annual Vehicle-Miles of Travel for Commercial Fleet Vehicles, 2015...................................................................................................7–4 Figure 7.2 Average Miles per Domestic Federal Vehicle by Vehicle Type, 2015 ..............7–5 Table 7.4 Federal Government Vehicles, 2001–2015 .......................................................7–6 Table 7.5 Federal Fleet Vehicle Acquisitions by Fuel Type, FY 2002–2015 ..................7–7 Table 7.6 Fuel Consumed by Federal Government Fleets, FY 2000–2015 ......................7–7 Table 7.7 Federal Government Vehicles by Agency, FY 2015 ........................................7–8 Table 7.8 Summary Statistics on Demand Response Vehicles, 1994–2014 .....................7–9 Table 7.9 Summary Statistics on Transit Buses and Trolleybuses, 1994–2015 .............7–10

xiii
TRANSPORTATION ENERGY DATA BOOK: EDITION 36—2017
CHAPTER 8 HOUSEHOLD VEHICLES AND CHARACTERISTICS..........................8–1 Table 8.1 Population and Vehicle Profile, 1950–2015 .....................................................8–2 Table 8.2 Vehicles and Vehicle-Miles per Capita, 1950–2015 ........................................8–3 Table 8.3 Household Vehicle Ownership, 1960–2015 Census .........................................8–4 Table 8.4 Demographic Statistics from the 1969, 1977, 1983, 1990, 1995 NPTS and 2001, 2009 NHTS ......................................................................................8–5 Table 8.5 Average Annual Vehicle-Miles, Vehicle Trips and Trip Length per Household 1969, 1977, 1983, 1990, 1995 NPTS and 2001, 2009 NHTS ........8–6 Table 8.6 Average Number of Vehicles and Vehicle Travel per Household, 1990 NPTS and 2001 and 2009 NHTS .............................................................8–7 Table 8.7 Trip Statistics by Trip Purpose, 2001 and 2009 NHTS ....................................8–8 Figure 8.1 Average Vehicle Occupancy by Vehicle Type, 1995 NPTS and 2009 NHTS ........................................................................................................8–9 Figure 8.2 Average Vehicle Occupancy by Trip Purpose, 1977 NPTS and 2009 NHTS ......................................................................................................8–10 Table 8.8 Average Annual Miles per Household Vehicle by Vehicle Age ....................8–11 Table 8.9 Self-Reported vs. Odometer Average Annual Miles, 1995 NPTS and 2001 NHTS .....................................................................................................8–12 Figure 8.3 Share of Vehicle Trips by Trip Distance, 2009 NHTS ....................................8–13 Figure 8.4 Share of Vehicle Trips to Work by Trip Distance, 2009 NHTS ......................8–13 Table 8.10 Share of Vehicles by Annual Miles of Travel and Vehicle Age, 2009 NHTS .....................................................................................................8–14 Table 8.11 Household Vehicle Trips, 2009 NHTS ...........................................................8–15 Figure 8.5 Average Daily Miles Driven (per Driver), 2009 NHTS ..................................8–15 Table 8.12 Daily Vehicle Miles of Travel (per Vehicle) by Number of Vehicles in the Household, 2009 NHTS ............................................................................8–16 Table 8.13 Daily and Annual Vehicle Miles of Travel and Average Age for Each Vehicle in a Household, 2009 NHTS .............................................................8–16 Figure 8.6 Daily Vehicle Miles of Travel for Each Vehicle in a Household, 2009 NHTS ......................................................................................................8–17

xiv
TRANSPORTATION ENERGY DATA BOOK: EDITION 36—2017
Figure 8.7 Annual Vehicle Miles of Travel for Each Vehicle in a Household, 2009 NHTS ......................................................................................................8–17 Table 8.14 Means of Transportation to Work, 1980, 1990, 2000 and 2015 .....................8–18 Table 8.15 Characteristics of U.S. Daily per Vehicle Driving vs. Dwelling Unit Type and Density ............................................................................................8–19 Table 8.16 Housing Unit Characteristics, 2015 ................................................................8–19 Table 8.17 Workers by Commute Time, 1990, 2000, and 2015 .......................................8–20 Table 8.18 Bicycle Sales, 1981-2015................................................................................8–21 Figure 8.8 Walk and Bike Trips by Trip Purpose, 2009 NHTS ........................................8–22 Table 8.19 Long-Distance Trip Characteristics, 2001 NHTS ...........................................8–24 CHAPTER 9 NONHIGHWAY MODES .............................................................................9–1 Table 9.1 Nonhighway Energy Use Shares, 1970–2015 ..................................................9–2 Table 9.2 Summary Statistics for U.S. Domestic and International Certificated Route Air Carriers (Combined Totals), 1970–2016 .........................................9–3 Table 9.3 Summary Statistics for General Aviation, 1970–2015 .....................................9–4 Table 9.4 Tonnage Statistics for Domestic and International Waterborne Commerce, 1970–2015 .....................................................................................9–5 Table 9.5 Summary Statistics for Domestic Waterborne Commerce, 1970–2015 ...........9–6 Table 9.6 Recreational Boat Energy Use, 1970–2015 ......................................................9–7 Table 9.7 Class I Railroad Freight Systems in the United States Ranked by Revenue Ton–Miles, 2015 ................................................................................9–8 Table 9.8 Summary Statistics for Class I Freight Railroads, 1970–2015 .........................9–9 Table 9.9 Intermodal Rail Traffic, 1965–2015 ...............................................................9–10

xv
TRANSPORTATION ENERGY DATA BOOK: EDITION 36—2017
Table 9.10 Summary Statistics for the National Railroad Passenger Corporation (Amtrak), 1971–2015 ......................................................................................9–11 Table 9.11 Summary Statistics for Commuter Rail Operations, 1984–2015....................9–12 Table 9.12 Summary Statistics for Rail Transit Operations, 1970–2015 .........................9–13 CHAPTER 10 TRANSPORTATION AND THE ECONOMY .........................................10–1 Figure 10.1 Transportation Services Index, January 1990–January 2017 ........................10–3 Table 10.1 Average Annual Expenditures of Households by Income, 2015 ....................10–4 Table 10.2 Annual Household Expenditures for Transportation, 1985-2015 ...................10–5 Table 10.3 Gasoline Prices for Selected Countries, 1990–2016 .......................................10–6 Table 10.4 Diesel Fuel Prices for Selected Countries, 1990–2016 ...................................10–7 Figure 10.2 Gasoline Prices for Selected Countries, 1990 and 2016 ................................10–8 Figure 10.3 Diesel Prices for Selected Countries, 1990 and 2016 ....................................10–9 Table 10.5 Prices for a Barrel of Crude Oil and a Gallon of Gasoline, 1978–2016 .......10–10 Table 10.6 Retail Prices for Motor Fuel, 1978–2016 .....................................................10–11 Figure 10.4 Oil Price and Economic Growth, 1970–2016...............................................10–12 Figure 10.5 Costs of Oil Dependence to the U.S. Economy, 1970–2015 .........................10–13 Table 10.7 Refiner Sales Prices for Propane and No. 2 Diesel, 1978–2016 ...................10–14 Table 10.8 Refiner Sales Prices for Aviation Gasoline and Jet Fuel, 1978–2016 ..........10–15 Table 10.9 Federal Excise Taxes on Motor Fuels, 2015 .................................................10–16 Table 10.10 Federal, State, and Local Alternative Fuel Incentives, 2017 ........................10–17 Table 10.11 Federal, State, and Local Advanced Technology Incentives, 2017 ..............10–18 Table 10.12 Average Price of a New Car, 1913–2016 .....................................................10–19 Table 10.13 Average Price of a New Car (Domestic and Import), 1970–2016 ................10–20 Table 10.14 Car Operating Cost per Mile, 1985–2016 .....................................................10–21 Table 10.15 Fixed Car Operating Costs per Year, 1975–2016 .........................................10–22

xvi
TRANSPORTATION ENERGY DATA BOOK: EDITION 36—2017
Table 10.16 Personal Consumption Expenditures, 1970–2016 ........................................10–23 Table 10.17 Consumer Price Indices, 1970–2016 ............................................................10–23 Table 10.18 Transportation-Related Employment, 2000 and 2016 ..................................10–24 Table 10.19 U.S. Employment for Motor Vehicles and Motor Vehicle Parts Manufacturing, 1990–2016 ...........................................................................10–25 CHAPTER 11 GREENHOUSE GAS EMISSIONS ............................................................11–1 Table 11.1 World Carbon Dioxide Emissions, 1990, 2005, and 2016 .............................11–2 Figure 11.1 World Carbon Dioxide Emissions, 1990–2016 ..............................................11–3 Table 11.2 Numerical Estimates of Global Warming Potentials Compared with Carbon Dioxide .......................................................................................11–4 Table 11.3 U.S. Emissions of Greenhouse Gases, Based on Global Warming Potential, 1990–2015 ......................................................................................11–5 Table 11.4 Total U.S. Greenhouse Gas Emissions by End-Use Sector, 2015 ..................11–6 Table 11.5 U.S. Carbon Emissions from Fossil Fuel Consumption by End-Use Sector, 1990–2015 ...........................................................................11–7 Table 11.6 Transportation Sector Carbon Dioxide Emissions from Energy Consumption, 1973–2016 ...............................................................................11–8 Table 11.7 U.S. Carbon Emissions from Fossil Fuel Combustion in the Transportation End-Use Sector, 1990–2015 ...................................................11–9 Table 11.8 Transportation Carbon Dioxide Emissions by Mode, 1990–2015 ................11–10 Figure 11.2 GREET Model ...............................................................................................11–11 Figure 11.3 GREET Model Feedstocks and Fuels ...........................................................11–12 Figure 11.4 Well-to-Wheel Emissions for Various Fuels and Vehicle Technologies .......11–13 Table 11.9 Production-Weighted Annual Carbon Footprint of New Domestic and Import Cars, Model Years 1975-2016 ..........................................................11–15 Table 11.10 Production-Weighted Annual Carbon Footprint of New Domestic and Import Light Trucks, Model Years 1975-2016 .............................................11–16 Table 11.11 Average Annual Carbon Footprint of New Vehicles by Vehicle Classification, Model Years 1975 and 2016 .................................................11–17

xvii
TRANSPORTATION ENERGY DATA BOOK: EDITION 36—2017
Table 11.12 Direct Carbon Dioxide Emissions from a Gallon of Fuel.............................11–18 Table 11.13 Carbon Content of Transportation Fuels.......................................................11–19 CHAPTER 12 CRITERIA AIR POLLUTANTS ................................................................12–1 Table 12.1 Total National Emissions of the Criteria Air Pollutants by Sector, 2016 .......12–2 Table 12.2 Total National Emissions of Carbon Monoxide, 1970–2016 .........................12–3 Table 12.3 Emissions of Carbon Monoxide from Highway Vehicles, 1970–2014 ..........12–4 Table 12.4 Total National Emissions of Nitrogen Oxides, 1970–2016 ............................12–5 Table 12.5 Emissions of Nitrogen Oxides from Highway Vehicles, 1970–2014 .............12–6 Table 12.6 Total National Emissions of Volatile Organic Compounds, 1970–2016 .......12–7 Table 12.7 Emissions of Volatile Organic Compounds from Highway Vehicles, 1970–2014.......................................................................................................12–8 Table 12.8 Total National Emissions of Particulate Matter (PM–10), 1970–2016 ..........12–9 Table 12.9 Emissions of Particulate Matter (PM–10) from Highway Vehicles, 1970–2014.....................................................................................................12–10 Table 12.10 Total National Emissions of Particulate Matter (PM-2.5), 1990–2016 ........12–11 Table 12.11 Emissions of Particulate Matter (PM-2.5) from Highway Vehicles, 1990–2014.....................................................................................................12–12 Table 12.12 Total National Emissions of Sulfur Dioxide, 1970–2016 .............................12–13 Table 12.13 Tier 3 Non-Methane Organic Gases and Nitrogen Oxide Standards ............12–15 Table 12.14 Tier 3 Particulate Matter Emission Standards for Light Gasoline Vehicles, MY 2017 and Beyond ...................................................................12–16 Table 12.15 Tier 3 Evaporative Emission Standards ........................................................12–16 Table 12.16 Light-Duty Vehicle, Light-Duty Truck, and Medium-Duty Passenger Vehicle – Tier 2 Exhaust Emission Standards ..............................................12–17 Table 12.17 Light-Duty Vehicle, Light-Duty Truck, and Medium-Duty Passenger Vehicle – Tier 2 Evaporative Emission Standards .......................................12–18

xviii
TRANSPORTATION ENERGY DATA BOOK: EDITION 36—2017
Table 12.18 Heavy-Duty Highway Compression-Ignition Engines and Urban Buses – Exhaust Emission Standards .........................................................................12–19 Table 12.19 Heavy-Duty Highway Spark-Ignition Engines – Exhaust Emission Standards .......................................................................................................12–21 Table 12.20 Heavy-Duty Highway Compression-Ignition and Spark-Ignition Engines – Evaporative Emission Standards...................................................................12–23 Table 12.21 California New Car, Light Truck and Medium Truck Emission Certification Standards, Model Year 2015–On ............................................12–24 Table 12.22 Aircraft – Exhaust Emission Standards ........................................................12–25 Table 12.23 Nonroad Compression-Ignition Engines – Exhaust Emission Standards .....12–26 Table 12.24 Nonroad Large Spark-Ignition Engines – Exhaust and Evaporative Emission Standards .......................................................................................12–28 Table 12.25 Locomotives – Exhaust Emission Standards ................................................12–29 Table 12.26 Marine Compression-Ignition (CI) Engines – Exhaust Emission Standards .......................................................................................................12–31 Table 12.27 Marine Spark-Ignition Engines and Vessels – Exhaust Emission Standards .......................................................................................................12–35 Table 12.28 Nonroad Recreational Engines and Vehicles – Exhaust Emission Standards .......................................................................................................12–37 Table 12.29 Gasoline Sulfur Standards.............................................................................12–39 Table 12.30 Highway, Nonroad, Locomotive, and Marine (NRLM) Diesel Fuel Sulfur Standards ............................................................................................12–40 APPENDIX A. SOURCES & METHODOLOGIES ............................................................ A–1 APPENDIX B. CONVERSIONS ............................................................................................ B–1 APPENDIX C. MAPS .............................................................................................................. C–1 GLOSSARY.............................................................................................................................. G–1

xix
TRANSPORTATION ENERGY DATA BOOK: EDITION 36—2017
FOREWORD Thank you for reading the 36th edition of the Transportation Energy Data Book. We hope you find the information you are looking for on transportation and energy. Beginning with this edition, the Data Book will only be posted on-line in both PDF and spreadsheet format at the website cta.ornl.gov/data. Please utilize the flexibility and convenience of PDF viewing, downloading, and searching. We will continue to update the Data Book as new source data are made available throughout the year, instead of waiting for a once-a-year update. We thank you for your support and flexibility as we make this transition and please do not hesitate to reach out if you have any questions or concerns. I have put together a few highlights of this year’s Data Book:
• Before getting too far into the Transportation Energy Data Book check out Table 1.6 and Figure 1.5 which show some interesting trends on net imports of oil consumed for transportation.
• Energy use by transportation source can be found in Table 2.3 and broken down by consumption and Btu in Table 2.7 and Table 2.8, respectively. These tables and corresponding Figure 2.6, show how energy is being used across the transportation sector.
• You do not want to miss Table 2.15 on transportation energy consumption per mile; with our changing transportation environment, these data can inform the energy implications of our behavior and choices.
• Once you have gotten through the first couple chapters of petroleum consumption and energy use, there is still plenty of information on vehicles (light duty and heavy duty), alternative fuels, fleets, households, non-highway, the economy, and emissions.
• Note one change in the Data Book in this edition is the conversion factor for converting electricity usage into British thermal units (Btu). For this edition, only end-use energy was counted for electricity, and one kilowatt-hour (kWhr) of electricity is equal to 3,412 Btu. This change affected data in the energy-by-mode series going back to 1970. The rail and pipeline modes were most affected because they use a greater share of electricity than other transportation modes.
• Check out some highlights of the GREET model (Figure 11.3 and 11.4), and data that helps inform household transportation needs in terms of economics of operating and purchasing vehicles (Table 10.10-10.13), mileage (Figure 8.5 and Table 8.14), and more.
Every figure and table compiled here is thanks to the hard work and diligence of our staff at Oak Ridge National Laboratory, specifically, Stacy Davis, Susan Williams, and Bob Boundy. We hope you enjoy this edition of the Transportation Energy Data Book. If you have any questions or suggestions for future improvements, please let us know. Rachael Nealer Vehicle Technologies Office Office of Energy Efficiency and Renewable Energy U.S. Department of Energy

xx
TRANSPORTATION ENERGY DATA BOOK: EDITION 36—2017
xxi
TRANSPORTATION ENERGY DATA BOOK: EDITION 36—2017
ACKNOWLEDGMENTS
The authors would like to express their gratitude to the many individuals who assisted in
the preparation of this document. First, we would like to thank Rachael Nealer, Jacob Ward, David Gohlke, Kelly Fleming, and the Vehicle Technologies Office staff for their continued support of the Transportation Energy Data Book project. We would also like to thank Mark Robbins for the cover design. We are indebted to Debbie Bain, who has masterfully prepared the manuscript since 1998.
This book would not be possible without the leadership, guidance, and vision of Phil
Patterson, who began this book in the 1970’s. We hope to continue this report into the future with the same level of excellence. The authors and the transportation research community will be forever grateful for his efforts.

xxii
TRANSPORTATION ENERGY DATA BOOK: EDITION 36—2017

xxiii
TRANSPORTATION ENERGY DATA BOOK: EDITION 36—2017
ABSTRACT
The Transportation Energy Data Book: Edition 36 is a statistical compendium prepared and published by Oak Ridge National Laboratory (ORNL) under contract with the U.S. Department of Energy, Office of Energy Efficiency and Renewable Energy, Vehicle Technologies Office. Designed for use as a desk-top reference, the Data Book represents an assembly and display of statistics and information that characterize transportation activity, and presents data on other factors that influence transportation energy use. The purpose of this document is to present relevant statistical data in the form of tables and graphs. The latest edition of the Data Book is available via the Internet (cta.ornl.gov/data). This edition of the Data Book has 12 chapters which focus on various aspects of the transportation industry. Chapter 1 focuses on petroleum; Chapter 2 – energy; Chapter 3 – highway vehicles; Chapter 4 – light vehicles; Chapter 5 – heavy vehicles; Chapter 6 – alternative fuel vehicles; Chapter 7 – fleet vehicles; Chapter 8 – household vehicles; Chapter 9 – nonhighway modes; Chapter 10 – transportation and the economy; Chapter 11 – greenhouse gas emissions; and Chapter 12 – criteria pollutant emissions. The sources used represent the latest available data. There are also three appendices which include detailed source information for some tables, measures of conversion, and the definition of Census divisions and regions. A glossary of terms is also included for the reader’s convenience.

xxiv
TRANSPORTATION ENERGY DATA BOOK: EDITION 36—2017
xxv
TRANSPORTATION ENERGY DATA BOOK: EDITION 36—2017
INTRODUCTION
In January 1976, the Transportation Energy Conservation (TEC) Division of the Energy
Research and Development Administration contracted with Oak Ridge National Laboratory (ORNL) to prepare a Transportation Energy Conservation Data Book to be used by TEC staff in their evaluation of current and proposed conservation strategies. The major purposes of the Data Book were to draw together, under one cover, transportation data from diverse sources, to resolve data conflicts and inconsistencies, and to produce a comprehensive document. The first edition of the TEC Data Book was published in October 1976. With the passage of the Department of Energy (DOE) Organization Act, the work being conducted by the former Transportation Energy Conservation Division fell under the purview of the DOE's Office of Transportation Programs. This work continues today in the Vehicle Technologies Office.
Policymakers and analysts need to be well-informed about activity in the transportation sector. The organization and scope of the data book reflect the need for different kinds of information. For this reason, Edition 36 updates much of the same type of data that is found in previous editions.
In any attempt to compile a comprehensive set of statistics on transportation activity, numerous instances of inadequacies and inaccuracies in the basic data are encountered. Where such problems occur, estimates are developed by ORNL. To minimize the misuse of these statistics, an appendix (Appendix A) is included to document the estimation procedures. The attempt is to provide sufficient information for the conscientious user to evaluate the estimates and to form their own opinions as to their utility. Clearly, the accuracy of the estimates cannot exceed the accuracy of the primary data, an accuracy which in most instances is unknown. In cases where data accuracy is known or substantial errors are strongly suspected in the data, the reader is alerted. In all cases it should be recognized that the estimates are not precise.
The majority of the statistics contained in the data book are taken directly from published sources, although these data may be reformatted for presentation by ORNL. Consequently, neither ORNL nor DOE endorses the validity of these data.

xxvi
TRANSPORTATION ENERGY DATA BOOK: EDITION 36—2017
1–1
TRANSPORTATION ENERGY DATA BOOK: EDITION 36—2017
Petroleum
Summary Statistics from Tables/Figures in this Chapter
Source
Table 1.3 World Petroleum Production, 2016 (million barrels per day) 91.32
U.S. Production (million barrels per day) 12.35
U.S. Share 13.5%
Table 1.4 World Petroleum Consumption, 2015 (million barrels per day) 95.36
U.S. Consumption (million barrels per day) 19.53
U.S. Share 20.5%
Figure 1.4 Average Refinery Yield, 2016 OECDb Europe
OECDb Americas
Gasoline 20.1% 41.5%
Diesel oil 29.9% 28.7%
Residual fuel 9.2% 4.2%
Kerosene 15.2% 8.6%
Other
10.3% 14.2%
Table 1.12 U.S. transportation petroleum use as a percent of U.S. petroleum production, 2016
110.9%
Table 1.12 Net imports as a percentage of U.S. petroleum consumption, 2016 24.8%
Table 1.13 Transportation share of U.S. petroleum consumption, 2016 69.8%
Table 1.16 Highway share of transportation petroleum consumption, 2015 86.2%
Table 1.16 Light vehicle share of transportation petroleum consumption, 2015
63.1%
In this document, petroleum is defined as crude oil (including lease condensate) and natural gas plant liquids.
_________________________ a Organization for Economic Co‑operation and Development.

1–2
TRANSPORTATION ENERGY DATA BOOK: EDITION 36—2017
As new technologies appear and new areas are explored, the amount of proved reserves of crude oil and natural gas has grown. Although the reserves of natural gas in the United States were 84% higher in 2015 than it was in 1980, the U.S. share of World natural gas reserves is lower.
Table 1.1
Proved Reserves of Crude Oil and Natural Gas, 1980–2015
Crude Oil Reserves
(billion barrels) U.S. Share of
Crude Oil Reserves
Natural Gas Reserves
(trillion cubic feet) U.S. Share of Natural Gas
Reserves Year World United States World United States 1980 643.3 31.2 4.9% 2,592.0 201.0 7.8% 1981 650.7 31.3 4.8% 2,653.9 199.0 7.5% 1982 669.0 31.0 4.6% 2,927.0 201.7 6.9% 1983 667.2 29.5 4.4% 3,038.4 201.5 6.6% 1984 668.1 29.3 4.4% 3,208.5 200.2 6.2% 1985 699.3 30.0 4.3% 3,407.2 197.5 5.8% 1986 700.1 29.9 4.3% 3,490.1 193.4 5.5% 1987 699.4 28.3 4.1% 3,648.7 191.6 5.3% 1988 888.9 28.7 3.2% 3,796.6 187.2 4.9% 1989 907.4 28.2 3.1% 3,933.2 168.0 4.3% 1990 1,001.9 27.9 2.8% 3,987.5 167.1 4.2% 1991 1,000.0 27.6 2.8% 4,215.6 169.3 4.0% 1992 990.7 25.9 2.6% 4,376.7 167.1 3.8% 1993 997.3 25.0 2.5% 4,884.4 165.0 3.4% 1994 999.5 24.1 2.4% 5,013.8 162.4 3.2% 1995 1,000.4 23.6 2.4% 4,981.9 163.8 3.3% 1996 1,008.6 23.5 2.3% 4,935.3 165.1 3.3% 1997 1,019.8 23.3 2.3% 4,947.0 166.5 3.4% 1998 1,021.4 23.9 2.3% 5,087.6 167.2 3.3% 1999 1,034.1 22.4 2.2% 5,141.9 164.0 3.2% 2000 1,018.2 23.2 2.3% 5,150.0 167.4 3.3% 2001 1,029.6 23.5 2.3% 5,288.9 177.4 3.4% 2002 1,033.4 23.8 2.3% 5,457.6 183.5 3.4% 2003 1,214.5 24.0 2.0% 5,505.4 186.9 3.4% 2004 1,266.2 23.1 1.8% 6,079.1 189.0 3.1% 2005 1,278.5 22.6 1.8% 6,046.6 192.5 3.2% 2006 1,289.2 23.0 1.8% 6,124.6 204.4 3.3% 2007 1,319.9 22.3 1.7% 6,190.9 211.1 3.4% 2008 1,328.5 22.8 1.7% 6,213.7 237.7 3.8% 2009 1,336.4 20.6 1.5% 6,262.4 244.7 3.9% 2010 1,356.7 23.3 1.7% 6,638.2 272.5 4.1% 2011 1,475.0 26.5 1.8% 6,708.2 304.6 4.5% 2012 1,523.4 30.5 2.0% 6,809.3 334.1 4.9% 2013 1,643.9 33.4 2.0% 6,845.2 308.0 4.5% 2014 1,650.6 36.4 2.2% 6,972.5 338.3 4.9% 2015 1,658.0 32.3 1.9% 6,951.0 369.0 5.3%
Average Annual Percentage Change 1970-2015 2.7% 0.1% 2.9% 1.8% 2005-2015 2.6% 4.9% 1.4% 6.7%
Source: U.S. Department of Energy, Energy Information Administration, International Energy Statistics, August 2017.
(Additional resources: www.eia.doe.gov)
1–3
TRANSPORTATION ENERGY DATA BOOK: EDITION 36—2017
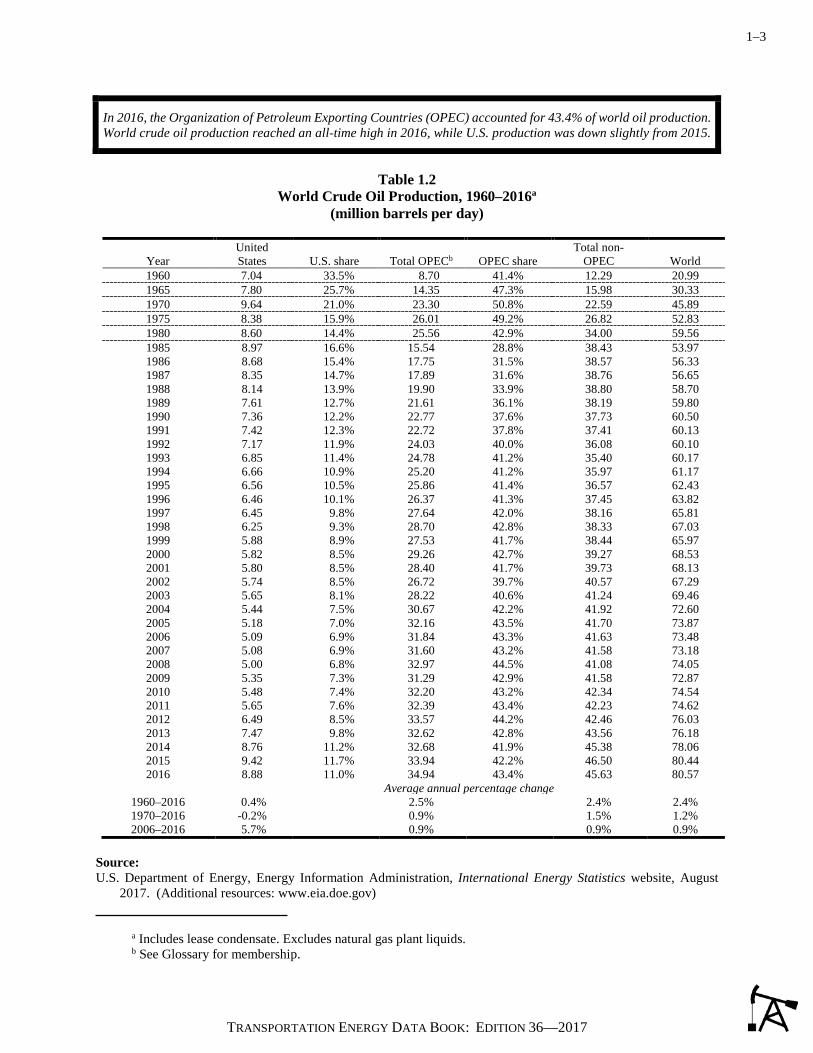
In 2016, the Organization of Petroleum Exporting Countries (OPEC) accounted for 43.4% of world oil production. World crude oil production reached an all-time high in 2016, while U.S. production was down slightly from 2015.
Table 1.2
World Crude Oil Production, 1960–2016a (million barrels per day)
Year United States U.S. share Total OPECb OPEC share
Total non-OPEC World
1960 7.04 33.5% 8.70 41.4% 12.29 20.99 1965 7.80 25.7% 14.35 47.3% 15.98 30.33 1970 9.64 21.0% 23.30 50.8% 22.59 45.89 1975 8.38 15.9% 26.01 49.2% 26.82 52.83 1980 8.60 14.4% 25.56 42.9% 34.00 59.56 1985 8.97 16.6% 15.54 28.8% 38.43 53.97 1986 8.68 15.4% 17.75 31.5% 38.57 56.33 1987 8.35 14.7% 17.89 31.6% 38.76 56.65 1988 8.14 13.9% 19.90 33.9% 38.80 58.70 1989 7.61 12.7% 21.61 36.1% 38.19 59.80 1990 7.36 12.2% 22.77 37.6% 37.73 60.50 1991 7.42 12.3% 22.72 37.8% 37.41 60.13 1992 7.17 11.9% 24.03 40.0% 36.08 60.10 1993 6.85 11.4% 24.78 41.2% 35.40 60.17 1994 6.66 10.9% 25.20 41.2% 35.97 61.17 1995 6.56 10.5% 25.86 41.4% 36.57 62.43 1996 6.46 10.1% 26.37 41.3% 37.45 63.82 1997 6.45 9.8% 27.64 42.0% 38.16 65.81 1998 6.25 9.3% 28.70 42.8% 38.33 67.03 1999 5.88 8.9% 27.53 41.7% 38.44 65.97 2000 5.82 8.5% 29.26 42.7% 39.27 68.53 2001 5.80 8.5% 28.40 41.7% 39.73 68.13 2002 5.74 8.5% 26.72 39.7% 40.57 67.29 2003 5.65 8.1% 28.22 40.6% 41.24 69.46 2004 5.44 7.5% 30.67 42.2% 41.92 72.60 2005 5.18 7.0% 32.16 43.5% 41.70 73.87 2006 5.09 6.9% 31.84 43.3% 41.63 73.48 2007 5.08 6.9% 31.60 43.2% 41.58 73.18 2008 5.00 6.8% 32.97 44.5% 41.08 74.05 2009 5.35 7.3% 31.29 42.9% 41.58 72.87 2010 5.48 7.4% 32.20 43.2% 42.34 74.54 2011 5.65 7.6% 32.39 43.4% 42.23 74.62 2012 6.49 8.5% 33.57 44.2% 42.46 76.03 2013 7.47 9.8% 32.62 42.8% 43.56 76.18 2014 8.76 11.2% 32.68 41.9% 45.38 78.06 2015 9.42 11.7% 33.94 42.2% 46.50 80.44 2016 8.88 11.0% 34.94 43.4% 45.63 80.57
Average annual percentage change 1960–2016 0.4% 2.5% 2.4% 2.4% 1970–2016 -0.2% 0.9% 1.5% 1.2% 2006–2016 5.7% 0.9% 0.9% 0.9%
Source: U.S. Department of Energy, Energy Information Administration, International Energy Statistics website, August
2017. (Additional resources: www.eia.doe.gov) a Includes lease condensate. Excludes natural gas plant liquids. b See Glossary for membership.

1–4
TRANSPORTATION ENERGY DATA BOOK: EDITION 36—2017
This table shows petroleum production, which includes both crude oil and natural gas plant liquids. Because other liquids and processing gain are not included, the world total is often smaller than world petroleum consumption (Table 1.4). The United States was responsible for 13.5% of the world’s petroleum production in 2016 and 11.0% of the world’s crude oil production (Table 1.2).
Table 1.3
World Petroleum Production, 1973–2016a (million barrels per day)
Total Non- United U.S. Total OPEC non- OPEC
Year States share OPECb share OPEC share World 1973 10.95 18.7% 29.99 51.3% 28.48 48.7% 58.47 1975 10.01 18.0% 26.16 47.0% 28.48 51.2% 55.62 1980 10.17 16.1% 26.05 41.3% 35.77 56.8% 63.00 1985 10.58 18.3% 16.20 28.0% 40.90 70.6% 57.90 1990 8.91 13.7% 23.71 36.4% 40.80 62.6% 65.14 1991 9.08 14.0% 23.65 36.4% 40.53 62.4% 64.95 1992 8.87 13.7% 25.02 38.5% 39.37 60.6% 64.95 1993 8.58 13.2% 25.83 39.6% 38.82 59.5% 65.23 1994 8.39 12.6% 26.52 39.8% 39.21 58.9% 66.55 1995 8.32 12.2% 27.19 40.0% 40.21 59.1% 68.01 1996 8.29 11.9% 27.70 39.8% 41.26 59.3% 69.52 1997 8.27 11.5% 29.05 40.5% 42.05 58.7% 71.65 1998 8.01 11.0% 30.21 41.4% 42.33 58.0% 73.04 1999 7.73 10.7% 29.13 40.4% 43.02 59.6% 72.15 2000 7.73 10.3% 32.78 43.8% 42.12 56.2% 74.90 2001 7.67 10.3% 32.05 42.8% 42.78 57.2% 74.83 2002 7.62 10.3% 30.37 41.0% 43.73 59.0% 74.10 2003 7.37 9.6% 31.91 41.7% 44.60 58.3% 76.52 2004 7.25 9.0% 34.75 43.4% 45.38 56.6% 80.12 2005 6.90 8.4% 36.50 44.7% 45.23 55.3% 81.73 2006 6.82 8.4% 36.16 44.3% 45.44 55.7% 81.59 2007 6.86 8.4% 35.98 44.1% 45.51 55.9% 81.49 2008 6.78 8.2% 37.53 45.5% 44.97 54.5% 82.50 2009 7.26 8.9% 35.84 44.0% 45.62 56.0% 81.46 2010 7.55 9.0% 36.85 44.1% 46.65 55.9% 83.49 2011 7.86 9.4% 37.03 44.2% 46.76 55.8% 83.79 2012 8.89 10.4% 38.32 44.8% 47.27 55.2% 85.59 2013 10.07 11.7% 37.23 43.4% 48.61 56.6% 85.84 2014 11.78 13.4% 37.20 42.2% 50.98 57.8% 88.18 2015 12.76 14.0% 38.55 42.4% 52.47 57.6% 91.01 2016 12.35 13.5% 39.62 43.4% 51.70 56.6% 91.32
Average annual percentage change 1973–2016 0.3% 0.6% 1.4% 1.0% 2006–2016 6.1% 0.9% 1.3% 1.1%
Source: U.S. Department of Energy, Energy Information Administration, International Energy Statistics website, August
2017. (Additional resources: www.eia.doe.gov)
a Includes natural gas plant liquids, crude oil and lease condensate. Does not account for all inputs or refinery processing gain.
b Organization of Petroleum Exporting Countries. See Glossary for membership. c Not comparable with previous data. Includes other inputs and refinery processing gains.

1–5
TRANSPORTATION ENERGY DATA BOOK: EDITION 36—2017
During the 1980s and 1990s, the United States accounted for about one-quarter of the world’s petroleum consumption, but from 2000 to 2012 that share had been decreasing. In 2015 the United States accounted for only 20.5%. World petroleum consumption decreased in 2009 but has continued to increase beginning with 2010. Non-OECD consumption has continued to increase.
Table 1.4
World Petroleum Consumption, 1960–2015 (million barrels per day)
Year United States U.S. share Total OECDa Total non-OECD World 1960 9.80 45.9% 15.78 5.56 21.34 1965 11.51 37.0% 22.81 8.33 31.14 1970 14.70 31.4% 34.69 12.12 46.81 1975 16.32 29.0% 39.14 17.06 56.20 1980 17.06 27.0% 42.03 21.09 63.12 1985 15.73 26.2% 37.70 22.39 60.08 1986 16.28 26.3% 38.83 22.99 61.82 1987 16.67 26.4% 39.59 23.51 63.11 1988 17.28 26.6% 40.92 24.05 64.98 1989 17.33 26.2% 41.62 24.47 66.09 1990 16.99 25.5% 41.75 24.79 66.54 1991 16.71 24.9% 42.22 24.97 67.19 1992 17.03 25.3% 43.25 24.15 67.40 1993 17.24 25.5% 43.69 23.93 67.62 1994 17.72 25.7% 44.92 24.09 69.01 1995 17.72 25.2% 45.40 24.86 70.26 1996 18.31 25.5% 46.53 25.35 71.88 1997 18.62 25.3% 47.30 26.29 73.60 1998 18.92 25.5% 47.49 26.78 74.27 1999 19.52 25.7% 48.48 27.50 75.98 2000 19.70 25.6% 48.50 28.56 77.06 2001 19.65 25.3% 48.54 29.19 77.73 2002 19.76 25.2% 48.51 29.91 78.42 2003 20.03 25.0% 49.23 30.84 80.07 2004 20.73 24.9% 50.05 33.16 83.21 2005 20.80 24.6% 50.38 34.25 84.63 2006 20.69 24.1% 50.16 35.54 85.70 2007 20.68 23.9% 50.04 36.46 86.49 2008 19.50 22.8% 48.36 37.28 85.64 2009 18.77 21.9% 46.30 39.29 85.58 2010 19.18 21.5% 47.00 42.17 89.17 2011 18.88 21.0% 46.33 43.56 89.88 2012 18.49 20.3% 45.93 45.16 91.09 2013 18.96 20.5% 46.07 46.26 92.32 2014 19.11 20.4% 45.77 47.84 93.61 2015 19.53 20.5% 46.34 49.02 95.36
Average annual percentage change 1960–2015 1.3% 2.0% 4.0% 2.8% 1970–2015 0.6% 0.6% 3.2% 1.6% 2005–2015 -0.6% -0.8% 3.3% 1.1%
Source: U.S. Department of Energy, Energy Information Administration, International Energy Statistics website,
August 2017. (Additional resources: www.eia.doe.gov) a Organization for Economic Cooperation and Development. See Glossary for membership.

1–6
TRANSPORTATION ENERGY DATA BOOK: EDITION 36—2017
Figure 1.1. World Oil Reserves, Production, and Consumption, 1980
Source: See Table 1.5.
Figure 1.2. World Oil Reserves, Production, and Consumption, 1993
Source: See Table 1.5.
1–7
TRANSPORTATION ENERGY DATA BOOK: EDITION 36—2017
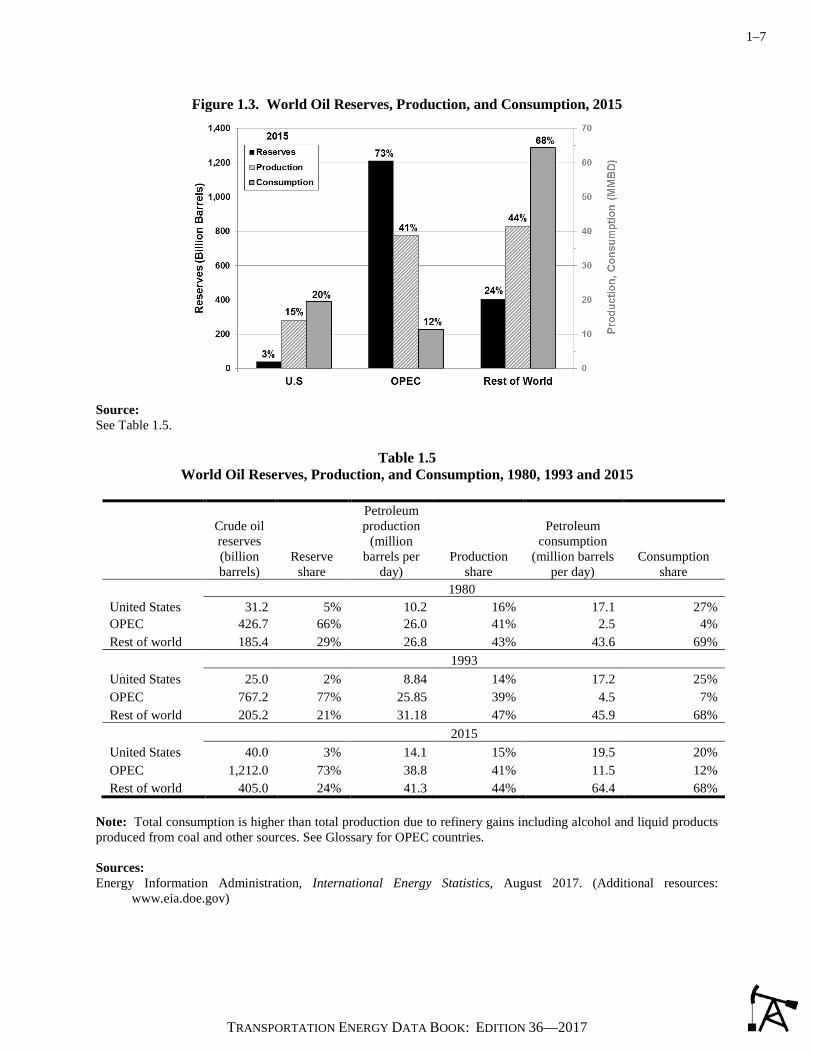
Figure 1.3. World Oil Reserves, Production, and Consumption, 2015
Source: See Table 1.5.
Table 1.5
World Oil Reserves, Production, and Consumption, 1980, 1993 and 2015
Crude oil reserves (billion barrels)
Reserve share
Petroleum production
(million barrels per
day) Production
share
Petroleum consumption
(million barrels per day)
Consumption share
1980 United States 31.2 5% 10.2 16% 17.1 27% OPEC 426.7 66% 26.0 41% 2.5 4% Rest of world 185.4 29% 26.8 43% 43.6 69% 1993 United States 25.0 2% 8.84 14% 17.2 25% OPEC 767.2 77% 25.85 39% 4.5 7% Rest of world 205.2 21% 31.18 47% 45.9 68% 2015 United States 40.0 3% 14.1 15% 19.5 20% OPEC 1,212.0 73% 38.8 41% 11.5 12% Rest of world 405.0 24% 41.3 44% 64.4 68%
Note: Total consumption is higher than total production due to refinery gains including alcohol and liquid products produced from coal and other sources. See Glossary for OPEC countries. Sources: Energy Information Administration, International Energy Statistics, August 2017. (Additional resources:
www.eia.doe.gov)
1–8
TRANSPORTATION ENERGY DATA BOOK: EDITION 36—2017
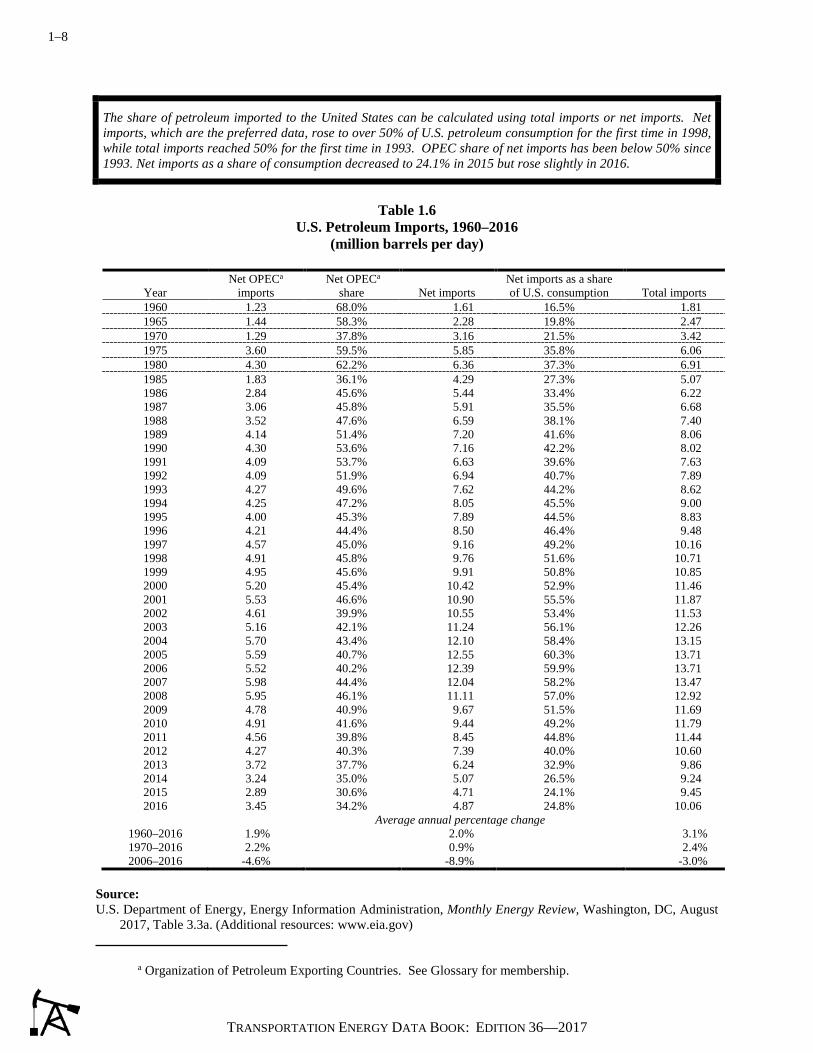
The share of petroleum imported to the United States can be calculated using total imports or net imports. Net imports, which are the preferred data, rose to over 50% of U.S. petroleum consumption for the first time in 1998, while total imports reached 50% for the first time in 1993. OPEC share of net imports has been below 50% since 1993. Net imports as a share of consumption decreased to 24.1% in 2015 but rose slightly in 2016.
Table 1.6
U.S. Petroleum Imports, 1960–2016 (million barrels per day)
Year Net OPECa
imports Net OPECa
share Net imports Net imports as a share of U.S. consumption Total imports
1960 1.23 68.0% 1.61 16.5% 1.81 1965 1.44 58.3% 2.28 19.8% 2.47 1970 1.29 37.8% 3.16 21.5% 3.42 1975 3.60 59.5% 5.85 35.8% 6.06 1980 4.30 62.2% 6.36 37.3% 6.91 1985 1.83 36.1% 4.29 27.3% 5.07 1986 2.84 45.6% 5.44 33.4% 6.22 1987 3.06 45.8% 5.91 35.5% 6.68 1988 3.52 47.6% 6.59 38.1% 7.40 1989 4.14 51.4% 7.20 41.6% 8.06 1990 4.30 53.6% 7.16 42.2% 8.02 1991 4.09 53.7% 6.63 39.6% 7.63 1992 4.09 51.9% 6.94 40.7% 7.89 1993 4.27 49.6% 7.62 44.2% 8.62 1994 4.25 47.2% 8.05 45.5% 9.00 1995 4.00 45.3% 7.89 44.5% 8.83 1996 4.21 44.4% 8.50 46.4% 9.48 1997 4.57 45.0% 9.16 49.2% 10.16 1998 4.91 45.8% 9.76 51.6% 10.71 1999 4.95 45.6% 9.91 50.8% 10.85 2000 5.20 45.4% 10.42 52.9% 11.46 2001 5.53 46.6% 10.90 55.5% 11.87 2002 4.61 39.9% 10.55 53.4% 11.53 2003 5.16 42.1% 11.24 56.1% 12.26 2004 5.70 43.4% 12.10 58.4% 13.15 2005 5.59 40.7% 12.55 60.3% 13.71 2006 5.52 40.2% 12.39 59.9% 13.71 2007 5.98 44.4% 12.04 58.2% 13.47 2008 5.95 46.1% 11.11 57.0% 12.92 2009 4.78 40.9% 9.67 51.5% 11.69 2010 4.91 41.6% 9.44 49.2% 11.79 2011 4.56 39.8% 8.45 44.8% 11.44 2012 4.27 40.3% 7.39 40.0% 10.60 2013 3.72 37.7% 6.24 32.9% 9.86 2014 3.24 35.0% 5.07 26.5% 9.24 2015 2.89 30.6% 4.71 24.1% 9.45 2016 3.45 34.2% 4.87 24.8% 10.06
Average annual percentage change 1960–2016 1.9% 2.0% 3.1% 1970–2016 2.2% 0.9% 2.4% 2006–2016 -4.6% -8.9% -3.0%
Source: U.S. Department of Energy, Energy Information Administration, Monthly Energy Review, Washington, DC, August
2017, Table 3.3a. (Additional resources: www.eia.gov)
a Organization of Petroleum Exporting Countries. See Glossary for membership.
1–9
TRANSPORTATION ENERGY DATA BOOK: EDITION 36—2017
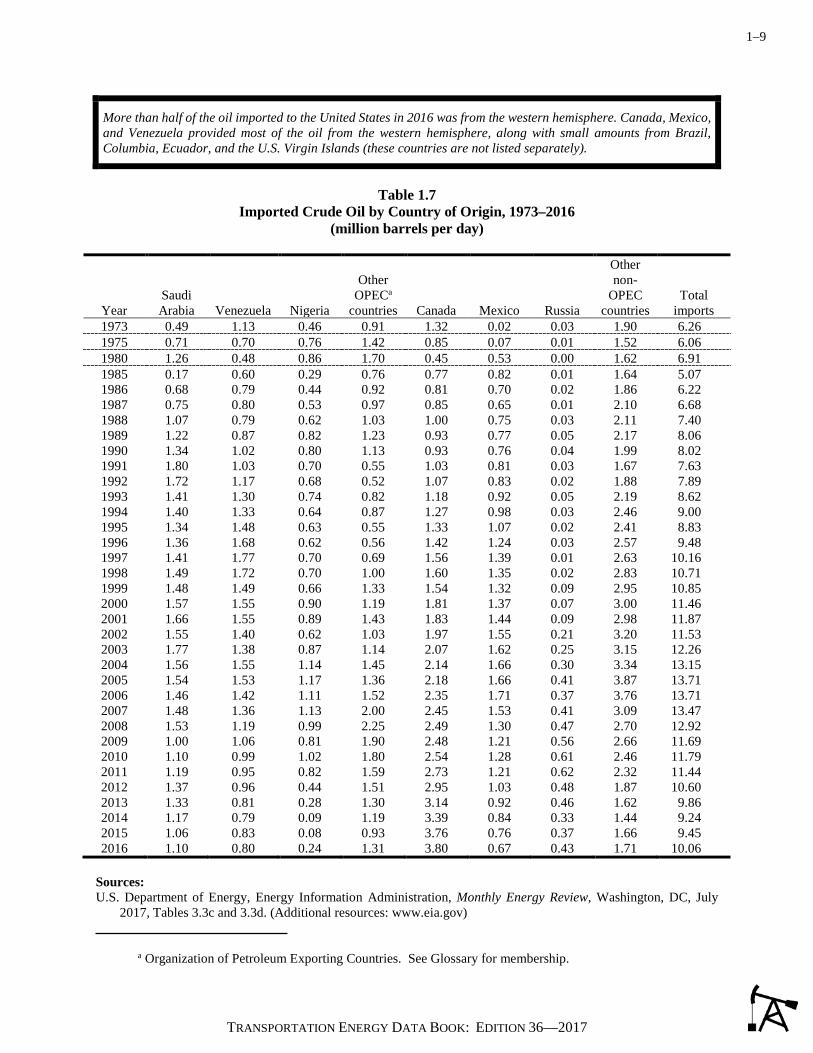
More than half of the oil imported to the United States in 2016 was from the western hemisphere. Canada, Mexico, and Venezuela provided most of the oil from the western hemisphere, along with small amounts from Brazil, Columbia, Ecuador, and the U.S. Virgin Islands (these countries are not listed separately).
Table 1.7
Imported Crude Oil by Country of Origin, 1973–2016 (million barrels per day)
Year Saudi Arabia Venezuela Nigeria
Other OPECa
countries Canada Mexico Russia
Other non-
OPEC countries
Total imports
1973 0.49 1.13 0.46 0.91 1.32 0.02 0.03 1.90 6.26 1975 0.71 0.70 0.76 1.42 0.85 0.07 0.01 1.52 6.06 1980 1.26 0.48 0.86 1.70 0.45 0.53 0.00 1.62 6.91 1985 0.17 0.60 0.29 0.76 0.77 0.82 0.01 1.64 5.07 1986 0.68 0.79 0.44 0.92 0.81 0.70 0.02 1.86 6.22 1987 0.75 0.80 0.53 0.97 0.85 0.65 0.01 2.10 6.68 1988 1.07 0.79 0.62 1.03 1.00 0.75 0.03 2.11 7.40 1989 1.22 0.87 0.82 1.23 0.93 0.77 0.05 2.17 8.06 1990 1.34 1.02 0.80 1.13 0.93 0.76 0.04 1.99 8.02 1991 1.80 1.03 0.70 0.55 1.03 0.81 0.03 1.67 7.63 1992 1.72 1.17 0.68 0.52 1.07 0.83 0.02 1.88 7.89 1993 1.41 1.30 0.74 0.82 1.18 0.92 0.05 2.19 8.62 1994 1.40 1.33 0.64 0.87 1.27 0.98 0.03 2.46 9.00 1995 1.34 1.48 0.63 0.55 1.33 1.07 0.02 2.41 8.83 1996 1.36 1.68 0.62 0.56 1.42 1.24 0.03 2.57 9.48 1997 1.41 1.77 0.70 0.69 1.56 1.39 0.01 2.63 10.16 1998 1.49 1.72 0.70 1.00 1.60 1.35 0.02 2.83 10.71 1999 1.48 1.49 0.66 1.33 1.54 1.32 0.09 2.95 10.85 2000 1.57 1.55 0.90 1.19 1.81 1.37 0.07 3.00 11.46 2001 1.66 1.55 0.89 1.43 1.83 1.44 0.09 2.98 11.87 2002 1.55 1.40 0.62 1.03 1.97 1.55 0.21 3.20 11.53 2003 1.77 1.38 0.87 1.14 2.07 1.62 0.25 3.15 12.26 2004 1.56 1.55 1.14 1.45 2.14 1.66 0.30 3.34 13.15 2005 1.54 1.53 1.17 1.36 2.18 1.66 0.41 3.87 13.71 2006 1.46 1.42 1.11 1.52 2.35 1.71 0.37 3.76 13.71 2007 1.48 1.36 1.13 2.00 2.45 1.53 0.41 3.09 13.47 2008 1.53 1.19 0.99 2.25 2.49 1.30 0.47 2.70 12.92 2009 1.00 1.06 0.81 1.90 2.48 1.21 0.56 2.66 11.69 2010 1.10 0.99 1.02 1.80 2.54 1.28 0.61 2.46 11.79 2011 1.19 0.95 0.82 1.59 2.73 1.21 0.62 2.32 11.44 2012 1.37 0.96 0.44 1.51 2.95 1.03 0.48 1.87 10.60 2013 1.33 0.81 0.28 1.30 3.14 0.92 0.46 1.62 9.86 2014 1.17 0.79 0.09 1.19 3.39 0.84 0.33 1.44 9.24 2015 1.06 0.83 0.08 0.93 3.76 0.76 0.37 1.66 9.45 2016 1.10 0.80 0.24 1.31 3.80 0.67 0.43 1.71 10.06
Sources: U.S. Department of Energy, Energy Information Administration, Monthly Energy Review, Washington, DC, July
2017, Tables 3.3c and 3.3d. (Additional resources: www.eia.gov)
a Organization of Petroleum Exporting Countries. See Glossary for membership.

1–10
TRANSPORTATION ENERGY DATA BOOK: EDITION 36—2017
The Strategic Petroleum Reserve (SPR) began in October 1977 as a result of the 1975 Energy Policy and Conservation Act. Its purpose is to provide protection against oil supply disruptions. The U.S. consumed 19.6 million barrels per day in 2016. At that rate of consumption, the SPR supply would last 35 days if used exclusively and continuously.
Table 1.8
Crude Oil Supplies, 1973-2016
Strategic Petroleum Reserve
Other crude oil stocksa
Total crude oil stocks
U.S. petroleum consumption
(million barrels per day)
Number of days the SPR would
supply the U.S.b Year (million barrels) 1973 0.0 242.5 242.5 17.3 0 1980 107.8 358.2 466.0 17.1 6 1985 493.3 320.9 814.2 15.7 31 1986 511.6 331.2 842.8 16.3 31 1987 540.6 349.0 889.6 16.7 32 1988 559.5 330.4 889.9 17.3 32 1989 579.9 341.3 921.1 17.3 33 1990 585.7 322.7 908.4 17.0 34 1991 568.5 324.6 893.1 16.7 34 1992 574.7 318.1 892.9 17.0 34 1993 587.1 335.4 922.5 17.2 34 1994 591.7 337.2 928.9 17.7 33 1995 591.6 303.3 895.0 17.7 33 1996 565.8 283.9 849.7 18.3 31 1997 563.4 304.7 868.1 18.6 30 1998 571.4 323.5 894.9 18.9 30 1999 567.2 284.5 851.7 19.5 29 2000 540.7 285.5 826.2 19.7 27 2001 550.2 312.0 862.2 19.6 28 2002 599.1 277.6 876.7 19.8 30 2003 638.4 268.9 907.3 20.0 32 2004 675.6 285.7 961.3 20.7 33 2005 684.5 307.7 992.2 20.8 33 2006 688.6 295.8 984.4 20.7 33 2007 696.9 268.4 964.3 20.7 34 2008 701.8 308.2 1,010.1 19.5 36 2009 726.6 307.1 1,033.8 18.8 39 2010 726.5 312.1 1,038.6 19.1 38 2011 696.0 308.2 1,004.2 18.9 37 2012 695.3 337.8 1,033.1 18.5 38 2013 696.0 327.2 1,023.2 19.0 37 2014 691.0 360.1 1,051.8 19.1 36 2015 695.1 449.2 1,144.3 19.5 36 2016 695.1 484.3 1,179.4 19.6 35
Sources: U.S. Department of Energy, Energy Information Administration, Monthly Energy Review, Washington, DC, July
2017, Tables 3.1 and 3.4. (Additional resources: www.eia.gov)
a Other crude oil stocks include stocks held by petroleum companies, as well as stocks of Alaskan crude oil in transit.
b Strategic Petroleum Reserves divided by U.S. consumption per day. This would only hold true if the SPR were the only oil used for that many days.

1–11
TRANSPORTATION ENERGY DATA BOOK: EDITION 36—2017
Other parts of the world refine crude oil to produce more diesel fuel and less gasoline than does OECD Americas. The OECD Asia Oceania countries produce the lowest share of gasoline in 2016.
Figure 1.4. Refinery Gross Output by World Region, 2006 and 2016
Source: International Energy Agency, Monthly Oil Survey, May 2017 and Monthly Oil Statistics, February 2007. (Additional
resources: www.iea.org) a Includes jet kerosene and other kerosene. b Includes motor gasoline, jet gasoline, and aviation gasoline. c Organization for Economic Cooperation and Development. See Glossary for membership.
1–12
TRANSPORTATION ENERGY DATA BOOK: EDITION 36—2017
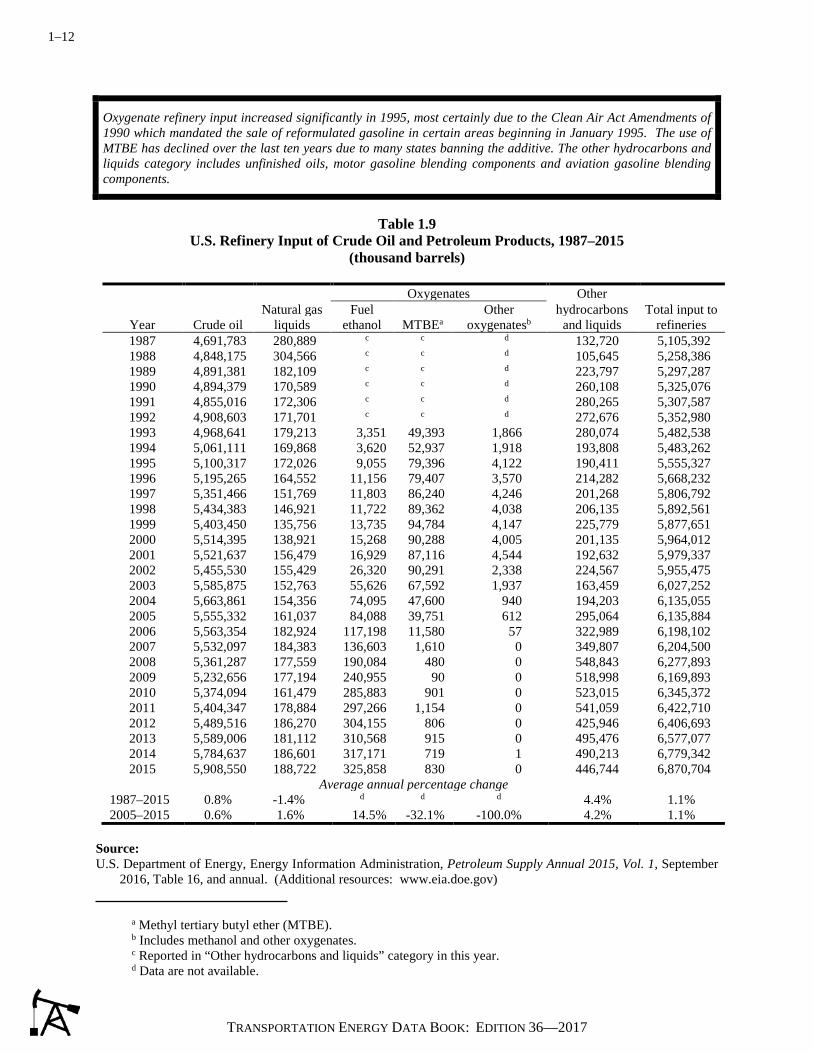
Oxygenate refinery input increased significantly in 1995, most certainly due to the Clean Air Act Amendments of 1990 which mandated the sale of reformulated gasoline in certain areas beginning in January 1995. The use of MTBE has declined over the last ten years due to many states banning the additive. The other hydrocarbons and liquids category includes unfinished oils, motor gasoline blending components and aviation gasoline blending components.
Table 1.9
U.S. Refinery Input of Crude Oil and Petroleum Products, 1987–2015 (thousand barrels)
Oxygenates Other
Natural gas Fuel Other hydrocarbons Total input to Year Crude oil liquids ethanol MTBEa oxygenatesb and liquids refineries 1987 4,691,783 280,889 c c d 132,720 5,105,392 1988 4,848,175 304,566 c c d 105,645 5,258,386 1989 4,891,381 182,109 c c d 223,797 5,297,287 1990 4,894,379 170,589 c c d 260,108 5,325,076 1991 4,855,016 172,306 c c d 280,265 5,307,587 1992 4,908,603 171,701 c c d 272,676 5,352,980 1993 4,968,641 179,213 3,351 49,393 1,866 280,074 5,482,538 1994 5,061,111 169,868 3,620 52,937 1,918 193,808 5,483,262 1995 5,100,317 172,026 9,055 79,396 4,122 190,411 5,555,327 1996 5,195,265 164,552 11,156 79,407 3,570 214,282 5,668,232 1997 5,351,466 151,769 11,803 86,240 4,246 201,268 5,806,792 1998 5,434,383 146,921 11,722 89,362 4,038 206,135 5,892,561 1999 5,403,450 135,756 13,735 94,784 4,147 225,779 5,877,651 2000 5,514,395 138,921 15,268 90,288 4,005 201,135 5,964,012 2001 5,521,637 156,479 16,929 87,116 4,544 192,632 5,979,337 2002 5,455,530 155,429 26,320 90,291 2,338 224,567 5,955,475 2003 5,585,875 152,763 55,626 67,592 1,937 163,459 6,027,252 2004 5,663,861 154,356 74,095 47,600 940 194,203 6,135,055 2005 5,555,332 161,037 84,088 39,751 612 295,064 6,135,884 2006 5,563,354 182,924 117,198 11,580 57 322,989 6,198,102 2007 5,532,097 184,383 136,603 1,610 0 349,807 6,204,500 2008 5,361,287 177,559 190,084 480 0 548,843 6,277,893 2009 5,232,656 177,194 240,955 90 0 518,998 6,169,893 2010 5,374,094 161,479 285,883 901 0 523,015 6,345,372 2011 5,404,347 178,884 297,266 1,154 0 541,059 6,422,710 2012 5,489,516 186,270 304,155 806 0 425,946 6,406,693 2013 5,589,006 181,112 310,568 915 0 495,476 6,577,077 2014 5,784,637 186,601 317,171 719 1 490,213 6,779,342 2015 5,908,550 188,722 325,858 830 0 446,744 6,870,704
Average annual percentage change 1987–2015 0.8% -1.4% d d d 4.4% 1.1% 2005–2015 0.6% 1.6% 14.5% -32.1% -100.0% 4.2% 1.1%
Source: U.S. Department of Energy, Energy Information Administration, Petroleum Supply Annual 2015, Vol. 1, September
2016, Table 16, and annual. (Additional resources: www.eia.doe.gov) a Methyl tertiary butyl ether (MTBE). b Includes methanol and other oxygenates. c Reported in “Other hydrocarbons and liquids” category in this year. d Data are not available.
1–13
TRANSPORTATION ENERGY DATA BOOK: EDITION 36—2017
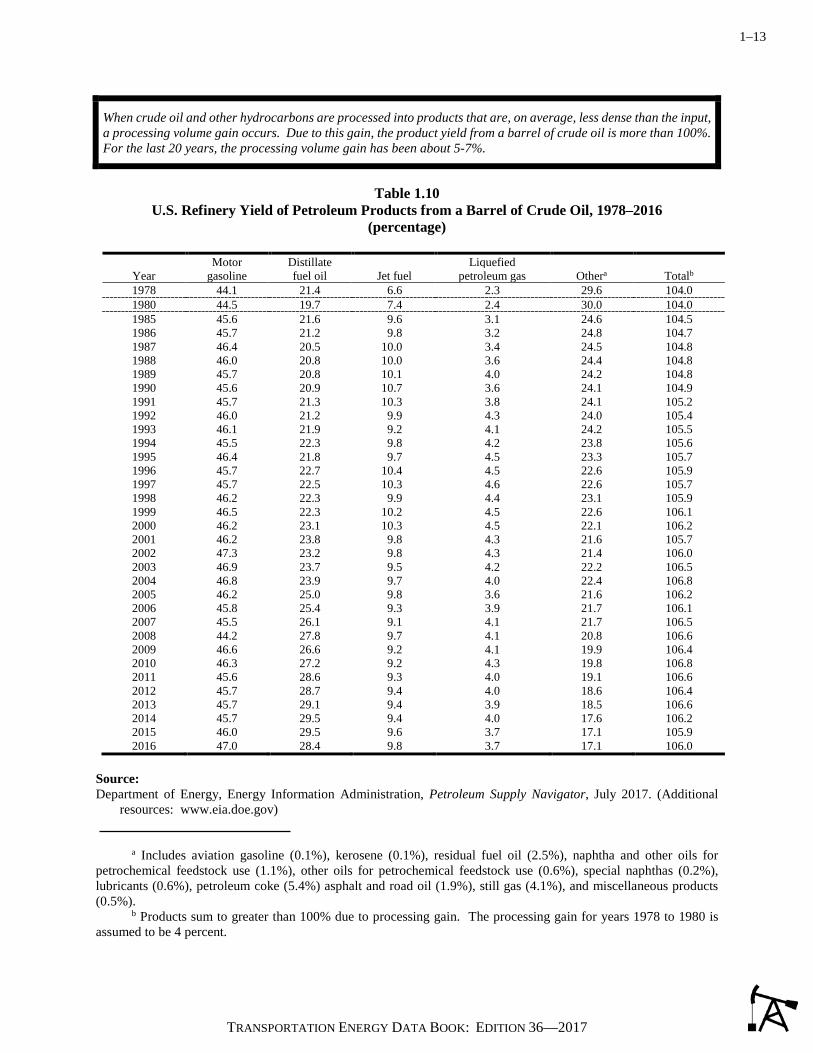
When crude oil and other hydrocarbons are processed into products that are, on average, less dense than the input, a processing volume gain occurs. Due to this gain, the product yield from a barrel of crude oil is more than 100%. For the last 20 years, the processing volume gain has been about 5-7%.
Table 1.10
U.S. Refinery Yield of Petroleum Products from a Barrel of Crude Oil, 1978–2016 (percentage)
Motor Distillate Liquefied
Year gasoline fuel oil Jet fuel petroleum gas Othera Totalb 1978 44.1 21.4 6.6 2.3 29.6 104.0 1980 44.5 19.7 7.4 2.4 30.0 104.0 1985 45.6 21.6 9.6 3.1 24.6 104.5 1986 45.7 21.2 9.8 3.2 24.8 104.7 1987 46.4 20.5 10.0 3.4 24.5 104.8 1988 46.0 20.8 10.0 3.6 24.4 104.8 1989 45.7 20.8 10.1 4.0 24.2 104.8 1990 45.6 20.9 10.7 3.6 24.1 104.9 1991 45.7 21.3 10.3 3.8 24.1 105.2 1992 46.0 21.2 9.9 4.3 24.0 105.4 1993 46.1 21.9 9.2 4.1 24.2 105.5 1994 45.5 22.3 9.8 4.2 23.8 105.6 1995 46.4 21.8 9.7 4.5 23.3 105.7 1996 45.7 22.7 10.4 4.5 22.6 105.9 1997 45.7 22.5 10.3 4.6 22.6 105.7 1998 46.2 22.3 9.9 4.4 23.1 105.9 1999 46.5 22.3 10.2 4.5 22.6 106.1 2000 46.2 23.1 10.3 4.5 22.1 106.2 2001 46.2 23.8 9.8 4.3 21.6 105.7 2002 47.3 23.2 9.8 4.3 21.4 106.0 2003 46.9 23.7 9.5 4.2 22.2 106.5 2004 46.8 23.9 9.7 4.0 22.4 106.8 2005 46.2 25.0 9.8 3.6 21.6 106.2 2006 45.8 25.4 9.3 3.9 21.7 106.1 2007 45.5 26.1 9.1 4.1 21.7 106.5 2008 44.2 27.8 9.7 4.1 20.8 106.6 2009 46.6 26.6 9.2 4.1 19.9 106.4 2010 46.3 27.2 9.2 4.3 19.8 106.8 2011 45.6 28.6 9.3 4.0 19.1 106.6 2012 45.7 28.7 9.4 4.0 18.6 106.4 2013 45.7 29.1 9.4 3.9 18.5 106.6 2014 45.7 29.5 9.4 4.0 17.6 106.2 2015 46.0 29.5 9.6 3.7 17.1 105.9 2016 47.0 28.4 9.8 3.7 17.1 106.0
Source: Department of Energy, Energy Information Administration, Petroleum Supply Navigator, July 2017. (Additional
resources: www.eia.doe.gov) a Includes aviation gasoline (0.1%), kerosene (0.1%), residual fuel oil (2.5%), naphtha and other oils for petrochemical feedstock use (1.1%), other oils for petrochemical feedstock use (0.6%), special naphthas (0.2%), lubricants (0.6%), petroleum coke (5.4%) asphalt and road oil (1.9%), still gas (4.1%), and miscellaneous products (0.5%). b Products sum to greater than 100% due to processing gain. The processing gain for years 1978 to 1980 is assumed to be 4 percent.
1–14
TRANSPORTATION ENERGY DATA BOOK: EDITION 36—2017
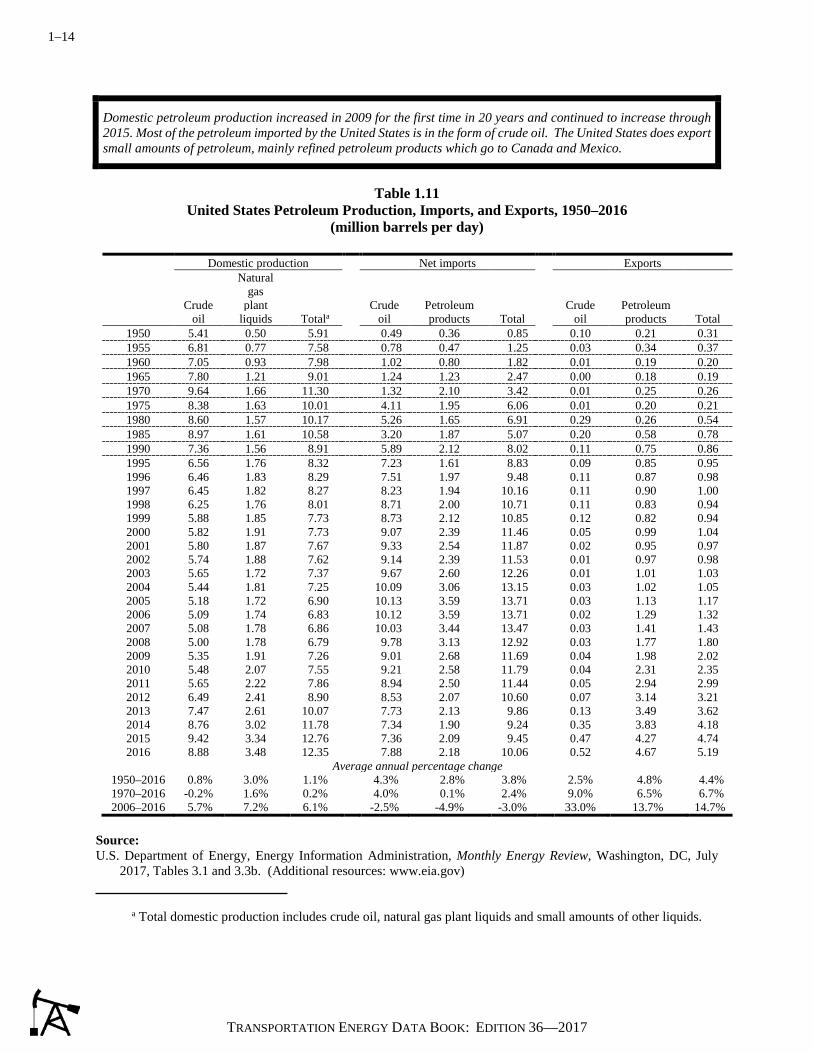
Domestic petroleum production increased in 2009 for the first time in 20 years and continued to increase through 2015. Most of the petroleum imported by the United States is in the form of crude oil. The United States does export small amounts of petroleum, mainly refined petroleum products which go to Canada and Mexico.
Table 1.11
United States Petroleum Production, Imports, and Exports, 1950–2016 (million barrels per day)
Domestic production Net imports Exports Natural gas Crude plant Crude Petroleum Crude Petroleum oil liquids Totala oil products Total oil products Total
1950 5.41 0.50 5.91 0.49 0.36 0.85 0.10 0.21 0.31 1955 6.81 0.77 7.58 0.78 0.47 1.25 0.03 0.34 0.37 1960 7.05 0.93 7.98 1.02 0.80 1.82 0.01 0.19 0.20 1965 7.80 1.21 9.01 1.24 1.23 2.47 0.00 0.18 0.19 1970 9.64 1.66 11.30 1.32 2.10 3.42 0.01 0.25 0.26 1975 8.38 1.63 10.01 4.11 1.95 6.06 0.01 0.20 0.21 1980 8.60 1.57 10.17 5.26 1.65 6.91 0.29 0.26 0.54 1985 8.97 1.61 10.58 3.20 1.87 5.07 0.20 0.58 0.78 1990 7.36 1.56 8.91 5.89 2.12 8.02 0.11 0.75 0.86 1995 6.56 1.76 8.32 7.23 1.61 8.83 0.09 0.85 0.95 1996 6.46 1.83 8.29 7.51 1.97 9.48 0.11 0.87 0.98 1997 6.45 1.82 8.27 8.23 1.94 10.16 0.11 0.90 1.00 1998 6.25 1.76 8.01 8.71 2.00 10.71 0.11 0.83 0.94 1999 5.88 1.85 7.73 8.73 2.12 10.85 0.12 0.82 0.94 2000 5.82 1.91 7.73 9.07 2.39 11.46 0.05 0.99 1.04 2001 5.80 1.87 7.67 9.33 2.54 11.87 0.02 0.95 0.97 2002 5.74 1.88 7.62 9.14 2.39 11.53 0.01 0.97 0.98 2003 5.65 1.72 7.37 9.67 2.60 12.26 0.01 1.01 1.03 2004 5.44 1.81 7.25 10.09 3.06 13.15 0.03 1.02 1.05 2005 5.18 1.72 6.90 10.13 3.59 13.71 0.03 1.13 1.17 2006 5.09 1.74 6.83 10.12 3.59 13.71 0.02 1.29 1.32 2007 5.08 1.78 6.86 10.03 3.44 13.47 0.03 1.41 1.43 2008 5.00 1.78 6.79 9.78 3.13 12.92 0.03 1.77 1.80 2009 5.35 1.91 7.26 9.01 2.68 11.69 0.04 1.98 2.02 2010 5.48 2.07 7.55 9.21 2.58 11.79 0.04 2.31 2.35 2011 5.65 2.22 7.86 8.94 2.50 11.44 0.05 2.94 2.99 2012 6.49 2.41 8.90 8.53 2.07 10.60 0.07 3.14 3.21 2013 7.47 2.61 10.07 7.73 2.13 9.86 0.13 3.49 3.62 2014 8.76 3.02 11.78 7.34 1.90 9.24 0.35 3.83 4.18 2015 9.42 3.34 12.76 7.36 2.09 9.45 0.47 4.27 4.74 2016 8.88 3.48 12.35 7.88 2.18 10.06 0.52 4.67 5.19
Average annual percentage change 1950–2016 0.8% 3.0% 1.1% 4.3% 2.8% 3.8% 2.5% 4.8% 4.4% 1970–2016 -0.2% 1.6% 0.2% 4.0% 0.1% 2.4% 9.0% 6.5% 6.7% 2006–2016 5.7% 7.2% 6.1% -2.5% -4.9% -3.0% 33.0% 13.7% 14.7%
Source: U.S. Department of Energy, Energy Information Administration, Monthly Energy Review, Washington, DC, July
2017, Tables 3.1 and 3.3b. (Additional resources: www.eia.gov) a Total domestic production includes crude oil, natural gas plant liquids and small amounts of other liquids.

1–15
TRANSPORTATION ENERGY DATA BOOK: EDITION 36—2017
U.S. petroleum production has been increasing and petroleum imports decreasing from 2008 through 2015. Net imports of petroleum in 2015 were at the lowest level since 1985. In 2016, domestic production declined slightly.
Table 1.12
Petroleum Production and Transportation Petroleum Consumption in Context, 1950–2016
Domestic petroleum
productiona
Net petroleum imports
Transportation petroleum
consumption
U.S. petroleum
consumption
World petroleum
consumption
Net imports as a share of
U.S.
U.S. petroleum consumption as a share of world
Transportation petroleum use as
a share of domestic
(million barrels per day) consumption consumption production 1950 5.91 0.55 3.36 6.46 b 8.4% b 56.8% 1955 7.58 0.88 4.46 8.46 b 10.4% b 58.8% 1960 7.99 1.62 5.15 9.82 21.34 16.5% 46.0% 64.5% 1965 9.01 2.28 6.04 11.51 31.14 19.8% 37.0% 67.0% 1970 11.30 3.16 7.78 14.70 46.81 21.5% 31.4% 68.9% 1975 10.01 5.85 8.92 16.32 56.20 35.8% 29.0% 89.4% 1980 10.17 6.36 9.55 17.06 63.12 37.3% 27.0% 93.9% 1985 10.58 4.29 9.84 15.73 60.08 27.3% 26.2% 93.0% 1990 8.91 7.16 10.99 16.99 66.54 42.2% 25.5% 123.2% 1995 8.32 7.89 11.50 17.72 70.26 44.5% 25.2% 138.2% 1996 8.29 8.50 11.83 18.31 71.88 46.4% 25.5% 142.6% 1997 8.27 9.16 12.14 18.62 73.60 49.2% 25.3% 146.8% 1998 8.01 9.76 12.40 18.92 74.27 51.6% 25.5% 154.8% 1999 7.73 9.91 12.74 19.52 75.98 50.8% 25.7% 164.8% 2000 7.73 10.42 12.99 19.70 76.93 52.9% 25.6% 168.0% 2001 7.67 10.90 12.91 19.65 77.73 55.5% 25.3% 168.4% 2002 7.62 10.55 13.18 19.76 78.46 53.4% 25.2% 172.9% 2003 7.37 11.24 13.25 20.03 80.09 56.1% 25.0% 179.8% 2004 7.25 12.10 13.67 20.73 83.06 58.4% 25.0% 188.6% 2005 6.90 12.55 13.90 20.80 84.56 60.3% 24.6% 201.6% 2006 6.83 12.39 14.11 20.69 85.57 59.9% 24.2% 206.7% 2007 6.86 12.04 14.20 20.68 86.72 58.2% 23.8% 207.0% 2008 6.78 11.11 13.50 19.50 86.05 57.0% 22.7% 199.0% 2009 7.26 9.67 13.16 18.77 84.97 51.5% 22.1% 181.3% 2010 7.55 9.44 13.35 19.18 89.17 49.2% 21.5% 176.9% 2011 7.86 8.45 13.14 18.88 89.88 44.8% 21.0% 167.2% 2012 8.90 7.39 12.86 18.49 91.09 40.0% 20.3% 144.6% 2013 10.07 6.24 13.09 18.96 92.32 32.9% 20.5% 130.0% 2014 11.78 5.07 13.29 19.11 93.61 26.5% 20.4% 112.9% 2015 12.76 4.71 13.60 19.53 95.36 24.1% 20.5% 106.6% 2016 12.35 4.87 13.69 19.63 b 24.8% b 110.9%
Average annual percentage change 1950–2016 1.1% 3.4% 2.2% 1.7% b 1970–2016 0.2% 0.9% 1.2% 0.6% b 2006–2016 6.1% -8.9% -0.3% -0.5% b Sources: U.S. Department of Energy, Energy Information Administration, Monthly Energy Review, Washington, DC, July
2017, Tables 2.5, 3.1, and A3. (Pre-1973 data from the Annual Energy Review). World petroleum consumption - U.S. Department of Energy, Energy Information Administration, International Energy Statistics website, August 2017. (Additional resources: www.eia.doe.gov)
a Total domestic production includes crude oil, natural gas plant liquids and small amounts of other liquids. b Data are not available.

1–16
TRANSPORTATION ENERGY DATA BOOK: EDITION 36—2017
Before 1989 the U.S. produced enough petroleum to meet the needs of the transportation sector, but was still short of meeting the petroleum needs of all the sectors, including industrial, residential and commercial, and electric utilities. In 1973 the gap between what the U.S. produced and what was consumed was 5.8 million barrels per day. By 2050, the gap is expected to be only about 4.8 million barrels per day if petroleum and other inputs are included or 6.1 million barrels per day if only conventional petroleum is used.
Figure 1.5. United States Petroleum Production and Consumption – All Sectors, 1973–2050
Notes: “Total U.S. Petroleum Production” includes crude oil, natural gas plant liquids, and refinery gains. It does not include dry natural gas. “Total U.S. Petroleum Production” is for all uses. “Total U.S. Petroleum Production with Other Inputs” also includes non-petroleum sources such as ethanol, biomass, liquids from coal, other blending components, other hydrocarbons, and ethers which were domestically produced. The change from historical values to projected values is between 2015 and 2016. The sharp increase in the value for heavy trucks between 2006 and 2007 is the result of the Federal Highway Administration’s methodology change. Sources: Historical transportation petroleum use – See Tables 1.14 and 1.15. Historical petroleum use for other sectors – See
Table 1.13. Historical U.S. petroleum production – Energy Information Administration, Monthly Energy Review August 2017, Table 3.1. Historical other inputs - Energy Information Administration, Monthly Energy Review August 2017, Tables 10.3 and 10.4. Forecasted petroleum use and petroleum production – Energy Information Administration, 2017 Annual Energy Outlook, January 2017, reference case tables 7, 11, and 36.
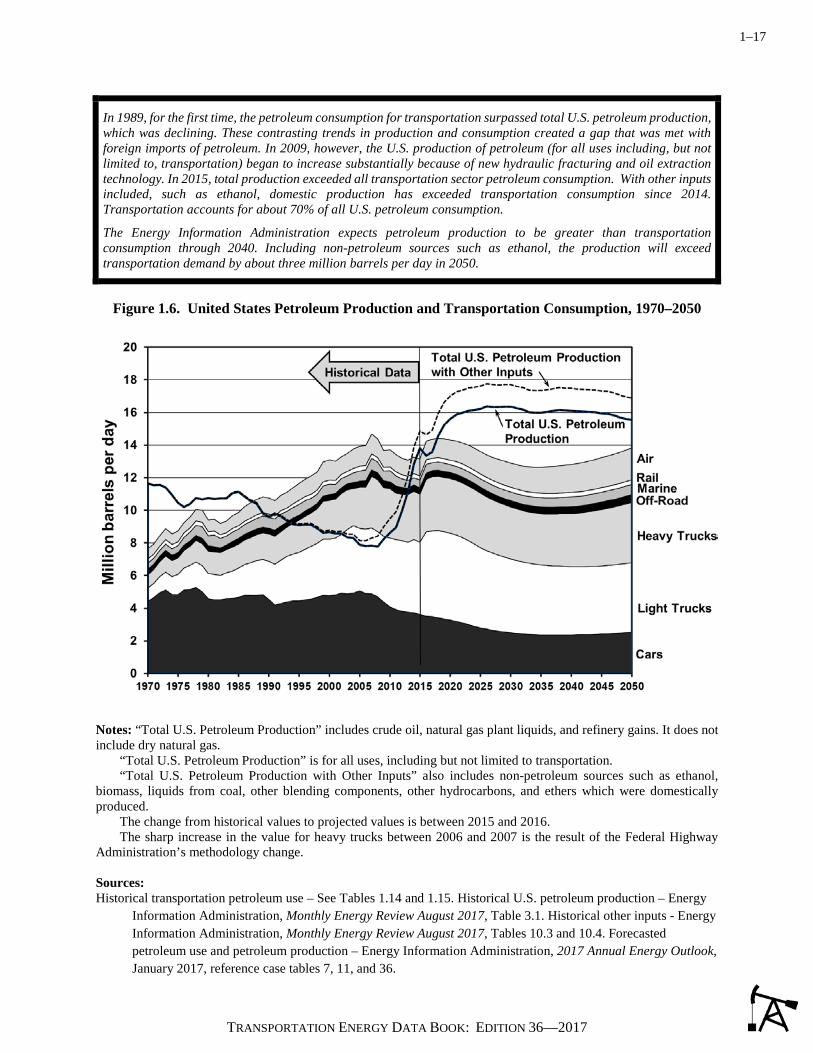
1–17
TRANSPORTATION ENERGY DATA BOOK: EDITION 36—2017
In 1989, for the first time, the petroleum consumption for transportation surpassed total U.S. petroleum production, which was declining. These contrasting trends in production and consumption created a gap that was met with foreign imports of petroleum. In 2009, however, the U.S. production of petroleum (for all uses including, but not limited to, transportation) began to increase substantially because of new hydraulic fracturing and oil extraction technology. In 2015, total production exceeded all transportation sector petroleum consumption. With other inputs included, such as ethanol, domestic production has exceeded transportation consumption since 2014. Transportation accounts for about 70% of all U.S. petroleum consumption.
The Energy Information Administration expects petroleum production to be greater than transportation consumption through 2040. Including non-petroleum sources such as ethanol, the production will exceed transportation demand by about three million barrels per day in 2050.
Figure 1.6. United States Petroleum Production and Transportation Consumption, 1970–2050
Notes: “Total U.S. Petroleum Production” includes crude oil, natural gas plant liquids, and refinery gains. It does not include dry natural gas. “Total U.S. Petroleum Production” is for all uses, including but not limited to transportation. “Total U.S. Petroleum Production with Other Inputs” also includes non-petroleum sources such as ethanol, biomass, liquids from coal, other blending components, other hydrocarbons, and ethers which were domestically produced. The change from historical values to projected values is between 2015 and 2016. The sharp increase in the value for heavy trucks between 2006 and 2007 is the result of the Federal Highway Administration’s methodology change. Sources: Historical transportation petroleum use – See Tables 1.14 and 1.15. Historical U.S. petroleum production – Energy
Information Administration, Monthly Energy Review August 2017, Table 3.1. Historical other inputs - Energy Information Administration, Monthly Energy Review August 2017, Tables 10.3 and 10.4. Forecasted petroleum use and petroleum production – Energy Information Administration, 2017 Annual Energy Outlook, January 2017, reference case tables 7, 11, and 36.
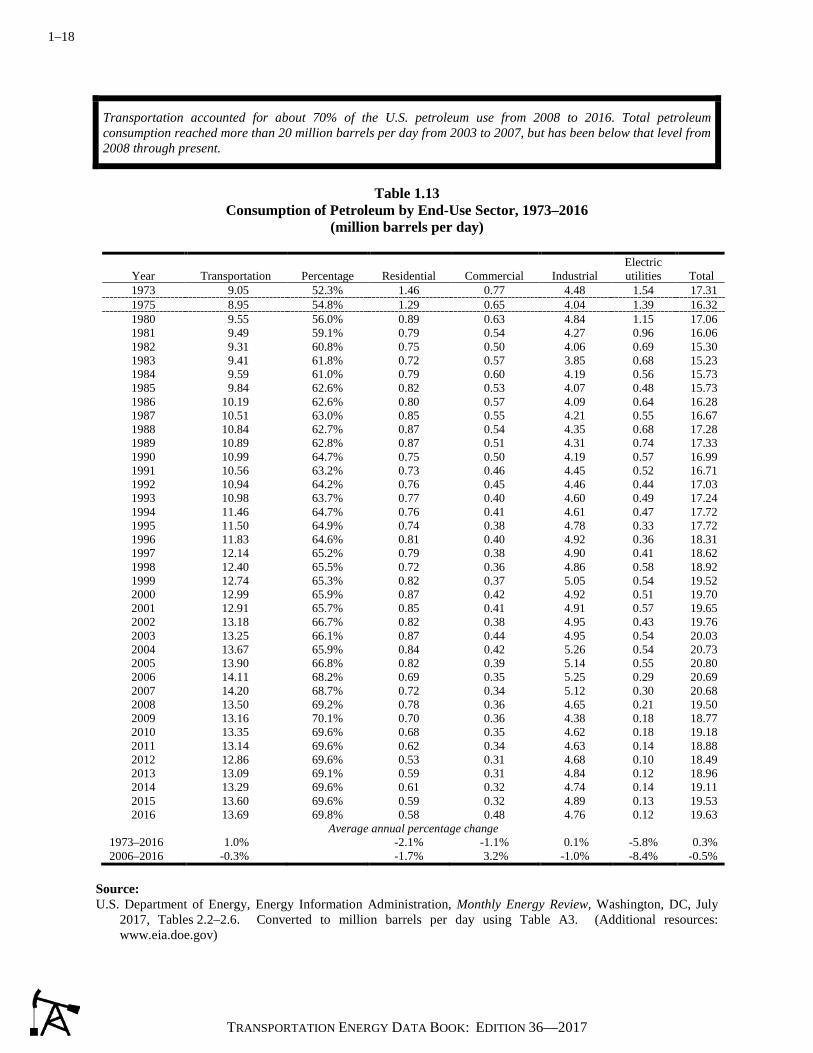
1–18
TRANSPORTATION ENERGY DATA BOOK: EDITION 36—2017
Transportation accounted for about 70% of the U.S. petroleum use from 2008 to 2016. Total petroleum consumption reached more than 20 million barrels per day from 2003 to 2007, but has been below that level from 2008 through present.
Table 1.13
Consumption of Petroleum by End-Use Sector, 1973–2016 (million barrels per day)
Electric
Year Transportation Percentage Residential Commercial Industrial utilities Total 1973 9.05 52.3% 1.46 0.77 4.48 1.54 17.31 1975 8.95 54.8% 1.29 0.65 4.04 1.39 16.32 1980 9.55 56.0% 0.89 0.63 4.84 1.15 17.06 1981 9.49 59.1% 0.79 0.54 4.27 0.96 16.06 1982 9.31 60.8% 0.75 0.50 4.06 0.69 15.30 1983 9.41 61.8% 0.72 0.57 3.85 0.68 15.23 1984 9.59 61.0% 0.79 0.60 4.19 0.56 15.73 1985 9.84 62.6% 0.82 0.53 4.07 0.48 15.73 1986 10.19 62.6% 0.80 0.57 4.09 0.64 16.28 1987 10.51 63.0% 0.85 0.55 4.21 0.55 16.67 1988 10.84 62.7% 0.87 0.54 4.35 0.68 17.28 1989 10.89 62.8% 0.87 0.51 4.31 0.74 17.33 1990 10.99 64.7% 0.75 0.50 4.19 0.57 16.99 1991 10.56 63.2% 0.73 0.46 4.45 0.52 16.71 1992 10.94 64.2% 0.76 0.45 4.46 0.44 17.03 1993 10.98 63.7% 0.77 0.40 4.60 0.49 17.24 1994 11.46 64.7% 0.76 0.41 4.61 0.47 17.72 1995 11.50 64.9% 0.74 0.38 4.78 0.33 17.72 1996 11.83 64.6% 0.81 0.40 4.92 0.36 18.31 1997 12.14 65.2% 0.79 0.38 4.90 0.41 18.62 1998 12.40 65.5% 0.72 0.36 4.86 0.58 18.92 1999 12.74 65.3% 0.82 0.37 5.05 0.54 19.52 2000 12.99 65.9% 0.87 0.42 4.92 0.51 19.70 2001 12.91 65.7% 0.85 0.41 4.91 0.57 19.65 2002 13.18 66.7% 0.82 0.38 4.95 0.43 19.76 2003 13.25 66.1% 0.87 0.44 4.95 0.54 20.03 2004 13.67 65.9% 0.84 0.42 5.26 0.54 20.73 2005 13.90 66.8% 0.82 0.39 5.14 0.55 20.80 2006 14.11 68.2% 0.69 0.35 5.25 0.29 20.69 2007 14.20 68.7% 0.72 0.34 5.12 0.30 20.68 2008 13.50 69.2% 0.78 0.36 4.65 0.21 19.50 2009 13.16 70.1% 0.70 0.36 4.38 0.18 18.77 2010 13.35 69.6% 0.68 0.35 4.62 0.18 19.18 2011 13.14 69.6% 0.62 0.34 4.63 0.14 18.88 2012 12.86 69.6% 0.53 0.31 4.68 0.10 18.49 2013 13.09 69.1% 0.59 0.31 4.84 0.12 18.96 2014 13.29 69.6% 0.61 0.32 4.74 0.14 19.11 2015 13.60 69.6% 0.59 0.32 4.89 0.13 19.53 2016 13.69 69.8% 0.58 0.48 4.76 0.12 19.63
Average annual percentage change 1973–2016 1.0% -2.1% -1.1% 0.1% -5.8% 0.3% 2006–2016 -0.3% -1.7% 3.2% -1.0% -8.4% -0.5%
Source: U.S. Department of Energy, Energy Information Administration, Monthly Energy Review, Washington, DC, July
2017, Tables 2.2–2.6. Converted to million barrels per day using Table A3. (Additional resources: www.eia.doe.gov)
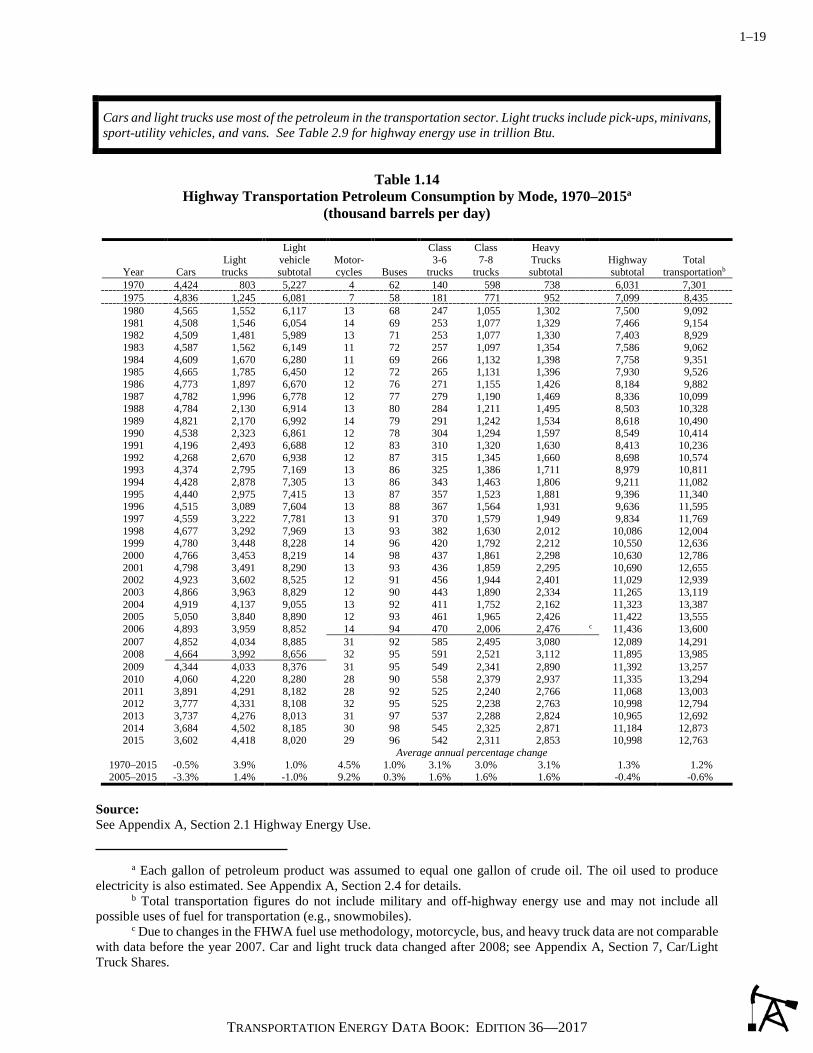
1–19
TRANSPORTATION ENERGY DATA BOOK: EDITION 36—2017
Cars and light trucks use most of the petroleum in the transportation sector. Light trucks include pick-ups, minivans, sport-utility vehicles, and vans. See Table 2.9 for highway energy use in trillion Btu.
Table 1.14
Highway Transportation Petroleum Consumption by Mode, 1970–2015a (thousand barrels per day)
Year Cars Light trucks
Light vehicle subtotal
Motor-cycles Buses
Class 3-6
trucks
Class 7-8
trucks
Heavy Trucks subtotal
Highway subtotal
Total transportationb
1970 4,424 803 5,227 4 62 140 598 738 6,031 7,301 1975 4,836 1,245 6,081 7 58 181 771 952 7,099 8,435 1980 4,565 1,552 6,117 13 68 247 1,055 1,302 7,500 9,092 1981 4,508 1,546 6,054 14 69 253 1,077 1,329 7,466 9,154 1982 4,509 1,481 5,989 13 71 253 1,077 1,330 7,403 8,929 1983 4,587 1,562 6,149 11 72 257 1,097 1,354 7,586 9,062 1984 4,609 1,670 6,280 11 69 266 1,132 1,398 7,758 9,351 1985 4,665 1,785 6,450 12 72 265 1,131 1,396 7,930 9,526 1986 4,773 1,897 6,670 12 76 271 1,155 1,426 8,184 9,882 1987 4,782 1,996 6,778 12 77 279 1,190 1,469 8,336 10,099 1988 4,784 2,130 6,914 13 80 284 1,211 1,495 8,503 10,328 1989 4,821 2,170 6,992 14 79 291 1,242 1,534 8,618 10,490 1990 4,538 2,323 6,861 12 78 304 1,294 1,597 8,549 10,414 1991 4,196 2,493 6,688 12 83 310 1,320 1,630 8,413 10,236 1992 4,268 2,670 6,938 12 87 315 1,345 1,660 8,698 10,574 1993 4,374 2,795 7,169 13 86 325 1,386 1,711 8,979 10,811 1994 4,428 2,878 7,305 13 86 343 1,463 1,806 9,211 11,082 1995 4,440 2,975 7,415 13 87 357 1,523 1,881 9,396 11,340 1996 4,515 3,089 7,604 13 88 367 1,564 1,931 9,636 11,595 1997 4,559 3,222 7,781 13 91 370 1,579 1,949 9,834 11,769 1998 4,677 3,292 7,969 13 93 382 1,630 2,012 10,086 12,004 1999 4,780 3,448 8,228 14 96 420 1,792 2,212 10,550 12,636 2000 4,766 3,453 8,219 14 98 437 1,861 2,298 10,630 12,786 2001 4,798 3,491 8,290 13 93 436 1,859 2,295 10,690 12,655 2002 4,923 3,602 8,525 12 91 456 1,944 2,401 11,029 12,939 2003 4,866 3,963 8,829 12 90 443 1,890 2,334 11,265 13,119 2004 4,919 4,137 9,055 13 92 411 1,752 2,162 11,323 13,387 2005 5,050 3,840 8,890 12 93 461 1,965 2,426 11,422 13,555 2006 4,893 3,959 8,852 14 94 470 2,006 2,476 c 11,436 13,600 2007 4,852 4,034 8,885 31 92 585 2,495 3,080 12,089 14,291 2008 4,664 3,992 8,656 32 95 591 2,521 3,112 11,895 13,985 2009 4,344 4,033 8,376 31 95 549 2,341 2,890 11,392 13,257 2010 4,060 4,220 8,280 28 90 558 2,379 2,937 11,335 13,294 2011 3,891 4,291 8,182 28 92 525 2,240 2,766 11,068 13,003 2012 3,777 4,331 8,108 32 95 525 2,238 2,763 10,998 12,794 2013 3,737 4,276 8,013 31 97 537 2,288 2,824 10,965 12,692 2014 3,684 4,502 8,185 30 98 545 2,325 2,871 11,184 12,873 2015 3,602 4,418 8,020 29 96 542 2,311 2,853 10,998 12,763
Average annual percentage change 1970–2015 -0.5% 3.9% 1.0% 4.5% 1.0% 3.1% 3.0% 3.1% 1.3% 1.2% 2005–2015 -3.3% 1.4% -1.0% 9.2% 0.3% 1.6% 1.6% 1.6% -0.4% -0.6%
Source: See Appendix A, Section 2.1 Highway Energy Use. a Each gallon of petroleum product was assumed to equal one gallon of crude oil. The oil used to produce electricity is also estimated. See Appendix A, Section 2.4 for details. b Total transportation figures do not include military and off-highway energy use and may not include all possible uses of fuel for transportation (e.g., snowmobiles). c Due to changes in the FHWA fuel use methodology, motorcycle, bus, and heavy truck data are not comparable with data before the year 2007. Car and light truck data changed after 2008; see Appendix A, Section 7, Car/Light Truck Shares.

1–20
TRANSPORTATION ENERGY DATA BOOK: EDITION 36—2017
Although about 18% of transportation energy use is for nonhighway modes, only 14% of transportation petroleum use is for nonhighway. This is because some nonhighway modes, such as pipelines and transit rail, use electricity. An estimate for the petroleum used to make electricity is included in the data. See Table 2.10 for nonhighway transportation energy use in trillion Btu.
Table 1.15
Nonhighway Transportation Petroleum Consumption by Mode, 1970–2015a (thousand barrels per day)
Year Air Water Pipeline Rail Nonhighway
subtotal Total
transportationb 1970 625 381 14 250 1,270 7,301 1975 651 423 16 246 1,336 8,435 1980 697 625 11 259 1,592 9,092 1985 814 564 4 214 1,596 9,526 1986 884 601 6 207 1,698 9,882 1987 920 626 5 211 1,763 10,099 1988 958 644 6 217 1,825 10,328 1989 960 688 6 218 1,872 10,490 1990 991 655 5 214 1,865 10,414 1991 928 690 4 201 1,823 10,236 1992 942 724 3 207 1,876 10,574 1993 961 653 4 213 1,831 10,811 1994 1,004 635 4 229 1,871 11,082 1995 1,036 668 2 238 1,944 11,340 1996 1,068 644 3 244 1,959 11,595 1997 1,113 574 3 245 1,935 11,769 1998 1,102 566 4 246 1,918 12,004 1999 1,202 625 4 255 2,086 12,636 2000 1,236 662 3 254 2,156 12,786 2001 1,161 546 4 255 1,966 12,655 2002 1,079 572 3 256 1,910 12,939 2003 1,094 496 3 262 1,855 13,119 2004 1,188 596 3 276 2,064 13,387 2005 1,226 625 3 279 2,133 13,555 2006 1,216 661 2 285 2,163 13,600 2007 1,215 709 2 276 2,202 14,291 2008 1,160 664 1 265 2,091 13,985 2009 1,029 613 1 221 1,864 13,257 2010 1,040 677 1 240 1,959 13,294 2011 1,044 638 1 253 1,935 13,003 2012 1,006 543 1 247 1,797 12,794 2013 987 486 1 253 1,727 12,692 2014 997 426 1 265 1,689 12,873 2015 1,025 486 1 253 1,765 12,763
Average annual percentage change 1970–2015 1.1% 0.5% -5.7% 0.0% 0.7% 1.2% 2005–2015 -1.8% -2.5% -10.4% -1.0% -1.9% -0.6%
Source: See Appendix A, Section 2.3. Nonhighway Energy Use. a Each gallon of petroleum product was assumed to equal one gallon of crude oil. The oil used to produce electricity is also estimated. See Appendix A, Section 2.3 Nonhighway Energy Use for details. b Total transportation figures do not include military and off-highway energy use and may not include all possible uses of fuel for transportation (e.g., snowmobiles).
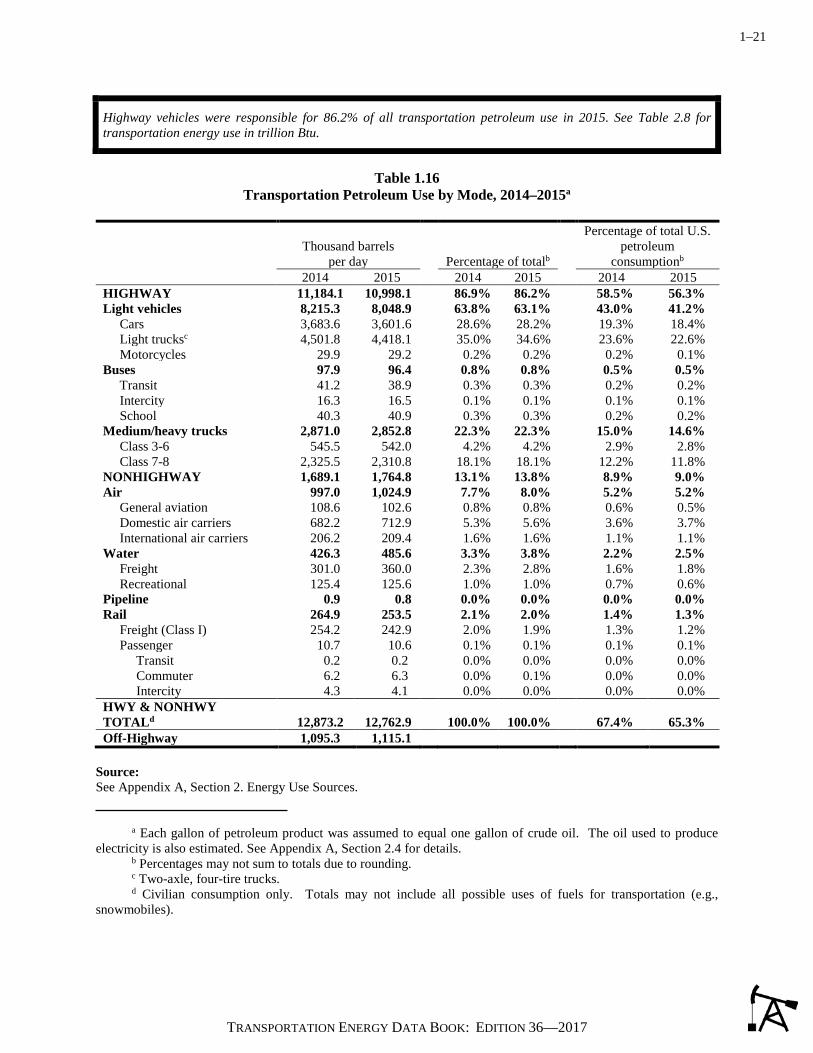
1–21
TRANSPORTATION ENERGY DATA BOOK: EDITION 36—2017
Highway vehicles were responsible for 86.2% of all transportation petroleum use in 2015. See Table 2.8 for transportation energy use in trillion Btu.
Table 1.16
Transportation Petroleum Use by Mode, 2014–2015a
Thousand barrels
per day Percentage of totalb
Percentage of total U.S. petroleum
consumptionb 2014 2015 2014 2015 2014 2015 HIGHWAY 11,184.1 10,998.1 86.9% 86.2% 58.5% 56.3% Light vehicles 8,215.3 8,048.9 63.8% 63.1% 43.0% 41.2% Cars 3,683.6 3,601.6 28.6% 28.2% 19.3% 18.4% Light trucksc 4,501.8 4,418.1 35.0% 34.6% 23.6% 22.6% Motorcycles 29.9 29.2 0.2% 0.2% 0.2% 0.1% Buses 97.9 96.4 0.8% 0.8% 0.5% 0.5% Transit 41.2 38.9 0.3% 0.3% 0.2% 0.2% Intercity 16.3 16.5 0.1% 0.1% 0.1% 0.1% School 40.3 40.9 0.3% 0.3% 0.2% 0.2% Medium/heavy trucks 2,871.0 2,852.8 22.3% 22.3% 15.0% 14.6% Class 3-6 545.5 542.0 4.2% 4.2% 2.9% 2.8% Class 7-8 2,325.5 2,310.8 18.1% 18.1% 12.2% 11.8% NONHIGHWAY 1,689.1 1,764.8 13.1% 13.8% 8.9% 9.0% Air 997.0 1,024.9 7.7% 8.0% 5.2% 5.2% General aviation 108.6 102.6 0.8% 0.8% 0.6% 0.5% Domestic air carriers 682.2 712.9 5.3% 5.6% 3.6% 3.7% International air carriers 206.2 209.4 1.6% 1.6% 1.1% 1.1% Water 426.3 485.6 3.3% 3.8% 2.2% 2.5% Freight 301.0 360.0 2.3% 2.8% 1.6% 1.8% Recreational 125.4 125.6 1.0% 1.0% 0.7% 0.6% Pipeline 0.9 0.8 0.0% 0.0% 0.0% 0.0% Rail 264.9 253.5 2.1% 2.0% 1.4% 1.3% Freight (Class I) 254.2 242.9 2.0% 1.9% 1.3% 1.2% Passenger 10.7 10.6 0.1% 0.1% 0.1% 0.1% Transit 0.2 0.2 0.0% 0.0% 0.0% 0.0% Commuter 6.2 6.3 0.0% 0.1% 0.0% 0.0% Intercity 4.3 4.1 0.0% 0.0% 0.0% 0.0% HWY & NONHWY TOTALd 12,873.2 12,762.9
100.0% 100.0%
67.4% 65.3% Off-Highway 1,095.3 1,115.1
Source: See Appendix A, Section 2. Energy Use Sources. a Each gallon of petroleum product was assumed to equal one gallon of crude oil. The oil used to produce electricity is also estimated. See Appendix A, Section 2.4 for details. b Percentages may not sum to totals due to rounding. c Two-axle, four-tire trucks. d Civilian consumption only. Totals may not include all possible uses of fuels for transportation (e.g., snowmobiles).

1–22
TRANSPORTATION ENERGY DATA BOOK: EDITION 36—2017

2–1
TRANSPORTATION ENERGY DATA BOOK: EDITION 36—2017
Chapter 2 Energy
Summary Statistics from Tables in this Chapter
Source
Table 2.1 Transportation share of U.S. energy consumption, 2016
28.7%
Table 2.2 Petroleum share of transportation energy consumption, 2016
91.9%
Table 2.6 Fuel ethanol consumption (million gallons) 14,399.1 Biodiesel consumption (million gallons) 2,059.6
Table 2.8 Transportation energy use by mode, 2015 (trillion Btu) (transportation energy share)
Cars 6,797 26.3% Light trucks 8,348 32.3% Medium/heavy trucks 5,984 23.1% Buses 203 0.8% Total Highway 21,386 82.6% Air 2,118 8.2% Water 1,046 4.0% Pipeline 767 3.0% Rail 563 2.2%

2–2
TRANSPORTATION ENERGY DATA BOOK: EDITION 36—2017
Petroleum accounted for 34% of the world’s energy use in 2014. Although petroleum and natural gas are the dominant energy sources for OECD countries, the non-OECD countries rely on coal and petroleum. The U.S. shares of primary energy sources are similar to the OECD countries as a whole, but with a lesser reliance on renewables.
Figure 2.1. World Consumption of Primary Energy, 2014
Note: The United States data are shown separately but are also included in the OECD data. Source: U.S. Department of Energy, Energy Information Administration, International Energy Statistics, August 2017.
(Additional resources: www.eia.doe.gov)

2–3
TRANSPORTATION ENERGY DATA BOOK: EDITION 36—2017
Total energy use was 97.4 quads in 2016 with transportation using 28.7%. The Energy Information Administration includes renewable energy in each sector.
Table 2.1
U. S. Consumption of Total Energy by End-Use Sector, 1973–2016 (quadrillion Btu)
Year Transportation
Percentage transportation of
total Industrial Commercial Residential Totala 1973 18.6 24.6% 32.6 9.5 14.9 75.7 1975 18.2 25.4% 29.4 9.5 14.8 72.0 1980 19.7 25.2% 32.0 10.6 15.8 78.1 1981 19.5 25.6% 30.7 10.6 15.3 76.1 1982 19.1 26.1% 27.6 10.9 15.5 73.1 1983 19.2 26.3% 27.4 10.9 15.4 73.0 1984 19.7 25.7% 29.6 11.4 16.0 76.7 1985 20.1 26.3% 28.8 11.5 16.0 76.4 1986 20.8 27.1% 28.3 11.6 16.0 76.7 1987 21.5 27.2% 28.4 11.9 16.3 79.1 1988 22.3 27.0% 30.7 12.6 17.1 82.7 1989 22.5 26.5% 31.3 13.2 17.8 84.8 1990 22.4 26.5% 31.8 13.3 16.9 84.5 1991 22.1 26.2% 31.4 13.4 17.4 84.4 1992 22.4 26.1% 32.6 13.4 17.4 85.8 1993 22.8 26.1% 32.6 13.8 18.2 87.4 1994 23.4 26.3% 33.5 14.1 18.1 89.1 1995 23.8 26.2% 34.0 14.7 18.5 91.0 1996 24.4 26.0% 34.9 15.2 19.5 94.0 1997 24.8 26.2% 35.2 15.7 19.0 94.6 1998 25.3 26.8% 34.8 16.0 19.0 95.0 1999 25.9 26.8% 34.8 16.4 19.6 96.7 2000 26.6 26.9% 34.7 17.2 20.4 98.8 2001 26.3 27.3% 32.7 17.1 20.0 96.2 2002 26.8 27.5% 32.7 17.3 20.8 97.6 2003 26.9 27.5% 32.6 17.3 21.1 97.9 2004 27.8 27.8% 33.5 17.7 21.1 100.1 2005 28.3 28.2% 32.4 17.9 21.6 100.2 2006 28.7 28.9% 32.4 17.7 20.7 99.5 2007 28.9 28.6% 32.4 18.3 21.5 101.0 2008 27.5 27.8% 31.3 18.4 21.7 98.9 2009 26.7 28.4% 28.5 17.9 21.1 94.1 2010 27.1 27.8% 30.5 18.1 21.8 97.4 2011 26.7 27.6% 30.8 18.0 21.3 96.8 2012 26.2 27.8% 30.9 17.4 19.9 94.2 2013 26.8 27.5% 31.4 17.9 21.1 97.2 2014 27.0 27.5% 31.6 18.3 21.4 98.3 2015 27.4 28.1% 31.3 18.2 20.5 97.4 2016 27.9 28.7% 30.8 18.2 20.4 97.4
Average annual percentage change 1973–2016 0.9% -0.1% 1.5% 0.7% 0.6% 2006–2016 -0.3% -0.5% 0.3% -0.1% -0.2%
Source: U.S. Department of Energy, Energy Information Administration, Monthly Energy Review, July 2017, Washington,
DC, Table 2.1. (Additional resources: www.eia.doe.gov) a Electrical energy losses have been distributed among the sectors.

2–4
TRANSPORTATION ENERGY DATA BOOK: EDITION 36—2017
In transportation, the alcohol fuels blended into gasoline to make gasohol (10% ethanol or less) are counted under “renewables” and are not in with petroleum. The petroleum category, however, still contains other blending agents that are not actually petroleum, but are not broken out into a separate category.
Table 2.2
Distribution of Energy Consumption by Source, 1973 and 2016 (percentage)
Energy Transportation Residential Commercial source 1973 2016 1973 2016 1973 2016 Petroleuma 95.8 91.9 18.8 4.7 16.8 4.7 Natural gasb 4.0 2.7 33.4 22.3 27.8 17.8 Coal 0.0 0.0 0.6 0.0 1.7 0.1 Renewable 0.0 5.1 2.4 2.8 0.1 1.4 Nuclear 0.0 0.0 0.0 0.0 0.0 0.0 Electricityc 0.2 0.3 44.8 70.2 53.6 76.0 Total 100.0 100.0 100.0 100.0 100.0 100.0
Energy Industrial Electric utilities source 1973 2016 1973 2016 Petroleuma 27.9 26.6 17.8 0.6 Natural gasb 31.8 31.1 19.0 27.3 Coal 12.4 3.9 44.0 34.4 Renewable 3.7 7.5 14.4 14.8 Nuclear 0.0 0.0 4.6 22.3 Electricityc 24.2 30.9 0.2 0.6 Total 100.0 100.0 100.0 100.0
Source: U.S. Department of Energy, Energy Information Administration, Monthly Energy Review, July 2017, Washington,
DC, Tables 2.2, 2.3, 2.4, 2.5, and 2.6. (Additional resources: www.eia.doe.gov) a In transportation, the petroleum category contains some blending agents which are not petroleum. b Includes supplemental gaseous fuels. Transportation sector includes pipeline fuel and natural gas vehicle use. c Includes electrical system energy losses.

2–5
TRANSPORTATION ENERGY DATA BOOK: EDITION 36—2017
Total transportation energy consumption was 27.9 quads in 2016. Petroleum has accounted for more than 90% of transportation energy consumption since the mid-1950’s. Renewables, including ethanol and biodiesel, were 5% of the total in 2016.
Table 2.3. Distribution of Transportation Energy Consumption by Source, 1950–2016
Year Petroleuma Natural gasb Coal Renewables Electricityc
Total
(trillion Btu)
1950 78.8% 1.5% 18.4% 0.0% 1.3% 8,492.5 1955 92.1% 2.7% 4.4% 0.0% 0.8% 9,550.2 1960 95.6% 3.4% 0.7% 0.0% 0.3% 10,595.9 1965 95.4% 4.2% 0.1% 0.0% 0.3% 12,432.5 1970 95.1% 4.6% 0.0% 0.0% 0.2% 16,098.2 1975 96.5% 3.3% 0.0% 0.0% 0.2% 18,245.0 1980 96.5% 3.3% 0.0% 0.0% 0.2% 19,696.7 1985 96.9% 2.6% 0.0% 0.2% 0.2% 20,087.9 1986 97.1% 2.4% 0.0% 0.3% 0.2% 20,788.8 1987 97.0% 2.5% 0.0% 0.3% 0.2% 21,468.9 1988 96.6% 2.8% 0.0% 0.3% 0.2% 22,317.7 1989 96.6% 2.9% 0.0% 0.3% 0.2% 22,477.9 1990 96.5% 3.0% 0.0% 0.3% 0.2% 22,419.6 1991 96.6% 2.8% 0.0% 0.3% 0.2% 22,118.0 1992 96.7% 2.7% 0.0% 0.4% 0.2% 22,415.1 1993 96.5% 2.8% 0.0% 0.4% 0.2% 22,711.7 1994 96.3% 3.0% 0.0% 0.4% 0.2% 23,365.1 1995 96.3% 3.0% 0.0% 0.5% 0.2% 23,851.1 1996 96.4% 3.0% 0.0% 0.3% 0.2% 24,439.2 1997 96.2% 3.2% 0.0% 0.4% 0.2% 24,751.3 1998 96.7% 2.6% 0.0% 0.4% 0.2% 25,260.1 1999 96.7% 2.6% 0.0% 0.5% 0.2% 25,949.5 2000 96.7% 2.5% 0.0% 0.5% 0.2% 26,555.3 2001 96.7% 2.5% 0.0% 0.5% 0.2% 26,282.2 2002 96.5% 2.6% 0.0% 0.6% 0.2% 26,845.7 2003 96.5% 2.3% 0.0% 0.9% 0.2% 26,900.2 2004 96.5% 2.2% 0.0% 1.0% 0.3% 27,842.8 2005 96.3% 2.2% 0.0% 1.2% 0.3% 28,280.3 2006 95.9% 2.2% 0.0% 1.7% 0.3% 28,716.7 2007 95.3% 2.3% 0.0% 2.1% 0.3% 28,858.3 2008 94.2% 2.5% 0.0% 3.0% 0.3% 27,486.3 2009 93.5% 2.7% 0.0% 3.5% 0.3% 26,687.1 2010 93.1% 2.7% 0.0% 4.0% 0.3% 27,059.1 2011 92.6% 2.7% 0.0% 4.3% 0.3% 26,712.1 2012 92.3% 3.0% 0.0% 4.4% 0.3% 26,219.3 2013 91.6% 3.3% 0.0% 4.8% 0.3% 26,749.8 2014 92.1% 2.8% 0.0% 4.8% 0.3% 26,996.5 2015 92.2% 2.7% 0.0% 4.8% 0.3% 27,355.2 2016 91.9% 2.6% 0.0% 5.1% 0.3% 27,925.3
Source: U.S. Department of Energy, Energy Information Administration, Monthly Energy Review, July 2017, Washington,
DC, Table 2.5. (Additional resources: www.eia.doe.gov) a In transportation, the petroleum category contains some blending agents which are not petroleum. b Includes supplemental gaseous fuels. Transportation sector includes pipeline fuel and natural gas vehicle use. c Includes electrical system energy losses.
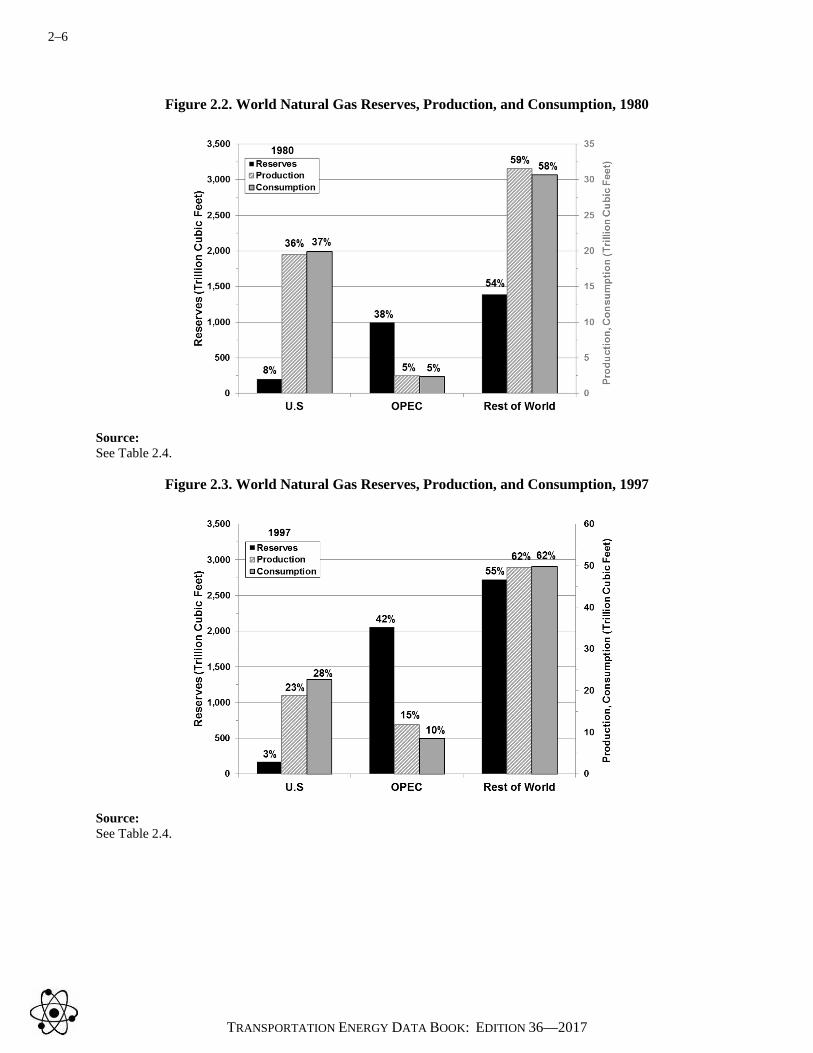
2–6
TRANSPORTATION ENERGY DATA BOOK: EDITION 36—2017
Figure 2.2. World Natural Gas Reserves, Production, and Consumption, 1980
Source: See Table 2.4.
Figure 2.3. World Natural Gas Reserves, Production, and Consumption, 1997
Source: See Table 2.4.
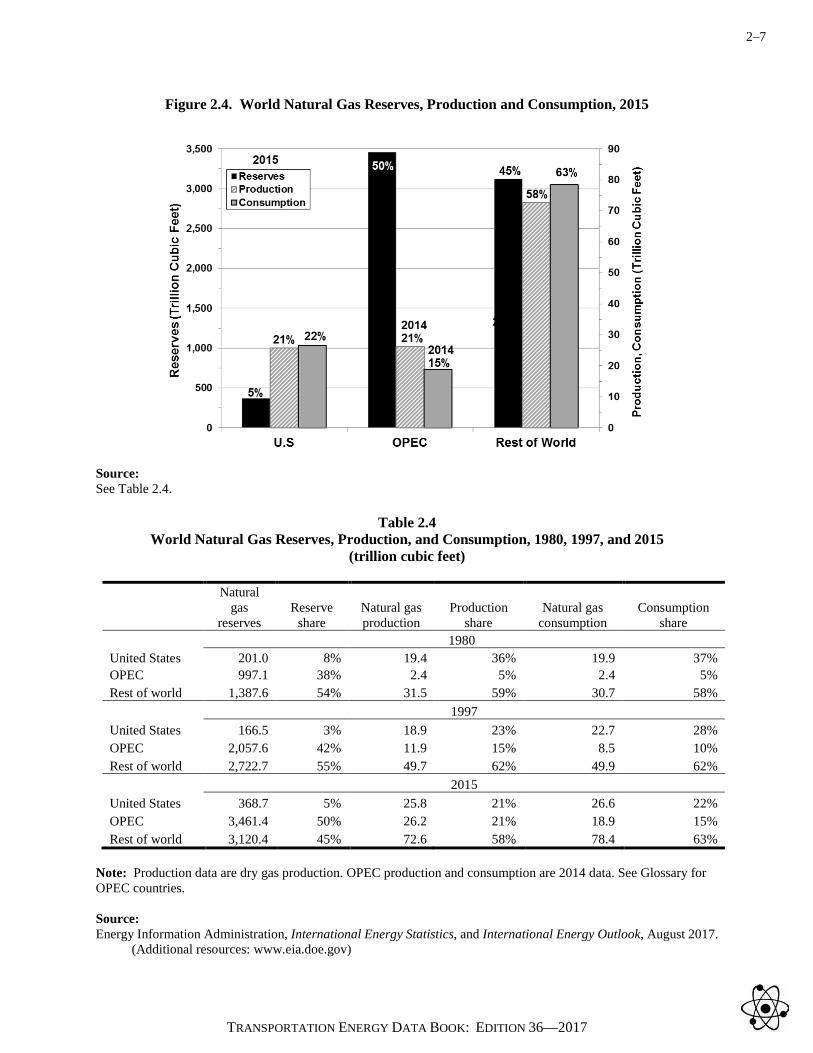
2–7
TRANSPORTATION ENERGY DATA BOOK: EDITION 36—2017
Figure 2.4. World Natural Gas Reserves, Production and Consumption, 2015
Source: See Table 2.4.
Table 2.4 World Natural Gas Reserves, Production, and Consumption, 1980, 1997, and 2015
(trillion cubic feet)
Natural gas
reserves Reserve
share Natural gas production
Production share
Natural gas consumption
Consumption share
1980 United States 201.0 8% 19.4 36% 19.9 37% OPEC 997.1 38% 2.4 5% 2.4 5% Rest of world 1,387.6 54% 31.5 59% 30.7 58% 1997 United States 166.5 3% 18.9 23% 22.7 28% OPEC 2,057.6 42% 11.9 15% 8.5 10% Rest of world 2,722.7 55% 49.7 62% 49.9 62% 2015 United States 368.7 5% 25.8 21% 26.6 22% OPEC 3,461.4 50% 26.2 21% 18.9 15% Rest of world 3,120.4 45% 72.6 58% 78.4 63%
Note: Production data are dry gas production. OPEC production and consumption are 2014 data. See Glossary for OPEC countries. Source: Energy Information Administration, International Energy Statistics, and International Energy Outlook, August 2017.
(Additional resources: www.eia.doe.gov)

2–8
TRANSPORTATION ENERGY DATA BOOK: EDITION 36—2017
In 2015, the United States and Russia were by far the top natural gas producing countries with more than triple that of any other country. Although the United States produced more than Russia, Russia has almost five times more reserves.
Figure 2.5. Natural Gas Production and Reserves for the Top Ten
Natural Gas Producing Countries, 2015
Note: The Energy Information Administration International Energy Statistics was formerly the source of this figure, but did not have 2015 production data available at the time of publication. Source: U.S. Central Intelligence Agency, The World Factbook, August 2017. (Additional resources:
www.cia.gov/library/publications/the-world-factbook)
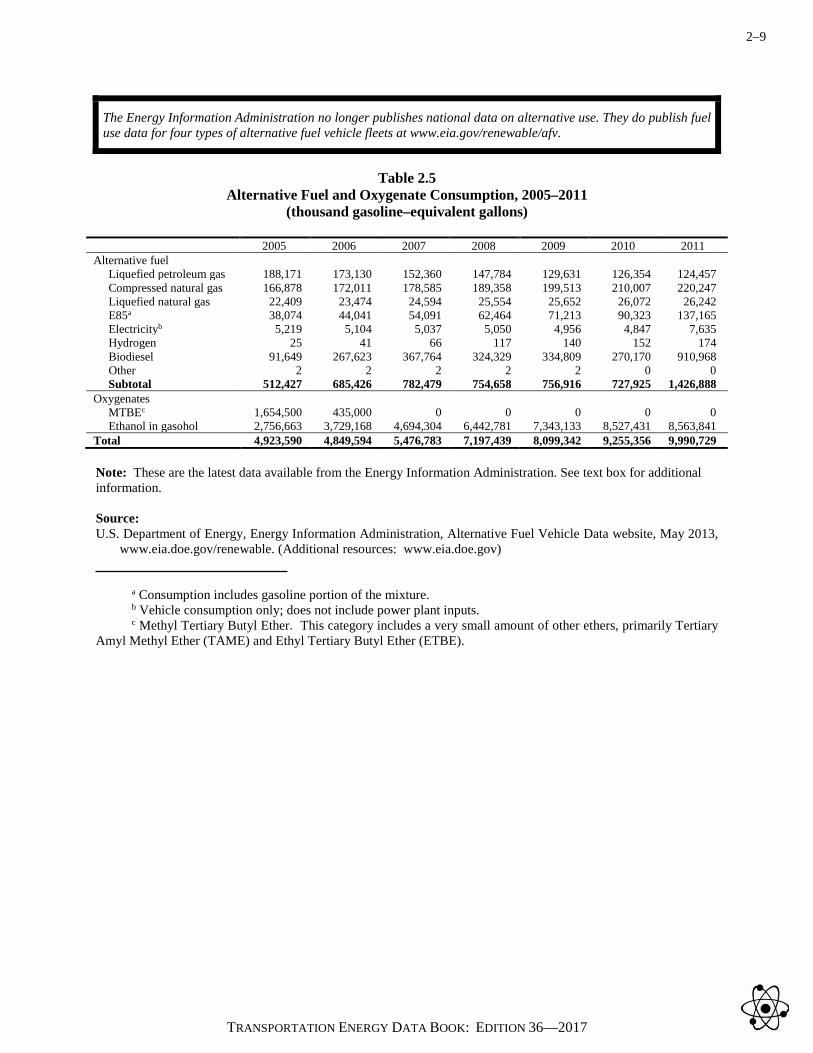
2–9
TRANSPORTATION ENERGY DATA BOOK: EDITION 36—2017
The Energy Information Administration no longer publishes national data on alternative use. They do publish fuel use data for four types of alternative fuel vehicle fleets at www.eia.gov/renewable/afv.
Table 2.5
Alternative Fuel and Oxygenate Consumption, 2005–2011 (thousand gasoline–equivalent gallons)
2005 2006 2007 2008 2009 2010 2011 Alternative fuel Liquefied petroleum gas 188,171 173,130 152,360 147,784 129,631 126,354 124,457 Compressed natural gas 166,878 172,011 178,585 189,358 199,513 210,007 220,247 Liquefied natural gas 22,409 23,474 24,594 25,554 25,652 26,072 26,242 E85a 38,074 44,041 54,091 62,464 71,213 90,323 137,165 Electricityb 5,219 5,104 5,037 5,050 4,956 4,847 7,635 Hydrogen 25 41 66 117 140 152 174 Biodiesel 91,649 267,623 367,764 324,329 334,809 270,170 910,968 Other 2 2 2 2 2 0 0 Subtotal 512,427 685,426 782,479 754,658 756,916 727,925 1,426,888 Oxygenates MTBEc 1,654,500 435,000 0 0 0 0 0 Ethanol in gasohol 2,756,663 3,729,168 4,694,304 6,442,781 7,343,133 8,527,431 8,563,841 Total 4,923,590 4,849,594 5,476,783 7,197,439 8,099,342 9,255,356 9,990,729 Note: These are the latest data available from the Energy Information Administration. See text box for additional information. Source: U.S. Department of Energy, Energy Information Administration, Alternative Fuel Vehicle Data website, May 2013,
www.eia.doe.gov/renewable. (Additional resources: www.eia.doe.gov) a Consumption includes gasoline portion of the mixture. b Vehicle consumption only; does not include power plant inputs. c Methyl Tertiary Butyl Ether. This category includes a very small amount of other ethers, primarily Tertiary Amyl Methyl Ether (TAME) and Ethyl Tertiary Butyl Ether (ETBE).
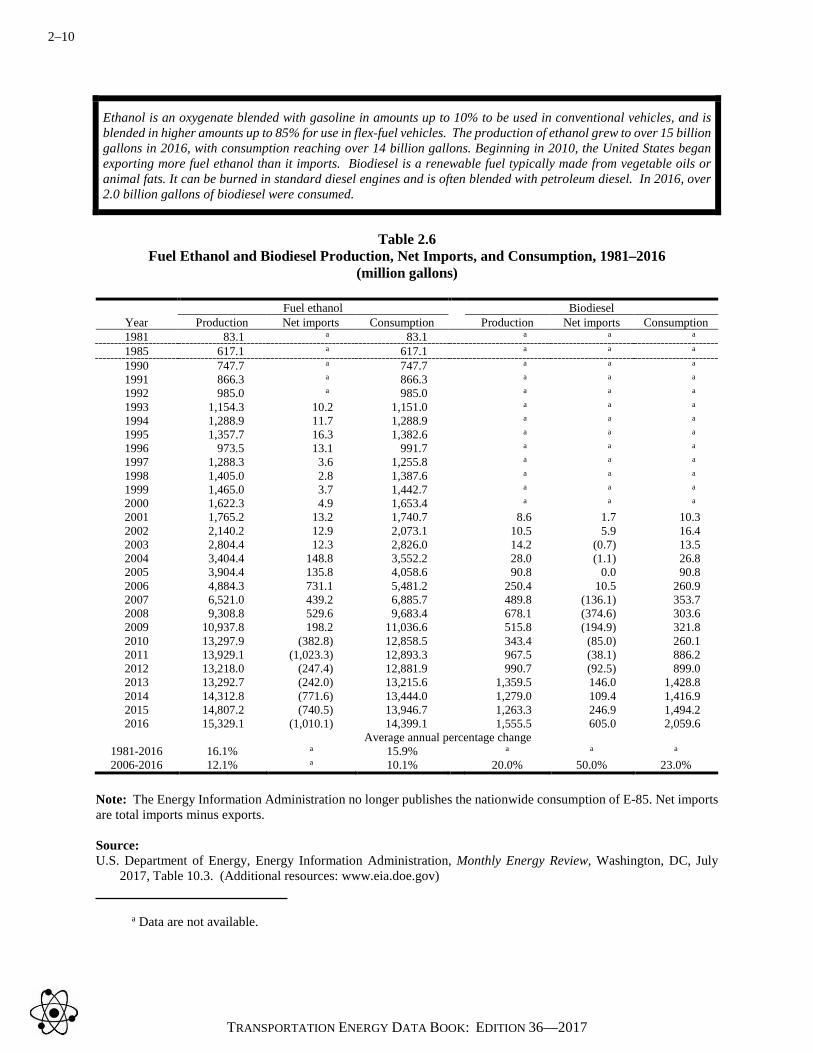
2–10
TRANSPORTATION ENERGY DATA BOOK: EDITION 36—2017
Ethanol is an oxygenate blended with gasoline in amounts up to 10% to be used in conventional vehicles, and is blended in higher amounts up to 85% for use in flex-fuel vehicles. The production of ethanol grew to over 15 billion gallons in 2016, with consumption reaching over 14 billion gallons. Beginning in 2010, the United States began exporting more fuel ethanol than it imports. Biodiesel is a renewable fuel typically made from vegetable oils or animal fats. It can be burned in standard diesel engines and is often blended with petroleum diesel. In 2016, over 2.0 billion gallons of biodiesel were consumed.
Table 2.6
Fuel Ethanol and Biodiesel Production, Net Imports, and Consumption, 1981–2016 (million gallons)
Fuel ethanol Biodiesel
Year Production Net imports Consumption Production Net imports Consumption 1981 83.1 a 83.1 a a a
1985 617.1 a 617.1 a a a
1990 747.7 a 747.7 a a a
1991 866.3 a 866.3 a a a
1992 985.0 a 985.0 a a a
1993 1,154.3 10.2 1,151.0 a a a
1994 1,288.9 11.7 1,288.9 a a a
1995 1,357.7 16.3 1,382.6 a a a
1996 973.5 13.1 991.7 a a a
1997 1,288.3 3.6 1,255.8 a a a
1998 1,405.0 2.8 1,387.6 a a a
1999 1,465.0 3.7 1,442.7 a a a
2000 1,622.3 4.9 1,653.4 a a a
2001 1,765.2 13.2 1,740.7 8.6 1.7 10.3 2002 2,140.2 12.9 2,073.1 10.5 5.9 16.4 2003 2,804.4 12.3 2,826.0 14.2 (0.7) 13.5 2004 3,404.4 148.8 3,552.2 28.0 (1.1) 26.8 2005 3,904.4 135.8 4,058.6 90.8 0.0 90.8 2006 4,884.3 731.1 5,481.2 250.4 10.5 260.9 2007 6,521.0 439.2 6,885.7 489.8 (136.1) 353.7 2008 9,308.8 529.6 9,683.4 678.1 (374.6) 303.6 2009 10,937.8 198.2 11,036.6 515.8 (194.9) 321.8 2010 13,297.9 (382.8) 12,858.5 343.4 (85.0) 260.1 2011 13,929.1 (1,023.3) 12,893.3 967.5 (38.1) 886.2 2012 13,218.0 (247.4) 12,881.9 990.7 (92.5) 899.0 2013 13,292.7 (242.0) 13,215.6 1,359.5 146.0 1,428.8 2014 14,312.8 (771.6) 13,444.0 1,279.0 109.4 1,416.9 2015 14,807.2 (740.5) 13,946.7 1,263.3 246.9 1,494.2 2016 15,329.1 (1,010.1) 14,399.1 1,555.5 605.0 2,059.6
Average annual percentage change 1981-2016 16.1% a 15.9% a a a
2006-2016 12.1% a 10.1% 20.0% 50.0% 23.0% Note: The Energy Information Administration no longer publishes the nationwide consumption of E-85. Net imports are total imports minus exports. Source: U.S. Department of Energy, Energy Information Administration, Monthly Energy Review, Washington, DC, July
2017, Table 10.3. (Additional resources: www.eia.doe.gov) a Data are not available.

2–11
TRANSPORTATION ENERGY DATA BOOK: EDITION 36—2017
As data about alternative fuel use become available, an attempt is made to incorporate them into this table. Sometimes assumptions must be made in order to use the data. Please see Appendix A for a description of the methodology used to develop these data. See Table 1.16 for transportation petroleum use in thousand barrels per day.
Table 2.7
Domestic Consumption of Transportation Energy by Mode and Fuel Type, 2015a
(trillion Btu)
Gasoline Diesel fuel
Liquefied petroleum
gas Jet fuel
Residual fuel oil
Natural gas Electricityb Totalc
HIGHWAY 15,343.4 5,947.2 70.1 - - 21.9 3.7 21,386.3 Light vehicles 14,733.1 414.1 49.5 - - - 3.4 15,200.1 Cars 6,754.8 38.3 3.4 6,796.5 Light trucksd 7,922.3 375.8 49.5 0.0 8,347.6 Motorcycles 56.0 56.0 Buses 8.9 170.9 0.7 - - 21.9 0.3 202.7 Transit 1.1 57.4 0.7 21.9 0.3 81.5 Intercity 35.1 35.1 School 7.8 78.3 86.1 Medium/heavy trucks 601.3 5,362.3 20.0 - - - - 5,983.6 Class 3-6 trucks 553.2 750.7 19.8 1,323.7 Class 7-8 trucks 48.1 4,611.5 0.2 4,659.9 NONHIGHWAY 214.6 927.3 - 2,095.6 464.6 686.9 104.2 4,493.2 Air 22.0 - - 2,095.6 - - - 2,117.7 General aviation 22.0 186.9 208.9 Domestic air carriers 1,475.4 1,475.4 International air carrierse 433.4 433.4 Water 192.6 388.4 - - 464.6 - - 1,045.6 Freight 335.0 464.6 799.6 Recreational 192.6 53.4 246.0 Pipeline - - - - - 686.9 80.3 767.1 Rail - 538.8 - - - - 24.0 562.8 Freight (Class I) 516.4 516.4 Passenger 22.4 24.0 46.3 Transit 16.1 16.1 Commuter 13.3 6.1 19.4 Intercity 9.1 1.8 10.9 TOTAL HWY & NONHWYc 15,558.0 6,874.5 70.1 2,095.6 464.6 708.8 107.9 25,879.5 Source: See Appendix A, Section 2. Energy Use Sources. a Civilian consumption only. Totals may not include all possible uses of fuels for transportation (e.g., snowmobiles). b Only end-use energy was counted for electricity. Previous editions included primary energy use for electricity which included generation and distribution losses. c Totals may not sum due to rounding. d Two-axle, four-tire trucks. e One half of fuel used by domestic carriers in international operation.
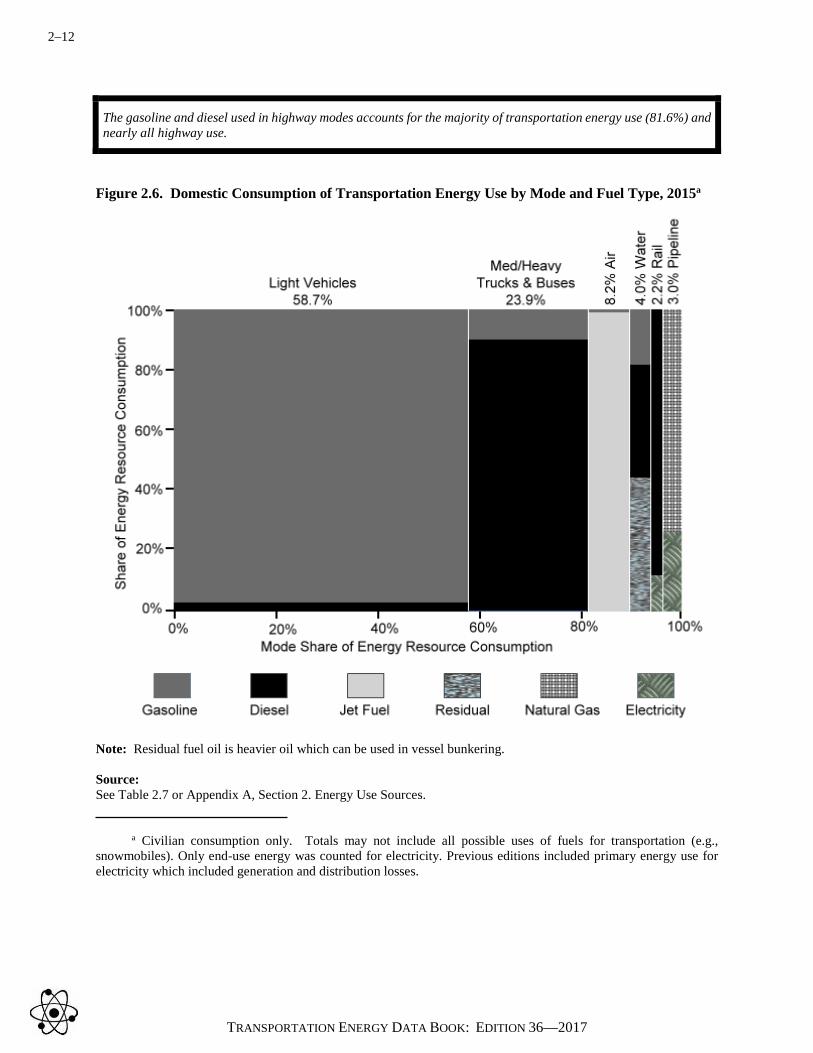
2–12
TRANSPORTATION ENERGY DATA BOOK: EDITION 36—2017
The gasoline and diesel used in highway modes accounts for the majority of transportation energy use (81.6%) and nearly all highway use.
Figure 2.6. Domestic Consumption of Transportation Energy Use by Mode and Fuel Type, 2015a
Note: Residual fuel oil is heavier oil which can be used in vessel bunkering. Source: See Table 2.7 or Appendix A, Section 2. Energy Use Sources. a Civilian consumption only. Totals may not include all possible uses of fuels for transportation (e.g., snowmobiles). Only end-use energy was counted for electricity. Previous editions included primary energy use for electricity which included generation and distribution losses.

2–13
TRANSPORTATION ENERGY DATA BOOK: EDITION 36—2017
Nonhighway modes were responsible for 18.0% of all transportation energy use in 2015. See Table 1.16 for transportation energy use in thousand barrels per day.
Table 2.8
Transportation Energy Use by Mode, 2014–2015a
Trillion Btu Percentage of total based on Btus 2014 2015 2014 2015 HIGHWAY 21,741.7 21,386.3 83.3% 82.6% Light vehicles 15,514.5 15,200.1 59.4% 58.7% Cars 6,951.2 6,796.5 26.6% 26.3% Light trucksb 8,505.9 8,347.6 32.6% 32.3% Motorcycles 57.3 56.0 0.2% 0.2% Buses 205.6 202.7 0.8% 0.8% Transit 86.2 81.5 0.3% 0.3% Intercity 34.6 35.1 0.1% 0.1% School 84.9 86.1 0.3% 0.3% Medium/heavy trucks 6,021.6 5,983.6 23.1% 23.1% Class 3-6 trucks 1,332.1 1,323.7 5.1% 5.1% Class 7-8 trucks 4,689.5 4,659.9 18.0% 18.0% NONHIGHWAY 4,367.5 4,493.2 16.7% 17.4% Air 2,059.6 2,117.7 7.9% 8.2% General aviation 221.0 208.9 0.8% 0.8% Domestic air carriers 1,411.9 1,475.4 5.4% 5.7% International air 426.7 433.4 1.6% 1.7% Water 918.2 1,045.6 3.5% 4.0% Freight 672.8 799.6 2.6% 3.1% Recreational 245.4 246.0 0.9% 1.0% Pipeline 802.6 767.1 3.1% 3.0% Rail 587.0 562.8 2.2% 2.2% Freight (Class I) 540.5 516.4 2.1% 2.0% Passenger 46.5 46.3 0.2% 0.2% Transit 16.4 16.1 0.1% 0.1% Commuter 19.2 19.4 0.1% 0.1% Intercity 11.0 10.9 0.0% 0.0% HWY & NONHWY TOTAL 26,109.3 25,879.5 100.0% 100.0% Off-highway 2,194.3 2,234.3
Source: See Appendix A, Section 2. Energy Use Sources. a Civilian consumption only. Totals may not include all possible uses of fuels for transportation (e.g., snowmobiles). Only end-use energy was counted for electricity. Previous editions included primary energy use for electricity which included generation and distribution losses. b Two-axle, four-tire trucks.
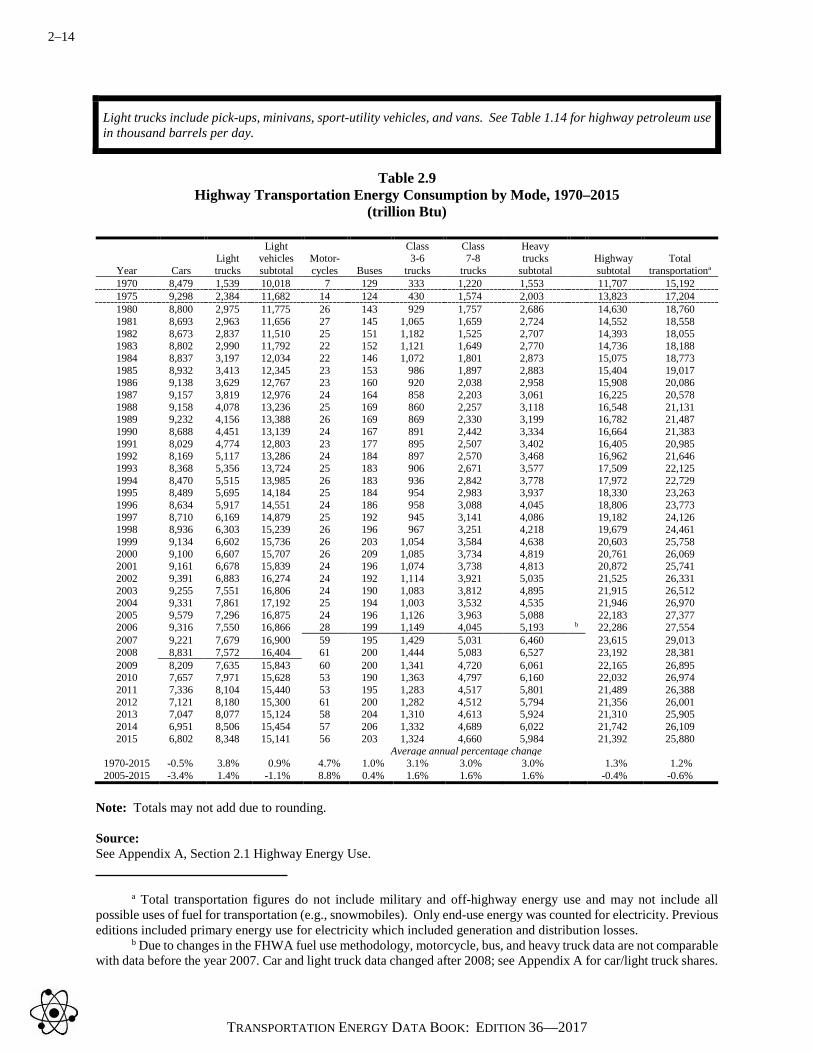
2–14
TRANSPORTATION ENERGY DATA BOOK: EDITION 36—2017
Light trucks include pick-ups, minivans, sport-utility vehicles, and vans. See Table 1.14 for highway petroleum use in thousand barrels per day.
Table 2.9
Highway Transportation Energy Consumption by Mode, 1970–2015 (trillion Btu)
Year Cars Light trucks
Light vehicles subtotal
Motor- cycles Buses
Class 3-6
trucks
Class 7-8
trucks
Heavy trucks
subtotal
Highway subtotal
Total transportationa
1970 8,479 1,539 10,018 7 129 333 1,220 1,553 11,707 15,192 1975 9,298 2,384 11,682 14 124 430 1,574 2,003 13,823 17,204 1980 8,800 2,975 11,775 26 143 929 1,757 2,686 14,630 18,760 1981 8,693 2,963 11,656 27 145 1,065 1,659 2,724 14,552 18,558 1982 8,673 2,837 11,510 25 151 1,182 1,525 2,707 14,393 18,055 1983 8,802 2,990 11,792 22 152 1,121 1,649 2,770 14,736 18,188 1984 8,837 3,197 12,034 22 146 1,072 1,801 2,873 15,075 18,773 1985 8,932 3,413 12,345 23 153 986 1,897 2,883 15,404 19,017 1986 9,138 3,629 12,767 23 160 920 2,038 2,958 15,908 20,086 1987 9,157 3,819 12,976 24 164 858 2,203 3,061 16,225 20,578 1988 9,158 4,078 13,236 25 169 860 2,257 3,118 16,548 21,131 1989 9,232 4,156 13,388 26 169 869 2,330 3,199 16,782 21,487 1990 8,688 4,451 13,139 24 167 891 2,442 3,334 16,664 21,383 1991 8,029 4,774 12,803 23 177 895 2,507 3,402 16,405 20,985 1992 8,169 5,117 13,286 24 184 897 2,570 3,468 16,962 21,646 1993 8,368 5,356 13,724 25 183 906 2,671 3,577 17,509 22,125 1994 8,470 5,515 13,985 26 183 936 2,842 3,778 17,972 22,729 1995 8,489 5,695 14,184 25 184 954 2,983 3,937 18,330 23,263 1996 8,634 5,917 14,551 24 186 958 3,088 4,045 18,806 23,773 1997 8,710 6,169 14,879 25 192 945 3,141 4,086 19,182 24,126 1998 8,936 6,303 15,239 26 196 967 3,251 4,218 19,679 24,461 1999 9,134 6,602 15,736 26 203 1,054 3,584 4,638 20,603 25,758 2000 9,100 6,607 15,707 26 209 1,085 3,734 4,819 20,761 26,069 2001 9,161 6,678 15,839 24 196 1,074 3,738 4,813 20,872 25,741 2002 9,391 6,883 16,274 24 192 1,114 3,921 5,035 21,525 26,331 2003 9,255 7,551 16,806 24 190 1,083 3,812 4,895 21,915 26,512 2004 9,331 7,861 17,192 25 194 1,003 3,532 4,535 21,946 26,970 2005 9,579 7,296 16,875 24 196 1,126 3,963 5,088 22,183 27,377 2006 9,316 7,550 16,866 28 199 1,149 4,045 5,193 b 22,286 27,554 2007 9,221 7,679 16,900 59 195 1,429 5,031 6,460 23,615 29,013 2008 8,831 7,572 16,404 61 200 1,444 5,083 6,527 23,192 28,381 2009 8,209 7,635 15,843 60 200 1,341 4,720 6,061 22,165 26,895 2010 7,657 7,971 15,628 53 190 1,363 4,797 6,160 22,032 26,974 2011 7,336 8,104 15,440 53 195 1,283 4,517 5,801 21,489 26,388 2012 7,121 8,180 15,300 61 200 1,282 4,512 5,794 21,356 26,001 2013 7,047 8,077 15,124 58 204 1,310 4,613 5,924 21,310 25,905 2014 6,951 8,506 15,454 57 206 1,332 4,689 6,022 21,742 26,109 2015 6,802 8,348 15,141 56 203 1,324 4,660 5,984 21,392 25,880
Average annual percentage change 1970-2015 -0.5% 3.8% 0.9% 4.7% 1.0% 3.1% 3.0% 3.0% 1.3% 1.2% 2005-2015 -3.4% 1.4% -1.1% 8.8% 0.4% 1.6% 1.6% 1.6% -0.4% -0.6%
Note: Totals may not add due to rounding. Source: See Appendix A, Section 2.1 Highway Energy Use. a Total transportation figures do not include military and off-highway energy use and may not include all possible uses of fuel for transportation (e.g., snowmobiles). Only end-use energy was counted for electricity. Previous editions included primary energy use for electricity which included generation and distribution losses. b Due to changes in the FHWA fuel use methodology, motorcycle, bus, and heavy truck data are not comparable with data before the year 2007. Car and light truck data changed after 2008; see Appendix A for car/light truck shares.

2–15
TRANSPORTATION ENERGY DATA BOOK: EDITION 36—2017
About 18% of transportation energy use is for nonhighway modes. Air travel accounts for almost 45% of nonhighway energy use. See Table 1.15 for nonhighway petroleum use in thousand barrels per day.
Table 2.10
Nonhighway Transportation Energy Consumption by Mode, 1970–2015 (trillion Btu)
Year Air Water Pipeline Rail Nonhighway
subtotal Total
transportationa 1970 1,287 836 826 537 3,486 15,192 1975 1,234 927 680 540 3,381 17,204 1980 1,434 1,393 734 570 4,130 18,760 1981 1,453 1,270 742 541 4,006 18,558 1982 1,445 1,063 694 460 3,662 18,055 1983 1,440 974 583 455 3,452 18,188 1984 1,609 964 623 502 3,699 18,773 1985 1,677 871 597 468 3,613 19,017 1986 1,823 1,323 578 454 4,178 20,086 1987 1,899 1,378 613 464 4,354 20,578 1988 1,978 1,417 712 476 4,583 21,131 1989 1,981 1,516 729 478 4,705 21,487 1990 2,046 1,442 760 471 4,719 21,383 1991 1,916 1,523 699 442 4,580 20,985 1992 1,945 1,599 685 455 4,684 21,646 1993 1,986 1,437 723 469 4,615 22,125 1994 2,075 1,394 787 502 4,758 22,729 1995 2,141 1,468 803 523 4,935 23,263 1996 2,206 1,411 814 536 4,967 23,773 1997 2,300 1,250 856 537 4,943 24,126 1998 2,275 1,232 735 540 4,782 24,461 1999 2,483 1,367 745 560 5,156 25,758 2000 2,554 1,454 742 559 5,309 26,069 2001 2,397 1,186 724 561 4,869 25,741 2002 2,229 1,247 768 563 4,807 26,331 2003 2,260 1,074 689 575 4,597 26,512 2004 2,456 1,299 662 607 5,024 26,970 2005 2,532 1,368 681 613 5,194 27,377 2006 2,511 1,450 681 626 5,269 27,554 2007 2,509 1,559 720 610 5,399 29,013 2008 2,396 1,460 748 586 5,190 28,381 2009 2,127 1,340 771 492 4,731 26,895 2010 2,149 1,485 775 533 4,942 26,974 2011 2,157 1,392 790 560 4,900 26,388 2012 2,077 1,183 835 549 4,644 26,001 2013 2,037 1,055 942 562 4,595 25,905 2014 2,060 918 803 587 4,368 26,109 2015 2,118 1,046 767 563 4,493 25,880
Average annual percentage change 1970–2015 1.1% 0.5% -0.2% 0.1% 0.6% 1.2% 2005–2015 -1.8% -2.6% 1.2% -0.8% -1.4% -0.6%
Note: Totals may not add due to rounding. Source: See Appendix A, Section 2.3 Nonhighway Energy Use. a Total transportation figures do not include military and off-highway energy use and may not include all possible uses of fuel for transportation (e.g., snowmobiles). Only end-use energy was counted for electricity. Previous editions included primary energy use for electricity which included generation and distribution losses.
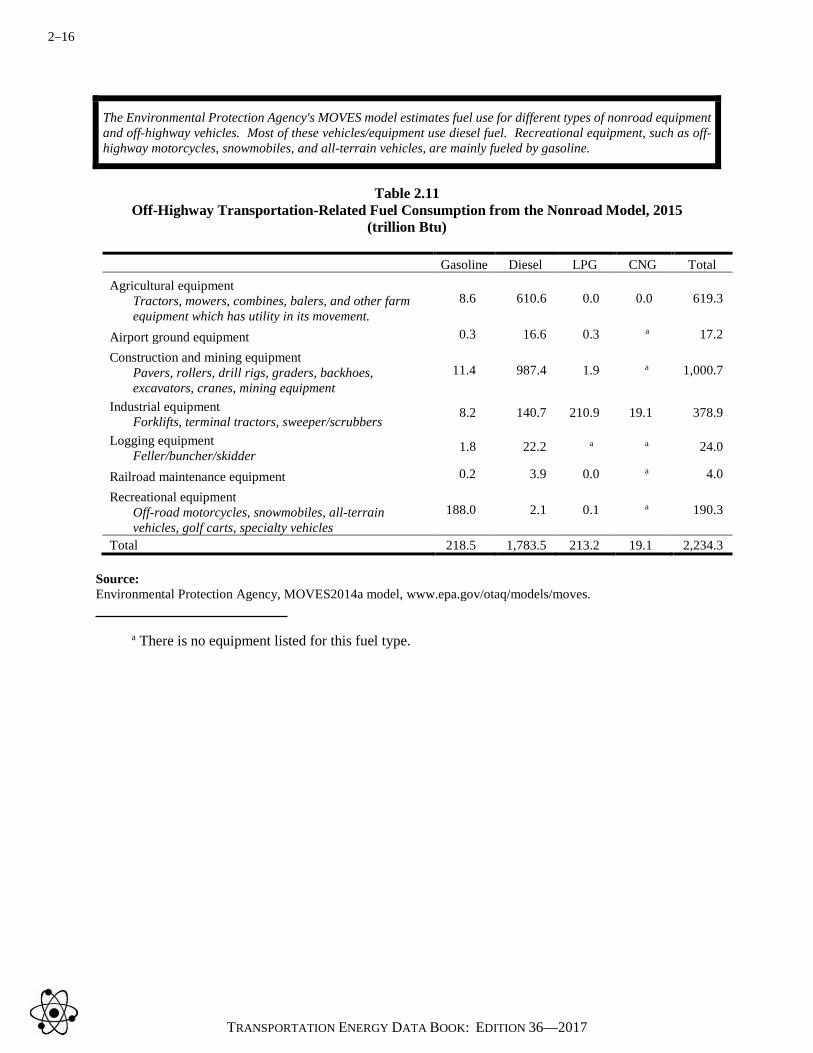
2–16
TRANSPORTATION ENERGY DATA BOOK: EDITION 36—2017
The Environmental Protection Agency's MOVES model estimates fuel use for different types of nonroad equipment and off-highway vehicles. Most of these vehicles/equipment use diesel fuel. Recreational equipment, such as off-highway motorcycles, snowmobiles, and all-terrain vehicles, are mainly fueled by gasoline.
Table 2.11
Off-Highway Transportation-Related Fuel Consumption from the Nonroad Model, 2015 (trillion Btu)
Gasoline Diesel LPG CNG Total Agricultural equipment
Tractors, mowers, combines, balers, and other farm equipment which has utility in its movement.
8.6 610.6 0.0 0.0 619.3
Airport ground equipment 0.3 16.6 0.3 a 17.2
Construction and mining equipment Pavers, rollers, drill rigs, graders, backhoes, excavators, cranes, mining equipment
11.4 987.4 1.9 a 1,000.7
Industrial equipment Forklifts, terminal tractors, sweeper/scrubbers
8.2 140.7 210.9 19.1 378.9
Logging equipment Feller/buncher/skidder
1.8 22.2 a a 24.0
Railroad maintenance equipment 0.2 3.9 0.0 a 4.0
Recreational equipment Off-road motorcycles, snowmobiles, all-terrain vehicles, golf carts, specialty vehicles
188.0 2.1 0.1 a 190.3
Total 218.5 1,783.5 213.2 19.1 2,234.3 Source: Environmental Protection Agency, MOVES2014a model, www.epa.gov/otaq/models/moves. a There is no equipment listed for this fuel type.
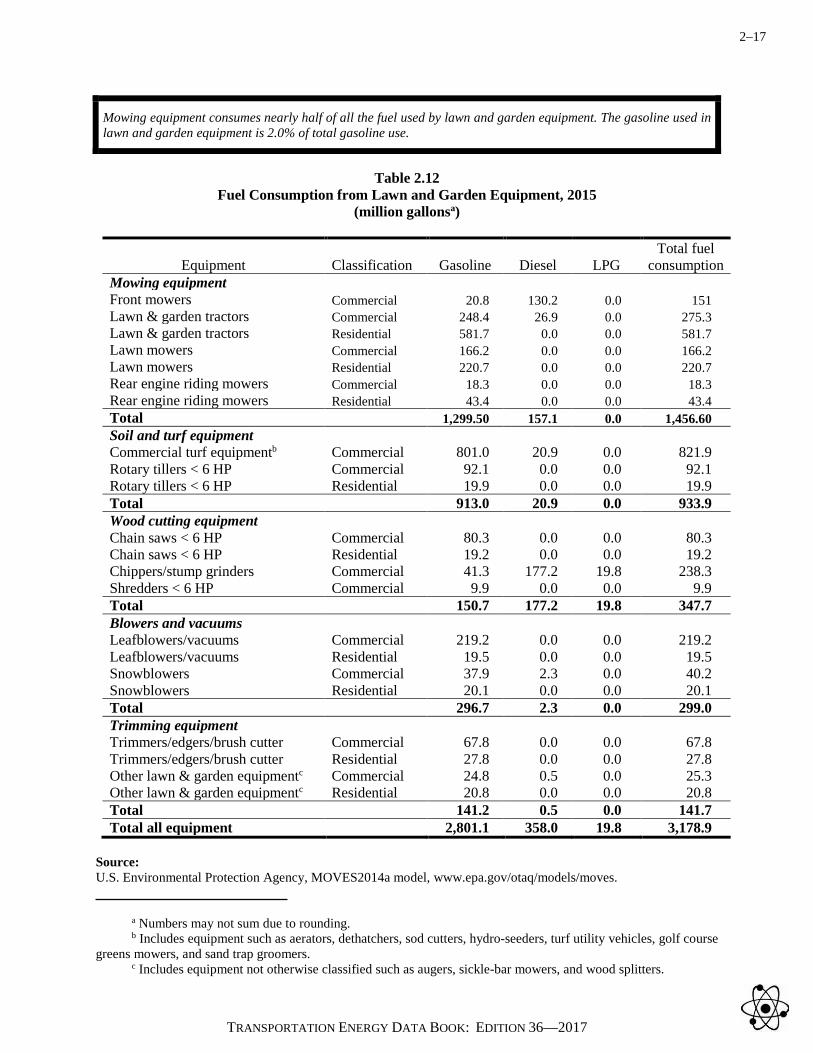
2–17
TRANSPORTATION ENERGY DATA BOOK: EDITION 36—2017
Mowing equipment consumes nearly half of all the fuel used by lawn and garden equipment. The gasoline used in lawn and garden equipment is 2.0% of total gasoline use.
Table 2.12
Fuel Consumption from Lawn and Garden Equipment, 2015 (million gallonsa)
Total fuel
Equipment Classification Gasoline Diesel LPG consumption Mowing equipment Front mowers Commercial 20.8 130.2 0.0 151 Lawn & garden tractors Commercial 248.4 26.9 0.0 275.3 Lawn & garden tractors Residential 581.7 0.0 0.0 581.7 Lawn mowers Commercial 166.2 0.0 0.0 166.2 Lawn mowers Residential 220.7 0.0 0.0 220.7 Rear engine riding mowers Commercial 18.3 0.0 0.0 18.3 Rear engine riding mowers Residential 43.4 0.0 0.0 43.4 Total 1,299.50 157.1 0.0 1,456.60 Soil and turf equipment Commercial turf equipmentb Commercial 801.0 20.9 0.0 821.9 Rotary tillers < 6 HP Commercial 92.1 0.0 0.0 92.1 Rotary tillers < 6 HP Residential 19.9 0.0 0.0 19.9 Total 913.0 20.9 0.0 933.9 Wood cutting equipment Chain saws < 6 HP Commercial 80.3 0.0 0.0 80.3 Chain saws < 6 HP Residential 19.2 0.0 0.0 19.2 Chippers/stump grinders Commercial 41.3 177.2 19.8 238.3 Shredders < 6 HP Commercial 9.9 0.0 0.0 9.9 Total 150.7 177.2 19.8 347.7 Blowers and vacuums Leafblowers/vacuums Commercial 219.2 0.0 0.0 219.2 Leafblowers/vacuums Residential 19.5 0.0 0.0 19.5 Snowblowers Commercial 37.9 2.3 0.0 40.2 Snowblowers Residential 20.1 0.0 0.0 20.1 Total 296.7 2.3 0.0 299.0 Trimming equipment Trimmers/edgers/brush cutter Commercial 67.8 0.0 0.0 67.8 Trimmers/edgers/brush cutter Residential 27.8 0.0 0.0 27.8 Other lawn & garden equipmentc Commercial 24.8 0.5 0.0 25.3 Other lawn & garden equipmentc Residential 20.8 0.0 0.0 20.8 Total 141.2 0.5 0.0 141.7 Total all equipment 2,801.1 358.0 19.8 3,178.9
Source: U.S. Environmental Protection Agency, MOVES2014a model, www.epa.gov/otaq/models/moves. a Numbers may not sum due to rounding. b Includes equipment such as aerators, dethatchers, sod cutters, hydro-seeders, turf utility vehicles, golf course greens mowers, and sand trap groomers. c Includes equipment not otherwise classified such as augers, sickle-bar mowers, and wood splitters.

2–18
TRANSPORTATION ENERGY DATA BOOK: EDITION 36—2017
The Federal Highway Administration (FHWA) cautions that data from 1993 on may not be directly comparable to earlier years. Some states have improved reporting procedures in recent years, and the estimation procedures were revised in 1994. The FHWA no longer publishes separate estimates of gasohol or ethanol used in gasohol.
Table 2.13
Highway Usage of Gasoline and Diesel, 1973–2015 (billion gallons)
Year Total gasoline and gasohol Diesela Percent diesel Total highway fuel use 1973 100.6 9.8 8.9% 110.5 1975 99.4 9.6 8.8% 109.0 1980 101.2 13.8 12.0% 115.0 1981 99.6 14.9 13.0% 114.5 1982 98.5 14.9 13.1% 113.4 1983 100.1 16.0 13.8% 116.1 1984 101.4 17.3 14.6% 118.7 1985 103.6 17.8 14.6% 121.3 1986 106.8 18.4 14.7% 125.2 1987 108.7 19.0 14.9% 127.7 1988 109.8 20.1 15.5% 129.9 1989 110.6 21.2 16.1% 131.9 1990 110.2 21.4 16.3% 131.6 1991 107.9 20.7 16.1% 128.6 1992 111.0 22.0 16.5% 132.9 1993 113.7 23.5 17.1% 137.2 1994 115.0 25.1 17.9% 140.1 1995 117.1 26.2 18.3% 143.3 1996 119.5 27.2 18.5% 146.7 1997 120.9 29.4 19.6% 150.3 1998 124.7 30.2 19.5% 154.9 1999 128.7 31.9 19.9% 160.7 2000 128.9 33.4 20.6% 162.3 2001 129.7 33.4 20.5% 163.1 2002 133.0 34.8 20.7% 167.8 2003 134.1 35.5 20.9% 169.6 2004 136.5 37.4 21.5% 173.9 2005 135.2 39.1 22.4% 174.3 2006 134.8 40.1 22.9% 174.9 2007 135.4 40.7 23.1% 176.1 2008 132.2 38.6 22.6% 170.8 2009 132.9 35.3 21.0% 168.1 2010 133.1 36.6 21.6% 169.7 2011 131.5 37.1 22.0% 168.6 2012 130.9 37.4 22.2% 168.3 2013 131.3 38.4 22.6% 169.7 2014 136.5 39.7 22.5% 176.2 2015 132.2 40.6 23.5% 172.9
Average annual percentage change 1973–2015 0.7% 3.4% 1.1% 2005–2015 -0.2% 0.4% -0.1%
Source: U.S. Department of Transportation, Federal Highway Administration, Highway Statistics 2015, Washington, DC,
2016, Table MF-21 and annual. (Additional resources: www.fhwa.dot.gov) a Consists primarily of diesel fuel, with small quantities of other fuels, such as liquefied petroleum gas and E85.

2–19
TRANSPORTATION ENERGY DATA BOOK: EDITION 36—2017
Great care should be taken when comparing modal energy intensity data among modes. Because of the inherent differences among the transportation modes in the nature of services, routes available, and many additional factors, it is not possible to obtain truly comparable national energy intensities among modes. These values are averages, and there is a great deal of variability even within a mode.
Table 2.14
Passenger Travel and Energy Use, 2015 a
Energy intensities
Number of vehicles
(thousands)
Vehicle-miles
(millions)
Passenger-miles
(millions)
Load factor (persons/ vehicle)
(Btu per vehicle-
mile)
(Btu per passenger-
mile) Energy use
(trillion Btu) Cars 112,864.0 1,445,400 2,240,370 1.60 4,702 3,034 6,796.5 Personal trucks 113,054.6 1,123,226 2,066,736 1.80 6,156 3,345 6,870.1 Motorcycles 8,601.0 19,606 22,743 1.20 2,855 2,462 56.0 Demand responseb 71.4 1,595 2,267 1.4 20,047 14,106 32.0 Buses c c c c c c 202.7 Transit 64.2 2,216 20,239 9.1 36,760 4,025 81.5 Intercityd c c c c c c 35.1 Schoold 628.1 c c c c c 86.1 Air c c c c c c 1,684.3 Certificated routee c 5,589 632,648 113.2 263,971 2,332 1,475.4 General aviation 210.0 c c c c c 208.9 Recreational boats 13,915.6 c c c c c 246.0 Rail 20.5 1,496 39,050 26.1 30,972 1,187 46.3 Intercity (Amtrak) 0.4 319 6,536 20.5 34,034 1,663 10.9 Transit 12.8 803 20,710 25.8 20.022 776 16.1 Commuter 7.3 374 11,804 31.6 51,888 1,643 19.4
Source: See Appendix A, Section 3. Passenger Travel and Energy Use. a Only end-use energy was counted for electricity. Previous editions included primary energy use for electricity which included generation and distribution losses. b Demand response data are for 2014. Includes passenger cars, vans, and small buses operating in response to calls from passengers to the transit operator who dispatches the vehicles. c Data are not available. d Energy use is estimated. e Only domestic service and domestic energy use are shown on this table. (Previous editions included half of international energy.) These energy intensities may be inflated because all energy use is attributed to passengers–cargo energy use is not taken into account.

2–20
TRANSPORTATION ENERGY DATA BOOK: EDITION 36—2017
Great care should be taken when comparing modal energy intensity data among modes. Because of the inherent differences among the transportation modes in the nature of services, routes available, and many additional factors, it is not possible to obtain truly comparable national energy intensities among modes. These values are averages, and there is a great deal of variability even within a mode.
Table 2.15
Energy Intensities of Highway Passenger Modes, 1970–2015
Cars Light truckb Transit Busesc (Btu per (Btu per (Btu per (Btu per (Btu per
Year vehicle-mile) passenger-mile) vehicle-mile) vehicle-mile) passenger-mile) 1970 9,250 4,868 12,479 31,796 2,472 1975 8,993 4,733 11,879 33,748 2,814 1980 7,916 4,279 10,224 36,553 2,813 1985 7,164 4,110 8,730 38,876 3,423 1986 7,194 4,197 8,560 37,889 3,545 1987 6,959 4,128 8,359 36,247 3,594 1988 6,683 4,033 8,119 36,673 3,706 1989 6,589 4,046 7,746 36,754 3,732 1990 6,169 3,856 7,746 37,374 3,794 1991 5,912 3,695 7,351 37,732 3,877 1992 5,956 3,723 7,239 40,243 4,310 1993 6,087 3,804 7,182 39,043 4,262 1994 6,024 3,765 7,212 36,932 4,225 1995 5,902 3,689 7,208 36,936 4,271 1996 5,874 3,683 7,247 37,238 4,315 1997 5,797 3,646 7,251 38,622 4,407 1998 5,767 3,638 7,260 41,062 4,374 1999 5,821 3,684 7,327 40,351 4,320 2000 5,687 3,611 7,158 41,466 4,506 2001 5,626 3,583 7,080 38,320 4,123 2002 5,662 3,607 7,125 37,340 4,110 2003 5,535 3,525 7,673 36,900 4,191 2004 5,489 3,496 7,653 37,665 4,342 2005 5,607 3,571 7,009 37,244 4,229 2006 5,511 3,510 6,974 39,397 4,297 2007 5,513 3,512 6,904 39,748 4,352 2008 5,466 3,526 6,830 39,726 4,328 2009 5,239 3,380 7,158 39,073 4,233 2010 5,117 3,301 6,919 35,858 4,107 2011 5,032 3,246 6,795 37,648 4,232 2012 4,949 3,193 6,674 37,037 4,023 2013 4,873 3,144 6,557 37,273 4,052 2014 4,839 3,122 6,677 35,237 3,810 2015 4,702 3,034 6,256 36,760 4,025
Average annual percentage change 1970–2015 -1.5% -1.0% -1.5% 0.3% 1.1% 2005–2015 -1.7% -1.6% -1.2% -0.1% -0.5%
Source: See Appendix A, Section 4. Highway Passenger Mode Energy Intensities. a Only end-use energy was counted for electricity. Previous editions included primary energy use for electricity which included generation and distribution losses. b All two-axle, four-tire trucks. c Series not continuous between 1983 and 1984 because of a change in data source by the American Public Transportation Association (APTA).

2–21
TRANSPORTATION ENERGY DATA BOOK: EDITION 36—2017
Great care should be taken when comparing modal energy intensity data among modes. Because of the inherent differences between the transportation modes in the nature of services, routes available, and many additional factors, it is not possible to obtain truly comparable national energy intensities among modes.
Table 2.16
Energy Intensities of Nonhighway Passenger Modes, 1970–2015a
Air Rail
Year
Certificated air carriersb (Btu per
passenger-mile)
Intercity Amtrak (Btu per
passenger-mile)
Rail transit (Btu per
passenger-mile)
Commuter rail (Btu per
passenger-mile) 1970 10,115 c 712 c 1975 7,625 3,311 866 c 1980 5,561 2,859 763 c 1981 5,774 2,414 855 c 1982 5,412 2,551 891 c 1983 5,133 2,359 931 c 1984 5,298 2,417 1,002 1,798 1985 5,053 2,237 927 1,720 1986 5,011 2,037 1,004 1,720 1987 4,827 1,989 1,003 1,628 1988 4,861 1,967 1,014 1,666 1989 4,844 2,082 960 1,622 1990 4,797 2,052 998 1,622 1991 4,602 2,011 1,074 1,601 1992 4,455 2,117 1,041 1,565 1993 4,490 2,142 1,113 1,782 1994 4,407 1,917 1,102 1,605 1995 4,349 2,071 1,102 1,580 1996 4,199 2,194 996 1,541 1997 4,173 2,289 943 1,630 1998 3,987 2,246 931 1,612 1999 4,108 2,362 919 1,670 2000 3,960 2,651 923 1,542 2001 3,943 2,690 925 1,533 2002 3,718 2,537 948 1,542 2003 3,614 2,145 936 1,542 2004 3,505 2,068 907 1,536 2005 3,346 2,025 919 1,658 2006 3,250 1,948 893 1,539 2007 3,153 1,824 851 1,543 2008 3,055 1,745 832 1,579 2009 2,901 1,773 830 1,714 2010 2,825 1,668 832 1,753 2011 2,772 1,628 812 1,681 2012 2,633 1,561 791 1,703 2013 2,568 1,559 793 1,676 2014 2,511 1,641 786 1,638 2015 2,477 1,663 776 1,643
Average annual percentage changed 1970–2015 -3.1% -1.7% 0.2% -0.3% 2005–2015 -3.0% -2.0% -1.7% -0.1%
Source: See Appendix A, Section 5. Nonhighway Passenger Mode Energy Intensities. a Only end-use energy was counted for electricity. Previous editions included primary energy use for electricity which included generation and distribution losses. b These data differ from the data on Table 2.14 because they include half of international services. These energy intensities may be inflated because all energy use is attributed to passengers–cargo energy use is not taken into account. c Data are not available. d Average annual percentage calculated to earliest year possible.

2–22
TRANSPORTATION ENERGY DATA BOOK: EDITION 36—2017
The energy intensity of light rail systems, measured in Btu per passenger-mile varies greatly. The weighted average of all light rail systems in 2015 is 3,823 Btu/passenger-mile.
Figure 2.7. Energy Intensity of Light Rail Transit Systemsa, 2015
Source: U.S. Department of Transportation, National Transit Database, August 2017. (Additional resources:
www.transit.dot.gov/ntd) a Typically an electric railway with a light volume traffic capacity with power drawn from an overhead electric line. Only end-use energy was counted for electricity. Previous editions included primary energy use for electricity which included generation and distribution losses.

2–23
TRANSPORTATION ENERGY DATA BOOK: EDITION 36—2017
Figure 2.8. Energy Intensity of Heavy Rail Systemsa, 2015
Source: U.S. Department of Transportation, National Transit Database, August 2017. (Additional resources:
www.transit.dot.gov/ntd)
Figure 2.9. Energy Intensity of Commuter Rail Systemsb, 2015
Note: Does not include systems classified as hybrid rail. Source: U.S. Department of Transportation, 2015 National Transit Database, August 2017. (Additional resources:
www.transit.dot.gov/ntd) a An electric railway with the capacity for a heavy volume of traffic. Only end-use energy was counted for electricity. Previous editions included primary energy use for electricity which included generation and distribution losses. b Electric car or diesel-propelled railway for urban passenger train service between a central city and adjacent suburbs. Only end-use energy was counted for electricity. Previous editions included primary energy use for electricity which included generation and distribution losses.
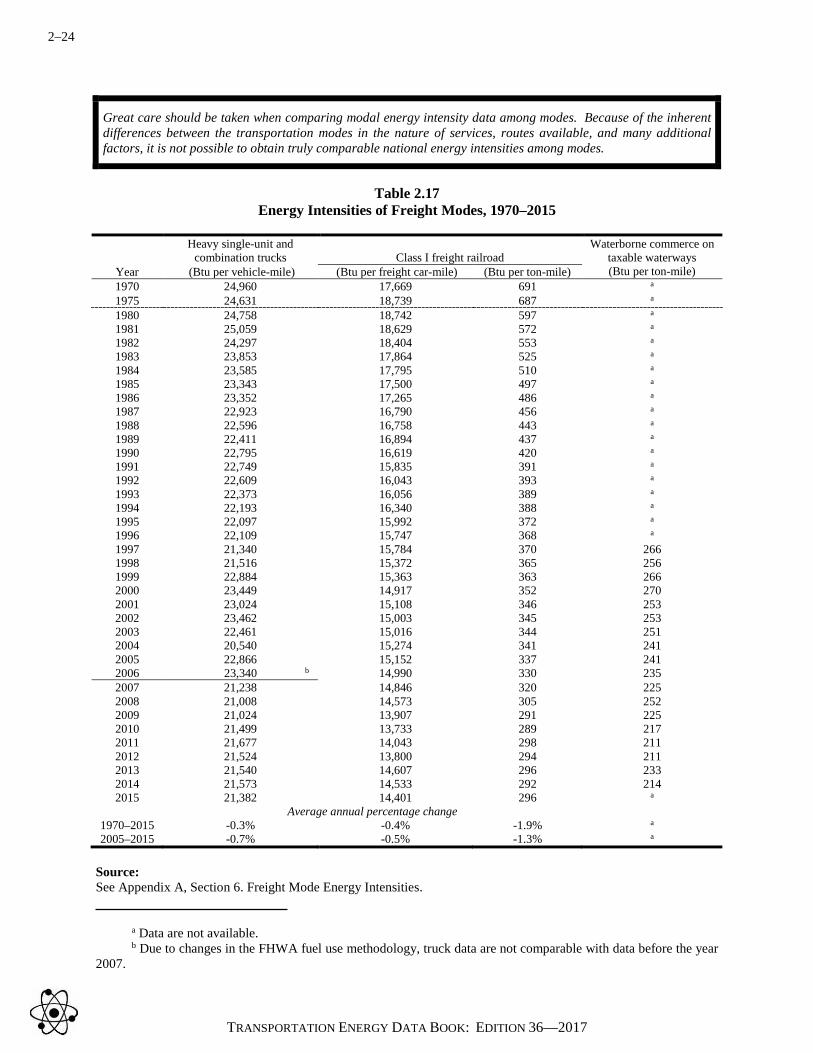
2–24
TRANSPORTATION ENERGY DATA BOOK: EDITION 36—2017
Great care should be taken when comparing modal energy intensity data among modes. Because of the inherent differences between the transportation modes in the nature of services, routes available, and many additional factors, it is not possible to obtain truly comparable national energy intensities among modes.
Table 2.17
Energy Intensities of Freight Modes, 1970–2015
Heavy single-unit and
combination trucks Class I freight railroad Waterborne commerce on
taxable waterways (Btu per ton-mile) Year (Btu per vehicle-mile) (Btu per freight car-mile) (Btu per ton-mile)
1970 24,960 17,669 691 a
1975 24,631 18,739 687 a
1980 24,758 18,742 597 a
1981 25,059 18,629 572 a
1982 24,297 18,404 553 a
1983 23,853 17,864 525 a
1984 23,585 17,795 510 a
1985 23,343 17,500 497 a
1986 23,352 17,265 486 a
1987 22,923 16,790 456 a
1988 22,596 16,758 443 a
1989 22,411 16,894 437 a
1990 22,795 16,619 420 a
1991 22,749 15,835 391 a
1992 22,609 16,043 393 a
1993 22,373 16,056 389 a
1994 22,193 16,340 388 a
1995 22,097 15,992 372 a
1996 22,109 15,747 368 a
1997 21,340 15,784 370 266 1998 21,516 15,372 365 256 1999 22,884 15,363 363 266 2000 23,449 14,917 352 270 2001 23,024 15,108 346 253 2002 23,462 15,003 345 253 2003 22,461 15,016 344 251 2004 20,540 15,274 341 241 2005 22,866 15,152 337 241 2006 23,340 b 14,990 330 235 2007 21,238 14,846 320 225 2008 21,008 14,573 305 252 2009 21,024 13,907 291 225 2010 21,499 13,733 289 217 2011 21,677 14,043 298 211 2012 21,524 13,800 294 211 2013 21,540 14,607 296 233 2014 21,573 14,533 292 214 2015 21,382 14,401 296 a
Average annual percentage change 1970–2015 -0.3% -0.4% -1.9% a 2005–2015 -0.7% -0.5% -1.3% a
Source: See Appendix A, Section 6. Freight Mode Energy Intensities. a Data are not available. b Due to changes in the FHWA fuel use methodology, truck data are not comparable with data before the year 2007.
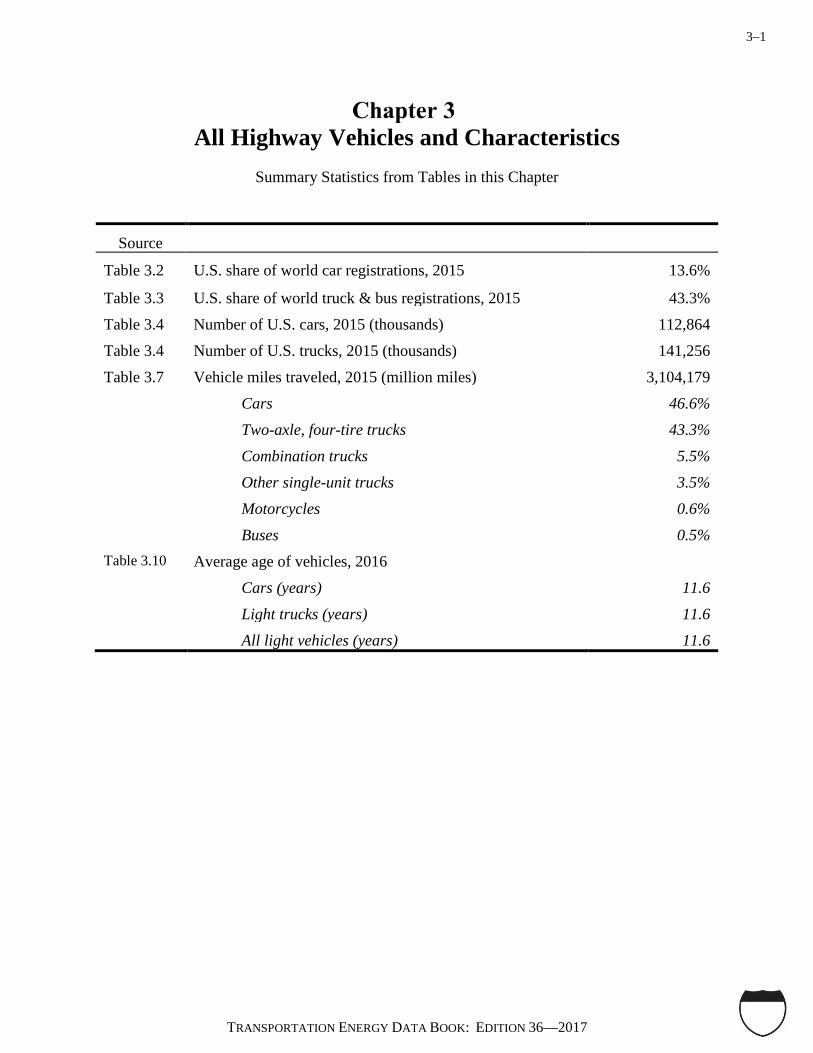
3–1
TRANSPORTATION ENERGY DATA BOOK: EDITION 36—2017
All Highway Vehicles and Characteristics
Summary Statistics from Tables in this Chapter
Source
Table 3.2 U.S. share of world car registrations, 2015 13.6%
Table 3.3 U.S. share of world truck & bus registrations, 2015 43.3% Table 3.4 Number of U.S. cars, 2015 (thousands) 112,864 Table 3.4 Number of U.S. trucks, 2015 (thousands) 141,256 Table 3.7 Vehicle miles traveled, 2015 (million miles) 3,104,179 Cars 46.6% Two-axle, four-tire trucks 43.3% Combination trucks 5.5% Other single-unit trucks 3.5% Motorcycles 0.6% Buses 0.5% Table 3.10 Average age of vehicles, 2016 Cars (years) 11.6 Light trucks (years) 11.6 All light vehicles (years) 11.6
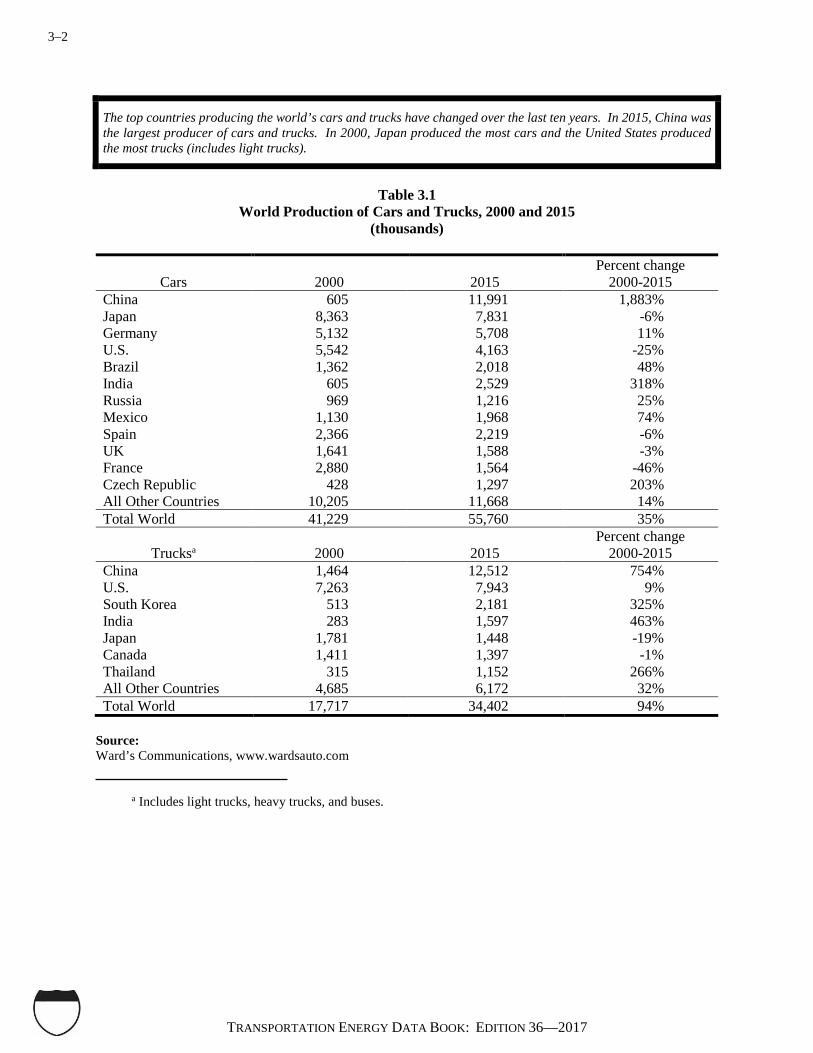
3–2
TRANSPORTATION ENERGY DATA BOOK: EDITION 36—2017
The top countries producing the world’s cars and trucks have changed over the last ten years. In 2015, China was the largest producer of cars and trucks. In 2000, Japan produced the most cars and the United States produced the most trucks (includes light trucks).
Table 3.1
World Production of Cars and Trucks, 2000 and 2015 (thousands)
Cars 2000 2015 Percent change
2000-2015 China 605 11,991 1,883% Japan 8,363 7,831 -6% Germany 5,132 5,708 11% U.S. 5,542 4,163 -25% Brazil 1,362 2,018 48% India 605 2,529 318% Russia 969 1,216 25% Mexico 1,130 1,968 74% Spain 2,366 2,219 -6% UK 1,641 1,588 -3% France 2,880 1,564 -46% Czech Republic 428 1,297 203% All Other Countries 10,205 11,668 14% Total World 41,229 55,760 35%
Trucksa 2000 2015 Percent change
2000-2015 China 1,464 12,512 754% U.S. 7,263 7,943 9% South Korea 513 2,181 325% India 283 1,597 463% Japan 1,781 1,448 -19% Canada 1,411 1,397 -1% Thailand 315 1,152 266% All Other Countries 4,685 6,172 32% Total World 17,717 34,402 94%
Source: Ward’s Communications, www.wardsauto.com a Includes light trucks, heavy trucks, and buses.
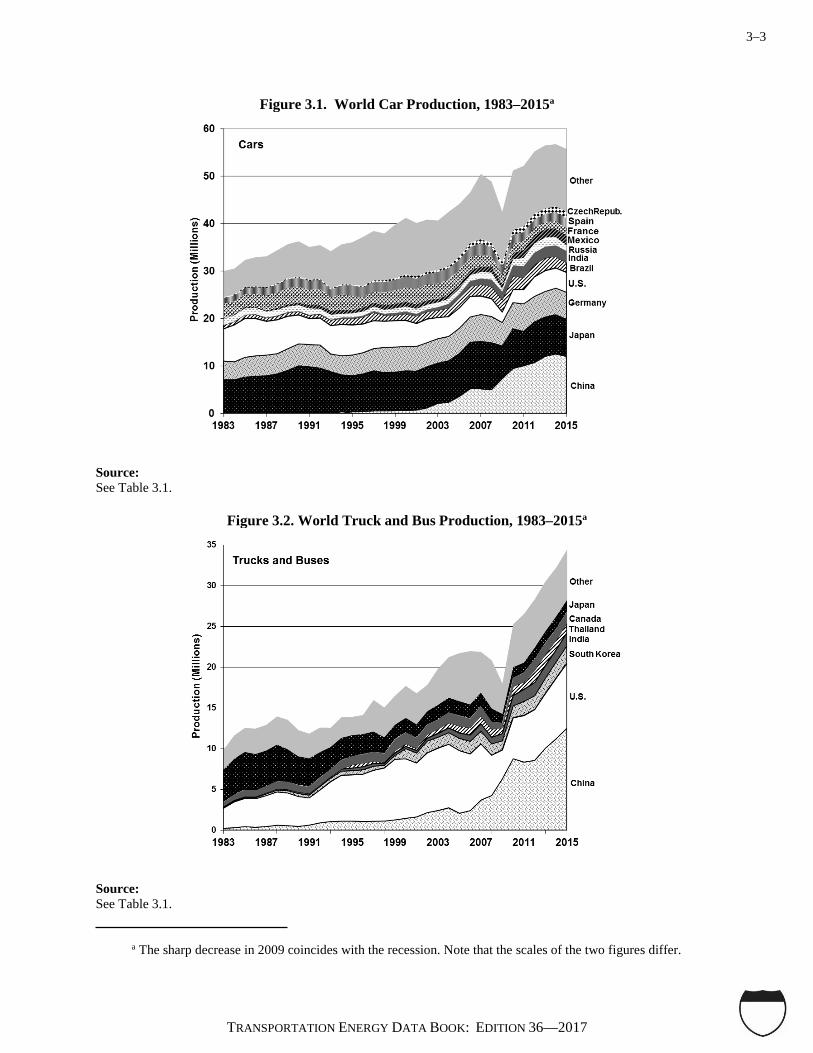
3–3
TRANSPORTATION ENERGY DATA BOOK: EDITION 36—2017
Figure 3.1. World Car Production, 1983–2015a
Source: See Table 3.1.
Figure 3.2. World Truck and Bus Production, 1983–2015a
Source: See Table 3.1. a The sharp decrease in 2009 coincides with the recession. Note that the scales of the two figures differ.

3–4
TRANSPORTATION ENERGY DATA BOOK: EDITION 36—2017
Use caution comparing historical data because of disconnects in data series. Also, the United States is unique in how many light trucks (SUVs, minivans, pickups) are used for personal travel. Those light trucks are not included on this table. The U.S. share of world cars continues to decline. The growth in the World total comes mainly from developing countries, like China, Indonesia, India, and South Korea.
Table 3.2
Car Registrations for Selected Countries, 1960–2015 (thousands)
Average annual
percentage change
Country 1960 1970 1980 1990 2000 2005 2010 2014 2015 1990-2015 Argentina 474 1,482 3,112 4,284 5,060 5,340 7,605 10,092 11,003 3.8%
Brazil a a a 12,127 15,393 18,370 25,541 32,715 33,566 4.2%
Canadab 4,104 6,602 10,256 12,622 16,832 18,124 20,121 21,730 22,068 2.3%
China a a 351 1,897 3,750 8,900 34,430 120,724 135,119 18.6%
France 4,950 11,860 18,440 23,550 28,060 30,100 31,300 31,800 32,000 1.2%
Germanyc 4,856 14,376 23,236 35,512 43,772 46,090 42,302 44,403 45,071 1.0%
India a a a 2,300 5,150 7,654 13,300 27,174 30,570 10.9%
Indonesia a a a 1,200 a 3,850 8,891 12,595 13,846 10.3%
Japan 457 8,779 23,660 34,924 52,437 57,091 58,347 60,668 61,873 2.3%
Malaysia a a a 1,811 4,213 6,402 9,115 11,149 11,279 7.6%
Pakistan a a a 738 375 411 1,726 2,316 2,470 5.0%
Russia a a a a 20,353 25,285 34,350 40,850 41,000 4.8%d
South Korea a a a 2,075 8,084 11,122 13,632 15,747 16,561 8.7% United Kingdom 5,650 11,802 15,438 22,528 27,185 30,652 31,258 32,613 33,542
1.6%
United States 61,671 89,244 121,601 143,550 127,721 132,909 129,053 120,984 126,014 -0.5% U.S. percentage of world 62.7% 46.1% 38.0% 32.3% 23.3% 21.5% 17.8% 13.7% 13.6%
World total 98,305 193,479 320,390 444,900 548,558 617,914 723,567 884,506 923,590 3.0%
Source: Ward’s Communications, www.wardsauto.com. a Data are not available. b Data from 2000 and later are not comparable to prior data. Canada reclassified autos and trucks prior to 2000. c Data for 1990 and prior include West Germany only. Kraftwagen are included with automobiles. d Data for earliest year available.

3–5
TRANSPORTATION ENERGY DATA BOOK: EDITION 36—2017
The United States totals include SUVs, minivans, and light trucks, many of which are used for personal travel. Thus, countries that only use trucks for freight movement will not be comparable to the United States.
Table 3.3
Truck and Bus Registrations for Selected Countries, 1960–2015 (thousands)
Average annual
percentage change
Country 1960 1970 1980 1990 2000 2005 2010 2015 1990-2015 Argentina 392 788 1,217 1,501 1,554 1,730 2,511 3,305 3.2% Brazil a a a 936 3,917 4,653 6,524 8,959 9.5% Canadab 1,056 1,481 2,955 3,931 739 786 933 1,147 -4.8% China a a 1,480 4,314 9,650 21,750 43,590 23,191 7.0% France 1,650 1,850 2,550 4,910 5,733 6,198 6,444 6,652 1.2% Germanyc 786 1,228 1,617 2,764 3,534 3,133 2,960 3,356 0.8% India a a a 2,050 2,390 4,145 9,500 11,230 7.0% Indonesia a a a 1,391 2,373 2,950 6,938 9,237 7.9% Japan 896 8,803 14,197 22,773 20,211 16,734 15,512 14,981 -1.7% Malaysia a a a 616 1,030 1,323 1,138 1,335 3.1% Pakistan a a a 172 385 414 538 678 5.6% Russia a a a 7,200 5,041 5,705 6,304 8,000 0.4% South Korea a a a 1,320 3,956 4,275 4,310 4,428 5.0% United Kingdom 1,534 1,769 1,920 3,774 3,361 3,943 4,220 4,677 0.9% United States 12,186 19,175 34,195 45,106 85,579 104,788 119,179 146,154 4.8% U.S. percentage of world 42.6% 36.2% 37.7% 32.7% 42.1% 42.6% 38.5% 43.3% World total 28,583 52,899 90,592 138,082 203,272 245,798 309,395 337,250 3.6%
Source: Ward’s Communications, www.wardsauto.com. a Data are not available. b Data from 2000 and later are not comparable to prior data. Canada reclassified autos and trucks prior to 2000. c Data for 1990 and prior include West Germany only. Kraftwagen are included with automobiles.
3–6
TRANSPORTATION ENERGY DATA BOOK: EDITION 36—2017
VEHICLES IN USE Both the Federal Highway Administration (FHWA) and IHS Automotive report figures on the car and
truck population each year. The two estimates, however, differ by as much as 11.2% (1981). The
differences can be attributed to several factors:
• The FHWA data include all vehicles which have been registered at any time throughout the
calendar year. Therefore, the data include vehicles which were retired during the year and may
double count vehicles which have been registered in different states or the same states to different
owners. IHS Automotive data include only those vehicles which are registered on July 1 of the
given year.
• The classification of mini-vans, station wagons on truck chassis, and utility vehicles as cars or
trucks causes important differences in the two estimates. IHS Automotive data included passenger
vans in the car count until 1980; since 1980 all vans have been counted as trucks.
• Starting in 1993, the FHWA reclassified some minivans and sport utility vehicles into the truck
category which were previously included with cars. This change produced a dramatic change in the
individual percentage differences of cars and trucks. The difference in total vehicles has been less
than 5% each year since 1990 and does not appear to be significantly affected by the FHWA
reclassifications. Beginning with 2009, the FHWA discontinued the car/2-axle, 4-tire truck
designations on Table VM-1. The data since 2009 come from Tables MV-1 and MV-9.
• The FHWA data include all non-military Federal vehicles, while IHS Automotive data include only
those Federal vehicles which are registered within a state. Federal vehicles are not required to have
State registrations, and, according to the General Services Administration, most Federal vehicles
are not registered.
• In 2012 both IHS Automotive and FHWA changed their methodologies for the car/light truck
split which created a significant decrease in the number of cars reported and a corresponding
increase in the number of light trucks.

3–7
TRANSPORTATION ENERGY DATA BOOK: EDITION 36—2017
In the early 1980's, researchers had to make a conscious choice of which data series to use, since they differed by as much as 11%. In 2005 the two sources differed by less than 1%. Both sources changed their methodologies for the car/light truck split causing significant decreases to the number of cars in 2012.
Table 3.4
U.S. Cars and Trucks in Use, 1970–2015 (thousands)
Cars Trucks Total
Year FHWA IHS
Automotive Percentage difference FHWA
IHS Automotive
Percentage difference FHWA
IHS Automotive
Percentage difference
1970 89,243 80,448 10.9% 18,797 17,688 6.3% 108,040 98,136 10.1% 1975 106,706 95,241 12.0% 25,781 24,813 3.9% 132,487 120,054 10.4% 1980 121,601 104,564 16.3% 33,667 35,268 -4.5% 155,267 139,832 11.0% 1981 123,098 105,839 16.3% 34,644 36,069 -4.0% 157,743 141,908 11.2% 1982 123,702 106,867 15.8% 35,382 36,987 -4.3% 159,084 143,854 10.6% 1983 126,444 108,961 16.0% 36,723 38,143 -3.7% 163,166 147,104 10.9% 1984 128,158 112,019 14.4% 37,507 40,143 -6.6% 165,665 152,162 8.9% 1985 127,885 114,662 11.5% 43,210 42,387 1.9% 171,095 157,049 8.9% 1986 130,004 117,268 10.9% 45,103 44,826 0.6% 175,106 162,094 8.0% 1987 131,482 119,849 9.7% 46,826 47,344 -1.1% 178,308 167,193 6.6% 1988 133,836 121,519 10.1% 49,941 50,221 -0.6% 183,777 171,740 7.0% 1989 134,559 122,758 9.6% 52,172 53,202 -1.9% 186,731 175,960 6.1% 1990 133,700 123,276 8.5% 54,470 56,023 -2.8% 188,171 179,299 4.9% 1991 128,300 123,268 4.1% 59,206 58,179 1.8% 187,505 181,447 3.3% 1992 126,581 120,347 5.2% 63,136 61,172 3.2% 189,717 181,519 4.5% 1993 127,327 121,055 5.2% 66,082 65,260 1.3% 193,409 186,315 3.8% 1994 127,883 121,997 4.8% 69,491 66,717 4.2% 197,375 188,714 4.6% 1995 128,387 123,242 4.2% 72,458 70,199 3.2% 200,845 193,441 3.8% 1996 129,728 124,613 4.1% 75,940 73,681 3.1% 205,669 198,294 3.7% 1997 129,749 124,673 4.1% 77,307 76,398 1.2% 207,056 201,071 3.0% 1998 131,839 125,966 4.7% 79,062 79,077 0.0% 210,901 205,043 2.9% 1999 132,432 126,869 4.4% 83,148 82,640 0.6% 215,580 209,509 2.9% 2000 133,621 127,721 4.6% 87,108 85,579 1.8% 220,729 213,300 3.5% 2001 137,633 128,714 6.9% 92,045 87,969 4.6% 229,678 216,683 6.0% 2002 135,921 129,907 4.6% 92,939 91,120 2.0% 228,860 221,027 3.5% 2003 135,670 131,072 3.5% 94,944 94,810 0.1% 230,614 225,882 2.1% 2004 136,431 132,469 3.0% 100,016 99,698 0.3% 236,447 232,167 1.8% 2005 136,568 132,909 2.8% 103,819 105,475 -1.6% 240,387 238,384 0.8% 2006 135,400 135,047 0.3% 107,944 109,596 -1.5% 243,344 244,643 -0.5% 2007 135,933 135,222 0.5% 110,498 113,479 -2.6% 246,431 248,701 -0.9% 2008 137,080 135,882 0.9% 110,242 113,931 -3.2% 247,322 249,813 -1.0% 2009 134,880 132,500 1.8% 110,561 116,472 -5.1% 245,441 248,972 -1.4% 2010 130,892 129,053 1.4% 110,322 119,179 -7.4% 241,214 248,232 -2.8% 2011 125,657 127,577 -1.5% 118,483 121,355 -2.4% 244,140 248,932 -1.9% 2012 111,290 120,902 -8.0% 133,130 130,595 1.9% 244,420 251,497 -2.8% 2013 113,676 120,214 -5.4% 132,931 132,501 0.3% 246,607 252,715 -2.4% 2014 113,899 120,984 -5.9% 137,531 137,043 0.4% 251,430 258,027 -2.6% 2015 112,864 122,322 -7.7% 141,256 141,872 -0.4% 254,120 264,194 -3.8%
Source: FHWA - U.S. Department of Transportation, Federal Highway Administration, 1970-2008, Highway Statistics 2008
and earlier, Washington, DC, 2009, Table VM-1 and annual. 2009-2015 data from Tables MV-1 and MV-9, Highway Statistics 2015. (Additional resources: www.fhwa.dot.gov)
IHS Automotive - IHS Automotive, Detroit, Michigan. FURTHER REPRODUCTION PROHIBITED. (Additional resources: https://www.ihs.com/industry/automotive.html)
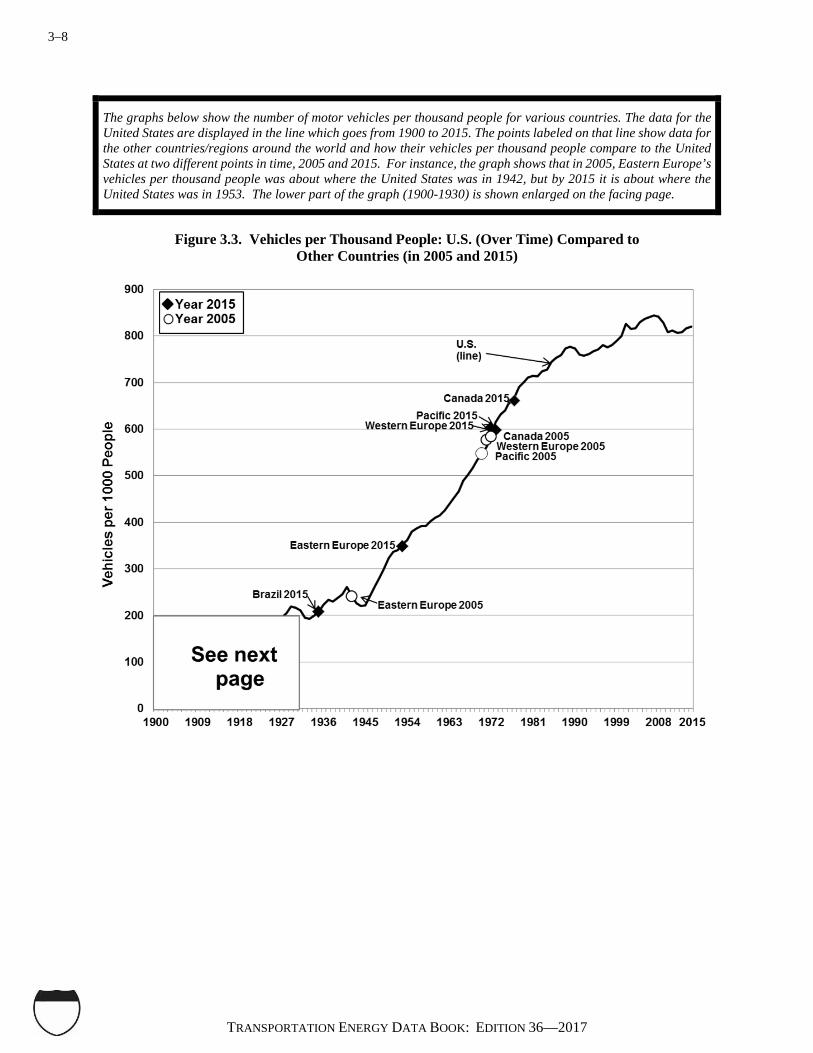
3–8
TRANSPORTATION ENERGY DATA BOOK: EDITION 36—2017
The graphs below show the number of motor vehicles per thousand people for various countries. The data for the United States are displayed in the line which goes from 1900 to 2015. The points labeled on that line show data for the other countries/regions around the world and how their vehicles per thousand people compare to the United States at two different points in time, 2005 and 2015. For instance, the graph shows that in 2005, Eastern Europe’s vehicles per thousand people was about where the United States was in 1942, but by 2015 it is about where the United States was in 1953. The lower part of the graph (1900-1930) is shown enlarged on the facing page.
Figure 3.3. Vehicles per Thousand People: U.S. (Over Time) Compared to
Other Countries (in 2005 and 2015)

3–9
TRANSPORTATION ENERGY DATA BOOK: EDITION 36—2017
Source: See Tables 3.5 and 3.6.
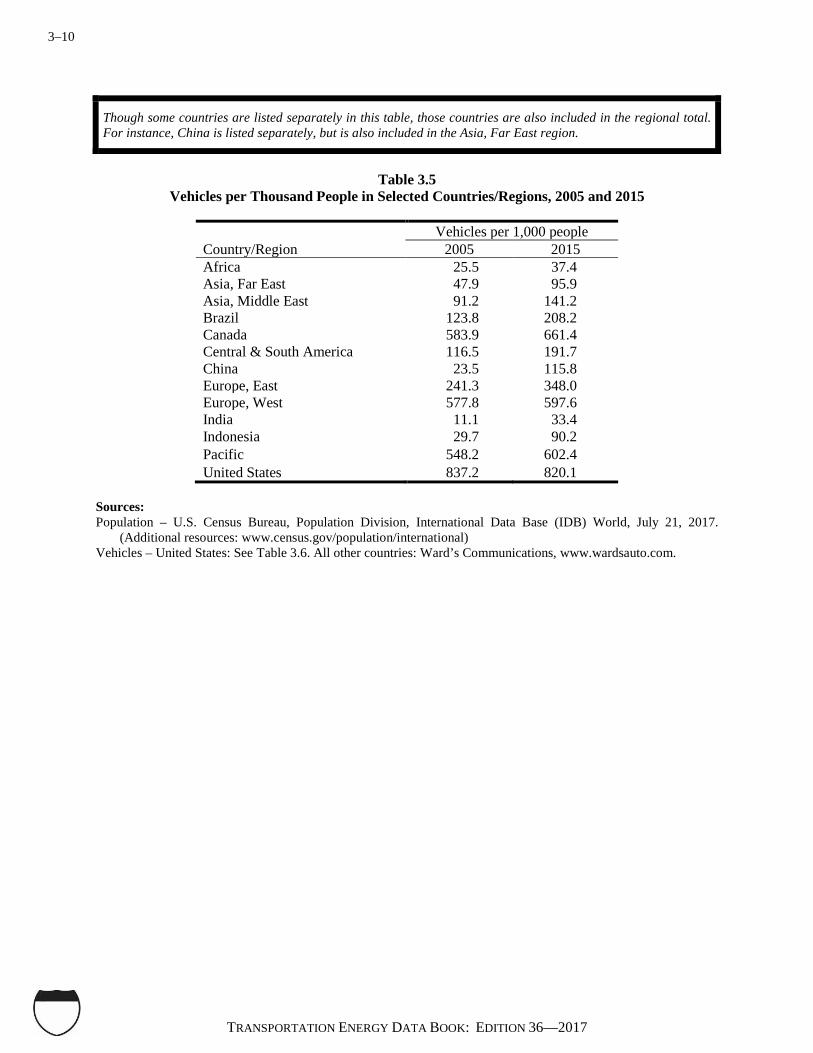
3–10
TRANSPORTATION ENERGY DATA BOOK: EDITION 36—2017
Though some countries are listed separately in this table, those countries are also included in the regional total. For instance, China is listed separately, but is also included in the Asia, Far East region.
Table 3.5
Vehicles per Thousand People in Selected Countries/Regions, 2005 and 2015
Vehicles per 1,000 people Country/Region 2005 2015 Africa 25.5 37.4 Asia, Far East 47.9 95.9 Asia, Middle East 91.2 141.2 Brazil 123.8 208.2 Canada 583.9 661.4 Central & South America 116.5 191.7 China 23.5 115.8 Europe, East 241.3 348.0 Europe, West 577.8 597.6 India 11.1 33.4 Indonesia 29.7 90.2 Pacific 548.2 602.4 United States 837.2 820.1
Sources: Population – U.S. Census Bureau, Population Division, International Data Base (IDB) World, July 21, 2017.
(Additional resources: www.census.gov/population/international) Vehicles – United States: See Table 3.6. All other countries: Ward’s Communications, www.wardsauto.com.
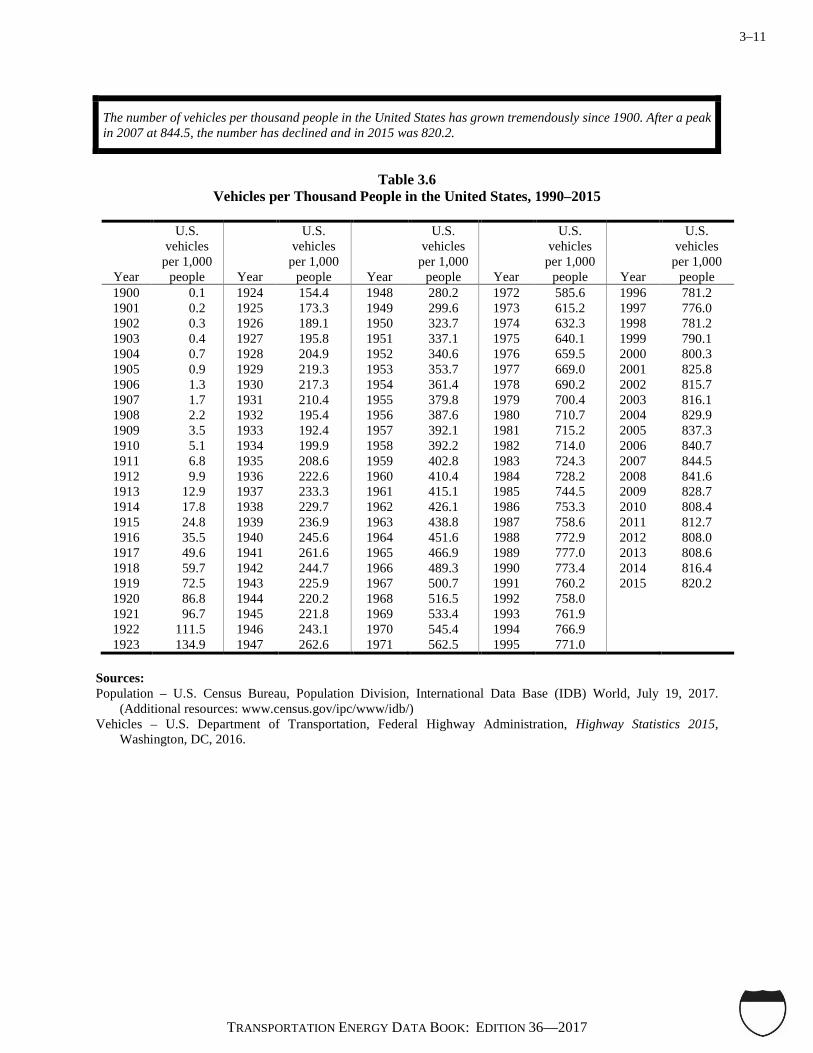
3–11
TRANSPORTATION ENERGY DATA BOOK: EDITION 36—2017
The number of vehicles per thousand people in the United States has grown tremendously since 1900. After a peak in 2007 at 844.5, the number has declined and in 2015 was 820.2.
Table 3.6
Vehicles per Thousand People in the United States, 1990–2015
Year
U.S. vehicles
per 1,000 people Year
U.S. vehicles
per 1,000 people Year
U.S. vehicles
per 1,000 people Year
U.S. vehicles
per 1,000 people Year
U.S. vehicles
per 1,000 people
1900 0.1 1924 154.4 1948 280.2 1972 585.6 1996 781.2 1901 0.2 1925 173.3 1949 299.6 1973 615.2 1997 776.0 1902 0.3 1926 189.1 1950 323.7 1974 632.3 1998 781.2 1903 0.4 1927 195.8 1951 337.1 1975 640.1 1999 790.1 1904 0.7 1928 204.9 1952 340.6 1976 659.5 2000 800.3 1905 0.9 1929 219.3 1953 353.7 1977 669.0 2001 825.8 1906 1.3 1930 217.3 1954 361.4 1978 690.2 2002 815.7 1907 1.7 1931 210.4 1955 379.8 1979 700.4 2003 816.1 1908 2.2 1932 195.4 1956 387.6 1980 710.7 2004 829.9 1909 3.5 1933 192.4 1957 392.1 1981 715.2 2005 837.3 1910 5.1 1934 199.9 1958 392.2 1982 714.0 2006 840.7 1911 6.8 1935 208.6 1959 402.8 1983 724.3 2007 844.5 1912 9.9 1936 222.6 1960 410.4 1984 728.2 2008 841.6 1913 12.9 1937 233.3 1961 415.1 1985 744.5 2009 828.7 1914 17.8 1938 229.7 1962 426.1 1986 753.3 2010 808.4 1915 24.8 1939 236.9 1963 438.8 1987 758.6 2011 812.7 1916 35.5 1940 245.6 1964 451.6 1988 772.9 2012 808.0 1917 49.6 1941 261.6 1965 466.9 1989 777.0 2013 808.6 1918 59.7 1942 244.7 1966 489.3 1990 773.4 2014 816.4 1919 72.5 1943 225.9 1967 500.7 1991 760.2 2015 820.2 1920 86.8 1944 220.2 1968 516.5 1992 758.0 1921 96.7 1945 221.8 1969 533.4 1993 761.9 1922 111.5 1946 243.1 1970 545.4 1994 766.9 1923 134.9 1947 262.6 1971 562.5 1995 771.0
Sources: Population – U.S. Census Bureau, Population Division, International Data Base (IDB) World, July 19, 2017.
(Additional resources: www.census.gov/ipc/www/idb/) Vehicles – U.S. Department of Transportation, Federal Highway Administration, Highway Statistics 2015,
Washington, DC, 2016.
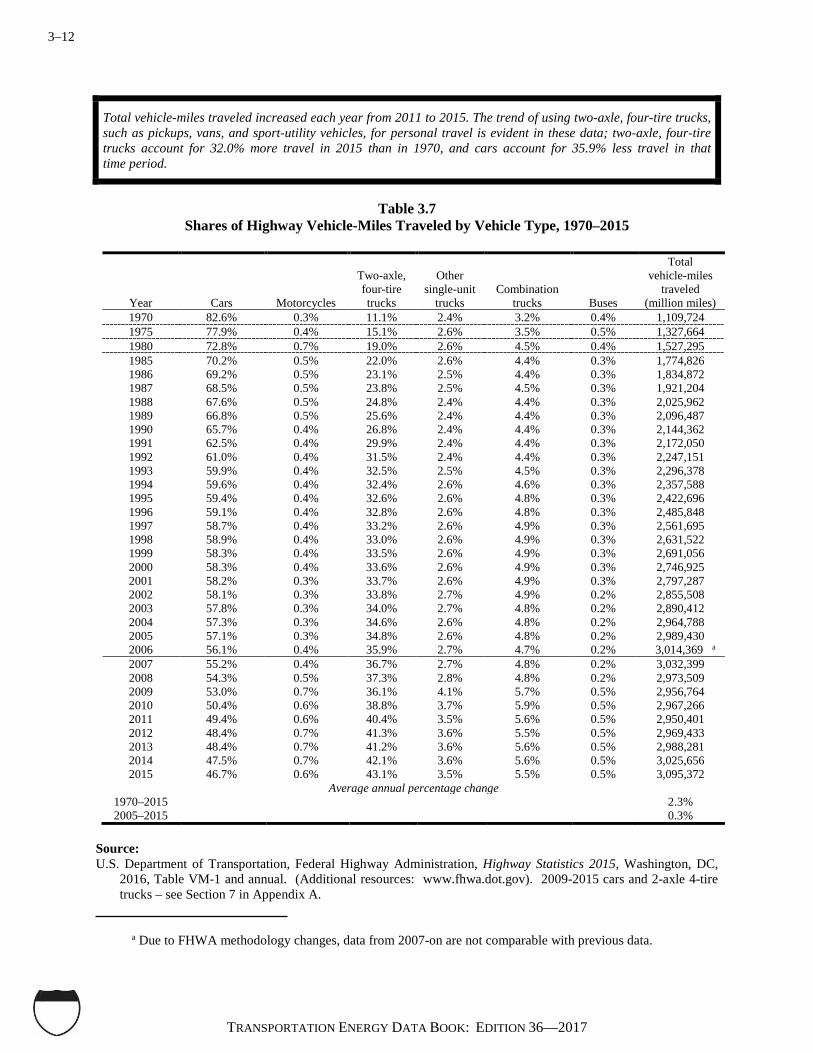
3–12
TRANSPORTATION ENERGY DATA BOOK: EDITION 36—2017
Total vehicle-miles traveled increased each year from 2011 to 2015. The trend of using two-axle, four-tire trucks, such as pickups, vans, and sport-utility vehicles, for personal travel is evident in these data; two-axle, four-tire trucks account for 32.0% more travel in 2015 than in 1970, and cars account for 35.9% less travel in that time period.
Table 3.7
Shares of Highway Vehicle-Miles Traveled by Vehicle Type, 1970–2015
Year Cars Motorcycles
Two-axle, four-tire trucks
Other single-unit
trucks
Combination
trucks Buses
Total vehicle-miles
traveled (million miles)
1970 82.6% 0.3% 11.1% 2.4% 3.2% 0.4% 1,109,724 1975 77.9% 0.4% 15.1% 2.6% 3.5% 0.5% 1,327,664 1980 72.8% 0.7% 19.0% 2.6% 4.5% 0.4% 1,527,295 1985 70.2% 0.5% 22.0% 2.6% 4.4% 0.3% 1,774,826 1986 69.2% 0.5% 23.1% 2.5% 4.4% 0.3% 1,834,872 1987 68.5% 0.5% 23.8% 2.5% 4.5% 0.3% 1,921,204 1988 67.6% 0.5% 24.8% 2.4% 4.4% 0.3% 2,025,962 1989 66.8% 0.5% 25.6% 2.4% 4.4% 0.3% 2,096,487 1990 65.7% 0.4% 26.8% 2.4% 4.4% 0.3% 2,144,362 1991 62.5% 0.4% 29.9% 2.4% 4.4% 0.3% 2,172,050 1992 61.0% 0.4% 31.5% 2.4% 4.4% 0.3% 2,247,151 1993 59.9% 0.4% 32.5% 2.5% 4.5% 0.3% 2,296,378 1994 59.6% 0.4% 32.4% 2.6% 4.6% 0.3% 2,357,588 1995 59.4% 0.4% 32.6% 2.6% 4.8% 0.3% 2,422,696 1996 59.1% 0.4% 32.8% 2.6% 4.8% 0.3% 2,485,848 1997 58.7% 0.4% 33.2% 2.6% 4.9% 0.3% 2,561,695 1998 58.9% 0.4% 33.0% 2.6% 4.9% 0.3% 2,631,522 1999 58.3% 0.4% 33.5% 2.6% 4.9% 0.3% 2,691,056 2000 58.3% 0.4% 33.6% 2.6% 4.9% 0.3% 2,746,925 2001 58.2% 0.3% 33.7% 2.6% 4.9% 0.3% 2,797,287 2002 58.1% 0.3% 33.8% 2.7% 4.9% 0.2% 2,855,508 2003 57.8% 0.3% 34.0% 2.7% 4.8% 0.2% 2,890,412 2004 57.3% 0.3% 34.6% 2.6% 4.8% 0.2% 2,964,788 2005 57.1% 0.3% 34.8% 2.6% 4.8% 0.2% 2,989,430 2006 56.1% 0.4% 35.9% 2.7% 4.7% 0.2% 3,014,369 a 2007 55.2% 0.4% 36.7% 2.7% 4.8% 0.2% 3,032,399 2008 54.3% 0.5% 37.3% 2.8% 4.8% 0.2% 2,973,509 2009 53.0% 0.7% 36.1% 4.1% 5.7% 0.5% 2,956,764 2010 50.4% 0.6% 38.8% 3.7% 5.9% 0.5% 2,967,266 2011 49.4% 0.6% 40.4% 3.5% 5.6% 0.5% 2,950,401 2012 48.4% 0.7% 41.3% 3.6% 5.5% 0.5% 2,969,433 2013 48.4% 0.7% 41.2% 3.6% 5.6% 0.5% 2,988,281 2014 47.5% 0.7% 42.1% 3.6% 5.6% 0.5% 3,025,656 2015 46.7% 0.6% 43.1% 3.5% 5.5% 0.5% 3,095,372
Average annual percentage change 1970–2015 2.3% 2005–2015 0.3%
Source: U.S. Department of Transportation, Federal Highway Administration, Highway Statistics 2015, Washington, DC,
2016, Table VM-1 and annual. (Additional resources: www.fhwa.dot.gov). 2009-2015 cars and 2-axle 4-tire trucks – see Section 7 in Appendix A.
a Due to FHWA methodology changes, data from 2007-on are not comparable with previous data.
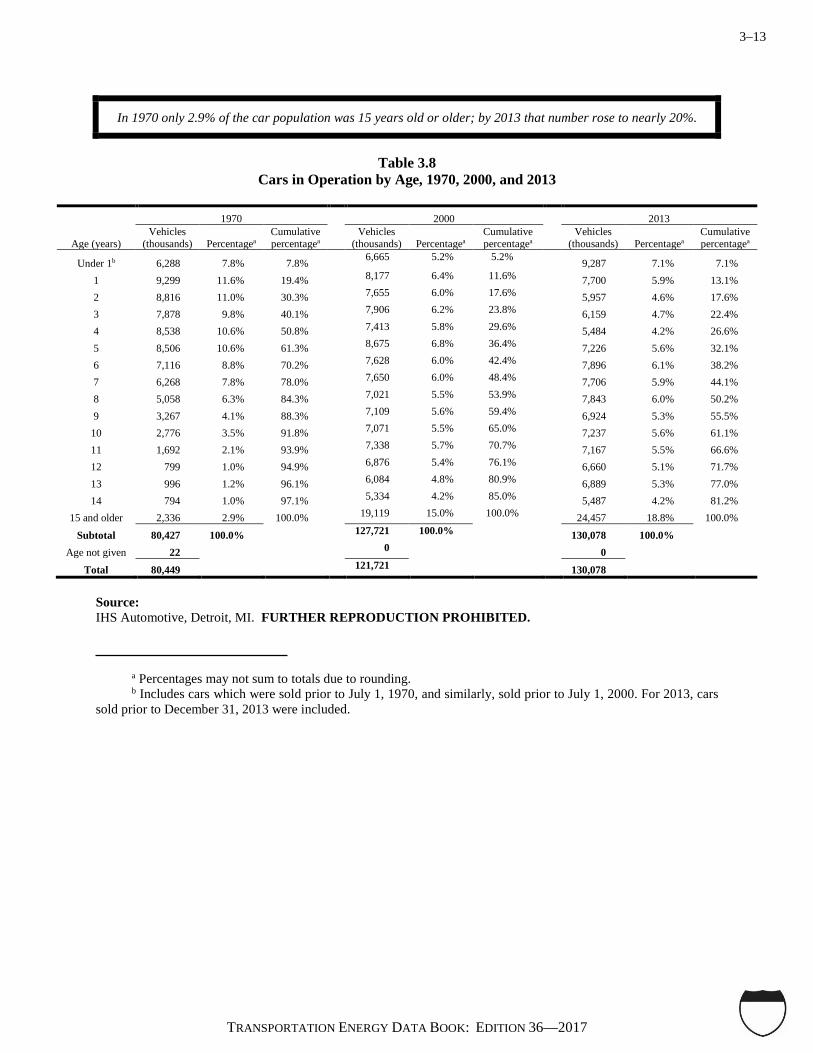
3–13
TRANSPORTATION ENERGY DATA BOOK: EDITION 36—2017
In 1970 only 2.9% of the car population was 15 years old or older; by 2013 that number rose to nearly 20%.
Table 3.8
Cars in Operation by Age, 1970, 2000, and 2013
1970 2000 2013
Age (years) Vehicles
(thousands) Percentagea Cumulative percentagea
Vehicles (thousands) Percentagea
Cumulative percentagea
Vehicles (thousands) Percentagea
Cumulative percentagea
Under 1b 6,288 7.8% 7.8% 6,665 5.2% 5.2%
9,287 7.1% 7.1% 1 9,299 11.6% 19.4% 8,177 6.4% 11.6% 7,700 5.9% 13.1% 2 8,816 11.0% 30.3% 7,655 6.0% 17.6% 5,957 4.6% 17.6% 3 7,878 9.8% 40.1% 7,906 6.2% 23.8% 6,159 4.7% 22.4% 4 8,538 10.6% 50.8% 7,413 5.8% 29.6% 5,484 4.2% 26.6% 5 8,506 10.6% 61.3% 8,675 6.8% 36.4% 7,226 5.6% 32.1% 6 7,116 8.8% 70.2% 7,628 6.0% 42.4% 7,896 6.1% 38.2% 7 6,268 7.8% 78.0% 7,650 6.0% 48.4% 7,706 5.9% 44.1% 8 5,058 6.3% 84.3% 7,021 5.5% 53.9% 7,843 6.0% 50.2% 9 3,267 4.1% 88.3% 7,109 5.6% 59.4% 6,924 5.3% 55.5%
10 2,776 3.5% 91.8% 7,071 5.5% 65.0% 7,237 5.6% 61.1% 11 1,692 2.1% 93.9% 7,338 5.7% 70.7% 7,167 5.5% 66.6% 12 799 1.0% 94.9% 6,876 5.4% 76.1% 6,660 5.1% 71.7% 13 996 1.2% 96.1% 6,084 4.8% 80.9% 6,889 5.3% 77.0% 14 794 1.0% 97.1% 5,334 4.2% 85.0% 5,487 4.2% 81.2%
15 and older 2,336 2.9% 100.0% 19,119 15.0% 100.0% 24,457 18.8% 100.0% Subtotal 80,427 100.0% 127,721 100.0%
130,078 100.0%
Age not given 22 0
0 Total 80,449 121,721 130,078
Source: IHS Automotive, Detroit, MI. FURTHER REPRODUCTION PROHIBITED. a Percentages may not sum to totals due to rounding. b Includes cars which were sold prior to July 1, 1970, and similarly, sold prior to July 1, 2000. For 2013, cars sold prior to December 31, 2013 were included.
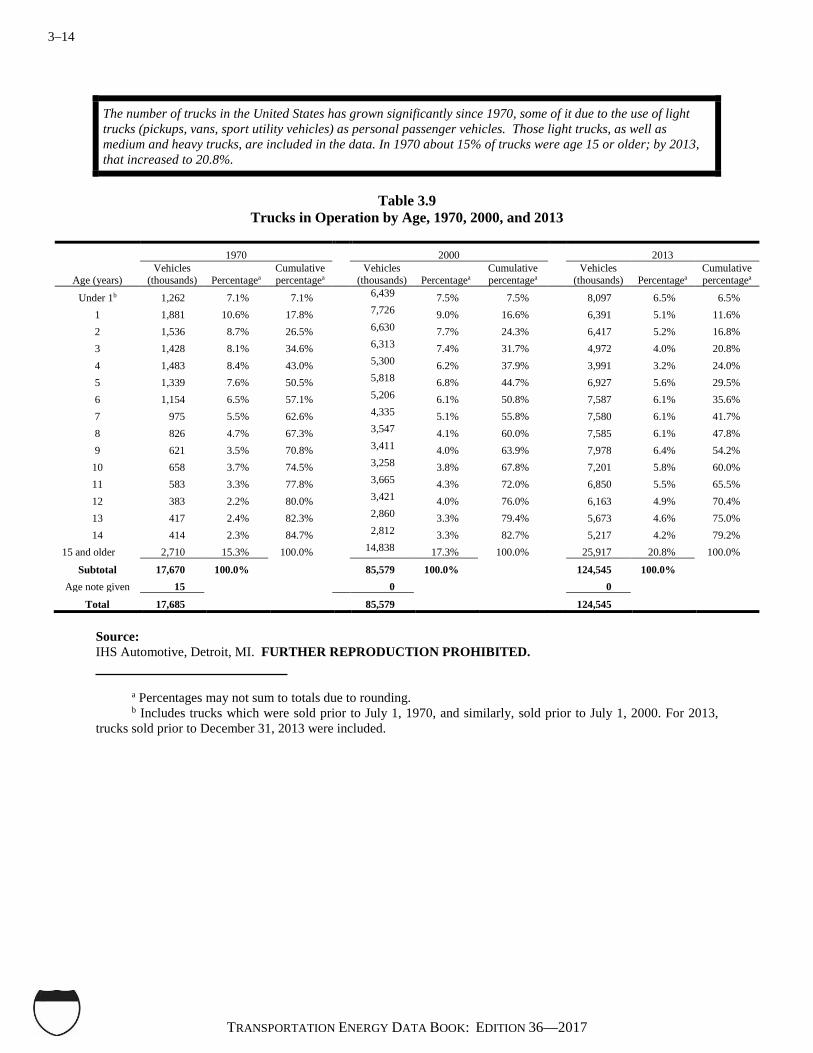
3–14
TRANSPORTATION ENERGY DATA BOOK: EDITION 36—2017
The number of trucks in the United States has grown significantly since 1970, some of it due to the use of light trucks (pickups, vans, sport utility vehicles) as personal passenger vehicles. Those light trucks, as well as medium and heavy trucks, are included in the data. In 1970 about 15% of trucks were age 15 or older; by 2013, that increased to 20.8%.
Table 3.9
Trucks in Operation by Age, 1970, 2000, and 2013
1970 2000 2013
Age (years) Vehicles
(thousands) Percentagea Cumulative percentagea
Vehicles (thousands) Percentagea
Cumulative percentagea
Vehicles (thousands) Percentagea
Cumulative percentagea
Under 1b 1,262 7.1% 7.1% 6,439 7.5% 7.5% 8,097 6.5% 6.5% 1 1,881 10.6% 17.8% 7,726 9.0% 16.6% 6,391 5.1% 11.6% 2 1,536 8.7% 26.5% 6,630 7.7% 24.3% 6,417 5.2% 16.8% 3 1,428 8.1% 34.6% 6,313 7.4% 31.7% 4,972 4.0% 20.8% 4 1,483 8.4% 43.0% 5,300 6.2% 37.9% 3,991 3.2% 24.0% 5 1,339 7.6% 50.5% 5,818 6.8% 44.7% 6,927 5.6% 29.5% 6 1,154 6.5% 57.1% 5,206 6.1% 50.8% 7,587 6.1% 35.6% 7 975 5.5% 62.6% 4,335 5.1% 55.8% 7,580 6.1% 41.7% 8 826 4.7% 67.3% 3,547 4.1% 60.0% 7,585 6.1% 47.8% 9 621 3.5% 70.8% 3,411 4.0% 63.9% 7,978 6.4% 54.2%
10 658 3.7% 74.5% 3,258 3.8% 67.8% 7,201 5.8% 60.0% 11 583 3.3% 77.8% 3,665 4.3% 72.0% 6,850 5.5% 65.5% 12 383 2.2% 80.0% 3,421 4.0% 76.0% 6,163 4.9% 70.4% 13 417 2.4% 82.3% 2,860 3.3% 79.4% 5,673 4.6% 75.0% 14 414 2.3% 84.7% 2,812 3.3% 82.7% 5,217 4.2% 79.2%
15 and older 2,710 15.3% 100.0% 14,838 17.3% 100.0% 25,917 20.8% 100.0%
Subtotal 17,670 100.0% 85,579 100.0% 124,545 100.0% Age note given 15 0 0
Total 17,685 85,579 124,545 Source: IHS Automotive, Detroit, MI. FURTHER REPRODUCTION PROHIBITED. a Percentages may not sum to totals due to rounding. b Includes trucks which were sold prior to July 1, 1970, and similarly, sold prior to July 1, 2000. For 2013, trucks sold prior to December 31, 2013 were included.

3–15
TRANSPORTATION ENERGY DATA BOOK: EDITION 36—2017
The average age of cars and light trucks has grown to a record level in 2016—11.6 years. Light trucks, which include pickups, vans, and sport utility vehicles, previously had a lower average age than cars. In 2014 through 2016, however, there is no difference in their ages.
Table 3.10
U.S. Average Vehicle Age, 1995–2016
Calendar Year Passenger cars Light trucks All light vehicles 1995 8.4 8.3 8.4 1996 8.5 8.3 8.5 1997 8.7 8.5 8.6 1998 8.9 8.5 8.8 1999 9.1 8.5 8.8 2000 9.1 8.4 8.9 2001 9.3 8.4 8.9 a 2002 9.8 9.4 9.6 2003 9.9 9.0 9.7 2004 10.0 9.5 9.8 2005 10.1 9.5 9.8 2006 10.2 9.5 9.9 2007 10.3 9.6 10.0 2008 10.4 9.8 10.1 2009 10.5 10.1 10.3 2010 10.8 10.5 10.6 2011 11.1 10.8 10.9 2012 11.3 11.1 11.2 2013 11.4 11.3 11.4 2014 11.4 11.4 11.4 2015 11.5 11.5 11.5 2016 11.6 11.6 11.6
Source: IHS Automotive, Detroit, MI. FURTHER REPRODUCTION PROHIBITED. (Additional resources:
https://www.ihs.com/industry/automotive.html) a In 2013, IHS Automotive published a data series showing vehicle age from 2002-2013. These data did not match the previous data published by IHS Automotive. The data prior to 2002 came from earlier IHS Automotive news releases and is not comparable to the revised data.

3–16
TRANSPORTATION ENERGY DATA BOOK: EDITION 36—2017
Table 3.11 New Retail Vehicle Sales, 1970–2016
(thousands)
Total Calendar Light Subtotal Heavy Vehicle
Year Cars Trucksa Light Vehicles Trucks Sales 1970 8,399 1,457 9,856 334 10,190 1975 8,624 2,053 10,677 298 10,975 1976 10,110 2,719 12,829 324 13,153 1977 11,183 3,109 14,292 376 14,668 1978 11,314 3,474 14,788 441 15,229 1979 10,673 2,845 13,518 391 13,909 1980 8,949 1,960 10,909 271 11,180 1981 8,489 1,746 10,235 226 10,461 1982 7,956 2,063 10,019 184 10,203 1983 9,148 2,521 11,669 189 11,858 1984 10,324 3,255 13,579 282 13,861 1985 10,979 3,688 14,667 295 14,962 1986 11,404 4,594 15,998 277 16,275 1987 10,192 4,610 14,802 302 15,104 1988 10,547 4,800 15,347 348 15,695 1989 9,779 4,610 14,389 330 14,719 1990 9,303 4,548 13,851 297 14,148 1991 8,185 4,122 12,307 242 12,549 1992 8,213 4,629 12,842 276 13,118 1993 8,518 5,351 13,869 330 14,199 1994 8,991 6,033 15,024 387 15,411 1995 8,620 6,053 14,673 428 15,101 1996 8,479 6,519 14,998 411 15,409 1997 8,217 6,797 15,014 430 15,444 1998 8,085 7,299 15,384 526 15,910 1999 8,638 8,073 16,711 641 17,352 2000 8,778 8,386 17,164 579 17,743 2001 8,352 8,598 16,950 452 17,402 2002 8,042 8,633 16,675 402 17,077 2003 7,556 8,938 16,494 420 16,914 2004 7,483 9,254 16,737 538 17,275 2005 7,660 9,114 16,774 664 17,438 2006 7,762 8,574 16,336 694 17,030 2007 7,562 8,305 15,867 537 16,404 2008 6,769 6,246 13,015 432 13,447 2009 5,402 4,834 10,236 312 10,548 2010 5,636 5,758 11,394 378 11,772 2011 6,093 6,449 12,542 500 13,042 2012 7,245 6,975 14,220 569 14,789 2013 7,586 7,693 15,279 606 15,884 2014 7,708 8,484 16,192 671 16,862 2015 7,517 9,578 17,095 732 17,827 2016 6,873 10,296 17,169 697 17,866
Average annual percentage change 1970–2016 -0.4% 4.3% 1.2% 1.6% 1.2% 2006–2016 -1.2% 1.8% 0.5% 0.0% 0.5%
Source: Ward’s Communications, www.wardsauto.com. a Includes light trucks of 10,000 lb. gross vehicle weight and less.

3–17
TRANSPORTATION ENERGY DATA BOOK: EDITION 36—2017
The Environmental Protection Agency estimated the survival rates for cars and light trucks for the mid-term evaluation of the Light Vehicle Greenhouse Gas Emissions Standards and Corporate Average Fuel Economy Standards.
Table 3.12
Survival Rates for Cars and Light Trucks by Vehicle Age
Vehicle age (years)
Estimated survival rate
for cars
Estimated survival rate
for light trucks 0 1.000 1.000 1 0.997 0.991 2 0.994 0.982 3 0.991 0.973 4 0.984 0.960 5 0.974 0.941 6 0.961 0.919 7 0.942 0.891 8 0.920 0.859 9 0.893 0.823 10 0.862 0.784 11 0.826 0.741 12 0.788 0.697 13 0.718 0.651 14 0.613 0.605 15 0.510 0.553 16 0.415 0.502 17 0.332 0.453 18 0.261 0.407 19 0.203 0.364 20 0.157 0.324 21 0.120 0.288 22 0.092 0.255 23 0.070 0.225 24 0.053 0.198 25 0.040 0.174 26 0.030 0.153 27 0.023 0.133 28 0.013 0.117 29 0.010 0.102 30 0.007 0.089 31 0.002 0.027
Source: U.S. Environmental Protection Agency, Draft Technical Assessment Report: Midterm Evaluation of Light-Duty
Vehicle Greenhouse Gas Emission Standards and Corporate Average Fuel Economy Standards for Model Years 2022-2025, EPA-420-D-16-900, July 2016. (Additional resources: https://www.epa.gov/regulations-emissions-vehicles-and-engines/midterm-evaluation-light-duty-vehicle-greenhouse-gas-ghg#TAR)

3–18
TRANSPORTATION ENERGY DATA BOOK: EDITION 36—2017
The Environmental Protection Agency estimated the annual vehicle miles of travel for cars and light trucks up to 30 years old for the mid-term evaluation of the Light Vehicle Greenhouse Gas Emissions Standards and Corporate Average Fuel Economy Standards. The “Total” row represents the number of miles a car or light truck would travel if it is in operation for 30 years. Typical lifetime miles from a 2006 study by the National Highway Traffic Safety Administration (NHTSA) are shown below the total.
Table 3.13
Annual Mileage for Cars and Light Trucks by Vehicle Age
Vehicle age (years)
Estimated annual vehicle miles of travel for cars
Estimated annual vehicle miles of travel
for light trucks 0 13,843 15,962 1 13,580 15,670 2 13,296 15,320 3 12,992 15,098 4 12,672 14,528 5 12,337 14,081 6 11,989 13,548 7 11,630 13,112 8 11,262 12,544 9 10,887 12,078 10 10,509 11,595 11 10,129 11,131 12 9,748 10,641 13 9,370 10,153 14 8,997 9,691 15 8,629 9,239 16 8,270 8,797 17 7,922 8,383 18 7,586 8,009 19 7,265 7,666 20 6,962 7,358 21 6,679 7,089 22 6,416 6,862 23 6,177 6,684 24 5,963 6,556 25 5,778 6,481 26 5,623 6,466 27 5,499 6,466 28 5,410 6,466 29 5,358 6,466 30 5,358 6,466
Total 278,134 310,610 NHTSA 2006 study – typical lifetime miles 152,137 179,954
Sources: U.S. Environmental Protection Agency, Draft Technical Assessment Report: Midterm Evaluation of Light-Duty
Vehicle Greenhouse Gas Emission Standards and Corporate Average Fuel Economy Standards for Model Years 2022-2025, EPA-420-D-16-900, July 2016. (Additional resources: https://www.epa.gov/regulations-emissions-vehicles-and-engines/midterm-evaluation-light-duty-vehicle-greenhouse-gas-ghg#TAR)
U.S. Department of Transportation, National Highway Traffic Safety Administration, Vehicle Survivability and Travel Mileage Schedules, January 2006.

3–19
TRANSPORTATION ENERGY DATA BOOK: EDITION 36—2017
Using current registration data and a scrappage model by Greenspan and Cohen [1996 paper: www.federalreserve.gov/pubs/feds/1996/199640/199640pap.pdf], ORNL calculated heavy truck (trucks over 26,000 lb gross vehicle weight) scrappage rates. The expected median lifetime for a 1990 model year heavy truck is 29 years. These data are fitted model values which assume constant economic conditions.
Table 3.14
Heavy Trucka Scrappage and Survival Rates 1970, 1980, and 1990 Model Years
Vehicle
ageb (years)
1970 model year 1980 model year 1990 model year Survival
ratec Scrappage
rated Survival
ratec Scrappage
rated Survival
ratec Scrappage
rated 4 98.8 1.2 98.5 1.5 99.4 0.6 5 97.2 1.6 96.7 1.9 98.6 0.8 6 95.3 1.9 94.5 2.3 97.6 1.0 7 93.2 2.3 92.0 2.7 96.5 1.2 8 90.7 2.6 89.1 3.1 95.2 1.3 9 88.1 3.0 86.0 3.5 93.8 1.5 10 85.2 3.3 82.7 3.9 92.2 1.7 11 82.1 3.6 79.1 4.3 90.5 1.9 12 78.8 4.0 75.4 4.7 88.6 2.0 13 75.4 4.3 71.6 5.1 86.7 2.2 14 71.9 4.7 67.7 5.5 84.6 2.4 15 68.3 5.0 63.7 5.9 82.4 2.6 16 64.6 5.3 59.7 6.3 80.2 2.7 17 61.0 5.7 55.7 6.7 77.9 2.9 18 57.3 6.0 51.8 7.1 75.5 3.1 19 53.7 6.3 47.9 7.4 73.0 3.3 20 50.1 6.7 44.2 7.8 70.5 3.4 21 46.6 7.0 40.6 8.2 68.0 3.6 22 43.2 7.3 37.1 8.6 65.4 3.8 23 39.9 7.6 33.7 9.0 62.8 3.9 24 36.7 8.0 30.6 9.4 60.3 4.1 25 33.7 8.3 27.6 9.7 57.7 4.3 26 30.8 8.6 24.8 10.1 55.1 4.5 27 28.0 8.9 22.2 10.5 52.6 4.6 28 25.4 9.3 19.8 10.9 50.0 4.8 29 23.0 9.6 17.6 11.2 47.6 5.0 30 20.7 9.9 15.5 11.6 45.1 5.1
Median lifetime 20.0 years 18.5 years 28.0 years
Source: Schmoyer, Richard L., unpublished study on scrappage rates, Oak Ridge National Laboratory, Oak Ridge, TN, 2001. a Heavy trucks are trucks over 26,000 lb gross vehicle weight. b It was assumed that scrappage for vehicles less than 4 years old is 0. c The percentage of heavy trucks which will be in use at the end of the year. d The percentage of heavy trucks which will be retired from use during the year.

3–20
TRANSPORTATION ENERGY DATA BOOK: EDITION 36—2017

4–1
TRANSPORTATION ENERGY DATA BOOK: EDITION 36—2017
Light Vehicles and Characteristics
Summary Statistics from Tables in this Chapter
Source Table 4.1 Cars, 2015 Registrations (thousands) 112,864 Vehicle miles (billion miles) 1,445.4 Fleet average fuel economy (miles per gallon) 26.2 Table 4.2 Two-axle, four-tire trucks, 2015 Registrations (thousands) 128,553 Vehicle miles (billion miles) 1,343.1 Fleet average fuel economy (miles per gallon) 18.8 Table 4.7 Light truck share of total light vehicle sales 1970 calendar year 14.8% 2016 calendar year 60.0% Table 4.8 Cars, 2015 model year Production (thousands) 7,899 New car fuel economy (miles per gallon) 29.4 Table 4.8 Car SUVs, 2015 model year Production (thousands) 1,701 New car SUV fuel economy (miles per gallon) 25.3 Table 4.8 Truck SUVs, 2015 model year Production (thousands) 4,697 New truck SUV fuel economy (miles per gallon) 22.6 Table 4.8 Pickups, 2015 model year Production (thousands) 1,786 New pickup fuel economy (miles per gallon) 18.8 Table 4.8 Vans, 2015 model year Production (thousands) 655 New van fuel economy (miles per gallon) 21.9 Table 4.29 Average fuel economy loss from 50 to 70 mph 24.5%
The definition of light truck can change from table to table in this document due to differing definitions among federal government regulations and public nomenclature. See page 4-2 for additional information.

4–2
TRANSPORTATION ENERGY DATA BOOK: EDITION 36—2017
Definition of Light Truck
Often for regulatory purposes, agencies within the federal government have differing definitions for the term “light truck.” Private data collectors, such as Ward’s Communications or IHS Automotive/Polk, have their own definitions as well. The paragraphs below are intended as a guide to the different definitions which are used in this document.
The data on Table 4.2 are from the Federal Highway Administration (FHWA). From 1970 to 2008 the FHWA defined light trucks as two-axle, four-tire trucks, including pickups, vans, SUVs, and other two-axle, four-tire trucks under 10,000 lb gross vehicle weight rating (GVWR). In 2009, the FHWA changed methodologies and no longer publishes vehicle miles, fuel use, and fuel economy of light trucks separately from cars. They continue to publish vehicle registrations for pickups, vans, SUVs and other two-axle, four tire trucks under 10,000 lb. The methodology used by Oak Ridge National Laboratory (ORNL) to continue the data series on Table 4.2 after 2008 is based on the FHWA data for all light vehicles, thus uses the same definition of light trucks. See Section 7.2 in Appendix A for the methodology of light truck data on Table 4.2 after 2008. Data on energy use in Tables 2.7 through 2.9 also use the FHWA definition of light truck.
Tables 3.11, 4.4, 4.5, and 4.7 are light truck sales based on Ward’s Communications data. Ward’s definition of light trucks includes pickups, vans, SUVs, and specialty purpose vehicles up to 14,000 lb GVWR. However, in most cases, data are available by individual GVWR and ORNL summarized only light trucks that were 10,000 lb GVWR or less and did not include the heavier trucks. Thus, the definition on these tables is nearly identical to the FHWA definition.
The Environmental Protection Agency (EPA) and the Department of Transportation, National Highway Traffic Safety Administration (NHTSA), issued joint rulemaking to establish Corporate Average Fuel Economy (CAFE) standards and greenhouse gas emissions standards beginning with model year 2012. The rulemaking established new definitions of cars and light trucks. Before the rule, CAFE standards applied to cars and light trucks (pickups, vans, SUVs, and other trucks) less than 8,500 lb GVWR. After the rule, some two-wheel drive SUVs are considered cars instead of light trucks, and personal passenger vehicles (vans and SUVs) up to 10,000 lb GVWR are considered light trucks. Thus, data are now categorized as cars, car SUVs, truck SUVs, pickups and vans. Table 4.9 gives a listing of which SUVs are considered car SUVs for model year 2016. The EPA revised their data series back to 1975, so the definitions are consistent historically. Data on tables 4.8 through 4.15 are based on EPA data and thus use this definition of cars and light trucks. The CAFE data on Table 4.21 apply to cars only through 2011 and cars plus car SUVs after that. The CAFE data on Table 4.22 are for trucks up to 8,500 lb GVWR through 2011 and after that are for truck SUVs and vans up to 10,000 lb GVWR, and pickup trucks up to 8,500 lb GVWR.
Because of these different definitions, caution is advised when comparing light truck data from different sources.

4–3
TRANSPORTATION ENERGY DATA BOOK: EDITION 36—2017
The data in this table from 1985–on DO NOT include minivans, pickups, or sport utility vehicles. Much of the data for 2009-on were estimated; the FHWA no longer publishes travel and fuel data for cars. A methodology change for the number of cars registered affected the series in 2012.
Table 4.1
Summary Statistics for Cars, 1970–2015
Year Registrationsa (thousands)
Vehicle travel (billion miles)
Miles (per vehicle)
Fuel use (million gallons)
Fuel economyb (miles per gallon)
1970 89,244 916.7 10,272 67,820 13.5 1975 106,706 1,034.0 9,690 74,140 13.9 1980 121,601 1,111.6 9,141 69,981 15.9
1985c 127,885 1,246.8 9,749 71,518 17.4 1986 130,004 1,270.2 9,770 73,174 17.4 1987 131,482 1,316.0 10,009 73,308 18.0 1988 133,836 1,370.3 10,238 73,345 18.7 1989 134,559 1,401.2 10,413 73,913 19.0 1990 133,700 1,408.3 10,533 69,568 20.2 1991 128,300 1,358.2 10,586 64,318 21.1 1992 126,581 1,371.6 10,836 65,436 21.0 1993 127,327 1,374.7 10,797 67,047 20.5 1994 127,883 1,406.1 10,995 67,874 20.7 1995 128,387 1,438.3 11,203 68,072 21.1 1996 129,728 1,469.9 11,330 69,221 21.2 1997 129,749 1,502.6 11,580 69,892 21.5 1998 131,839 1,549.6 11,754 71,695 21.6 1999 132,432 1,569.1 11,848 73,283 21.4 2000 133,621 1,600.3 11,976 73,065 21.9 2001 137,633 1,628.3 11,831 73,559 22.1 2002 135,921 1,658.5 12,202 75,471 22.0 2003 135,670 1,672.1 12,325 74,590 22.4 2004 136,431 1,699.9 12,460 75,402 22.5 2005 136,568 1,708.4 12,510 77,418 22.1 2006 135,400 1,690.5 12,485 75,009 22.5 2007 135,933 1,672.5 12,304 74,377 22.5 2008 137,080 1,615.9 11,788 71,497 22.6 d
2009 134,880 1,566.8 11,616 66,587 23.5 2010 130,892 1,496.4 11,432 62,245 24.0 2011 125,657 1,457.8 11,601 59,646 24.4 2012 111,290 1,438.6 12,928 57,899 24.9 2013 113,676 1,446.0 12,720 57,290 25.2 2014 113,899 1,436.6 12,613 56,470 25.4 2015 112,864 1,445.4 12,807 55,212 26.2
Average annual percentage change 1970–2015 0.5% 1.0% 0.5% -0.5% 1.5% 2005–2015 -1.9% -1.7% 0.2% -3.3% 1.7%
Source: 1970-2008: U.S. Department of Transportation, Federal Highway Administration, Highway Statistics 2009,
Washington, DC, 2011, Table VM-1 and annual. 2009-on: See Section 7.1 in Appendix A. (Additional resources: www.fhwa.dot.gov)
a This number differs from IHS Automotive’s estimates of “number of cars in use.” See Table 3.4. b Fuel economy for car population. c Beginning in this year the data were revised to exclude minivans, pickups and sport utility vehicles which may have been previously included. d Due to FHWA methodology changes, data from 2009-on are not comparable with previous data.

4–4
TRANSPORTATION ENERGY DATA BOOK: EDITION 36—2017
Much of the data for 2009-on were estimated; the FHWA no longer publishes travel and fuel use data for two-axle, four-tire trucks. A methodology change for the number of registrations affected the data series in 2012.
Table 4.2
Summary Statistics for Two-Axle, Four-Tire Trucks, 1970–2015
Year Registrations (thousands)
Vehicle travel (billion miles)
Miles (per vehicle)
Fuel use (million gallons)
Fuel economy (miles per gallon)
1970 14,211 123.3 8,675 12,313 10.0 1975 20,418 200.7 9,830 19,081 10.5 1980 27,876 290.9 10,437 23,796 12.2
1985a 37,214 391.0 10,506 27,363 14.3 1986 39,382 423.9 10,764 29,074 14.6 1987 41,107 456.9 11,114 30,598 14.9 1988 43,805 502.2 11,465 32,653 15.4 1989 45,945 536.5 11,676 33,271 16.1 1990 48,275 574.6 11,902 35,611 16.1 1991 53,033 649.4 12,245 38,217 17.0 1992 57,091 706.9 12,381 40,929 17.3 1993 59,994 745.8 12,430 42,851 17.4 1994 62,904 764.6 12,156 44,112 17.3 1995 65,738 790.0 12,018 45,605 17.3 1996 69,134 816.5 11,811 47,354 17.2 1997 70,224 850.7 12,115 49,389 17.2 1998 71,330 868.3 12,173 50,462 17.2 1999 75,356 901.0 11,957 52,859 17.0 2000 79,085 923.1 11,672 52,939 17.4 2001 84,188 943.2 11,204 53,522 17.6 2002 85,011 966.0 11,364 55,220 17.5 2003 87,187 984.1 11,287 60,758 16.2 2004 91,845 1,027.2 11,184 63,417 16.2 2005 95,337 1,041.1 10,920 58,869 17.7 2006 99,125 1,082.5 10,920 60,685 17.8 2007 101,470 1,112.3 10,962 61,836 18.0 2008 101,235 1,108.6 10,951 61,199 18.1 b
2009 100,154 1,066.5 10,649 61,824 17.3 2010 102,702 1,152.1 11,218 64,687 17.8 2011 105,571 1,192.7 11,298 65,786 18.1 2012 120,847 1,225.5 10,142 66,395 18.5 2013 120,523 1,231.8 10,220 65,555 18.8 2014 124,681 1,274.0 10,218 69,012 18.5 2015 128,553 1,334.3 10,448 67,730 18.8
Average annual percentage change 1970–2015 5.0% 5.5% 0.4% 3.9% 1.4% 2005–2015 3.0% 2.6% -0.4% 1.4% 0.6%
Source: 1970-2008: U.S. Department of Transportation, Federal Highway Administration, Highway Statistics 2009,
Washington, DC, 2011, Table MV-9. Previous years Table VM-1. 2009-on: See Section 7.2 in Appendix A. (Additional resources: www.fhwa.dot.gov)
a Beginning in this year the data were revised to include all vans (including mini-vans), pickups and sport utility vehicles. b Due to FHWA methodology changes, data from 2009-on are not comparable with previous data.
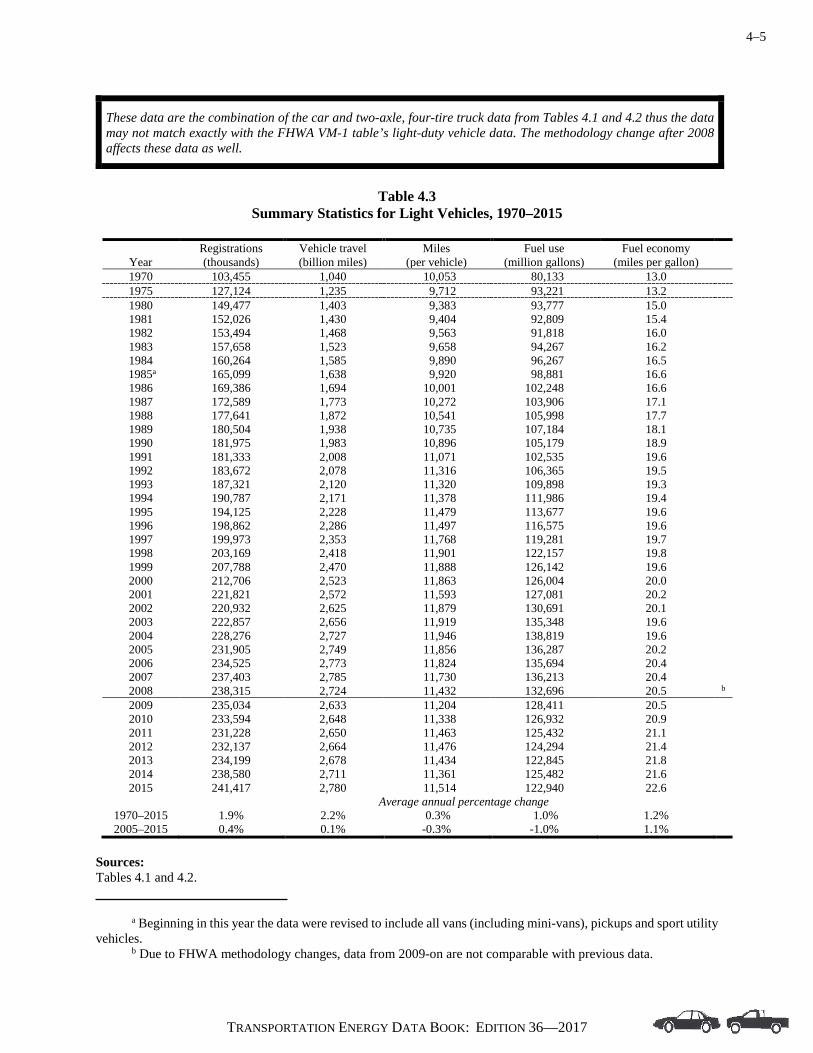
4–5
TRANSPORTATION ENERGY DATA BOOK: EDITION 36—2017
These data are the combination of the car and two-axle, four-tire truck data from Tables 4.1 and 4.2 thus the data may not match exactly with the FHWA VM-1 table’s light-duty vehicle data. The methodology change after 2008 affects these data as well.
Table 4.3
Summary Statistics for Light Vehicles, 1970–2015
Year Registrations (thousands)
Vehicle travel (billion miles)
Miles (per vehicle)
Fuel use (million gallons)
Fuel economy (miles per gallon)
1970 103,455 1,040 10,053 80,133 13.0 1975 127,124 1,235 9,712 93,221 13.2 1980 149,477 1,403 9,383 93,777 15.0 1981 152,026 1,430 9,404 92,809 15.4 1982 153,494 1,468 9,563 91,818 16.0 1983 157,658 1,523 9,658 94,267 16.2 1984 160,264 1,585 9,890 96,267 16.5
1985a 165,099 1,638 9,920 98,881 16.6 1986 169,386 1,694 10,001 102,248 16.6 1987 172,589 1,773 10,272 103,906 17.1 1988 177,641 1,872 10,541 105,998 17.7 1989 180,504 1,938 10,735 107,184 18.1 1990 181,975 1,983 10,896 105,179 18.9 1991 181,333 2,008 11,071 102,535 19.6 1992 183,672 2,078 11,316 106,365 19.5 1993 187,321 2,120 11,320 109,898 19.3 1994 190,787 2,171 11,378 111,986 19.4 1995 194,125 2,228 11,479 113,677 19.6 1996 198,862 2,286 11,497 116,575 19.6 1997 199,973 2,353 11,768 119,281 19.7 1998 203,169 2,418 11,901 122,157 19.8 1999 207,788 2,470 11,888 126,142 19.6 2000 212,706 2,523 11,863 126,004 20.0 2001 221,821 2,572 11,593 127,081 20.2 2002 220,932 2,625 11,879 130,691 20.1 2003 222,857 2,656 11,919 135,348 19.6 2004 228,276 2,727 11,946 138,819 19.6 2005 231,905 2,749 11,856 136,287 20.2 2006 234,525 2,773 11,824 135,694 20.4 2007 237,403 2,785 11,730 136,213 20.4 2008 238,315 2,724 11,432 132,696 20.5 b
2009 235,034 2,633 11,204 128,411 20.5 2010 233,594 2,648 11,338 126,932 20.9 2011 231,228 2,650 11,463 125,432 21.1 2012 232,137 2,664 11,476 124,294 21.4 2013 234,199 2,678 11,434 122,845 21.8 2014 238,580 2,711 11,361 125,482 21.6 2015 241,417 2,780 11,514 122,940 22.6
Average annual percentage change 1970–2015 1.9% 2.2% 0.3% 1.0% 1.2% 2005–2015 0.4% 0.1% -0.3% -1.0% 1.1%
Sources: Tables 4.1 and 4.2.
a Beginning in this year the data were revised to include all vans (including mini-vans), pickups and sport utility vehicles. b Due to FHWA methodology changes, data from 2009-on are not comparable with previous data.

4–6
TRANSPORTATION ENERGY DATA BOOK: EDITION 36—2017
Because data on Class 2b trucks are scarce, the U.S. DOE funded a study to investigate available sources of data. In the final report, four methodologies are described to estimate the sales of Class 2b trucks. Until another study is funded, the 1999 data are the latest available.
Table 4.4
Summary Statistics on Class 1, Class 2a, and Class 2b Light Trucks
CY 1999 truck sales (millions)
2000 truck population (millions)
Percent diesel trucks
in population
Average age
(years)
Estimated annual milesa
(billions)
Estimated fuel use (billiona gallons)
Estimated fuel economy (miles per
gallon) Class 1 5.7 49.7 0.3% 7.3 672.7 37.4 18.0 Class 2a 1.8 19.2 2.5% 7.4 251.9 18.0 14.0 Class 2b 0.5 5.8 24.0% 8.6 76.7 5.5 13.9
Note: CY - calendar year. Source: Davis, S.C. and L.F. Truett, Investigation of Class 2b Trucks (Vehicles of 8,500 to 10,000 lbs GVWR), ORNL/TM-
2002/49, March 2002, Table 16.
Table 4.5 Sales Estimates of Class 1, Class 2a, and Class 2b Light Trucks, 1989–1999
Sales estimates (thousands)
Calendar year Class 1
(6,000 lb and under) Class 2a
(6,001-8,500 lb) Class 2b
(8,501-10,000 lb) Total 1989 3,313 918 379 4,610 1990 3,451 829 268 4,548 1991 3,246 670 206 4,122 1992 3,608 827 194 4,629 1993 4,119 975 257 5,351 1994 4,527 1,241 265 6,033 1995 4,422 1,304 327 6,053 1996 4,829 1,356 334 6,519 1997 5,085 1,315 397 6,797 1998 5,263 1,694 342 7,299 1999 5,707 1,845 521 8,073
Percent change 1989–1999 72.3% 101.0% 37.5% 75.1%
Note: These data were calculated using Methodology 4 from the report. Source: Davis, S.C. and L.F. Truett, Investigation of Class 2b Trucks (Vehicles of 8,500 to 10,000 lbs GVWR), ORNL/TM-
2002/49, March 2002, Table 1. a Estimates derived using 2000 population data and 1997 usage data. See source for details.

4–7
TRANSPORTATION ENERGY DATA BOOK: EDITION 36—2017
Car sales in 2009 and 2010 were below 6 million but increased to more than 7.7 million by 2014 before declining in both 2015 and 2016. In 1980, Chrysler/FCA, Ford and General Motors held 73.8% of the market; by 2016, that had dropped to 27.9%.
Table 4.6
New Retail Car Sales in the United States, 1970–2016
Percentage Calendar Domestica Importb Totalc Percentage FCA/Ford/GM Percentage
year (thousands) imports salesd diesel 1970 7,119 1,280 8,399 15.2% e 0.07% 1975 7,053 1,571 8,624 18.2% e 0.31% 1980 6,580 2,369 8,949 26.5% 73.8% 4.32% 1985 8,205 2,775 10,979 25.3% 72.9% 0.83% 1990 6,919 2,384 9,303 25.6% 65.7% 0.08% 1991 6,162 2,023 8,185 24.7% 64.2% 0.10% 1992 6,286 1,927 8,213 23.5% 65.8% 0.06% 1993 6,742 1,776 8,518 20.9% 67.3% 0.04% 1994 7,255 1,735 8,991 19.3% 65.9% 0.04% 1995 7,114 1,506 8,620 17.5% 65.3% 0.03% 1996 7,206 1,272 8,479 15.0% 64.1% 0.09% 1997 6,862 1,355 8,217 16.5% 62.2% 0.09% 1998 6,705 1,380 8,085 17.1% 59.7% 0.14% 1999 6,919 1,719 8,638 19.9% 58.3% 0.16% 2000 6,762 2,016 8,778 23.0% 55.0% 0.26% 2001 6,254 2,098 8,352 25.1% 51.4% 0.18% 2002 5,817 2,226 8,042 27.7% 48.4% 0.39% 2003 5,473 2,083 7,556 27.6% 47.1% 0.52% 2004 5,333 2,149 7,483 28.7% 44.9% 0.40% 2005 5,473 2,187 7,660 28.5% 43.1% 0.63% 2006 5,417 2,345 7,762 30.2% 40.5% 0.82% 2007 5,197 2,365 7,562 31.3% 36.9% 0.10% 2008 4,491 2,278 6,769 33.7% 34.2% 0.11% 2009 3,558 1,843 5,402 34.1% 31.3% 2.93% 2010 3,791 1,844 5,636 32.7% 31.7% 2.69% 2011 4,146 1,947 6,093 32.0% 33.3% 1.47% 2012 5,120 2,125 7,245 29.3% 31.6% 2.69% 2013 5,433 2,153 7,586 28.4% 32.4% 2.45% 2014 5,610 2,098 7,708 27.2% 31.2% 2.41% 2015 5,595 1,922 7,517 25.6% 29.7% 1.14% 2016 5,169 1,703 6,873 24.8% 27.9% 0.12%
Average annual percentage change 1970–2016 -0.7% 0.6% -0.4% 2006–2016 -0.5% -3.1% -1.2%
Source: Domestic and import data - 1970–97: American Automobile Manufacturers Association, Motor Vehicle Facts and
Figures 1998, Detroit, MI, 1998, p. 15, and annual. 1997 data from Economic Indicators, 4th Quarter 1997. 1998–2016: Ward’s Communication, www.wardsauto.com.
Diesel data - Ward's Communications, www.wardsauto.com. a Any vehicle built in North America regardless of manufacturer. b Any vehicle built outside of North America regardless of manufacturer. Does not include import tourist deliveries. c Sums may not add to totals due to rounding. d Big 3 includes Ford, General Motors, and Fiat-Chrysler (and predecessor entities). e Data are not available.
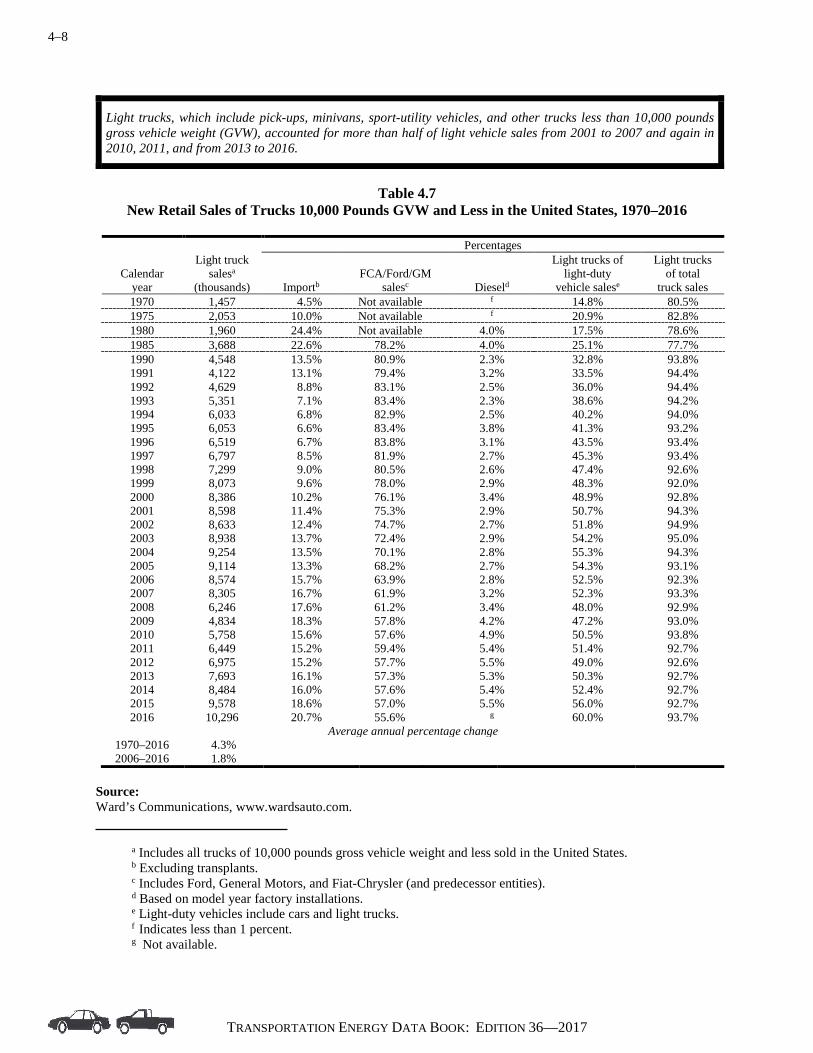
4–8
TRANSPORTATION ENERGY DATA BOOK: EDITION 36—2017
Light trucks, which include pick-ups, minivans, sport-utility vehicles, and other trucks less than 10,000 pounds gross vehicle weight (GVW), accounted for more than half of light vehicle sales from 2001 to 2007 and again in 2010, 2011, and from 2013 to 2016.
Table 4.7
New Retail Sales of Trucks 10,000 Pounds GVW and Less in the United States, 1970–2016
Percentages
Calendar year
Light truck salesa
(thousands) Importb FCA/Ford/GM
salesc Dieseld
Light trucks of light-duty
vehicle salese
Light trucks of total
truck sales 1970 1,457 4.5% Not available f 14.8% 80.5% 1975 2,053 10.0% Not available f 20.9% 82.8% 1980 1,960 24.4% Not available 4.0% 17.5% 78.6% 1985 3,688 22.6% 78.2% 4.0% 25.1% 77.7% 1990 4,548 13.5% 80.9% 2.3% 32.8% 93.8% 1991 4,122 13.1% 79.4% 3.2% 33.5% 94.4% 1992 4,629 8.8% 83.1% 2.5% 36.0% 94.4% 1993 5,351 7.1% 83.4% 2.3% 38.6% 94.2% 1994 6,033 6.8% 82.9% 2.5% 40.2% 94.0% 1995 6,053 6.6% 83.4% 3.8% 41.3% 93.2% 1996 6,519 6.7% 83.8% 3.1% 43.5% 93.4% 1997 6,797 8.5% 81.9% 2.7% 45.3% 93.4% 1998 7,299 9.0% 80.5% 2.6% 47.4% 92.6% 1999 8,073 9.6% 78.0% 2.9% 48.3% 92.0% 2000 8,386 10.2% 76.1% 3.4% 48.9% 92.8% 2001 8,598 11.4% 75.3% 2.9% 50.7% 94.3% 2002 8,633 12.4% 74.7% 2.7% 51.8% 94.9% 2003 8,938 13.7% 72.4% 2.9% 54.2% 95.0% 2004 9,254 13.5% 70.1% 2.8% 55.3% 94.3% 2005 9,114 13.3% 68.2% 2.7% 54.3% 93.1% 2006 8,574 15.7% 63.9% 2.8% 52.5% 92.3% 2007 8,305 16.7% 61.9% 3.2% 52.3% 93.3% 2008 6,246 17.6% 61.2% 3.4% 48.0% 92.9% 2009 4,834 18.3% 57.8% 4.2% 47.2% 93.0% 2010 5,758 15.6% 57.6% 4.9% 50.5% 93.8% 2011 6,449 15.2% 59.4% 5.4% 51.4% 92.7% 2012 6,975 15.2% 57.7% 5.5% 49.0% 92.6% 2013 7,693 16.1% 57.3% 5.3% 50.3% 92.7% 2014 8,484 16.0% 57.6% 5.4% 52.4% 92.7% 2015 9,578 18.6% 57.0% 5.5% 56.0% 92.7% 2016 10,296 20.7% 55.6% g 60.0% 93.7%
Average annual percentage change 1970–2016 4.3% 2006–2016 1.8%
Source: Ward’s Communications, www.wardsauto.com. a Includes all trucks of 10,000 pounds gross vehicle weight and less sold in the United States. b Excluding transplants. c Includes Ford, General Motors, and Fiat-Chrysler (and predecessor entities). d Based on model year factory installations. e Light-duty vehicles include cars and light trucks. f Indicates less than 1 percent. g Not available.
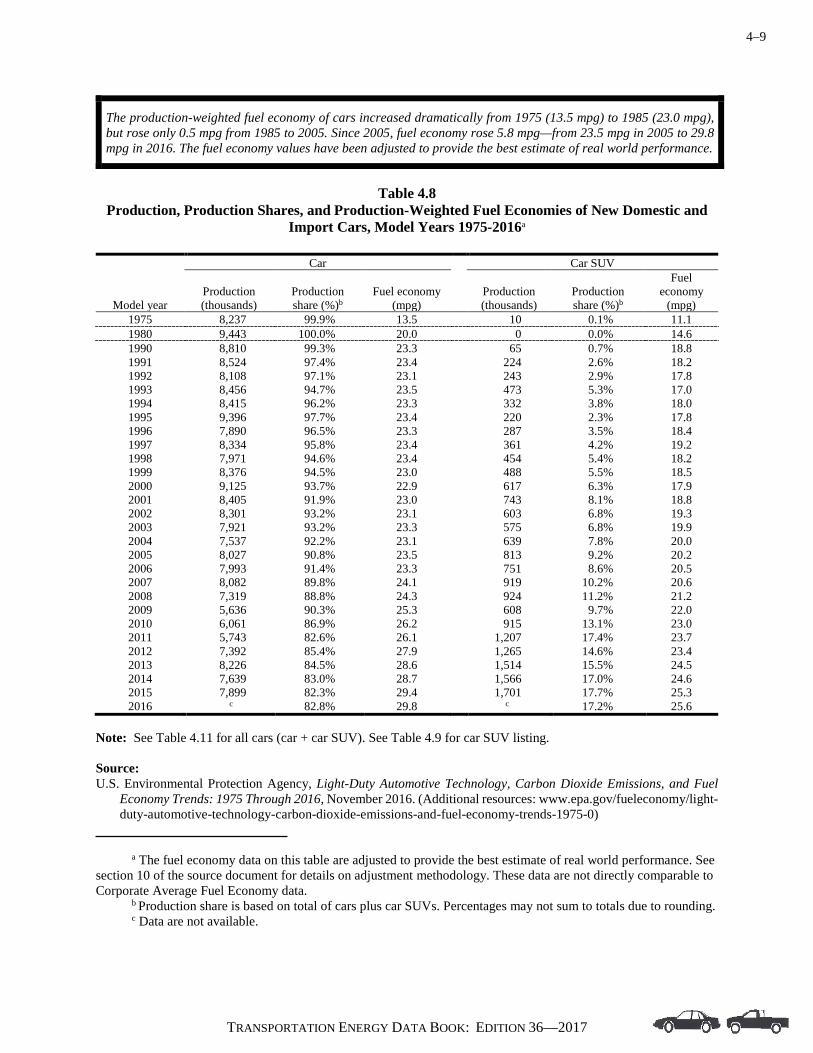
4–9
TRANSPORTATION ENERGY DATA BOOK: EDITION 36—2017
The production-weighted fuel economy of cars increased dramatically from 1975 (13.5 mpg) to 1985 (23.0 mpg), but rose only 0.5 mpg from 1985 to 2005. Since 2005, fuel economy rose 5.8 mpg—from 23.5 mpg in 2005 to 29.8 mpg in 2016. The fuel economy values have been adjusted to provide the best estimate of real world performance.
Table 4.8
Production, Production Shares, and Production-Weighted Fuel Economies of New Domestic and Import Cars, Model Years 1975-2016a
Car Car SUV
Model year Production (thousands)
Production share (%)b
Fuel economy (mpg)
Production (thousands)
Production share (%)b
Fuel economy
(mpg) 1975 8,237 99.9% 13.5 10 0.1% 11.1 1980 9,443 100.0% 20.0 0 0.0% 14.6 1990 8,810 99.3% 23.3 65 0.7% 18.8 1991 8,524 97.4% 23.4 224 2.6% 18.2 1992 8,108 97.1% 23.1 243 2.9% 17.8 1993 8,456 94.7% 23.5 473 5.3% 17.0 1994 8,415 96.2% 23.3 332 3.8% 18.0 1995 9,396 97.7% 23.4 220 2.3% 17.8 1996 7,890 96.5% 23.3 287 3.5% 18.4 1997 8,334 95.8% 23.4 361 4.2% 19.2 1998 7,971 94.6% 23.4 454 5.4% 18.2 1999 8,376 94.5% 23.0 488 5.5% 18.5 2000 9,125 93.7% 22.9 617 6.3% 17.9 2001 8,405 91.9% 23.0 743 8.1% 18.8 2002 8,301 93.2% 23.1 603 6.8% 19.3 2003 7,921 93.2% 23.3 575 6.8% 19.9 2004 7,537 92.2% 23.1 639 7.8% 20.0 2005 8,027 90.8% 23.5 813 9.2% 20.2 2006 7,993 91.4% 23.3 751 8.6% 20.5 2007 8,082 89.8% 24.1 919 10.2% 20.6 2008 7,319 88.8% 24.3 924 11.2% 21.2 2009 5,636 90.3% 25.3 608 9.7% 22.0 2010 6,061 86.9% 26.2 915 13.1% 23.0 2011 5,743 82.6% 26.1 1,207 17.4% 23.7 2012 7,392 85.4% 27.9 1,265 14.6% 23.4 2013 8,226 84.5% 28.6 1,514 15.5% 24.5 2014 7,639 83.0% 28.7 1,566 17.0% 24.6 2015 7,899 82.3% 29.4 1,701 17.7% 25.3 2016 c 82.8% 29.8 c 17.2% 25.6
Note: See Table 4.11 for all cars (car + car SUV). See Table 4.9 for car SUV listing. Source: U.S. Environmental Protection Agency, Light-Duty Automotive Technology, Carbon Dioxide Emissions, and Fuel
Economy Trends: 1975 Through 2016, November 2016. (Additional resources: www.epa.gov/fueleconomy/light-duty-automotive-technology-carbon-dioxide-emissions-and-fuel-economy-trends-1975-0)
a The fuel economy data on this table are adjusted to provide the best estimate of real world performance. See section 10 of the source document for details on adjustment methodology. These data are not directly comparable to Corporate Average Fuel Economy data. b Production share is based on total of cars plus car SUVs. Percentages may not sum to totals due to rounding. c Data are not available.

4–10
TRANSPORTATION ENERGY DATA BOOK: EDITION 36—2017
A vehicle classification was created to match the Corporate Average Fuel Economy (CAFE) methodology. Under CAFE, small, two-wheel drive sport utility vehicles will be held to the same standards as cars. The Environmental Protection Agency has defined these vehicles as “car SUVs.” The vehicles below make up this category.
Table 4.9
Definition of Car Sport Utility Vehicles in Model Year 2016
Acura RDX 2WD Jeep Cherokee FWD BMW X3 sDrive 28i Jeep Compass FWD Buick Encore Jeep Patriot FWD Cadillac SRX Jeep Renegade 4x2 Cadillac SRX AWD Kia Sorento AWD Chevrolet Equinox AWD Kia Sorento FWD Chevrolet Equinox FWD Kia Sportage FWD Chevrolet Trax Kia Sportage SX FWD Dodge Journey Lexus NX 200t Fiat 500X Lexus NX 200t AWD F Sport Ford Edge FWD Lexus NX 300h Ford Escape FWD Lexus RX 350 GMC Terrain AWD Lexus RX 450h GMC Terrain FWD Lincoln MKC FWD Honda CR-V 2WD Lincoln MKX FWD Honda HR-V 2WD Mazda CX-5 2WD Honda HR-V 4WD Mercedes GLC 300 Hyundai Santa Fe Sport AWD Mitsubishi Outlander Sport 2WD Hyundai Santa Fe Sport FWD Nissan Rogue FWD Hyundai Santa Fe Sport Ultimate FWD Tesla Model X AWD Hyundai Tucson AWD Toyota RAV4 Hyundai Tucson Eco AWD Toyota RAV4 LE/XLE Hyundai Tucson Eco FWD Toyota RAV4 Limited AWD/SE AWD Hyundai Tucson Fuel Cella Volvo XC60 FWD Hyundai Tucson FWD Volvo XC70 FWD Infiniti QX70 RWD VW Tiguan
Note: 2WD = Two-wheel drive. 4WD = Four-wheel drive. AWD = All-wheel drive. FWD = Front-wheel drive. Source: U.S. Environmental Protection Agency, Light-Duty Automotive Technology, Carbon Dioxide Emissions, and Fuel
Economy Trends: 1975 Through 2016, November 2016. (Additional resources: www.epa.gov/fueleconomy/light-duty-automotive-technology-carbon-dioxide-emissions-and-fuel-economy-trends-1975-0)
a Alternative fuel vehicle.

4–11
TRANSPORTATION ENERGY DATA BOOK: EDITION 36—2017
Production of sport utility vehicles (SUVs) has grown substantially since 1975. The production-weighted fuel economy of SUVs was more than 22 mpg in 2016. Almost 62% of all light trucks produced in 2016 were SUVs.
Table 4.10
Production, Production Shares, and Production-Weighted Fuel Economies of New Domestic and Import Light Trucks, Model Years 1975-2016a
Pickup Van Truck SUV Fuel Fuel Fuel
Model Year
Production (Thousands)
Share (%)b
Economy (mpg)
Production (Thousands)
Share (%)b
Economy (mpg)
Production (Thousands)
Share (%)b
Economy (mpg)
1975 1,343 67.9% 11.9
457 23.1% 11.1
177 9.0% 11.0 1980 1,437 77.1% 16.5
242 13.0% 14.1
184 9.9% 13.2
1985 2,078 58.0% 18.2
855 23.9% 16.5
648 18.1% 16.5 1986 2,532 59.0% 18.9
1,044 24.3% 17.5
714 16.6% 17.0
1987 2,147 53.2% 19.0
1,114 27.6% 17.7
779 19.3% 17.3 1988 2,459 55.3% 18.1
1,133 25.5% 17.9
859 19.3% 17.0
1989 2,232 51.6% 17.8
1,278 29.5% 17.8
818 18.9% 16.6 1990 1,835 49.1% 17.4
1,262 33.7% 17.8
643 17.2% 16.4
1991 1,920 50.2% 18.2
1,034 27.0% 17.9
871 22.8% 16.7 1992 1,840 48.1% 17.5
1,221 31.9% 17.9
761 19.9% 16.2
1993 2,002 46.8% 17.6
1,441 33.7% 18.2
838 19.6% 16.3 1994 2,669 49.6% 17.4
1,418 26.4% 17.8
1,291 24.0% 16.0
1995 2,271 41.1% 16.9
1,662 30.1% 18.1
1,596 28.9% 16.0 1996 1,955 39.4% 17.1
1,409 28.4% 18.3
1,603 32.3% 16.2
1997 2,408 41.8% 16.8
1,265 22.0% 18.2
2,089 36.3% 16.1 1998 2,415 40.0% 17.0
1,489 24.7% 18.7
2,127 35.3% 16.2
1999 2,544 40.1% 16.3
1,463 23.0% 18.3
2,342 36.9% 16.1 2000 2,612 38.2% 16.7
1,691 24.8% 18.6
2,526 37.0% 16.0
2001 2,519 39.0% 16.0
1,232 19.1% 18.0
2,707 41.9% 16.4 2002 2,380 33.0% 15.8
1,243 17.2% 18.7
3,588 49.8% 16.3
2003 2,474 34.0% 16.1
1,232 16.9% 19.0
3,571 49.1% 16.4 2004 2,505 33.3% 15.7
953 12.7% 19.2
4,075 54.1% 16.5
2005 2,300 32.6% 15.8
1,481 21.0% 19.3
3,272 46.4% 16.7 2006 2,188 34.4% 16.1
1,166 18.3% 19.5
3,006 47.3% 17.2
2007 2,113 33.7% 16.2
847 13.5% 19.5
3,314 52.8% 17.7 2008 1,794 31.7% 16.5
790 14.0% 19.8
3,072 54.3% 18.2
2009 989 32.2% 16.9
368 12.0% 20.1
1,714 55.8% 19.3 2010 1,276 30.8% 16.9
559 13.5% 20.1
2,305 55.7% 19.7
2011 1,479 29.2% 17.2
521 10.3% 21.0
3,069 60.5% 19.8 2012 1,357 28.3% 17.2
661 13.8% 21.3
2,771 57.8% 20.0
2013 1,577 28.9% 17.4
571 10.5% 21.1 3,310 60.6% 20.9 2014 1,929 30.6% 18.0 672 10.7% 21.3 3,706 58.8% 21.7 2015 1,786 25.0% 18.8 655 9.2% 21.9 4,697 65.8% 22.6 2016 c 28.5% 19.0 c 9.5% 21.9 c 61.7% 22.6
Note: Includes light trucks of 8,500 lb or less. See Table 4.11 for all light trucks (pickup + van + truck SUV). Source: U.S. Environmental Protection Agency, Light-Duty Automotive Technology, Carbon Dioxide Emissions, and Fuel
Economy Trends: 1975 Through 2016, November 2016. (Additional resources: www.epa.gov/fueleconomy/light-duty-automotive-technology-carbon-dioxide-emissions-and-fuel-economy-trends-1975-0)
a The fuel economy data on this table are adjusted to provide the best estimate of real world performance. See section 10 of the source document for details on adjustment methodology. These data are not directly comparable to Corporate Average Fuel Economy data. b Production share is based on the total of pickups, plus vans and truck SUVs. Percentages may not sum to totals due to rounding. c Data are not available.
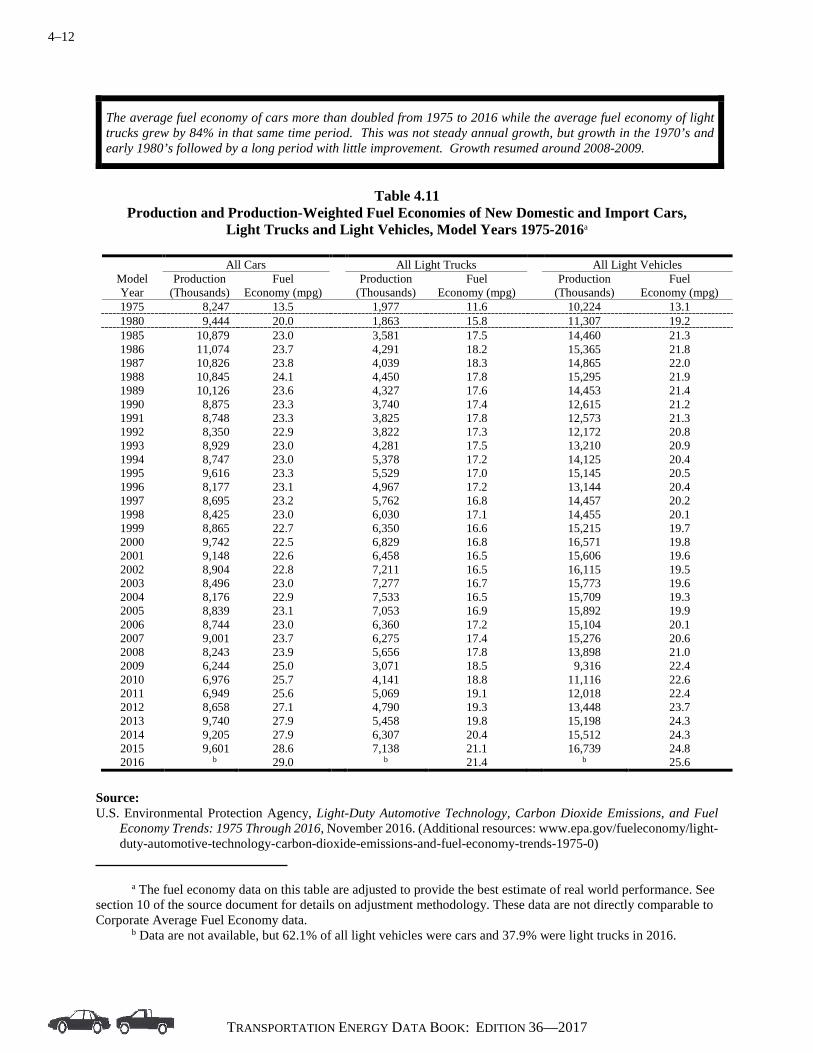
4–12
TRANSPORTATION ENERGY DATA BOOK: EDITION 36—2017
The average fuel economy of cars more than doubled from 1975 to 2016 while the average fuel economy of light trucks grew by 84% in that same time period. This was not steady annual growth, but growth in the 1970’s and early 1980’s followed by a long period with little improvement. Growth resumed around 2008-2009.
Table 4.11
Production and Production-Weighted Fuel Economies of New Domestic and Import Cars, Light Trucks and Light Vehicles, Model Years 1975-2016a
All Cars All Light Trucks All Light Vehicles
Model Production Fuel Production Fuel Production Fuel Year (Thousands) Economy (mpg) (Thousands) Economy (mpg) (Thousands) Economy (mpg) 1975 8,247 13.5 1,977 11.6 10,224 13.1 1980 9,444 20.0 1,863 15.8 11,307 19.2 1985 10,879 23.0 3,581 17.5 14,460 21.3 1986 11,074 23.7 4,291 18.2 15,365 21.8 1987 10,826 23.8 4,039 18.3 14,865 22.0 1988 10,845 24.1 4,450 17.8 15,295 21.9 1989 10,126 23.6 4,327 17.6 14,453 21.4 1990 8,875 23.3 3,740 17.4 12,615 21.2 1991 8,748 23.3 3,825 17.8 12,573 21.3 1992 8,350 22.9 3,822 17.3 12,172 20.8 1993 8,929 23.0 4,281 17.5 13,210 20.9 1994 8,747 23.0 5,378 17.2 14,125 20.4 1995 9,616 23.3 5,529 17.0 15,145 20.5 1996 8,177 23.1 4,967 17.2 13,144 20.4 1997 8,695 23.2 5,762 16.8 14,457 20.2 1998 8,425 23.0 6,030 17.1 14,455 20.1 1999 8,865 22.7 6,350 16.6 15,215 19.7 2000 9,742 22.5 6,829 16.8 16,571 19.8 2001 9,148 22.6 6,458 16.5 15,606 19.6 2002 8,904 22.8 7,211 16.5 16,115 19.5 2003 8,496 23.0 7,277 16.7 15,773 19.6 2004 8,176 22.9 7,533 16.5 15,709 19.3 2005 8,839 23.1 7,053 16.9 15,892 19.9 2006 8,744 23.0 6,360 17.2 15,104 20.1 2007 9,001 23.7 6,275 17.4 15,276 20.6 2008 8,243 23.9 5,656 17.8 13,898 21.0 2009 6,244 25.0 3,071 18.5 9,316 22.4 2010 6,976 25.7 4,141 18.8 11,116 22.6 2011 6,949 25.6 5,069 19.1 12,018 22.4 2012 8,658 27.1 4,790 19.3 13,448 23.7 2013 9,740 27.9 5,458 19.8 15,198 24.3 2014 9,205 27.9 6,307 20.4 15,512 24.3 2015 9,601 28.6 7,138 21.1 16,739 24.8 2016 b 29.0 b 21.4 b 25.6
Source: U.S. Environmental Protection Agency, Light-Duty Automotive Technology, Carbon Dioxide Emissions, and Fuel
Economy Trends: 1975 Through 2016, November 2016. (Additional resources: www.epa.gov/fueleconomy/light-duty-automotive-technology-carbon-dioxide-emissions-and-fuel-economy-trends-1975-0)
a The fuel economy data on this table are adjusted to provide the best estimate of real world performance. See section 10 of the source document for details on adjustment methodology. These data are not directly comparable to Corporate Average Fuel Economy data. b Data are not available, but 62.1% of all light vehicles were cars and 37.9% were light trucks in 2016.

4–13
TRANSPORTATION ENERGY DATA BOOK: EDITION 36—2017
Back in 1975 only 19.3% of new light vehicles produced were light trucks. Because of the boom in production of minivans, sport utility vehicles, and pick-up trucks, that number rose to over 40% in 1998. The car SUV category was almost 11% of production in 2016 and the truck SUVs were 23%.
Table 4.12
Light Vehicle Production Sharesa, Model Years 1975–2016
Total Light
Vehicles
Production Share
Model
Car
Truck Produced
Light Year Car SUV Pickup Van SUV (thousands)
Carsb Trucks
1975 80.6% 0.1% 13.1% 4.5% 1.7% 10,224
80.7% 19.3% 1980 83.5% 0.0% 12.7% 2.1% 1.6% 11,306
83.5% 16.5%
1985 74.6% 0.6% 14.4% 5.9% 4.5% 14,460
75.2% 24.8% 1986 71.7% 0.4% 16.5% 6.8% 4.6% 15,365
72.1% 27.9%
1987 72.2% 0.6% 14.4% 7.5% 5.2% 14,865
72.8% 27.2% 1988 70.2% 0.7% 16.1% 7.4% 5.6% 15,295
70.9% 29.1%
1989 69.3% 0.7% 15.4% 8.8% 5.7% 14,453
70.1% 29.9% 1990 69.8% 0.5% 14.5% 10.0% 5.1% 12,615
70.4% 29.6%
1991 67.8% 1.8% 15.3% 8.2% 6.9% 12,573
69.6% 30.4% 1992 66.6% 2.0% 15.1% 10.0% 6.2% 12,172
68.6% 31.4%
1993 64.0% 3.6% 15.2% 10.9% 6.3% 13,211
67.6% 32.4% 1994 59.6% 2.3% 18.9% 10.0% 9.1% 14,125
61.9% 38.1%
1995 62.0% 1.5% 15.0% 11.0% 10.5% 15,145
63.5% 36.5% 1996 60.0% 2.2% 14.9% 10.7% 12.2% 13,144
62.2% 37.8%
1997 57.6% 2.5% 16.7% 8.8% 14.5% 14,458
60.1% 39.9% 1998 55.1% 3.1% 16.7% 10.3% 14.7% 14,456
58.3% 41.7%
1999 55.1% 3.2% 16.7% 9.6% 15.4% 15,215
58.3% 41.7% 2000 55.1% 3.7% 15.8% 10.2% 15.2% 16,571
58.8% 41.2%
2001 53.9% 4.8% 16.1% 7.9% 17.3% 15,605
58.6% 41.4% 2002 51.5% 3.7% 14.8% 7.7% 22.3% 16,115
55.3% 44.7%
2003 50.2% 3.6% 15.7% 7.8% 22.6% 15,773
53.9% 46.1% 2004 48.0% 4.1% 15.9% 6.1% 25.9% 15,709
52.0% 48.0%
2005 50.5% 5.1% 14.5% 9.3% 20.6% 15,892
55.6% 44.4% 2006 52.9% 5.0% 14.5% 7.7% 19.9% 15,104
57.9% 42.1%
2007 52.9% 6.0% 13.8% 5.5% 21.7% 15,276
58.9% 41.1% 2008 52.7% 6.6% 12.9% 5.7% 22.1% 13,898
59.3% 40.7%
2009 60.5% 6.5% 10.6% 4.0% 18.4% 9,316
67.0% 33.0% 2010 54.5% 8.2% 11.5% 5.0% 20.7% 11,116
62.8% 37.3%
2011 47.8% 10.0% 12.3% 4.3% 25.5% 12,018
57.8% 42.2% 2012 55.0% 9.4% 10.1% 4.9% 20.6% 13,448
64.4% 35.6%
2013 54.1% 10.0% 10.4% 3.8% 21.8% 15,198
64.1% 35.9% 2014 49.2% 10.1% 12.4% 4.3% 23.9% 15,512 59.3% 40.7% 2015 47.2% 10.2% 10.7% 3.9% 28.1% 16,739 57.4% 42.6% 2016 51.4% 10.7% 10.8% 3.7% 23.4% c 62.1% 37.9%
Note: Includes light trucks of 8,500 lb or less. Source: U.S. Environmental Protection Agency, Light-Duty Automotive Technology, Carbon Dioxide Emissions, and Fuel
Economy Trends: 1975 Through 2016, November 2016. (Additional resources: www.epa.gov/fueleconomy/light-duty-automotive-technology-carbon-dioxide-emissions-and-fuel-economy-trends-1975-0)
a Percentages may not sum to totals due to rounding. b Cars include both car and car SUV categories. c Data are not available.
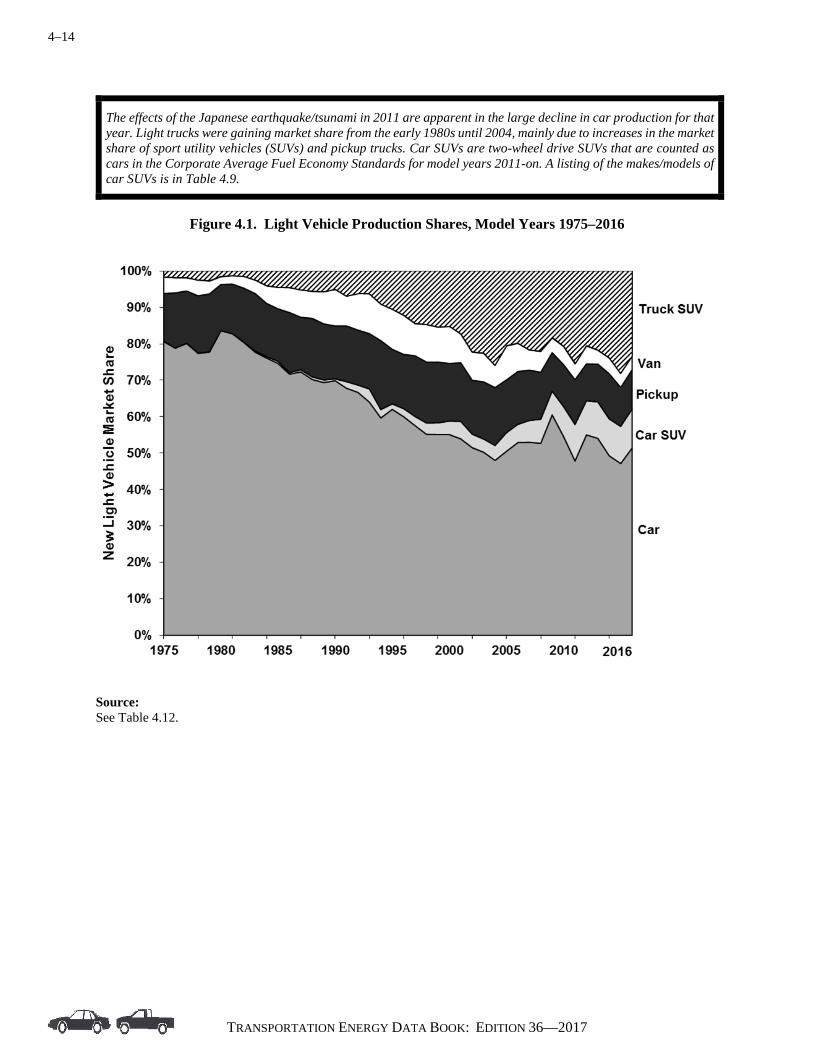
4–14
TRANSPORTATION ENERGY DATA BOOK: EDITION 36—2017
The effects of the Japanese earthquake/tsunami in 2011 are apparent in the large decline in car production for that year. Light trucks were gaining market share from the early 1980s until 2004, mainly due to increases in the market share of sport utility vehicles (SUVs) and pickup trucks. Car SUVs are two-wheel drive SUVs that are counted as cars in the Corporate Average Fuel Economy Standards for model years 2011-on. A listing of the makes/models of car SUVs is in Table 4.9.
Figure 4.1. Light Vehicle Production Shares, Model Years 1975–2016
Source: See Table 4.12.

4–15
TRANSPORTATION ENERGY DATA BOOK: EDITION 36—2017
The production-weighted average engine displacement of cars in 1975 was 4.72 liters, but had declined to 2.34 liters by 2016. Car SUVs also experienced a decline in engine displacement. For a list of car SUVs, see Table 4.9.
Table 4.13
Production-Weighted Engine Size of New Domestic and Import Cars Model Years 1975-2016
(litersa)
Model Year Car Car SUV 1975 4.72 4.29 1980 3.08 4.59 1985 2.90 2.80 1986 2.74 2.79 1987 2.65 2.93 1988 2.62 3.26 1989 2.67 3.70 1990 2.67 3.43 1991 2.67 3.52 1992 2.79 3.44 1993 2.72 3.90 1994 2.75 3.43 1995 2.74 3.51 1996 2.70 3.52 1997 2.69 3.11 1998 2.69 3.57 1999 2.72 3.46 2000 2.70 3.46 2001 2.70 3.18 2002 2.72 3.00 2003 2.70 2.97 2004 2.75 3.13 2005 2.72 3.05 2006 2.82 3.02 2007 2.70 3.03 2008 2.70 2.93 2009 2.54 2.87 2010 2.56 2.82 2011 2.61 2.72 2012 2.43 2.74 2013 2.38 2.64 2014 2.39 2.52 2015 2.38 2.51 2016 2.34 2.43
Annual average percentage change 1975–2016 -1.7% -1.4% 2006–2016 -1.8% -2.2%
Source: U.S. Environmental Protection Agency, Light-Duty Automotive Technology, Carbon Dioxide Emissions, and Fuel
Economy Trends: 1975 Through 2016, November 2016. (Additional resources: www.epa.gov/fueleconomy/light-duty-automotive-technology-carbon-dioxide-emissions-and-fuel-economy-trends-1975-0)
a 1 liter = 61.02 cubic inches.
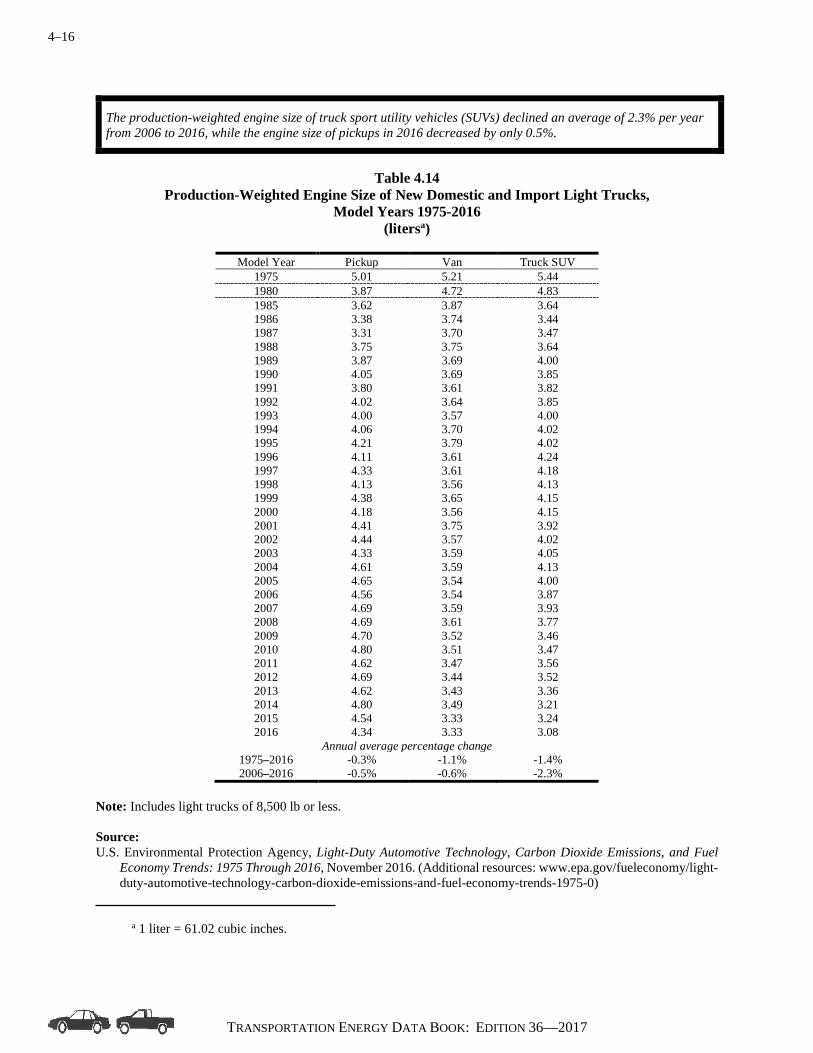
4–16
TRANSPORTATION ENERGY DATA BOOK: EDITION 36—2017
The production-weighted engine size of truck sport utility vehicles (SUVs) declined an average of 2.3% per year from 2006 to 2016, while the engine size of pickups in 2016 decreased by only 0.5%.
Table 4.14
Production-Weighted Engine Size of New Domestic and Import Light Trucks, Model Years 1975-2016
(litersa)
Model Year Pickup Van Truck SUV 1975 5.01 5.21 5.44 1980 3.87 4.72 4.83 1985 3.62 3.87 3.64 1986 3.38 3.74 3.44 1987 3.31 3.70 3.47 1988 3.75 3.75 3.64 1989 3.87 3.69 4.00 1990 4.05 3.69 3.85 1991 3.80 3.61 3.82 1992 4.02 3.64 3.85 1993 4.00 3.57 4.00 1994 4.06 3.70 4.02 1995 4.21 3.79 4.02 1996 4.11 3.61 4.24 1997 4.33 3.61 4.18 1998 4.13 3.56 4.13 1999 4.38 3.65 4.15 2000 4.18 3.56 4.15 2001 4.41 3.75 3.92 2002 4.44 3.57 4.02 2003 4.33 3.59 4.05 2004 4.61 3.59 4.13 2005 4.65 3.54 4.00 2006 4.56 3.54 3.87 2007 4.69 3.59 3.93 2008 4.69 3.61 3.77 2009 4.70 3.52 3.46 2010 4.80 3.51 3.47 2011 4.62 3.47 3.56 2012 4.69 3.44 3.52 2013 4.62 3.43 3.36 2014 4.80 3.49 3.21 2015 4.54 3.33 3.24 2016 4.34 3.33 3.08
Annual average percentage change 1975–2016 -0.3% -1.1% -1.4% 2006–2016 -0.5% -0.6% -2.3%
Note: Includes light trucks of 8,500 lb or less. Source: U.S. Environmental Protection Agency, Light-Duty Automotive Technology, Carbon Dioxide Emissions, and Fuel
Economy Trends: 1975 Through 2016, November 2016. (Additional resources: www.epa.gov/fueleconomy/light-duty-automotive-technology-carbon-dioxide-emissions-and-fuel-economy-trends-1975-0)
a 1 liter = 61.02 cubic inches.

4–17
TRANSPORTATION ENERGY DATA BOOK: EDITION 36—2017
The production-weighted loaded vehicle weight of cars declined almost 550 lb from 1975 to 2016, while car SUVs declined by 151 lb.
Table 4.15
Production-Weighted Loaded Vehicle Weighta of New Domestic and Import Cars, Model Years 1975–2016
(pounds)
Model Year Car Car SUV 1975 4,058 4,000 1980 3,101 4,000 1981 3,076 4,000 1982 3,054 2,630 1983 3,112 3,124 1984 3,099 3,487 1985 3,093 3,469 1986 3,041 3,479 1987 3,031 3,492 1988 3,047 3,495 1989 3,099 3,497 1990 3,176 3,518 1991 3,154 3,733 1992 3,240 3,713 1993 3,207 3,848 1994 3,250 3,735 1995 3,263 3,763 1996 3,282 3,710 1997 3,274 3,549 1998 3,306 3,824 1999 3,365 3,831 2000 3,369 3,870 2001 3,380 3,765 2002 3,391 3,747 2003 3,417 3,716 2004 3,462 3,854 2005 3,463 3,848 2006 3,534 3,876 2007 3,507 3,935 2008 3,527 3,902 2009 3,464 3,846 2010 3,474 3,949 2011 3,559 3,890 2012 3,452 3,915 2013 3,465 3,966 2014 3,497 3,865 2015 3,489 3,868 2016 3,509 3,849
Annual average percentage change 1975–2016 -0.4% -0.1% 2006–2016 -0.1% -0.1%
Source: U.S. Environmental Protection Agency, Light-Duty Automotive Technology, Carbon Dioxide Emissions, and Fuel
Economy Trends: 1975 Through 2016, November 2016. (Additional resources: www.epa.gov/fueleconomy/light-duty-automotive-technology-carbon-dioxide-emissions-and-fuel-economy-trends-1975-0)
a Loaded vehicle weight is equal to the vehicle’s curb weight plus 300 pounds.

4–18
TRANSPORTATION ENERGY DATA BOOK: EDITION 36—2017
The production-weighted loaded vehicle weight of pickups, vans, and truck SUVs increased from 1975 to 2016. Pickups gained almost 1,200 lb while vans gained 210 lb and truck SUVs gained 261 lb.
Table 4.16
Production-Weighted Loaded Vehicle Weight of New Domestic and Import Light Trucks, Model Years 1975–2016
(pounds)
Model Year Pickup Van Truck SUV 1975 4,012 4,196 4,214 1980 3,740 4,353 4,237 1981 3,679 4,324 4,208 1982 3,629 4,342 4,494 1983 3,544 4,414 4,270 1984 3,619 4,075 4,049 1985 3,642 3,975 4,092 1986 3,574 3,998 3,958 1987 3,526 3,972 3,882 1988 3,737 4,053 3,906 1989 3,803 4,057 4,086 1990 3,928 4,095 4,098 1991 3,779 4,133 4,157 1992 3,976 4,151 4,204 1993 3,996 4,105 4,331 1994 4,056 4,156 4,331 1995 4,182 4,110 4,323 1996 4,190 4,195 4,386 1997 4,415 4,240 4,463 1998 4,282 4,183 4,450 1999 4,486 4,306 4,518 2000 4,340 4,276 4,602 2001 4,551 4,518 4,546 2002 4,690 4,394 4,636 2003 4,642 4,393 4,754 2004 4,939 4,487 4,756 2005 4,988 4,430 4,756 2006 4,968 4,475 4,715 2007 5,144 4,479 4,797 2008 5,161 4,527 4,727 2009 5,176 4,572 4,548 2010 5,309 4,533 4,555 2011 5,268 4,502 4,665 2012 5,335 4,442 4,640 2013 5,429 4,543 4,584 2014 5,485 4,489 4,483 2015 5,165 4,416 4,533 2016 5,177 4,406 4,475
Annual average percentage change 1975–2016 0.6% 0.1% 0.1% 2006–2016 0.4% -0.2% -0.5%
Source: U.S. Environmental Protection Agency, Light-Duty Automotive Technology, Carbon Dioxide Emissions, and Fuel
Economy Trends: 1975 Through 2016, November 2016. (Additional resources: www.epa.gov/fueleconomy/light-duty-automotive-technology-carbon-dioxide-emissions-and-fuel-economy-trends-1975-0)
a Loaded vehicle weight is equal to the vehicle’s curb weight plus 300 pounds.
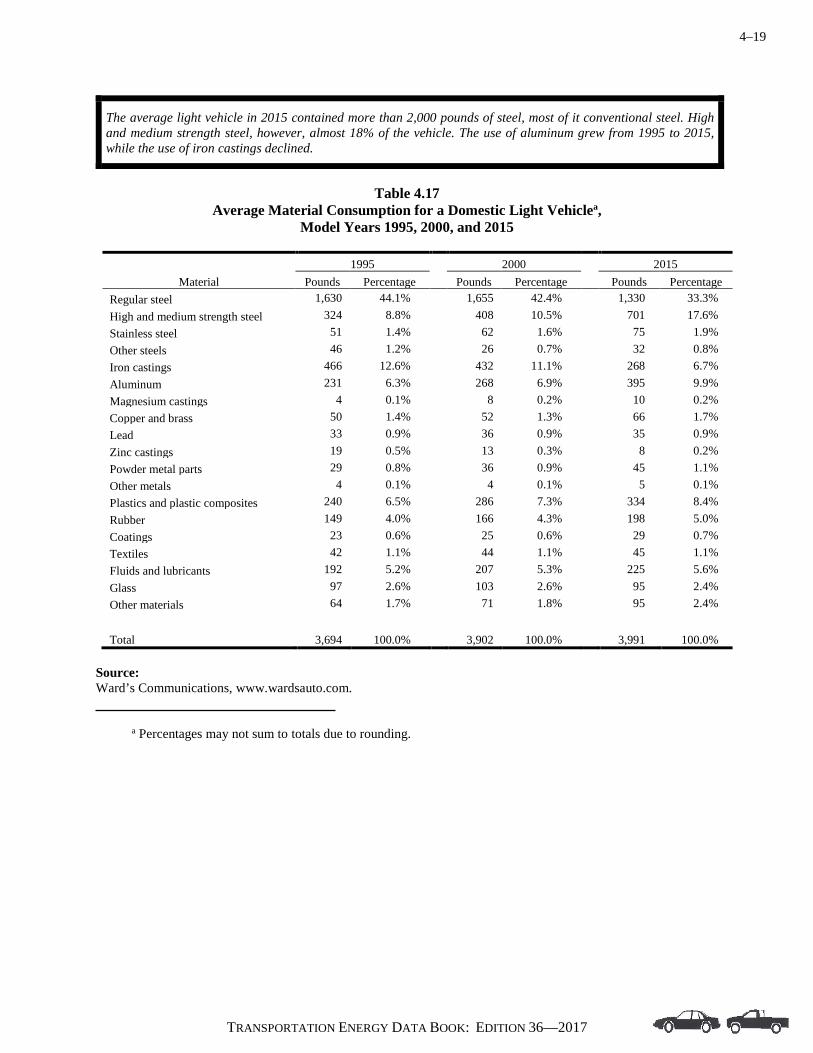
4–19
TRANSPORTATION ENERGY DATA BOOK: EDITION 36—2017
The average light vehicle in 2015 contained more than 2,000 pounds of steel, most of it conventional steel. High and medium strength steel, however, almost 18% of the vehicle. The use of aluminum grew from 1995 to 2015, while the use of iron castings declined.
Table 4.17
Average Material Consumption for a Domestic Light Vehiclea, Model Years 1995, 2000, and 2015
1995 2000 2015 Material Pounds Percentage Pounds Percentage Pounds Percentage
Regular steel 1,630 44.1% 1,655 42.4% 1,330 33.3% High and medium strength steel 324 8.8% 408 10.5% 701 17.6% Stainless steel 51 1.4% 62 1.6% 75 1.9% Other steels 46 1.2% 26 0.7% 32 0.8% Iron castings 466 12.6% 432 11.1% 268 6.7% Aluminum 231 6.3% 268 6.9% 395 9.9% Magnesium castings 4 0.1% 8 0.2% 10 0.2% Copper and brass 50 1.4% 52 1.3% 66 1.7% Lead 33 0.9% 36 0.9% 35 0.9% Zinc castings 19 0.5% 13 0.3% 8 0.2% Powder metal parts 29 0.8% 36 0.9% 45 1.1% Other metals 4 0.1% 4 0.1% 5 0.1% Plastics and plastic composites 240 6.5% 286 7.3% 334 8.4% Rubber 149 4.0% 166 4.3% 198 5.0% Coatings 23 0.6% 25 0.6% 29 0.7% Textiles 42 1.1% 44 1.1% 45 1.1% Fluids and lubricants 192 5.2% 207 5.3% 225 5.6% Glass 97 2.6% 103 2.6% 95 2.4% Other materials 64 1.7% 71 1.8% 95 2.4%
Total 3,694 100.0% 3,902 100.0% 3,991 100.0% Source: Ward’s Communications, www.wardsauto.com. a Percentages may not sum to totals due to rounding.
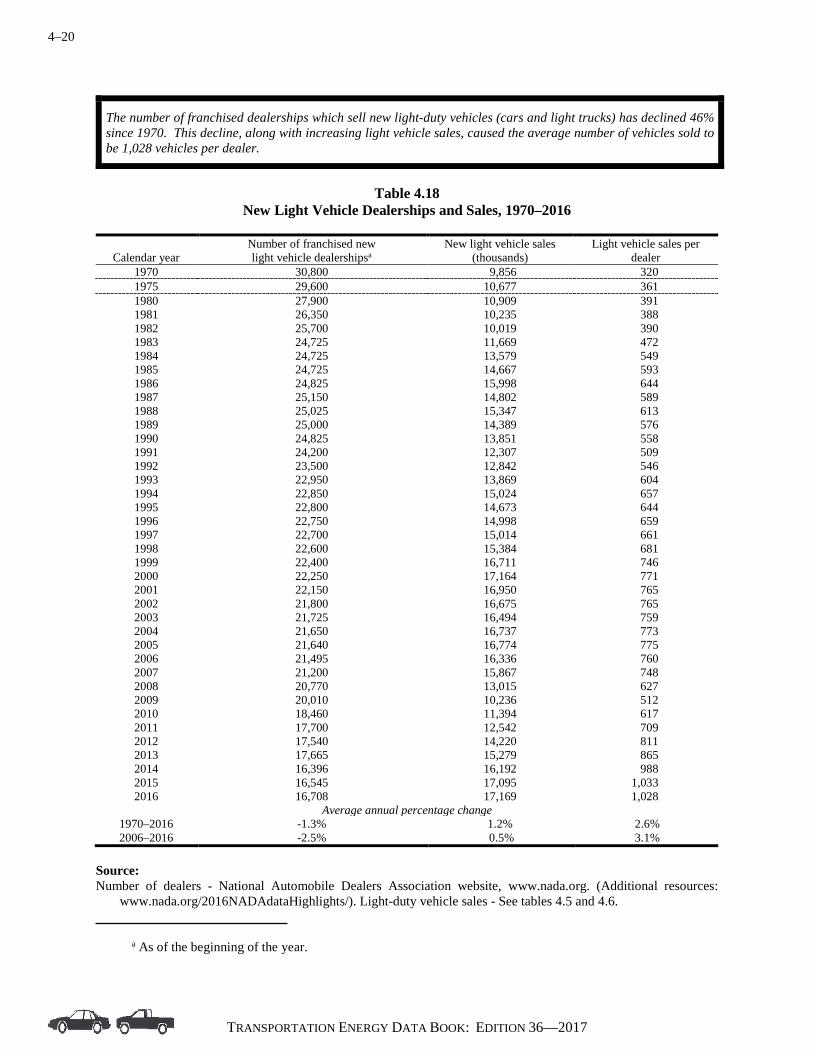
4–20
TRANSPORTATION ENERGY DATA BOOK: EDITION 36—2017
The number of franchised dealerships which sell new light-duty vehicles (cars and light trucks) has declined 46% since 1970. This decline, along with increasing light vehicle sales, caused the average number of vehicles sold to be 1,028 vehicles per dealer.
Table 4.18
New Light Vehicle Dealerships and Sales, 1970–2016
Calendar year Number of franchised new light vehicle dealershipsa
New light vehicle sales (thousands)
Light vehicle sales per dealer
1970 30,800 9,856 320 1975 29,600 10,677 361 1980 27,900 10,909 391 1981 26,350 10,235 388 1982 25,700 10,019 390 1983 24,725 11,669 472 1984 24,725 13,579 549 1985 24,725 14,667 593 1986 24,825 15,998 644 1987 25,150 14,802 589 1988 25,025 15,347 613 1989 25,000 14,389 576 1990 24,825 13,851 558 1991 24,200 12,307 509 1992 23,500 12,842 546 1993 22,950 13,869 604 1994 22,850 15,024 657 1995 22,800 14,673 644 1996 22,750 14,998 659 1997 22,700 15,014 661 1998 22,600 15,384 681 1999 22,400 16,711 746 2000 22,250 17,164 771 2001 22,150 16,950 765 2002 21,800 16,675 765 2003 21,725 16,494 759 2004 21,650 16,737 773 2005 21,640 16,774 775 2006 21,495 16,336 760 2007 21,200 15,867 748 2008 20,770 13,015 627 2009 20,010 10,236 512 2010 18,460 11,394 617 2011 17,700 12,542 709 2012 17,540 14,220 811 2013 17,665 15,279 865 2014 16,396 16,192 988 2015 16,545 17,095 1,033 2016 16,708 17,169 1,028
Average annual percentage change 1970–2016 -1.3% 1.2% 2.6% 2006–2016 -2.5% 0.5% 3.1%
Source: Number of dealers - National Automobile Dealers Association website, www.nada.org. (Additional resources:
www.nada.org/2016NADAdataHighlights/). Light-duty vehicle sales - See tables 4.5 and 4.6. a As of the beginning of the year.

4–21
TRANSPORTATION ENERGY DATA BOOK: EDITION 36—2017
In 2010 the number of conventional refueling stations fell below 160,000 for the first time in the series history and continued to decline through 2013. The number of vehicles fueling at those stations fell in 2009 for the first time in several years but began rising slowly in 2011. In 2013, there were 0.61 fueling stations per thousand vehicles or 1.65 thousand vehicles per station.
Table 4.19
Conventional Refueling Stations, 1993-2013
Number of retail
outlets
Vehicles in operation
(thousands) Stations per
thousand vehicles
Thousand vehicles per
station Year Conventional fuels 1993 207,416 186,315 1.11 0.90 1994 202,878 188,714 1.08 0.93 1995 195,455 193,441 1.01 0.99 1996 190,246 198,294 0.96 1.04 1997 187,892 201,071 0.93 1.07 1998 182,596 205,043 0.89 1.12 1999 180,567 209,509 0.86 1.16 2000 175,941 213,299 0.82 1.21 2001 172,169 216,683 0.79 1.26 2002 170,018 221,027 0.77 1.30 2003 167,571 225,882 0.74 1.35 2004 167,346 232,167 0.72 1.39 2005 168,987 238,384 0.71 1.41 2006 167,476 244,643 0.69 1.46 2007 164,292 248,701 0.66 1.51 2008 161,068 249,813 0.64 1.55 2009 162,350 248,972 0.65 1.53 2010 159,006 248,231 0.64 1.56 2011 157,393 248,932 0.63 1.58 2012 156,065 251,497 0.62 1.61 2013 152,995 252,715 0.61 1.65
Notes: This data series was discontinued after 2013. The County Business Patterns (CBP) data published by the Bureau of the Census tells the number of establishments by North American Industry Classification System (NAICS). NAICS is an industry classification system that groups establishments into industries based on the activities in which they are primarily engaged. NAICS 447 represents gasoline stations. However, the CBP gasoline station data differ from the National Petroleum News Survey data by as much as 30% (117,189 stations in 2005); the CBP may not include every gasoline retail outlet due to the classification of the primary activity of the business. Alternative Fuel Refueling Stations are listed in Chapter 6. Sources: Conventional refueling stations: National Petroleum News Survey, 2013. (Source discontinued after 2013.) Conventional vehicles: IHS Automotive, Detroit, MI. FURTHER REPRODUCTION PROHIBITED.
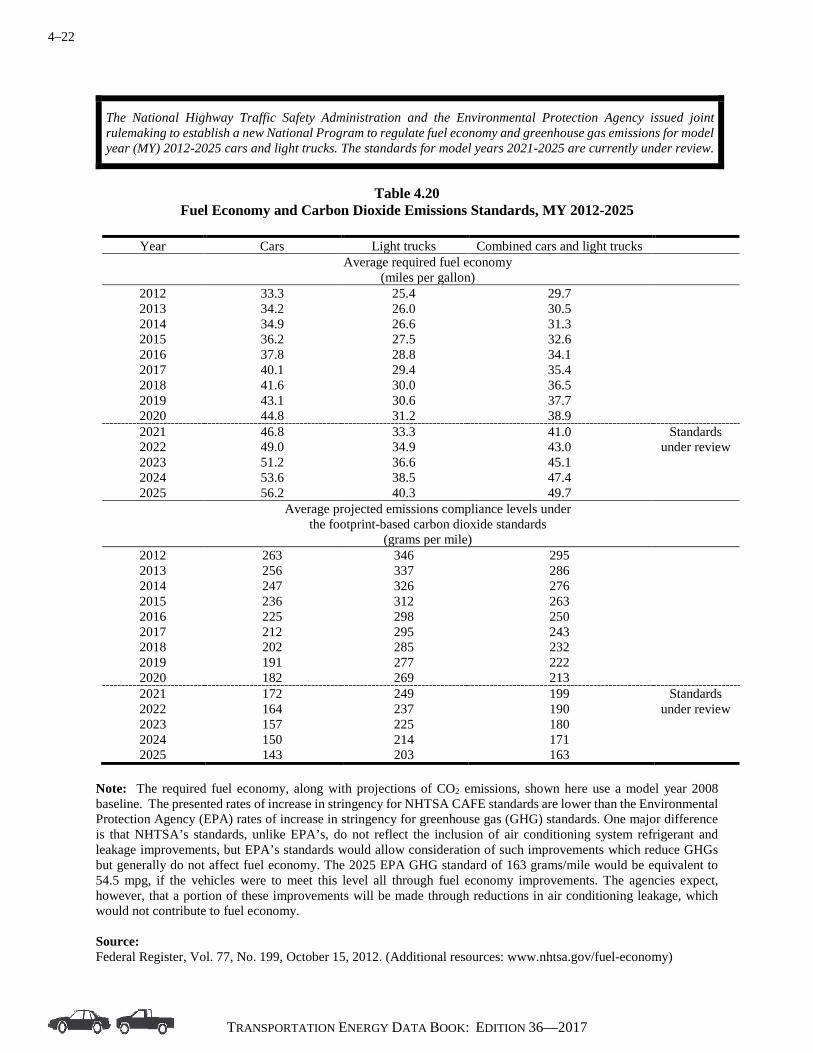
4–22
TRANSPORTATION ENERGY DATA BOOK: EDITION 36—2017
The National Highway Traffic Safety Administration and the Environmental Protection Agency issued joint rulemaking to establish a new National Program to regulate fuel economy and greenhouse gas emissions for model year (MY) 2012-2025 cars and light trucks. The standards for model years 2021-2025 are currently under review.
Table 4.20
Fuel Economy and Carbon Dioxide Emissions Standards, MY 2012-2025
Year Cars Light trucks Combined cars and light trucks
Average required fuel economy
(miles per gallon)
2012 33.3 25.4 29.7 2013 34.2 26.0 30.5 2014 34.9 26.6 31.3 2015 36.2 27.5 32.6 2016 37.8 28.8 34.1 2017 40.1 29.4 35.4 2018 41.6 30.0 36.5 2019 43.1 30.6 37.7 2020 44.8 31.2 38.9 2021 46.8 33.3 41.0 Standards
under review 2022 49.0 34.9 43.0 2023 51.2 36.6 45.1 2024 53.6 38.5 47.4 2025 56.2 40.3 49.7
Average projected emissions compliance levels under the footprint-based carbon dioxide standards
(grams per mile)
2012 263 346 295 2013 256 337 286 2014 247 326 276 2015 236 312 263 2016 225 298 250 2017 212 295 243 2018 202 285 232 2019 191 277 222 2020 182 269 213 2021 172 249 199 Standards
under review 2022 164 237 190 2023 157 225 180 2024 150 214 171 2025 143 203 163
Note: The required fuel economy, along with projections of CO2 emissions, shown here use a model year 2008 baseline. The presented rates of increase in stringency for NHTSA CAFE standards are lower than the Environmental Protection Agency (EPA) rates of increase in stringency for greenhouse gas (GHG) standards. One major difference is that NHTSA’s standards, unlike EPA’s, do not reflect the inclusion of air conditioning system refrigerant and leakage improvements, but EPA’s standards would allow consideration of such improvements which reduce GHGs but generally do not affect fuel economy. The 2025 EPA GHG standard of 163 grams/mile would be equivalent to 54.5 mpg, if the vehicles were to meet this level all through fuel economy improvements. The agencies expect, however, that a portion of these improvements will be made through reductions in air conditioning leakage, which would not contribute to fuel economy. Source: Federal Register, Vol. 77, No. 199, October 15, 2012. (Additional resources: www.nhtsa.gov/fuel-economy)

4–23
TRANSPORTATION ENERGY DATA BOOK: EDITION 36—2017
The target levels for the fuel economy and carbon dioxide emission standards for vehicles manufactured in model years 2012-on are assigned based on a vehicle’s “footprint.” Each footprint has a different target. The vehicle
footprint is calculated as:
footprint = track width × wheelbase,
where
track width = lateral distance between the centerlines of the base tires at ground, and wheelbase = longitudinal distance between the front and rear wheel centerlines.
Table 4.21
Fuel Economy and Carbon Dioxide Targets for Model Year 2025
Vehicle type Example models
Example model footprint
(square feet)
CO2 emissions target
(grams per mile) Fuel economy target
(miles per gallon) Example Passenger Cars
Compact car Honda Fit 40 131 61.1 Midsize car Ford Fusion 46 147 54.9 Fullsize car Chrysler 300 53 170 48.0
Example Light-Duty Trucks Small SUV 4WD Ford Escape 44 170 47.5 Midsize crossover Nissan Murano 49 188 43.4 Minivan Toyota Sienna 55 209 39.2 Large pickup truck Chevy Silverado 67 252 33.0
Notes: The model year 2025 targets are currently under review. Examples in table use model year 2012 vehicle specifications. The fuel economy from this table will not match the fuel economy listed on the window sticker of a new vehicle. Window sticker fuel economy is calculated by a different methodology than the Corporate Average Fuel Economy. Source: Federal Register, Vol. 77, No. 199, October 15, 2012. (Additional resources: www.nhtsa.gov/fuel-economy)
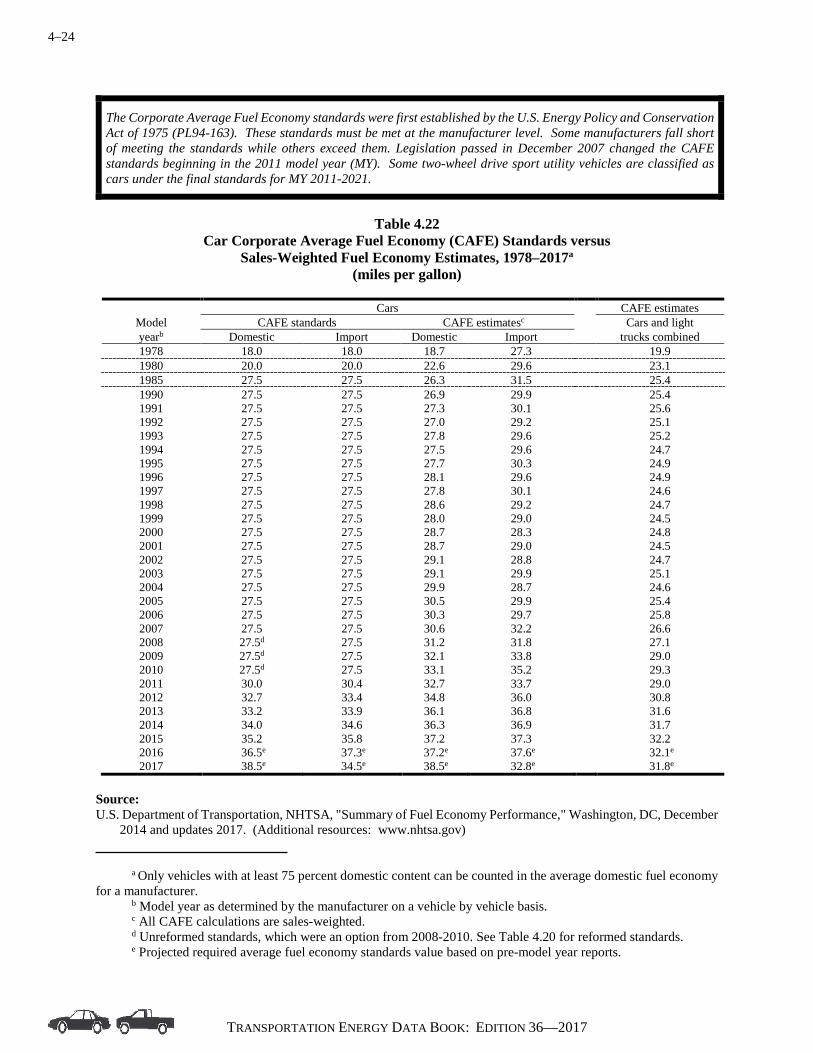
4–24
TRANSPORTATION ENERGY DATA BOOK: EDITION 36—2017
The Corporate Average Fuel Economy standards were first established by the U.S. Energy Policy and Conservation Act of 1975 (PL94-163). These standards must be met at the manufacturer level. Some manufacturers fall short of meeting the standards while others exceed them. Legislation passed in December 2007 changed the CAFE standards beginning in the 2011 model year (MY). Some two-wheel drive sport utility vehicles are classified as cars under the final standards for MY 2011-2021.
Table 4.22
Car Corporate Average Fuel Economy (CAFE) Standards versus Sales-Weighted Fuel Economy Estimates, 1978–2017a
(miles per gallon)
Cars CAFE estimates Model CAFE standards CAFE estimatesc Cars and light yearb Domestic Import Domestic Import trucks combined 1978 18.0 18.0 18.7 27.3 19.9 1980 20.0 20.0 22.6 29.6 23.1 1985 27.5 27.5 26.3 31.5 25.4 1990 27.5 27.5 26.9 29.9 25.4 1991 27.5 27.5 27.3 30.1 25.6 1992 27.5 27.5 27.0 29.2 25.1 1993 27.5 27.5 27.8 29.6 25.2 1994 27.5 27.5 27.5 29.6 24.7 1995 27.5 27.5 27.7 30.3 24.9 1996 27.5 27.5 28.1 29.6 24.9 1997 27.5 27.5 27.8 30.1 24.6 1998 27.5 27.5 28.6 29.2 24.7 1999 27.5 27.5 28.0 29.0 24.5 2000 27.5 27.5 28.7 28.3 24.8 2001 27.5 27.5 28.7 29.0 24.5 2002 27.5 27.5 29.1 28.8 24.7 2003 27.5 27.5 29.1 29.9 25.1 2004 27.5 27.5 29.9 28.7 24.6 2005 27.5 27.5 30.5 29.9 25.4 2006 27.5 27.5 30.3 29.7 25.8 2007 27.5 27.5 30.6 32.2 26.6 2008 27.5d 27.5 31.2 31.8 27.1 2009 27.5d 27.5 32.1 33.8 29.0 2010 27.5d 27.5 33.1 35.2 29.3 2011 30.0 30.4 32.7 33.7 29.0 2012 32.7 33.4 34.8 36.0 30.8 2013 33.2 33.9 36.1 36.8 31.6 2014 34.0 34.6 36.3 36.9 31.7 2015 35.2 35.8 37.2 37.3 32.2 2016 36.5e 37.3e 37.2e 37.6e 32.1e 2017 38.5e 34.5e 38.5e 32.8e 31.8e
Source: U.S. Department of Transportation, NHTSA, "Summary of Fuel Economy Performance," Washington, DC, December
2014 and updates 2017. (Additional resources: www.nhtsa.gov) a Only vehicles with at least 75 percent domestic content can be counted in the average domestic fuel economy for a manufacturer. b Model year as determined by the manufacturer on a vehicle by vehicle basis. c All CAFE calculations are sales-weighted. d Unreformed standards, which were an option from 2008-2010. See Table 4.20 for reformed standards. e Projected required average fuel economy standards value based on pre-model year reports.
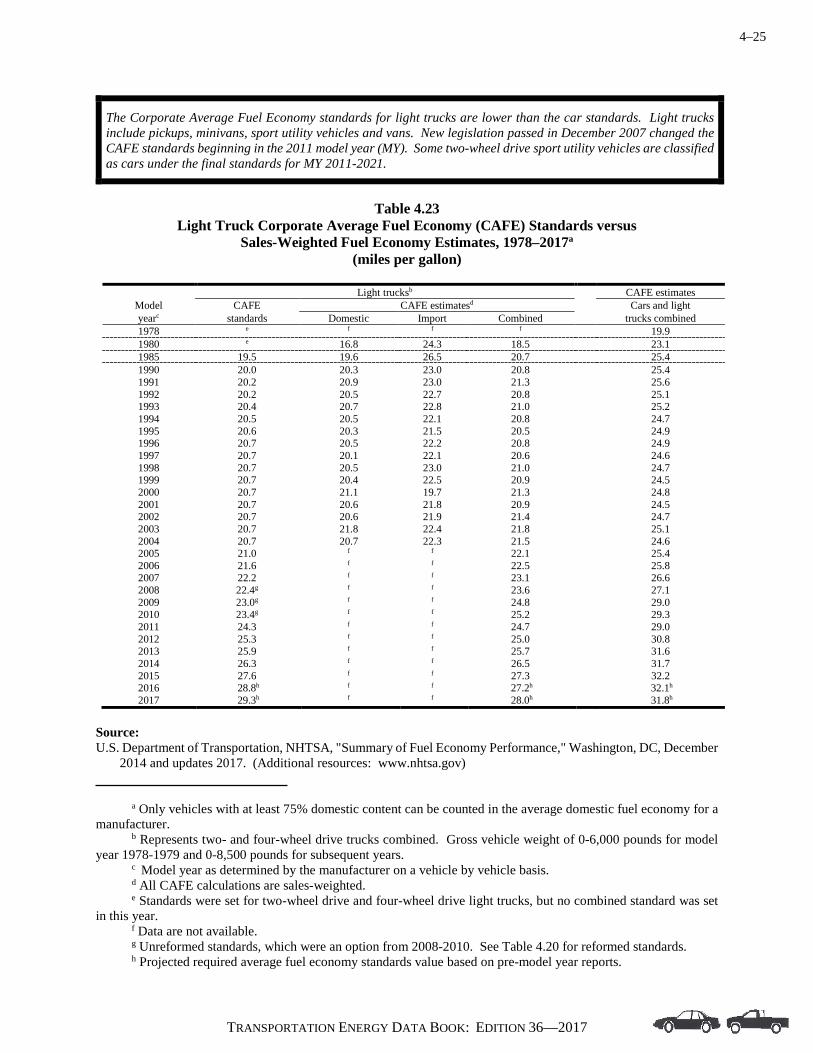
4–25
TRANSPORTATION ENERGY DATA BOOK: EDITION 36—2017
The Corporate Average Fuel Economy standards for light trucks are lower than the car standards. Light trucks include pickups, minivans, sport utility vehicles and vans. New legislation passed in December 2007 changed the CAFE standards beginning in the 2011 model year (MY). Some two-wheel drive sport utility vehicles are classified as cars under the final standards for MY 2011-2021.
Table 4.23
Light Truck Corporate Average Fuel Economy (CAFE) Standards versus Sales-Weighted Fuel Economy Estimates, 1978–2017a
(miles per gallon)
Light trucksb CAFE estimates Model CAFE CAFE estimatesd Cars and light yearc standards Domestic Import Combined trucks combined 1978 e f f f 19.9 1980 e 16.8 24.3 18.5 23.1 1985 19.5 19.6 26.5 20.7 25.4 1990 20.0 20.3 23.0 20.8 25.4 1991 20.2 20.9 23.0 21.3 25.6 1992 20.2 20.5 22.7 20.8 25.1 1993 20.4 20.7 22.8 21.0 25.2 1994 20.5 20.5 22.1 20.8 24.7 1995 20.6 20.3 21.5 20.5 24.9 1996 20.7 20.5 22.2 20.8 24.9 1997 20.7 20.1 22.1 20.6 24.6 1998 20.7 20.5 23.0 21.0 24.7 1999 20.7 20.4 22.5 20.9 24.5 2000 20.7 21.1 19.7 21.3 24.8 2001 20.7 20.6 21.8 20.9 24.5 2002 20.7 20.6 21.9 21.4 24.7 2003 20.7 21.8 22.4 21.8 25.1 2004 20.7 20.7 22.3 21.5 24.6 2005 21.0 f f 22.1 25.4 2006 21.6 f f 22.5 25.8 2007 22.2 f f 23.1 26.6 2008 22.4g f f 23.6 27.1 2009 23.0g f f 24.8 29.0 2010 23.4g f f 25.2 29.3 2011 24.3 f f 24.7 29.0 2012 25.3 f f 25.0 30.8 2013 25.9 f f 25.7 31.6 2014 26.3 f f 26.5 31.7 2015 27.6 f f 27.3 32.2 2016 28.8h f f 27.2h 32.1h 2017 29.3h f f 28.0h 31.8h
Source: U.S. Department of Transportation, NHTSA, "Summary of Fuel Economy Performance," Washington, DC, December
2014 and updates 2017. (Additional resources: www.nhtsa.gov) a Only vehicles with at least 75% domestic content can be counted in the average domestic fuel economy for a manufacturer. b Represents two- and four-wheel drive trucks combined. Gross vehicle weight of 0-6,000 pounds for model year 1978-1979 and 0-8,500 pounds for subsequent years. c Model year as determined by the manufacturer on a vehicle by vehicle basis. d All CAFE calculations are sales-weighted. e Standards were set for two-wheel drive and four-wheel drive light trucks, but no combined standard was set in this year. f Data are not available. g Unreformed standards, which were an option from 2008-2010. See Table 4.20 for reformed standards. h Projected required average fuel economy standards value based on pre-model year reports.
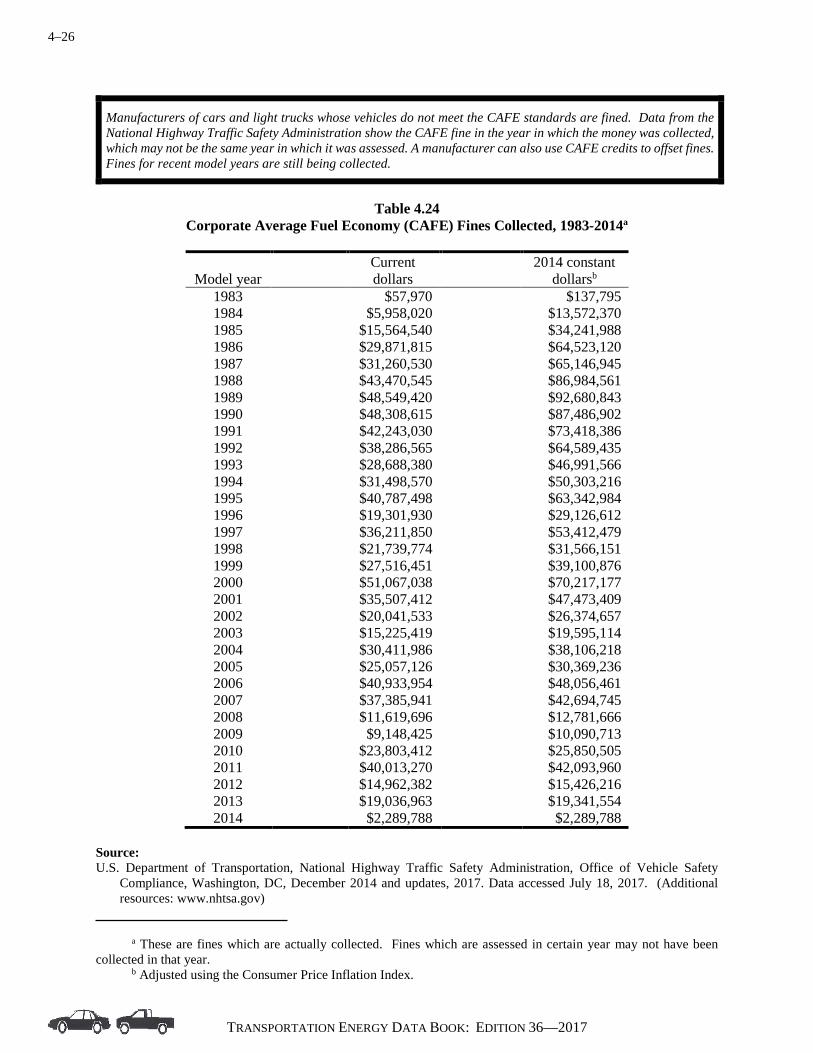
4–26
TRANSPORTATION ENERGY DATA BOOK: EDITION 36—2017
Manufacturers of cars and light trucks whose vehicles do not meet the CAFE standards are fined. Data from the National Highway Traffic Safety Administration show the CAFE fine in the year in which the money was collected, which may not be the same year in which it was assessed. A manufacturer can also use CAFE credits to offset fines. Fines for recent model years are still being collected.
Table 4.24
Corporate Average Fuel Economy (CAFE) Fines Collected, 1983-2014a
Model year Current dollars
2014 constant dollarsb
1983 $57,970 $137,795 1984 $5,958,020 $13,572,370 1985 $15,564,540 $34,241,988 1986 $29,871,815 $64,523,120 1987 $31,260,530 $65,146,945 1988 $43,470,545 $86,984,561 1989 $48,549,420 $92,680,843 1990 $48,308,615
$87,486,902
1991 $42,243,030
$73,418,386 1992 $38,286,565
$64,589,435
1993 $28,688,380
$46,991,566 1994 $31,498,570
$50,303,216
1995 $40,787,498
$63,342,984 1996 $19,301,930
$29,126,612
1997 $36,211,850
$53,412,479 1998 $21,739,774
$31,566,151
1999 $27,516,451
$39,100,876 2000 $51,067,038
$70,217,177
2001 $35,507,412
$47,473,409 2002 $20,041,533
$26,374,657
2003 $15,225,419
$19,595,114 2004 $30,411,986
$38,106,218
2005 $25,057,126
$30,369,236 2006 $40,933,954
$48,056,461
2007 $37,385,941
$42,694,745 2008 $11,619,696
$12,781,666
2009 $9,148,425 $10,090,713 2010 $23,803,412 $25,850,505 2011 $40,013,270 $42,093,960 2012 $14,962,382 $15,426,216 2013 $19,036,963 $19,341,554 2014 $2,289,788 $2,289,788
Source: U.S. Department of Transportation, National Highway Traffic Safety Administration, Office of Vehicle Safety
Compliance, Washington, DC, December 2014 and updates, 2017. Data accessed July 18, 2017. (Additional resources: www.nhtsa.gov)
a These are fines which are actually collected. Fines which are assessed in certain year may not have been collected in that year. b Adjusted using the Consumer Price Inflation Index.
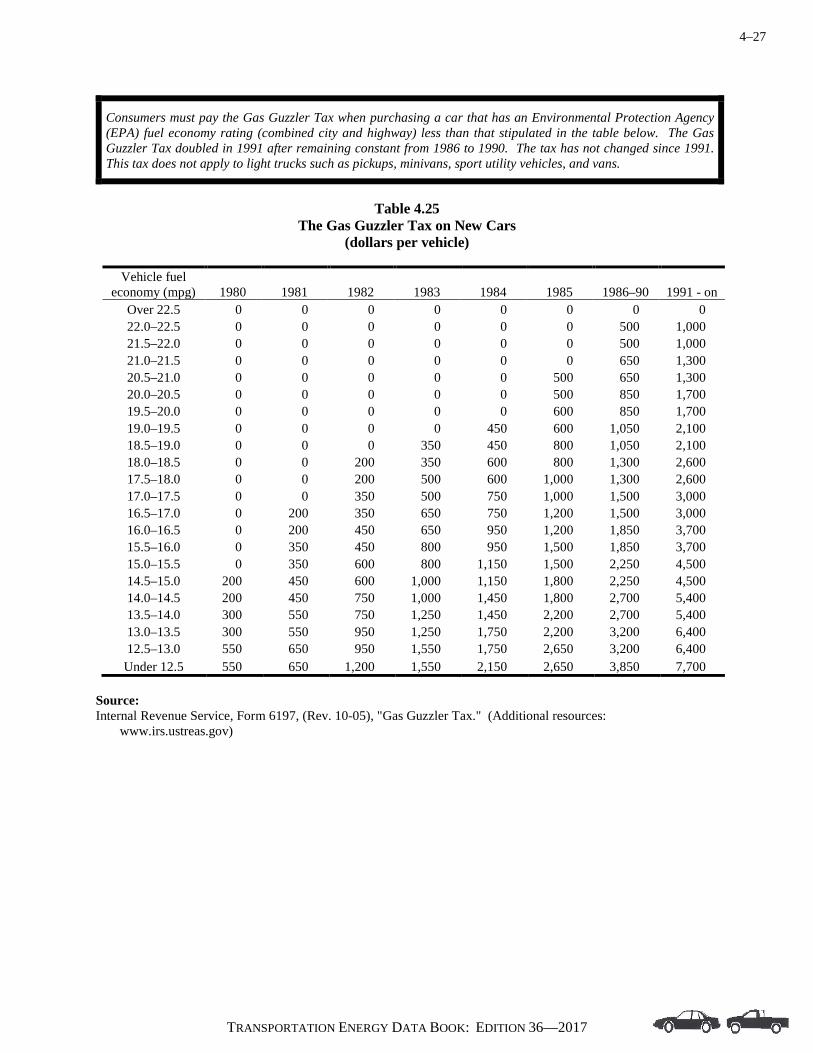
4–27
TRANSPORTATION ENERGY DATA BOOK: EDITION 36—2017
Consumers must pay the Gas Guzzler Tax when purchasing a car that has an Environmental Protection Agency (EPA) fuel economy rating (combined city and highway) less than that stipulated in the table below. The Gas Guzzler Tax doubled in 1991 after remaining constant from 1986 to 1990. The tax has not changed since 1991. This tax does not apply to light trucks such as pickups, minivans, sport utility vehicles, and vans.
Table 4.25
The Gas Guzzler Tax on New Cars (dollars per vehicle)
Vehicle fuel
economy (mpg) 1980 1981 1982 1983 1984 1985 1986–90 1991 - on Over 22.5 0 0 0 0 0 0 0 0 22.0–22.5 0 0 0 0 0 0 500 1,000 21.5–22.0 0 0 0 0 0 0 500 1,000 21.0–21.5 0 0 0 0 0 0 650 1,300 20.5–21.0 0 0 0 0 0 500 650 1,300 20.0–20.5 0 0 0 0 0 500 850 1,700 19.5–20.0 0 0 0 0 0 600 850 1,700 19.0–19.5 0 0 0 0 450 600 1,050 2,100 18.5–19.0 0 0 0 350 450 800 1,050 2,100 18.0–18.5 0 0 200 350 600 800 1,300 2,600 17.5–18.0 0 0 200 500 600 1,000 1,300 2,600 17.0–17.5 0 0 350 500 750 1,000 1,500 3,000 16.5–17.0 0 200 350 650 750 1,200 1,500 3,000 16.0–16.5 0 200 450 650 950 1,200 1,850 3,700 15.5–16.0 0 350 450 800 950 1,500 1,850 3,700 15.0–15.5 0 350 600 800 1,150 1,500 2,250 4,500 14.5–15.0 200 450 600 1,000 1,150 1,800 2,250 4,500 14.0–14.5 200 450 750 1,000 1,450 1,800 2,700 5,400 13.5–14.0 300 550 750 1,250 1,450 2,200 2,700 5,400 13.0–13.5 300 550 950 1,250 1,750 2,200 3,200 6,400 12.5–13.0 550 650 950 1,550 1,750 2,650 3,200 6,400
Under 12.5 550 650 1,200 1,550 2,150 2,650 3,850 7,700 Source: Internal Revenue Service, Form 6197, (Rev. 10-05), "Gas Guzzler Tax." (Additional resources:
www.irs.ustreas.gov)
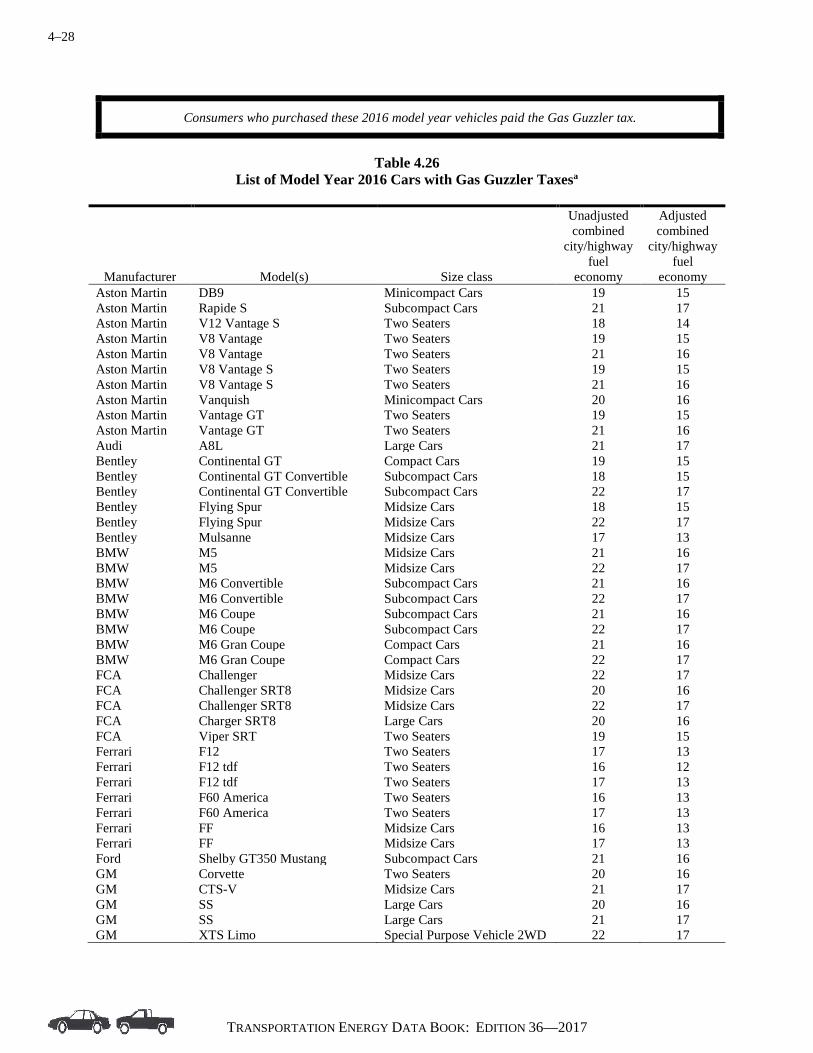
4–28
TRANSPORTATION ENERGY DATA BOOK: EDITION 36—2017
Consumers who purchased these 2016 model year vehicles paid the Gas Guzzler tax.
Table 4.26
List of Model Year 2016 Cars with Gas Guzzler Taxesa
Manufacturer Model(s) Size class
Unadjusted combined
city/highway fuel
economy
Adjusted combined
city/highway fuel
economy Aston Martin DB9 Minicompact Cars 19 15 Aston Martin Rapide S Subcompact Cars 21 17 Aston Martin V12 Vantage S Two Seaters 18 14 Aston Martin V8 Vantage Two Seaters 19 15 Aston Martin V8 Vantage Two Seaters 21 16 Aston Martin V8 Vantage S Two Seaters 19 15 Aston Martin V8 Vantage S Two Seaters 21 16 Aston Martin Vanquish Minicompact Cars 20 16 Aston Martin Vantage GT Two Seaters 19 15 Aston Martin Vantage GT Two Seaters 21 16 Audi A8L Large Cars 21 17 Bentley Continental GT Compact Cars 19 15 Bentley Continental GT Convertible Subcompact Cars 18 15 Bentley Continental GT Convertible Subcompact Cars 22 17 Bentley Flying Spur Midsize Cars 18 15 Bentley Flying Spur Midsize Cars 22 17 Bentley Mulsanne Midsize Cars 17 13 BMW M5 Midsize Cars 21 16 BMW M5 Midsize Cars 22 17 BMW M6 Convertible Subcompact Cars 21 16 BMW M6 Convertible Subcompact Cars 22 17 BMW M6 Coupe Subcompact Cars 21 16 BMW M6 Coupe Subcompact Cars 22 17 BMW M6 Gran Coupe Compact Cars 21 16 BMW M6 Gran Coupe Compact Cars 22 17 FCA Challenger Midsize Cars 22 17 FCA Challenger SRT8 Midsize Cars 20 16 FCA Challenger SRT8 Midsize Cars 22 17 FCA Charger SRT8 Large Cars 20 16 FCA Viper SRT Two Seaters 19 15 Ferrari F12 Two Seaters 17 13 Ferrari F12 tdf Two Seaters 16 12 Ferrari F12 tdf Two Seaters 17 13 Ferrari F60 America Two Seaters 16 13 Ferrari F60 America Two Seaters 17 13 Ferrari FF Midsize Cars 16 13 Ferrari FF Midsize Cars 17 13 Ford Shelby GT350 Mustang Subcompact Cars 21 16 GM Corvette Two Seaters 20 16 GM CTS-V Midsize Cars 21 17 GM SS Large Cars 20 16 GM SS Large Cars 21 17 GM XTS Limo Special Purpose Vehicle 2WD 22 17

4–29
TRANSPORTATION ENERGY DATA BOOK: EDITION 36—2017
Table 4.26 (Continued) List of Model Year 2016 Cars with Gas Guzzler Taxesa
Make Model(s) Size class
Unadjusted combined
city/highway fuel
economy
Adjusted combined
city/highway fuel
economy Lamborghini Aventador Coupe Two Seaters 16 13 Lamborghini Aventador Roadster Two Seaters 15 12 Lamborghini Huracan Two Seaters 21 17 Lamborghini Huracan Spyder Two Seaters 20 16 Maserati Granturismo Subcompact Cars 20 16 Maserati Granturismo Convertible Subcompact Cars 20 15 Maserati Quattroporte GTS Large Cars 22 17 Mercedes-Benz AMG S 65 Large Cars 19 15 Mercedes-Benz AMG S 65 (coupe) Compact Cars 19 15 Mercedes-Benz AMG SL 65 Two Seaters 21 17 Mercedes-Benz Maybach S 600 Large Cars 20 15 Mercedes-Benz S 600 Large Cars 21 16 Pagani Huayra Coupe Two Seaters 15 13 Porsche 911 GT3 Two Seaters 22 17 Porsche 911 GT3RS Two Seaters 21 16 Porsche 911 R Minicompact Cars 21 16 Rolls-Royce Dawn Compact Cars 18 14 Rolls-Royce Ghost Large Cars 19 15 Rolls-Royce Ghost EWB Large Cars 19 15 Rolls-Royce Phantom Large Cars 17 14 Rolls-Royce Phantom Coupe Compact Cars 17 14 Rolls-Royce Phantom Drophead Coupe Compact Cars 17 14 Rolls-Royce Phantom EWB Large Cars 17 14 Rolls-Royce Wraith Midsize Cars 19 15 Roush Roush Stage 3 Mustang Subcompact Cars 20 16 Roush Roush Stage 3 Mustang Subcompact Cars 21 16 Source: U.S. Department of Energy and U.S. Environmental Protection Agency, Fuel Economy Guide database,
www.fueleconomy.gov a Tax is based on unadjusted combined fuel economy; adjusted combined fuel economy is used on window stickers.

4–30
TRANSPORTATION ENERGY DATA BOOK: EDITION 36—2017
The IRS collected $58.7 million in 2015 from those buying cars with combined city/highway fuel economy less than 22.5 miles per gallon. This tax does not apply to light trucks such as pickups, minivans, sport utility vehicles, and vans. It is worthy to note that total revenue from fines paid by consumers to purchase gas-guzzling vehicles greatly exceeds the overall fines paid by manufacturers whose vehicles fail to meet CAFE standards (see Table 4.22).
Table 4.27
Tax Receipts from the Sale of Gas Guzzlers, 1980–2015 (thousands)
Model year Current dollars 2015
constant dollarsa 1980 740 2,129 1981 780 2,034 1982 1,720 4,225 1983 4,020 9,566 1984 8,820 20,120 1985 39,790 87,648 1986 147,660 319,324 1987 145,900 304,408 1988 116,780 233,972 1989 109,640 209,569 1990 103,200 187,147 1991 118,400 206,041 1992 144,200 243,605 1993 111,600 183,053 1994 64,100 102,515 1995 73,500 114,309 1996 52,600 79,459 1997 48,200 71,179 1998 47,700 69,360 1999 68,300 97,168 2000 70,800 97,449 2001 78,200 104,657 2002 79,700 105,004 2003 126,700 163,207 2004 140,800 176,665 2005 163,800 198,788 2006 201,700 237,135 2007 178,700 204,276 2008 172,428 189,818 2009 99,300 109,705 2010 85,226 92,637 2011 68,905 72,605 2012 73,500 75,876 2013 61,300 62,368 2014 48,200 48,257 2015 58,700 58,700
Source: Ward’s Communications, Detroit, MI, 2017. Original data source: Internal Revenue Service. (Additional resources:
www.epa.gov/fueleconomy/guzzler) a Adjusted using the Consumer Price Inflation Index.

4–31
TRANSPORTATION ENERGY DATA BOOK: EDITION 36—2017
Autonomie is a system simulation tool for vehicle energy consumption and performance analysis. It is used to evaluate the energy consumption and cost of multiple advanced powertrain technologies. Autonomie was used to develop data on the relationship between steady-state vehicle speed and fuel economy.
Table 4.28
Fuel Economy by Speed, Autonomie Model Results
Gasoline conventional Diesel conventional Hybrid vehicle
Speed (mph) Midsize Small Large Midsize Small Large Midsize
car SUV SUV car SUV SUV Car (miles per gallon)
45 43 37 35 57 48 48 55 55 45 36 31 55 45 40 46 65 38 30 29 45 36 35 38 75 32 26 25 37 30 29 33 Fuel economy loss
55 - 65 mph 15% 16% 7% 18% 19% 13% 18% 65 - 75 mph 15% 16% 15% 18% 18% 17% 12% 55 - 75 mph 28% 29% 21% 33% 34% 27% 28%
Source: Argonne National Laboratory, Autonomie model, August 2016, www.autonomie.net. (Additional resources:
www.anl.gov/energy/transportation)

4–32
TRANSPORTATION ENERGY DATA BOOK: EDITION 36—2017
The latest study of vehicle fuel economy by speed indicated higher fuel economy around 40 miles per hour, as did the 1973 and 1984 studies. Engineers at Oak Ridge National Laboratory believe that the lowest speed in the vehicle's highest gear is where the best fuel economy is typically obtained. That speed will be different for individual vehicles.
Table 4.29
Fuel Economy by Speed, 1973, 1984, 1997, and 2012 Studies (miles per gallon)
Speed 1973a 1984b 1997c 2012d (miles per hour) (13 vehicles) (15 vehicles) (9 vehicles) (74 vehicles)
15 e 21.1 24.4 e 20 e 25.5 27.9 e 25 e 30.0 30.5 e 30 21.1 31.8 31.7 e 35 21.1 33.6 31.2 e 40 21.1 33.6 31.0 33.2 45 20.3 33.5 31.6 e 50 19.5 31.9 32.4 31.9 55 18.5 30.3 32.4 e 60 17.5 27.6 31.4 27.9 65 16.2 24.9 29.2 e 70 14.9 22.5 26.8 24.1 75 e 20.0 24.8 e 80 e e e 20.5
Fuel economy loss 50–60 mph 10.3% 13.5% 3.1% 12.5% 60–70 mph 14.9% 18.5% 14.6% 13.6% 50–70 mph 23.6% 29.5% 17.3% 24.5%
Sources: 1973- U.S. Department of Transportation, Federal Highway Administration, Office of Highway Planning, The Effect
of Speed on Automobile Gasoline Consumption Rates, Washington, DC, October 1973. 1984 - U.S. Department of Transportation, Federal Highway Administration, Fuel Consumption and Emission Values
for Traffic Models, Washington, DC, May 1985. 1997 - West, B.H., R.N. McGill, J.W. Hodgson, S.S. Sluder, and D.E. Smith, Development and Verification of Light-
Duty Modal Emissions and Fuel Consumption Values for Traffic Models, FHWA-RD-99-068, U.S. Department of Transportation, Federal Highway Administration, Washington, DC, March 1999.
2012 - U.S. Department of Energy and U.S. Environmental Protection Agency, Fuel Economy Guide website: www.fueleconomy.gov. The Green Car Congress, "ORNL researchers quantify the effect of increasing highway speed on fuel economy." February 8, 2013.
a Model years 1970 and earlier cars. b Model years 1981–84 cars and light trucks. c Model years 1988–97 cars and light trucks. d Model years 2003-2012 cars and light trucks. e Data are not available.
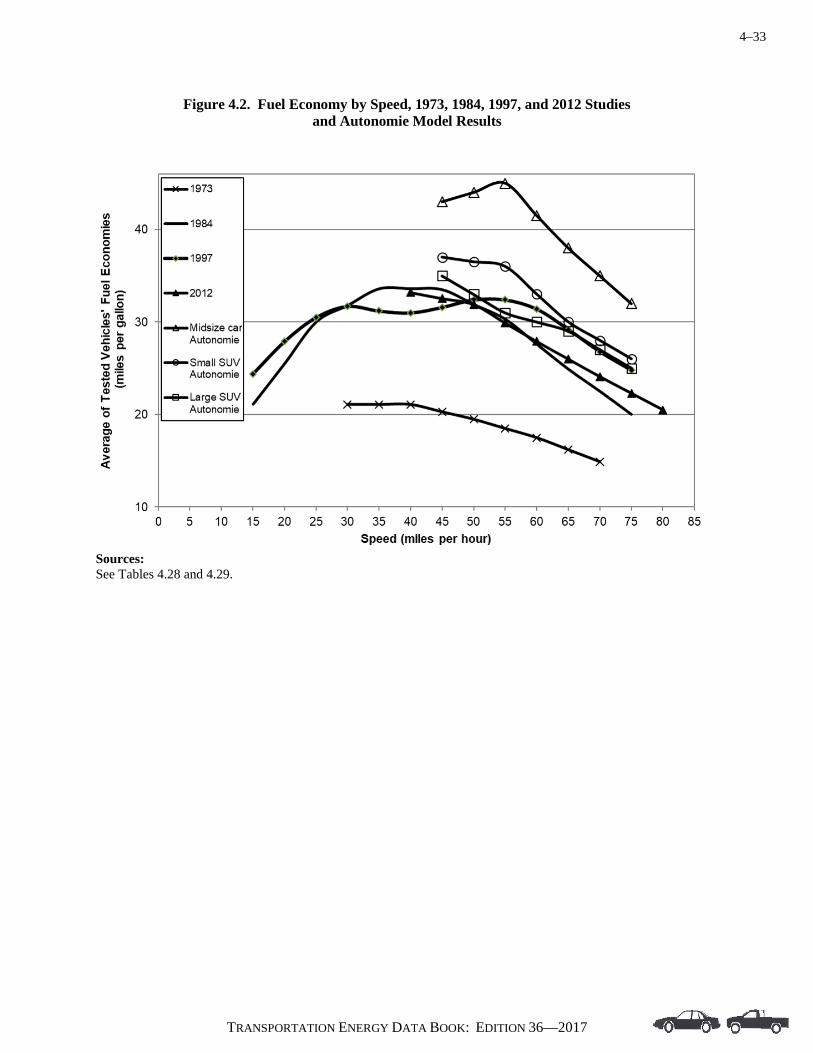
4–33
TRANSPORTATION ENERGY DATA BOOK: EDITION 36—2017
Figure 4.2. Fuel Economy by Speed, 1973, 1984, 1997, and 2012 Studies and Autonomie Model Results
Sources: See Tables 4.28 and 4.29.
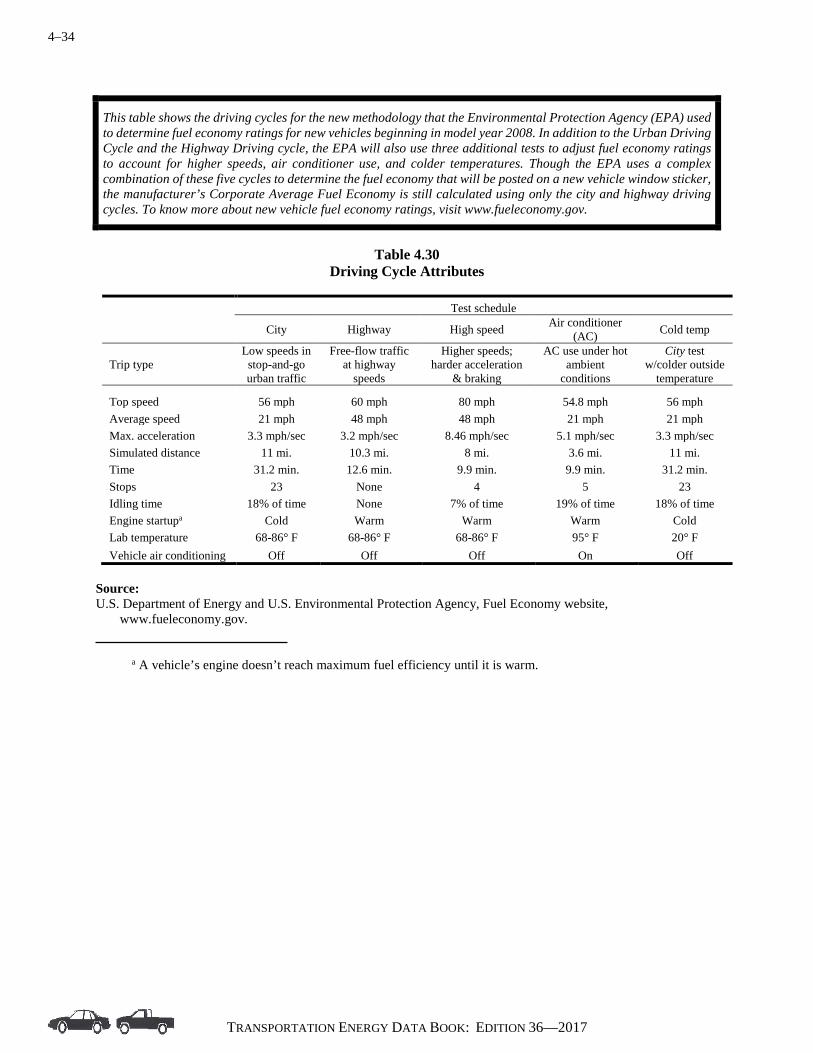
4–34
TRANSPORTATION ENERGY DATA BOOK: EDITION 36—2017
This table shows the driving cycles for the new methodology that the Environmental Protection Agency (EPA) used to determine fuel economy ratings for new vehicles beginning in model year 2008. In addition to the Urban Driving Cycle and the Highway Driving cycle, the EPA will also use three additional tests to adjust fuel economy ratings to account for higher speeds, air conditioner use, and colder temperatures. Though the EPA uses a complex combination of these five cycles to determine the fuel economy that will be posted on a new vehicle window sticker, the manufacturer’s Corporate Average Fuel Economy is still calculated using only the city and highway driving cycles. To know more about new vehicle fuel economy ratings, visit www.fueleconomy.gov.
Table 4.30
Driving Cycle Attributes
Test schedule
City Highway High speed Air conditioner (AC) Cold temp
Trip type Low speeds in
stop-and-go urban traffic
Free-flow traffic at highway
speeds
Higher speeds; harder acceleration
& braking
AC use under hot ambient
conditions
City test w/colder outside
temperature
Top speed 56 mph 60 mph 80 mph 54.8 mph 56 mph Average speed 21 mph 48 mph 48 mph 21 mph 21 mph Max. acceleration 3.3 mph/sec 3.2 mph/sec 8.46 mph/sec 5.1 mph/sec 3.3 mph/sec Simulated distance 11 mi. 10.3 mi. 8 mi. 3.6 mi. 11 mi. Time 31.2 min. 12.6 min. 9.9 min. 9.9 min. 31.2 min. Stops 23 None 4 5 23 Idling time 18% of time None 7% of time 19% of time 18% of time Engine startupa Cold Warm Warm Warm Cold Lab temperature 68-86° F 68-86° F 68-86° F 95° F 20° F Vehicle air conditioning Off Off Off On Off
Source: U.S. Department of Energy and U.S. Environmental Protection Agency, Fuel Economy website,
www.fueleconomy.gov. a A vehicle’s engine doesn’t reach maximum fuel efficiency until it is warm.

4–35
TRANSPORTATION ENERGY DATA BOOK: EDITION 36—2017
These driving cycles simulate the performance of an engine while driving in the city and on the highway. Once the city cycle is completed, the engine is stopped, and then started again for the 8.5-minute hot start cycle. Three additional cycles also influence new vehicle fuel economy ratings beginning with the 2008 model year.
Figure 4.3. City Driving Cycle
Figure 4.4. Highway Driving Cycle
Source: Code of Federal Regulations, 40CFR, "Subpart B - Fuel Economy Regulations for 1978 and Later Model Year
Automobiles - Test Procedures," July 1, 1988 edition, p. 676.
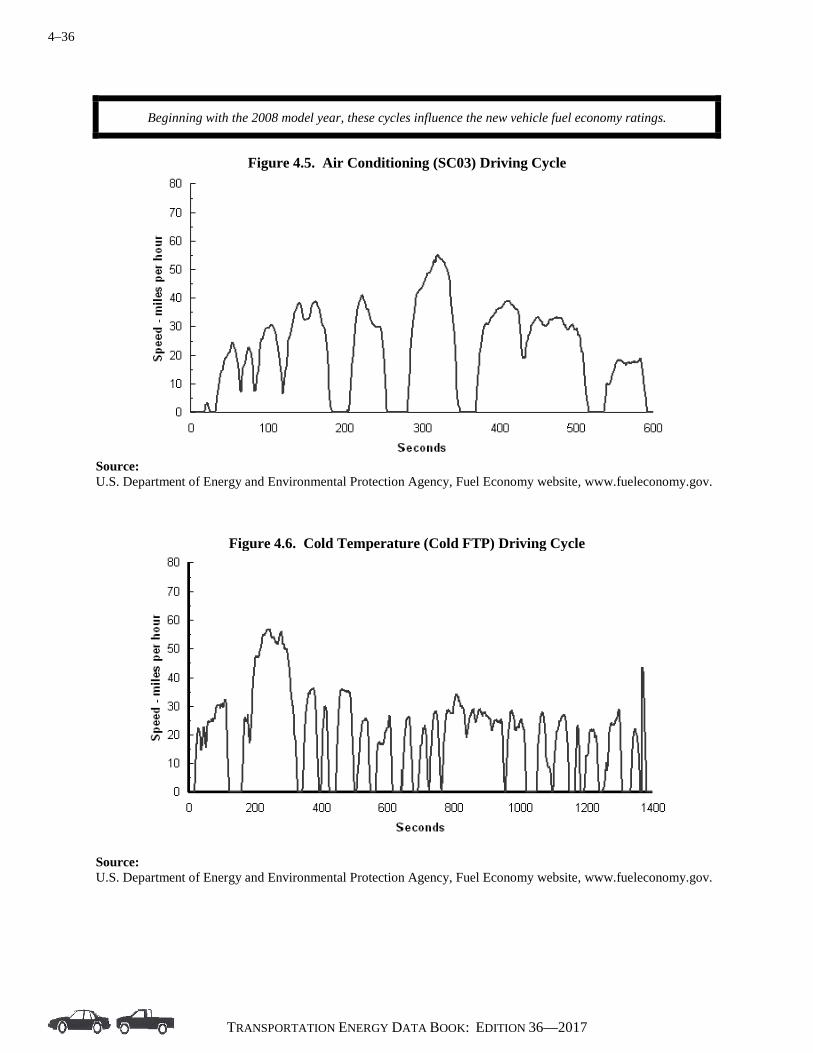
4–36
TRANSPORTATION ENERGY DATA BOOK: EDITION 36—2017
Beginning with the 2008 model year, these cycles influence the new vehicle fuel economy ratings.
Figure 4.5. Air Conditioning (SC03) Driving Cycle
Source: U.S. Department of Energy and Environmental Protection Agency, Fuel Economy website, www.fueleconomy.gov.
Figure 4.6. Cold Temperature (Cold FTP) Driving Cycle
Source: U.S. Department of Energy and Environmental Protection Agency, Fuel Economy website, www.fueleconomy.gov.
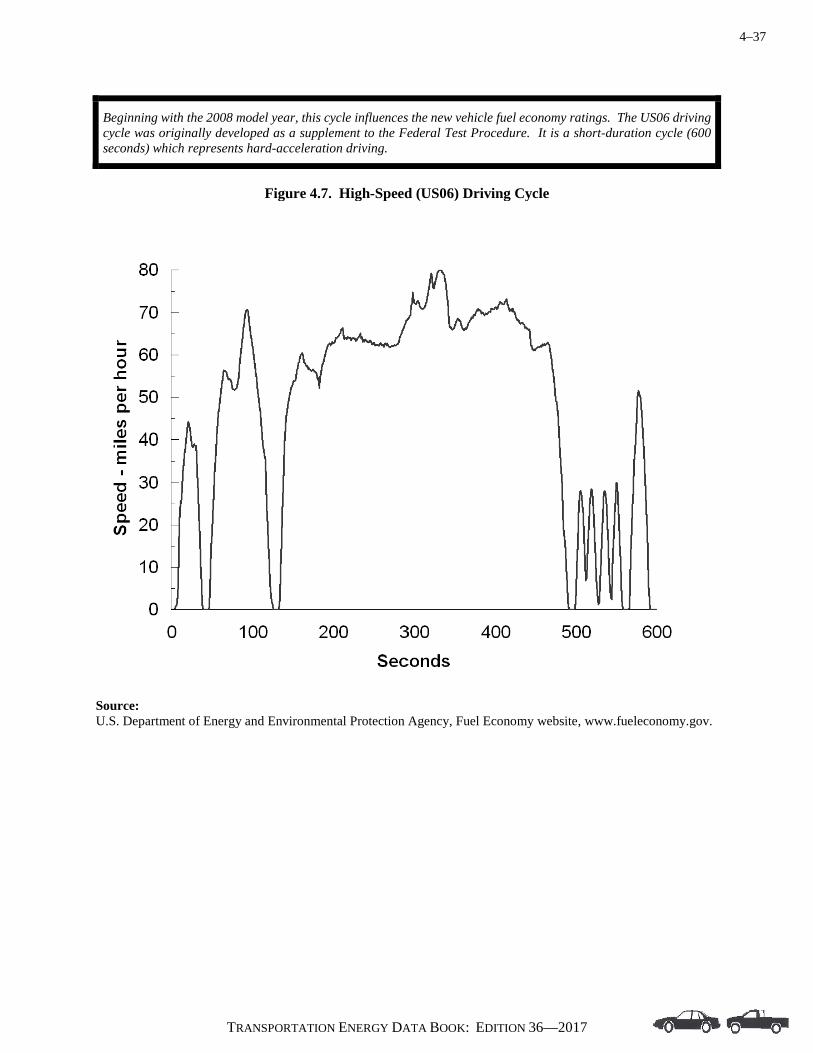
4–37
TRANSPORTATION ENERGY DATA BOOK: EDITION 36—2017
Beginning with the 2008 model year, this cycle influences the new vehicle fuel economy ratings. The US06 driving cycle was originally developed as a supplement to the Federal Test Procedure. It is a short-duration cycle (600 seconds) which represents hard-acceleration driving.
Figure 4.7. High-Speed (US06) Driving Cycle
Source: U.S. Department of Energy and Environmental Protection Agency, Fuel Economy website, www.fueleconomy.gov.
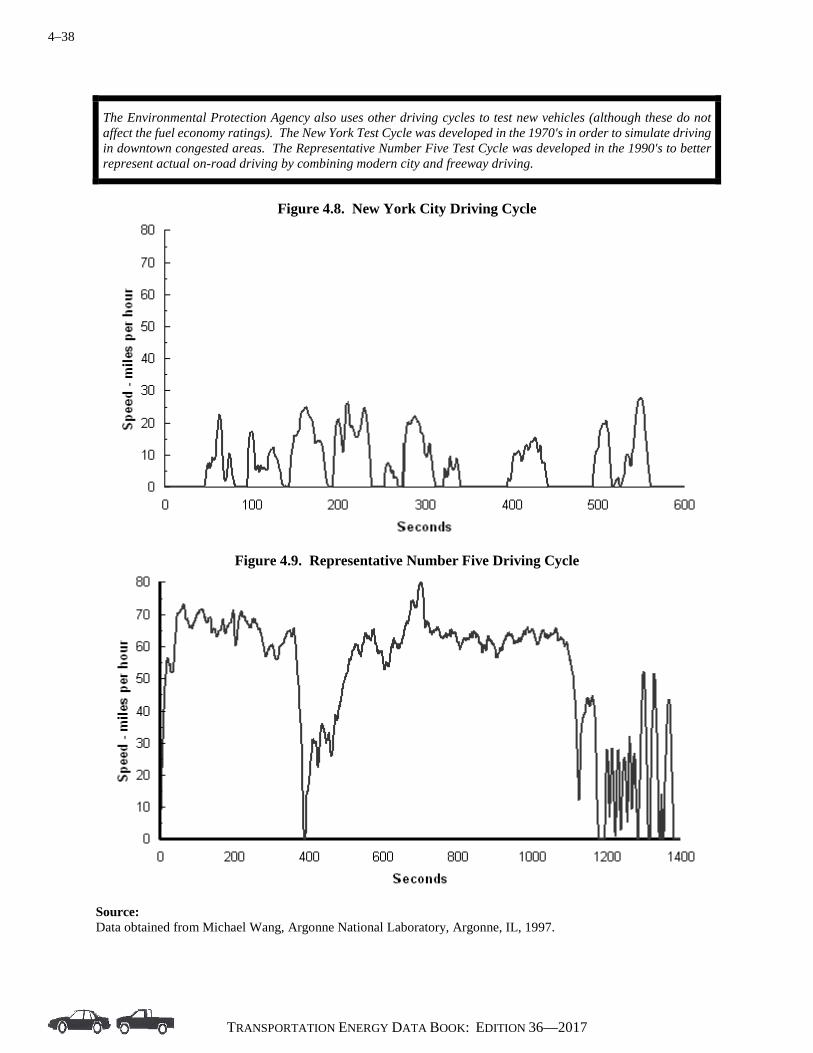
4–38
TRANSPORTATION ENERGY DATA BOOK: EDITION 36—2017
The Environmental Protection Agency also uses other driving cycles to test new vehicles (although these do not affect the fuel economy ratings). The New York Test Cycle was developed in the 1970's in order to simulate driving in downtown congested areas. The Representative Number Five Test Cycle was developed in the 1990's to better represent actual on-road driving by combining modern city and freeway driving.
Figure 4.8. New York City Driving Cycle
Figure 4.9. Representative Number Five Driving Cycle
Source: Data obtained from Michael Wang, Argonne National Laboratory, Argonne, IL, 1997.
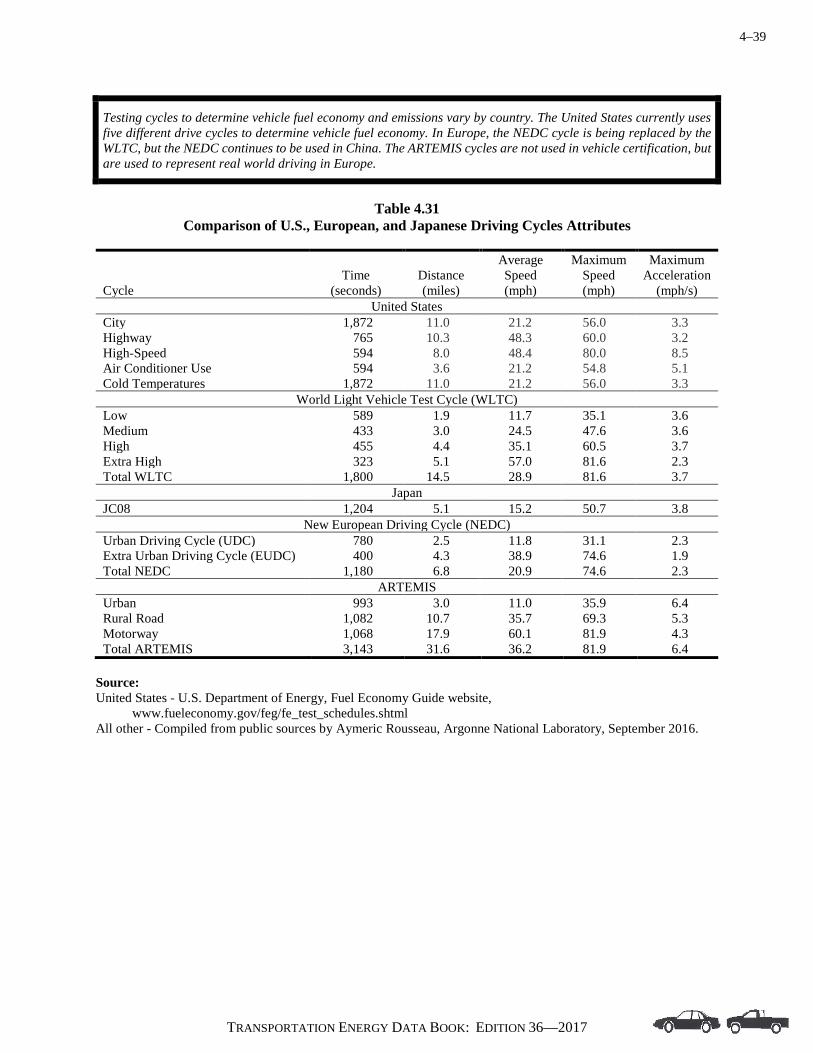
4–39
TRANSPORTATION ENERGY DATA BOOK: EDITION 36—2017
Testing cycles to determine vehicle fuel economy and emissions vary by country. The United States currently uses five different drive cycles to determine vehicle fuel economy. In Europe, the NEDC cycle is being replaced by the WLTC, but the NEDC continues to be used in China. The ARTEMIS cycles are not used in vehicle certification, but are used to represent real world driving in Europe.
Table 4.31
Comparison of U.S., European, and Japanese Driving Cycles Attributes
Cycle Time
(seconds) Distance (miles)
Average Speed (mph)
Maximum Speed (mph)
Maximum Acceleration
(mph/s) United States
City 1,872 11.0 21.2 56.0 3.3 Highway 765 10.3 48.3 60.0 3.2 High-Speed 594 8.0 48.4 80.0 8.5 Air Conditioner Use 594 3.6 21.2 54.8 5.1 Cold Temperatures 1,872 11.0 21.2 56.0 3.3
World Light Vehicle Test Cycle (WLTC) Low 589 1.9 11.7 35.1 3.6 Medium 433 3.0 24.5 47.6 3.6 High 455 4.4 35.1 60.5 3.7 Extra High 323 5.1 57.0 81.6 2.3 Total WLTC 1,800 14.5 28.9 81.6 3.7
Japan JC08 1,204 5.1 15.2 50.7 3.8
New European Driving Cycle (NEDC) Urban Driving Cycle (UDC) 780 2.5 11.8 31.1 2.3 Extra Urban Driving Cycle (EUDC) 400 4.3 38.9 74.6 1.9 Total NEDC 1,180 6.8 20.9 74.6 2.3
ARTEMIS Urban 993 3.0 11.0 35.9 6.4 Rural Road 1,082 10.7 35.7 69.3 5.3 Motorway 1,068 17.9 60.1 81.9 4.3 Total ARTEMIS 3,143 31.6 36.2 81.9 6.4
Source: United States - U.S. Department of Energy, Fuel Economy Guide website,
www.fueleconomy.gov/feg/fe_test_schedules.shtml All other - Compiled from public sources by Aymeric Rousseau, Argonne National Laboratory, September 2016.

4–40
TRANSPORTATION ENERGY DATA BOOK: EDITION 36—2017
Testing cycles to determine vehicle fuel economy and emissions vary by country and therefore it is difficult to make a direct comparison. Simulation results show up to a 28% difference in the test cycles for each vehicle type. Note that the differences in these cycle results also vary with each individual vehicle tested.
Table 4.32 Example of Differing Results Using the U.S., European, and Japanese Driving Cycles
Miles per gallon Percentage difference from
Vehicle type
U.S. Corporate Average Fuel
Economy (CAFE) cycle
New European Driving Cycle
(NEDC) Japan JC08
cycle
CAFE to NEDC
CAFE to JC08
Small car 34.8 32.4 27.6 -7% -21% Large car 26.6 24.7 21.5 -7% -19% Minivan 23.9 20.5 17.2 -14% -28% Sport-utility vehicle 20.2 17.6 14.6 -13% -28% Pickup 18.8 15.9 13.5 -15% -28%
Note: Simulation results for identical gasoline vehicles (i.e., results for the same small car on each of the three cycles). Source: The International Council on Clean Transportation, Passenger Vehicle Greenhouse Gas and Fuel Economy
Standards: A Global Update, July 2009.
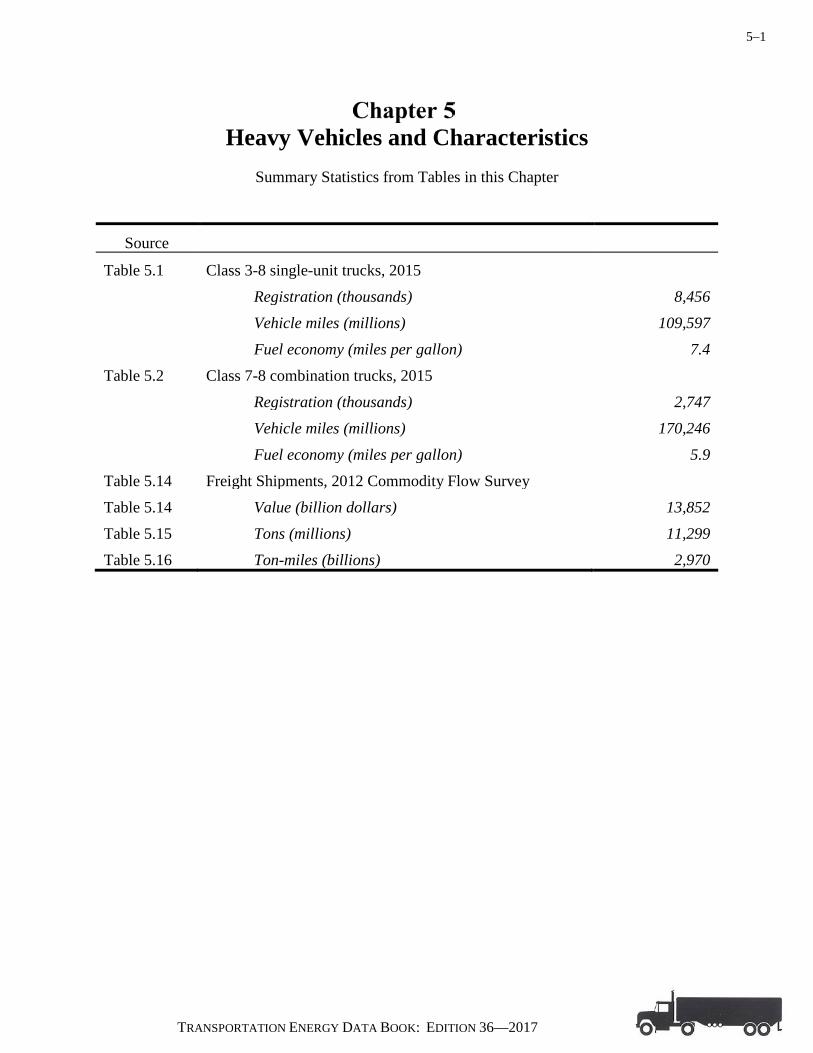
5–1
TRANSPORTATION ENERGY DATA BOOK: EDITION 36—2017
Heavy Vehicles and Characteristics
Summary Statistics from Tables in this Chapter
Source
Table 5.1 Class 3-8 single-unit trucks, 2015 Registration (thousands) 8,456 Vehicle miles (millions) 109,597 Fuel economy (miles per gallon) 7.4 Table 5.2 Class 7-8 combination trucks, 2015 Registration (thousands) 2,747 Vehicle miles (millions) 170,246 Fuel economy (miles per gallon) 5.9 Table 5.14 Freight Shipments, 2012 Commodity Flow Survey Table 5.14 Value (billion dollars) 13,852 Table 5.15 Tons (millions) 11,299 Table 5.16 Ton-miles (billions) 2,970

5–2
TRANSPORTATION ENERGY DATA BOOK: EDITION 36—2017
Class 3-8 single-unit trucks include trucks over 10,000 lb gross vehicle weight with the cab/engine and cargo space together as one unit. Most of these trucks would be used for business or for individuals with heavy hauling or towing needs. Very heavy single-units, such as concrete mixers and dump trucks, are also in this category. The data series was changed by the FHWA back to 2007.
Table 5.1
Summary Statistics for Class 3-8 Single-Unit Trucks, 1970–2015
Year Registrations (thousands)
Vehicle travel (million miles)
Average annual miles per vehicle
Fuel use (million gallons)
Fuel economy (miles per gallon)
1970 3,681 27,081 7,357 3,968 6.8 1975 4,232 34,606 8,177 5,420 6.4 1980 4,374 39,813 9,102 6,923 5.8 1981 4,455 39,568 8,882 6,867 5.8 1982 4,325 40,658 9,401 6,803 6.0 1983 4,204 42,546 10,120 6,965 6.1 1984 4,061 44,419 10,938 7,240 6.1 1985 4,593 45,441 9,894 7,399 6.1 1986 4,313 45,637 10,581 7,386 6.2 1987 4,188 48,022 11,467 7,523 6.4 1988 4,470 49,434 11,059 7,701 6.4 1989 4,519 50,870 11,257 7,779 6.5 1990 4,487 51,901 11,567 8,357 6.2 1991 4,481 52,898 11,805 8,172 6.5 1992 4,370 53,874 12,328 8,237 6.5 1993 4,408 56,772 12,879 8,488 6.7 1994 4,906 61,284 12,492 9,032 6.8 1995 5,024 62,705 12,481 9,216 6.8 1996 5,266 64,072 12,167 9,409 6.8 1997 5,293 66,893 12,638 9,576 7.0 1998 5,414 67,894 12,540 9,741 7.0 1999 5,763 70,304 12,199 9,372 7.5 2000 5,926 70,500 11,897 9,563 7.4 2001 5,704 72,448 12,701 9,667 7.5 2002 5,651 75,866 13,425 10,321 7.4 2003 5,849 77,757 13,294 8,881 8.8 2004 6,161 78,441 12,732 8,959 8.8 2005 6,395 78,496 12,275 9,501 8.3 2006 6,649 80,344 12,084 9,852 8.2 a 2007 8,117 119,979 14,781 16,314 7.3 2008 8,228 126,855 15,417 17,144 7.4 2009 8,356 120,207 14,386 16,253 7.4 2010 8,217 110,738 13,477 15,097 7.3 2011 7,819 103,803 13,276 14,214 7.3 2012 8,190 105,605 12,894 14,376 7.3 2013 8,126 106,582 13,116 14,502 7.3 2014 8,329 109,301 13,123 14,894 7.3 2015 8,456 109,597 12,961 14,850 7.4
Average annual percentage change 1970–2015 1.9% 3.2% 1.3% 3.0% 0.2% 2005–2015 2.8% 3.4% 0.5% 4.6% -1.1%
Source: U. S. Department of Transportation, Federal Highway Administration, Highway Statistics 2015, Washington, DC,
2016, Table VM-1 and annual. (Additional resources: www.fhwa.dot.gov)
a Due to FHWA methodology changes, data from 2007-on are not comparable with previous data.

5–3
TRANSPORTATION ENERGY DATA BOOK: EDITION 36—2017
Class 7-8 combination trucks include all trucks designed to be used in combination with one or more trailers with a gross vehicle weight rating over 26,000 lb. The average vehicle travel of these trucks (on a per truck basis) far surpasses the travel of other trucks due to long-haul freight movement. The data series was changed by the FHWA back to 2007.
Table 5.2
Summary Statistics for Class 7-8 Combination Trucks, 1970–2015
Year Registrations (thousands)
Vehicle travela (million miles)
Average annual miles per vehicle
Fuel use (million gallons)
Fuel economy (miles per gallon)
1970 905 35,134 38,822 7,348 4.8 1975 1,131 46,724 41,312 9,177 5.1 1980 1,417 68,678 48,467 13,037 5.3 1981 1,261 69,134 54,825 13,509 5.1 1982 1,265 70,765 55,941 13,583 5.2 1983 1,304 73,586 56,431 13,796 5.3 1984 1,340 77,377 57,744 14,188 5.5 1985 1,403 78,063 55,640 14,005 5.6 1986 1,408 81,038 57,555 14,475 5.6 1987 1,530 85,495 55,879 14,990 5.7 1988 1,667 88,551 53,120 15,224 5.8 1989 1,707 91,879 53,825 15,733 5.8 1990 1,709 94,341 55,202 16,133 5.8 1991 1,691 96,645 57,153 16,809 5.7 1992 1,675 99,510 59,409 17,216 5.8 1993 1,680 103,116 61,379 17,748 5.8 1994 1,681 108,932 64,802 18,653 5.8 1995 1,696 115,451 68,073 19,777 5.8 1996 1,747 118,899 68,059 20,192 5.9 1997 1,790 124,584 69,600 20,302 6.1 1998 1,831 128,159 69,994 21,100 6.1 1999 2,029 132,384 65,246 24,537 5.4 2000 2,097 135,020 64,387 25,666 5.3 2001 2,154 136,584 63,409 25,512 5.4 2002 2,277 138,737 60,930 26,480 5.2 2003 1,908 140,160 73,459 23,815 5.9 2004 2,010 142,370 70,831 24,191 5.9 2005 2,087 144,028 69,012 27,689 5.2 2006 2,170 142,169 65,516 28,107 5.1 b 2007 2,635 184,199 69,905 30,904 6.0 2008 2,585 183,826 71,113 30,561 6.0 2009 2,617 168,100 64,234 28,050 6.0 2010 2,553 175,789 68,856 29,927 5.9 2011 2,452 163,791 66,809 28,181 5.8 2012 2,469 163,602 66,262 27,975 5.8 2013 2,471 168,436 68,155 28,795 5.8 2014 2,577 169,830 65,897 29,118 5.8 2015 2,747 170,246 61,978 28,884 5.9
Average annual percentage change 1970–2015 2.5% 3.6% 1.0% 3.1% 0.5% 2005–2015 2.8% 1.7% -1.1% 0.4% 1.3%
Source: U. S. Department of Transportation, Federal Highway Administration, Highway Statistics 2015, Washington, DC,
2016, Table VM-1 and annual. (Additional resources: www.fhwa.dot.gov) a The Federal Highway Administration changed the combination truck travel methodology in 1993.
b Due to FHWA methodology changes, data from 2007-on are not comparable with previous data.

5–4
TRANSPORTATION ENERGY DATA BOOK: EDITION 36—2017
Truck sales rose in 2010 for the first time since the sales peak in 2004 and have thus far continued to rise. Trucks under 10,000 lb continue to dominate truck sales.
Table 5.3
New Retail Truck Sales by Gross Vehicle Weight, 1970–2016a (thousands)
Class 1 Class 2 Class 3 Class 4 Class 5 Class 6 Class 7 Class 8
Calendar 6,000 lb 6,001– 10,001– 14,001– 16,001– 19,501– 26,001– 33,001 lb year or less 10,000 lb 14,000 lb 16,000 lb 19,500 lb 26,000 lb 33,000 lb and over Total
Domestic sales (import data are not available) 1970b 1,049 408 6 12 58 133 36 89 1,791 1975 1,101 952 23 1 9 159 23 83 2,351 1980 985 975 4 c 2 90 58 117 2,231 1981 896 850 1 c 2 72 51 100 1,972 1982 1,102 961 1 c 1 44 62 76 2,248 1983 1,314 1,207 c c 1 47 59 82 2,710 1984 2,031 1,224 6 c 5 55 78 138 3,538 1985 2,408 1,280 11 c 5 48 97 134 3,983
Domestic and import sales 1986 3,380 1,214 12 c 6 45 101 113 4,870 1987 3,435 1,175 14 2 8 44 103 131 4,912 1988 3,467 1,333 14 21 8 54 103 148 5,149 1989 3,313 1,297 19 27 7 39 93 145 4,942 1990 3,451 1,097 21 27 5 38 85 121 4,846 1991 3,246 876 21 24 3 22 73 99 4,365 1992 3,608 1,021 26 26 4 28 73 119 4,903 1993 4,119 1,232 27 33 4 27 81 158 5,681 1994 4,527 1,506 35 44 4 20 98 186 6,421 1995 4,422 1,631 40 53 4 23 107 201 6,481 1996 4,829 1,690 52 59 7 19 104 170 6,930 1997 5,085 1,712 53 57 9 18 114 179 7,226 1998 5,263 2,036 102 43 25 32 115 209 7,826 1999 5,707 2,366 122 49 30 48 130 262 8,716 2000 5,965 2,421 117 47 29 51 123 212 8,965 2001 6,073 2,525 102 52 24 42 92 140 9,050 2002 6,068 2,565 80 38 24 45 69 146 9,035 2003 6,267 2,671 91 40 29 51 67 142 9,357 2004 6,458 2,796 107 47 36 70 75 203 9,793 2005 6,586 2,528 167 49 46 60 89 253 9,777 2006 6,136 2,438 150 50 49 70 91 284 9,268 2007 5,682 2,623 166 51 45 54 70 151 8,842 2008 4,358 1,888 135 36 40 39 49 133 6,680 2009 3,528 1,306 112 20 24 22 39 95 5,145 2010 4,245 1,513 161 12 31 29 38 107 6,137 2011 4,714 1,735 195 10 42 41 41 171 6,951 2012 5,164 1,811 223 9 55 40 47 195 7,544 2013 5,615 2,077 254 12 60 47 48 185 8,298 2014 6,209 2,275 264 13 67 52 54 220 9,154 2015 7,161 2,417 283 14 72 55 59 249 10,310 2016 7,724 2,572 296 14 72 62 60 193 10,993
Average annual percentage change 1970–1985 5.7% 7.9% 4.1% c -15.1% -6.6% 6.8% 2.8% 5.5% 1986–2016 2.8% 2.5% 11.3% 6.9%d 8.6% 1.1% -1.7% 1.8% 2.8% 2006–2016 2.3% 0.5% 7.0% -12.0% 3.9% -1.2% -4.1% -3.8% 1.7%
Source: Ward’s Communications, www.wardsauto.com. (Additional resources: www.wardsauto.com) a Sales include domestic-sponsored imports. b Data for 1970 is based on new truck registrations. c Data are not available. d 1987-2016.
5–5
TRANSPORTATION ENERGY DATA BOOK: EDITION 36—2017
The Vehicle Inventory and Use Survey (VIUS) was discontinued, thus the 2002 VIUS data remain the latest available. The United States Department of Transportation, the United States Department of Energy, and the United States Department of Agriculture are funding a planning study to design and scope a new VIUS, possibly utilizing new forms of survey technologies. There is an opportunity to provide input on how VIUS data have been used; which survey elements are essential to your future data and policy needs; and, elements which should be added or deleted. To review the questions from the 2002 survey prior to providing input, go to www.census.gov/svsd/www/vius/questionnaires.html. To give input towards a new VIUS data collection, email [email protected].
Vehicle Inventory and Use Survey
The Vehicle Inventory and Use Survey (VIUS), which was formerly the Truck Inventory
and Use Survey (TIUS), provides data on the physical and operational characteristics of the
Nation's truck population. It is based on a probability sample of private and commercial trucks
registered (or licensed) in each state. In 1997, the survey was changed to the Vehicle Inventory
and Use Survey due to future possibilities of including additional vehicle types. The 2002 VIUS,
however, only includes trucks. Copies of the 2002 VIUS report or CD may be obtained by
contacting the U.S. Bureau of the Census, Transportation Characteristics Surveys Branch (301)
457-2797. Internet site:
www.census.gov/svsd/www/tiusview.html
Since 1987, the survey has included minivans, vans, station wagons on truck chassis, and
sport utility vehicles in addition to the bigger trucks. The 1977 and 1982 surveys did not include
those vehicle types. The estimated number of trucks that were within the scope of the 2002 VIUS
and registered in the United States as of July 1, 2002 was 85.2 million. These trucks were
estimated to have been driven a total of 1,115 billion miles during 2002, an increase of 6.8% from
1997. The average annual miles traveled per truck was estimated at 13,100 miles.
In 2016, the California Department of Transportation is conducting a survey to collect data
on the physical and operational characteristics of the State’s commercial vehicle population called
the California Vehicle Inventory Use and Survey. Internet site:
www.dot.ca.gov/hq/tpp/offices/omsp/statewide_modeling/cal_vehicle_survey.html
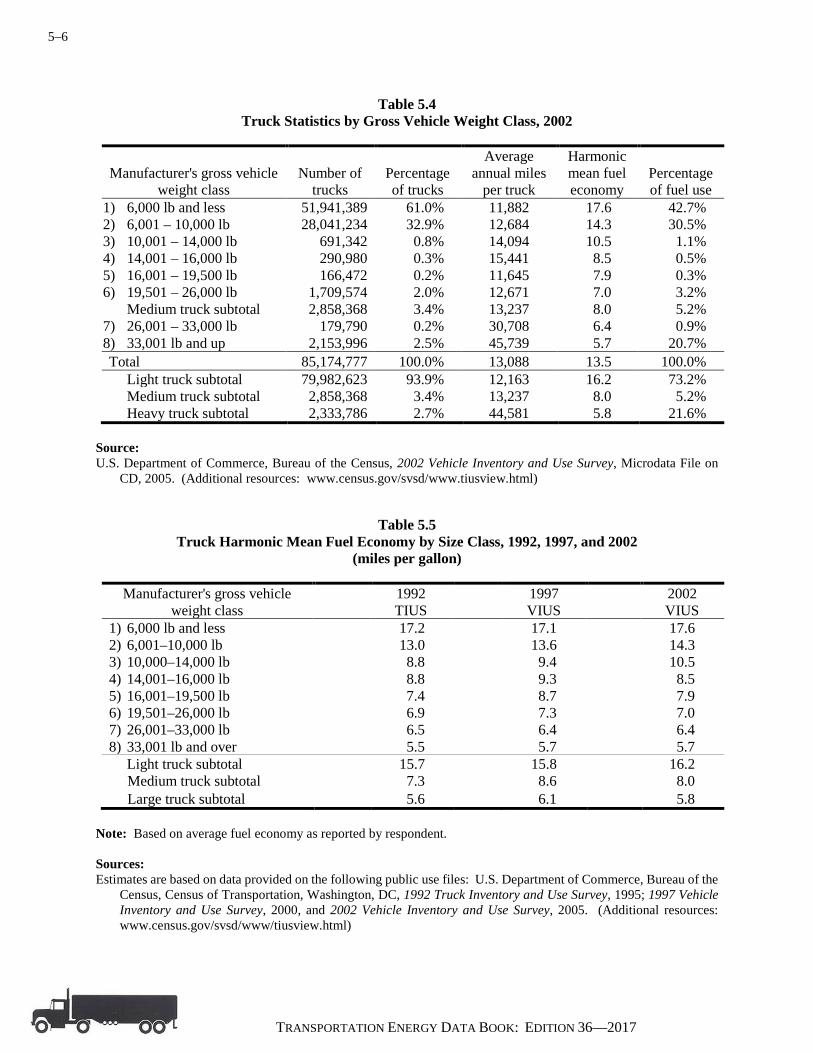
5–6
TRANSPORTATION ENERGY DATA BOOK: EDITION 36—2017
Table 5.4 Truck Statistics by Gross Vehicle Weight Class, 2002
Manufacturer's gross vehicle weight class
Number of trucks
Percentage of trucks
Average annual miles
per truck
Harmonic mean fuel economy
Percentage of fuel use
1) 6,000 lb and less 51,941,389 61.0% 11,882 17.6 42.7% 2) 6,001 – 10,000 lb 28,041,234 32.9% 12,684 14.3 30.5% 3) 10,001 – 14,000 lb 691,342 0.8% 14,094 10.5 1.1% 4) 14,001 – 16,000 lb 290,980 0.3% 15,441 8.5 0.5% 5) 16,001 – 19,500 lb 166,472 0.2% 11,645 7.9 0.3% 6) 19,501 – 26,000 lb 1,709,574 2.0% 12,671 7.0 3.2% Medium truck subtotal 2,858,368 3.4% 13,237 8.0 5.2% 7) 26,001 – 33,000 lb 179,790 0.2% 30,708 6.4 0.9% 8) 33,001 lb and up 2,153,996 2.5% 45,739 5.7 20.7% Total 85,174,777 100.0% 13,088 13.5 100.0%
Light truck subtotal 79,982,623 93.9% 12,163 16.2 73.2% Medium truck subtotal 2,858,368 3.4% 13,237 8.0 5.2% Heavy truck subtotal 2,333,786 2.7% 44,581 5.8 21.6%
Source: U.S. Department of Commerce, Bureau of the Census, 2002 Vehicle Inventory and Use Survey, Microdata File on
CD, 2005. (Additional resources: www.census.gov/svsd/www.tiusview.html)
Table 5.5 Truck Harmonic Mean Fuel Economy by Size Class, 1992, 1997, and 2002
(miles per gallon)
Manufacturer's gross vehicle weight class
1992 TIUS
1997 VIUS
2002 VIUS
1) 6,000 lb and less 17.2 17.1 17.6 2) 6,001–10,000 lb 13.0 13.6 14.3 3) 10,000–14,000 lb 8.8 9.4 10.5 4) 14,001–16,000 lb 8.8 9.3 8.5 5) 16,001–19,500 lb 7.4 8.7 7.9 6) 19,501–26,000 lb 6.9 7.3 7.0 7) 26,001–33,000 lb 6.5 6.4 6.4 8) 33,001 lb and over 5.5 5.7 5.7 Light truck subtotal 15.7 15.8 16.2 Medium truck subtotal 7.3 8.6 8.0 Large truck subtotal 5.6 6.1 5.8
Note: Based on average fuel economy as reported by respondent. Sources: Estimates are based on data provided on the following public use files: U.S. Department of Commerce, Bureau of the
Census, Census of Transportation, Washington, DC, 1992 Truck Inventory and Use Survey, 1995; 1997 Vehicle Inventory and Use Survey, 2000, and 2002 Vehicle Inventory and Use Survey, 2005. (Additional resources: www.census.gov/svsd/www/tiusview.html)

5–7
TRANSPORTATION ENERGY DATA BOOK: EDITION 36—2017
As expected, most light trucks travel within 50 miles of their home base and refuel at public stations. About sixty percent of heavy trucks travel over 50 miles from their home base and 36% of them refuel at central company-owned refueling stations.
Table 5.6
Truck Statistics by Size, 2002
Manufacturer's gross vehicle weight class
Light
(< 10,000 lb)
Medium (10,001–
26,000 lb) Heavy
(> 26,000 lb) Total Typical trip miles or range of operationa
Under 50 miles 69.2% 61.5% 40.7% 68.2% 51–100 miles 8.5% 11.7% 13.5% 8.7% 101–200 miles 2.4% 3.2% 6.7% 2.5% 201–500 miles 1.1% 1.8% 7.6% 1.3% 501 miles or more 1.4% 2.2% 10.4% 1.7% Off-road 1.1% 3.5% 3.2% 1.2% Vehicle not in use 2.2% 4.4% 3.2% 2.3% Not reported 14.1% 11.7% 14.7% 14.1% Totalb 100.0% 100.0% 100.0% 100.0%
Primary refueling facility Gas station 96.9% 62.4% 28.4% 93.9% Truck stop 0.7% 7.7% 31.9% 1.8% Own facility 2.0% 27.3% 36.2% 3.7% Other nonpublic facility 0.3% 2.6% 3.5% 0.5% Other 0.0% 0.0% 0.0% 0.0% Totalb 100.0% 100.0% 100.0% 100.0%
Source: U.S. Department of Commerce, Bureau of the Census, 2002 Vehicle Inventory and Use Survey, Microdata. File on
CD, 2005. (Additional resources: www.census.gov/svsd/www/tiusview.html) a The respondent was asked to choose the category which best described the trips made by the vehicle. b Percentages may not sum to totals due to rounding.

5–8
TRANSPORTATION ENERGY DATA BOOK: EDITION 36—2017
More medium truck owners listed construction as the truck’s major use than any other major use category. Construction was the second highest major use for light trucks and heavy trucks.
Table 5.7
Percentage of Trucks by Size Ranked by Major Use, 2002
Rank
Light (< 10,000 lb
average weight)
Medium (10,001 – 26,000 lb
average weight)
Heavy (> 26,000 lb average
weight) 1 Personal Construction For hire 81.5% 18.4% 30.1%
2 Construction Agriculture Construction 4.6% 16.2% 15.9%
3 Other services a For hire Agriculture 2.5% 9.6% 12.2%
4 Not in use Retail Retail 2.2% 7.1% 5.4%
5 Agriculture Not in use Not in use 1.9% 6.4% 5.1%
6 Retail Leasing Waste management 1.5% 6.2% 5.0%
7 Unknown Wholesale Manufacturing 1.3% 5.5% 4.9%
8 Leasing Waste management Wholesale 0.7% 5.4% 4.8%
9 Manufacturing Utilities Leasing 0.7% 5.0% 4.6%
10 Utilities Personal Unknown 0.6% 4.8% 3.2%
11 Waste management Unknown Personal 0.6% 4.4% 2.5%
12 Wholesale Manufacturing Mining 0.6% 3.3% 2.4%
13 Information services Other servicesa Other servicesa 0.4% 3.2% 1.3%
14 For hire Food services Utilities 0.4% 1.6% 1.1%
15 Food services Information services Food services 0.3% 1.3% 1.1%
16 Arts Mining Arts 0.2% 1.1% 0.3%
17 Mining Arts Information services 0.1% 0.5% 0.1%
Source: U.S. Department of Commerce, Bureau of the Census, 2002 Vehicle Inventory and Use Survey, Micro data File on
CD, 2005. (Additional resources: www.census.gov/svsd/www/tiusview.html) a Business and personal services.
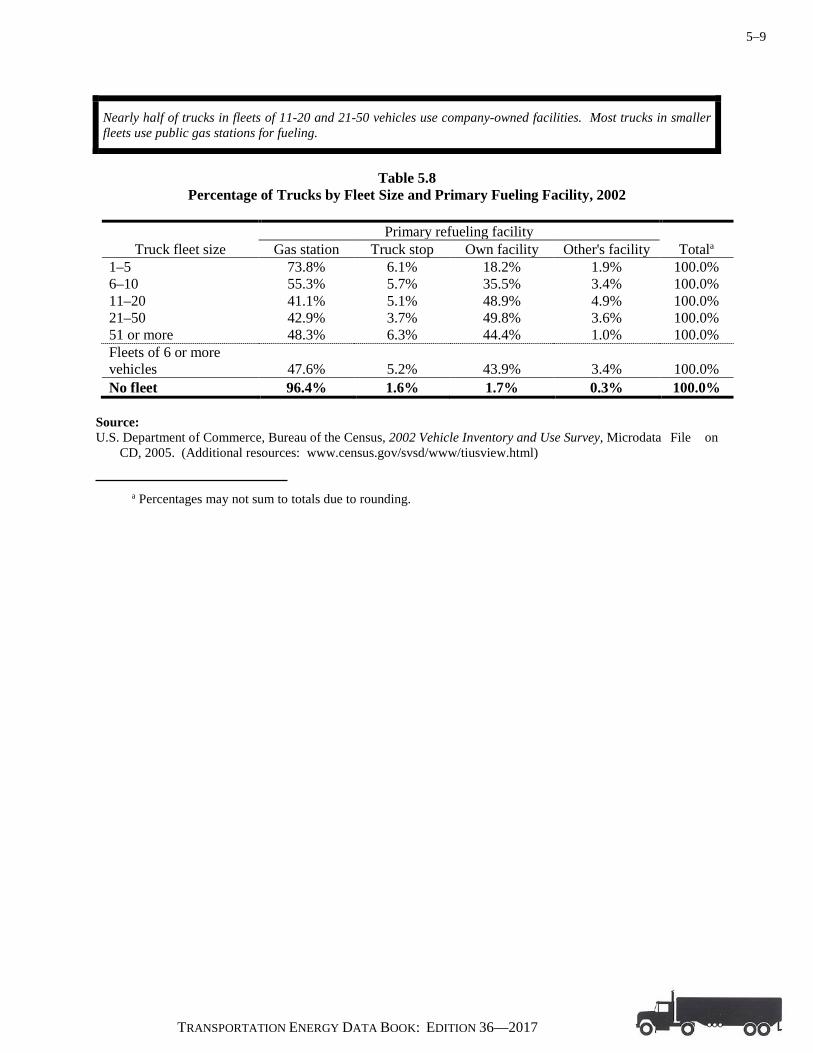
5–9
TRANSPORTATION ENERGY DATA BOOK: EDITION 36—2017
Nearly half of trucks in fleets of 11-20 and 21-50 vehicles use company-owned facilities. Most trucks in smaller fleets use public gas stations for fueling.
Table 5.8
Percentage of Trucks by Fleet Size and Primary Fueling Facility, 2002
Primary refueling facility Truck fleet size Gas station Truck stop Own facility Other's facility Totala
1–5 73.8% 6.1% 18.2% 1.9% 100.0% 6–10 55.3% 5.7% 35.5% 3.4% 100.0% 11–20 41.1% 5.1% 48.9% 4.9% 100.0% 21–50 42.9% 3.7% 49.8% 3.6% 100.0% 51 or more 48.3% 6.3% 44.4% 1.0% 100.0% Fleets of 6 or more vehicles 47.6% 5.2% 43.9% 3.4% 100.0% No fleet 96.4% 1.6% 1.7% 0.3% 100.0%
Source: U.S. Department of Commerce, Bureau of the Census, 2002 Vehicle Inventory and Use Survey, Microdata File on
CD, 2005. (Additional resources: www.census.gov/svsd/www/tiusview.html)
a Percentages may not sum to totals due to rounding.
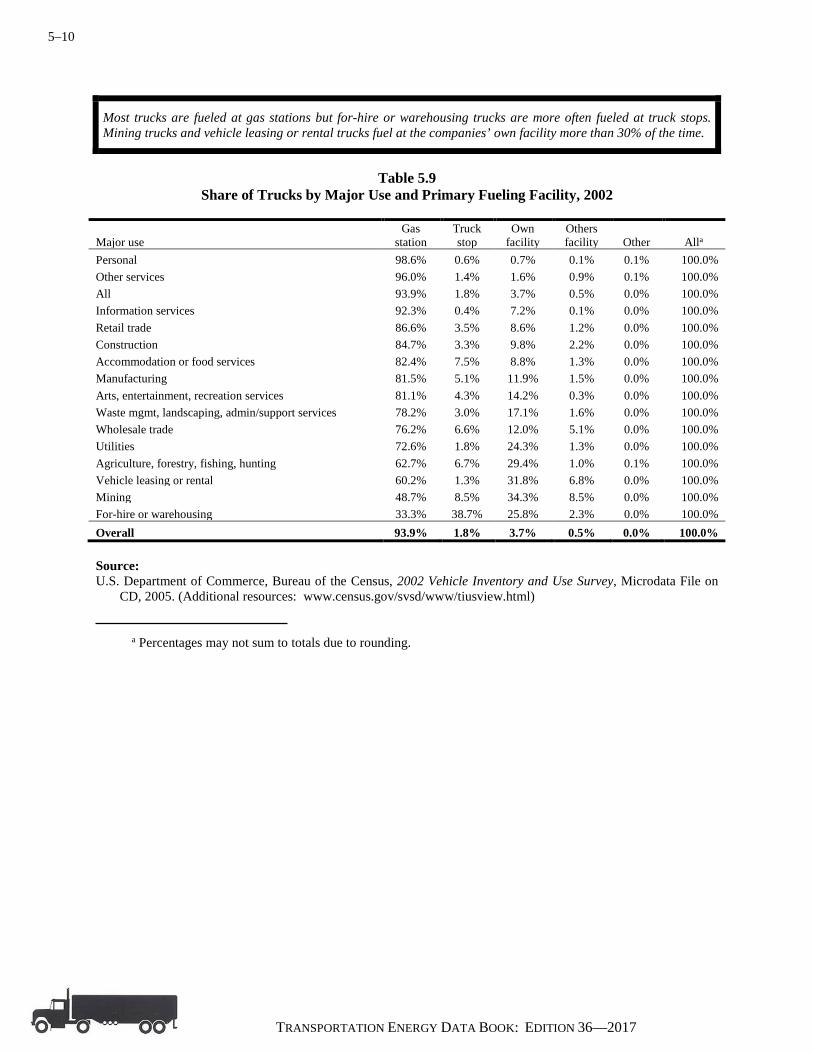
5–10
TRANSPORTATION ENERGY DATA BOOK: EDITION 36—2017
Most trucks are fueled at gas stations but for-hire or warehousing trucks are more often fueled at truck stops. Mining trucks and vehicle leasing or rental trucks fuel at the companies’ own facility more than 30% of the time.
Table 5.9
Share of Trucks by Major Use and Primary Fueling Facility, 2002
Major use Gas
station Truck stop
Own facility
Others facility Other Alla
Personal 98.6% 0.6% 0.7% 0.1% 0.1% 100.0% Other services 96.0% 1.4% 1.6% 0.9% 0.1% 100.0% All 93.9% 1.8% 3.7% 0.5% 0.0% 100.0% Information services 92.3% 0.4% 7.2% 0.1% 0.0% 100.0% Retail trade 86.6% 3.5% 8.6% 1.2% 0.0% 100.0% Construction 84.7% 3.3% 9.8% 2.2% 0.0% 100.0% Accommodation or food services 82.4% 7.5% 8.8% 1.3% 0.0% 100.0% Manufacturing 81.5% 5.1% 11.9% 1.5% 0.0% 100.0% Arts, entertainment, recreation services 81.1% 4.3% 14.2% 0.3% 0.0% 100.0% Waste mgmt, landscaping, admin/support services 78.2% 3.0% 17.1% 1.6% 0.0% 100.0% Wholesale trade 76.2% 6.6% 12.0% 5.1% 0.0% 100.0% Utilities 72.6% 1.8% 24.3% 1.3% 0.0% 100.0% Agriculture, forestry, fishing, hunting 62.7% 6.7% 29.4% 1.0% 0.1% 100.0% Vehicle leasing or rental 60.2% 1.3% 31.8% 6.8% 0.0% 100.0% Mining 48.7% 8.5% 34.3% 8.5% 0.0% 100.0% For-hire or warehousing 33.3% 38.7% 25.8% 2.3% 0.0% 100.0% Overall 93.9% 1.8% 3.7% 0.5% 0.0% 100.0% Source: U.S. Department of Commerce, Bureau of the Census, 2002 Vehicle Inventory and Use Survey, Microdata File on
CD, 2005. (Additional resources: www.census.gov/svsd/www/tiusview.html)
a Percentages may not sum to totals due to rounding.

5–11
TRANSPORTATION ENERGY DATA BOOK: EDITION 36—2017
The figure below shows the distribution of annual travel the two types of Class 7 and 8 vehicles–combination units (separate tractor and trailer) and single units (tractor and trailer on a single chassis). This information is for all trucks and trucks two years old or less. Combination trucks, dominated by box-type trailers, display the greatest amount of annual travel of all heavy vehicle types, as is evidenced both by the range of annual use. Most of the single-unit trucks in the survey travel 40,000 miles per year or less.
Figure 5.1. Distribution of Trucks over 26,000 lb by Vehicle-Miles Traveled
Note: Heavy trucks (class 7 & 8) are greater than 26,000 pounds gross vehicle weight based on the manufacturer’s rating. Source: U.S. Department of Commerce, Bureau of the Census, 2002 Vehicle Inventory and Use Survey, Microdata File on
CD, 2005. (Additional resources: www.census.gov/svsd/www/tiusview.html)

5–12
TRANSPORTATION ENERGY DATA BOOK: EDITION 36—2017
The latest Vehicle Inventory and Use Survey asked truck owners if the truck had certain features as permanent equipment on the truck. Some of the features asked about were onboard computers, idle-reduction devices, navigational systems, and Internet access. Of the 2.3 million heavy trucks (class 7 & 8) in the United States, nearly 10% were equipped with onboard computers that had communication capabilities and another 5% had onboard computers without communication capabilities. Six percent of heavy trucks were equipped with idle-reducing technology. Navigational systems and Internet access were available in less than one percent of heavy trucks.
Figure 5.2. Share of Heavy Trucks with Selected Electronic Features, 2002
Note: Heavy trucks (class 7 & 8) are greater than 26,000 pounds gross vehicle weight based on the manufacturer’s rating. Source: U.S. Department of Commerce, Bureau of the Census, 2002 Vehicle Inventory and User Survey, Microdata File on
CD, 2005.
5–13
TRANSPORTATION ENERGY DATA BOOK: EDITION 36—2017
Fuel Economy Study for Class 8 Trucks
As part of a study sponsored by the U.S. Department of Energy (DOE) Vehicle
Technologies Office (VTO), the Oak Ridge National Laboratory (ORNL) in conjunction with
several industry partners has collected data and information related to heavy-truck operation in
real-world highway environments. The primary objective of the project was to collect real-world
performance and spatial data for long-haul operations of Class 8 tractor-trailers from a fleet
engaged in normal freight operations. Six model-year 2005 Class 8 trucks from the selected fleet,
which operates within a large area of the country extending from the east coast to Mountain Time
Zone and from Canada to the US-Mexican border, were instrumented and 60 channels of data were
collected for over a year at a rate of 5 Hz (or 5 readings per second). Those channels included
information such as instantaneous fuel rate, engine speed, gear ratio, vehicle speed, and other
information read from the vehicle’s databus; weather information (wind speed, precipitation, air
temperature, etc.) gathered from an on-board weather station; spatial information (latitude,
longitude, altitude) acquired from a GPS (Global Positioning System) device; and instantaneous
tractor and trailer weight obtained from devices mounted on the six participating tractors and ten
trailers. Three of the six instrumented tractors and five of the ten instrumented trailers were
mounted with New Generation Single Wide-Based Tires and the others with regular dual tires.
Over the duration of this phase of the project (just over a year) the six tractors traveled nearly
700,000 miles.
To find out more about this project, contact Oscar Franzese, [email protected], 865-946-
1304. The final report on this project is available on-line at:
cta.ornl.gov/cta/Publications/Reports/ORNL_TM_2008-122.pdf.
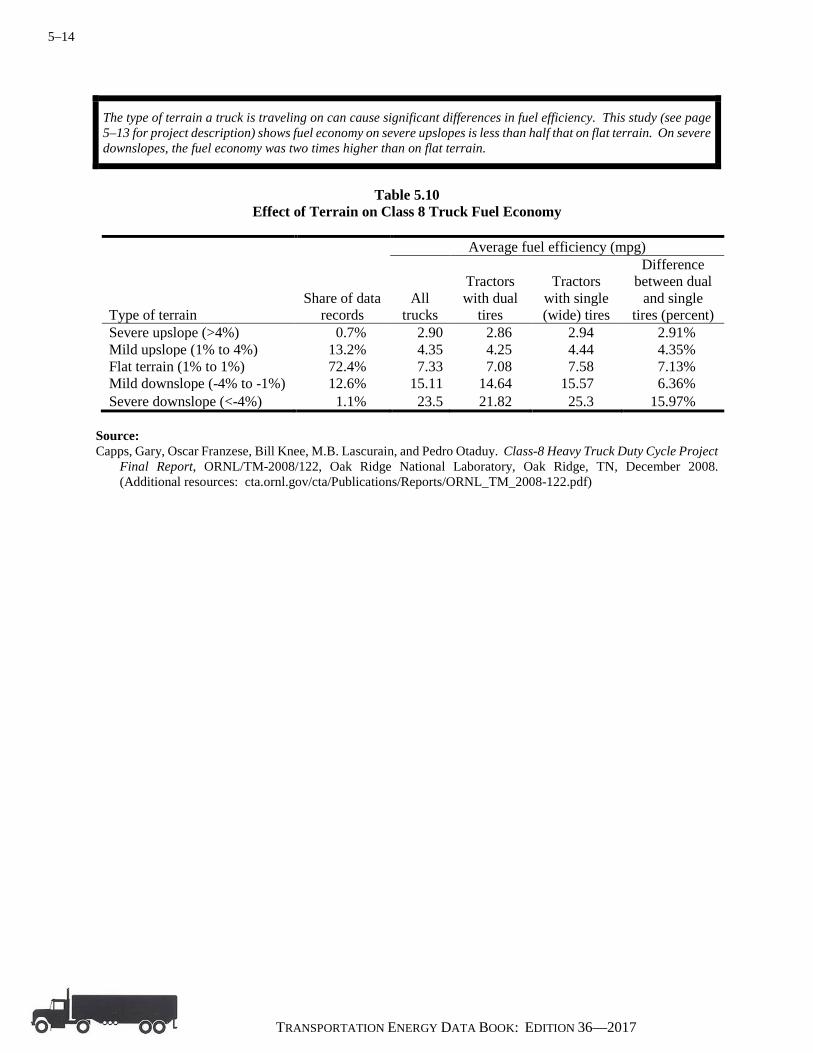
5–14
TRANSPORTATION ENERGY DATA BOOK: EDITION 36—2017
The type of terrain a truck is traveling on can cause significant differences in fuel efficiency. This study (see page 5–13 for project description) shows fuel economy on severe upslopes is less than half that on flat terrain. On severe downslopes, the fuel economy was two times higher than on flat terrain.
Table 5.10
Effect of Terrain on Class 8 Truck Fuel Economy
Average fuel efficiency (mpg)
Type of terrain Share of data
records All
trucks
Tractors with dual
tires
Tractors with single (wide) tires
Difference between dual
and single tires (percent)
Severe upslope (>4%) 0.7% 2.90 2.86 2.94 2.91% Mild upslope (1% to 4%) 13.2% 4.35 4.25 4.44 4.35% Flat terrain (1% to 1%) 72.4% 7.33 7.08 7.58 7.13% Mild downslope (-4% to -1%) 12.6% 15.11 14.64 15.57 6.36% Severe downslope (<-4%) 1.1% 23.5 21.82 25.3 15.97%
Source: Capps, Gary, Oscar Franzese, Bill Knee, M.B. Lascurain, and Pedro Otaduy. Class-8 Heavy Truck Duty Cycle Project
Final Report, ORNL/TM-2008/122, Oak Ridge National Laboratory, Oak Ridge, TN, December 2008. (Additional resources: cta.ornl.gov/cta/Publications/Reports/ORNL_TM_2008-122.pdf)

5–15
TRANSPORTATION ENERGY DATA BOOK: EDITION 36—2017
This table presents a distribution of distance traveled, fuel consumed, and fuel economy by speed and by type of tires for the vehicles participating in the project (see page 5-13 for project description). The speed bins are divided into 5-mile intervals, going from 0+ mph (i.e., speed > 0.00 mph) to 85 mph, while the four main columns of the table are organized by the type of tires that were mounted on the tractor and trailers. The first row of the table contains information about fuel consumed while the vehicle was idling (i.e., the vehicle was static with the engine on) with the following rows presenting information about the distance traveled, fuel consumed, and fuel economy for each one of the speed intervals. The next-to-the-last row shows the totals for both traveled distances and fuel consumed as well as the overall fuel economy for each tire-combination category. The latter are then used to compute the percentage difference in terms of fuel economy from dual tire tractors and trailers, which is the most common tire setup for large trucks at the present time.
Table 5.11
Fuel Economy for Class 8 Trucks as Function of Speed and Tractor-Trailer Tire Combination
Dual tire tractor –
dual tire trailer Dual tire tractor –
single (wide) tire trailer Single (wide) tire tractor –
dual tire trailer Single (wide) tire tractor -single (wide) tire trailer
Distance Fuel Fuel Distance Fuel Fuel Distance Fuel Fuel Distance Fuel Fuel Speed traveled cons. econ. traveled cons. econ. traveled cons. econ. traveled cons. econ. (mph) (miles) (gal) (MPG) (miles) (gal) (MPG) (miles) (gal) (MPG) (miles) (gal) (MPG) Idling N/A 1,858.5 N/A N/A 967.9 N/A N/A 1,676.4 N/A N/A 706.0 N/A 0+ to 5 281 101.8 2.76 148 50.4 2.93 368.0 124.2 3.0 156 52.8 2.96
5+ to 10 674 198.8 3.39 368 103.2 3.56 808.0 245.4 3.3 331 98.8 3.35 10+ to 15 723 192.0 3.77 396 98.3 4.03 848.0 216.5 3.9 343 87.0 3.95 15+ to 20 744 199.1 3.73 404 100.9 4.00 882.0 221.6 4.0 361 90.5 3.98 20+ to 25 938 228.4 4.11 489 113.6 4.31 1,111.0 244.2 4.6 462 101.1 4.57 25+ to 30 1,178 266.9 4.41 609 131.5 4.63 1,420.0 286.9 5.0 580 117.6 4.93 30+ to 35 1,481 336.8 4.40 753 154.2 4.88 1,774.0 341.1 5.2 708 141.1 5.02 35+ to 40 1,917 403.5 4.75 1,000 193.6 5.17 2,284.0 433.6 5.3 941 184.3 5.10 40+ to 45 2,955 584.1 5.06 1,543 285.9 5.40 3,380.0 603.6 5.6 1,350 254.4 5.31 45+ to 50 4,935 907.9 5.43 2,573 447.7 5.75 5,410.0 872.8 6.2 2,177 360.4 6.04 50+ to 55 9,397 1,629.8 5.77 4,962 811.5 6.11 10,046.0 1,622.7 6.2 3,877 625.5 6.20 55+ to 60 20,656 3,297.2 6.26 11,707 1,721.9 6.80 22,373.0 3,257.8 6.9 8,710 1,246.9 6.99 60+ to 65 38,964 5,879.6 6.63 21,472 2,980.8 7.20 34,517.0 4,840.0 7.1 14,944 2,049.4 7.29
NOT ADJUSTED FOR TERRAIN: See note below. 65+ to 70 58,304 8,313.2 7.01 27,931 3,652.2 7.65 65,063.0 9,256.4 7.0 27,144 3,880.1 7.00 70+ to 75 56,378 7,483.2 7.53 21,751 2,745.5 7.92 66,882.0 8,435.6 7.9 32,887 4,056.1 8.11 75+ to 85 7,849 808.2 9.71 3,610 403.2 8.95 11,513.0 911.1 12.6 6,817 512.2 13.31
Totala 207,374 30,831.0 6.73 99,714 13,994.0 7.13 228,680.0 31,913.0 7.2 101,790 13,858.0 7.35 Percent increase in fuel economy from dual tire trac/trail
0.00% 5.93% 6.53% 9.20%
Note: These data were not adjusted to account for the effects of terrain. The increase in fuel economy for speeds above 70 mph is likely due to the vehicle achieving high speeds while traveling down slope. Therefore, this increase in fuel economy is not expected to be characteristic of all travel at these higher speeds. Source: Capps, Gary, Oscar Franzese, Bill Knee, M.B. Lascurain, and Pedro Otaduy. Class-8 Heavy Truck Duty Cycle Project
Final Report, ORNL/TM-2008/122, Oak Ridge National Laboratory, Oak Ridge, TN, December 2008. (Additional resources: cta.ornl.gov/cta/Publications/Reports/ORNL_TM_2008-122.pdf)
a Total fuel consumed does not include fuel consumed while idling.

5–16
TRANSPORTATION ENERGY DATA BOOK: EDITION 36—2017
The fuel economy information presented in Table 5.11 is on the upper limits of today’s large-truck fleets and is mostly a result of driver training and the extensive vehicle maintenance (including constant tire pressure) to which the fleet company participating in this project adheres. Nevertheless, the results of this extensive test indicate that there are substantial gains in terms of fuel economy for large trucks when single (wide) tires are used in combination with dual tires or alone (best case). Figure 5.3 shows the information from Table 5.11 in a graphical form (bars) and also displays for each speed bin the percentage of the total distance that is traveled at that speed (line). It is possible to observe that above 80% of the distance traveled by long-haul Class 8 trucks is done at speeds above 55 mph. Therefore, any gains in fuel economies at these speeds derived from a given tire combination would have a very large impact on the overall fuel economy of these types of trucks. Figure 5.3 shows that, except for the D-S combination within the 65+ to 70 mph, the combinations with all single (wide) tires perform better and, therefore, obtain the largest overall fuel economy.
Figure 5.3. Class 8 Truck Fuel Economy as a Function of Speed and Tractor-Trailer Tire
Combination and Percentage of Total Distance Traveled as a Function of Speed
NOT ADJUSTED FOR TERRAIN: See note below.
Note: D = Dual tire. S = Single (wide) tire. These data were not adjusted to account for the effects of terrain. The increase in fuel economy for speeds above 70 mph is likely due to the vehicle achieving high speeds while traveling down slope. Therefore, this increase in fuel economy is not expected to be characteristic of all travel at these higher speeds. Source: Capps, Gary, Oscar Franzese, Bill Knee, M.B. Lascurain, and Pedro Otaduy. Class-8 Heavy Truck Duty Cycle Project
Final Report, ORNL/TM-2008/122, Oak Ridge National Laboratory, Oak Ridge, TN, December 2008. (Additional resources: cta.ornl.gov/cta/Publications/Reports/ORNL_TM_2008-122.pdf)

5–17
TRANSPORTATION ENERGY DATA BOOK: EDITION 36—2017
This graph presents for each one of the four tire-combination categories the percent of total fuel that is consumed when traveling at different speeds (bars) as well as the average percent of fuel consumed for each speed bin (line). As opposed to Table 5.11, the total fuel consumed on this graph includes the fuel consumed while idling.
Figure 5.4. Class 8 Truck Percent of Total Fuel Consumed as a Function of Speed
and Tractor-Trailer Tire Combination
NOT ADJUSTED FOR TERRAIN: See note below
Note: D = Dual tire. S = Single (wide) tire. These data were not adjusted to account for the effects of terrain. The increase in fuel economy for speeds above 70 mph is likely due to the vehicle achieving high speeds while traveling down slope. Therefore, this increase in fuel economy is not expected to be characteristic of all travel at these higher speeds. Source: Capps, Gary, Oscar Franzese, Bill Knee, M.B. Lascurain, and Pedro Otaduy. Class-8 Heavy Truck Duty Cycle Project
Final Report, ORNL/TM-2008/122, Oak Ridge National Laboratory, Oak Ridge, TN, December 2008. (Additional resources: cta.ornl.gov/cta/Publications/Reports/ORNL_TM_2008-122.pdf)
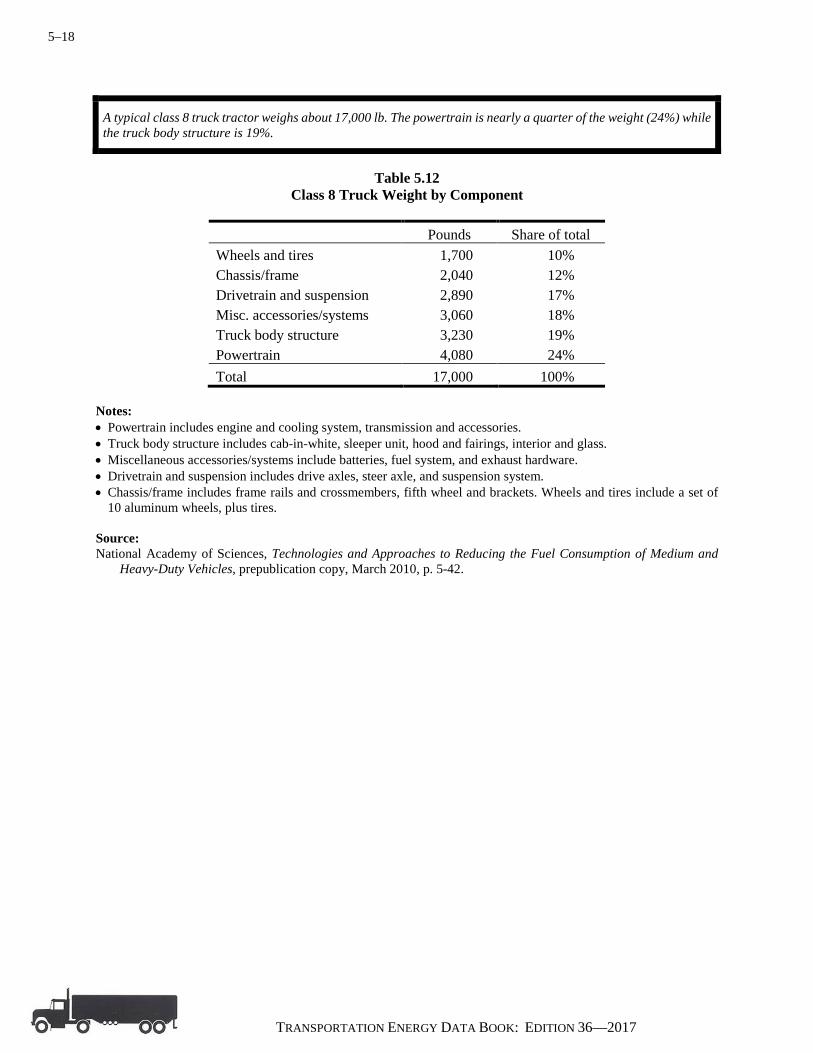
5–18
TRANSPORTATION ENERGY DATA BOOK: EDITION 36—2017
A typical class 8 truck tractor weighs about 17,000 lb. The powertrain is nearly a quarter of the weight (24%) while the truck body structure is 19%.
Table 5.12
Class 8 Truck Weight by Component
Pounds Share of total Wheels and tires 1,700 10% Chassis/frame 2,040 12% Drivetrain and suspension 2,890 17% Misc. accessories/systems 3,060 18% Truck body structure 3,230 19% Powertrain 4,080 24% Total 17,000 100%
Notes: • Powertrain includes engine and cooling system, transmission and accessories. • Truck body structure includes cab-in-white, sleeper unit, hood and fairings, interior and glass. • Miscellaneous accessories/systems include batteries, fuel system, and exhaust hardware. • Drivetrain and suspension includes drive axles, steer axle, and suspension system. • Chassis/frame includes frame rails and crossmembers, fifth wheel and brackets. Wheels and tires include a set of
10 aluminum wheels, plus tires. Source: National Academy of Sciences, Technologies and Approaches to Reducing the Fuel Consumption of Medium and
Heavy-Duty Vehicles, prepublication copy, March 2010, p. 5-42.

5–19
TRANSPORTATION ENERGY DATA BOOK: EDITION 36—2017
The gross weight of a vehicle (GVW) is the weight of the empty vehicle plus the weight of the maximum payload that the vehicle was designed to carry. In cars and small light trucks, the difference between the empty weight of the vehicle and the GVW is not significantly different (1,000 to 1,500 lb). The largest trucks and tractor-trailers, however, have a payload capacity share of 200%, which means they can carry 200% of their empty weight. The medium-sized trucks (truck classes 3-6) have payload capacity shares between 50% and 100%.
Table 5.13
Gross Vehicle Weight vs. Empty Vehicle Weight
Vehicle description Truck class
Gross vehicle weight range
(pounds)
Empty vehicle weight range
(pounds)
Maximum payload capacity (pounds)
Payload capacity share
(percent of empty weight)
Cars 3,200-6,000 2,400-5,000 1,000 20% Minivans, small SUVs, small pick-ups 1 4,000-2,400 3,200-4,500 1,500 33%
Large SUVs, standard pick-ups 2a 6,001-8,500 4,500-6,000 2,500 40%
Large SUVs, standard pick-ups 2b 8,501-10,000 5,000-6,300 3,700 60%
Utility van, multi- purpose, mini-bus, step van 3 10,001-14,000 7,650-8,750 5,250 60%
City delivery, parcel delivery, large walk-in, bucket, landscaping
4 14,001-16,000 7,650-8,750 7,250 80%
City delivery, parcel delivery, large walk-in, bucket
5 16,001-19,500 9,500-10,000 8,700 80%
City delivery, school bus, large walk-in, bucket 6 19,501-26,000 11,500-14,500 11,500 80%
City bus, furniture, refrigerated, refuse, fuel tanker, dump, tow, concrete, fire engine, tractor-trailer
7 26,001-33,000 11,500-14,500 18,500 125%
Refuse, concrete, furniture, city bus, tow, fire engine (straight trucks)
8a 33,001-80,000 20,000-26,000 54,000 200%
Tractor-trailer: van, refrigerated, bulk tanker, flat bed (combination trucks)
8b 33,001-80,000 20,000-26,000 54,000 200%
Source: National Academy of Sciences, Technologies and Approaches to Reducing the Fuel Consumption of Medium and
Heavy-Duty Vehicles, prepublication copy, March 2010, pp. 2-2 and 5-42.

5–20
TRANSPORTATION ENERGY DATA BOOK: EDITION 36—2017
According to weigh-in-motion data collected by fifteen states, the majority of 5-axle tractor-trailers on the road weigh between 33,000 and 73,000 lb. Eleven percent of the tractor-trailers had weight recorded around 72,800 lb and 10% around 68,300 lb. Another 10% of tractor-trailers were on the lighter end of the scale – around 37,500 lb. These data show that only a small percent of trucks on the road are near the maximum roadway gross vehicle weight of 80,000 lb. Thus, most trucks are filling the trailer space to capacity (cubing-out) before they reach the maximum weight limit (weighing-out).
Figure 5.5. Distribution of Class 8 Trucks by On-Road Vehicle Weight, 2008a
Note: Data are from these 15 States: California, Connecticut, Florida, Georgia, Hawaii, Iowa, Minnesota, Missouri, Montana, North Carolina, Oregon, Pennsylvania, South Dakota, Texas, and Washington. Source: National Academy of Sciences, Technologies and Approaches to Reducing the Fuel Consumption of Medium and
Heavy-Duty Vehicles, prepublication copy, March 2010, p. 5-45. Original source: Federal Highway Administration, Vehicle Travel Information System, 2008.
a Study reported data on 5-axle tractor-trailers which are class 8 trucks. Single-unit class 8 trucks were not considered in the study.

5–21
TRANSPORTATION ENERGY DATA BOOK: EDITION 36—2017
Commodity Flow Survey
The Commodity Flow Survey (CFS) designed to provide data on the flow of goods and materials by mode of transport. The survey was first conducted in various years from 1963 to 1977, and was again conducted in 1993, 1997, 2002, 2007, and 2012 with improvements in methodology, sample size, and scope. Data collection for the 2017 survey began in late 2016. It is a shipper-based survey which covers business establishments from these industries:
• Mining • Manufacturing • Wholesale trade • Select Retail and Services
Industries not covered by CFS include transportation, construction, most retail and services industries, farms, fisheries, foreign establishments, and most government-owned establishments. Before 1993 data were collected only on the principal mode of travel, but after that time all modes of a shipment were captured in the data.
The CFS is a joint effort of the Bureau of Transportation Statistics and the U.S. Census Bureau. Additional information on the survey can be found at: www.rita.dot.gov/bts/sites/rita.dot.gov.bts/files/publications/commodity_flow_survey/index.html or www.census.gov/econ/cfs/

5–22
TRANSPORTATION ENERGY DATA BOOK: EDITION 36—2017
Industries covered by the 2012 Commodity Flow Survey (CFS) shipped goods worth over $13 trillion. Compared to the 1993 CFS, the value of shipments is up 1.7% per year and tons shipped are up 0.8% per year. By value, multiple mode shipments increased 2.8% per year from 1993 to 2012.
Table 5.14
Value of Goods Shipped in the United States: Comparison of the 1993, 1997, 2002, 2007 and 2012 Commodity Flow Surveysa
1993 (billion
2012 dollars)
1997 (billion
2012 dollars)
2002 (billion
2012 dollars)
2007 (billion
2012 dollars)
2012 (billion dollars)
Average annual percent change
(1993-2012) All modes 10,106.6 9,933.3 10,716.8 12,938.9 13,852.1 1.7% Single modes 8,542.3 8,181.8 8,996.6 10,562.8 11,900.4 1.8% Truckb 7,612.4 7,126.0 7,957.3 9,230.4 10,132.2 1.5%
For-hire truck 4,538.0 4,150.4 4,794.9 5,487.5 6,504.6 1.9% Private truck 3,035.4 2,913.2 3,120.8 3,742.8 3,627.6 0.9%
Rail 427.7 457.2 396.8 483.3 473.1 0.5% Water 106.6 108.5 114.0 127.2 301.6 5.6%
Inland water 70.4 77.1 73.3 100.8 218.9 6.2% Great Lakes c 2.2 1.1 c 0.4 c Deep sea 34.2 29.2 39.6 25.5 59.9 3.0% Multiple waterways c d d d 22.3 c
Air (includes truck and air) 240.4 327.7 338.1 279.4 450.6 3.4% Pipelinee 155.4 162.4 190.4 442.5 542.9 6.8% Multiple modes 1,145.4 1,353.1 1,377.3 2,067.1 1,950.8 2.8% Parcel, U.S.P.S. or courier 973.7 1,224.4 1,260.6 1,729.5 1,688.2 2.9% Truck and rail 143.6 108.3 89.2 207.3 224.8 2.4% Truck and water 16.2 11.8 18.3 64.7 29.0 3.1% Rail and water 6.4 2.5 4.2 15.4 8.0 1.2% Other multiple modes 5.6 6.1 4.9 50.2 0.7 -10.3% Other and unknown modes
418.8 398.5 342.8 309.1 1.0
-27.2%
Source: U.S. Department of Transportation, Bureau of Transportation Statistics and U.S. Department of Commerce, Bureau
of the Census, 1993, 1997, 2002, 2007, and 2012 Commodity Flow Surveys, Table 1a. (Additional resources: http://www.census.gov/econ/cfs/historical_data.html)
a Detail may not add to total because of rounding. b "Truck" as a single mode includes shipments which went by private truck only, for-hire truck only, or a combination of private truck and for-hire truck. c Denotes data do not meet publication standards because of high sampling variability or poor response quality. d Data are not available. e CFS data for pipeline exclude most shipments of crude oil.
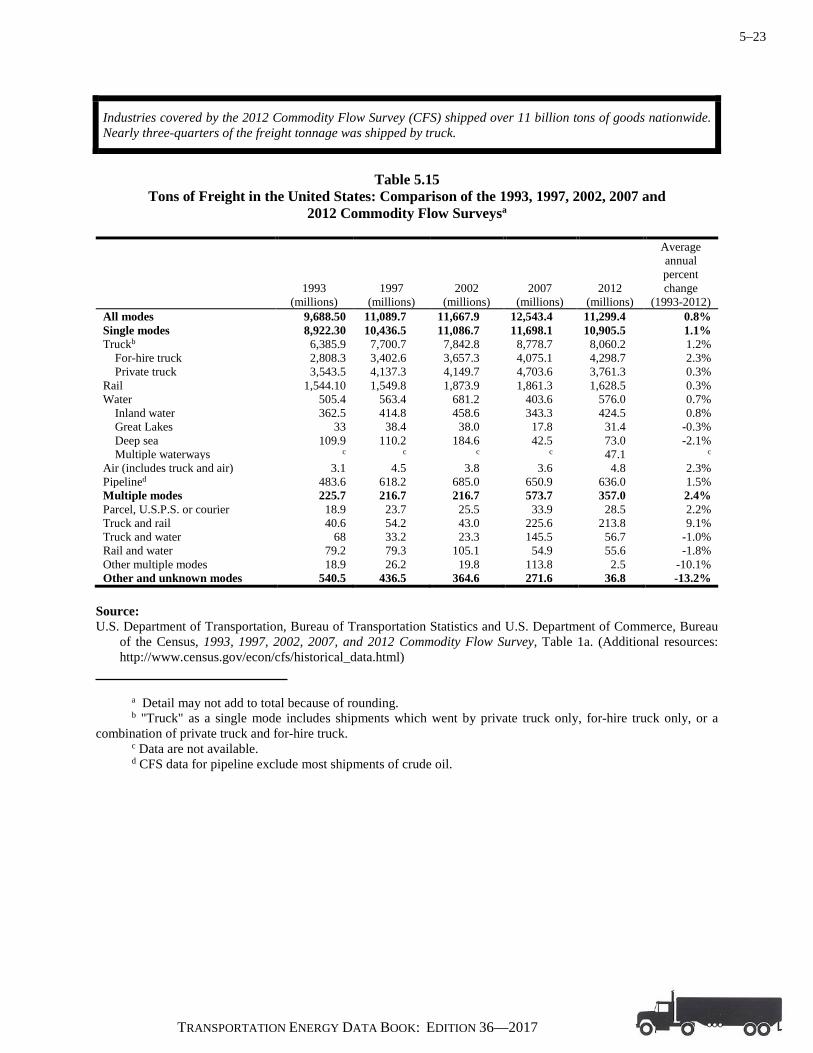
5–23
TRANSPORTATION ENERGY DATA BOOK: EDITION 36—2017
Industries covered by the 2012 Commodity Flow Survey (CFS) shipped over 11 billion tons of goods nationwide. Nearly three-quarters of the freight tonnage was shipped by truck.
Table 5.15
Tons of Freight in the United States: Comparison of the 1993, 1997, 2002, 2007 and 2012 Commodity Flow Surveysa
1993 (millions)
1997 (millions)
2002 (millions)
2007 (millions)
2012 (millions)
Average annual percent change
(1993-2012) All modes 9,688.50 11,089.7 11,667.9 12,543.4 11,299.4 0.8% Single modes 8,922.30 10,436.5 11,086.7 11,698.1 10,905.5 1.1% Truckb 6,385.9 7,700.7 7,842.8 8,778.7 8,060.2 1.2%
For-hire truck 2,808.3 3,402.6 3,657.3 4,075.1 4,298.7 2.3% Private truck 3,543.5 4,137.3 4,149.7 4,703.6 3,761.3 0.3%
Rail 1,544.10 1,549.8 1,873.9 1,861.3 1,628.5 0.3% Water 505.4 563.4 681.2 403.6 576.0 0.7%
Inland water 362.5 414.8 458.6 343.3 424.5 0.8% Great Lakes 33 38.4 38.0 17.8 31.4 -0.3% Deep sea 109.9 110.2 184.6 42.5 73.0 -2.1% Multiple waterways c c c c 47.1 c
Air (includes truck and air) 3.1 4.5 3.8 3.6 4.8 2.3% Pipelined 483.6 618.2 685.0 650.9 636.0 1.5% Multiple modes 225.7 216.7 216.7 573.7 357.0 2.4% Parcel, U.S.P.S. or courier 18.9 23.7 25.5 33.9 28.5 2.2% Truck and rail 40.6 54.2 43.0 225.6 213.8 9.1% Truck and water 68 33.2 23.3 145.5 56.7 -1.0% Rail and water 79.2 79.3 105.1 54.9 55.6 -1.8% Other multiple modes 18.9 26.2 19.8 113.8 2.5 -10.1% Other and unknown modes 540.5 436.5 364.6 271.6 36.8 -13.2%
Source: U.S. Department of Transportation, Bureau of Transportation Statistics and U.S. Department of Commerce, Bureau
of the Census, 1993, 1997, 2002, 2007, and 2012 Commodity Flow Survey, Table 1a. (Additional resources: http://www.census.gov/econ/cfs/historical_data.html)
a Detail may not add to total because of rounding. b "Truck" as a single mode includes shipments which went by private truck only, for-hire truck only, or a combination of private truck and for-hire truck. c Data are not available. d CFS data for pipeline exclude most shipments of crude oil.

5–24
TRANSPORTATION ENERGY DATA BOOK: EDITION 36—2017
Industries covered by the 2012 Commodity Flow Survey (CFS) accounted for 2.9 trillion ton-miles on the nation’s highways, railways, waterways, pipelines, and aviation system. Ton-miles increased an average of 1.1% per year from 1993 to 2012.
Table 5.16
Growth of Ton-Miles in the United States: Comparison of the 1993, 1997, 2002, 2007 and 2012 Commodity Flow Surveysa
1993 (billions)
1997 (billions)
2002 (billions)
2007 (billions)
2012 (billions)
Average annual percent change
(1993-2012) All modes 2,420.90 2,661.4 3,137.9 3,344.7 2,969.5 1.1% Single modes 2,136.90 2,383.5 2,867.9 2,894.3 2,697.4 1.2% Truckb 869.5 1,023.5 1,255.9 1,342.1 1,247.7 1.9%
For-hire truck 629 741.1 959.6 1,055.6 1,050.9 2.7% Private truck 235.9 268.6 291.1 286.5 196.8 -0.9%
Rail 942.6 1,022.5 1,261.6 1,344.0 1,211.5 1.3% Water 272 261.7 282.7 157.3 192.9 -1.8%
Inland water 164.4 189.3 211.5 117.5 118.7 -1.7% Great Lakes 12.4 13.4 13.8 6.9 11.0 -0.6% Deep sea 95.2 59.0 57.4 33.0 22.1 -7.4% Multiple waterways c c c c 41.0 c
Air (includes truck and air) 4 6.2 5.8 4.5 5.8 2.0% Pipelined c e e e e c
Multiple modes 191.5 204.5 225.7 416.6 271.8 1.9% Parcel, U.S.P.S. or courier 13.2 18.0 19.0 28.0 22.7 2.9% Truck and rail 37.7 55.6 45.5 196.8 169.5 8.2% Truck and water 40.6 34.8 32.4 98.4 48.6 1.0% Rail and water 70.2 77.6 115.0 47.1 29.2 -4.5% Other multiple modes c 18.6 13.8 46.4 1.9 c
Other and unknown modes 92.6 73.4 44.2 33.8 0.3 -26.0% Source: U.S. Department of Transportation, Bureau of Transportation Statistics and U.S. Department of Commerce, Bureau
of the Census, 1993, 1997, 2002, 2007 and 2012 Commodity Flow Surveys, Table 1a. (Additional resources: http://www.census.gov/econ/cfs/historical_data.html)
a Detail may not add to total because of rounding. b "Truck" as a single mode includes shipments which went by private truck only, for-hire truck only, or a combination of private truck and for-hire truck. c Data are not available. d CFS data for pipeline exclude most shipments of crude oil. e Denotes data do not meet publication standards because of high sampling variability or poor response quality.
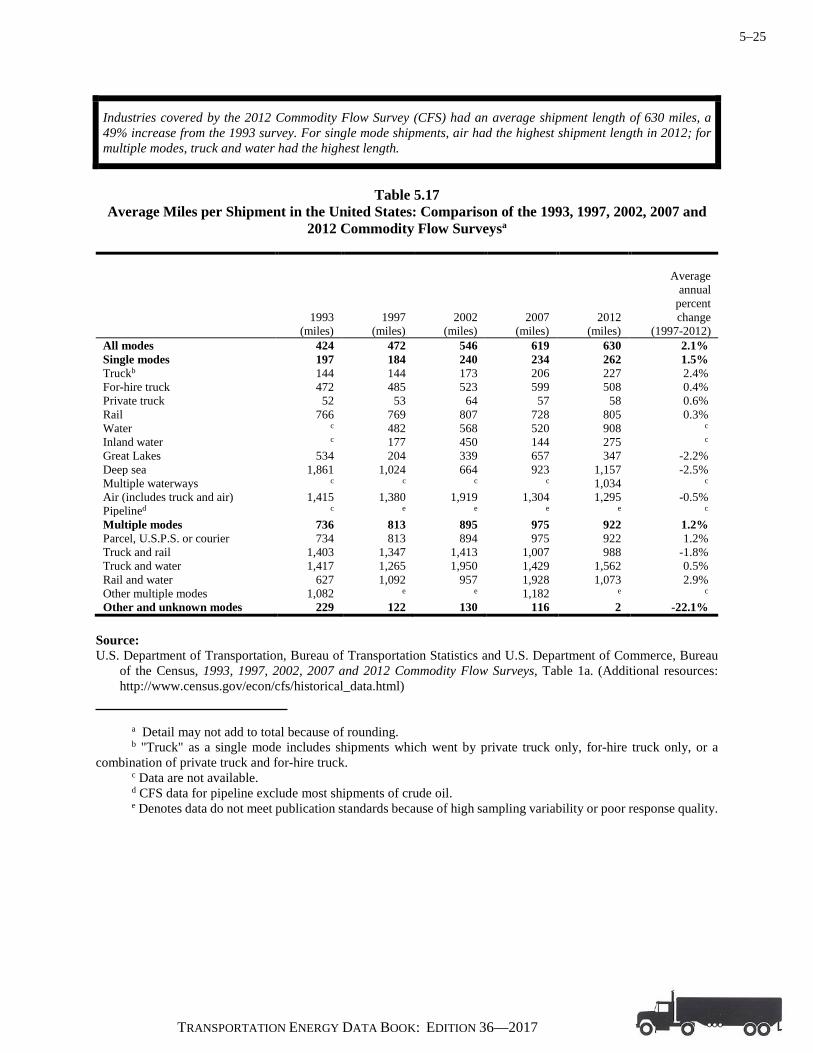
5–25
TRANSPORTATION ENERGY DATA BOOK: EDITION 36—2017
Industries covered by the 2012 Commodity Flow Survey (CFS) had an average shipment length of 630 miles, a 49% increase from the 1993 survey. For single mode shipments, air had the highest shipment length in 2012; for multiple modes, truck and water had the highest length.
Table 5.17
Average Miles per Shipment in the United States: Comparison of the 1993, 1997, 2002, 2007 and 2012 Commodity Flow Surveysa
1993 (miles)
1997 (miles)
2002 (miles)
2007 (miles)
2012 (miles)
Average annual
percent change
(1997-2012) All modes 424 472 546 619 630 2.1% Single modes 197 184 240 234 262 1.5% Truckb 144 144 173 206 227 2.4% For-hire truck 472 485 523 599 508 0.4% Private truck 52 53 64 57 58 0.6% Rail 766 769 807 728 805 0.3% Water c 482 568 520 908 c Inland water c 177 450 144 275 c Great Lakes 534 204 339 657 347 -2.2% Deep sea 1,861 1,024 664 923 1,157 -2.5% Multiple waterways c c c c 1,034 c Air (includes truck and air) 1,415 1,380 1,919 1,304 1,295 -0.5% Pipelined c e e e e c Multiple modes 736 813 895 975 922 1.2% Parcel, U.S.P.S. or courier 734 813 894 975 922 1.2% Truck and rail 1,403 1,347 1,413 1,007 988 -1.8% Truck and water 1,417 1,265 1,950 1,429 1,562 0.5% Rail and water 627 1,092 957 1,928 1,073 2.9% Other multiple modes 1,082 e e 1,182 e c Other and unknown modes 229 122 130 116 2 -22.1%
Source: U.S. Department of Transportation, Bureau of Transportation Statistics and U.S. Department of Commerce, Bureau
of the Census, 1993, 1997, 2002, 2007 and 2012 Commodity Flow Surveys, Table 1a. (Additional resources: http://www.census.gov/econ/cfs/historical_data.html)
a Detail may not add to total because of rounding. b "Truck" as a single mode includes shipments which went by private truck only, for-hire truck only, or a combination of private truck and for-hire truck. c Data are not available. d CFS data for pipeline exclude most shipments of crude oil. e Denotes data do not meet publication standards because of high sampling variability or poor response quality.

5–26
TRANSPORTATION ENERGY DATA BOOK: EDITION 36—2017
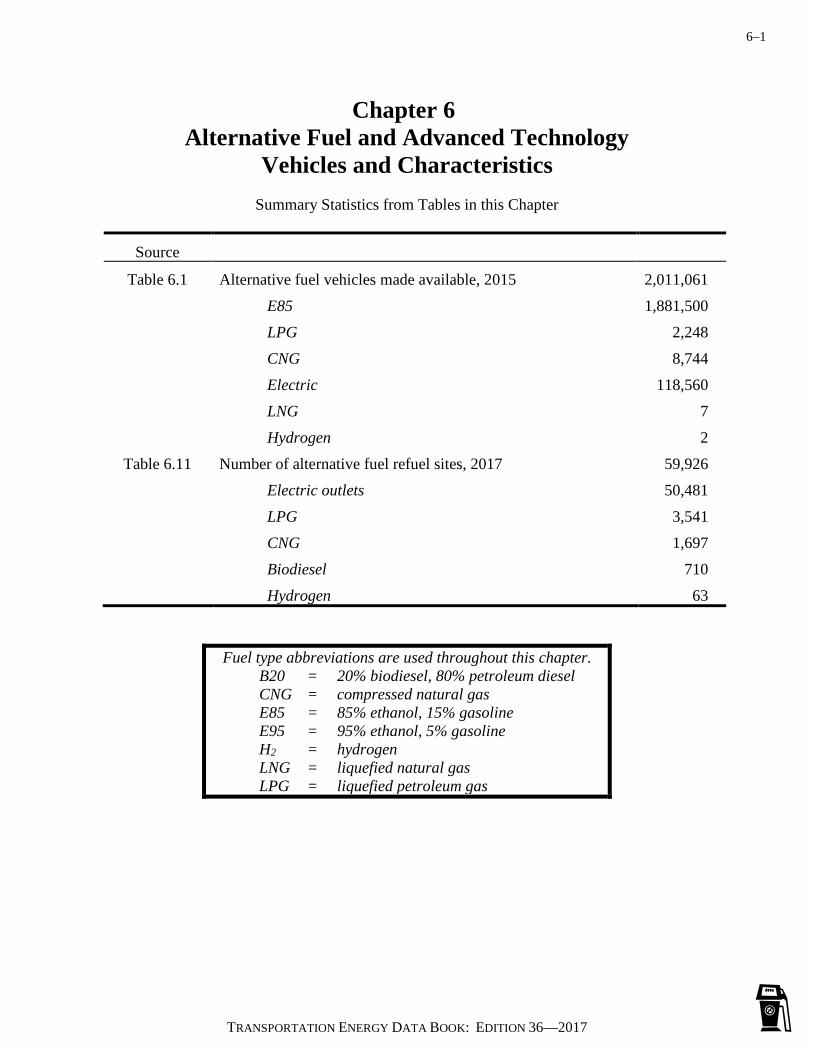
6–1
TRANSPORTATION ENERGY DATA BOOK: EDITION 36—2017
Chapter 6 Alternative Fuel and Advanced Technology
Vehicles and Characteristics
Summary Statistics from Tables in this Chapter
Source
Table 6.1 Alternative fuel vehicles made available, 2015 2,011,061 E85 1,881,500 LPG 2,248 CNG 8,744 Electric 118,560 LNG 7 Hydrogen 2
Table 6.11 Number of alternative fuel refuel sites, 2017 59,926 Electric outlets 50,481 LPG 3,541 CNG 1,697 Biodiesel 710 Hydrogen 63
Fuel type abbreviations are used throughout this chapter. B20 = 20% biodiesel, 80% petroleum diesel CNG = compressed natural gas E85 = 85% ethanol, 15% gasoline E95 = 95% ethanol, 5% gasoline H2 = hydrogen LNG = liquefied natural gas LPG = liquefied petroleum gas

6–2
TRANSPORTATION ENERGY DATA BOOK: EDITION 36—2017
Alternative Fuels The Energy Policy Act of 1992 defines alternative fuels and allows the U.S. Department of Energy (DOE) to add to the list of alternative fuels if the fuel is substantially nonpetroleum, yields substantial energy security benefits, and offers substantial environmental benefits. DOE currently recognizes the following as alternative fuels:
• methanol, ethanol, and other alcohols, • blends of 85% or more of alcohol with gasoline, • natural gas and liquid fuels domestically produced from natural gas, • liquefied petroleum gas (propane), • coal-derived liquid fuels, • hydrogen, • electricity, • biodiesel (B100), • fuels (other than alcohol) derived from biological materials, • P-series.
Alternative Fuels Data Center
DOE established the Alternative Fuels Data Center (AFDC) in 1991 to support its work aimed at fulfilling the Alternative Motor Fuels Act directives. Since then, the AFDC has expanded its focus to include all advanced transportation fuels, vehicles, and technologies. The AFDC is operated and managed by the National Renewable Energy Laboratory (NREL) in Golden, Colorado. The purposes of the AFDC are:
• to gather and analyze information on the fuel consumption, emissions, operation, and durability of alternative fuel vehicles, and
• to provide unbiased, accurate information on alternative fuels and alternative fuel
vehicles to government agencies, private industry, research institutions, and other interested organizations.
Much of the AFDC data can be obtained through their website: www.afdc.energy.gov. Several tables and graphs in this chapter contain statistics which were generated by the AFDC. Below are some links to specific areas of the AFDC website.
Alternative & Advanced Fuels – www.afdc.energy.gov
Alternative Fueling Station Locator – www.afdc.energy.gov/afdc/locator/stations
Alternative & Advanced Vehicles – www.afdc.energy.gov/fuels
State & Federal Incentives & Laws – www.afdc.energy.gov/afdc/laws
Data Analysis & Trends – www.afdc.energy.gov/data
Tools – www.afdc.energy.gov/tools

6–3
TRANSPORTATION ENERGY DATA BOOK: EDITION 36—2017
The Energy Information Administration (EIA) is no longer publishing estimates of the number of alternative vehicles in use in the United States. EIA does publish the number of alternative fuel vehicles “made available” each year, beginning in 2004. The alternative fuel vehicles “made available” are estimates from vehicle manufacturer production and companies performing vehicle conversions. The data are more of a proxy for alternative fuel vehicle sales than for vehicle population, but EIA cautions that the data are not actual sales data.
Table 6.1
Estimates of Alternative Fuel Highway Vehicles Made Available, 2004-2015
Year CNG Electricity E85 Hydrogen LNG LPG 2004 7,752 2,200 674,678 31 136 2,150 2005 3,304 2,281 743,948 74 68 700 2006 3,128 2,715 1,011,399 40 92 473 2007 2,487 3,152 1,115,069 63 26 356 2008 4,440 2,802 1,175,345 63 384 695 2009 3,770 2,255 805,777 26 126 861 2010 4,973 2,229 1,484,945 64 231 747 2011 5,674 25,382 2,116,273 107 137 1,054 2012 7,672 46,624 2,446,966 56 101 1,134 2013 9,454 130,323 2,665,470 10 344 2,700 2014 6,662 92,594 2,433,113 3 535 1,708 2015 8,744 118,560 1,881,500 2 7 2,248
Note: “Made available” refers to the supply of warrantied alternative fuel vehicles by manufacturers and aftermarket conversion companies. These do not represent sales. Source: U. S. Department of Energy, Energy Information Administration website, “Alternative Fuel Vehicle Data,”
www.eia.gov/renewable/afv, August 2017. (Additional resources: www.eia.gov)

6–4
TRANSPORTATION ENERGY DATA BOOK: EDITION 36—2017
The hybrid share of all light vehicles fell to 2.0% of all light vehicle sales in 2016. Plug-in vehicles certified for highway use began selling in 2010 and were 0.9% of the light vehicle market in 2016.
Table 6.2
Hybrid and Plug-In Vehicle Sales, 1999-2016
Calendar year
Hybrid vehicle sales
(thousands)
Plug-in vehicle salesa
(thousands)
All light vehicle sales (thousands)
Hybrid share of all light vehicles
Plug-in share of all light vehicles
1999 0.0 0.0 16,711 0.0% 0.0% 2000 9.4 0.0 17,164 0.1% 0.0% 2001 20.3 0.0 16,950 0.1% 0.0% 2002 36.0 0.0 16,675 0.2% 0.0% 2003 47.6 0.0 16,494 0.3% 0.0% 2004 84.2 0.0 16,737 0.5% 0.0% 2005 205.9 0.0 16,774 1.2% 0.0% 2006 251.9 0.0 16,336 1.5% 0.0% 2007 351.1 0.0 15,867 2.2% 0.0% 2008 315.8 0.0 13,015 2.4% 0.0% 2009 290.3 0.0 10,236 2.8% 0.0% 2010 274.6 0.3 11,394 2.4% 0.0% 2011 266.5 17.8 12,542 2.1% 0.1% 2012 434.6 53.2 14,220 3.1% 0.4% 2013 495.5 97.1 15,279 3.2% 0.6% 2014 452.2 118.9 16,192 2.8% 0.7% 2015 384.4 115.3 17,095 2.2% 0.7% 2016 346.9 159.6 17,169 2.0% 0.9%
Note: Plug-in vehicle sales include only those vehicles certified for highway use. Small electric carts and neighborhood electric vehicles are excluded. Sources: Hybrid and Electric Vehicle Sales – Compiled by the Transportation Research Center at Argonne National
Laboratory, 2017. (Additional resources: www.anl.gov/energy-systems/project/light-duty-electric-drive-vehicles-monthly-sales-updates)
All Light Vehicle Sales – Table 3.11. a Includes plug-in hybrid-electric vehicles and all-electric vehicles.
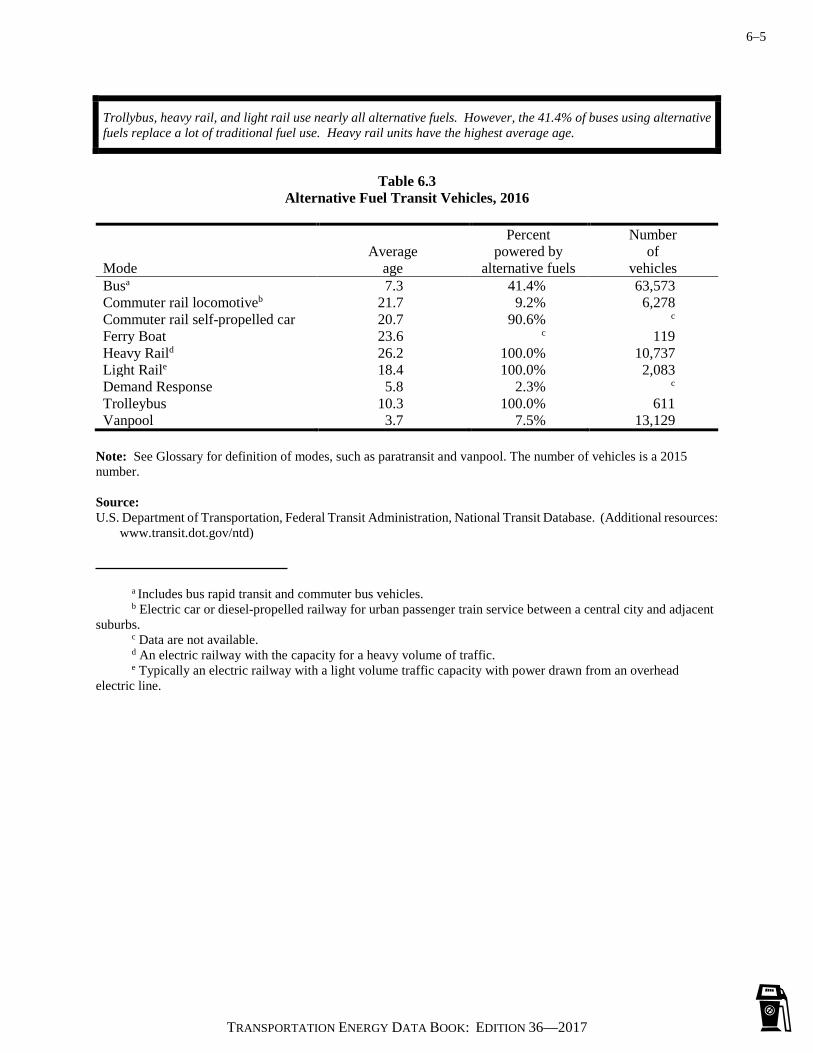
6–5
TRANSPORTATION ENERGY DATA BOOK: EDITION 36—2017
Trollybus, heavy rail, and light rail use nearly all alternative fuels. However, the 41.4% of buses using alternative fuels replace a lot of traditional fuel use. Heavy rail units have the highest average age.
Table 6.3
Alternative Fuel Transit Vehicles, 2016
Mode
Average
age
Percent powered by
alternative fuels
Number of
vehicles Busa 7.3 41.4% 63,573 Commuter rail locomotiveb 21.7 9.2% 6,278 Commuter rail self-propelled car 20.7 90.6% c Ferry Boat 23.6 c 119 Heavy Raild 26.2 100.0% 10,737 Light Raile 18.4 100.0% 2,083 Demand Response 5.8 2.3% c Trolleybus 10.3 100.0% 611 Vanpool 3.7 7.5% 13,129
Note: See Glossary for definition of modes, such as paratransit and vanpool. The number of vehicles is a 2015 number. Source: U.S. Department of Transportation, Federal Transit Administration, National Transit Database. (Additional resources:
www.transit.dot.gov/ntd) a Includes bus rapid transit and commuter bus vehicles. b Electric car or diesel-propelled railway for urban passenger train service between a central city and adjacent suburbs. c Data are not available. d An electric railway with the capacity for a heavy volume of traffic. e Typically an electric railway with a light volume traffic capacity with power drawn from an overhead electric line.

6–6
TRANSPORTATION ENERGY DATA BOOK: EDITION 36—2017
Table 6.4 E85 Flex-Fuel Vehicles Available by Manufacturer, Model Year 2017
Model Type Emission class
Audi A5 Cabriolet quattro Sedan/Wagon LEV II ULEV, Tier 3 Bin 125 Audi A5 quattro Sedan/Wagon LEV II ULEV Audi Q5 AWD SUV LEV II ULEV, Tier 2 Bin 5 Chevrolet Equinox AWD SUV TBD Chevrolet Equinox FWD SUV TBD Chevrolet Impala Sedan/Wagon TBD Chevrolet Silverado C15 2WD 4.3L Truck TBD Chevrolet Silverado C15 2WD 5.3L Truck TBD Chevrolet Silverado K15 4WD 4.3L Truck TBD Chevrolet Silverado K15 4WD 5.3L Truck TBD Chevrolet Suburban C1500 2WD SUV TBD Chevrolet Suburban K1500 4WD SUV TBD Chevrolet Tahoe C1500 2WD SUV TBD Chevrolet Tahoe K1500 4WD SUV TBD Chrysler 200 3.6L Sedan/Wagon TBD Chrysler 200 2.4L Sedan/Wagon TBD Chrysler 200 AWD Sedan/Wagon TBD Dodge Grand Caravan Van TBD Dodge Journey SUV TBD Ford Escape FWD FFV SUV TBD Ford Explorer 2WD FFV SUV TBD Ford Explorer AWD FFV SUV TBD Ford Transit Connect Van FFV Van TBD Ford Transit Connect Wagon FFV Sedan/Wagon TBD Ford Transit Connect Wagon LWB FFV Sedan/Wagon TBD Ford Transit T150 Wagon FFV Van TBD GMC Sierra C15 2WD Truck TBD GMC Sierra C15 2WD Truck TBD GMC Sierra K15 4WD Truck TBD GMC Sierra K15 4WD Truck TBD GMC Terrain FWD SUV TBD GMC Yukon C1500 2WD SUV TBD GMC Yukon C1500 XL 2WD SUV TBD GMC Yukon K1500 4WD SUV TBD GMC Yukon K1500 XL 4WD SUV TBD Jeep Cherokee 4WD SUV TBD Jeep Cherokee FWD SUV TBD Jeep Renegade 2WD SUV TBD Mercedes-Benz CLA250 4matic Sedan/Wagon TBD Mercedes-Benz GLA250 4matic SUV TBD Mercedes-Benz GLE350 4matic SUV TBD Ram 1500 2WD Truck TBD Ram 1500 4WD Truck TBD Toyota Tundra 2WD FFV Truck TBD Toyota Tundra 4WD FFV Truck TBD Note: LEV = low emission vehicle. ILEV = inherently low emission vehicle. ULEV = ultra low emission vehicle. ZEV = zero emission vehicle. TLEV = transitional low emission vehicle. SULEV = super ultra low emission vehicle. See Chapter 12 for details on emissions. TBD = to be determined. Source: U.S. Department of Energy, Alternative Fuels Data Center website, “Alternative Fuel and Advanced Vehicle Search,”
www.afdc.energy.gov/vehicles/search, August 2017. (Additional resources: www.afdc.energy.gov)
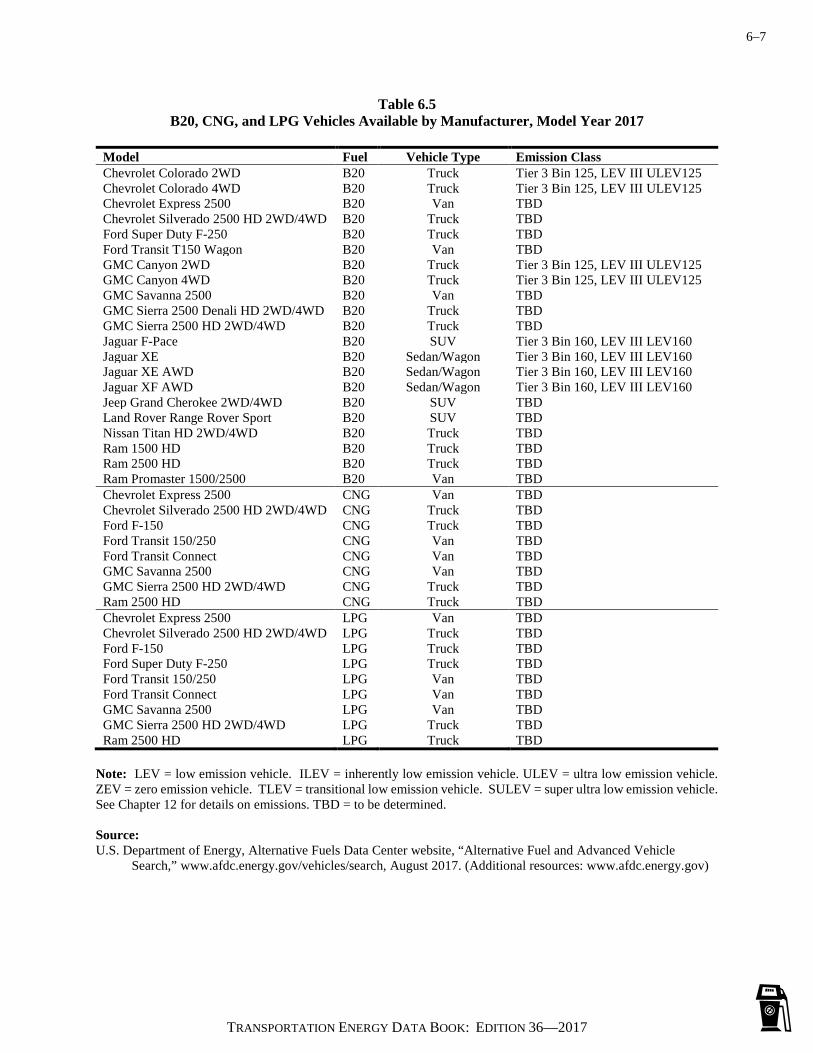
6–7
TRANSPORTATION ENERGY DATA BOOK: EDITION 36—2017
Table 6.5 B20, CNG, and LPG Vehicles Available by Manufacturer, Model Year 2017
Model Fuel Vehicle Type Emission Class Chevrolet Colorado 2WD B20 Truck Tier 3 Bin 125, LEV III ULEV125 Chevrolet Colorado 4WD B20 Truck Tier 3 Bin 125, LEV III ULEV125 Chevrolet Express 2500 B20 Van TBD Chevrolet Silverado 2500 HD 2WD/4WD B20 Truck TBD Ford Super Duty F-250 B20 Truck TBD Ford Transit T150 Wagon B20 Van TBD GMC Canyon 2WD B20 Truck Tier 3 Bin 125, LEV III ULEV125 GMC Canyon 4WD B20 Truck Tier 3 Bin 125, LEV III ULEV125 GMC Savanna 2500 B20 Van TBD GMC Sierra 2500 Denali HD 2WD/4WD B20 Truck TBD GMC Sierra 2500 HD 2WD/4WD B20 Truck TBD Jaguar F-Pace B20 SUV Tier 3 Bin 160, LEV III LEV160 Jaguar XE B20 Sedan/Wagon Tier 3 Bin 160, LEV III LEV160 Jaguar XE AWD B20 Sedan/Wagon Tier 3 Bin 160, LEV III LEV160 Jaguar XF AWD B20 Sedan/Wagon Tier 3 Bin 160, LEV III LEV160 Jeep Grand Cherokee 2WD/4WD B20 SUV TBD Land Rover Range Rover Sport B20 SUV TBD Nissan Titan HD 2WD/4WD B20 Truck TBD Ram 1500 HD B20 Truck TBD Ram 2500 HD B20 Truck TBD Ram Promaster 1500/2500 B20 Van TBD Chevrolet Express 2500 CNG Van TBD Chevrolet Silverado 2500 HD 2WD/4WD CNG Truck TBD Ford F-150 CNG Truck TBD Ford Transit 150/250 CNG Van TBD Ford Transit Connect CNG Van TBD GMC Savanna 2500 CNG Van TBD GMC Sierra 2500 HD 2WD/4WD CNG Truck TBD Ram 2500 HD CNG Truck TBD Chevrolet Express 2500 LPG Van TBD Chevrolet Silverado 2500 HD 2WD/4WD LPG Truck TBD Ford F-150 LPG Truck TBD Ford Super Duty F-250 LPG Truck TBD Ford Transit 150/250 LPG Van TBD Ford Transit Connect LPG Van TBD GMC Savanna 2500 LPG Van TBD GMC Sierra 2500 HD 2WD/4WD LPG Truck TBD Ram 2500 HD LPG Truck TBD
Note: LEV = low emission vehicle. ILEV = inherently low emission vehicle. ULEV = ultra low emission vehicle. ZEV = zero emission vehicle. TLEV = transitional low emission vehicle. SULEV = super ultra low emission vehicle. See Chapter 12 for details on emissions. TBD = to be determined. Source: U.S. Department of Energy, Alternative Fuels Data Center website, “Alternative Fuel and Advanced Vehicle
Search,” www.afdc.energy.gov/vehicles/search, August 2017. (Additional resources: www.afdc.energy.gov)

6–8
TRANSPORTATION ENERGY DATA BOOK: EDITION 36—2017
Table 6.6 Hybrid-Electric Vehicles Available by Manufacturer, Model Year 2017
Model Vehicle Type Emission Class
Acura MDX Hybrid SUV TBD Acura NSX Hybrid Two-Seater LEV III ULEV125, Tier 3 Bin 125 Acura RLX Hybrid Sedan/Wagon Tier 3 Bin 30, LEV-III SULEV30 BMW I8 Two-Seater Tier 3 Bin 125, LEV-II ULEV Chevrolet Malibu Hybrid Sedan/Wagon Tier 3 Transitional Bin 110 Chevrolet Silverado 15 Hybrid 2WD Truck LEV III ULEV125, Bin 5 Chevrolet Silverado 15 Hybrid 4WD Truck Bin 5, LEV III ULEV125 Ferrari LaFerrari Aperta Two-Seater Tier 3 Bin 125 Ford C-MAX Hybrid Sedan/Wagon TBD Ford Fusion Hybrid FWD Sedan/Wagon LEV-III SULEV30, Tier 3 Bin 30 GMC Sierra 15 Hybrid 2WD Truck LEV III ULEV125, Bin 5 GMC Sierra 15 Hybrid 4WD Truck LEV III ULEV125, Bin 5 Honda Accord Hybrid Sedan/Wagon LEV-III SULEV30/PZEV, Tier 3 Hyundai Ioniq Sedan/Wagon TBD Hyundai Ioniq Blue Sedan/Wagon TBD Hyundai Sonata Hybrid Sedan/Wagon LEV III ULEV125, Tier 3 Bin 125 Hyundai Sonata Hybrid SE Sedan/Wagon Tier 3 Bin 125, LEV III ULEV125 Infiniti Q50 Hybrid Sedan/Wagon Tier 3 Bin 125, LEV II ULEV Infiniti Q50 Hybrid AWD Sedan/Wagon Tier 3 Bin 125, LEV II ULEV Infiniti Q60 Hybrid AWD SUV LEV II ULEV, Tier 3 Bin 125 Infiniti Q60 Hybrid FWD SUV Tier 3 Bin 125, LEV II ULEV Infiniti Q70 Hybrid Sedan/Wagon Tier 3 Bin 125, LEV II ULEV Kia Niro Sedan/Wagon TBD Kia Niro FE Sedan/Wagon TBD Kia Niro Touring Sedan/Wagon TBD Kia Optima Hybrid Sedan/Wagon LEV III ULEV125, Tier 3 Bin 125 Lexus CT 200h Sedan/Wagon Tier 3 Bin 30, LEV-III SULEV30 Lexus ES 300h Sedan/Wagon TBD Lexus GS 450h Sedan/Wagon TBD Lexus NX 300h SUV Tier 3 Bin 30, LEV-III SULEV30 Lexus RX 450h SUV TBD Lincoln MKZ Hybrid FWD Sedan/Wagon TBD Nissan Rogue AWD Hybrid SUV TBD Nissan Rogue FWD Hybrid SUV TBD Nissan Rogue SV FWD Hybrid SUV TBD Toyota Avalon Hybrid Sedan/Wagon Tier 3 Bin 30, LEV-III Toyota Camry Hyrid LE Sedan/Wagon TBD Toyota Camry Hyrid XLE/SE Sedan/Wagon TBD Toyota Highlander Hybrid 4WD SUV TBD Toyota Highlander Hybrid 4WD LE Plus SUV TBD Toyota Prius Sedan/Wagon TBD Toyota Prius c Sedan/Wagon TBD Toyota Prius Eco Sedan/Wagon TBD Toyota Prius v Sedan/Wagon TBD Toyota RAV4 Hybrid AWD SUV TBD
Note: LEV = low emission vehicle. ILEV = inherently low emission vehicle. ULEV = ultra-low emission vehicle. ZEV = zero emission vehicle. TLEV = transitional low emission vehicle. Does not include plug-in hybrid electric vehicles. See Chapter 12 for details on emissions. Source: U.S. Department of Energy, Alternative Fuels Data Center website, “Alternative Fuel and Advanced Vehicle Search,”
www.afdc.energy.gov/vehicles/search, August 2017. (Additional resources: www.afdc.energy.gov)

6–9
TRANSPORTATION ENERGY DATA BOOK: EDITION 36—2017
Table 6.7 Electric-Drive Vehicles Available by Manufacturer, Model Year 2017
Model Drive Type Vehicle Type Emission Class BMW i3 BEV EV Sedan/Wagon TBD BMW i3 BEV EV Sedan/Wagon TBD BYD Motors e6 EV Sedan/Wagon TBD Chevrolet Bolt EV Sedan/Wagon ZEV, Tier III Bin 0 Fiat 500e EV Sedan/Wagon ZEV, Tier III Bin 0 Ford Focus Electric EV Sedan/Wagon TBD Honda Clarity EV Sedan/Wagon TBD Hyundai Ioniq EV Sedan/Wagon TBD Kia Soul EV Sedan/Wagon ZEV, Tier III Bin 0 Mercedes-Benz B250e EV Sedan/Wagon ZEV, Tier III Bin 0 Mitsubishi i-MiEV EV Sedan/Wagon ZEV, Tier III Bin 0 Nissan Leaf EV Sedan/Wagon ZEV, Tier III Bin 0 Smart ForTwo EV Two-Seater TBD Tesla Model S AWD - 60D EV Sedan/Wagon TBD Tesla Model S AWD - 75D EV Sedan/Wagon TBD Tesla Model S AWD - P100D EV Sedan/Wagon TBD Tesla Model S AWD - P90D EV Sedan/Wagon TBD Tesla Model S RWD 60 kWh EV Sedan/Wagon TBD Tesla Model S RWD 75 kWh EV Sedan/Wagon TBD Tesla Model X AWD - 60D EV SUV TBD Tesla Model X AWD - 75D EV SUV TBD Tesla Model X AWD - 90D EV SUV TBD Tesla Model X AWD - P100D EV SUV TBD Tesla Model X AWD - P90D EV SUV TBD Volkswagen e-Golf EV Sedan/Wagon TBD Audi A3 e-tron PHEV Sedan/Wagon LEV-III SULEV30/PZEV, Tier 3 BMW 330e PHEV Sedan/Wagon Tier 3 Bin 125, LEV III ULEV125 BMW 740e xDrive PHEV Sedan/Wagon Tier 3 Bin 125, LEV III ULEV125 BMW I3 REX PHEV Sedan/Wagon TBD BMW X5 xDrive40e PHEV SUV LEV-II ULEV, Tier 2 Bin 5 Cadillac CT6 PHEV PHEV Sedan/Wagon TBD Chevrolet Volt PHEV Sedan/Wagon Tier 3 Bin 125, LEV-III SULEV30 Chrysler Pacifica PHEV PHEV Sedan/Wagon TBD Ford C-Max Energi PHEV Sedan/Wagon TBD Ford Fusion Energi Plug in Hybrid PHEV Sedan/Wagon Tier 3 Bin 30, LEV-III SULEV30 Hyundai Ioniq PHEV Sedan/Wagon TBD Hyundai Sonata Plug-in Hybrid PHEV Sedan/Wagon LEV-III SULEV30/PZEV, Tier 3 Kia Optima Plug-In Hybrid PHEV Sedan/Wagon Tier 3 Bin 125, LEV III ULEV125 Mercedes-Benz C350e PHEV Sedan/Wagon TBD Mercedes-Benz GLE550e PHEV SUV TBD Mercedes-Benz S550e PHEV Sedan/Wagon TBD Porsche 918 Spyder PHEV Two-Seater TBD Porsche Cayenne S e-Hybrid PHEV SUV LEV-II ULEV, Bin 5 Porsche Panamera 4 e-Hybrid PHEV Sedan/Wagon TBD Toyota Prius Prime PHEV Sedan/Wagon TBD Volvo XC90 T8 Plug-in Hybrid PHEV SUV LEV-III SULEV30/PZEV, Tier 3 Bin 30 Honda Clarity Fuel Cell FCEV Sedan/Wagon TBD Hyundai Tucson FCEV SUV Tier III Bin 0, ZEV Toyota Mirai FCEV Sedan/Wagon ZEV, Tier III Bin 0
Note: EV = electric vehicle; PHEV = plug-in hybrid-electric vehicle; FCEV = hydrogen fuel cell vehicle; LEV = low emission vehicle; ILEV = inherently low emission vehicle; ULEV = ultra-low emission vehicle; ZEV = zero emission vehicle; TLEV = transitional low emission vehicle; SULEV = super ultra-low emission vehicle; AT-PZEV = advanced technology - partial zero emissions vehicle. See Chapter 12 for details on emissions. Source: U.S. Department of Energy, Alternative Fuels Data Center website, “Alternative Fuel and Advanced Vehicle Search,”
www.afdc.energy.gov/vehicles/search, August 2017. (Additional resources: www.afdc.energy.gov)
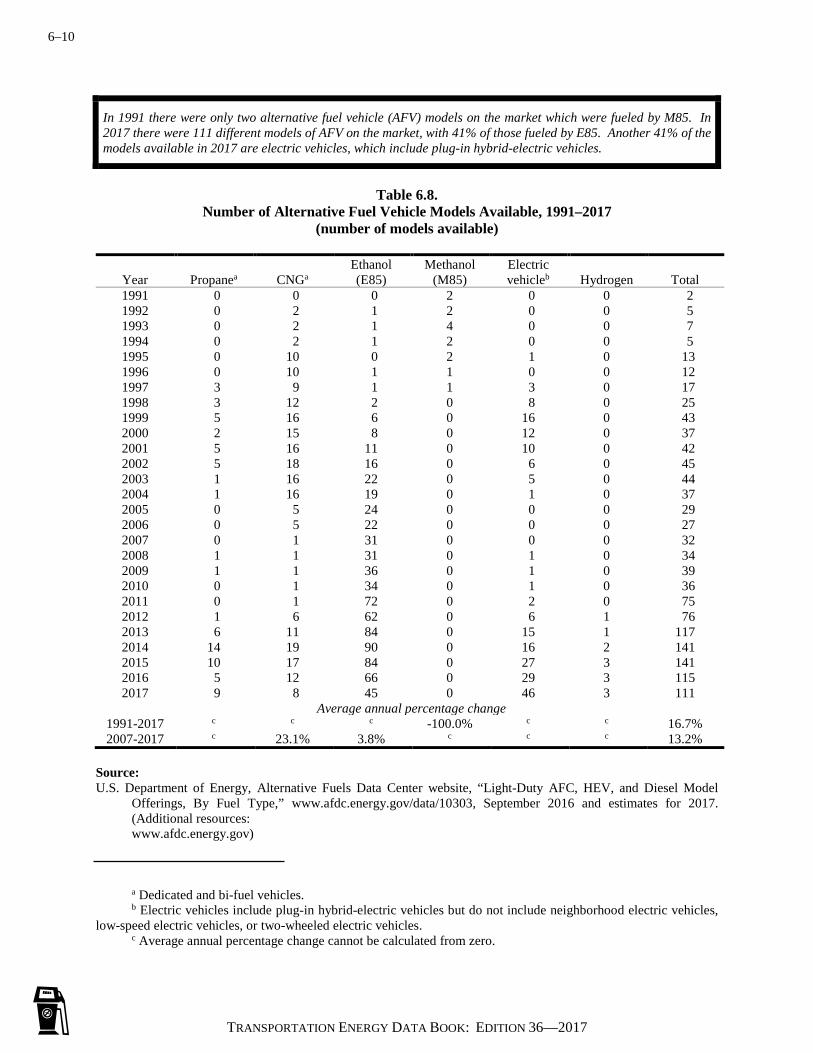
6–10
TRANSPORTATION ENERGY DATA BOOK: EDITION 36—2017
In 1991 there were only two alternative fuel vehicle (AFV) models on the market which were fueled by M85. In 2017 there were 111 different models of AFV on the market, with 41% of those fueled by E85. Another 41% of the models available in 2017 are electric vehicles, which include plug-in hybrid-electric vehicles.
Table 6.8.
Number of Alternative Fuel Vehicle Models Available, 1991–2017 (number of models available)
Year Propanea CNGa Ethanol (E85)
Methanol (M85)
Electric vehicleb Hydrogen Total
1991 0 0 0 2 0 0 2 1992 0 2 1 2 0 0 5 1993 0 2 1 4 0 0 7 1994 0 2 1 2 0 0 5 1995 0 10 0 2 1 0 13 1996 0 10 1 1 0 0 12 1997 3 9 1 1 3 0 17 1998 3 12 2 0 8 0 25 1999 5 16 6 0 16 0 43 2000 2 15 8 0 12 0 37 2001 5 16 11 0 10 0 42 2002 5 18 16 0 6 0 45 2003 1 16 22 0 5 0 44 2004 1 16 19 0 1 0 37 2005 0 5 24 0 0 0 29 2006 0 5 22 0 0 0 27 2007 0 1 31 0 0 0 32 2008 1 1 31 0 1 0 34 2009 1 1 36 0 1 0 39 2010 0 1 34 0 1 0 36 2011 0 1 72 0 2 0 75 2012 1 6 62 0 6 1 76 2013 6 11 84 0 15 1 117 2014 14 19 90 0 16 2 141 2015 10 17 84 0 27 3 141 2016 5 12 66 0 29 3 115 2017 9 8 45 0 46 3 111
Average annual percentage change 1991-2017 c c c -100.0% c c 16.7% 2007-2017 c 23.1% 3.8% c c c 13.2%
Source: U.S. Department of Energy, Alternative Fuels Data Center website, “Light-Duty AFC, HEV, and Diesel Model
Offerings, By Fuel Type,” www.afdc.energy.gov/data/10303, September 2016 and estimates for 2017. (Additional resources:
www.afdc.energy.gov)
a Dedicated and bi-fuel vehicles. b Electric vehicles include plug-in hybrid-electric vehicles but do not include neighborhood electric vehicles, low-speed electric vehicles, or two-wheeled electric vehicles. c Average annual percentage change cannot be calculated from zero.

6–11
TRANSPORTATION ENERGY DATA BOOK: EDITION 36—2017
Table 6.9 Hybrid-Electric Medium/Heavy Trucks and Buses Available by Manufacturer, 2017
Manufacturer - Model Drive type Truck type Daimler Buses North America Orion VII Hybrid Low-Floor Hybrid Electric Transit Bus DesignLine Corp. EcoSaver IV Hybrid Electric Transit Bus Foton America FCB 30-foot; FCB 35-foot; FCB 40-foot Hybrid Electric Transit Bus Glaval Bus Universal Hybrid Electric Shuttle Bus International DuraStar Hybrid Hybrid Electric Vocational/Cab Chassis Navistar HC300 Hybrid Hybrid Electric School Bus North American Bus Industries 31LFW / 35LFW / 40LFW Hybrid Electric Transit Bus North American Bus Industries CompoBus Hybrid Electric Transit Bus North American Bus Industries 42BRT Hybrid Electric Transit Bus North American Bus Industries 60BRT Hybrid Electric Transit Bus Turtle Top Odyssey XLT Hybrid Electric Shuttle Bus XL Hybrid - Chevrolet Express 2500/3500 HD Hybrid Electric Van XL Hybrid - Ford Transit Hybrid Electric Van XL Hybrid - General Motors Savana 2500/3500 HD Hybrid Electric Van XL Hybrid - Isuzu Reach Hybrid Electric Van XL Hybrid - Ford E 350/450 Hybrid Electric Vocational/Cab Chassis XL Hybrid - Ford F-59 Super Duty Hybrid Electric Vocational/Cab Chassis XL Hybrid - General Motors 3500/4500 HD Hybrid Electric Vocational/Cab Chassis Autocar E3-Hybrid Drive Hybrid - Diesel Refuse ElDorado National E-Z Rider II Hybrid - Diesel Transit Bus ENC E-Z RIDER II Hybrid - Diesel Transit Bus Gillig Corp. Trolley Hybrid - Diesel Transit Bus Gillig Corp. Standard, BRT, BRTPlus, Commuter Hybrid - Diesel Transit Bus Hino 195h Hybrid COE, 195h-DC Hybrid COE Hybrid - Diesel Vocational/Cab Chassis Motor Coach Industries D4500 CT Hybrid Commuter Coach Hybrid - Diesel Transit Bus New Flyer Xcelsior Hybrid - Diesel Transit Bus Nova Bus LFS Artic HEV Hybrid - Diesel Transit Bus Nova Bus LFS HEV Hybrid - Diesel Transit Bus DesignLine Corp. EcoSaver IV Hybrid - CNG Transit Bus
Source: U.S. Department of Energy, Alternative Fuels Data Center website, www.afdc.energy.gov/vehicles/search, August
2017. (Additional resources: www.afdc.energy.gov)
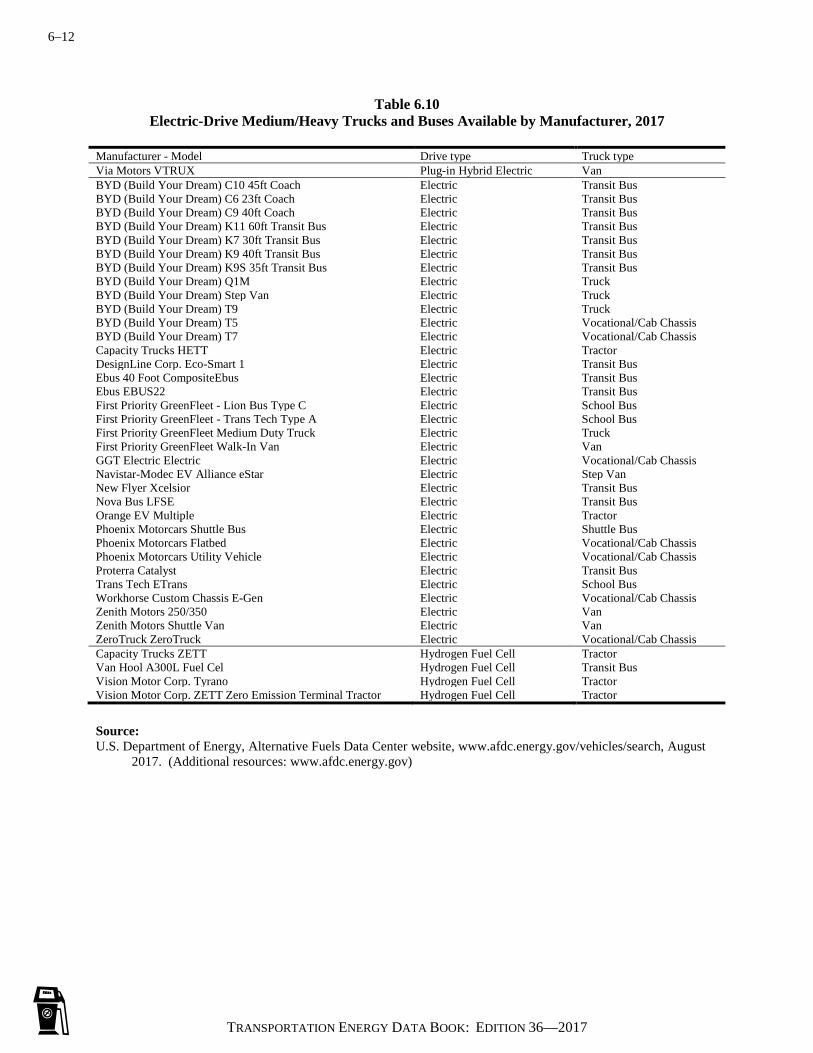
6–12
TRANSPORTATION ENERGY DATA BOOK: EDITION 36—2017
Table 6.10 Electric-Drive Medium/Heavy Trucks and Buses Available by Manufacturer, 2017
Manufacturer - Model Drive type Truck type Via Motors VTRUX Plug-in Hybrid Electric Van BYD (Build Your Dream) C10 45ft Coach Electric Transit Bus BYD (Build Your Dream) C6 23ft Coach Electric Transit Bus BYD (Build Your Dream) C9 40ft Coach Electric Transit Bus BYD (Build Your Dream) K11 60ft Transit Bus Electric Transit Bus BYD (Build Your Dream) K7 30ft Transit Bus Electric Transit Bus BYD (Build Your Dream) K9 40ft Transit Bus Electric Transit Bus BYD (Build Your Dream) K9S 35ft Transit Bus Electric Transit Bus BYD (Build Your Dream) Q1M Electric Truck BYD (Build Your Dream) Step Van Electric Truck BYD (Build Your Dream) T9 Electric Truck BYD (Build Your Dream) T5 Electric Vocational/Cab Chassis BYD (Build Your Dream) T7 Electric Vocational/Cab Chassis Capacity Trucks HETT Electric Tractor DesignLine Corp. Eco-Smart 1 Electric Transit Bus Ebus 40 Foot CompositeEbus Electric Transit Bus Ebus EBUS22 Electric Transit Bus First Priority GreenFleet - Lion Bus Type C Electric School Bus First Priority GreenFleet - Trans Tech Type A Electric School Bus First Priority GreenFleet Medium Duty Truck Electric Truck First Priority GreenFleet Walk-In Van Electric Van GGT Electric Electric Electric Vocational/Cab Chassis Navistar-Modec EV Alliance eStar Electric Step Van New Flyer Xcelsior Electric Transit Bus Nova Bus LFSE Electric Transit Bus Orange EV Multiple Electric Tractor Phoenix Motorcars Shuttle Bus Electric Shuttle Bus Phoenix Motorcars Flatbed Electric Vocational/Cab Chassis Phoenix Motorcars Utility Vehicle Electric Vocational/Cab Chassis Proterra Catalyst Electric Transit Bus Trans Tech ETrans Electric School Bus Workhorse Custom Chassis E-Gen Electric Vocational/Cab Chassis Zenith Motors 250/350 Electric Van Zenith Motors Shuttle Van Electric Van ZeroTruck ZeroTruck Electric Vocational/Cab Chassis Capacity Trucks ZETT Hydrogen Fuel Cell Tractor Van Hool A300L Fuel Cel Hydrogen Fuel Cell Transit Bus Vision Motor Corp. Tyrano Hydrogen Fuel Cell Tractor Vision Motor Corp. ZETT Zero Emission Terminal Tractor Hydrogen Fuel Cell Tractor
Source: U.S. Department of Energy, Alternative Fuels Data Center website, www.afdc.energy.gov/vehicles/search, August
2017. (Additional resources: www.afdc.energy.gov)
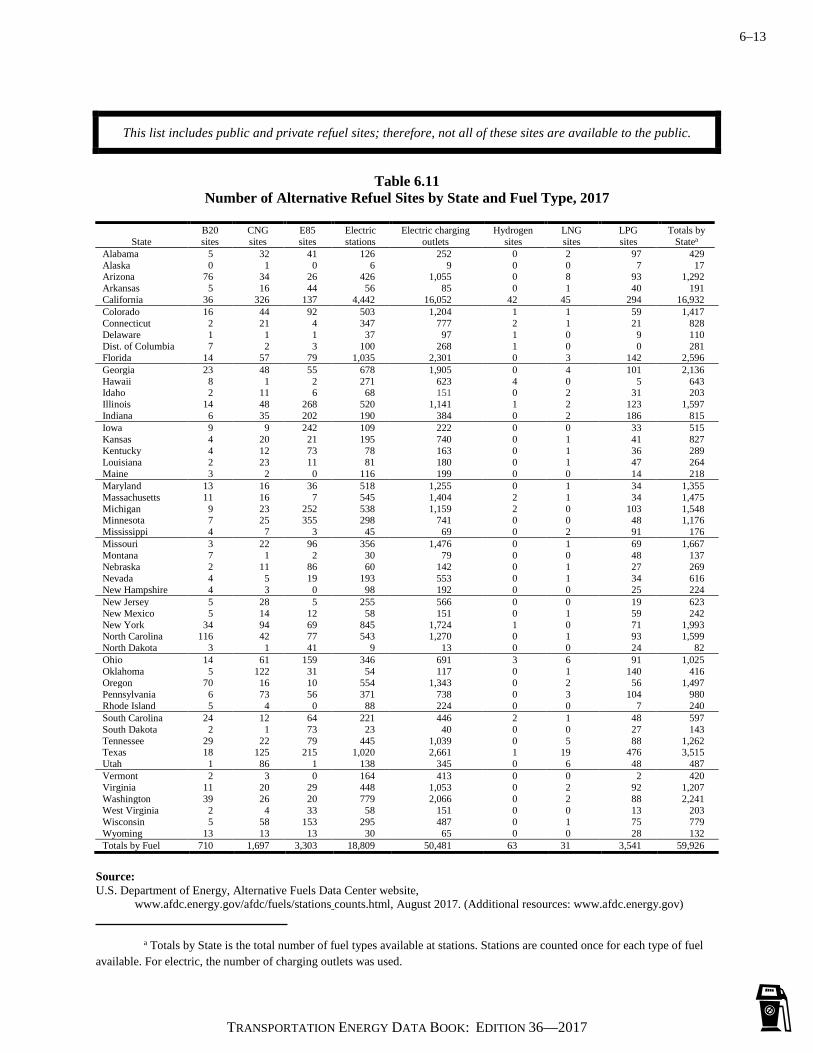
6–13
TRANSPORTATION ENERGY DATA BOOK: EDITION 36—2017
This list includes public and private refuel sites; therefore, not all of these sites are available to the public.
Table 6.11
Number of Alternative Refuel Sites by State and Fuel Type, 2017
State B20 sites
CNG sites
E85 sites
Electric stations
Electric charging outlets
Hydrogen sites
LNG sites
LPG sites
Totals by Statea
Alabama 5 32 41 126 252 0 2 97 429 Alaska 0 1 0 6 9 0 0 7 17 Arizona 76 34 26 426 1,055 0 8 93 1,292 Arkansas 5 16 44 56 85 0 1 40 191 California 36 326 137 4,442 16,052 42 45 294 16,932 Colorado 16 44 92 503 1,204 1 1 59 1,417 Connecticut 2 21 4 347 777 2 1 21 828 Delaware 1 1 1 37 97 1 0 9 110 Dist. of Columbia 7 2 3 100 268 1 0 0 281 Florida 14 57 79 1,035 2,301 0 3 142 2,596 Georgia 23 48 55 678 1,905 0 4 101 2,136 Hawaii 8 1 2 271 623 4 0 5 643 Idaho 2 11 6 68 151 0 2 31 203 Illinois 14 48 268 520 1,141 1 2 123 1,597 Indiana 6 35 202 190 384 0 2 186 815 Iowa 9 9 242 109 222 0 0 33 515 Kansas 4 20 21 195 740 0 1 41 827 Kentucky 4 12 73 78 163 0 1 36 289 Louisiana 2 23 11 81 180 0 1 47 264 Maine 3 2 0 116 199 0 0 14 218 Maryland 13 16 36 518 1,255 0 1 34 1,355 Massachusetts 11 16 7 545 1,404 2 1 34 1,475 Michigan 9 23 252 538 1,159 2 0 103 1,548 Minnesota 7 25 355 298 741 0 0 48 1,176 Mississippi 4 7 3 45 69 0 2 91 176 Missouri 3 22 96 356 1,476 0 1 69 1,667 Montana 7 1 2 30 79 0 0 48 137 Nebraska 2 11 86 60 142 0 1 27 269 Nevada 4 5 19 193 553 0 1 34 616 New Hampshire 4 3 0 98 192 0 0 25 224 New Jersey 5 28 5 255 566 0 0 19 623 New Mexico 5 14 12 58 151 0 1 59 242 New York 34 94 69 845 1,724 1 0 71 1,993 North Carolina 116 42 77 543 1,270 0 1 93 1,599 North Dakota 3 1 41 9 13 0 0 24 82 Ohio 14 61 159 346 691 3 6 91 1,025 Oklahoma 5 122 31 54 117 0 1 140 416 Oregon 70 16 10 554 1,343 0 2 56 1,497 Pennsylvania 6 73 56 371 738 0 3 104 980 Rhode Island 5 4 0 88 224 0 0 7 240 South Carolina 24 12 64 221 446 2 1 48 597 South Dakota 2 1 73 23 40 0 0 27 143 Tennessee 29 22 79 445 1,039 0 5 88 1,262 Texas 18 125 215 1,020 2,661 1 19 476 3,515 Utah 1 86 1 138 345 0 6 48 487 Vermont 2 3 0 164 413 0 0 2 420 Virginia 11 20 29 448 1,053 0 2 92 1,207 Washington 39 26 20 779 2,066 0 2 88 2,241 West Virginia 2 4 33 58 151 0 0 13 203 Wisconsin 5 58 153 295 487 0 1 75 779 Wyoming 13 13 13 30 65 0 0 28 132 Totals by Fuel 710 1,697 3,303 18,809 50,481 63 31 3,541 59,926
Source: U.S. Department of Energy, Alternative Fuels Data Center website, www.afdc.energy.gov/afdc/fuels/stations counts.html, August 2017. (Additional resources: www.afdc.energy.gov) a Totals by State is the total number of fuel types available at stations. Stations are counted once for each type of fuel available. For electric, the number of charging outlets was used.
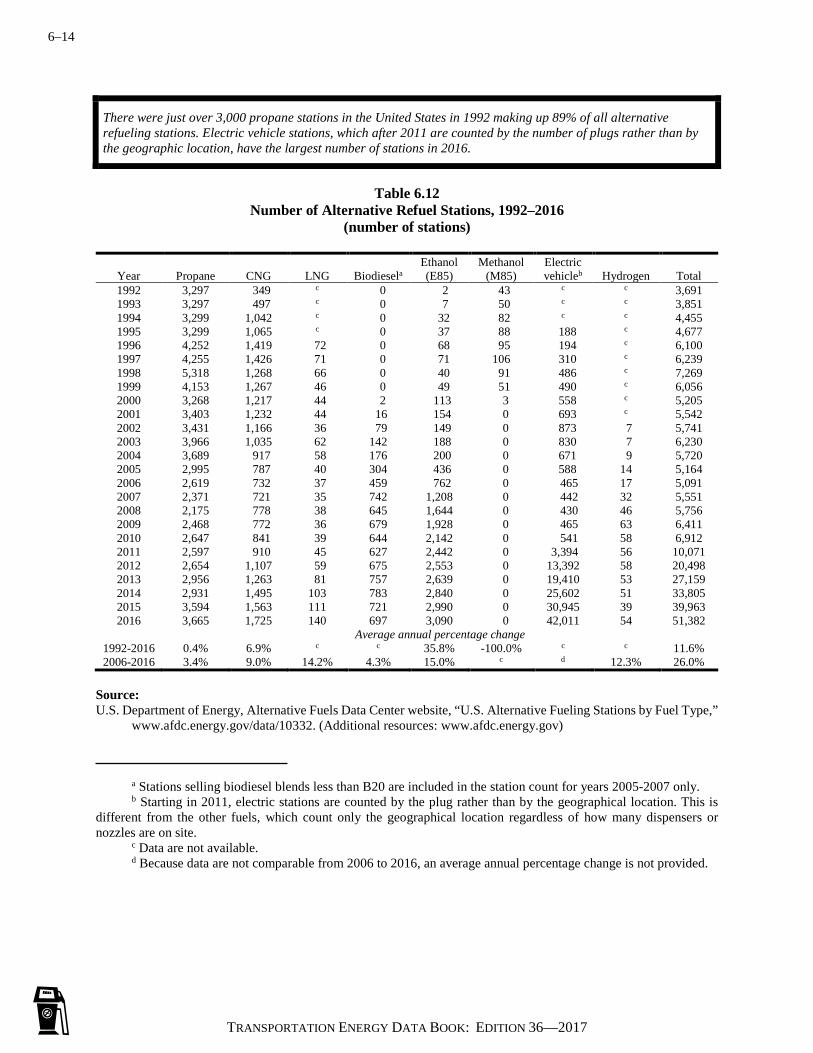
6–14
TRANSPORTATION ENERGY DATA BOOK: EDITION 36—2017
There were just over 3,000 propane stations in the United States in 1992 making up 89% of all alternative refueling stations. Electric vehicle stations, which after 2011 are counted by the number of plugs rather than by the geographic location, have the largest number of stations in 2016.
Table 6.12
Number of Alternative Refuel Stations, 1992–2016 (number of stations)
Year Propane CNG LNG Biodiesela Ethanol (E85)
Methanol (M85)
Electric vehicleb Hydrogen Total
1992 3,297 349 c 0 2 43 c c 3,691 1993 3,297 497 c 0 7 50 c c 3,851 1994 3,299 1,042 c 0 32 82 c c 4,455 1995 3,299 1,065 c 0 37 88 188 c 4,677 1996 4,252 1,419 72 0 68 95 194 c 6,100 1997 4,255 1,426 71 0 71 106 310 c 6,239 1998 5,318 1,268 66 0 40 91 486 c 7,269 1999 4,153 1,267 46 0 49 51 490 c 6,056 2000 3,268 1,217 44 2 113 3 558 c 5,205 2001 3,403 1,232 44 16 154 0 693 c 5,542 2002 3,431 1,166 36 79 149 0 873 7 5,741 2003 3,966 1,035 62 142 188 0 830 7 6,230 2004 3,689 917 58 176 200 0 671 9 5,720 2005 2,995 787 40 304 436 0 588 14 5,164 2006 2,619 732 37 459 762 0 465 17 5,091 2007 2,371 721 35 742 1,208 0 442 32 5,551 2008 2,175 778 38 645 1,644 0 430 46 5,756 2009 2,468 772 36 679 1,928 0 465 63 6,411 2010 2,647 841 39 644 2,142 0 541 58 6,912 2011 2,597 910 45 627 2,442 0 3,394 56 10,071 2012 2,654 1,107 59 675 2,553 0 13,392 58 20,498 2013 2,956 1,263 81 757 2,639 0 19,410 53 27,159 2014 2,931 1,495 103 783 2,840 0 25,602 51 33,805 2015 3,594 1,563 111 721 2,990 0 30,945 39 39,963 2016 3,665 1,725 140 697 3,090 0 42,011 54 51,382
Average annual percentage change 1992-2016 0.4% 6.9% c c 35.8% -100.0% c c 11.6% 2006-2016 3.4% 9.0% 14.2% 4.3% 15.0% c d 12.3% 26.0%
Source: U.S. Department of Energy, Alternative Fuels Data Center website, “U.S. Alternative Fueling Stations by Fuel Type,”
www.afdc.energy.gov/data/10332. (Additional resources: www.afdc.energy.gov) a Stations selling biodiesel blends less than B20 are included in the station count for years 2005-2007 only. b Starting in 2011, electric stations are counted by the plug rather than by the geographical location. This is different from the other fuels, which count only the geographical location regardless of how many dispensers or nozzles are on site. c Data are not available. d Because data are not comparable from 2006 to 2016, an average annual percentage change is not provided.

6–15
TRANSPORTATION ENERGY DATA BOOK: EDITION 36—2017
Clean Cities is a locally-based government/industry partnership, coordinated by the U.S. Department of Energy to expand the use of alternatives to gasoline and diesel fuel. By combining the decision-making with voluntary action by partners, the "grass-roots" approach of Clean Cities departs from traditional "top-down" Federal programs.
Figure 6.1. Clean Cities Coalitions
Source: U.S. Department of Energy, Clean Cities website, “Clean Cities Coalition Locations,”
cleancities.energy.gov/coalitions/locations, August 2017. (Additional resources: cleancities.energy.gov)
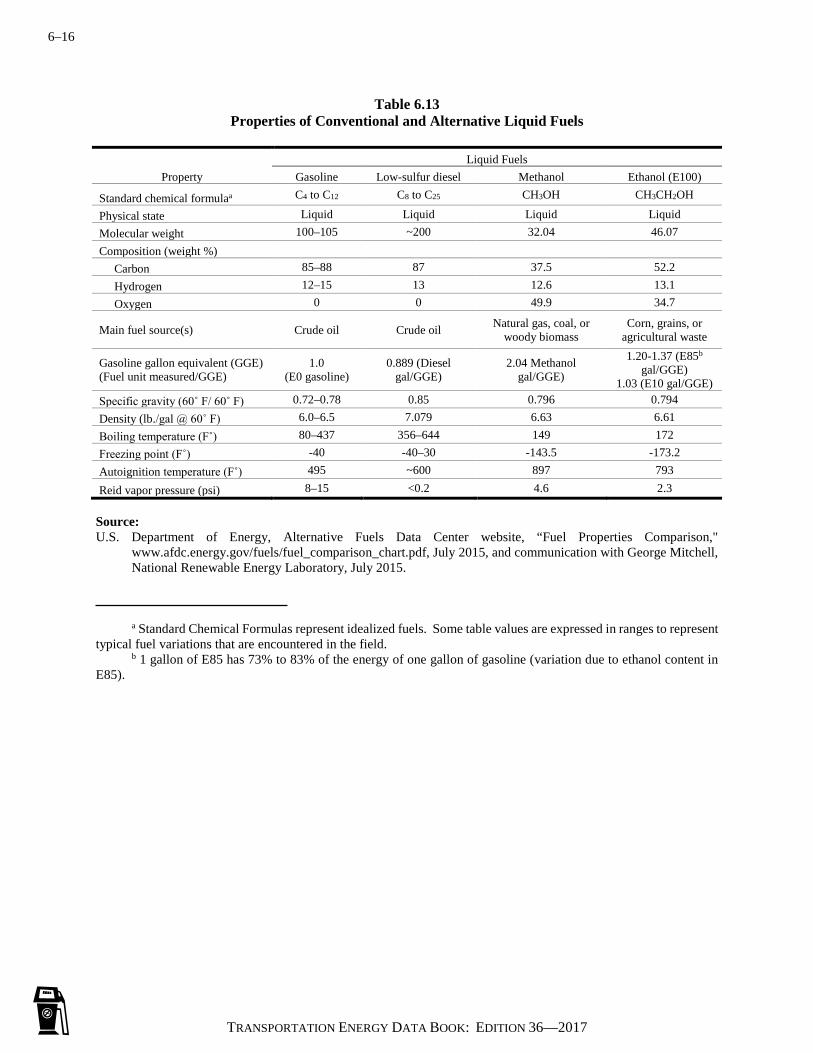
6–16
TRANSPORTATION ENERGY DATA BOOK: EDITION 36—2017
Table 6.13 Properties of Conventional and Alternative Liquid Fuels
Liquid Fuels
Property Gasoline Low-sulfur diesel Methanol Ethanol (E100)
Standard chemical formulaa C4 to C12 C8 to C25 CH3OH CH3CH2OH
Physical state Liquid Liquid Liquid Liquid Molecular weight 100–105 ~200 32.04 46.07 Composition (weight %)
Carbon 85–88 87 37.5 52.2 Hydrogen 12–15 13 12.6 13.1 Oxygen 0 0 49.9 34.7
Main fuel source(s) Crude oil Crude oil Natural gas, coal, or woody biomass
Corn, grains, or agricultural waste
Gasoline gallon equivalent (GGE) (Fuel unit measured/GGE)
1.0 (E0 gasoline)
0.889 (Diesel gal/GGE)
2.04 Methanol gal/GGE)
1.20-1.37 (E85b gal/GGE)
1.03 (E10 gal/GGE) Specific gravity (60˚ F/ 60˚ F) 0.72–0.78 0.85 0.796 0.794 Density (lb./gal @ 60˚ F) 6.0–6.5 7.079 6.63 6.61 Boiling temperature (F˚) 80–437 356–644 149 172 Freezing point (F˚) -40 -40–30 -143.5 -173.2 Autoignition temperature (F˚) 495 ~600 897 793
Reid vapor pressure (psi) 8–15 <0.2 4.6 2.3 Source: U.S. Department of Energy, Alternative Fuels Data Center website, “Fuel Properties Comparison,"
www.afdc.energy.gov/fuels/fuel_comparison_chart.pdf, July 2015, and communication with George Mitchell, National Renewable Energy Laboratory, July 2015.
a Standard Chemical Formulas represent idealized fuels. Some table values are expressed in ranges to represent typical fuel variations that are encountered in the field. b 1 gallon of E85 has 73% to 83% of the energy of one gallon of gasoline (variation due to ethanol content in E85).
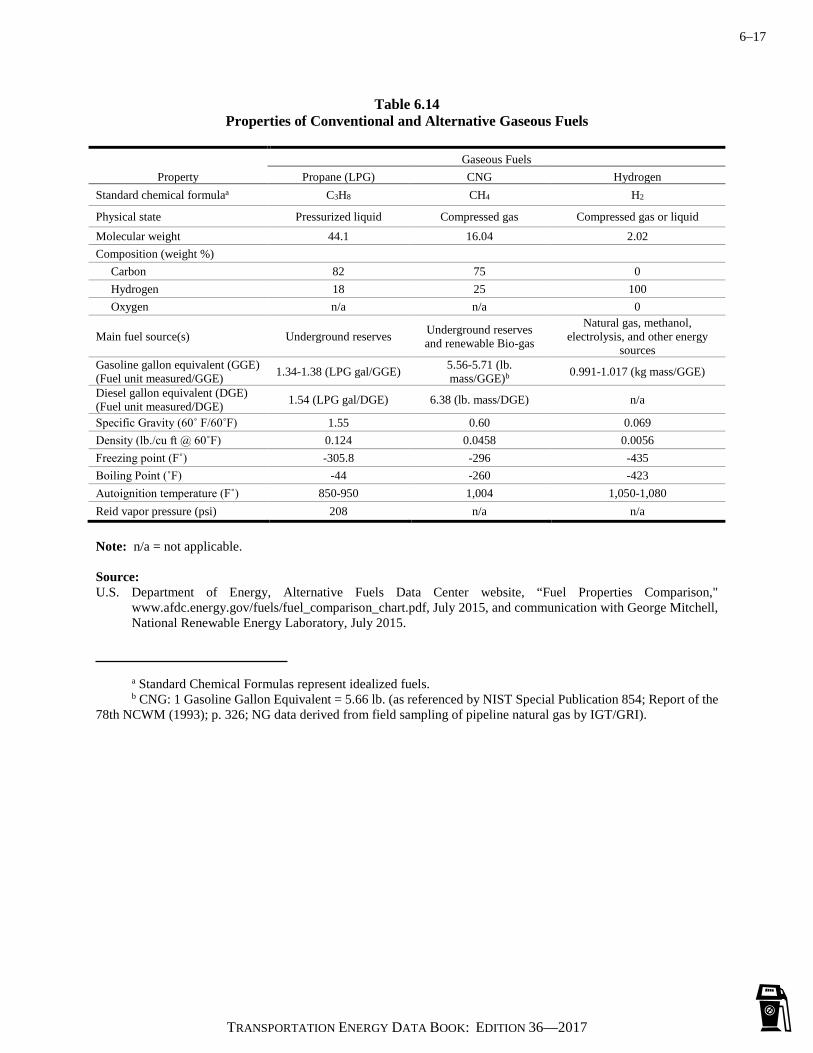
6–17
TRANSPORTATION ENERGY DATA BOOK: EDITION 36—2017
Table 6.14 Properties of Conventional and Alternative Gaseous Fuels
Gaseous Fuels
Property Propane (LPG) CNG Hydrogen Standard chemical formulaa C3H8 CH4 H2
Physical state Pressurized liquid Compressed gas Compressed gas or liquid Molecular weight 44.1 16.04 2.02 Composition (weight %)
Carbon 82 75 0 Hydrogen 18 25 100 Oxygen n/a n/a 0
Main fuel source(s) Underground reserves Underground reserves and renewable Bio-gas
Natural gas, methanol, electrolysis, and other energy
sources Gasoline gallon equivalent (GGE) (Fuel unit measured/GGE) 1.34-1.38 (LPG gal/GGE) 5.56-5.71 (lb.
mass/GGE)b 0.991-1.017 (kg mass/GGE)
Diesel gallon equivalent (DGE) (Fuel unit measured/DGE) 1.54 (LPG gal/DGE) 6.38 (lb. mass/DGE) n/a
Specific Gravity (60˚ F/60˚F) 1.55 0.60 0.069 Density (lb./cu ft @ 60˚F) 0.124 0.0458 0.0056 Freezing point (F˚) -305.8 -296 -435 Boiling Point (˚F) -44 -260 -423 Autoignition temperature (F˚) 850-950 1,004 1,050-1,080 Reid vapor pressure (psi) 208 n/a n/a
Note: n/a = not applicable. Source: U.S. Department of Energy, Alternative Fuels Data Center website, “Fuel Properties Comparison,"
www.afdc.energy.gov/fuels/fuel_comparison_chart.pdf, July 2015, and communication with George Mitchell, National Renewable Energy Laboratory, July 2015.
a Standard Chemical Formulas represent idealized fuels. b CNG: 1 Gasoline Gallon Equivalent = 5.66 lb. (as referenced by NIST Special Publication 854; Report of the 78th NCWM (1993); p. 326; NG data derived from field sampling of pipeline natural gas by IGT/GRI).

6–18
TRANSPORTATION ENERGY DATA BOOK: EDITION 36—2017

7–1
TRANSPORTATION ENERGY DATA BOOK: EDITION 36—2017
Chapter 7 Fleet Vehicles and Characteristics
Summary Statistics from Tables in this Chapter
Source
Figure 7.1 Fleet cars, 2016 4,756,800 Figure 7.1 Fleet trucks ≤ 19,500 lbs. GVW, 2016 4,809,400 Table 7.3 Average annual miles per business fleet vehicle SUVs 26,352 Intermediate cars 24,540 Pickup trucks 25,500 Figure 7.2 Average annual miles per Federal Government
fleet vehicle, 2015 Sedans 9,855 SUVs 9,508 Buses 8,256 Heavy trucks 6,730 Medium trucks 6,600 Light trucks 6,245 Ambulances 5,403 Table 7.4 Federal government vehicles, FY 2015 640,304 Light trucks (<8,500 lbs. GVW) 281,993 Cars and other passenger vehicles 235,319 Medium trucks (8,500–26,000 lbs. GVW) 79,421 Heavy trucks (>26,000 lbs. GVW) 34,049 Buses and ambulances 9,522

7–2
TRANSPORTATION ENERGY DATA BOOK: EDITION 36—2017
Vehicles in fleets of 15 or more are counted as fleet vehicles, as well as vehicles in fleets where five or more vehicles are purchased annually. There are more trucks in fleets than cars in 2016.
Figure 7.1. Fleet Vehicles in Service as of January 1, 2016
Source: Bobit Publishing Company, Automotive Fleet Research Department, Automotive Fleet Factbook 2016, Redondo
Beach, CA, 2017. a Taxi category includes taxis that are vans in addition to cars. b Rental category includes vans and sports utility vehicles under cars, not trucks. c Fleets of 15 or more in operation or 5 or more fleet vehicles purchased annually.

7–3
TRANSPORTATION ENERGY DATA BOOK: EDITION 36—2017
Data for fleet vehicles (cars and trucks less than 19,501 pounds) show that rental fleets are the largest share of cars and commercial fleets are the largest share of trucks. Government fleets are the second largest share for both cars and trucks.
Table 7.1
Fleet Vehicles in Service, 2006-2016 (thousands of vehicles)
Year Commercial Rentala Government Police & Taxib Total
Carsc 2006 896.9 1,623.0 1,195.9 555.2 4,271.0 2007 911.8 1,650.0 1,215.8 564.5 4,342.0 2008 879.1 1,465.1 1,255.8 586.0 4,186.0 2009 791.0 1,289.0 1,299.0 607.0 3,986.0 2010 741.2 1,175.0 1,352.0 575.7 3,843.8 2011 803.9 1,553.2 1,330.0 578.6 4,265.7 2012 834.7 1,745.0 1,240.0 556.6 4,376.3 2013 727.7 1,850.0 1,290.0 570.6 4,438.3 2014 688.5 1,920.0 1,245.2 582.4 4,443.2 2015 659.2 2,040.0 1,325.0 595.8 4,620.0 2016 685.0 2,156.0 1,340.0 575.8 4,756.8
Trucksc <19,501 lbs. 2006 2,362.4 499.7 1,635.5 45.4 4,543.0 2007 2,383.2 560.8 1,682.3 46.7 4,673.0 2008 2,318.5 500.1 1,682.0 45.5 4,546.0 2009 2,224.0 381.0 1,701.0 59.0 4,365.0 2010 1,999.5 380.0 1,751.0 55.4 4,185.8 2011 2,136.3 391.0 1,684.0 58.4 4,269.7 2012 2,236.8 417.0 1,512.0 62.0 4,227.8 2013 2,186.9 465.0 1,560.0 66.5 4,278.4 2014 2,136.4 480.0 1,631.5 74.9 4,322.8 2015 2,231.8 535.0 1,727.4 77.4 4,571.6 2016 2,340.0 582.0 1,810.0 77.4 4,809.0
Source: Bobit Publishing Company, Automotive Fleet Research Department, Automotive Fleet Factbook 2016, and annual,
Redondo Beach, CA. (Additional resources: www.fleet-central.com) a Rental category includes vans and sports utility vehicles under cars, not trucks. b Taxi category includes vans. c Fleets of 15 or more in operation or 5 or more fleet vehicles purchased annually.

7–4
TRANSPORTATION ENERGY DATA BOOK: EDITION 36—2017
In commercial fleets, full size vans stay in service the longest—an average of 63 months. Most commercial fleet vehicles drive about 25,000 miles in a year.
Table 7.2
Average Length of Time Commercial Fleet Vehicles Are in Service, 2015
Vehicle type Average months
in service Compact cars 35 Intermediate cars 33 Pickup trucks 56 Minivans 42 Sport utility vehicles 35 Full-size vans 63
Note: Based on data collected from four leading Fleet Management companies. Source: Bobit Publishing Company, Automotive Fleet Factbook 2016, www.automotive-fleet.com. (Additional resources:
www.fleet-central.com)
Table 7.3 Average Annual Vehicle-Miles of Travel
for Commercial Fleet Vehicles, 2015
Business fleet vehicles Average annual miles of
travel Compact cars 24,408 Intermediate cars 24,540 Pickup trucks 25,500 Minivans 26,616 Sport utility vehicles 26,352 Full-size vans 25,152
Source: Bobit Publishing Company, Automotive Fleet Factbook 2016, www.automotive-fleet.com. (Additional resources:
www.fleet-central.com)

7–5
TRANSPORTATION ENERGY DATA BOOK: EDITION 36—2017
These data, which apply to domestic Federal fleet vehicles, indicate that sedans now have the highest average annual miles per vehicle, followed closely by sport utility vehicles (SUVs).
Figure 7.2. Average Miles per Domestic Federal Vehicle by Vehicle Type, 2015
Note: Light trucks = less than 8,500 pounds gross vehicle weight ratio (GVWR). Medium trucks = 8,501-23,999 pounds GVWR. Heavy trucks = 24,000 pounds GVWR or more. LSEVs = low-speed electric vehicles. Source: U.S. General Services Administrations, Federal Vehicle Policy Division, FY 2015 Federal Fleet Report,
Washington, DC, 2016, Table 4-2. (Additional resources: www.gsa.gov)
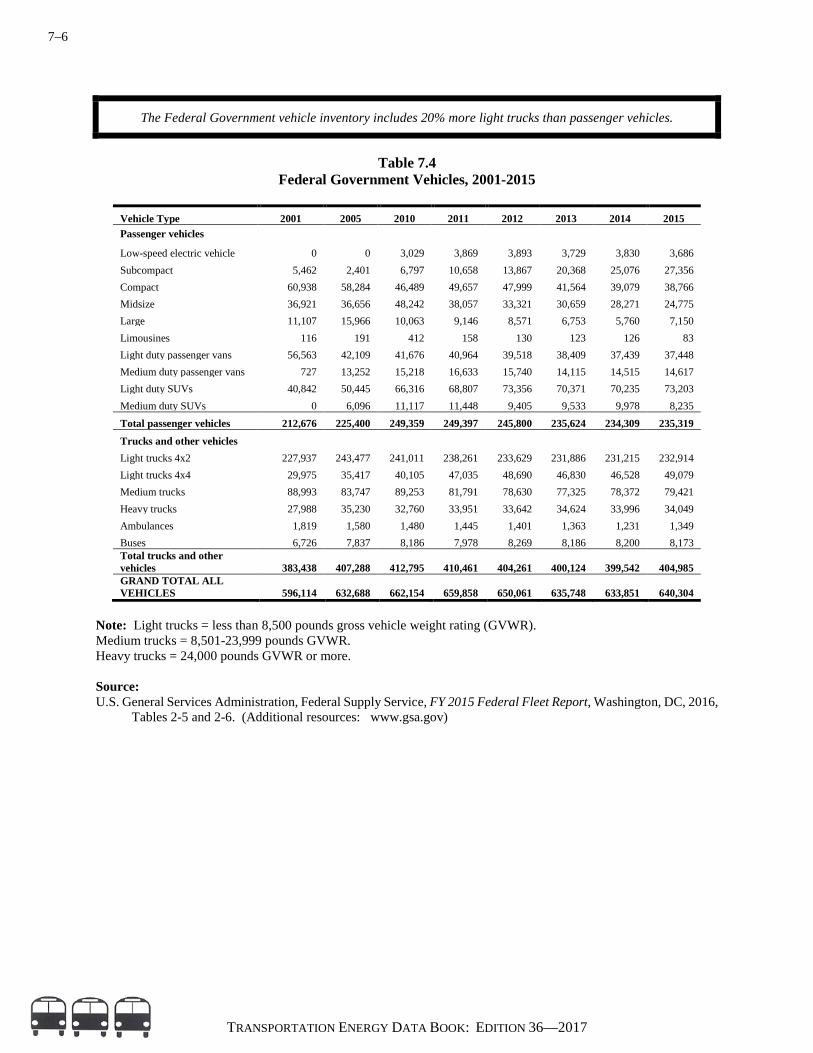
7–6
TRANSPORTATION ENERGY DATA BOOK: EDITION 36—2017
The Federal Government vehicle inventory includes 20% more light trucks than passenger vehicles.
Table 7.4
Federal Government Vehicles, 2001-2015
Vehicle Type 2001 2005 2010 2011 2012 2013 2014 2015 Passenger vehicles Low-speed electric vehicle 0 0 3,029 3,869 3,893 3,729 3,830 3,686 Subcompact 5,462 2,401 6,797 10,658 13,867 20,368 25,076 27,356 Compact 60,938 58,284 46,489 49,657 47,999 41,564 39,079 38,766 Midsize 36,921 36,656 48,242 38,057 33,321 30,659 28,271 24,775 Large 11,107 15,966 10,063 9,146 8,571 6,753 5,760 7,150 Limousines 116 191 412 158 130 123 126 83 Light duty passenger vans 56,563 42,109 41,676 40,964 39,518 38,409 37,439 37,448 Medium duty passenger vans 727 13,252 15,218 16,633 15,740 14,115 14,515 14,617 Light duty SUVs 40,842 50,445 66,316 68,807 73,356 70,371 70,235 73,203 Medium duty SUVs 0 6,096 11,117 11,448 9,405 9,533 9,978 8,235 Total passenger vehicles 212,676 225,400 249,359 249,397 245,800 235,624 234,309 235,319
Trucks and other vehicles Light trucks 4x2 227,937 243,477 241,011 238,261 233,629 231,886 231,215 232,914 Light trucks 4x4 29,975 35,417 40,105 47,035 48,690 46,830 46,528 49,079 Medium trucks 88,993 83,747 89,253 81,791 78,630 77,325 78,372 79,421 Heavy trucks 27,988 35,230 32,760 33,951 33,642 34,624 33,996 34,049 Ambulances 1,819 1,580 1,480 1,445 1,401 1,363 1,231 1,349 Buses 6,726 7,837 8,186 7,978 8,269 8,186 8,200 8,173 Total trucks and other vehicles 383,438 407,288 412,795 410,461 404,261 400,124 399,542 404,985 GRAND TOTAL ALL VEHICLES 596,114 632,688 662,154 659,858 650,061 635,748 633,851 640,304
Note: Light trucks = less than 8,500 pounds gross vehicle weight rating (GVWR). Medium trucks = 8,501-23,999 pounds GVWR. Heavy trucks = 24,000 pounds GVWR or more. Source: U.S. General Services Administration, Federal Supply Service, FY 2015 Federal Fleet Report, Washington, DC, 2016,
Tables 2-5 and 2-6. (Additional resources: www.gsa.gov)

7–7
TRANSPORTATION ENERGY DATA BOOK: EDITION 36—2017
Table 7.5 Federal Fleet Vehicle Acquisitions
by Fuel Type, FY 2002–2015
Acquisitions by year Fuel type 2002 2005 2007 2010 2012 2013 2014 2015 Gasoline 44,850 41,247 32,089 26,547 15,660 15,994 18,412 17,080 Gasoline hybrid a 222 458 4,853 1,254 1,364 4,124 2,500 Gasoline LGHGb 0 0 0 0 745 369 562 224 Gasoline plug-in hybrid 0 0 0 0 144 258 283 263 Diesel 8,107 6,049 5,809 4,136 4,383 4,625 5,974 6,215 Diesel hybrid c 1 4 27 36 51 8 7 Diesel LGHGb 0 0 0 0 10 0 1 0 CNG 1,267 188 129 60 106 123 87 241 E-85 8,054 16,892 26,581 26,789 24,214 21,644 26,267 24,651 Electric 7 13 7 1,376 258 284 349 231 LNG 3 0 0 0 0 0 0 0 LPG 59 1 4 2 15 23 7 6 M-85 25 0 0 0 0 0 0 0 Hydrogen 0 0 0 4 0 2 5 0 Grand total 62,372 64,613 65,081 63,794 46,825 44,737 56,079 51,418
Source: U.S. General Services Administrations, Federal Vehicle Policy Division, FY 2015 Federal Fleet Report, Washington,
DC, 2016, Table 5-4. (Additional resources: www.gsa.gov)
Table 7.6 Fuel Consumed by Federal Government Fleets, FY 2000–2015
(thousand gasoline equivalent gallons)
FY00 FY05 FY07 FY09 FY10 FY12 FY13 FY14 FY15 Gasoline 284,480 300,261 293,848 301,437 322,023 302,089 295,076 296,083 310,416 Diesel 70,181 53,363 74,806 76,456 75,329 73,228 67,332 65,168 66,736 CNG 865 1,245 889 499 504 421 369 333 400 Electricity 1 6 5 4 36 85 88 142 197 Biodiesel (B20) 569 8,052 9,515 7,393 8,258 6,353 5,619 5,329 4,722 Biodiesel (B100)d 0 0 0 5 0 344 358 17 11 Methanol/M-85 14 0 0 0 0 0 0 0 0 LPG 34 231 322 208 195 211 257 231 150 Ethanol/E-85 347 3,060 3,854 7,923 8,201 12,261 14,158 12,911 13,512 LNG 0 102 95 35 0 0 0 3 7 Hydrogen 0 0 0 0 1 1 0 0 0 Total 356,491 366,320 383,334 393,961 414,548 394,994 383,257 380,217 396,152
Source: U.S. General Services Administrations, Federal Vehicle Policy Division, FY 2015 Federal Fleet Report, Washington,
DC, 2016, Table 5-1. (Additional resources: www.gsa.gov) a Combined with gasoline. b Low greenhouse gas emissions. c Combined with diesel. d B100 cannot be separated from B20 from 2000-2007.
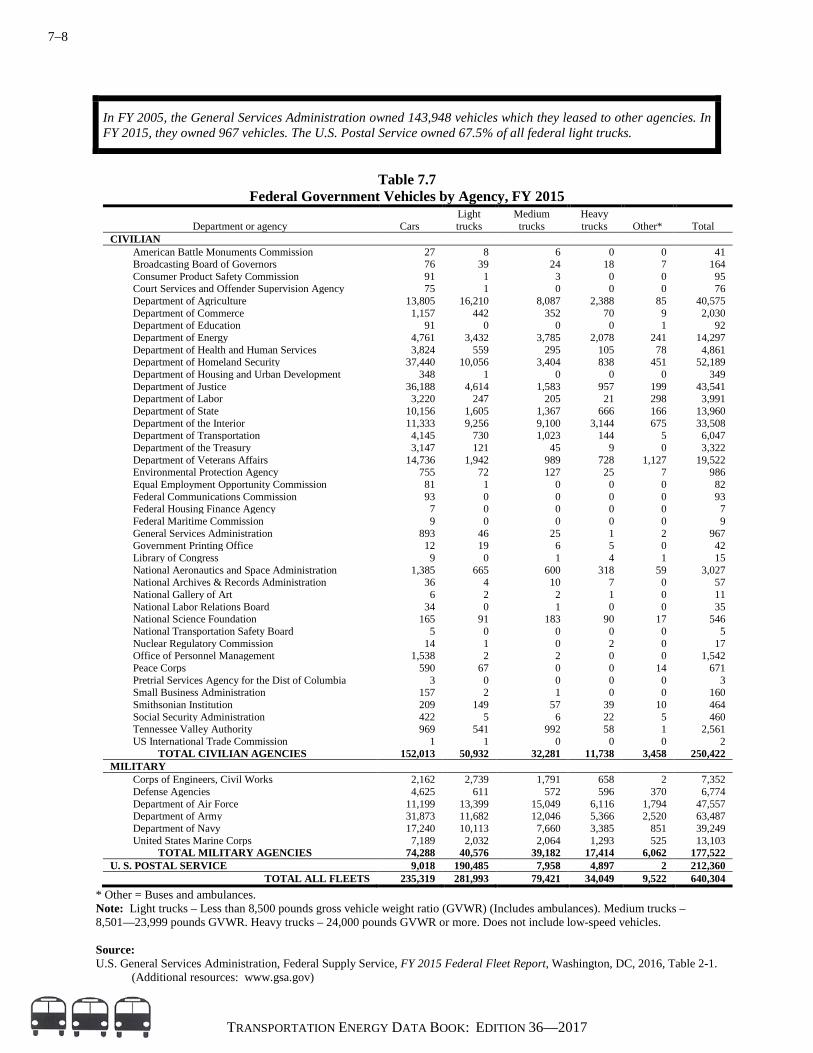
7–8
TRANSPORTATION ENERGY DATA BOOK: EDITION 36—2017
In FY 2005, the General Services Administration owned 143,948 vehicles which they leased to other agencies. In FY 2015, they owned 967 vehicles. The U.S. Postal Service owned 67.5% of all federal light trucks.
Table 7.7
Federal Government Vehicles by Agency, FY 2015
Department or agency Cars Light trucks
Medium trucks
Heavy trucks Other* Total
CIVILIAN American Battle Monuments Commission 27 8 6 0 0 41 Broadcasting Board of Governors 76 39 24 18 7 164 Consumer Product Safety Commission 91 1 3 0 0 95 Court Services and Offender Supervision Agency 75 1 0 0 0 76 Department of Agriculture 13,805 16,210 8,087 2,388 85 40,575 Department of Commerce 1,157 442 352 70 9 2,030 Department of Education 91 0 0 0 1 92 Department of Energy 4,761 3,432 3,785 2,078 241 14,297 Department of Health and Human Services 3,824 559 295 105 78 4,861 Department of Homeland Security 37,440 10,056 3,404 838 451 52,189 Department of Housing and Urban Development 348 1 0 0 0 349 Department of Justice 36,188 4,614 1,583 957 199 43,541 Department of Labor 3,220 247 205 21 298 3,991 Department of State 10,156 1,605 1,367 666 166 13,960 Department of the Interior 11,333 9,256 9,100 3,144 675 33,508 Department of Transportation 4,145 730 1,023 144 5 6,047 Department of the Treasury 3,147 121 45 9 0 3,322 Department of Veterans Affairs 14,736 1,942 989 728 1,127 19,522 Environmental Protection Agency 755 72 127 25 7 986 Equal Employment Opportunity Commission 81 1 0 0 0 82 Federal Communications Commission 93 0 0 0 0 93 Federal Housing Finance Agency 7 0 0 0 0 7 Federal Maritime Commission 9 0 0 0 0 9 General Services Administration 893 46 25 1 2 967 Government Printing Office 12 19 6 5 0 42 Library of Congress 9 0 1 4 1 15 National Aeronautics and Space Administration 1,385 665 600 318 59 3,027 National Archives & Records Administration 36 4 10 7 0 57 National Gallery of Art 6 2 2 1 0 11 National Labor Relations Board 34 0 1 0 0 35 National Science Foundation 165 91 183 90 17 546 National Transportation Safety Board 5 0 0 0 0 5 Nuclear Regulatory Commission 14 1 0 2 0 17 Office of Personnel Management 1,538 2 2 0 0 1,542 Peace Corps 590 67 0 0 14 671 Pretrial Services Agency for the Dist of Columbia 3 0 0 0 0 3 Small Business Administration 157 2 1 0 0 160 Smithsonian Institution 209 149 57 39 10 464 Social Security Administration 422 5 6 22 5 460 Tennessee Valley Authority 969 541 992 58 1 2,561 US International Trade Commission 1 1 0 0 0 2 TOTAL CIVILIAN AGENCIES 152,013 50,932 32,281 11,738 3,458 250,422
MILITARY Corps of Engineers, Civil Works 2,162 2,739 1,791 658 2 7,352 Defense Agencies 4,625 611 572 596 370 6,774 Department of Air Force 11,199 13,399 15,049 6,116 1,794 47,557 Department of Army 31,873 11,682 12,046 5,366 2,520 63,487 Department of Navy 17,240 10,113 7,660 3,385 851 39,249 United States Marine Corps 7,189 2,032 2,064 1,293 525 13,103 TOTAL MILITARY AGENCIES 74,288 40,576 39,182 17,414 6,062 177,522
U. S. POSTAL SERVICE 9,018 190,485 7,958 4,897 2 212,360 TOTAL ALL FLEETS 235,319 281,993 79,421 34,049 9,522 640,304
* Other = Buses and ambulances. Note: Light trucks – Less than 8,500 pounds gross vehicle weight ratio (GVWR) (Includes ambulances). Medium trucks – 8,501—23,999 pounds GVWR. Heavy trucks – 24,000 pounds GVWR or more. Does not include low-speed vehicles. Source: U.S. General Services Administration, Federal Supply Service, FY 2015 Federal Fleet Report, Washington, DC, 2016, Table 2-1.
(Additional resources: www.gsa.gov)

7–9
TRANSPORTATION ENERGY DATA BOOK: EDITION 36—2017
Demand response vehicles (also called paratransit or dial-a-ride) are widely used by transit agencies. The vehicles do not operate over a fixed route or on a fixed schedule. The vehicle may be dispatched to pick up several passengers at different pick-up points before taking them to their respective destinations and may even be interrupted en route to these destinations to pick up other passengers. Demand response service is provided primarily by vans. In 2007, the data changed substantially due to improved estimation methodologies. Unfortunately, those data are no longer comparable to the rest of the historical series.
Table 7.8
Summary Statistics on Demand Response Vehicles, 1994–2014
Year
Number of agencies
Number of active vehicles
Vehicle-miles (millions)
Average miles per vehicle
Passenger-miles
(millions)
Average load
factor Energy use
(trillion Btu)
1994 5,214 28,729 463.7 16.14 577 a 9.5 1995 5,214 29,352 506.5 17.26 607 1.41 9.2 1996 5,214 30,804 548.3 17.80 656 1.21 9.9 1997 5,214 32,509 585.3 18.00 754 1.36 9.8 1998 5,214 29,646 670.9 22.63 735 1.21 10.4 1999 5,252 31,884 718.4 22.53 813 1.34 10.6 2000 5,252 33,080 758.9 22.94 839 1.30 10.8 2001 5,251 34,661 789.3 22.77 855 1.28 11.3 2002 5,251 34,699 802.6 23.13 853 1.24 11.6 2003 5,346 35,954 864.0 24.03 930 1.27 12.9 2004 5,960 37,078 889.5 23.99 962 1.25 13.3 2005 5,960 41,958 978.3 23.32 1,058 1.25 14.8 2006 5,960 43,509 1,013.0 23.28 1,078 1.24 15.5 b
2007 7,300 64,865 1,471.4 22.68 1,502 1.18 24.7 2008 7,200 65,799 1,495.2 22.72 1,412 1.09 24.7 2009 6,700 68,957 1,529.2 22.18 1,477 1.12 23.1 2010 6,741 68,621 1,693.6 24.68 1,494 1.03 22.8 2011 6,600 65,336 1,611.8 24.67 1,580 1.13 24.1 2012 6,511 68,632 1,618.1 23.58 1,756 1.24 24.8 2013 6,270 68,559 1,565.1 22.83 2,171 1.59 26.4 2014 6,370 71,359 1,595.1 22.35 2,267 1.65 32.0
Note: See Glossary for a detailed definition of demand response. Source: American Public Transportation Association, 2016 Public Transportation Fact Book, Washington, DC, April 2016.
(Additional resources: www.apta.com) a Data are not available. b Data are not continuous between 2006 and 2007 due to changes in estimation methodology. See source document for details.

7–10
TRANSPORTATION ENERGY DATA BOOK: EDITION 36—2017
In 2007, the data changed substantially due to improved estimation methodologies. Unfortunately, those data are no longer comparable to the rest of the historical series.
Table 7.9
Summary Statistics on Transit Buses and Trolleybuses, 1994–2015
Year Number of active buses
Vehicle-miles (millions)
Passenger-miles
(millions) Btu/passenger-
mile Energy use
(trillion Btu)
1994 68,766 2,176 19,019 4,262 81.1 1995 67,802 2,198 19,005 4,307 81.9 1996 72,353 2,234 19,280 4,340 83.7 1997 73,425 2,259 19,793 4,434 87.8 1998 72,788 2,188 20,542 4,399 90.4 1999 74,885 2,290 21,391 4,344 92.9 2000 75,665 2,329 21,433 4,531 97.1 2001 76,675 2,389 22,209 4,146 92.1 2002 76,806 2,425 22,029 4,133 91.1 2003 78,000 2,435 21,438 4,213 90.3 2004 81,630 2,484 21,550 4,364 94.0 2005 82,642 2,498 21,998 4,250 93.5 2006 83,689 2,507 22,985 4,316 99.2 a
2007 65,808 2,314 21,132 4,372 92.4 2008 67,096 2,388 21,918 4,348 95.3 2009 65,363 2,345 21,645 4,242 91.8 2010 66,810 2,425 21,172 4,118 87.2 2011 69,654 2,425 21,574 4,240 91.5 2012 70,757 2,417 21,251 4,030 89.7 2013 71,699 2,425 22,306 4,071 90.8 2014 71,603 2,445 22,614 3,829 86.6 2015 64,184 2,205 20,239 4,051 82.0
Source: American Public Transportation Association, 2016 Public Transportation Fact Book, Washington, DC, April 2016,
Appendix A. Data for 2015 are from the U.S. Department of Transportation, Federal Transit Administration, Federal Transit Database. (Additional resources: www.apta.com)
a Data are not continuous between 2006 and 2007 due to changes in estimation methodology. See source document for details.
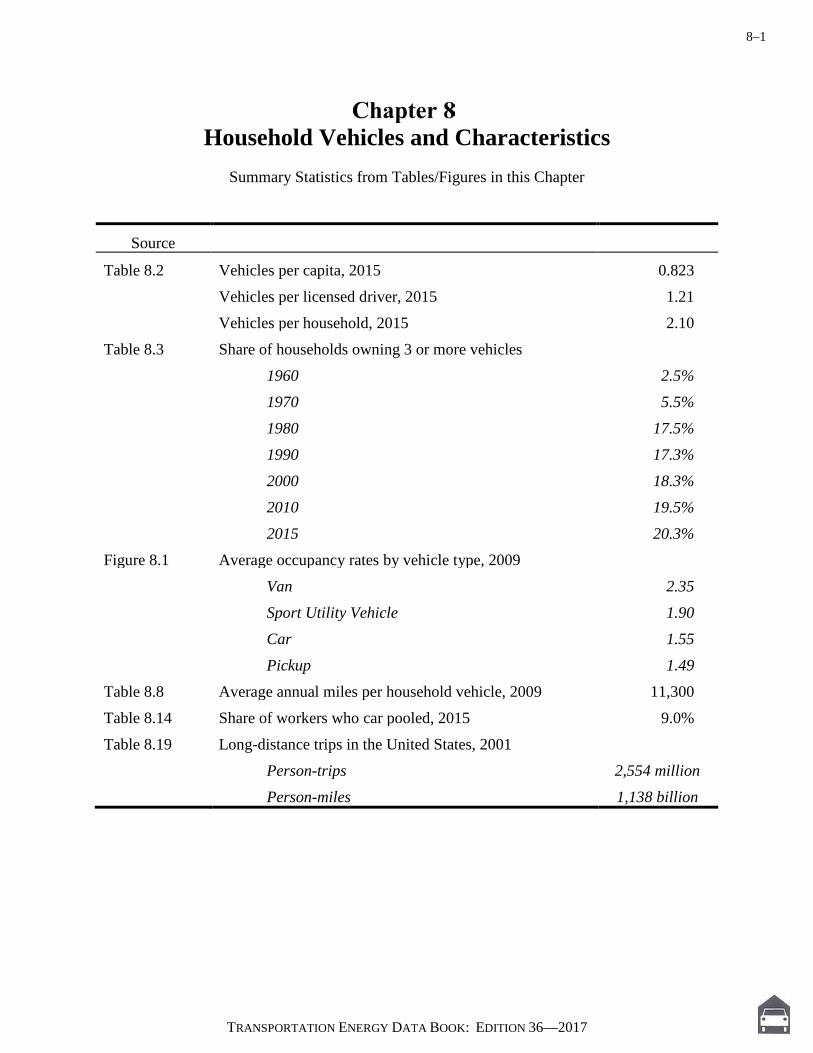
8–1
TRANSPORTATION ENERGY DATA BOOK: EDITION 36—2017
Household Vehicles and Characteristics
Summary Statistics from Tables/Figures in this Chapter
Source
Table 8.2 Vehicles per capita, 2015 0.823 Vehicles per licensed driver, 2015 1.21 Vehicles per household, 2015 2.10 Table 8.3 Share of households owning 3 or more vehicles 1960 2.5% 1970 5.5% 1980 17.5% 1990 17.3% 2000 18.3% 2010 19.5% 2015 20.3% Figure 8.1 Average occupancy rates by vehicle type, 2009 Van 2.35 Sport Utility Vehicle 1.90 Car 1.55 Pickup 1.49 Table 8.8 Average annual miles per household vehicle, 2009 11,300 Table 8.14 Share of workers who car pooled, 2015 9.0% Table 8.19 Long-distance trips in the United States, 2001 Person-trips 2,554 million Person-miles 1,138 billion
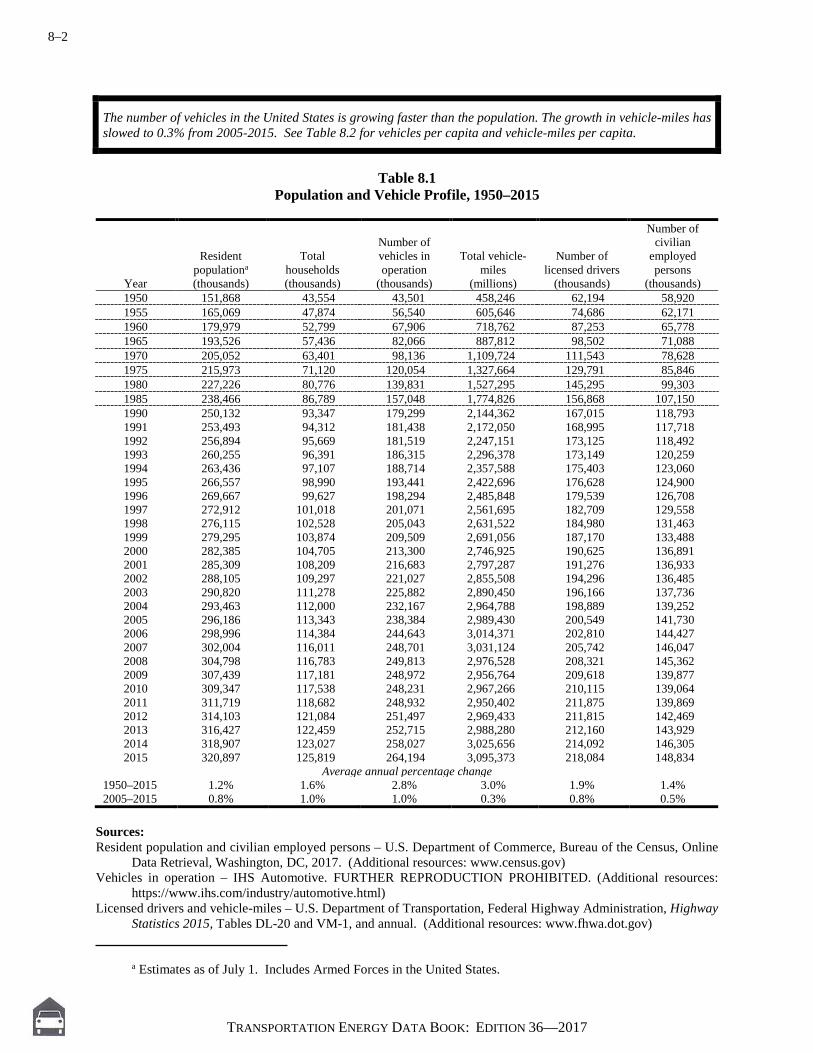
8–2
TRANSPORTATION ENERGY DATA BOOK: EDITION 36—2017
The number of vehicles in the United States is growing faster than the population. The growth in vehicle-miles has slowed to 0.3% from 2005-2015. See Table 8.2 for vehicles per capita and vehicle-miles per capita.
Table 8.1
Population and Vehicle Profile, 1950–2015
Year
Resident populationa (thousands)
Total households (thousands)
Number of vehicles in operation
(thousands)
Total vehicle-miles
(millions)
Number of licensed drivers
(thousands)
Number of civilian
employed persons
(thousands) 1950 151,868 43,554 43,501 458,246 62,194 58,920 1955 165,069 47,874 56,540 605,646 74,686 62,171 1960 179,979 52,799 67,906 718,762 87,253 65,778 1965 193,526 57,436 82,066 887,812 98,502 71,088 1970 205,052 63,401 98,136 1,109,724 111,543 78,628 1975 215,973 71,120 120,054 1,327,664 129,791 85,846 1980 227,226 80,776 139,831 1,527,295 145,295 99,303 1985 238,466 86,789 157,048 1,774,826 156,868 107,150 1990 250,132 93,347 179,299 2,144,362 167,015 118,793 1991 253,493 94,312 181,438 2,172,050 168,995 117,718 1992 256,894 95,669 181,519 2,247,151 173,125 118,492 1993 260,255 96,391 186,315 2,296,378 173,149 120,259 1994 263,436 97,107 188,714 2,357,588 175,403 123,060 1995 266,557 98,990 193,441 2,422,696 176,628 124,900 1996 269,667 99,627 198,294 2,485,848 179,539 126,708 1997 272,912 101,018 201,071 2,561,695 182,709 129,558 1998 276,115 102,528 205,043 2,631,522 184,980 131,463 1999 279,295 103,874 209,509 2,691,056 187,170 133,488 2000 282,385 104,705 213,300 2,746,925 190,625 136,891 2001 285,309 108,209 216,683 2,797,287 191,276 136,933 2002 288,105 109,297 221,027 2,855,508 194,296 136,485 2003 290,820 111,278 225,882 2,890,450 196,166 137,736 2004 293,463 112,000 232,167 2,964,788 198,889 139,252 2005 296,186 113,343 238,384 2,989,430 200,549 141,730 2006 298,996 114,384 244,643 3,014,371 202,810 144,427 2007 302,004 116,011 248,701 3,031,124 205,742 146,047 2008 304,798 116,783 249,813 2,976,528 208,321 145,362 2009 307,439 117,181 248,972 2,956,764 209,618 139,877 2010 309,347 117,538 248,231 2,967,266 210,115 139,064 2011 311,719 118,682 248,932 2,950,402 211,875 139,869 2012 314,103 121,084 251,497 2,969,433 211,815 142,469 2013 316,427 122,459 252,715 2,988,280 212,160 143,929 2014 318,907 123,027 258,027 3,025,656 214,092 146,305 2015 320,897 125,819 264,194 3,095,373 218,084 148,834
Average annual percentage change 1950–2015 1.2% 1.6% 2.8% 3.0% 1.9% 1.4% 2005–2015 0.8% 1.0% 1.0% 0.3% 0.8% 0.5%
Sources: Resident population and civilian employed persons – U.S. Department of Commerce, Bureau of the Census, Online
Data Retrieval, Washington, DC, 2017. (Additional resources: www.census.gov) Vehicles in operation – IHS Automotive. FURTHER REPRODUCTION PROHIBITED. (Additional resources:
https://www.ihs.com/industry/automotive.html) Licensed drivers and vehicle-miles – U.S. Department of Transportation, Federal Highway Administration, Highway
Statistics 2015, Tables DL-20 and VM-1, and annual. (Additional resources: www.fhwa.dot.gov) a Estimates as of July 1. Includes Armed Forces in the United States.
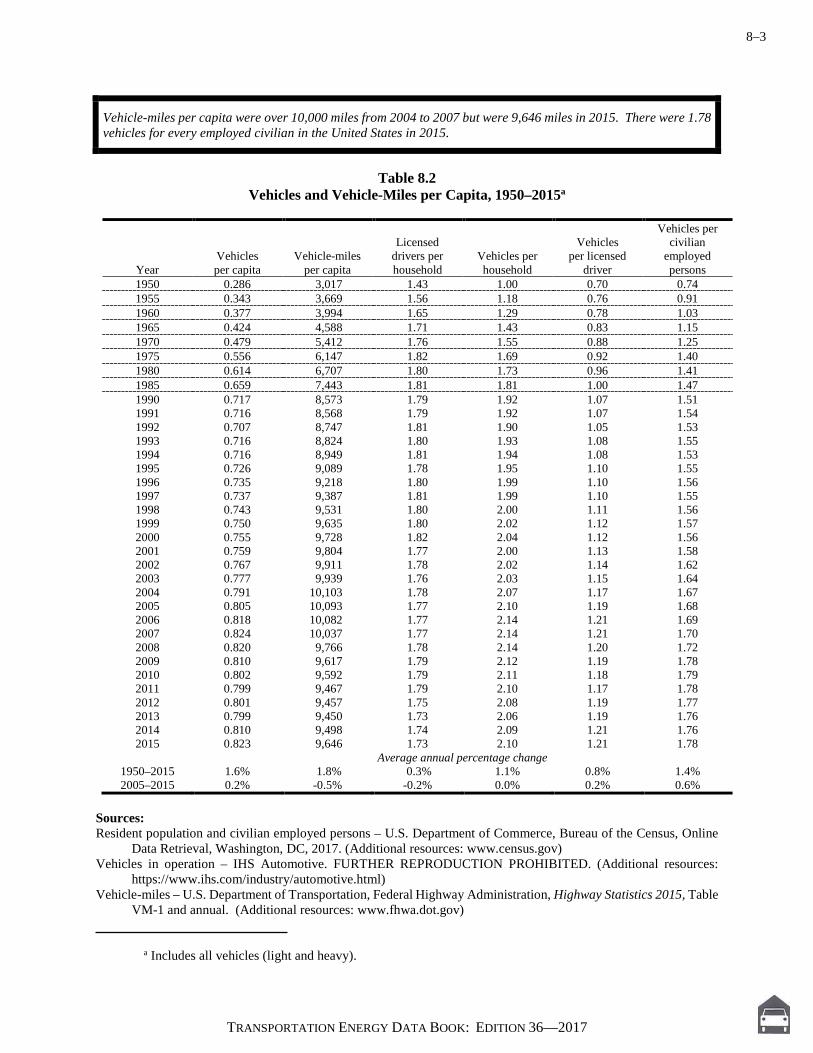
8–3
TRANSPORTATION ENERGY DATA BOOK: EDITION 36—2017
Vehicle-miles per capita were over 10,000 miles from 2004 to 2007 but were 9,646 miles in 2015. There were 1.78 vehicles for every employed civilian in the United States in 2015.
Table 8.2
Vehicles and Vehicle-Miles per Capita, 1950–2015a
Year Vehicles per capita
Vehicle-miles per capita
Licensed drivers per household
Vehicles per household
Vehicles per licensed
driver
Vehicles per civilian
employed persons
1950 0.286 3,017 1.43 1.00 0.70 0.74 1955 0.343 3,669 1.56 1.18 0.76 0.91 1960 0.377 3,994 1.65 1.29 0.78 1.03 1965 0.424 4,588 1.71 1.43 0.83 1.15 1970 0.479 5,412 1.76 1.55 0.88 1.25 1975 0.556 6,147 1.82 1.69 0.92 1.40 1980 0.614 6,707 1.80 1.73 0.96 1.41 1985 0.659 7,443 1.81 1.81 1.00 1.47 1990 0.717 8,573 1.79 1.92 1.07 1.51 1991 0.716 8,568 1.79 1.92 1.07 1.54 1992 0.707 8,747 1.81 1.90 1.05 1.53 1993 0.716 8,824 1.80 1.93 1.08 1.55 1994 0.716 8,949 1.81 1.94 1.08 1.53 1995 0.726 9,089 1.78 1.95 1.10 1.55 1996 0.735 9,218 1.80 1.99 1.10 1.56 1997 0.737 9,387 1.81 1.99 1.10 1.55 1998 0.743 9,531 1.80 2.00 1.11 1.56 1999 0.750 9,635 1.80 2.02 1.12 1.57 2000 0.755 9,728 1.82 2.04 1.12 1.56 2001 0.759 9,804 1.77 2.00 1.13 1.58 2002 0.767 9,911 1.78 2.02 1.14 1.62 2003 0.777 9,939 1.76 2.03 1.15 1.64 2004 0.791 10,103 1.78 2.07 1.17 1.67 2005 0.805 10,093 1.77 2.10 1.19 1.68 2006 0.818 10,082 1.77 2.14 1.21 1.69 2007 0.824 10,037 1.77 2.14 1.21 1.70 2008 0.820 9,766 1.78 2.14 1.20 1.72 2009 0.810 9,617 1.79 2.12 1.19 1.78 2010 0.802 9,592 1.79 2.11 1.18 1.79 2011 0.799 9,467 1.79 2.10 1.17 1.78 2012 0.801 9,457 1.75 2.08 1.19 1.77 2013 0.799 9,450 1.73 2.06 1.19 1.76 2014 0.810 9,498 1.74 2.09 1.21 1.76 2015 0.823 9,646 1.73 2.10 1.21 1.78
Average annual percentage change 1950–2015 1.6% 1.8% 0.3% 1.1% 0.8% 1.4% 2005–2015 0.2% -0.5% -0.2% 0.0% 0.2% 0.6%
Sources: Resident population and civilian employed persons – U.S. Department of Commerce, Bureau of the Census, Online
Data Retrieval, Washington, DC, 2017. (Additional resources: www.census.gov) Vehicles in operation – IHS Automotive. FURTHER REPRODUCTION PROHIBITED. (Additional resources:
https://www.ihs.com/industry/automotive.html) Vehicle-miles – U.S. Department of Transportation, Federal Highway Administration, Highway Statistics 2015, Table
VM-1 and annual. (Additional resources: www.fhwa.dot.gov) a Includes all vehicles (light and heavy).

8–4
TRANSPORTATION ENERGY DATA BOOK: EDITION 36—2017
Household vehicle ownership shows a dramatic increase from 1960 to 1990. In 1960, nearly 79% of households owned less than two vehicles; by 1990, it declined to 45%. Census data prior to 1990 indicated that the majority of households owned one vehicle; in 1990 that changed to two vehicles. Since 2000, less than 10% of households had no vehicles. The American Community Survey now collects these data on an annual basis, thus annual data are available after 2010.
Table 8.3
Household Vehicle Ownership, 1960–2015 Census (percentage)
No
vehicles One
vehicle Two
vehicles
Three or more
vehicles 1960 21.5% 56.9% 19.0% 2.5% 1970 17.5% 47.7% 29.3% 5.5% 1980 12.9% 35.5% 34.0% 17.5% 1990 11.5% 33.7% 37.4% 17.3% 2000 9.4% 33.8% 38.6% 18.3% 2010 9.1% 33.8% 37.6% 19.5% 2011 9.3% 34.1% 37.5% 19.1% 2012 9.2% 34.1% 37.3% 19.3% 2013 9.1% 33.9% 37.3% 19.7% 2014 9.1% 33.7% 37.3% 19.9% 2015 8.9% 33.5% 37.2% 20.3%
Source: U. S. Department of Transportation, Volpe National Transportation Systems Center, Journey-to-Work Trends in the
United States and its Major Metropolitan Area, 1960–1990, Cambridge, MA, 1994, p. 2-2. 2000 data – U.S. Bureau of the Census, American Fact Finder, factfinder.census.gov, Table QT-04, August 2001.
(Additional resources: www.census.gov) 2010-2015 data – U.S. Bureau of the Census, American Community Survey, Table CP04, 2017.

8–5
TRANSPORTATION ENERGY DATA BOOK: EDITION 36—2017
2009 National Household Travel Survey Daily Trip Data The Department of Transportation (DOT) collected data on daily trips in 1969, 1977, 1983, 1990 and 1995 via the Nationwide Personal Transportation Survey (NPTS). For 2001, the DOT combined the collection of long trip and daily trip data into one survey – the 2001 National Household Travel Survey (NHTS). The long trip data were not included in the 2009 NHTS. The NHTS is the nation’s inventory of daily travel. The survey includes demographic characteristics of households, people, vehicles, and detailed information on daily travel for all purposes by all modes. NHTS survey data are collected from a sample of U.S. households and expanded to provide national estimates of trips and miles by travel mode, trip purpose, and a host of household attributes. The NHTS was designed to continue the NPTS series, but as with all data surveys, caution should be used when comparing statistics from one survey to another due to changes in terminology, survey procedures, and target population. The 2001 and 2009 surveys collected data on trips of children under 5 years of age, while the previous NPTS did not. Improved methodologies first used in the collection of trip information in the 1995 NPTS make it difficult to compare these data with past NPTS survey data. Thus, the 1990 NPTS trip data have been adjusted to make it comparable with the later surveys. The next NHTS is being conducted in 2016 and data will be available in 2018.
Table 8.4 Demographic Statistics from the 1969, 1977, 1983, 1990, 1995 NPTS and 2001, 2009 NHTS
1969 1977 1983 1990 1995 2001 2009
Percent change
1969–2009 Persons per household 3.16 2.83 2.69 2.56 2.63 2.58 2.50 -21% Vehicles per household 1.16 1.59 1.68 1.77 1.78 1.89 1.87 61% Workers per household 1.21 1.23 1.21 1.27 1.33 1.35 1.34 11% Licensed drivers per household 1.65 1.69 1.72 1.75 1.78 1.77 1.88 14% Vehicles per worker 0.96 1.29 1.39 1.40 1.34 1.39 1.40 46% Vehicles per licensed driver 0.70 0.94 0.98 1.01 1.00 1.06 1.00 42% Average vehicle trip length (miles) 8.89 8.34 7.90 8.98 9.06 9.87 9.72 9%
Note: Average vehicle trip length for 1990 and 1995 is calculated using only those records with trip mileage information present. The 1969 survey does not include pickups and other light trucks as household vehicles. Data on vehicles per household and licensed drivers per household will not match Table 8.2 because they come from a different source. Sources: U.S. Department of Transportation, Federal Highway Administration, 1990 Nationwide Personal Transportation
Survey: Summary of Travel Trends, FHWA-PL-92-027, Washington, DC, March 1992, Table 2. Data for 1995, 2001 and 2009 were generated from the 2009 National Household Travel Survey website nhts.ornl.gov. (Additional resources: www.fhwa.dot.gov)
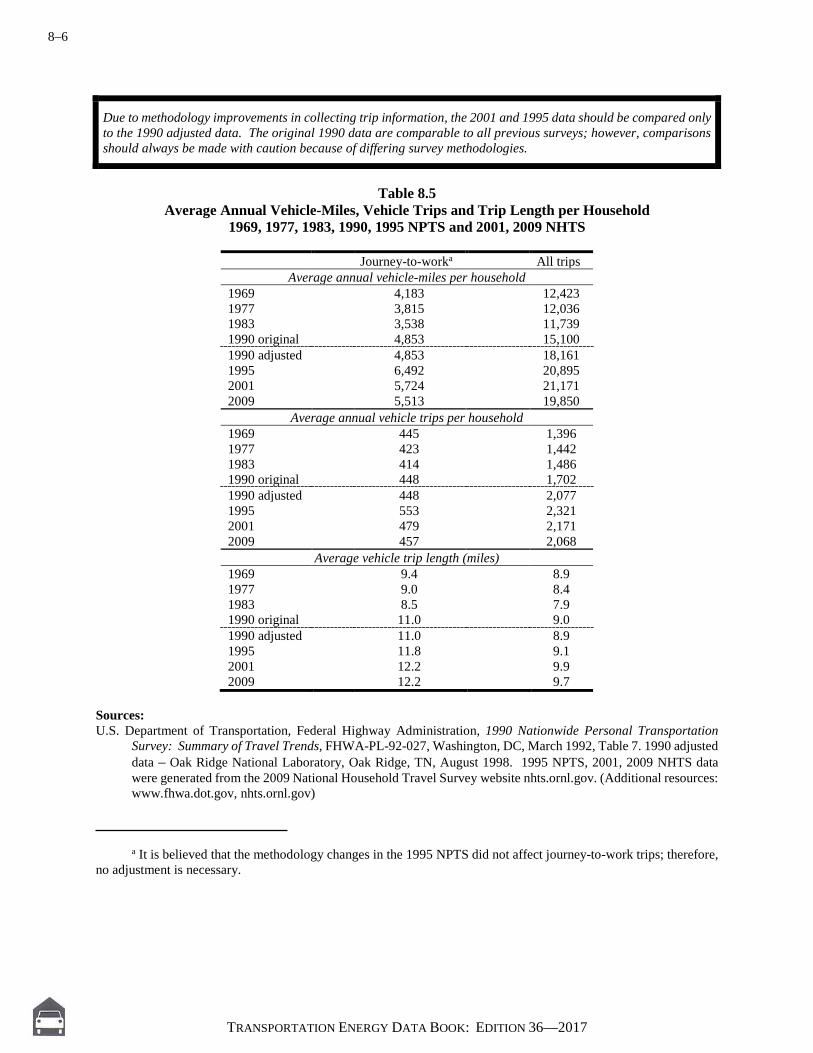
8–6
TRANSPORTATION ENERGY DATA BOOK: EDITION 36—2017
Due to methodology improvements in collecting trip information, the 2001 and 1995 data should be compared only to the 1990 adjusted data. The original 1990 data are comparable to all previous surveys; however, comparisons should always be made with caution because of differing survey methodologies.
Table 8.5
Average Annual Vehicle-Miles, Vehicle Trips and Trip Length per Household 1969, 1977, 1983, 1990, 1995 NPTS and 2001, 2009 NHTS
Journey-to-worka All trips
Average annual vehicle-miles per household 1969 4,183 12,423 1977 3,815 12,036 1983 3,538 11,739 1990 original 4,853 15,100 1990 adjusted 4,853 18,161 1995 6,492 20,895 2001 5,724 21,171 2009 5,513 19,850
Average annual vehicle trips per household 1969 445 1,396 1977 423 1,442 1983 414 1,486 1990 original 448 1,702 1990 adjusted 448 2,077 1995 553 2,321 2001 479 2,171 2009 457 2,068
Average vehicle trip length (miles) 1969 9.4 8.9 1977 9.0 8.4 1983 8.5 7.9 1990 original 11.0 9.0 1990 adjusted 11.0 8.9 1995 11.8 9.1 2001 12.2 9.9 2009 12.2 9.7
Sources: U.S. Department of Transportation, Federal Highway Administration, 1990 Nationwide Personal Transportation
Survey: Summary of Travel Trends, FHWA-PL-92-027, Washington, DC, March 1992, Table 7. 1990 adjusted data – Oak Ridge National Laboratory, Oak Ridge, TN, August 1998. 1995 NPTS, 2001, 2009 NHTS data were generated from the 2009 National Household Travel Survey website nhts.ornl.gov. (Additional resources: www.fhwa.dot.gov, nhts.ornl.gov)
a It is believed that the methodology changes in the 1995 NPTS did not affect journey-to-work trips; therefore, no adjustment is necessary.
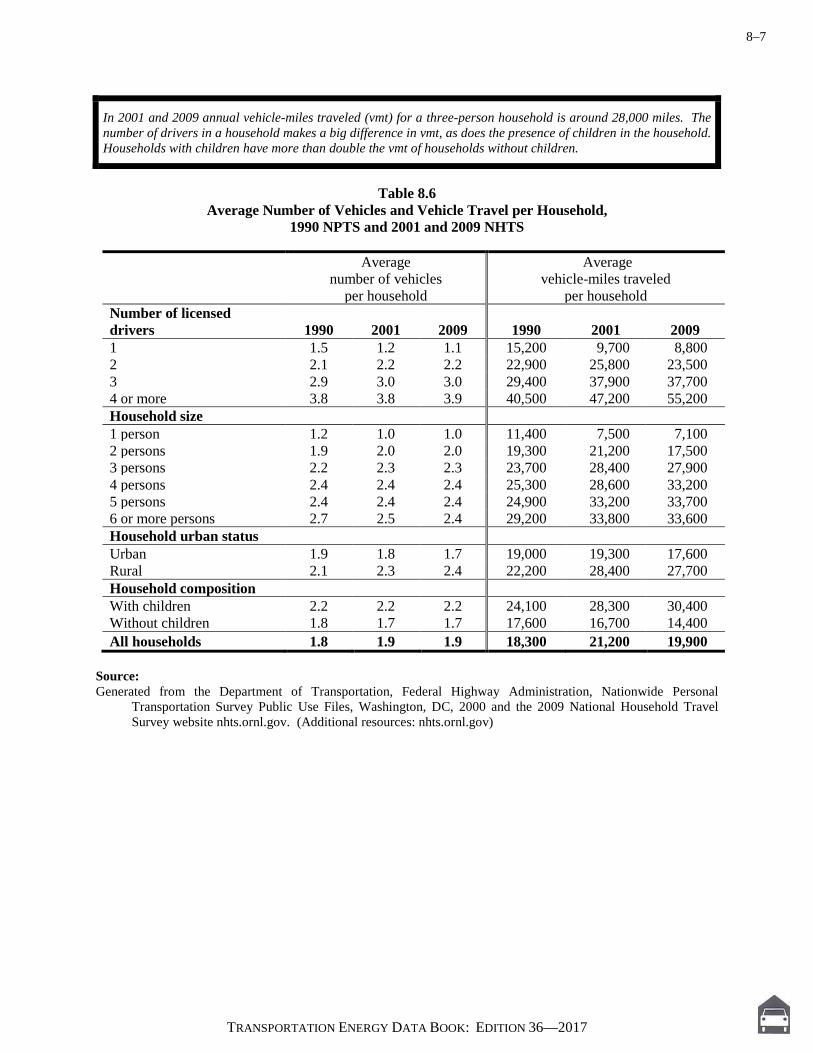
8–7
TRANSPORTATION ENERGY DATA BOOK: EDITION 36—2017
In 2001 and 2009 annual vehicle-miles traveled (vmt) for a three-person household is around 28,000 miles. The number of drivers in a household makes a big difference in vmt, as does the presence of children in the household. Households with children have more than double the vmt of households without children.
Table 8.6
Average Number of Vehicles and Vehicle Travel per Household, 1990 NPTS and 2001 and 2009 NHTS
Average number of vehicles
per household
Average vehicle-miles traveled
per household Number of licensed drivers 1990 2001 2009 1990 2001 2009 1 1.5 1.2 1.1 15,200 9,700 8,800 2 2.1 2.2 2.2 22,900 25,800 23,500 3 2.9 3.0 3.0 29,400 37,900 37,700 4 or more 3.8 3.8 3.9 40,500 47,200 55,200 Household size 1 person 1.2 1.0 1.0 11,400 7,500 7,100 2 persons 1.9 2.0 2.0 19,300 21,200 17,500 3 persons 2.2 2.3 2.3 23,700 28,400 27,900 4 persons 2.4 2.4 2.4 25,300 28,600 33,200 5 persons 2.4 2.4 2.4 24,900 33,200 33,700 6 or more persons 2.7 2.5 2.4 29,200 33,800 33,600 Household urban status Urban 1.9 1.8 1.7 19,000 19,300 17,600 Rural 2.1 2.3 2.4 22,200 28,400 27,700 Household composition With children 2.2 2.2 2.2 24,100 28,300 30,400 Without children 1.8 1.7 1.7 17,600 16,700 14,400 All households 1.8 1.9 1.9 18,300 21,200 19,900
Source: Generated from the Department of Transportation, Federal Highway Administration, Nationwide Personal
Transportation Survey Public Use Files, Washington, DC, 2000 and the 2009 National Household Travel Survey website nhts.ornl.gov. (Additional resources: nhts.ornl.gov)

8–8
TRANSPORTATION ENERGY DATA BOOK: EDITION 36—2017
In 2009, 22% of vehicle trips were traveling to and from work. Another 22% of trips were for shopping. Shopping is done close to home, as the average trip length for shopping was only 6.5 miles.
Table 8.7
Trip Statisticsa by Trip Purpose, 2001 and 2009 NHTS
Share of vehicle- Trip length Trip length Share of trips miles traveled (miles) (minutes) Trip purpose 2001 2009 2001 2009 2001 2009 2001 2009 To/from work 22.1% 22.3% 27.0% 28.7% 12.1 12.2 22.3 22.9 Work-related business 4.1% 3.9% 8.4% 7.2% 20.3 17.2 30.9 27.5 Shopping 21.1% 22.8% 14.5% 15.5% 6.7 6.5 14.4 14.4 Other family/personal business 24.7% 21.9% 18.7% 15.7% 7.5 6.8 15.2 14.8 School/church 4.9% 5.0% 3.7% 4.6% 7.5 8.8 15.8 17.5 Medical/dental 2.2% 2.6% 2.2% 2.6% 9.9 9.9 20.7 21.2 Vacation 0.4% 0.7% 1.8% 2.3% 47.4 31.4 59.6 41.3 Visit friends/relatives 6.3% 5.7% 9.4% 9.4% 14.9 15.7 24.4 24.6 Other social/recreational 13.7% 14.9% 13.2% 13.5% 9.6 8.6 18.2 17.2 Other 0.5% 0.3% 1.0% 0.6% 18.1 19.0 31.4 29.7 All 100.0% 100.0% 100.0% 100.0% 9.9 9.7 18.7 18.6
Note: The "All" category for average trip length and duration includes records for which trip purpose was not identified. Source: Generated from the 2009 National Household Travel Survey website nhts.ornl.gov.
a Percentages may not sum to totals due to rounding.

8–9
TRANSPORTATION ENERGY DATA BOOK: EDITION 36—2017
While car occupancy stayed nearly constant from 1995 to 2009, most other vehicle types showed increased occupancy. Vans and sport utility vehicles have higher vehicle occupancies than cars.
Figure 8.1. Average Vehicle Occupancy by Vehicle Type, 1995 NPTS and 2009 NHTS
Sources: U.S. Department of Transportation, Federal Highway Administration, 1995 Nationwide Personal Transportation
Survey, Washington, DC, 1997, and 2009 National Household Travel Survey, Washington, DC. (Additional resources: www.fhwa.dot.gov, nhts.ornl.gov)

8–10
TRANSPORTATION ENERGY DATA BOOK: EDITION 36—2017
The average vehicle occupancy, calculated as person-miles per vehicle-mile, is highest for social and recreational purposes. The highest vehicle occupancy levels for all purposes were in 1977. The increase in number of vehicles per household and the decrease in average household size could have contributed to the decline since then.
Figure 8.2. Average Vehicle Occupancy by Trip Purpose
1977 NPTS and 2009 NHTS
Sources: U.S. Department of Transportation, Federal Highway Administration, 1990 Nationwide Personal Transportation
Survey: Summary of Travel Trends, FHWA-PL-92027, Washington, DC, March 1992, Figure 6. Data from 2009 NHTS were generated from the 2009 National Household Travel Survey website nhts.ornl.gov, March 2011. (Additional resources: www.fhwa.dot.gov, nhts.ornl.gov)

8–11
TRANSPORTATION ENERGY DATA BOOK: EDITION 36—2017
The 1990 household survey reports the highest average annual miles per vehicle and the 1983 survey reports the lowest. These data show that younger vehicles are typically driven more miles than older vehicles.
Table 8.8
Average Annual Miles per Household Vehicle by Vehicle Age
Vehicle age (years)
1983 self-reported
1990 self-reported
1995 self-reported
2001 self-reported
2009 self-reported
Under 1 8,200 19,600 15,900 15,500 13,200 1 15,200 16,800 16,800 14,300 14,600 2 16,800 16,600 15,500 14,000 13,900 3 14,500 14,700 14,400 13,100 12,700 4 13,000 13,600 14,100 12,500 12,600 5 12,100 12,900 13,500 12,000 12,800 6 11,300 13,200 13,200 11,800 12,100 7 10,000 12,400 12,800 11,600 11,900 8 9,800 12,600 12,200 10,900 11,500 9 9,000 11,500 12,200 10,800 11,300
10 and older 7,300 9,200 8,900 7,400 9,300 All household
vehicles 10,400 12,500 12,200 11,100 11,300 Note: Data include all household vehicles, and have been rounded to the nearest hundred. Sources: Nationwide Personal Transportation Study—1983: D. Klinger and J. Richard Kuzmyak, COMSIS Corporation,
Personal Travel in the United States, Volume 1: 1983–84 Nationwide Personal Travel Study, prepared for the U.S. Department of Transportation, Washington, DC, August 1986, Table 4-22, p. 4-21. 1990: Generated from the 1990 Nationwide Personal Transportation Study Public Use Tape, March 1992. 1995, 2001 and 2009: Generated from the 2009 NHTS datasets, version 2, February 2011. (Additional resources: nhts.ornl.gov)
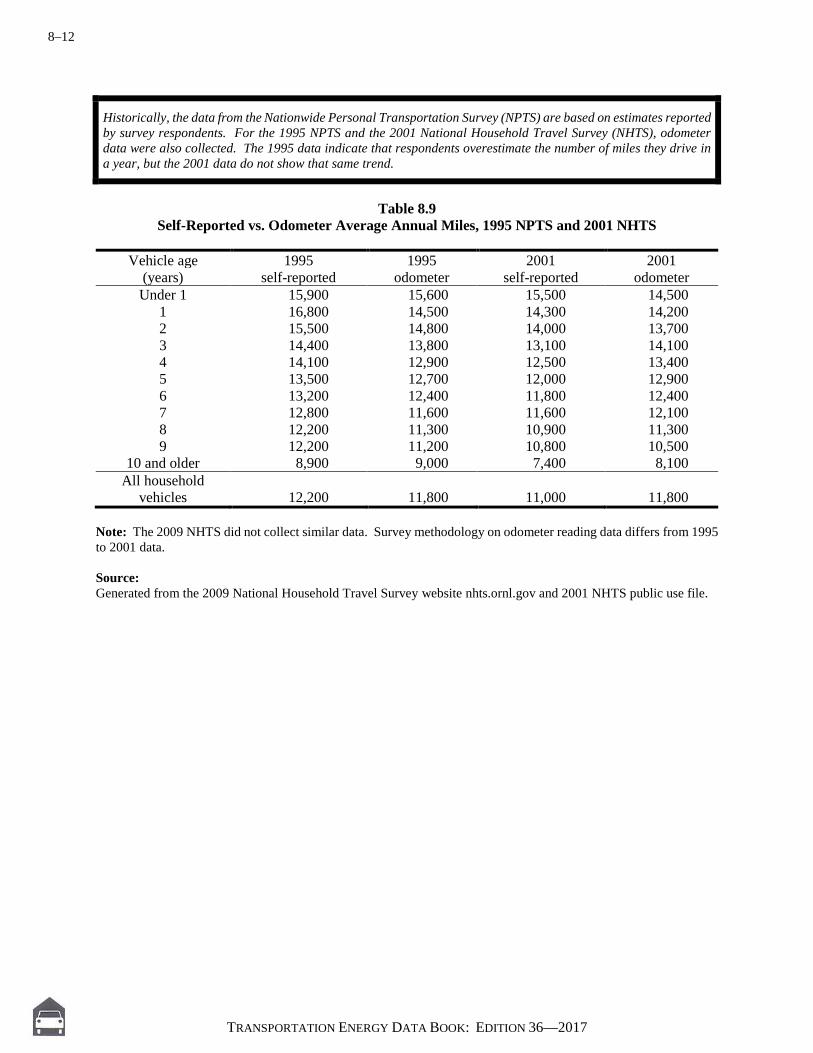
8–12
TRANSPORTATION ENERGY DATA BOOK: EDITION 36—2017
Historically, the data from the Nationwide Personal Transportation Survey (NPTS) are based on estimates reported by survey respondents. For the 1995 NPTS and the 2001 National Household Travel Survey (NHTS), odometer data were also collected. The 1995 data indicate that respondents overestimate the number of miles they drive in a year, but the 2001 data do not show that same trend.
Table 8.9
Self-Reported vs. Odometer Average Annual Miles, 1995 NPTS and 2001 NHTS
Vehicle age 1995 1995 2001 2001 (years) self-reported odometer self-reported odometer Under 1 15,900 15,600 15,500 14,500
1 16,800 14,500 14,300 14,200 2 15,500 14,800 14,000 13,700 3 14,400 13,800 13,100 14,100 4 14,100 12,900 12,500 13,400 5 13,500 12,700 12,000 12,900 6 13,200 12,400 11,800 12,400 7 12,800 11,600 11,600 12,100 8 12,200 11,300 10,900 11,300 9 12,200 11,200 10,800 10,500
10 and older 8,900 9,000 7,400 8,100 All household
vehicles 12,200 11,800 11,000 11,800 Note: The 2009 NHTS did not collect similar data. Survey methodology on odometer reading data differs from 1995 to 2001 data. Source: Generated from the 2009 National Household Travel Survey website nhts.ornl.gov and 2001 NHTS public use file.

8–13
TRANSPORTATION ENERGY DATA BOOK: EDITION 36—2017
Figure 8.3. Share of Vehicle Trips by Trip Distance, 2009 NHTS
Source: Generated from the 2009 National Household Travel Survey website nhts.ornl.gov.
Figure 8.4. Share of Vehicle Trips to Work by Trip Distance, 2009 NHTS
Source: Generated from the 2009 National Household Travel Survey website nhts.ornl.gov.

8–14
TRANSPORTATION ENERGY DATA BOOK: EDITION 36—2017
Nineteen percent of new vehicles (1-year-old and under) travel over 20,000 miles per year. Almost half of the vehicles over 20 years old travel less than 4,000 miles in a year.
Table 8.10
Share of Vehicles by Annual Miles of Travel and Vehicle Age, 2009 NHTS
Vehicle age (years) Annual vehicle miles of travel
1 and under 2 3 4 5 6 7
< 1,000 miles 2% 3% 3% 3% 3% 4% 3% 1 - 2,000 miles 2% 3% 2% 3% 3% 3% 3% 2 - 4,000 miles 5% 6% 7% 7% 6% 7% 9% 4 - 6,000 miles 7% 10% 9% 8% 8% 10% 10% 6 - 8,000 miles 10% 10% 11% 11% 10% 12% 12% 8 - 10,000 miles 11% 11% 11% 11% 11% 12% 12% 10 - 12,000 miles 9% 11% 11% 11% 12% 11% 11% 12 - 15,000 miles 16% 15% 14% 15% 15% 14% 13% 15 - 20,000 miles 18% 15% 17% 17% 16% 14% 14% 20 - 30,000 miles 13% 11% 12% 11% 11% 10% 9% >30,000 miles 6% 5% 4% 3% 4% 4% 3% All 100% 100% 100% 100% 100% 100% 100% Vehicle age (years) 8 9 10 11-15 16-20 Over 20 < 1,000 miles 4% 4% 4% 6% 9% 19% 1 - 2,000 miles 4% 4% 4% 5% 7% 8% 2 - 4,000 miles 9% 9% 10% 11% 16% 19% 4 - 6,000 miles 11% 12% 12% 14% 14% 14% 6 - 8,000 miles 12% 12% 11% 14% 13% 12% 8 - 10,000 miles 13% 11% 12% 12% 10% 7% 10 - 12,000 miles 11% 11% 11% 10% 8% 6% 12 - 15,000 miles 13% 13% 12% 10% 8% 5% 15 - 20,000 miles 12% 13% 14% 9% 7% 5% 20 - 30,000 miles 9% 8% 7% 7% 4% 3% >30,000 miles 3% 3% 3% 3% 2% 2% All 100% 100% 100% 100% 100% 100%
Source: Generated from the 2009 National Household Travel Survey website nhts.ornl.gov. (Additional resources:
nhts.ornl.gov)
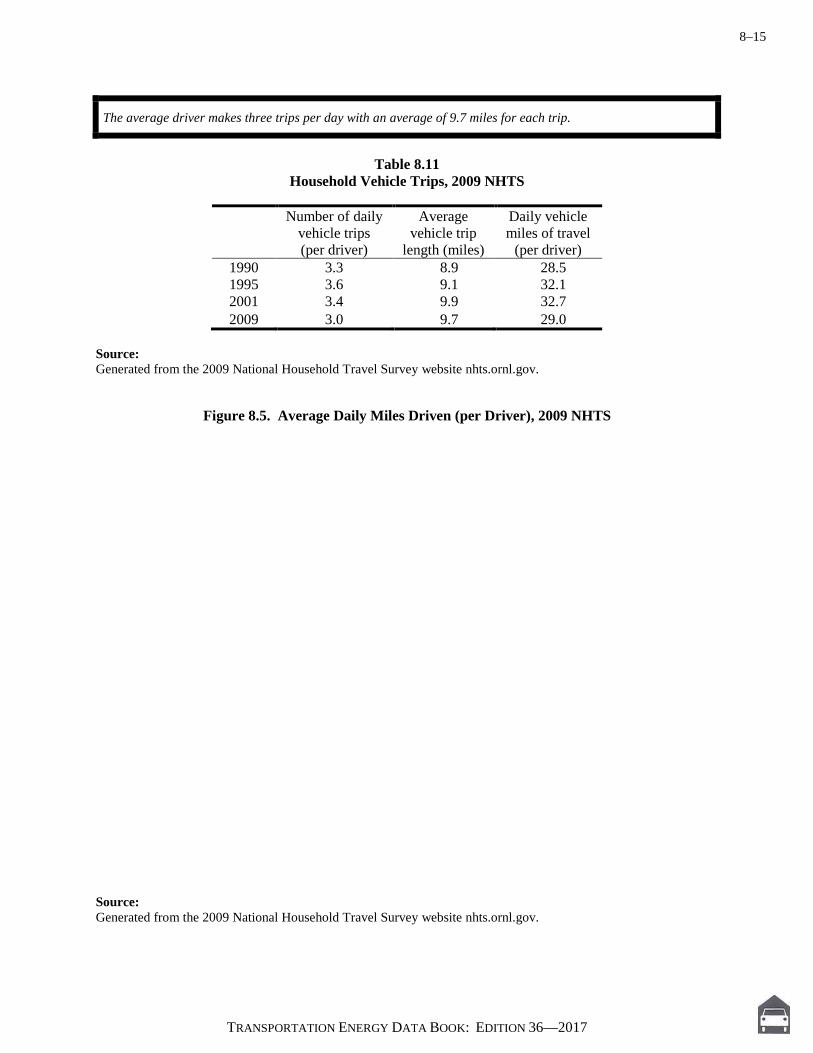
8–15
TRANSPORTATION ENERGY DATA BOOK: EDITION 36—2017
The average driver makes three trips per day with an average of 9.7 miles for each trip.
Table 8.11
Household Vehicle Trips, 2009 NHTS
Number of daily vehicle trips (per driver)
Average vehicle trip
length (miles)
Daily vehicle miles of travel
(per driver) 1990 3.3 8.9 28.5 1995 3.6 9.1 32.1 2001 3.4 9.9 32.7 2009 3.0 9.7 29.0
Source: Generated from the 2009 National Household Travel Survey website nhts.ornl.gov.
Figure 8.5. Average Daily Miles Driven (per Driver), 2009 NHTS
Source: Generated from the 2009 National Household Travel Survey website nhts.ornl.gov.

8–16
TRANSPORTATION ENERGY DATA BOOK: EDITION 36—2017
Table 8.12 Daily Vehicle Miles of Travel (per Vehicle) by Number of Vehicles
in the Household, 2009 NHTS
Daily miles per vehicle Number of household vehicles 2001 2009
1 25.6 29.1 2 27.5 32.7 3 24.2 31.3 4 23.0 30.2 5 21.1 27.6
More than 5 18.4 27.2 All 25.2 31.1
Source:
Generated from the 2009 National Household Travel Survey website nhts.ornl.gov.
Table 8.13 Daily and Annual Vehicle Miles of Travel and Average Age for
Each Vehicle in a Household, 2009 NHTS
Vehicle number Average
daily miles Average
annual miles Average age
(years) One-vehicle household
1 29.0 10,600 9.0 Two-vehicle household
1 43.6 15,900 7.6 2 21.4 7,800 9.0
Three-vehicle household 1 50.7 18,500 7.9 2 28.2 10,300 9.1 3 14.0 5,100 11.8
Four-vehicle household 1 56.2 20,500 8.5 2 33.2 12,100 8.8 3 20.3 7,400 11.4 4 9.9 3,600 13.2
Five-vehicle household 1 57.8 21,100 8.5 2 34.0 12,400 9.4 3 22.7 8,300 12.3 4 14.2 5,200 12.7 5 6.3 2,300 16.8
Six-vehicle household 1 61.4 22,400 10.2 2 38.1 13,900 9.8 3 26.3 9,600 12.2 4 17.5 6,400 12.5 5 10.4 3,800 14.5 6 4.4 1,600 17.9
Source:
Generated from the 2009 National Household Travel Survey website nhts.ornl.gov.
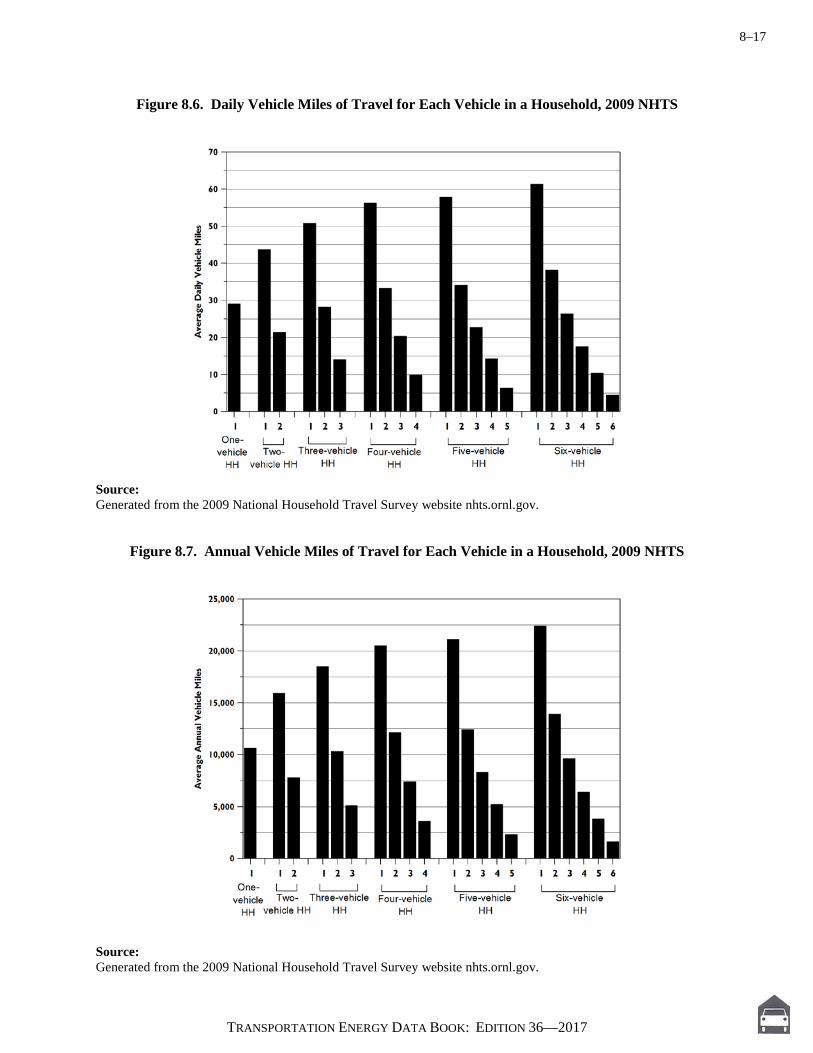
8–17
TRANSPORTATION ENERGY DATA BOOK: EDITION 36—2017
Figure 8.6. Daily Vehicle Miles of Travel for Each Vehicle in a Household, 2009 NHTS
Source: Generated from the 2009 National Household Travel Survey website nhts.ornl.gov.
Figure 8.7. Annual Vehicle Miles of Travel for Each Vehicle in a Household, 2009 NHTS
Source: Generated from the 2009 National Household Travel Survey website nhts.ornl.gov.

8–18
TRANSPORTATION ENERGY DATA BOOK: EDITION 36—2017
According to the U.S. Census data, the percentage of workers who car pooled has dropped from 19.7% in 1980 to 9.0% in 2015. The percent of workers using public transit declined from 6.4% to 5.3% in the ten-year period between 1980 and 1990, but stayed relatively the same from 1990 to 2014 (~5.0%). The average travel time increased by 4.2 minutes from 1980 to 2015. The American Community Survey (ACS) now collects journey-to-work data on an annual basis. It shows the average commute time as 25.9 minutes in 2015.
Table 8.14
Means of Transportation to Work, 1980, 1990, 2000, and 2015
1980 Census 1990 Census 2000 Census 2015 ACS
Means of transportation
Number of workers
(thousands) Share
Number of workers
(thousands) Share
Number of workers
(thousands) Share
Number of workers
(thousands)
Share Private vehicle 81,258 84.1% 99,593 86.5% 112,737 87.9% 126,924 85.6% Drove alone 62,193 64.4% 84,215 73.2% 97,102 75.7% 113,576 76.6% Car pooled 19,065 19.7% 15,378 13.4% 15,635 12.2% 13,348 9.0% Public transportation 6,175 6.4% 6,068 5.3% 6,068 4.7% 7,949 5.4% Bus or trolley busa 3,925 4.1% 3,445 3.0% 3,207 2.5% 3,882 2.6% Streetcar or trolley cara b b 78 0.1% 73 0.1% 89 0.1% Subway or elevated 1,529 1.6% 1,755 1.5% 1,886 1.5% 2,851 1.9% Railroad 554 0.6% 574 0.5% 658 0.5% 881 0.6% Ferryboat b b 37 0.0% 44 0.0% 59 0.0% Taxicab 167 0.2% 179 0.2% 200 0.2% 188 0.1% Motorcycle 419 0.4% 237 0.2% 142 0.1% 266 0.2% Bicycle 468 0.5% 467 0.4% 488 0.4% 885 0.6% Walked only 5,413 5.6% 4,489 3.9% 3,759 2.9% 4,114 2.8% Other means 703 0.7% 809 0.7% 901 0.7% 1,343 0.9% Worked at home 2,180 2.3% 3,406 3.0% 4,184 3.3% 6,843 4.6% Total workers 96,616 100.0% 115,069 100.0% 128,279 100.0% 148,324 100.0% Average travel time (minutes) 21.7 22.4 25.5 25.9
Sources: 1980-1990 data – Provided by the Journey-to-Work and Migration Statistics Branch, Population Division, U.S. Bureau
of the Census. 2000 data – U.S. Bureau of the Census, Journey to Work: 2000, Tables 1 and 2, 1990-2000, March 2004
(www.census.gov/population/www/socdemo/journey.html). 2015 data – U.S. Bureau of the Census, 2009-2015 American Community Survey Five-Year Estimates, Tables B08301
and GCT0801. (Additional resources: www.census.gov) a This category was "Bus or streetcar" in 1980. b Data are not available.

8–19
TRANSPORTATION ENERGY DATA BOOK: EDITION 36—2017
Table 8.15 Characteristics of U.S. Daily per Vehicle Driving vs. Dwelling Unit Type and Density
Share of vehicles in
density type
Hours per vehicle per day
Average vehicle speed
(miles/hour)
Miles per vehicle
per day All classes detached single house 77.0% 0.92 32.0 29.6 All classes other 23.0% 0.99 27.7 27.4 <1,000/sq. mile detached single house 81.6% 0.91 34.7 31.6 <1,000/sq. mile all other 18.4% 0.91 32.5 29.5 1,000-4,000/sq. mile detached single house 75.5% 0.94 27.5 26.0 1,000-4,000/sq. mile all other 24.5% 1.03 25.1 25.9 4,000-10,000/sq. mile detached single house 42.5% 0.96 26.1 25.1 4,000-10,000/sq. mile all other 57.5% 1.15 21.5 24.6 10,000-25,000/sq. mile detached single house 17.8% 1.02 18.2 18.5 10,000-25,000/sq. mile all other 82.2% 1.05 21.3 22.3 >25,000/sq. mile detached single house 9.8% 0.72 20.5 14.8 >25,000/sq. mile all other 90.2% 1.23 21.9 26.9
Source: Generated from the 2009 National Household Travel Survey website nhts.ornl.gov.
Table 8.16
Housing Unit Characteristics, 2015
Share of occupied
housing units Percent with
garage or carport Type of housing unit New construction (< = 4 years) 3.2% 70.8% Manufactured/mobile homes 5.9% 33.0% Geographic location (Census Region) Northeast 18.1% 49.3% Midwest 22.3% 71.9% South 37.2% 56.0% West 22.4% 76.3% Tenure Owner 62.7% 78.3% Renter 37.3% 36.8% All occupied units 118,290 units 62.9%
Note: The American Housing Survey is updated every two years. The 2015 data are the latest available. Source: U.S. Bureau of the Census, 2015 American Housing Survey, Table Creator, accessed July 28, 2017.
(Additional information: www.census.gov/programs-surveys/ahs)
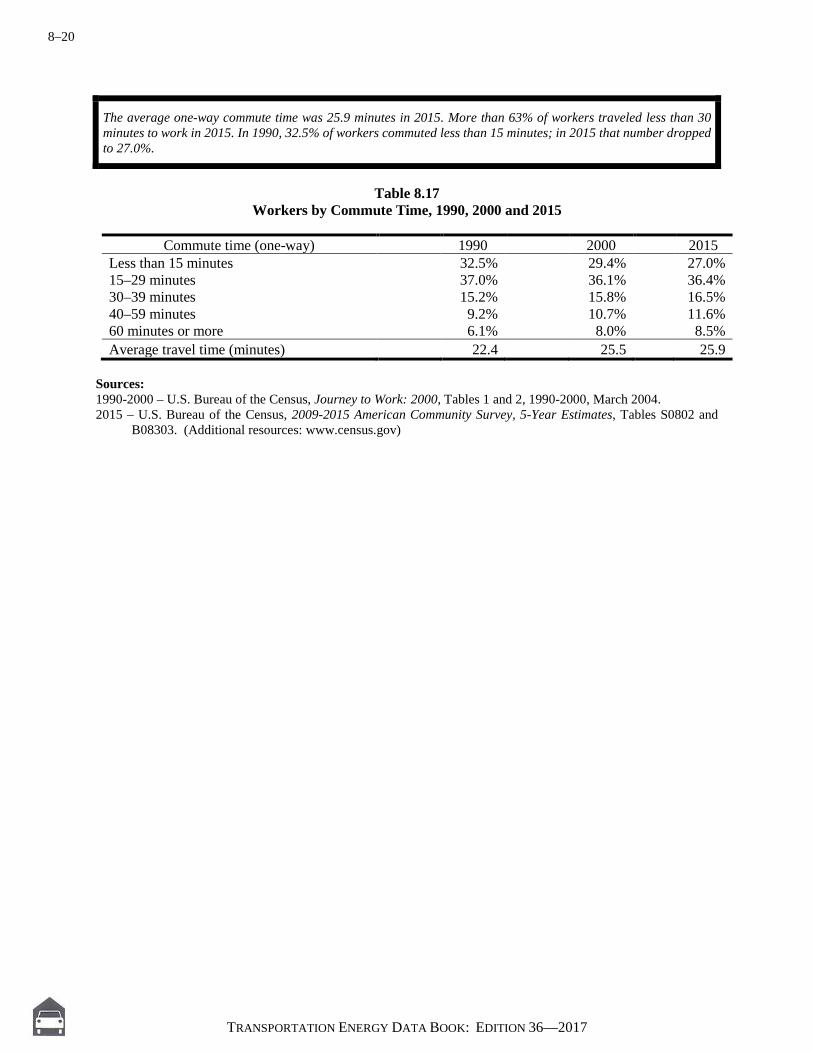
8–20
TRANSPORTATION ENERGY DATA BOOK: EDITION 36—2017
The average one-way commute time was 25.9 minutes in 2015. More than 63% of workers traveled less than 30 minutes to work in 2015. In 1990, 32.5% of workers commuted less than 15 minutes; in 2015 that number dropped to 27.0%.
Table 8.17
Workers by Commute Time, 1990, 2000 and 2015
Commute time (one-way) 1990 2000 2015 Less than 15 minutes 32.5% 29.4% 27.0% 15–29 minutes 37.0% 36.1% 36.4% 30–39 minutes 15.2% 15.8% 16.5% 40–59 minutes 9.2% 10.7% 11.6% 60 minutes or more 6.1% 8.0% 8.5% Average travel time (minutes) 22.4 25.5 25.9
Sources: 1990-2000 – U.S. Bureau of the Census, Journey to Work: 2000, Tables 1 and 2, 1990-2000, March 2004. 2015 – U.S. Bureau of the Census, 2009-2015 American Community Survey, 5-Year Estimates, Tables S0802 and
B08303. (Additional resources: www.census.gov)

8–21
TRANSPORTATION ENERGY DATA BOOK: EDITION 36—2017
Sales of bicycles with wheel sizes of 20 inches and over have grown at an average annual rate of 1.0% from 1981 to 2015. Bicycle sales experienced a large decline in 2009, which brought total sales to 14.9 million—a new low in the 18-year series. Sales in 2015 were 17.4 million.
Table 8.18
Bicycle Sales, 1981–2015 (millions)
Wheel sizes under 20 inches
Wheel sizes of 20 inches and
over All
wheel sizes 1981 a 8.9 a 1982 a 6.8 a 1983 a 9.0 a 1984 a 10.1 a 1985 a 11.4 a 1986 a 12.3 a 1987 a 12.6 a 1988 a 9.9 a 1989 a 10.7 a 1990 a 10.8 a 1991 a 11.6 a 1992 3.7 11.6 15.3 1993 3.8 13.0 16.8 1994 4.2 12.5 16.7 1995 4.1 12.0 16.1 1996 4.5 10.9 15.4 1997 4.2 11.0 15.2 1998 4.7 11.1 15.8 1999 5.9 11.6 17.5 2000 9.0 11.9 20.9 2001 5.4 11.3 16.7 2002 5.9 13.6 19.5 2003 5.6 12.9 18.5 2004 5.3 13.0 18.3 2005 5.8 14.0 19.8 2006 5.5 12.7 18.2 2007 5.4 12.8 18.2 2008 5.1 13.4 18.5 2009 4.7 10.2 14.9 2010 6.3 13.5 19.8 2011 4.7 11.0 15.7 2012 5.7 13.0 18.7 2013 4.9 11.3 16.2 2014 5.6 12.4 18.0
2015b 4.9 12.5 17.4 Average annual percentage change
1981–2015 a 1.0% a 2005–2015 -1.7% -1.1% -1.3%
Source: 1981–1996: Bicycle Manufacturers Association. 1997–on: National Bicycle Dealers Association. (Additional
resources: www.nbda.com) a Data are not available. b Latest year available.

8–22
TRANSPORTATION ENERGY DATA BOOK: EDITION 36—2017
In 2009, 4.5% of walk trips and 10.9% of bike trips were to/from work. Forty-seven percent of all bike trips were for social/recreational purposes. Nearly 15% of walk trips were shopping trips.
Figure 8.8. Walk and Bike Trips by Trip Purpose,
2009 NHTS
Note: Percentages may not sum to totals due to rounding. Source: Generated from the 2009 National Household Travel Survey website nhts.ornl.gov.

8–23
TRANSPORTATION ENERGY DATA BOOK: EDITION 36—2017
After 2001 only data on daily trips were collected in the NHTS. The 2001 data are still the latest available on long-distance trips.
Long Distance Trips – 2001 National Household Travel Survey
The 2001 National Household Travel Survey (NHTS) collected data on long-distance trips as well as
everyday travel. The everyday travel data is a continuation of the Nationwide Personal Transportation
Survey (NPTS), while the long-distance travel data is a continuation of the American Travel Survey (ATS)
which was collected in 1977 and 1985. The survey collected trip-related data such as mode of
transportation, duration, distance and purpose of trip. It also gathered demographic, geographic, and
economic data for analysis purposes.
A long-distance trip is defined as a trip of 50 miles or more, one-way. Long-trip data from the 2001
NHTS were released in the summer of 2004. For additional information about the 2001 NHTS data, contact
the Bureau of Transportation Statistics at 202-366-3282 or visit the following website: nhts.ornl.gov.

8–24
TRANSPORTATION ENERGY DATA BOOK: EDITION 36—2017
Table 8.19 Long-Distance Tripa Characteristics, 2001 NHTS
Person trips Person miles
Trip characteristic (thousands) (percent) (thousands) (percent) Total 2,554,068 100.0 1,138,322,697 100.0 Principal means of transportation: Personal use vehicles 2,310,376 90.5 735,882,255 64.7 Airplane 165,039 6.5 367,888,741 32.3 Commercial airplane 158,880 6.2 361,717,015 31.8 Busb 52,962 2.1 23,747,433 2.1 Intercity bus 3,456 0.1 1,765,696 0.2 Charter, tour, or school bus 45,952 1.8 21,019,942 1.9 Train 20,672 0.8 9,266,373 0.8 Round trip distance: 100 to 300 miles 1,688,358 66.1 284,586,370 25.0 300 to 499 miles 373,550 14.6 143,571,597 12.6 500 to 999 miles 261,802 10.3 180,669,482 15.9 1,000 to 1,999 miles 125,665 4.9 178,629,838 15.7 2,000 miles or more 104,694 4.1 350,865,409 30.8 Mean (miles) 446 c c c Median (miles) 206 c c c Calendar quarter: 1st quarter 566,502 22.2 246,556,190 21.7 2nd quarter 653,310 25.6 298,154,812 26.2 3rd quarter 734,878 28.8 341,021,290 30.0 4th quarter 599,378 23.5 252,590,405 22.2 Main purpose of trip: Commuting 329,395 12.9 65,877,968 5.8 Other business 405,866 15.9 242,353,212 21.3 Personal/leisure 1,406,411 55.1 667,471,358 58.7 Personal business 322,645 12.6 130,020,982 11.4 Other 88,230 3.5 32,031,679 2.8 Nights away from home: None 1,454,847 57.0 304,469,524 26.8 1 to 3 nights 808,281 31.7 414,219,147 36.4 4 to 7 nights 214,464 8.4 269,265,597 23.7 8 or more nights 76,475 3.0 150,368,429 13.2 Destination: Within Census division 2,077,810 81.4 549,651,116 48.3 Across Census division, within Census 196,890 7.7 134,930,113 11.9 Across Census region 279,367 10.9 453,741,468 39.9
Note: Long-distance trips were not included in the 2009 NHTS. Source: U.S. Bureau of Transportation Statistics and the U.S. Federal Highway Administration, 2001 National Household
Transportation Survey. (Additional resources: nhts.ornl.gov) a A long-distance trip is defined as a trip of 50 miles or more, one-way. b Includes other types of buses. c Not applicable.
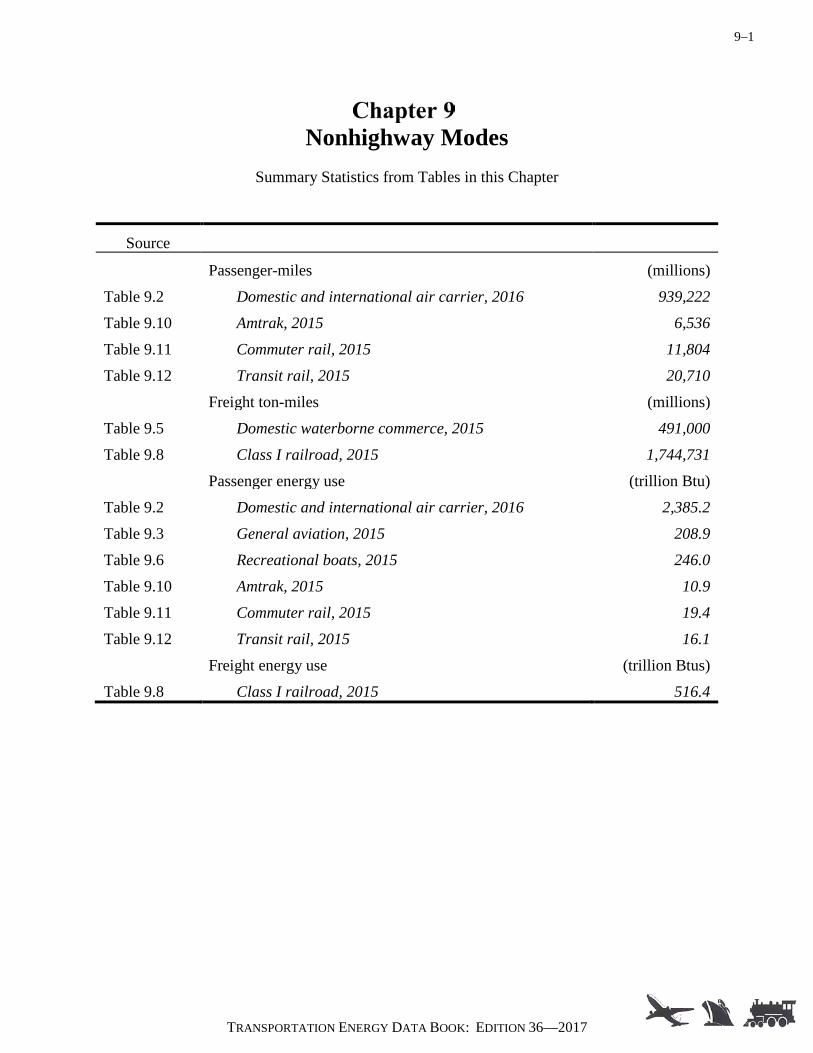
9–1
TRANSPORTATION ENERGY DATA BOOK: EDITION 36—2017
Nonhighway Modes
Summary Statistics from Tables in this Chapter
Source
Passenger-miles (millions) Table 9.2 Domestic and international air carrier, 2016 939,222 Table 9.10 Amtrak, 2015 6,536 Table 9.11 Commuter rail, 2015 11,804 Table 9.12 Transit rail, 2015 20,710 Freight ton-miles (millions) Table 9.5 Domestic waterborne commerce, 2015 491,000 Table 9.8 Class I railroad, 2015 1,744,731 Passenger energy use (trillion Btu) Table 9.2 Domestic and international air carrier, 2016 2,385.2 Table 9.3 General aviation, 2015 208.9 Table 9.6 Recreational boats, 2015 246.0 Table 9.10 Amtrak, 2015 10.9 Table 9.11 Commuter rail, 2015 19.4 Table 9.12 Transit rail, 2015 16.1 Freight energy use (trillion Btus) Table 9.8 Class I railroad, 2015 516.4

9–2
TRANSPORTATION ENERGY DATA BOOK: EDITION 36—2017
Nonhighway transportation modes accounted for 18.0% of total transportation energy use in 2015.
Table 9.1
Nonhighway Energy Use Shares, 1970–2015
Share of transportation energy use Nonhighway Transportation
Year Air Water Pipeline Rail total total (trillion Btu) a
1970 8.5% 5.5% 5.4% 3.5% 22.9% 15,192 1971 8.2% 4.9% 5.4% 3.4% 21.8% 15,819 1972 7.8% 4.7% 5.2% 3.3% 21.0% 16,845 1973 7.7% 5.1% 4.7% 3.3% 20.8% 17,670 1974 7.2% 5.2% 4.5% 3.5% 20.5% 16,968 1975 7.2% 5.4% 4.0% 3.1% 19.7% 17,204 1976 7.0% 5.9% 3.5% 3.1% 19.6% 18,266 1977 7.1% 6.2% 3.3% 3.0% 19.7% 18,951 1978 7.1% 6.9% 3.1% 2.9% 20.1% 19,922 1979 7.6% 5.9% 3.6% 3.0% 20.2% 19,473 1980 7.6% 7.4% 3.9% 3.0% 22.0% 18,760 1981 7.8% 6.8% 4.0% 2.9% 21.6% 18,558 1982 8.0% 5.9% 3.8% 2.5% 20.3% 18,055 1983 7.9% 5.4% 3.2% 2.5% 19.0% 18,188 1984 8.6% 5.1% 3.3% 2.7% 19.7% 18,773 1985 8.8% 4.6% 3.1% 2.5% 19.0% 19,017 1986 9.1% 6.6% 2.9% 2.3% 20.8% 20,086 1987 9.2% 6.7% 3.0% 2.3% 21.2% 20,578 1988 9.4% 6.7% 3.4% 2.3% 21.7% 21,131 1989 9.2% 7.1% 3.4% 2.2% 21.9% 21,487 1990 9.6% 6.7% 3.6% 2.2% 22.1% 21,383 1991 9.1% 7.3% 3.3% 2.1% 21.8% 20,985 1992 9.0% 7.4% 3.2% 2.1% 21.6% 21,646 1993 9.0% 6.5% 3.3% 2.1% 20.9% 22,125 1994 9.1% 6.1% 3.5% 2.2% 20.9% 22,729 1995 9.2% 6.3% 3.5% 2.2% 21.2% 23,263 1996 9.3% 5.9% 3.4% 2.3% 20.9% 23,773 1997 9.5% 5.2% 3.5% 2.2% 20.5% 24,126 1998 9.3% 5.0% 3.0% 2.2% 19.5% 24,461 1999 9.6% 5.3% 2.9% 2.2% 20.0% 25,758 2000 9.8% 5.6% 2.8% 2.1% 20.4% 26,069 2001 9.3% 4.6% 2.8% 2.2% 18.9% 25,741 2002 8.5% 4.7% 2.9% 2.1% 18.3% 26,331 2003 8.5% 4.0% 2.6% 2.2% 17.3% 26,512 2004 9.1% 4.8% 2.5% 2.3% 18.6% 26,970 2005 9.2% 5.0% 2.5% 2.2% 19.0% 27,377 2006 9.1% 5.3% 2.5% 2.3% 19.1% 27,554 2007 8.6% 5.4% 2.5% 2.1% 18.6% 29,013 2008 8.4% 5.1% 2.6% 2.1% 18.3% 28,381 2009 7.9% 5.0% 2.9% 1.8% 17.6% 26,895 2010 8.0% 5.5% 2.9% 2.0% 18.3% 26,974 2011 8.2% 5.3% 3.0% 2.1% 18.6% 26,388 2012 8.0% 4.5% 3.2% 2.1% 17.9% 26,001 2013 7.9% 4.1% 3.6% 2.2% 17.7% 25,905 2014 7.9% 3.5% 3.1% 2.2% 16.7% 26,109 2015 8.2% 4.0% 3.0% 2.2% 17.4% 25,880
Source: See Appendix A, Section 2.3. Nonhighway Energy Use. a Only end-use energy was counted for electricity. Previous editions included primary energy use for electricity which included generation and distribution losses.

9–3
TRANSPORTATION ENERGY DATA BOOK: EDITION 36—2017
These data include ALL international and domestic certificated route air carrier statistics; therefore, the data are different than those in Chapter 2. Revenue aircraft-miles, passenger-miles, and seat-miles began to rise in 2010. Passenger load factor was 83.0% in 2016.
Table 9.2
Summary Statistics for U.S. Domestic and International Certificated Route Air Carriers (Combined Totals), 1970–2016a
Year
Revenue aircraft-
miles (millions)
Revenue passenger-miles
(millions)
Available seat-miles (millions)
Available seats per aircraftb
Passenger load factor
(percentage)c
Revenue cargo ton-miles (millions)
Energy use (trillion Btu)d
1970 2,542 148,137 264,904 104 55.9% 3,755 1,363.4 1975 2,241 173,324 315,823 141 54.9% 5,062 1,283.4 1980 2,924 267,722 448,479 153 59.7% 7,885 1,386.0 1985 3,462 351,073 565,677 163 62.1% 9,048 1,701.4 1990 4,724 472,236 753,211 159 62.7% 16,403 2,180.2 1995 5,627 558,794 832,081 148 67.2% 23,375 2,338.6 1996 5,855 596,164 859,721 147 69.3% 24,892 2,409.1 1997 6,025 620,029 880,715 146 70.4% 27,610 2,513.6 1998 6,220 634,933 899,029 145 70.6% 28,015 2,459.5 1999 6,558 668,626 942,311 144 71.0% 25,147 2,665.0 2000 6,946 708,926 981,080 141 72.3% 30,221 2,750.4 2001 6,814 664,849 950,519 139 69.9% 27,882 2,592.5 2002 6,834 655,215 913,898 134 71.7% 30,507 2,430.1 2003 7,367 674,160 922,440 125 73.1% 32,446 2,470.6 2004 7,479 752,341 1,000,193 134 75.2% 37,958 2,657.2 2005 7,716 795,117 1,029,316 133 77.2% 39,286 2,693.3 2006 8,220 810,086 1,027,526 125 78.8% 38,251 2,661.1 2007 8,415 842,007 1,060,093 126 79.4% 38,433 2,684.6 2008 8,142 823,783 1,040,840 128 79.1% 35,227 2,547.8 2009 7,534 779,997 975,307 129 80.0% 30,317 2,303.2 2010 7,666 809,051 991,934 129 81.6% 35,209 2,335.3 2011 7,783 825,916 1,012,597 130 81.6% 35,713 2,370.3 2012 7,727 832,733 1,012,261 131 82.3% 34,937 2,287.7 2013 7,725 848,000 1,025,616 133 82.7% 33,561 2,271.3 2014 7,740 869,688 1,048,107 135 83.0% 34,471 2,265.3 2015 7,877 908,794 1,090,198 138 83.4% 35,011 2,342.1 2016 8,076 939,222 1,131,912 140 83.0% 35,912 2,385.2
Average annual percentage change 1970–2016 2.5% 4.1% 3.2% 0.6% 5.0% 1.2% 2006–2016 -0.2% 1.5% 1.0% 1.1% -0.6% -1.1% Sources: U.S. Department of Transportation, Bureau of Transportation Statistics, www.transtats.bts.gov. (Additional
resources: www.rita.dot.gov/bts) 1970–76 Energy Use – Department of Transportation, Civil Aeronautics Board, Fuel Cost and Consumption,
Washington, DC, 1981, and annual. a Data are for all U.S. air carriers reporting on Form 41. b Available seats per aircraft is calculated as the ratio of available seat-miles to revenue aircraft-miles. c Passenger load factor is calculated as the ratio of revenue passenger-miles to available seat-miles for scheduled and nonscheduled services. d Energy use includes fuel purchased abroad for international flights.

9–4
TRANSPORTATION ENERGY DATA BOOK: EDITION 36—2017
General aviation includes: (1) aircraft operating under general operating and flight rules; (2) not-for-hire airplanes with a seating capacity of 20 or more or a maximum payload capacity of 6,000 lbs. or more; (3) rotorcraft external load operations; (4) on-demand and commuter operations not covered under Federal Aviation Regulations Part 121; and (5) agricultural aircraft operations.
Table 9.3
Summary Statistics for General Aviation, 1970–2015
Calendar year Total number of aircraft Aircraft hours flown
(thousands) Energy use (trillion Btu) 1970 131,700a 26,030b 94.3 1975 168,475 30,298 110.7 1980 211,045 41,016 165.9 1985 196,500 31,456 143.9 1986 205,300 31,782 147.9 1987 202,700 30,883 139.1 1988 196,200 31,114 148.5 1989 205,000 32,332 134.1 1990 198,000 32,096 131.8 1991 196,874 29,862 120.0 1992 185,650 26,747 103.7 1993 177,120 24,455 93.6 1994 172,935 24,092 95.3 1995 188,089 26,612 106.6 1996 191,129 26,909 111.0 1997 192,414 27,713 121.1 1998 204,710 28,100 147.4 1999 219,464 31,231 172.1 2000 217,533 29,960 175.2 2001 211,446 27,017 165.1 2002 211,244 27,040 141.5 2003 209,708 27,329 141.4 2004 219,426 28,126 175.9 2005 224,352 26,982 242.4 2006 221,943 27,705 256.3 2007 231,607 27,852 243.6 2008 228,663 26,009 265.7 2009 223,877 23,763 210.3 2010 223,370 24,802 221.2 2011 220,770 24,570 227.1 2012 209,034 24,403 228.8 2013 199,927 22,876 203.6 2014 204,408 23,271 221.0 2015 210,030 24,142 208.9
Average annual percentage change 1970–2015 1.0% -0.2% 1.8% 2005–2015 -0.7% -1.1% -1.5%
Sources: U.S. Department of Transportation, Federal Aviation Administration, General Aviation and Part 135 Activity
Surveys, CY 2015, Tables 1.1, 1.4, 5.1, and annual. 2011 Data: Aviation Forecasts, Tables 28 and 29, May 2013. (Additional resources: www.faa.gov/data-research/aviation_data_statistics/general_aviation)
a Active fixed-wing general aviation aircraft only. b Includes rotorcraft.
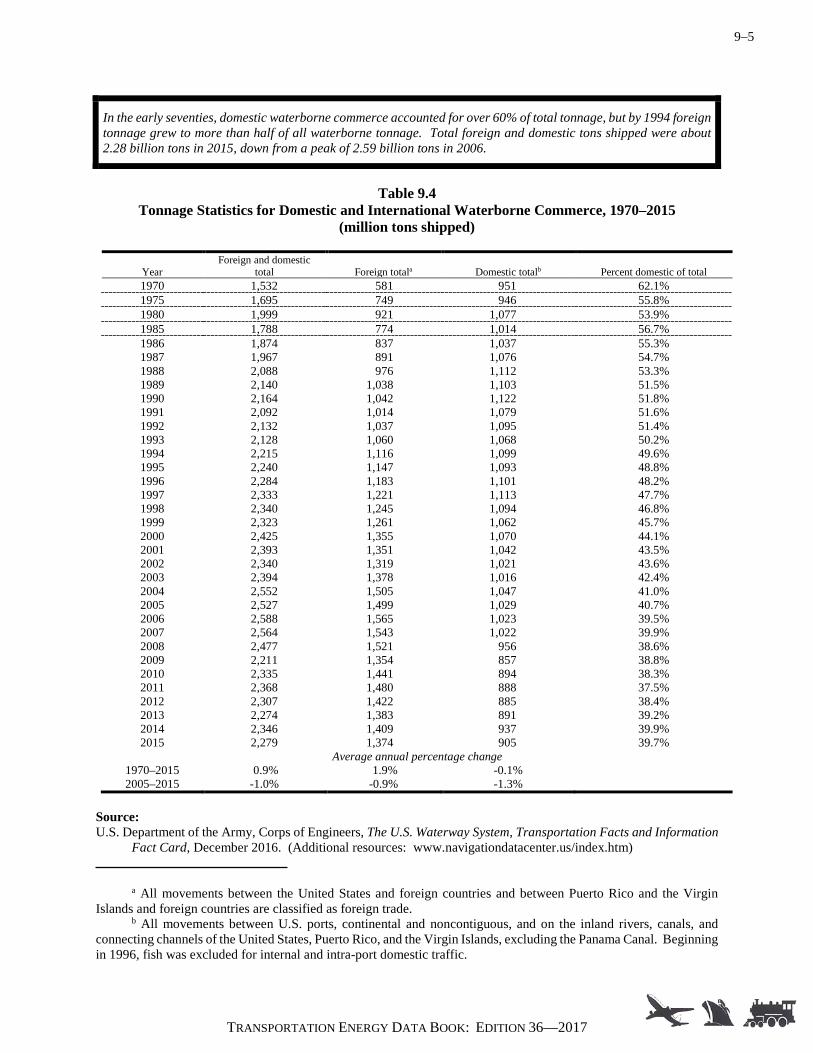
9–5
TRANSPORTATION ENERGY DATA BOOK: EDITION 36—2017
In the early seventies, domestic waterborne commerce accounted for over 60% of total tonnage, but by 1994 foreign tonnage grew to more than half of all waterborne tonnage. Total foreign and domestic tons shipped were about 2.28 billion tons in 2015, down from a peak of 2.59 billion tons in 2006.
Table 9.4
Tonnage Statistics for Domestic and International Waterborne Commerce, 1970–2015 (million tons shipped)
Year Foreign and domestic
total Foreign totala Domestic totalb Percent domestic of total 1970 1,532 581 951 62.1% 1975 1,695 749 946 55.8% 1980 1,999 921 1,077 53.9% 1985 1,788 774 1,014 56.7% 1986 1,874 837 1,037 55.3% 1987 1,967 891 1,076 54.7% 1988 2,088 976 1,112 53.3% 1989 2,140 1,038 1,103 51.5% 1990 2,164 1,042 1,122 51.8% 1991 2,092 1,014 1,079 51.6% 1992 2,132 1,037 1,095 51.4% 1993 2,128 1,060 1,068 50.2% 1994 2,215 1,116 1,099 49.6% 1995 2,240 1,147 1,093 48.8% 1996 2,284 1,183 1,101 48.2% 1997 2,333 1,221 1,113 47.7% 1998 2,340 1,245 1,094 46.8% 1999 2,323 1,261 1,062 45.7% 2000 2,425 1,355 1,070 44.1% 2001 2,393 1,351 1,042 43.5% 2002 2,340 1,319 1,021 43.6% 2003 2,394 1,378 1,016 42.4% 2004 2,552 1,505 1,047 41.0% 2005 2,527 1,499 1,029 40.7% 2006 2,588 1,565 1,023 39.5% 2007 2,564 1,543 1,022 39.9% 2008 2,477 1,521 956 38.6% 2009 2,211 1,354 857 38.8% 2010 2,335 1,441 894 38.3% 2011 2,368 1,480 888 37.5% 2012 2,307 1,422 885 38.4% 2013 2,274 1,383 891 39.2% 2014 2,346 1,409 937 39.9% 2015 2,279 1,374 905 39.7%
Average annual percentage change 1970–2015 0.9% 1.9% -0.1% 2005–2015 -1.0% -0.9% -1.3%
Source: U.S. Department of the Army, Corps of Engineers, The U.S. Waterway System, Transportation Facts and Information
Fact Card, December 2016. (Additional resources: www.navigationdatacenter.us/index.htm) a All movements between the United States and foreign countries and between Puerto Rico and the Virgin Islands and foreign countries are classified as foreign trade. b All movements between U.S. ports, continental and noncontiguous, and on the inland rivers, canals, and connecting channels of the United States, Puerto Rico, and the Virgin Islands, excluding the Panama Canal. Beginning in 1996, fish was excluded for internal and intra-port domestic traffic.

9–6
TRANSPORTATION ENERGY DATA BOOK: EDITION 36—2017
The U.S. Army Corps of Engineers Navigation Data Center collects a wealth of waterborne commerce data. Energy use data, however, have never been collected as part of this effort. The energy use data collected by the Energy Information Administration (EIA) on vessel bunkering was formerly displayed on this table. The EIA data include different uses of fuel, not just fuel for domestic waterborne commerce; therefore it was misleading to display those data together.
Table 9.5
Summary Statistics for Domestic Waterborne Commerce, 1970–2015
Year Number of vesselsa Ton-miles (billions) Tons shippedb (millions)
Average length of haul (miles)
1970 25,832 596 949 628.2 1975 31,666 566 944 599.9 1980 38,792 922 1,074 856.4 1985 41,672 893 1,011 883.5 1990 41,119 834 1,118 745.7 1995 39,445 808 1,086 743.6 1996 41,104 765 1,093 699.4 1997 41,419 707 1,106 639.5 1998 42,032 673 1,087 619.0 1999 41,766 656 1,056 621.1 2000 39,641 646 1,064 606.8 2001 41,588 622 1,037 599.7 2002 41,002 612 1,016 602.5 2003 39,983 606 1,010 600.3 2004 40,290 621 1,042 596.4 2005 41,354 591 1,024 577.4 2006 41,109 562 1,018 548.7 2007 40,695 553 1,016 544.2 2008 40,301 521 952 546.7 2009 40,109 477 852 559.7 2010 40,512 503 894 562.8 2011 40,521 500 888 563.5 2012 40,530 475 885 536.5 2013 39,999 465 891 521.8 2014 40,082 505 937 538.4 2015 40,555 491 905 542.2
Average annual percentage change 1970–2015 1.0% -0.4% -0.1% -0.3% 2005–2015 -0.2% -1.8% -1.2% -0.6%
Sources: Number of vessels 1970–92, 1995–2010 – U.S. Department of the Army, Corps of Engineers, Waterborne
Transportation Lines of the United States, 2011, New Orleans, LA, 2012, Table 2, p. 6, and annual. 1993–94 – U.S. Department of the Army, Corps of Engineers, The U.S. Waterway System-Facts, Navigation Data Center, New Orleans, Louisiana, January 1996.
Ton-miles, tons shipped, average length of haul – U.S. Department of the Army, Corps of Engineers, Waterborne Commerce of the United States, Calendar Year 2011, Part 5: National Summaries, New Orleans, LA, 2012, Table 1-4, pp. 1-6, 1-7, and annual. (Additional resources: www.navigationdatacenter.us/index.htm)
Number of vessels, ton-miles, tons shipped and average length of haul, 2011-2015 – U.S. Department of the Army, Corps of Engineers, The U.S. Waterway System, Transportation Facts and Information Fact Card, December 2016.
a Grand total for self-propelled and non-self-propelled. b These figures are not consistent with the figures on Table 9.4 because intra-territory tons are not included in this table. Intra-territory traffic is traffic between ports in Puerto Rico and the Virgin Islands.

9–7
TRANSPORTATION ENERGY DATA BOOK: EDITION 36—2017
The data displayed in this table come from the Environmental Protection Agency’s MOVES2014a model.
Table 9.6
Recreational Boat Energy Use, 1970–2015
Number of boats Diesel fuel Gasoline Total energy use Year (thousands) (trillion Btu) 1970 10,087 5.5 151.7 157.2 1975 10,337 10.7 156.4 167.1 1976 10,387 11.8 157.4 169.1 1977 10,437 12.8 158.3 171.1 1978 10,487 13.9 159.3 173.1 1979 10,537 14.9 160.2 175.1 1980 10,587 16.0 161.2 177.1 1981 10,637 17.0 162.1 179.1 1982 10,687 18.0 163.1 181.1 1983 10,737 19.1 164.0 183.1 1984 10,787 20.1 165.0 185.1 1985 10,837 21.2 165.9 187.1 1986 10,887 22.2 166.9 189.1 1987 10,937 23.3 167.8 191.1 1988 11,030 24.3 170.4 194.7 1989 11,122 25.4 172.9 198.3 1990 11,215 26.4 175.4 201.8 1991 11,327 27.5 178.7 206.2 1992 11,440 28.5 182.0 210.5 1993 11,553 29.5 185.3 214.8 1994 11,770 30.6 192.5 223.1 1995 11,988 31.6 199.7 231.3 1996 12,206 32.7 206.8 239.5 1997 12,244 33.7 207.2 240.9 1998 12,283 34.8 207.4 242.2 1999 12,321 35.8 207.1 243.0 2000 12,359 36.8 206.6 243.4 2001 12,464 37.9 206.9 244.9 2002 12,568 39.0 206.7 245.7 2003 12,673 40.2 206.0 246.2 2004 12,777 41.3 205.0 246.2 2005 12,882 42.4 203.7 246.1 2006 12,984 43.5 202.5 245.9 2007 13,086 44.6 201.2 245.8 2008 13,189 45.7 200.0 245.7 2009 13,291 46.8 198.8 245.6 2010 13,393 47.9 197.3 245.2 2011 13,497 49.0 195.9 244.9 2012 13,602 50.1 194.7 244.8 2013 13,707 51.2 193.8 245.0 2014 13,811 52.3 193.1 245.4 2015 13,916 53.4 192.6 246.0
Average annual percentage change 1970–2015 0.7% 5.2% 0.5% 1.0% 2005–2015 0.8% 2.3% -0.6% 0.0%
Source: U.S. Environmental Protection Agency, MOVES2014a model, www3.epa.gov/otaq/models/moves.
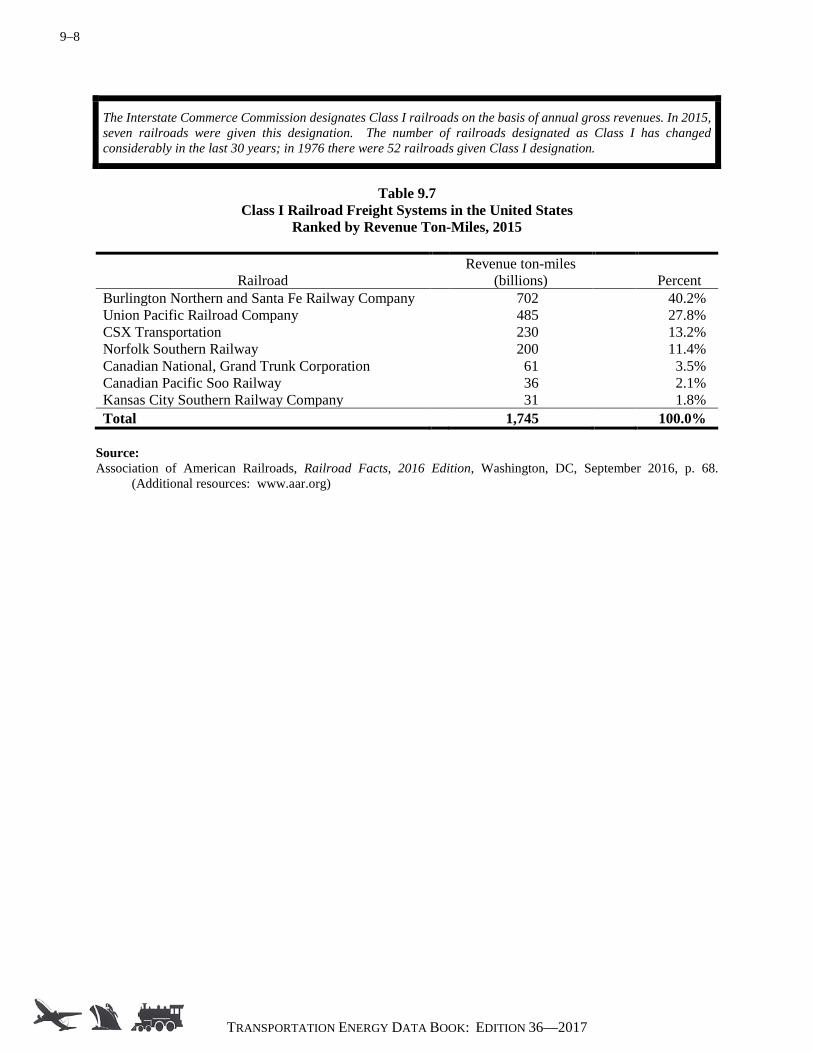
9–8
TRANSPORTATION ENERGY DATA BOOK: EDITION 36—2017
The Interstate Commerce Commission designates Class I railroads on the basis of annual gross revenues. In 2015, seven railroads were given this designation. The number of railroads designated as Class I has changed considerably in the last 30 years; in 1976 there were 52 railroads given Class I designation.
Table 9.7
Class I Railroad Freight Systems in the United States Ranked by Revenue Ton-Miles, 2015
Railroad Revenue ton-miles
(billions) Percent Burlington Northern and Santa Fe Railway Company 702 40.2% Union Pacific Railroad Company 485 27.8% CSX Transportation 230 13.2% Norfolk Southern Railway 200 11.4% Canadian National, Grand Trunk Corporation 61 3.5% Canadian Pacific Soo Railway 36 2.1% Kansas City Southern Railway Company 31 1.8% Total 1,745 100.0%
Source: Association of American Railroads, Railroad Facts, 2016 Edition, Washington, DC, September 2016, p. 68.
(Additional resources: www.aar.org)
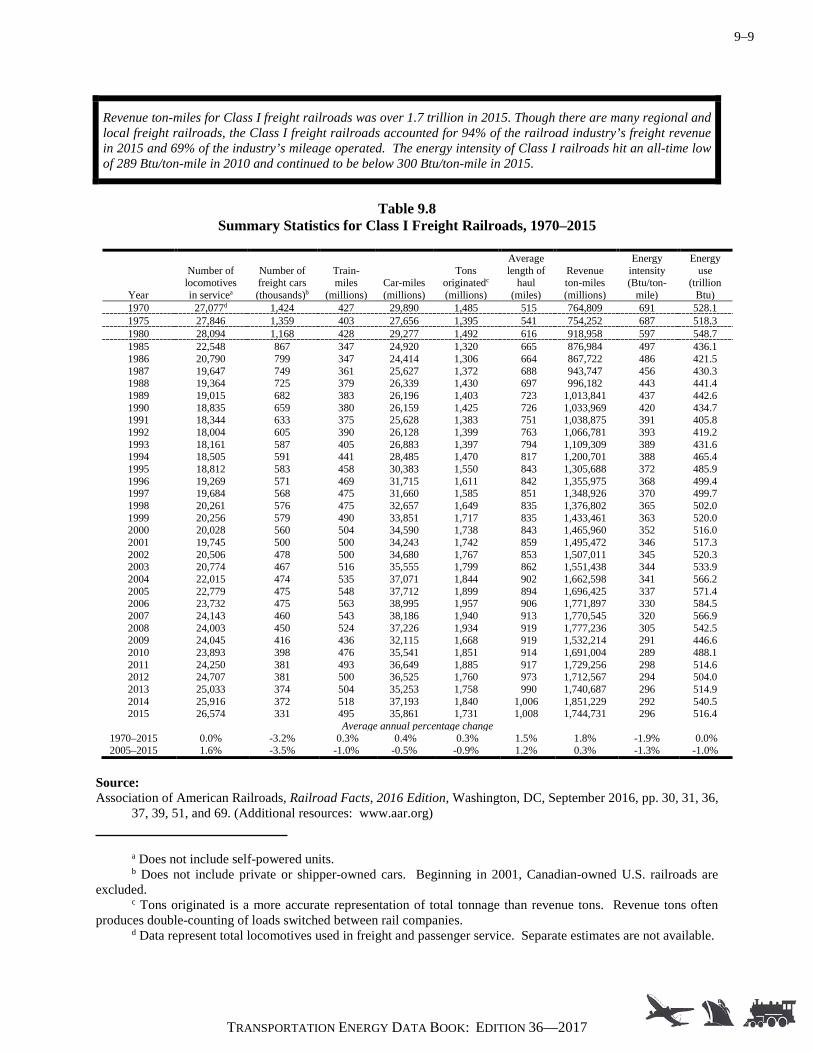
9–9
TRANSPORTATION ENERGY DATA BOOK: EDITION 36—2017
Revenue ton-miles for Class I freight railroads was over 1.7 trillion in 2015. Though there are many regional and local freight railroads, the Class I freight railroads accounted for 94% of the railroad industry’s freight revenue in 2015 and 69% of the industry’s mileage operated. The energy intensity of Class I railroads hit an all-time low of 289 Btu/ton-mile in 2010 and continued to be below 300 Btu/ton-mile in 2015.
Table 9.8
Summary Statistics for Class I Freight Railroads, 1970–2015
Year
Number of locomotives in servicea
Number of freight cars (thousands)b
Train-miles
(millions) Car-miles (millions)
Tons originatedc (millions)
Average length of
haul (miles)
Revenue ton-miles (millions)
Energy intensity (Btu/ton-
mile)
Energy use
(trillion Btu)
1970 27,077d 1,424 427 29,890 1,485 515 764,809 691 528.1 1975 27,846 1,359 403 27,656 1,395 541 754,252 687 518.3 1980 28,094 1,168 428 29,277 1,492 616 918,958 597 548.7 1985 22,548 867 347 24,920 1,320 665 876,984 497 436.1 1986 20,790 799 347 24,414 1,306 664 867,722 486 421.5 1987 19,647 749 361 25,627 1,372 688 943,747 456 430.3 1988 19,364 725 379 26,339 1,430 697 996,182 443 441.4 1989 19,015 682 383 26,196 1,403 723 1,013,841 437 442.6 1990 18,835 659 380 26,159 1,425 726 1,033,969 420 434.7 1991 18,344 633 375 25,628 1,383 751 1,038,875 391 405.8 1992 18,004 605 390 26,128 1,399 763 1,066,781 393 419.2 1993 18,161 587 405 26,883 1,397 794 1,109,309 389 431.6 1994 18,505 591 441 28,485 1,470 817 1,200,701 388 465.4 1995 18,812 583 458 30,383 1,550 843 1,305,688 372 485.9 1996 19,269 571 469 31,715 1,611 842 1,355,975 368 499.4 1997 19,684 568 475 31,660 1,585 851 1,348,926 370 499.7 1998 20,261 576 475 32,657 1,649 835 1,376,802 365 502.0 1999 20,256 579 490 33,851 1,717 835 1,433,461 363 520.0 2000 20,028 560 504 34,590 1,738 843 1,465,960 352 516.0 2001 19,745 500 500 34,243 1,742 859 1,495,472 346 517.3 2002 20,506 478 500 34,680 1,767 853 1,507,011 345 520.3 2003 20,774 467 516 35,555 1,799 862 1,551,438 344 533.9 2004 22,015 474 535 37,071 1,844 902 1,662,598 341 566.2 2005 22,779 475 548 37,712 1,899 894 1,696,425 337 571.4 2006 23,732 475 563 38,995 1,957 906 1,771,897 330 584.5 2007 24,143 460 543 38,186 1,940 913 1,770,545 320 566.9 2008 24,003 450 524 37,226 1,934 919 1,777,236 305 542.5 2009 24,045 416 436 32,115 1,668 919 1,532,214 291 446.6 2010 23,893 398 476 35,541 1,851 914 1,691,004 289 488.1 2011 24,250 381 493 36,649 1,885 917 1,729,256 298 514.6 2012 24,707 381 500 36,525 1,760 973 1,712,567 294 504.0 2013 25,033 374 504 35,253 1,758 990 1,740,687 296 514.9 2014 25,916 372 518 37,193 1,840 1,006 1,851,229 292 540.5 2015 26,574 331 495 35,861 1,731 1,008 1,744,731 296 516.4
Average annual percentage change 1970–2015 0.0% -3.2% 0.3% 0.4% 0.3% 1.5% 1.8% -1.9% 0.0% 2005–2015 1.6% -3.5% -1.0% -0.5% -0.9% 1.2% 0.3% -1.3% -1.0%
Source: Association of American Railroads, Railroad Facts, 2016 Edition, Washington, DC, September 2016, pp. 30, 31, 36,
37, 39, 51, and 69. (Additional resources: www.aar.org) a Does not include self-powered units. b Does not include private or shipper-owned cars. Beginning in 2001, Canadian-owned U.S. railroads are excluded. c Tons originated is a more accurate representation of total tonnage than revenue tons. Revenue tons often produces double-counting of loads switched between rail companies. d Data represent total locomotives used in freight and passenger service. Separate estimates are not available.

9–10
TRANSPORTATION ENERGY DATA BOOK: EDITION 36—2017
According to the 2012 Commodity Flow Survey, 7% of all freight ton-miles are rail intermodal shipments (truck/rail or rail/water). See Table 5.16 for details. The number of trailers and containers moved by railroads has increased more than eight-fold from 1965 to 2015. Containerization has increased in the last two decades, evidenced by the 432% increase in the number of containers from 1988 to 2015. The number of trailers moved by rail fell to an all-time low in 2013 but has increased for the last two years.
Table 9.9
Intermodal Rail Traffic, 1965–2015a
Year Trailers & containers Trailers Containers 1965 1,664,929 b b 1970 2,363,200 b b 1975 2,238,117 b b 1980 3,059,402 b b 1985 4,590,952 b b 1986 4,997,229 b b 1987 5,503,819 b b 1988 5,779,547 3,481,020 2,298,527 1989 5,987,355 3,496,262 2,491,093 1990 6,206,782 3,451,953 2,754,829 1991 6,246,134 3,201,560 3,044,574 1992 6,627,841 3,264,597 3,363,244 1993 7,156,628 3,464,126 3,692,502 1994 8,128,228 3,752,502 4,375,726 1995 7,936,172 3,492,463 4,443,709 1996 8,143,258 3,302,128 4,841,130 1997 8,698,308 3,453,907 5,244,401 1998 8,772,663 3,353,032 5,419,631 1999 8,907,626 3,207,407 5,700,219 2000 9,176,890 2,888,630 6,288,260 2001 8,935,444 2,603,423 6,332,021 2002 9,312,360 2,531,338 6,781,022 2003 9,955,605 2,625,837 7,329,768 2004 10,993,662 2,928,123 8,065,539 2005 11,693,512 2,979,906 8,713,606 2006 12,282,221 2,882,699 9,399,522 2007 12,026,631 2,600,635 9,425,996 2008 11,499,978 2,478,890 9,021,088 2009 9,875,967 1,639,603 8,236,364 2010 11,283,151 1,684,684 9,598,467 2011 11,892,418 1,698,615 10,193,803 2012 12,267,416 1,518,323 10,749,093 2013 12,831,311 1,483,938 11,347,373 2014 13,496,822 1,550,124 11,946,698 2015 13,710,646 1,475,754 12,234,892
Average annual percentage change 1965–2015 4.3% b b 2005–2015 1.6% -6.8% 3.5%
Source: Association of American Railroads, Railroad Facts, 2016 Edition, Washington, DC, September 2016, p. 29.
(Additional resources: www.aar.org) a Beginning in 1995, the Grand Trunk Western Railroad and the Soo Line Railroad Company are excluded. Beginning in 1999, the Illinois Central data are excluded. Beginning in 2002, the Wisconsin Central data are excluded. b Data are not available.
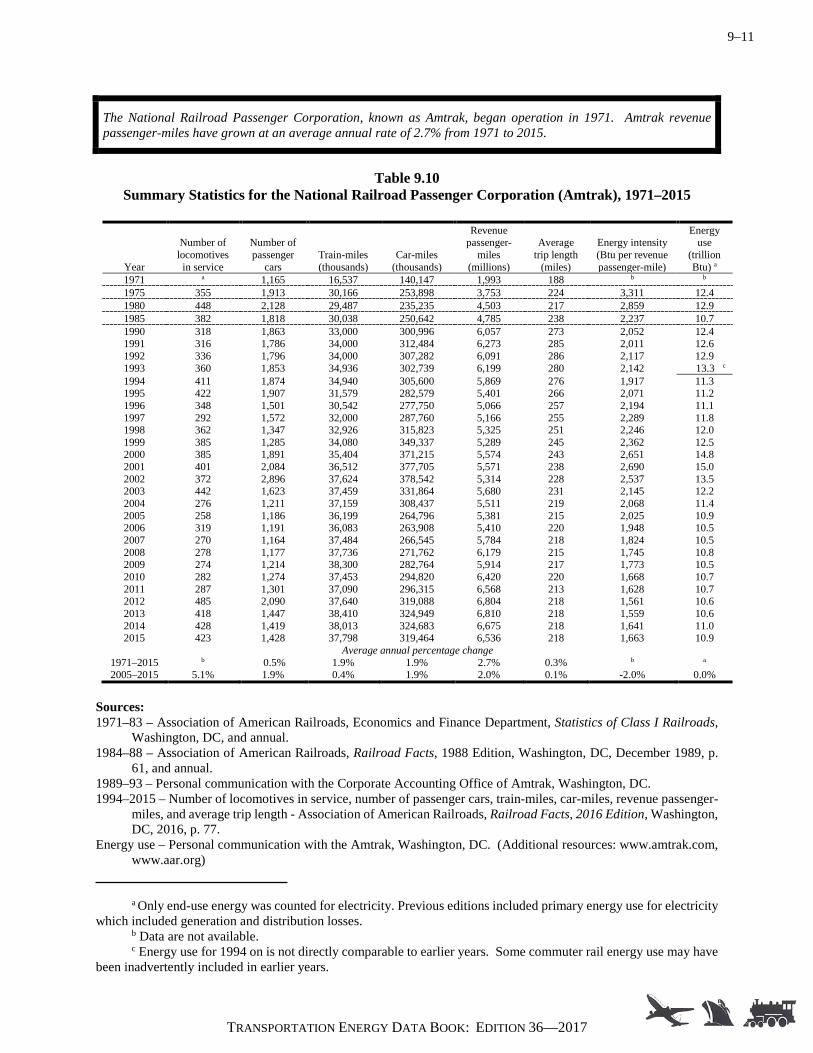
9–11
TRANSPORTATION ENERGY DATA BOOK: EDITION 36—2017
The National Railroad Passenger Corporation, known as Amtrak, began operation in 1971. Amtrak revenue passenger-miles have grown at an average annual rate of 2.7% from 1971 to 2015.
Table 9.10
Summary Statistics for the National Railroad Passenger Corporation (Amtrak), 1971–2015
Year
Number of locomotives
in service
Number of passenger
cars Train-miles (thousands)
Car-miles (thousands)
Revenue passenger-
miles (millions)
Average trip length
(miles)
Energy intensity (Btu per revenue passenger-mile)
Energy use
(trillion Btu) a
1971 a 1,165 16,537 140,147 1,993 188 b b 1975 355 1,913 30,166 253,898 3,753 224 3,311 12.4 1980 448 2,128 29,487 235,235 4,503 217 2,859 12.9 1985 382 1,818 30,038 250,642 4,785 238 2,237 10.7 1990 318 1,863 33,000 300,996 6,057 273 2,052 12.4 1991 316 1,786 34,000 312,484 6,273 285 2,011 12.6 1992 336 1,796 34,000 307,282 6,091 286 2,117 12.9 1993 360 1,853 34,936 302,739 6,199 280 2,142 13.3 c 1994 411 1,874 34,940 305,600 5,869 276 1,917 11.3 1995 422 1,907 31,579 282,579 5,401 266 2,071 11.2 1996 348 1,501 30,542 277,750 5,066 257 2,194 11.1 1997 292 1,572 32,000 287,760 5,166 255 2,289 11.8 1998 362 1,347 32,926 315,823 5,325 251 2,246 12.0 1999 385 1,285 34,080 349,337 5,289 245 2,362 12.5 2000 385 1,891 35,404 371,215 5,574 243 2,651 14.8 2001 401 2,084 36,512 377,705 5,571 238 2,690 15.0 2002 372 2,896 37,624 378,542 5,314 228 2,537 13.5 2003 442 1,623 37,459 331,864 5,680 231 2,145 12.2 2004 276 1,211 37,159 308,437 5,511 219 2,068 11.4 2005 258 1,186 36,199 264,796 5,381 215 2,025 10.9 2006 319 1,191 36,083 263,908 5,410 220 1,948 10.5 2007 270 1,164 37,484 266,545 5,784 218 1,824 10.5 2008 278 1,177 37,736 271,762 6,179 215 1,745 10.8 2009 274 1,214 38,300 282,764 5,914 217 1,773 10.5 2010 282 1,274 37,453 294,820 6,420 220 1,668 10.7 2011 287 1,301 37,090 296,315 6,568 213 1,628 10.7 2012 485 2,090 37,640 319,088 6,804 218 1,561 10.6 2013 418 1,447 38,410 324,949 6,810 218 1,559 10.6 2014 428 1,419 38,013 324,683 6,675 218 1,641 11.0 2015 423 1,428 37,798 319,464 6,536 218 1,663 10.9
Average annual percentage change 1971–2015 b 0.5% 1.9% 1.9% 2.7% 0.3% b a 2005–2015 5.1% 1.9% 0.4% 1.9% 2.0% 0.1% -2.0% 0.0%
Sources: 1971–83 – Association of American Railroads, Economics and Finance Department, Statistics of Class I Railroads,
Washington, DC, and annual. 1984–88 – Association of American Railroads, Railroad Facts, 1988 Edition, Washington, DC, December 1989, p.
61, and annual. 1989–93 – Personal communication with the Corporate Accounting Office of Amtrak, Washington, DC. 1994–2015 – Number of locomotives in service, number of passenger cars, train-miles, car-miles, revenue passenger-
miles, and average trip length - Association of American Railroads, Railroad Facts, 2016 Edition, Washington, DC, 2016, p. 77.
Energy use – Personal communication with the Amtrak, Washington, DC. (Additional resources: www.amtrak.com, www.aar.org)
a Only end-use energy was counted for electricity. Previous editions included primary energy use for electricity which included generation and distribution losses. b Data are not available. c Energy use for 1994 on is not directly comparable to earlier years. Some commuter rail energy use may have been inadvertently included in earlier years.

9–12
TRANSPORTATION ENERGY DATA BOOK: EDITION 36—2017
Commuter rail, which is also known as regional rail or suburban rail, is long-haul rail passenger service operating between metropolitan and suburban areas, whether within or across state lines. Commuter rail lines usually have reduced fares for multiple rides and commutation tickets for regular, recurring riders.
Table 9.11
Summary Statistics for Commuter Rail Operations, 1984–2015
Year
Number of passenger vehicles
Vehicle-miles
(millions)
Passenger trips
(millions)
Passenger-miles
(millions)
Average trip length
(miles)
Energy intensity
(Btu/passenger-mile) a
Energy use
(trillion Btu) a
1984 4,075 167.9 267 6,207 23.2 1,798 11.2 1985 4,035 182.7 275 6,534 23.8 1,720 11.2 1986 4,440 188.6 306 6,723 22.0 1,720 11.6 1987 4,686 188.9 311 6,818 21.9 1,628 11.1 1988 4,649 202.2 325 6,964 21.4 1,666 11.4 1989 4,472 209.6 330 7,211 21.9 1,622 11.7 1990 4,982 212.7 328 7,082 21.6 1,622 11.5 1991 5,126 214.9 318 7,344 23.1 1,601 11.8 1992 5,164 218.8 314 7,320 23.3 1,565 11.5 1993 4,982 223.9 322 6,940 21.6 1,782 12.4 1994 5,126 230.8 339 7,996 23.6 1,605 12.8 1995 5,164 237.7 344 8,244 24.0 1,580 13.0 1996 5,240 241.9 352 8,351 23.7 1,541 12.9 1997 5,426 250.7 357 8,038 22.5 1,630 13.1 1998 5,536 259.5 381 8,704 22.8 1,612 14.0 1999 5,550 265.9 396 8,766 22.1 1,670 14.6 2000 5,498 270.9 413 9,402 22.8 1,542 14.5 2001 5,572 277.3 419 9,548 22.8 1,533 14.6 2002 5,724 283.7 414 9,504 22.9 1,542 14.7 2003 5,959 286.0 410 9,559 23.3 1,542 14.7 2004 6,228 294.7 414 9,719 23.5 1,536 14.9 2005 6,392 303.4 423 9,473 22.4 1,658 15.7 2006 6,403 314.7 441 10,361 23.5 1,539 15.9 2007 6,391 325.7 459 11,153 24.3 1,543 17.2 2008 6,617 310.2 472 11,049 23.4 1,579 17.4 2009 6,941 343.5 468 11,232 24.0 1,714 19.2 2010 6,927 345.3 464 10,874 23.4 1,753 19.1 2011 7,193 345.2 466 11,427 24.5 1,681 19.2 2012 7,059 346.4 471 11,181 23.7 1,703 19.0 2013 7,310 359.1 480 11,862 24.7 1,676 19.9 2014 7,337 370.8 490 11,718 23.9 1,638 19.2 2015 7,301 373.7 498 11,804 23.7 1,643 19.4
Average annual percentage change 1984–2015 1.9% 2.6% 2.0% 2.1% 0.1% -0.3% 1.8% 2005–2015 1.3% 2.1% 1.6% 2.2% 0.6% -0.1% 2.1%
Sources: 1984-2014: American Public Transportation Association, 2016 Public Transportation Fact Book, Washington, DC,
April 2016, Appendix A. (Additional resources: www.apta.com) 2015: U.S. Department of Transportation, Federal Transit Administration, 2015 National Transit Database,
accessed September 2017. (Additional resources: www.transit.gov/ntd)
a Only end-use energy was counted for electricity. Previous editions included primary energy use for
electricity which included generation and distribution losses.

9–13
TRANSPORTATION ENERGY DATA BOOK: EDITION 36—2017
This table on transit rail operations includes data on light rail and heavy rail systems. Light rail vehicles are usually single vehicles driven electrically with power drawn from overhead wires. Heavy rail is characterized by high speed and rapid acceleration of rail cars operating on a separate right-of-way.
Table 9.12
Summary Statistics for Rail Transit Operations, 1970–2015a
Year
Number of passenger vehicles
Vehicle-miles
(millions)
Passenger trips
(millions)b
Passenger-miles
(millions)c
Average trip length
(miles)d
Energy intensity (Btu/passenger-
mile)e Energy use
(trillion Btu) e 1970 10,548 440.8 2,116 12,273 f 712 8.7 1975 10,617 446.9 1,797 10,423 f 866 9.0 1980 10,654 402.2 2,241 10,939 4.9 763 8.3 1985 11,109 467.8 2,422 10,777 4.4 927 10.0 1990 11,332 560.9 2,521 12,046 4.8 998 12.0 1995 11,156 571.8 2,284 11,419 5.0 1,102 12.6 1996 11,341 580.7 2,418 12,487 5.2 996 12.4 1997 11,471 598.9 2,692 13,091 4.9 943 12.3 1998 11,521 609.5 2,669 13,412 5.0 931 12.5 1999 11,603 626.4 2,813 14,108 5.0 919 13.0 2000 12,168 648.0 2,952 15,200 5.1 923 14.0 2001 12,084 662.4 3,064 15,615 5.1 925 14.4 2002 12,479 681.9 3,025 15,095 5.0 948 14.3 2003 12,236 694.2 3,005 15,082 5.0 936 14.1 2004 12,480 709.7 3,098 15,930 5.1 907 14.5 2005 12,755 715.4 3,189 16,118 5.1 919 14.8 2006 12,853 726.4 3,334 16,587 5.0 893 14.8 2007 13,032 741.2 3,879 18,070 4.7 851 15.4 2008 13,346 762.8 4,001 18,941 4.7 832 15.8 2009 13,529 775.3 3,955 19,004 4.8 830 15.8 2010 13,614 759.6 4,007 18,580 4.6 832 15.5 2011 13,328 744.1 4,083 19,520 4.8 812 15.8 2012 12,455 749.5 4,192 19,835 4.7 791 15.7 2013 12,434 774.3 4,275 20,381 4.8 793 16.2 2014 12,608 780.9 4,411 20,829 4.7 786 16.4 2015 12,820 803.2 4,339 20,710 4.8 776 16.1
Average annual percentage change 1970–2015 0.4% 1.3% 1.6% 1.2% -0.1%g 0.2% 1.4% 2005–2015 0.1% 1.2% 3.1% 2.5% -0.6% -1.7% 0.8%
Sources: 1970-2014: American Public Transportation Association, 2016 Public Transportation Fact Book, Washington, DC,
April 2016, Appendix A. (Additional resources: www.apta.com) 2015: U.S. Department of Transportation, Federal Transit Administration, 2015 National Transit Database, accessed
September 2017. (Additional resources: www.transit.gov/ntd) Energy use – See Appendix A for Rail Transit Energy Use. a Heavy rail and light rail. Series not continuous between 1983 and 1984 because of a change in data source by the American Public Transit Association (APTA). Beginning in 1984, data provided by APTA are taken from mandatory reports filed with the Urban Mass Transit Administration (UMTA). Data for prior years were provided on a voluntary basis by APTA members and expanded statistically. b 1970–79 data represents total passenger rides; after 1979, data represents unlinked passenger trips. c Estimated for years 1970–76 based on an average trip length of 5.8 miles. d Calculated as the ratio of passenger-miles to passenger trips. e Only end-use energy was counted for electricity. Previous editions included primary energy use for electricity which included generation and distribution losses. Large system-to-system variations exist for energy intensities. f Data are not available. g Average annual percentage change is calculated for years 1980–2015.

9–14
TRANSPORTATION ENERGY DATA BOOK: EDITION 36—2017

10–1
TRANSPORTATION ENERGY DATA BOOK: EDITION 36—2017
Transportation and the Economy
Summary Statistics from Tables/Figures in this Chapter
Source
Table 10.1 Average household transportation expenditures, 2015 17.0% Figure 10.2 Share of gasoline cost attributed to taxes, 2016 Canada 38% France 66% Germany 66% Japan 54% United Kingdom 70% United States 21% Table 10.13 Average price of a new car, 2016 (current dollars) 25,774 Domestic 24,414 Import 29,913 Table 10.14 Car operating costs, 2016 Variable costs (constant 2016 dollars per 10,000 miles) 1,473 Fixed costs (constant 2016 dollars per 10,000 miles) 6,072 Table 10.18 Transportation sector share of total employment 2000 8.3% 2016 7.5%

10–2
TRANSPORTATION ENERGY DATA BOOK: EDITION 36—2017
Adjusting Dollar Amounts for Inflation
A dollar spent in 1970 does not have the purchasing power of a dollar spent in 2016 due
to the inflation of prices for all goods and services. Thus, prices in a historical series must be
adjusted in order to provide proper comparison. The term “current dollars” is used in this report
for dollar amounts that were current as of the year listed – this can also be referred to as
“nominal dollars.” The term “constant 2016 dollars” is used in this report for dollar amounts that
have been adjusted to a constant purchasing power (2016, in this example) and thus the data are
comparable historically – this can also be referred to as “real dollars.”
Appendix B, Table B.17 contains the Consumer Price Inflation Index and Table B.18
contains the Gross National Product Implicit Price Deflator for years 1970 to 2016. Tables in the
report with constant dollars have a footnote indicating which of these inflation adjustment
indices were used.
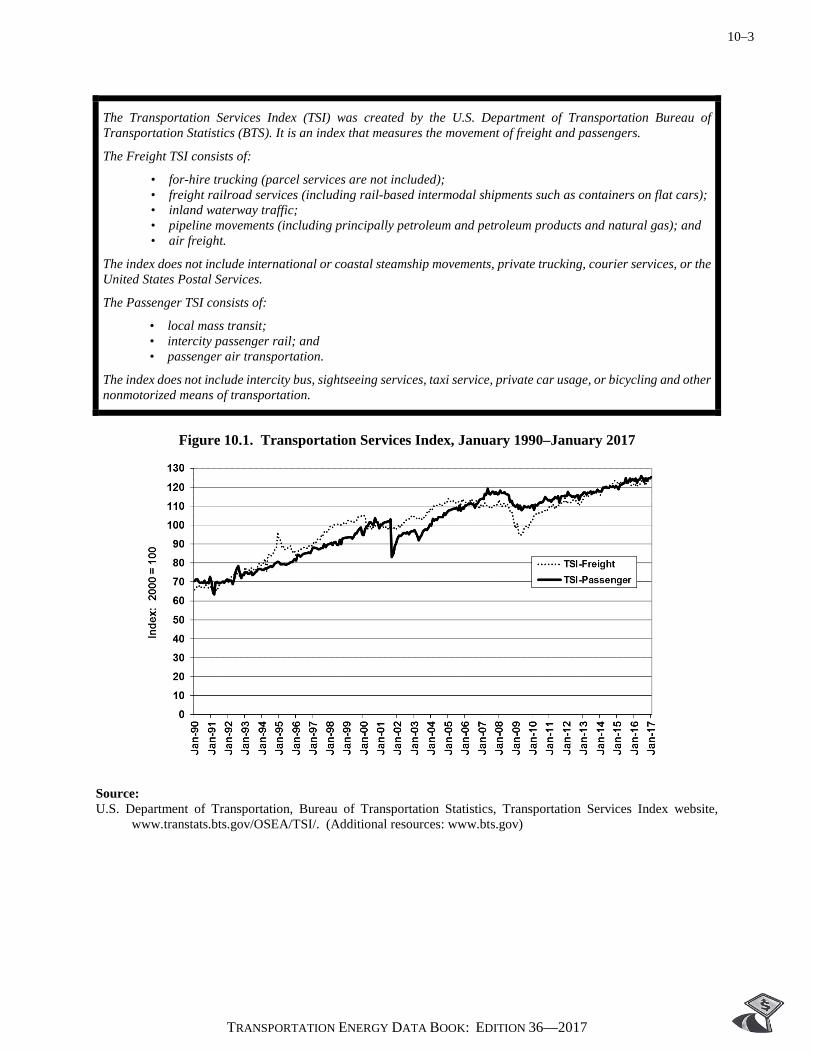
10–3
TRANSPORTATION ENERGY DATA BOOK: EDITION 36—2017
The Transportation Services Index (TSI) was created by the U.S. Department of Transportation Bureau of Transportation Statistics (BTS). It is an index that measures the movement of freight and passengers.
The Freight TSI consists of:
• for-hire trucking (parcel services are not included); • freight railroad services (including rail-based intermodal shipments such as containers on flat cars); • inland waterway traffic; • pipeline movements (including principally petroleum and petroleum products and natural gas); and • air freight.
The index does not include international or coastal steamship movements, private trucking, courier services, or the United States Postal Services.
The Passenger TSI consists of:
• local mass transit; • intercity passenger rail; and • passenger air transportation.
The index does not include intercity bus, sightseeing services, taxi service, private car usage, or bicycling and other nonmotorized means of transportation.
Figure 10.1. Transportation Services Index, January 1990–January 2017
Source: U.S. Department of Transportation, Bureau of Transportation Statistics, Transportation Services Index website,
www.transtats.bts.gov/OSEA/TSI/. (Additional resources: www.bts.gov)
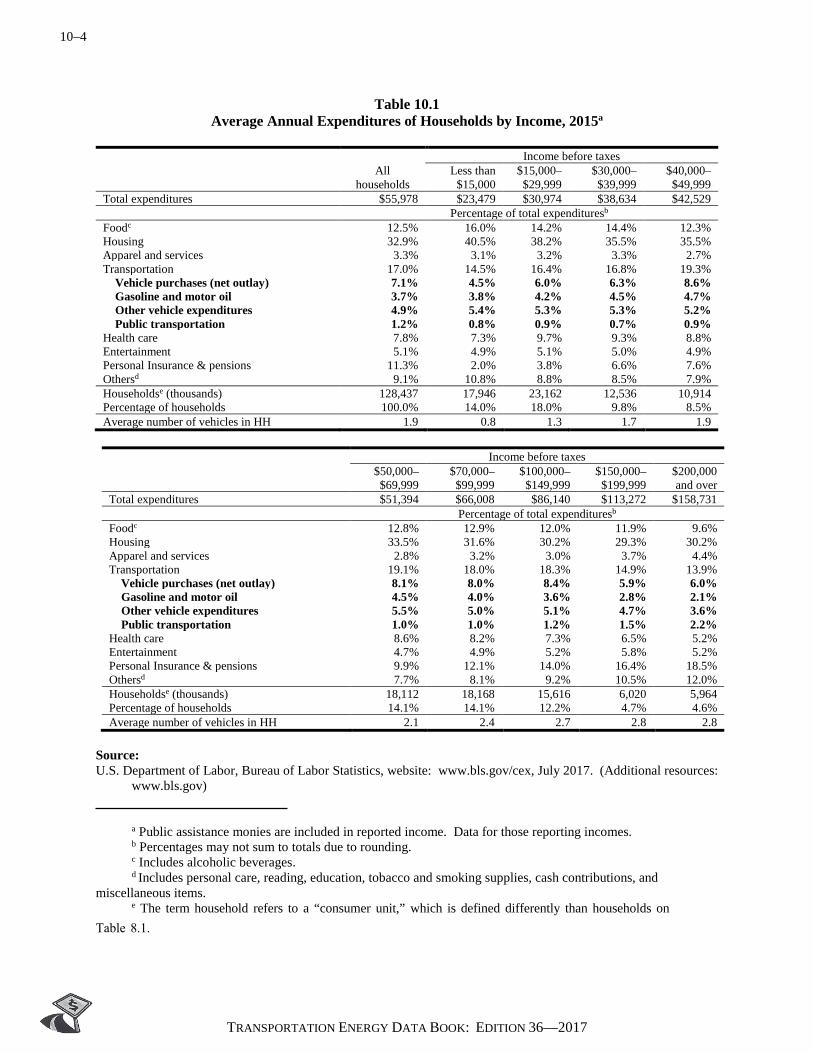
10–4
TRANSPORTATION ENERGY DATA BOOK: EDITION 36—2017
Table 10.1 Average Annual Expenditures of Households by Income, 2015a
Income before taxes All
households Less than
$15,000 $15,000–$29,999
$30,000–$39,999
$40,000–$49,999
Total expenditures $55,978 $23,479 $30,974 $38,634 $42,529 Percentage of total expendituresb
Foodc 12.5% 16.0% 14.2% 14.4% 12.3% Housing 32.9% 40.5% 38.2% 35.5% 35.5% Apparel and services 3.3% 3.1% 3.2% 3.3% 2.7% Transportation 17.0% 14.5% 16.4% 16.8% 19.3% Vehicle purchases (net outlay) 7.1% 4.5% 6.0% 6.3% 8.6% Gasoline and motor oil 3.7% 3.8% 4.2% 4.5% 4.7% Other vehicle expenditures 4.9% 5.4% 5.3% 5.3% 5.2% Public transportation 1.2% 0.8% 0.9% 0.7% 0.9% Health care 7.8% 7.3% 9.7% 9.3% 8.8% Entertainment 5.1% 4.9% 5.1% 5.0% 4.9% Personal Insurance & pensions 11.3% 2.0% 3.8% 6.6% 7.6% Othersd 9.1% 10.8% 8.8% 8.5% 7.9% Householdse (thousands) 128,437 17,946 23,162 12,536 10,914 Percentage of households 100.0% 14.0% 18.0% 9.8% 8.5% Average number of vehicles in HH 1.9 0.8 1.3 1.7 1.9
Income before taxes $50,000–$69,999
$70,000–$99,999
$100,000– $149,999
$150,000–$199,999
$200,000 and over
Total expenditures $51,394 $66,008 $86,140 $113,272 $158,731 Percentage of total expendituresb
Foodc 12.8% 12.9% 12.0% 11.9% 9.6% Housing 33.5% 31.6% 30.2% 29.3% 30.2% Apparel and services 2.8% 3.2% 3.0% 3.7% 4.4% Transportation 19.1% 18.0% 18.3% 14.9% 13.9% Vehicle purchases (net outlay) 8.1% 8.0% 8.4% 5.9% 6.0% Gasoline and motor oil 4.5% 4.0% 3.6% 2.8% 2.1% Other vehicle expenditures 5.5% 5.0% 5.1% 4.7% 3.6% Public transportation 1.0% 1.0% 1.2% 1.5% 2.2% Health care 8.6% 8.2% 7.3% 6.5% 5.2% Entertainment 4.7% 4.9% 5.2% 5.8% 5.2% Personal Insurance & pensions 9.9% 12.1% 14.0% 16.4% 18.5% Othersd 7.7% 8.1% 9.2% 10.5% 12.0% Householdse (thousands) 18,112 18,168 15,616 6,020 5,964 Percentage of households 14.1% 14.1% 12.2% 4.7% 4.6% Average number of vehicles in HH 2.1 2.4 2.7 2.8 2.8
Source: U.S. Department of Labor, Bureau of Labor Statistics, website: www.bls.gov/cex, July 2017. (Additional resources:
www.bls.gov)
a Public assistance monies are included in reported income. Data for those reporting incomes. b Percentages may not sum to totals due to rounding. c Includes alcoholic beverages. d Includes personal care, reading, education, tobacco and smoking supplies, cash contributions, and
miscellaneous items. e The term household refers to a “consumer unit,” which is defined differently than households on
Table 8.1.
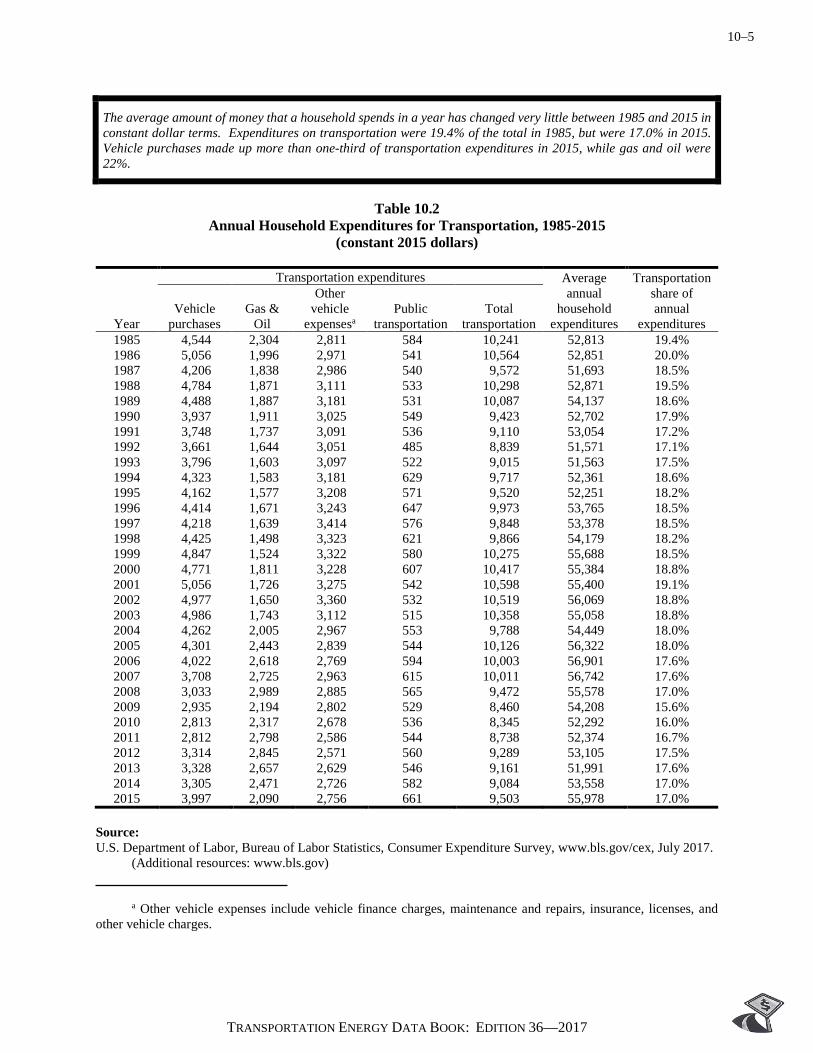
10–5
TRANSPORTATION ENERGY DATA BOOK: EDITION 36—2017
The average amount of money that a household spends in a year has changed very little between 1985 and 2015 in constant dollar terms. Expenditures on transportation were 19.4% of the total in 1985, but were 17.0% in 2015. Vehicle purchases made up more than one-third of transportation expenditures in 2015, while gas and oil were 22%.
Table 10.2
Annual Household Expenditures for Transportation, 1985-2015 (constant 2015 dollars)
Transportation expenditures Average annual
household expenditures
Transportation share of annual
expenditures Year Vehicle
purchases Gas &
Oil
Other vehicle
expensesa Public
transportation Total
transportation 1985 4,544 2,304 2,811 584 10,241 52,813 19.4% 1986 5,056 1,996 2,971 541 10,564 52,851 20.0% 1987 4,206 1,838 2,986 540 9,572 51,693 18.5% 1988 4,784 1,871 3,111 533 10,298 52,871 19.5% 1989 4,488 1,887 3,181 531 10,087 54,137 18.6% 1990 3,937 1,911 3,025 549 9,423 52,702 17.9% 1991 3,748 1,737 3,091 536 9,110 53,054 17.2% 1992 3,661 1,644 3,051 485 8,839 51,571 17.1% 1993 3,796 1,603 3,097 522 9,015 51,563 17.5% 1994 4,323 1,583 3,181 629 9,717 52,361 18.6% 1995 4,162 1,577 3,208 571 9,520 52,251 18.2% 1996 4,414 1,671 3,243 647 9,973 53,765 18.5% 1997 4,218 1,639 3,414 576 9,848 53,378 18.5% 1998 4,425 1,498 3,323 621 9,866 54,179 18.2% 1999 4,847 1,524 3,322 580 10,275 55,688 18.5% 2000 4,771 1,811 3,228 607 10,417 55,384 18.8% 2001 5,056 1,726 3,275 542 10,598 55,400 19.1% 2002 4,977 1,650 3,360 532 10,519 56,069 18.8% 2003 4,986 1,743 3,112 515 10,358 55,058 18.8% 2004 4,262 2,005 2,967 553 9,788 54,449 18.0% 2005 4,301 2,443 2,839 544 10,126 56,322 18.0% 2006 4,022 2,618 2,769 594 10,003 56,901 17.6% 2007 3,708 2,725 2,963 615 10,011 56,742 17.6% 2008 3,033 2,989 2,885 565 9,472 55,578 17.0% 2009 2,935 2,194 2,802 529 8,460 54,208 15.6% 2010 2,813 2,317 2,678 536 8,345 52,292 16.0% 2011 2,812 2,798 2,586 544 8,738 52,374 16.7% 2012 3,314 2,845 2,571 560 9,289 53,105 17.5% 2013 3,328 2,657 2,629 546 9,161 51,991 17.6% 2014 3,305 2,471 2,726 582 9,084 53,558 17.0% 2015 3,997 2,090 2,756 661 9,503 55,978 17.0%
Source: U.S. Department of Labor, Bureau of Labor Statistics, Consumer Expenditure Survey, www.bls.gov/cex, July 2017.
(Additional resources: www.bls.gov) a Other vehicle expenses include vehicle finance charges, maintenance and repairs, insurance, licenses, and other vehicle charges.

10–6
TRANSPORTATION ENERGY DATA BOOK: EDITION 36—2017
The United States prices are the lowest of these listed countries. Those in France, the United Kingdom, and Germany paid, on average, over $5 per gallon in 2016. Data for China and India have been discontinued by the International Energy Agency.
Table 10.3
Gasoline Pricesa for Selected Countries, 1990–2016
Current dollars per gallon Average annual
percentage change 1990 1995 2000 2005 2010 2016 1990–2016 China b 1.03 b 1.70 3.71 b b Japan 3.16 4.43 3.65 4.28 5.73 4.53 1.5% India b b b 3.71 4.29 b b Korea b b b 5.28 5.60 4.80 b Francec 3.63 4.26 3.80 5.46 6.74 5.47 1.7% United Kingdomc 2.82 3.21 4.58 5.97 6.83 5.56 2.8% Germanyc 2.65 3.96 3.45 5.75 7.11 5.47 2.9% Canada 1.87 1.53 1.86 2.89 3.79 2.94 1.8% United Statesd 1.16 1.15 1.51 2.27 2.78 2.15 2.5%
Constant 2016 dollarse per gallon Average annual
percentage change 1990 1995 2000 2005 2010 2016 1990–2016 China b 1.03 b 2.09 4.08 b b Japan 5.80 6.98 5.09 5.26 6.31 4.53 -1.0% India b b b 4.56 4.73 b b Korea b b b 6.49 6.16 4.80 b Francec 6.67 6.71 5.30 6.71 7.42 5.47 -0.8% United Kingdomc 5.18 5.06 6.38 7.33 7.52 5.56 0.3% Germanyc 4.87 6.24 4.81 7.07 7.82 5.47 0.5% Canada 3.43 2.41 2.59 3.55 4.19 2.94 -0.6% United Statesd 2.13 1.81 2.10 2.79 3.06 2.15 0.0%
Note: Comparisons between prices and price trends in different countries require care. They are of limited validity because of fluctuations in exchange rates; differences in product quality, marketing practices, and market structures; and the extent to which the standard categories of sales are representative of total national sales for a given period. Source: International Energy Agency, Energy Prices and Taxes, First Quarter, 2017, Paris, France, 2017. (Additional
resources: www.iea.org) a Prices represent the retail prices (including taxes) for regular unleaded gasoline, except for France, Germany and the United Kingdom which are premium unleaded gasoline. b Data are not available. c Premium gasoline. d These estimates are international comparisons only and do not necessarily correspond to gasoline price estimates in other sections of the book. e Adjusted by the U.S. Consumer Price Inflation Index.
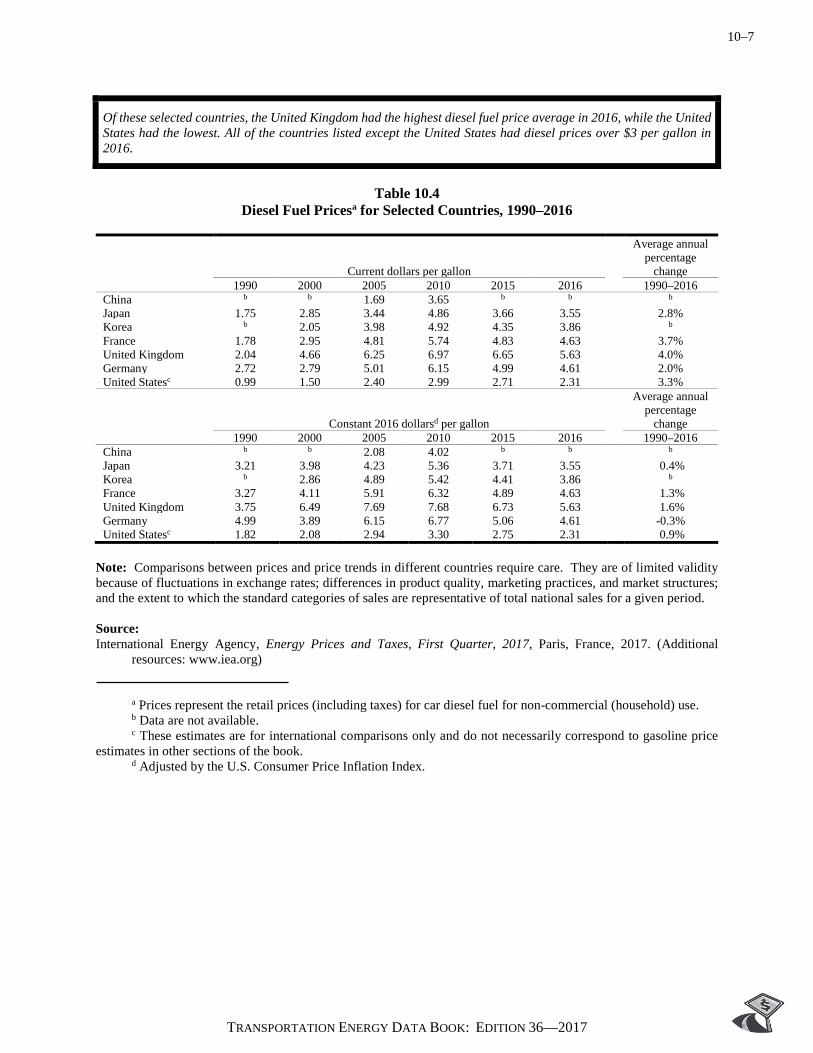
10–7
TRANSPORTATION ENERGY DATA BOOK: EDITION 36—2017
Of these selected countries, the United Kingdom had the highest diesel fuel price average in 2016, while the United States had the lowest. All of the countries listed except the United States had diesel prices over $3 per gallon in 2016.
Table 10.4
Diesel Fuel Pricesa for Selected Countries, 1990–2016
Current dollars per gallon
Average annual percentage
change 1990 2000 2005 2010 2015 2016 1990–2016 China b b 1.69 3.65 b b b Japan 1.75 2.85 3.44 4.86 3.66 3.55 2.8% Korea b 2.05 3.98 4.92 4.35 3.86 b France 1.78 2.95 4.81 5.74 4.83 4.63 3.7% United Kingdom 2.04 4.66 6.25 6.97 6.65 5.63 4.0% Germany 2.72 2.79 5.01 6.15 4.99 4.61 2.0% United Statesc 0.99 1.50 2.40 2.99 2.71 2.31 3.3%
Constant 2016 dollarsd per gallon
Average annual percentage
change 1990 2000 2005 2010 2015 2016 1990–2016 China b b 2.08 4.02 b b b Japan 3.21 3.98 4.23 5.36 3.71 3.55 0.4% Korea b 2.86 4.89 5.42 4.41 3.86 b France 3.27 4.11 5.91 6.32 4.89 4.63 1.3% United Kingdom 3.75 6.49 7.69 7.68 6.73 5.63 1.6% Germany 4.99 3.89 6.15 6.77 5.06 4.61 -0.3% United Statesc 1.82 2.08 2.94 3.30 2.75 2.31 0.9%
Note: Comparisons between prices and price trends in different countries require care. They are of limited validity because of fluctuations in exchange rates; differences in product quality, marketing practices, and market structures; and the extent to which the standard categories of sales are representative of total national sales for a given period. Source: International Energy Agency, Energy Prices and Taxes, First Quarter, 2017, Paris, France, 2017. (Additional
resources: www.iea.org) a Prices represent the retail prices (including taxes) for car diesel fuel for non-commercial (household) use. b Data are not available. c These estimates are for international comparisons only and do not necessarily correspond to gasoline price estimates in other sections of the book. d Adjusted by the U.S. Consumer Price Inflation Index.

10–8
TRANSPORTATION ENERGY DATA BOOK: EDITION 36—2017
In 2016 over sixty percent of the cost of gasoline in France, Germany, and the United Kingdom went for taxes. Of the listed countries, the United States has the lowest percentage of taxes.
Figure 10.2. Gasoline Prices for Selected Countries, 1990 and 2016
Source: Table 10.3 and International Energy Agency, Energy Prices & Taxes, First Quarter, 2017, Paris, France, 2017.
(Additional resources: www.iea.org)
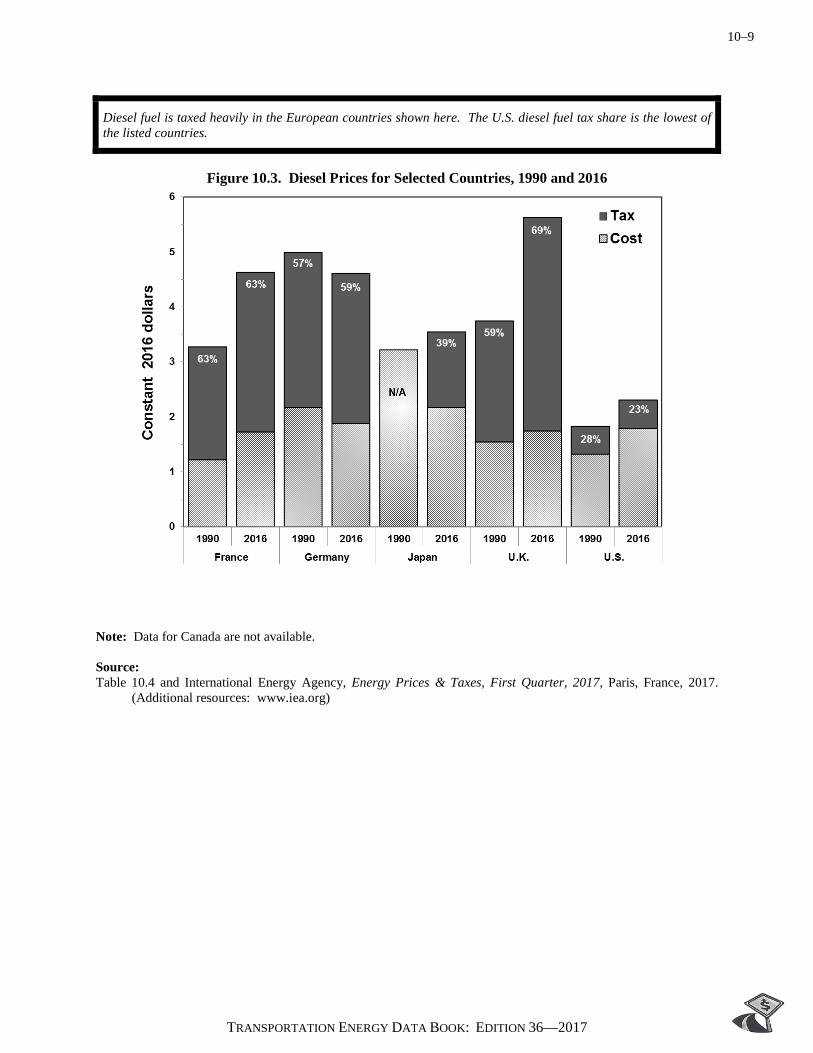
10–9
TRANSPORTATION ENERGY DATA BOOK: EDITION 36—2017
Diesel fuel is taxed heavily in the European countries shown here. The U.S. diesel fuel tax share is the lowest of the listed countries.
Figure 10.3. Diesel Prices for Selected Countries, 1990 and 2016
Note: Data for Canada are not available. Source: Table 10.4 and International Energy Agency, Energy Prices & Taxes, First Quarter, 2017, Paris, France, 2017.
(Additional resources: www.iea.org)
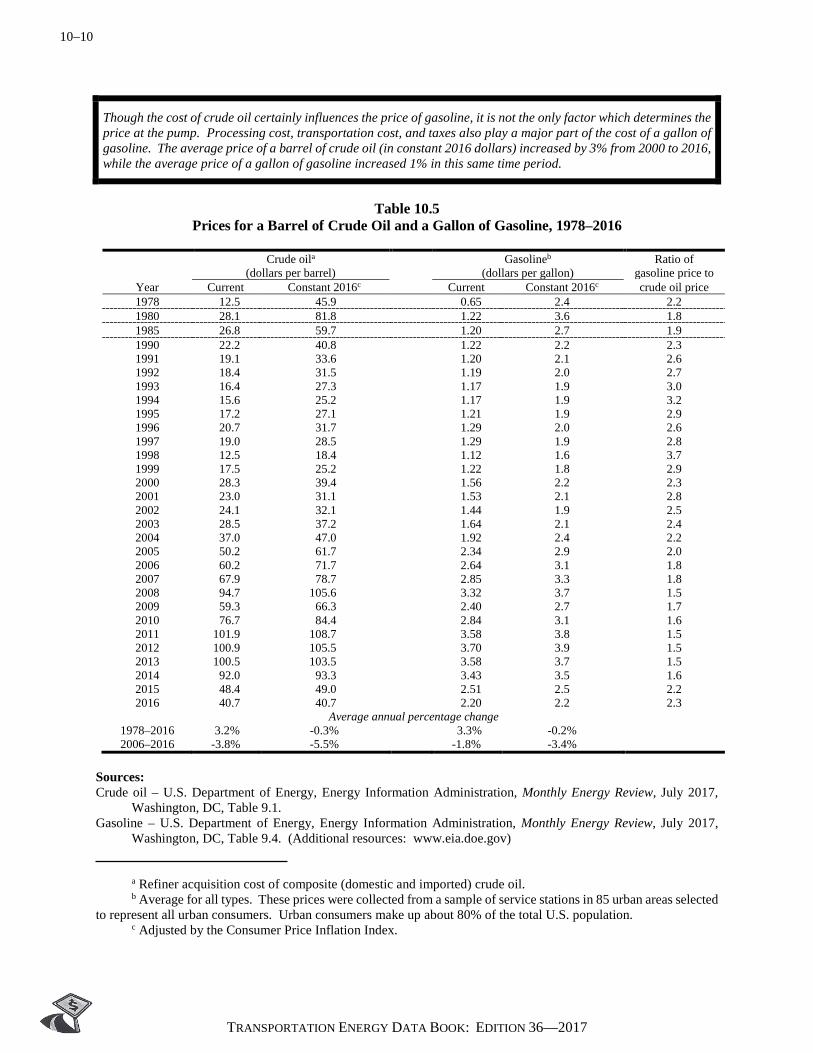
10–10
TRANSPORTATION ENERGY DATA BOOK: EDITION 36—2017
Though the cost of crude oil certainly influences the price of gasoline, it is not the only factor which determines the price at the pump. Processing cost, transportation cost, and taxes also play a major part of the cost of a gallon of gasoline. The average price of a barrel of crude oil (in constant 2016 dollars) increased by 3% from 2000 to 2016, while the average price of a gallon of gasoline increased 1% in this same time period.
Table 10.5
Prices for a Barrel of Crude Oil and a Gallon of Gasoline, 1978–2016
Crude oila
(dollars per barrel) Gasolineb
(dollars per gallon) Ratio of
gasoline price to Year Current Constant 2016c Current Constant 2016c crude oil price 1978 12.5 45.9 0.65 2.4 2.2 1980 28.1 81.8 1.22 3.6 1.8 1985 26.8 59.7 1.20 2.7 1.9 1990 22.2 40.8 1.22 2.2 2.3 1991 19.1 33.6 1.20 2.1 2.6 1992 18.4 31.5 1.19 2.0 2.7 1993 16.4 27.3 1.17 1.9 3.0 1994 15.6 25.2 1.17 1.9 3.2 1995 17.2 27.1 1.21 1.9 2.9 1996 20.7 31.7 1.29 2.0 2.6 1997 19.0 28.5 1.29 1.9 2.8 1998 12.5 18.4 1.12 1.6 3.7 1999 17.5 25.2 1.22 1.8 2.9 2000 28.3 39.4 1.56 2.2 2.3 2001 23.0 31.1 1.53 2.1 2.8 2002 24.1 32.1 1.44 1.9 2.5 2003 28.5 37.2 1.64 2.1 2.4 2004 37.0 47.0 1.92 2.4 2.2 2005 50.2 61.7 2.34 2.9 2.0 2006 60.2 71.7 2.64 3.1 1.8 2007 67.9 78.7 2.85 3.3 1.8 2008 94.7 105.6 3.32 3.7 1.5 2009 59.3 66.3 2.40 2.7 1.7 2010 76.7 84.4 2.84 3.1 1.6 2011 101.9 108.7 3.58 3.8 1.5 2012 100.9 105.5 3.70 3.9 1.5 2013 100.5 103.5 3.58 3.7 1.5 2014 92.0 93.3 3.43 3.5 1.6 2015 48.4 49.0 2.51 2.5 2.2 2016 40.7 40.7 2.20 2.2 2.3
Average annual percentage change 1978–2016 3.2% -0.3% 3.3% -0.2% 2006–2016 -3.8% -5.5% -1.8% -3.4%
Sources: Crude oil – U.S. Department of Energy, Energy Information Administration, Monthly Energy Review, July 2017,
Washington, DC, Table 9.1. Gasoline – U.S. Department of Energy, Energy Information Administration, Monthly Energy Review, July 2017,
Washington, DC, Table 9.4. (Additional resources: www.eia.doe.gov) a Refiner acquisition cost of composite (domestic and imported) crude oil. b Average for all types. These prices were collected from a sample of service stations in 85 urban areas selected to represent all urban consumers. Urban consumers make up about 80% of the total U.S. population. c Adjusted by the Consumer Price Inflation Index.

10–11
TRANSPORTATION ENERGY DATA BOOK: EDITION 36—2017
The price of diesel fuel was lower than gasoline in constant dollars prior to 2005 but since that time the price of diesel fuel has increased to become higher than gasoline. Prices for both fuels declined substantially since 2015.
Table 10.6
Retail Prices for Motor Fuel, 1978–2016 (cents per gallon, including tax)
Diesel fuela Average for all gasoline typesb
Year Current Constant
2016c Current Constant
2016c 1978 d d 65 240 1980 101 294 122 356 1985 122 272 120 267 1986 94 206 93 204 1987 96 203 96 202 1988 95 193 96 195 1989 102 197 106 205 1990 107 196 122 223 1991 91 160 120 211 1992 106 181 119 204 1993 98 163 117 195 1994 111 180 117 190 1995 111 175 121 190 1996 124 189 129 197 1997 120 179 129 193 1998 104 154 112 164 1999 112 162 122 176 2000 149 208 156 218 2001 140 190 153 207 2002 132 176 144 192 2003 151 197 164 214 2004 181 230 192 244 2005 240 295 234 287 2006 271 322 264 314 2007 289 334 285 330 2008 380 424 332 370 2009 247 276 240 269 2010 299 330 284 313 2011 384 410 358 382 2012 397 415 370 386 2013 392 404 358 369 2014 383 388 343 347 2015 271 274 251 254 2016 230 230 220 220
Average annual percentage change 1978–2016 2.3%e -0.7%c 3.3% -0.2% 2006–2016 -1.6% -3.3% -1.8% -3.5%
Sources: Gasoline – U.S. Department of Energy, Energy Information Administration, Monthly Energy Review, July 2017,
Washington, DC, Table 9.4. Diesel – U.S. Department of Energy, Energy Information Administration, International Energy Annual 2004,
Washington, DC, June 2004, Table 7.2. 2005–2016 data from EIA website. (Additional resources: www.eia.doe.gov)
a 1980-1993: Collected from a survey of prices on January 1 of the current year. 1994-on: Annual average. b These prices were collected from a sample of service stations in 85 urban areas selected to represent all urban consumers. Urban consumers make up about 80 percent of the total U.S. population. c Adjusted by the Consumer Price Inflation Index. d Data are not available. e Average annual percentage change is from the earliest year possible to 2016.

10–12
TRANSPORTATION ENERGY DATA BOOK: EDITION 36—2017
Major oil price shocks have disrupted world energy markets five times in the past 30 years (1973-74, 1979-80, 1990-91, 1999-2000, 2008). Most of the oil price shocks were followed by an economic recession in the United States.
Figure 10.4. Oil Price and Economic Growth, 1970–2016
Source: Greene, D.L. and N. I. Tishchishyna, Costs of Oil Dependence: A 2000 Update, Oak Ridge National Laboratory,
ORNL/TM-2000/152, Oak Ridge, TN, 2000, and data updates, 2017. (Additional resources: cta.ornl.gov/cta/publications.shtml)
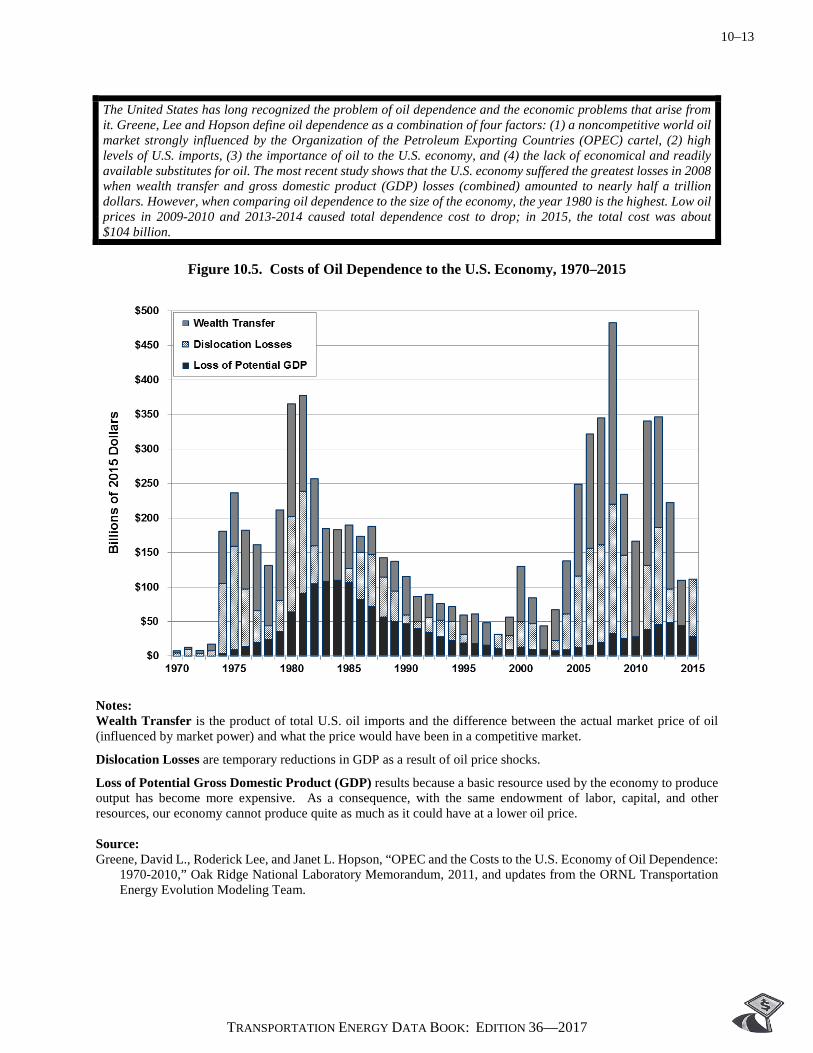
10–13
TRANSPORTATION ENERGY DATA BOOK: EDITION 36—2017
The United States has long recognized the problem of oil dependence and the economic problems that arise from it. Greene, Lee and Hopson define oil dependence as a combination of four factors: (1) a noncompetitive world oil market strongly influenced by the Organization of the Petroleum Exporting Countries (OPEC) cartel, (2) high levels of U.S. imports, (3) the importance of oil to the U.S. economy, and (4) the lack of economical and readily available substitutes for oil. The most recent study shows that the U.S. economy suffered the greatest losses in 2008 when wealth transfer and gross domestic product (GDP) losses (combined) amounted to nearly half a trillion dollars. However, when comparing oil dependence to the size of the economy, the year 1980 is the highest. Low oil prices in 2009-2010 and 2013-2014 caused total dependence cost to drop; in 2015, the total cost was about $104 billion.
Figure 10.5. Costs of Oil Dependence to the U.S. Economy, 1970–2015
Notes: Wealth Transfer is the product of total U.S. oil imports and the difference between the actual market price of oil (influenced by market power) and what the price would have been in a competitive market.
Dislocation Losses are temporary reductions in GDP as a result of oil price shocks.
Loss of Potential Gross Domestic Product (GDP) results because a basic resource used by the economy to produce output has become more expensive. As a consequence, with the same endowment of labor, capital, and other resources, our economy cannot produce quite as much as it could have at a lower oil price. Source: Greene, David L., Roderick Lee, and Janet L. Hopson, “OPEC and the Costs to the U.S. Economy of Oil Dependence:
1970-2010,” Oak Ridge National Laboratory Memorandum, 2011, and updates from the ORNL Transportation Energy Evolution Modeling Team.
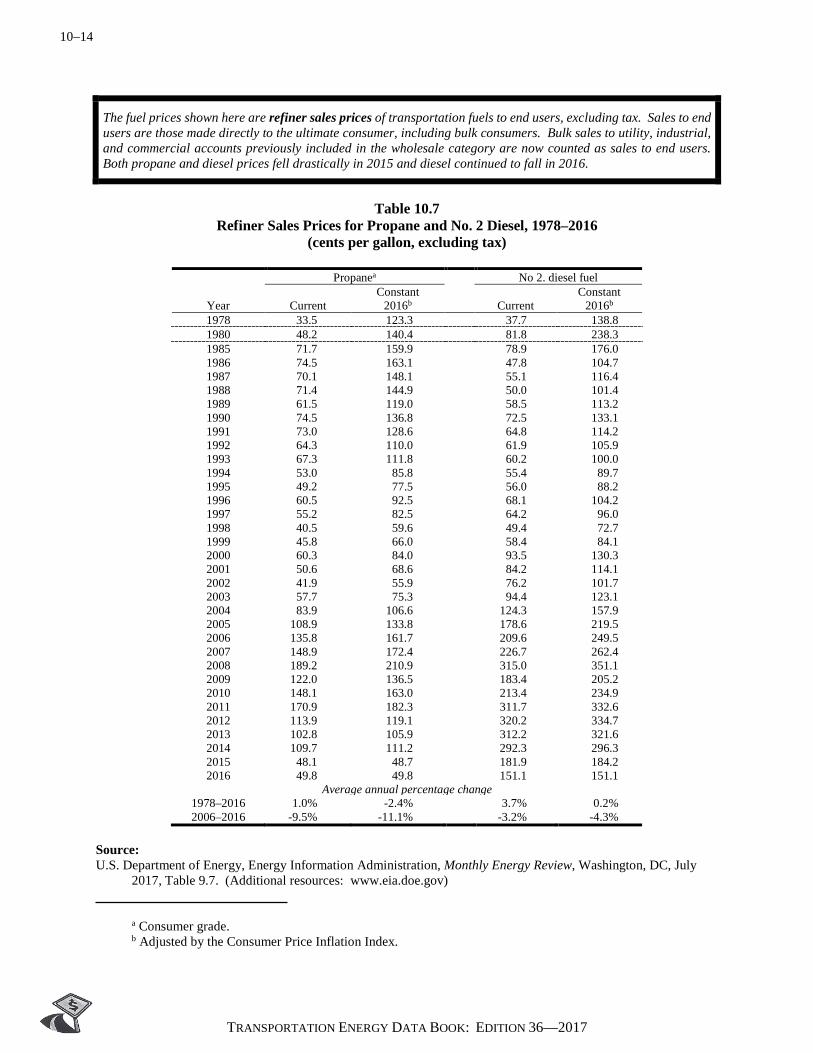
10–14
TRANSPORTATION ENERGY DATA BOOK: EDITION 36—2017
The fuel prices shown here are refiner sales prices of transportation fuels to end users, excluding tax. Sales to end users are those made directly to the ultimate consumer, including bulk consumers. Bulk sales to utility, industrial, and commercial accounts previously included in the wholesale category are now counted as sales to end users. Both propane and diesel prices fell drastically in 2015 and diesel continued to fall in 2016.
Table 10.7
Refiner Sales Prices for Propane and No. 2 Diesel, 1978–2016 (cents per gallon, excluding tax)
Propanea No 2. diesel fuel Constant Constant
Year Current 2016b Current 2016b 1978 33.5 123.3 37.7 138.8 1980 48.2 140.4 81.8 238.3 1985 71.7 159.9 78.9 176.0 1986 74.5 163.1 47.8 104.7 1987 70.1 148.1 55.1 116.4 1988 71.4 144.9 50.0 101.4 1989 61.5 119.0 58.5 113.2 1990 74.5 136.8 72.5 133.1 1991 73.0 128.6 64.8 114.2 1992 64.3 110.0 61.9 105.9 1993 67.3 111.8 60.2 100.0 1994 53.0 85.8 55.4 89.7 1995 49.2 77.5 56.0 88.2 1996 60.5 92.5 68.1 104.2 1997 55.2 82.5 64.2 96.0 1998 40.5 59.6 49.4 72.7 1999 45.8 66.0 58.4 84.1 2000 60.3 84.0 93.5 130.3 2001 50.6 68.6 84.2 114.1 2002 41.9 55.9 76.2 101.7 2003 57.7 75.3 94.4 123.1 2004 83.9 106.6 124.3 157.9 2005 108.9 133.8 178.6 219.5 2006 135.8 161.7 209.6 249.5 2007 148.9 172.4 226.7 262.4 2008 189.2 210.9 315.0 351.1 2009 122.0 136.5 183.4 205.2 2010 148.1 163.0 213.4 234.9 2011 170.9 182.3 311.7 332.6 2012 113.9 119.1 320.2 334.7 2013 102.8 105.9 312.2 321.6 2014 109.7 111.2 292.3 296.3 2015 48.1 48.7 181.9 184.2 2016 49.8 49.8 151.1 151.1
Average annual percentage change 1978–2016 1.0% -2.4% 3.7% 0.2% 2006–2016 -9.5% -11.1% -3.2% -4.3%
Source: U.S. Department of Energy, Energy Information Administration, Monthly Energy Review, Washington, DC, July
2017, Table 9.7. (Additional resources: www.eia.doe.gov) a Consumer grade. b Adjusted by the Consumer Price Inflation Index.
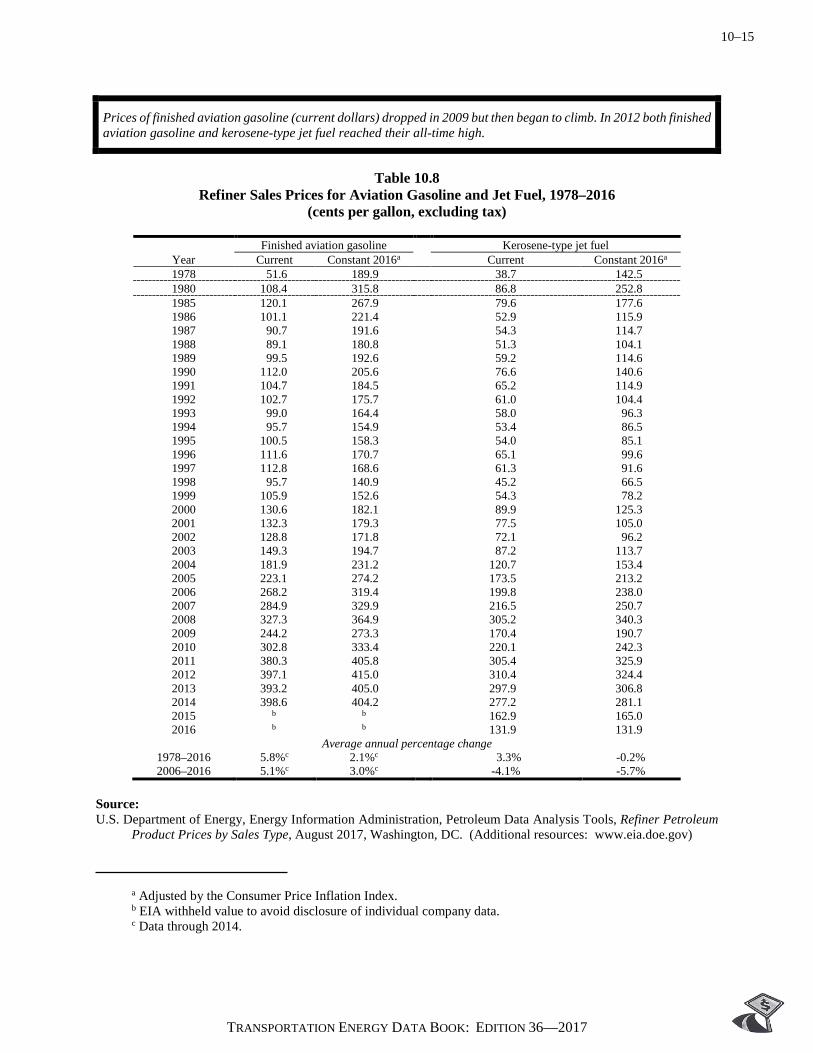
10–15
TRANSPORTATION ENERGY DATA BOOK: EDITION 36—2017
Prices of finished aviation gasoline (current dollars) dropped in 2009 but then began to climb. In 2012 both finished aviation gasoline and kerosene-type jet fuel reached their all-time high.
Table 10.8
Refiner Sales Prices for Aviation Gasoline and Jet Fuel, 1978–2016 (cents per gallon, excluding tax)
Finished aviation gasoline Kerosene-type jet fuel
Year Current Constant 2016a Current Constant 2016a 1978 51.6 189.9 38.7 142.5 1980 108.4 315.8 86.8 252.8 1985 120.1 267.9 79.6 177.6 1986 101.1 221.4 52.9 115.9 1987 90.7 191.6 54.3 114.7 1988 89.1 180.8 51.3 104.1 1989 99.5 192.6 59.2 114.6 1990 112.0 205.6 76.6 140.6 1991 104.7 184.5 65.2 114.9 1992 102.7 175.7 61.0 104.4 1993 99.0 164.4 58.0 96.3 1994 95.7 154.9 53.4 86.5 1995 100.5 158.3 54.0 85.1 1996 111.6 170.7 65.1 99.6 1997 112.8 168.6 61.3 91.6 1998 95.7 140.9 45.2 66.5 1999 105.9 152.6 54.3 78.2 2000 130.6 182.1 89.9 125.3 2001 132.3 179.3 77.5 105.0 2002 128.8 171.8 72.1 96.2 2003 149.3 194.7 87.2 113.7 2004 181.9 231.2 120.7 153.4 2005 223.1 274.2 173.5 213.2 2006 268.2 319.4 199.8 238.0 2007 284.9 329.9 216.5 250.7 2008 327.3 364.9 305.2 340.3 2009 244.2 273.3 170.4 190.7 2010 302.8 333.4 220.1 242.3 2011 380.3 405.8 305.4 325.9 2012 397.1 415.0 310.4 324.4 2013 393.2 405.0 297.9 306.8 2014 398.6 404.2 277.2 281.1 2015 b b 162.9 165.0 2016 b b 131.9 131.9
Average annual percentage change 1978–2016 5.8%c 2.1%c 3.3% -0.2% 2006–2016 5.1%c 3.0%c -4.1% -5.7%
Source: U.S. Department of Energy, Energy Information Administration, Petroleum Data Analysis Tools, Refiner Petroleum
Product Prices by Sales Type, August 2017, Washington, DC. (Additional resources: www.eia.doe.gov) a Adjusted by the Consumer Price Inflation Index. b EIA withheld value to avoid disclosure of individual company data. c Data through 2014.
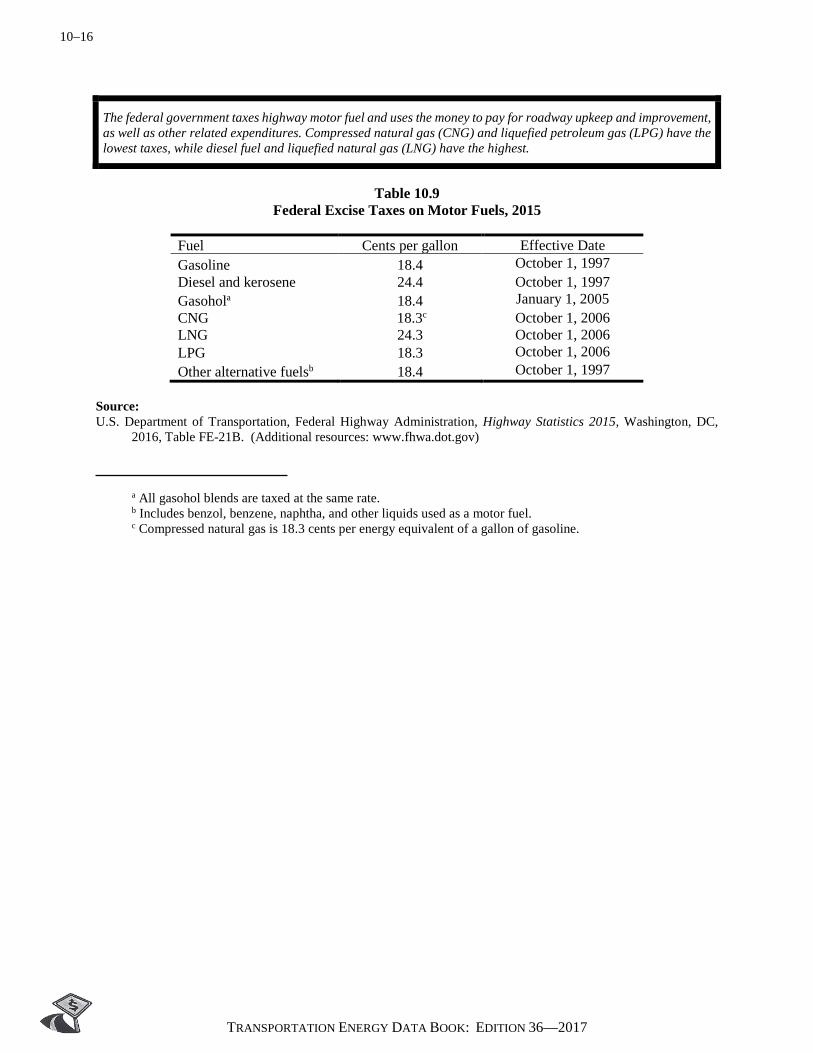
10–16
TRANSPORTATION ENERGY DATA BOOK: EDITION 36—2017
The federal government taxes highway motor fuel and uses the money to pay for roadway upkeep and improvement, as well as other related expenditures. Compressed natural gas (CNG) and liquefied petroleum gas (LPG) have the lowest taxes, while diesel fuel and liquefied natural gas (LNG) have the highest.
Table 10.9
Federal Excise Taxes on Motor Fuels, 2015
Fuel Cents per gallon Effective Date Gasoline 18.4 October 1, 1997 Diesel and kerosene 24.4 October 1, 1997 Gasohola 18.4 January 1, 2005 CNG 18.3c October 1, 2006 LNG 24.3 October 1, 2006 LPG 18.3 October 1, 2006 Other alternative fuelsb 18.4 October 1, 1997
Source: U.S. Department of Transportation, Federal Highway Administration, Highway Statistics 2015, Washington, DC,
2016, Table FE-21B. (Additional resources: www.fhwa.dot.gov) a All gasohol blends are taxed at the same rate. b Includes benzol, benzene, naphtha, and other liquids used as a motor fuel. c Compressed natural gas is 18.3 cents per energy equivalent of a gallon of gasoline.
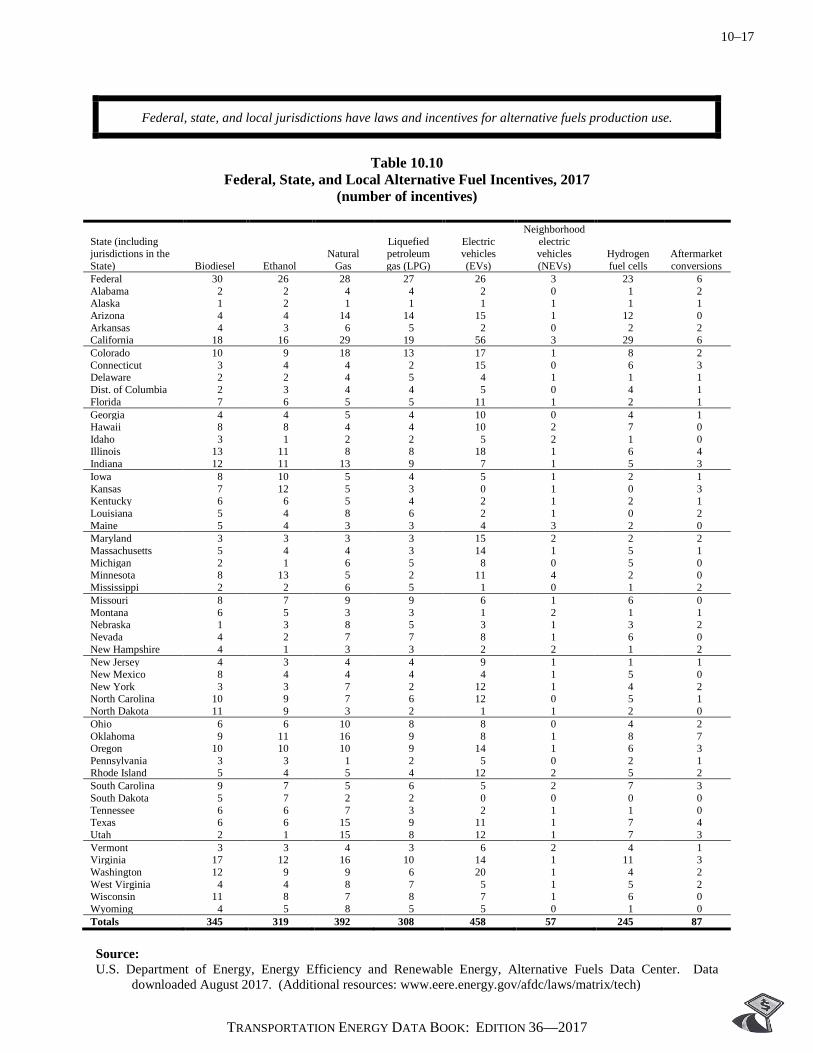
10–17
TRANSPORTATION ENERGY DATA BOOK: EDITION 36—2017
Federal, state, and local jurisdictions have laws and incentives for alternative fuels production use.
Table 10.10
Federal, State, and Local Alternative Fuel Incentives, 2017 (number of incentives)
State (including jurisdictions in the State) Biodiesel Ethanol
Natural Gas
Liquefied petroleum gas (LPG)
Electric vehicles (EVs)
Neighborhood electric vehicles (NEVs)
Hydrogen fuel cells
Aftermarket conversions
Federal 30 26 28 27 26 3 23 6 Alabama 2 2 4 4 2 0 1 2 Alaska 1 2 1 1 1 1 1 1 Arizona 4 4 14 14 15 1 12 0 Arkansas 4 3 6 5 2 0 2 2 California 18 16 29 19 56 3 29 6 Colorado 10 9 18 13 17 1 8 2 Connecticut 3 4 4 2 15 0 6 3 Delaware 2 2 4 5 4 1 1 1 Dist. of Columbia 2 3 4 4 5 0 4 1 Florida 7 6 5 5 11 1 2 1 Georgia 4 4 5 4 10 0 4 1 Hawaii 8 8 4 4 10 2 7 0 Idaho 3 1 2 2 5 2 1 0 Illinois 13 11 8 8 18 1 6 4 Indiana 12 11 13 9 7 1 5 3 Iowa 8 10 5 4 5 1 2 1 Kansas 7 12 5 3 0 1 0 3 Kentucky 6 6 5 4 2 1 2 1 Louisiana 5 4 8 6 2 1 0 2 Maine 5 4 3 3 4 3 2 0 Maryland 3 3 3 3 15 2 2 2 Massachusetts 5 4 4 3 14 1 5 1 Michigan 2 1 6 5 8 0 5 0 Minnesota 8 13 5 2 11 4 2 0 Mississippi 2 2 6 5 1 0 1 2 Missouri 8 7 9 9 6 1 6 0 Montana 6 5 3 3 1 2 1 1 Nebraska 1 3 8 5 3 1 3 2 Nevada 4 2 7 7 8 1 6 0 New Hampshire 4 1 3 3 2 2 1 2 New Jersey 4 3 4 4 9 1 1 1 New Mexico 8 4 4 4 4 1 5 0 New York 3 3 7 2 12 1 4 2 North Carolina 10 9 7 6 12 0 5 1 North Dakota 11 9 3 2 1 1 2 0 Ohio 6 6 10 8 8 0 4 2 Oklahoma 9 11 16 9 8 1 8 7 Oregon 10 10 10 9 14 1 6 3 Pennsylvania 3 3 1 2 5 0 2 1 Rhode Island 5 4 5 4 12 2 5 2 South Carolina 9 7 5 6 5 2 7 3 South Dakota 5 7 2 2 0 0 0 0 Tennessee 6 6 7 3 2 1 1 0 Texas 6 6 15 9 11 1 7 4 Utah 2 1 15 8 12 1 7 3 Vermont 3 3 4 3 6 2 4 1 Virginia 17 12 16 10 14 1 11 3 Washington 12 9 9 6 20 1 4 2 West Virginia 4 4 8 7 5 1 5 2 Wisconsin 11 8 7 8 7 1 6 0 Wyoming 4 5 8 5 5 0 1 0 Totals 345 319 392 308 458 57 245 87 Source: U.S. Department of Energy, Energy Efficiency and Renewable Energy, Alternative Fuels Data Center. Data
downloaded August 2017. (Additional resources: www.eere.energy.gov/afdc/laws/matrix/tech)

10–18
TRANSPORTATION ENERGY DATA BOOK: EDITION 36—2017
Table 10.11 Federal, State, and Local Advanced Technology Incentives, 2017
(number of incentives)
State (including jurisdictions in the State)
Hybrid electric vehicles (HEV) or plug-in hybrid vehicles (PHEVs)
Fuel economy or efficiency Idle reduction Othera
Federal 38 13 7 6 Alabama 3 1 4 0 Alaska 1 1 1 0 Arizona 16 0 2 1 Arkansas 2 0 1 1 California 71 7 5 12 Colorado 22 2 3 3 Connecticut 15 1 2 2 Delaware 5 2 2 2 Dist. of Columbia 5 3 1 0 Florida 12 1 1 0 Georgia 11 0 2 1 Hawaii 13 1 1 1 Idaho 8 1 0 0 Illinois 15 3 5 0 Indiana 9 3 4 2 Iowa 5 0 1 0 Kansas 0 0 1 0 Kentucky 1 0 0 1 Louisiana 3 1 0 0 Maine 5 2 3 1 Maryland 11 1 3 2 Massachusetts 12 0 3 1 Michigan 7 0 0 0 Minnesota 11 1 3 1 Mississippi 2 1 1 0 Missouri 6 0 1 0 Montana 1 1 0 0 Nebraska 2 0 1 0 Nevada 11 0 1 0 New Hampshire 1 2 5 3 New Jersey 9 4 1 4 New Mexico 5 1 1 0 New York 13 3 3 4 North Carolina 12 1 3 0 North Dakota 0 0 0 1 Ohio 5 0 2 0 Oklahoma 9 0 1 3 Oregon 15 1 3 2 Pennsylvania 4 1 3 1 Rhode Island 12 3 5 6 South Carolina 10 1 3 1 South Dakota 0 0 0 1 Tennessee 3 1 1 0 Texas 11 1 3 1 Utah 11 3 3 5 Vermont 7 2 4 2 Virginia 16 2 2 3 Washington 18 2 2 3 West Virginia 4 0 2 1 Wisconsin 9 0 1 0 Wyoming 4 0 1 0 Totals 501 74 108 78
Source: U.S. Department of Energy, Energy Efficiency and Renewable Energy, Alternative Fuels Data Center. Data
downloaded August 2017. (Additional resources: www.eere.energy.gov/afdc/laws/matrix/tech) a Includes Clean Fuel Initiatives and Pollution Prevention.

10–19
TRANSPORTATION ENERGY DATA BOOK: EDITION 36—2017
The average price of a new car in 2016 ($25,774) was close to the average price in 1916 ($23,798) when adjusted for inflation. Average new car prices were at their lowest in 1940 ($13,311). Since 1914 the highest average price was in the year 1998 ($32,102).
Table 10.12
Average Price of a New Car, 1913–2016
Year
2016 Constant dollars Year
2016 Constant dollars Year
2016 Constant dollars Year
2016 Constant dollars
1913 $34,689 1939 $14,319 1965 $21,048 1991 $27,270 1914 $35,899 1940 $13,311 1966 $21,032 1992 $28,459 1915 $29,848 1941 $13,483 1967 $23,110 1993 $28,022 1916 $23,798 1942 $13,656 1968 $21,776 1994 $28,994 1917 $21,983 1943 $13,829 1969 $23,262 1995 $28,283 1918 $20,168 1944 $14,001 1970 $21,910 1996 $28,723 1919 $19,966 1945 $14,174 1971 $22,175 1997 $31,442 1920 $19,764 1946 $14,346 1972 $22,272 1998 $32,102 1921 $20,974 1947 $14,519 1973 $21,903 1999 $31,297 1922 $22,185 1948 $15,206 1974 $21,615 2000 $29,860 1923 $20,168 1949 $17,719 1975 $22,082 2001 $28,879 1924 $18,151 1950 $18,159 1976 $22,853 2002 $28,291 1925 $17,949 1951 $18,468 1977 $23,026 2003 $27,417 1926 $17,748 1952 $20,005 1978 $23,482 2004 $27,277 1927 $17,546 1953 $20,030 1979 $22,635 2005 $27,594 1928 $17,344 1954 $19,666 1980 $22,061 2006 $27,485 1929 $17,143 1955 $19,559 1981 $23,525 2007 $26,986 1930 $16,941 1956 $20,123 1982 $24,598 2008 $25,421 1931 $18,958 1957 $22,354 1983 $25,557 2009 $24,894 1932 $20,974 1958 $23,648 1984 $26,276 2010 $26,485 1933 $19,764 1959 $23,698 1985 $26,405 2011 $26,156 1934 $18,554 1960 $22,804 1986 $27,706 2012 $25,653 1935 $16,538 1961 $21,714 1987 $28,281 2013 $25,194 1936 $14,521 1962 $21,586 1988 $28,265 2014 $24,703 1937 $14,924 1963 $21,348 1989 $27,816 2015 $24,662 1938 $15,327 1964 $21,454 1990 $27,622 2016 $25,774
Note: These data are based on an average car and do not include prices for pickups, vans, or sport utility vehicles. Estimations were used for years 1941-1946. Sources: Compiled by Jacob Ward, Vehicle Technologies Program, U.S. Department of Energy, from the following sources.
Raff, D.M.G. & Trajtenberg, M. (1995), "Quality-Adjusted Prices for the American Automobile Industry: 1906-1940," National Bureau of Economic Research, Inc.; Gordon, R.J. (1990), The Measurement of Durable Goods Prices, National Bureau of Economic Research, Inc.; and U.S. Department of Commerce, Bureau of Economic Analysis (2017), National Income and Product Accounts.

10–20
TRANSPORTATION ENERGY DATA BOOK: EDITION 36—2017
In current dollars, import cars, on average, were less expensive than domestic cars until 1982. Since then, import prices have more than tripled, while domestic prices have more than doubled (current dollars).
Table 10.13
Average Price of a New Car (Domestic and Import), 1970–2016
Domestica Import Total
Year Current dollars
Constant 2016 dollarsb
Current dollars
Constant 2016 dollarsb
Current dollars
Constant 2016 dollarsb
1970 3,708 22,938 2,648 16,381 3,542 21,911 1975 5,084 22,680 4,384 19,557 4,950 22,082 1980 7,609 22,165 7,482 21,795 7,574 22,063 1985 11,589 25,855 12,853 28,675 11,838 26,411 1986 12,319 26,979 13,670 29,937 12,652 27,708 1987 12,922 27,304 14,470 30,575 13,386 28,285 1988 13,418 27,225 15,221 30,883 13,932 28,268 1989 13,936 26,980 15,510 30,027 14,371 27,822 1990 14,489 26,602 16,640 30,551 15,042 27,617 1991 15,192 26,768 16,327 28,768 15,475 27,267 1992 15,644 26,767 18,593 31,813 16,636 28,464 1993 15,976 26,536 20,261 33,654 16,871 28,023 1994 16,930 27,410 21,989 35,600 17,903 28,985 1995 16,864 26,561 23,202 36,543 17,959 28,285 1996 17,468 26,726 26,205 40,094 18,777 28,729 1997 17,532 26,210 27,718 41,438 21,026 31,434 1998 18,501 27,233 28,695 42,239 21,802 32,093 1999 19,006 27,388 27,472 39,587 21,725 31,306 2000 19,561 27,268 26,008 36,255 21,424 29,865 2001 20,004 27,105 25,809 34,971 21,310 28,875 2002 20,431 27,255 25,612 34,166 21,206 28,289 2003 19,961 26,029 26,136 34,081 21,019 27,409 2004 20,509 26,067 25,942 32,972 21,469 27,287 2005 21,565 26,503 26,622 32,718 22,454 27,596 2006 22,139 26,368 27,061 32,230 23,087 27,497 2007 22,264 25,782 27,463 31,802 23,313 26,996 2008 22,192 24,744 25,902 28,881 22,804 25,426 2009 22,080 24,708 25,223 28,225 22,252 24,900 2010 23,768 26,169 27,232 29,982 24,063 26,493 2011 24,167 25,786 28,284 30,179 24,514 26,156 2012 24,131 25,217 28,973 30,277 24,540 25,644 2013 23,921 24,639 29,769 30,662 24,454 25,188 2014 23,787 24,120 29,935 30,354 24,366 24,707 2015 23,981 24,293 29,284 29,665 24,355 24,672 2016 24,414 24,414 29,913 29,913 25,774 25,774
Average annual percentage change 1970–2016 4.2% 0.1% 5.4% 1.3% 4.4% 0.4% 2006–2016 1.0% -0.8% 1.0% -0.7% 1.1% -0.6%
Note: These data are based on an average car and do not include prices for pickups, vans, or sport utility vehicles. Source: U.S. Department of Commerce, Bureau of Economic Analysis, Average Transaction Price per New Car, Washington,
DC, 2017. (Additional resources: www.bea.gov) a Includes all vehicles produced in the United States regardless of manufacturer. b Adjusted by the Consumer Price Inflation Index.
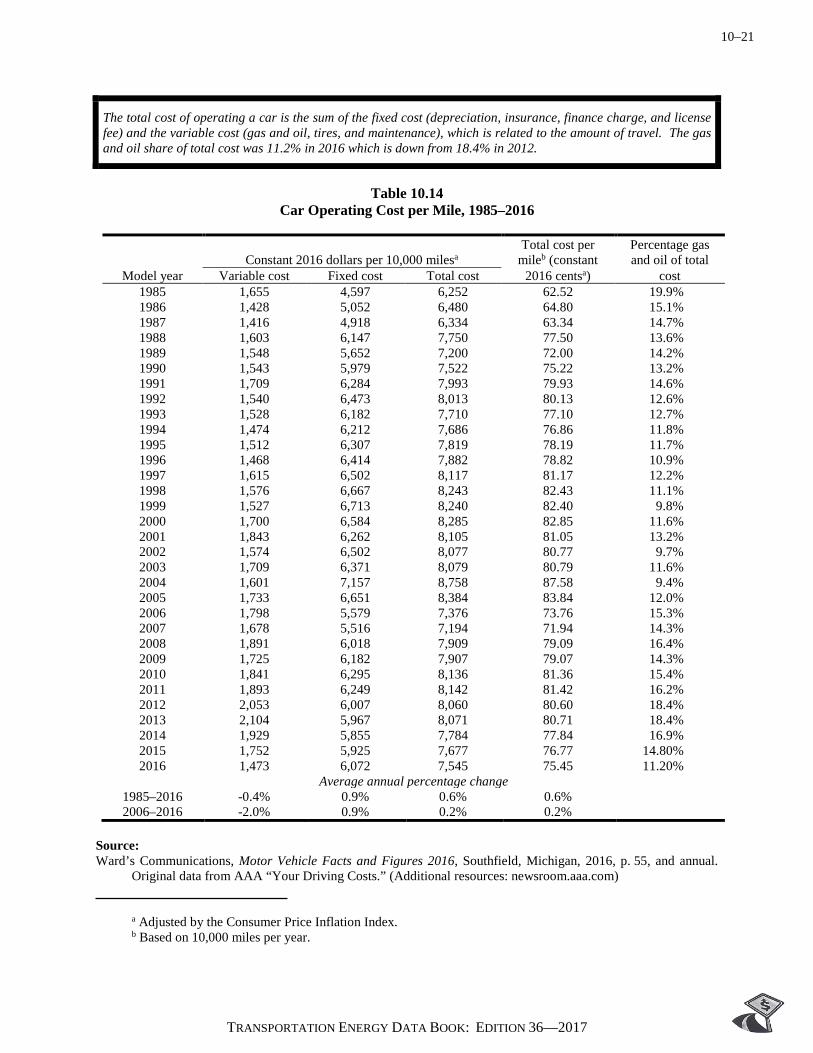
10–21
TRANSPORTATION ENERGY DATA BOOK: EDITION 36—2017
The total cost of operating a car is the sum of the fixed cost (depreciation, insurance, finance charge, and license fee) and the variable cost (gas and oil, tires, and maintenance), which is related to the amount of travel. The gas and oil share of total cost was 11.2% in 2016 which is down from 18.4% in 2012.
Table 10.14
Car Operating Cost per Mile, 1985–2016
Constant 2016 dollars per 10,000 milesa Total cost per
mileb (constant Percentage gas and oil of total
Model year Variable cost Fixed cost Total cost 2016 centsa) cost 1985 1,655 4,597 6,252 62.52 19.9% 1986 1,428 5,052 6,480 64.80 15.1% 1987 1,416 4,918 6,334 63.34 14.7% 1988 1,603 6,147 7,750 77.50 13.6% 1989 1,548 5,652 7,200 72.00 14.2% 1990 1,543 5,979 7,522 75.22 13.2% 1991 1,709 6,284 7,993 79.93 14.6% 1992 1,540 6,473 8,013 80.13 12.6% 1993 1,528 6,182 7,710 77.10 12.7% 1994 1,474 6,212 7,686 76.86 11.8% 1995 1,512 6,307 7,819 78.19 11.7% 1996 1,468 6,414 7,882 78.82 10.9% 1997 1,615 6,502 8,117 81.17 12.2% 1998 1,576 6,667 8,243 82.43 11.1% 1999 1,527 6,713 8,240 82.40 9.8% 2000 1,700 6,584 8,285 82.85 11.6% 2001 1,843 6,262 8,105 81.05 13.2% 2002 1,574 6,502 8,077 80.77 9.7% 2003 1,709 6,371 8,079 80.79 11.6% 2004 1,601 7,157 8,758 87.58 9.4% 2005 1,733 6,651 8,384 83.84 12.0% 2006 1,798 5,579 7,376 73.76 15.3% 2007 1,678 5,516 7,194 71.94 14.3% 2008 1,891 6,018 7,909 79.09 16.4% 2009 1,725 6,182 7,907 79.07 14.3% 2010 1,841 6,295 8,136 81.36 15.4% 2011 1,893 6,249 8,142 81.42 16.2% 2012 2,053 6,007 8,060 80.60 18.4% 2013 2,104 5,967 8,071 80.71 18.4% 2014 1,929 5,855 7,784 77.84 16.9% 2015 1,752 5,925 7,677 76.77 14.80% 2016 1,473 6,072 7,545 75.45 11.20%
Average annual percentage change 1985–2016 -0.4% 0.9% 0.6% 0.6% 2006–2016 -2.0% 0.9% 0.2% 0.2%
Source: Ward’s Communications, Motor Vehicle Facts and Figures 2016, Southfield, Michigan, 2016, p. 55, and annual.
Original data from AAA “Your Driving Costs.” (Additional resources: newsroom.aaa.com) a Adjusted by the Consumer Price Inflation Index. b Based on 10,000 miles per year.
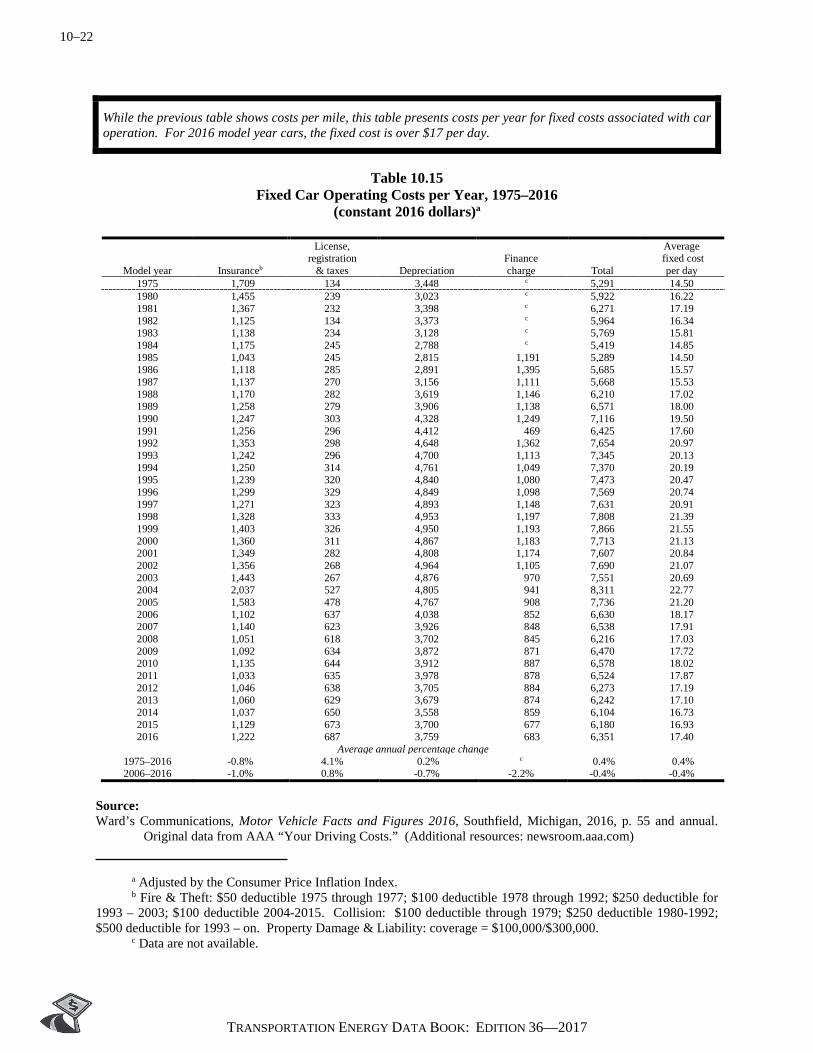
10–22
TRANSPORTATION ENERGY DATA BOOK: EDITION 36—2017
While the previous table shows costs per mile, this table presents costs per year for fixed costs associated with car operation. For 2016 model year cars, the fixed cost is over $17 per day.
Table 10.15
Fixed Car Operating Costs per Year, 1975–2016 (constant 2016 dollars)a
License, Average registration Finance fixed cost
Model year Insuranceb & taxes Depreciation charge Total per day 1975 1,709 134 3,448 c 5,291 14.50 1980 1,455 239 3,023 c 5,922 16.22 1981 1,367 232 3,398 c 6,271 17.19 1982 1,125 134 3,373 c 5,964 16.34 1983 1,138 234 3,128 c 5,769 15.81 1984 1,175 245 2,788 c 5,419 14.85 1985 1,043 245 2,815 1,191 5,289 14.50 1986 1,118 285 2,891 1,395 5,685 15.57 1987 1,137 270 3,156 1,111 5,668 15.53 1988 1,170 282 3,619 1,146 6,210 17.02 1989 1,258 279 3,906 1,138 6,571 18.00 1990 1,247 303 4,328 1,249 7,116 19.50 1991 1,256 296 4,412 469 6,425 17.60 1992 1,353 298 4,648 1,362 7,654 20.97 1993 1,242 296 4,700 1,113 7,345 20.13 1994 1,250 314 4,761 1,049 7,370 20.19 1995 1,239 320 4,840 1,080 7,473 20.47 1996 1,299 329 4,849 1,098 7,569 20.74 1997 1,271 323 4,893 1,148 7,631 20.91 1998 1,328 333 4,953 1,197 7,808 21.39 1999 1,403 326 4,950 1,193 7,866 21.55 2000 1,360 311 4,867 1,183 7,713 21.13 2001 1,349 282 4,808 1,174 7,607 20.84 2002 1,356 268 4,964 1,105 7,690 21.07 2003 1,443 267 4,876 970 7,551 20.69 2004 2,037 527 4,805 941 8,311 22.77 2005 1,583 478 4,767 908 7,736 21.20 2006 1,102 637 4,038 852 6,630 18.17 2007 1,140 623 3,926 848 6,538 17.91 2008 1,051 618 3,702 845 6,216 17.03 2009 1,092 634 3,872 871 6,470 17.72 2010 1,135 644 3,912 887 6,578 18.02 2011 1,033 635 3,978 878 6,524 17.87 2012 1,046 638 3,705 884 6,273 17.19 2013 1,060 629 3,679 874 6,242 17.10 2014 1,037 650 3,558 859 6,104 16.73 2015 1,129 673 3,700 677 6,180 16.93 2016 1,222 687 3,759 683 6,351 17.40
Average annual percentage change 1975–2016 -0.8% 4.1% 0.2% c 0.4% 0.4% 2006–2016 -1.0% 0.8% -0.7% -2.2% -0.4% -0.4%
Source: Ward’s Communications, Motor Vehicle Facts and Figures 2016, Southfield, Michigan, 2016, p. 55 and annual.
Original data from AAA “Your Driving Costs.” (Additional resources: newsroom.aaa.com) a Adjusted by the Consumer Price Inflation Index. b Fire & Theft: $50 deductible 1975 through 1977; $100 deductible 1978 through 1992; $250 deductible for 1993 – 2003; $100 deductible 2004-2015. Collision: $100 deductible through 1979; $250 deductible 1980-1992; $500 deductible for 1993 – on. Property Damage & Liability: coverage = $100,000/$300,000. c Data are not available.

10–23
TRANSPORTATION ENERGY DATA BOOK: EDITION 36—2017
Table 10.16 Personal Consumption Expenditures, 1970–2016
(billion dollars)
Personal consumption expenditures Transportation personal
consumption expenditures Constant Constant Transportation PCE
Year Current 2016a Current 2016a as a percent of PCE 1970 647.7 3,175.7 80.8 396.2 12.5% 1980 1,754.6 4,416.3
241.7 608.4 13.8%
1990 3,825.6 6,392.6 455.7 761.5 11.9% 2000 6,792.4 9,251.2
811.2 1,104.9 11.9%
2005 8,794.1 10,667.2
983.2 1,192.6 11.2% 2010 10,202.2 11,222.4 968.3 1,065.1 9.5% 2011 10,689.3 11,523.1 1,081.2 1,165.5 10.1% 2012 11,050.6 11,702.6 1,132.2 1,199.0 10.2% 2013 11,361.2 11,838.4 1,162.8 1,211.6 10.2% 2014 11,863.7 12,148.4 1,197.2 1,225.9 10.1% 2015 12,332.3 12,492.6 1,151.5 1,166.5 9.3% 2016 12,820.7 12,820.7 1,147.0 1,147.0 8.9%
Note: Transportation PCE includes the following categories: transportation, motor vehicles and parts, and gasoline and oil. Source: U.S. Department of Commerce, Bureau of Economic Analysis, National Income and Product Accounts, Table 2.3.5,
www.bea.gov
Table 10.17 Consumer Price Indices, 1970–2016
(1970 = 1.000)
Year Consumer price
index Transportation
consumer price indexb
New car consumer price
index
Used car consumer price
index Gross national product
index 1970 1.000 1.000 1.000 1.000 1.000 1980 2.124 2.216 1.667 1.997 2.676 1990 3.369 3.213 2.286 3.769 5.557 2000 4.438 4.088 2.689 4.994 9.537 2005 5.034 4.637 2.597 4.468 12.184 2010 5.620 5.157 2.599 4.587 14.017 2011 5.797 5.663 2.672 4.776 14.566 2012 5.917 5.796 2.716 4.818 15.146 2013 6.004 5.798 2.745 4.804 15.648 2014 6.101 5.758 2.755 4.779 16.319 2015 6.109 5.308 2.771 4.715 16.932 2016 6.186 5.197 2.775 4.599 17.390
Sources: Bureau of Labor Statistics, Consumer Price Index Table 1A for 2016, and annual. (Additional resources: www.bls.gov) GNP – U.S. Department of Commerce, Bureau of Economic Analysis, National Income and Product Accounts, Table
1.7.5. (Additional resources: www.bea.gov) a Adjusted by the GNP price deflator. b Transportation Consumer Price Index includes new and used cars, gasoline, car insurance rates, intracity mass transit, intracity bus fare, and airline fares.

10–24
TRANSPORTATION ENERGY DATA BOOK: EDITION 36—2017
The data below were summarized from the Bureau of Labor Statistics (BLS) Current Employment Statistics Survey data using the North American Industry Classification System (NAICS). Transportation-related employment was 7.5% of total employment in 2016.
Table 10.18
Transportation-Related Employment, 2000 and 2016a (thousands)
Percent 2000 2016 change Truck transportation (includes drivers) 1,405.8 1,453.6 3.4% Transit and ground transportation 372.1 478.4 28.6% Air transportation 614.4 475.9 -22.5% Rail transportation 231.7 214.7 -7.3% Water transportation 56.0 65.5 17.0% Pipeline transportation 46.0 49.5 7.6% Motor vehicle and parts - retail 1,846.9 1,981.8 7.3% Motor vehicles and parts - wholesale 355.7 331.9 -6.7% Gasoline stations - retail 935.7 925.7 -1.1% Automotive repair and maintenance 888.1 913.3 2.8% Automotive equipment rental and leasing 208.3 206.4 -0.9% Manufacturing 2,143.9 1,679.8 -21.6% Cars and light trucks 237.4 180.9 -23.8% Heavy-duty trucks 54.0 27.9 -48.3% Motor vehicle bodies and trailers 182.7 151.2 -17.2% Motor vehicle parts 839.5 580.0 -30.9% Aerospace products and parts 516.7 489.0 -5.4% Railroad rolling stock & other transportation equipment 72.7 60.6 -16.6% Ship & boat building 154.1 135.2 -12.3% Tires 86.8 55.0 -36.6% Oil and gas pipeline construction 72.2 124.7 72.7% Highway street and bridge construction 340.1 321.5 -5.5% Scenic & sightseeing 27.5 34.6 25.8% Support activities for transportation 537.4 660.1 22.8% Couriers and messengers 605.0 641.9 6.1% Travel arrangement and reservation services 298.6 216.3 -27.6% Total transportation-related employment 10,985.4 10,775.6 -1.9% Total nonfarm employment 132,019.0 144,306.0 9.3% Transportation-related to total employment 8.3% 7.5%
Source: Bureau of Labor Statistics website query system: www.bls.gov/data/. (Additional resources: www.bls.gov) a Not seasonally adjusted.
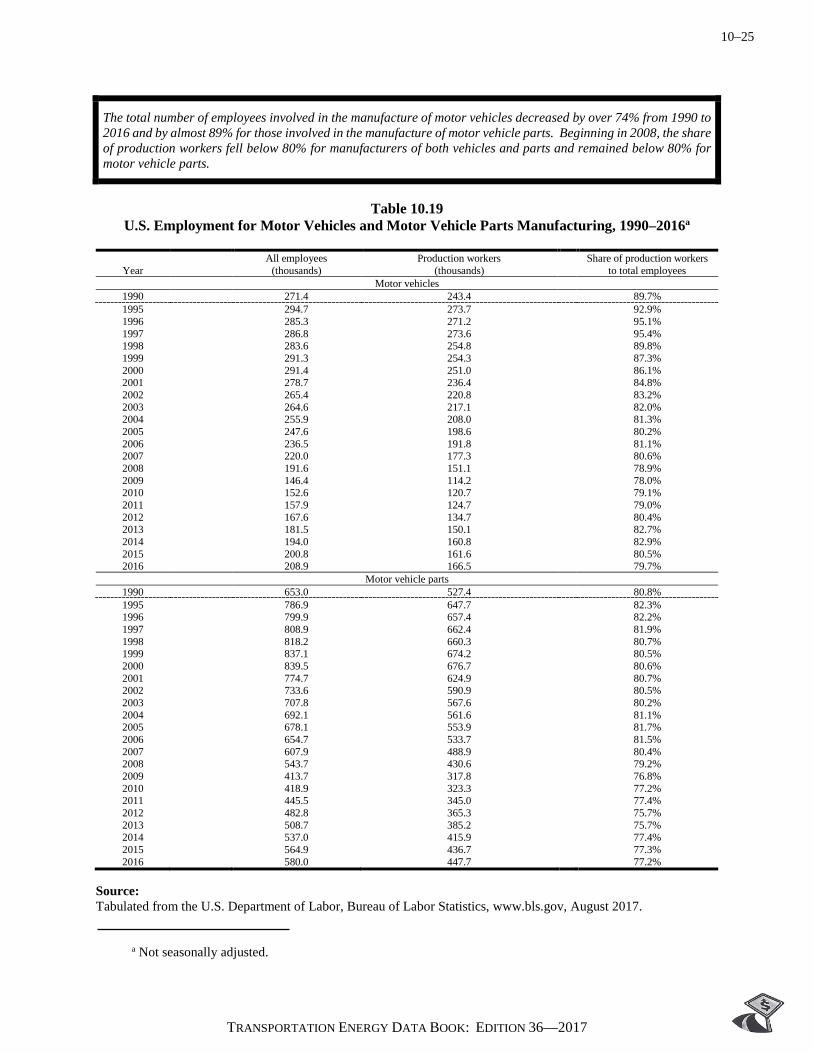
10–25
TRANSPORTATION ENERGY DATA BOOK: EDITION 36—2017
The total number of employees involved in the manufacture of motor vehicles decreased by over 74% from 1990 to 2016 and by almost 89% for those involved in the manufacture of motor vehicle parts. Beginning in 2008, the share of production workers fell below 80% for manufacturers of both vehicles and parts and remained below 80% for motor vehicle parts.
Table 10.19
U.S. Employment for Motor Vehicles and Motor Vehicle Parts Manufacturing, 1990–2016a
Year All employees
(thousands) Production workers
(thousands) Share of production workers
to total employees Motor vehicles
1990 271.4 243.4 89.7% 1995 294.7 273.7 92.9% 1996 285.3 271.2 95.1% 1997 286.8 273.6 95.4% 1998 283.6 254.8 89.8% 1999 291.3 254.3 87.3% 2000 291.4 251.0 86.1% 2001 278.7 236.4 84.8% 2002 265.4 220.8 83.2% 2003 264.6 217.1 82.0% 2004 255.9 208.0 81.3% 2005 247.6 198.6 80.2% 2006 236.5 191.8 81.1% 2007 220.0 177.3 80.6% 2008 191.6 151.1 78.9% 2009 146.4 114.2 78.0% 2010 152.6 120.7 79.1% 2011 157.9 124.7 79.0% 2012 167.6 134.7 80.4% 2013 181.5 150.1 82.7% 2014 194.0 160.8 82.9% 2015 200.8 161.6 80.5% 2016 208.9 166.5 79.7%
Motor vehicle parts 1990 653.0 527.4 80.8% 1995 786.9 647.7 82.3% 1996 799.9 657.4 82.2% 1997 808.9 662.4 81.9% 1998 818.2 660.3 80.7% 1999 837.1 674.2 80.5% 2000 839.5 676.7 80.6% 2001 774.7 624.9 80.7% 2002 733.6 590.9 80.5% 2003 707.8 567.6 80.2% 2004 692.1 561.6 81.1% 2005 678.1 553.9 81.7% 2006 654.7 533.7 81.5% 2007 607.9 488.9 80.4% 2008 543.7 430.6 79.2% 2009 413.7 317.8 76.8% 2010 418.9 323.3 77.2% 2011 445.5 345.0 77.4% 2012 482.8 365.3 75.7% 2013 508.7 385.2 75.7% 2014 537.0 415.9 77.4% 2015 564.9 436.7 77.3% 2016 580.0 447.7 77.2%
Source: Tabulated from the U.S. Department of Labor, Bureau of Labor Statistics, www.bls.gov, August 2017. a Not seasonally adjusted.

10–26
TRANSPORTATION ENERGY DATA BOOK: EDITION 36—2017
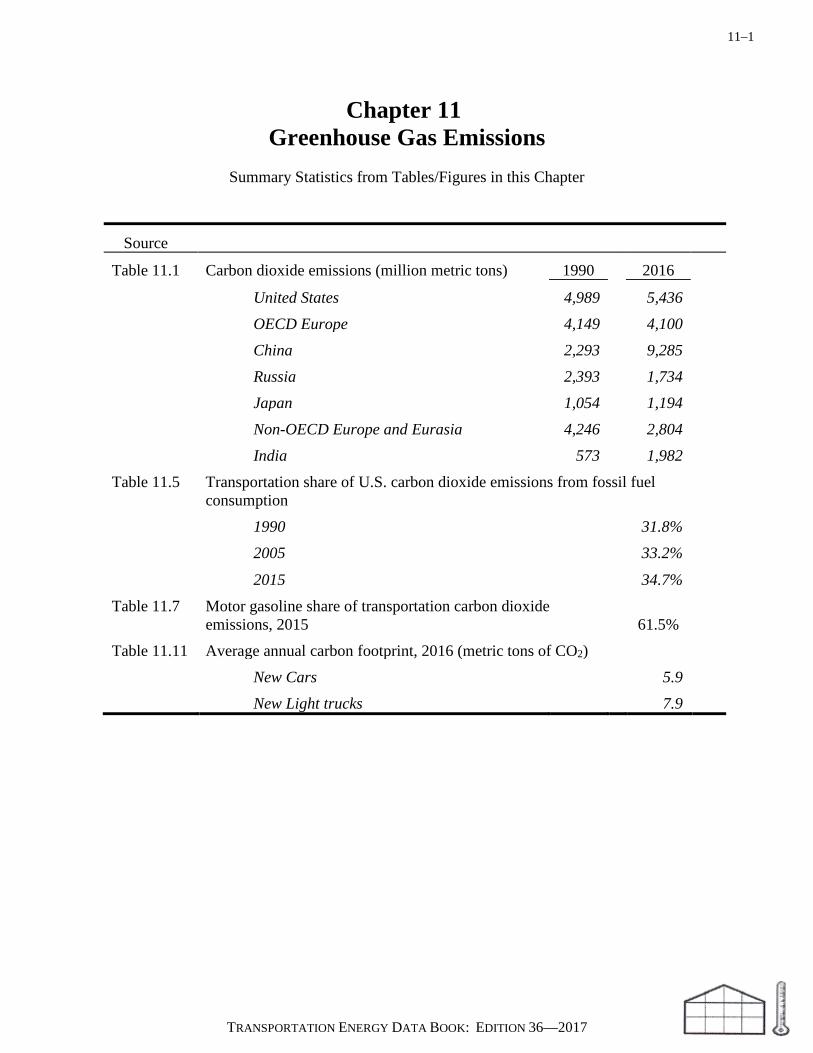
11–1
TRANSPORTATION ENERGY DATA BOOK: EDITION 36—2017
Chapter 11 Greenhouse Gas Emissions
Summary Statistics from Tables/Figures in this Chapter
Source
Table 11.1 Carbon dioxide emissions (million metric tons) 1990 2016
United States 4,989 5,436 OECD Europe 4,149 4,100 China 2,293 9,285 Russia 2,393 1,734 Japan 1,054 1,194 Non-OECD Europe and Eurasia 4,246 2,804 India 573 1,982 Table 11.5 Transportation share of U.S. carbon dioxide emissions from fossil fuel
consumption
1990 31.8% 2005 33.2%
2015 34.7% Table 11.7 Motor gasoline share of transportation carbon dioxide
emissions, 2015 61.5%
Table 11.11 Average annual carbon footprint, 2016 (metric tons of CO2) New Cars 5.9 New Light trucks 7.9
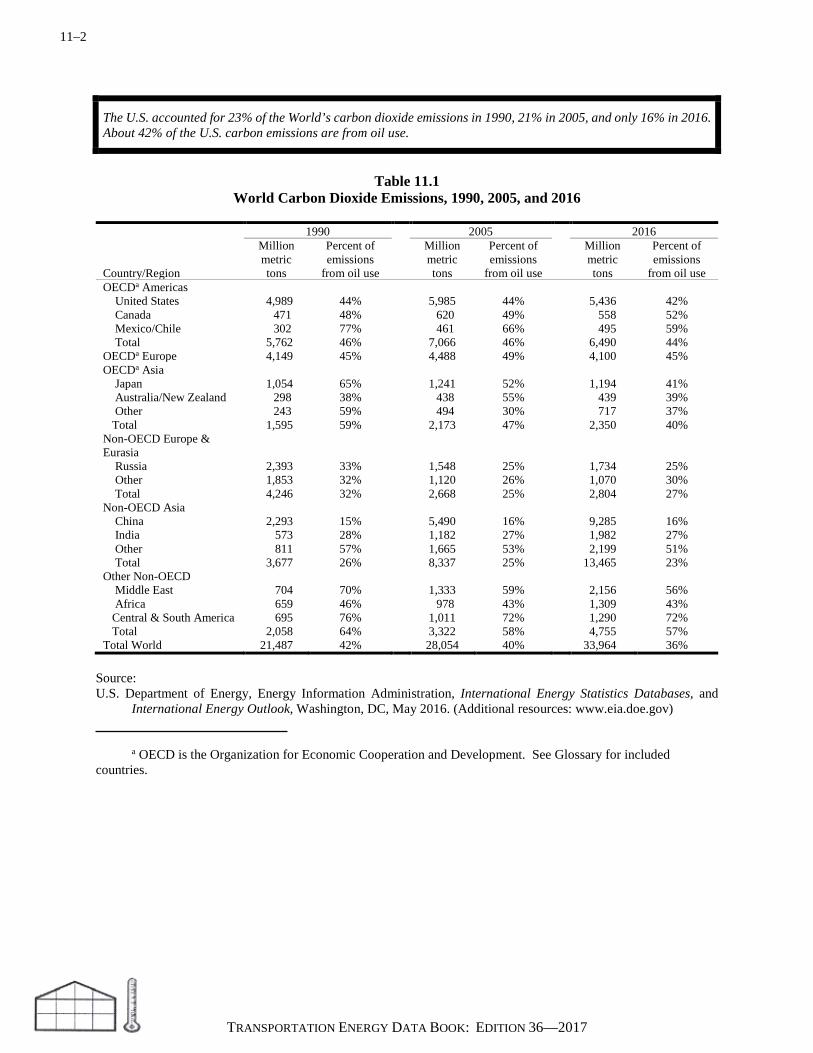
11–2
TRANSPORTATION ENERGY DATA BOOK: EDITION 36—2017
The U.S. accounted for 23% of the World’s carbon dioxide emissions in 1990, 21% in 2005, and only 16% in 2016. About 42% of the U.S. carbon emissions are from oil use.
Table 11.1
World Carbon Dioxide Emissions, 1990, 2005, and 2016
1990 2005 2016 Country/Region
Million metric tons
Percent of emissions
from oil use
Million metric tons
Percent of emissions
from oil use
Million metric tons
Percent of emissions
from oil use OECDa Americas United States 4,989 44% 5,985 44% 5,436 42% Canada 471 48% 620 49% 558 52% Mexico/Chile 302 77% 461 66% 495 59% Total 5,762 46% 7,066 46% 6,490 44% OECDa Europe 4,149 45% 4,488 49% 4,100 45% OECDa Asia Japan 1,054 65% 1,241 52% 1,194 41% Australia/New Zealand 298 38% 438 55% 439 39% Other 243 59% 494 30% 717 37% Total 1,595 59% 2,173 47% 2,350 40% Non-OECD Europe & Eurasia Russia 2,393 33% 1,548 25% 1,734 25% Other 1,853 32% 1,120 26% 1,070 30% Total 4,246 32% 2,668 25% 2,804 27% Non-OECD Asia China 2,293 15% 5,490 16% 9,285 16% India 573 28% 1,182 27% 1,982 27% Other 811 57% 1,665 53% 2,199 51% Total 3,677 26% 8,337 25% 13,465 23% Other Non-OECD Middle East 704 70% 1,333 59% 2,156 56% Africa 659 46% 978 43% 1,309 43% Central & South America 695 76% 1,011 72% 1,290 72% Total 2,058 64% 3,322 58% 4,755 57% Total World 21,487 42% 28,054 40% 33,964 36%
Source: U.S. Department of Energy, Energy Information Administration, International Energy Statistics Databases, and
International Energy Outlook, Washington, DC, May 2016. (Additional resources: www.eia.doe.gov) a OECD is the Organization for Economic Cooperation and Development. See Glossary for included countries.

11–3
TRANSPORTATION ENERGY DATA BOOK: EDITION 36—2017
Since 1990, China shows the greatest increase of carbon dioxide (CO2) emissions. The Americas have about the same CO2 emissions in 2014 as in 1990. Europe and Eurasia have fewer CO2 emissions in 2016 than 1990.
Figure 11.1. World Carbon Dioxide Emissions, 1990–2016
Source: 1990–2012: U.S. Department of Energy, Energy Information Administration, International Energy Statistics, Total
Carbon Dioxide Emissions from the Consumption of Energy, www.eia.doe.gov/cfapps/ipdbproject/IEDIndex3.cfm, September 2016.
2013–2016: U.S. Department of Energy, Energy Information Administration, International Energy Outlook 2016, www.eia.gov/forecasts/aeo/index.cfm, accessed August 2017. (Additional resources: www.eia.doe.gov)

11–4
TRANSPORTATION ENERGY DATA BOOK: EDITION 36—2017
Global Warming Potentials (GWP) were developed to allow comparison of the ability of each greenhouse gas to trap heat in the atmosphere relative to carbon dioxide. Extensive research has been performed and it has been discovered that the effects of various gases on global warming are too complex to be precisely summarized by a single number. Further understanding of the subject also causes frequent changes to estimates. Despite that, the scientific community has developed approximations, the latest of which are shown below. Most analysts use the 100-year time horizon.
Table 11.2
Numerical Estimates of Global Warming Potentials Compared with Carbon Dioxide (kilogram of gas per kilogram of carbon dioxide)
Lifetime
Global warming potential direct effect for time horizons of
Gas (years) 20 years 100 years Carbon Dioxide (CO2) 5-200a 1 1 Methane (CH4)b 12.4 86 34 Tetrafluoroethane (HFC-134a) 13.4 3,790 1,550 Trichlorofluoromethane (CFC-11) 45 7,020 5,350 Nitrous Oxide (N2O) 121 268 298 Perfluoromethane (CF4) 50,000 4,950 7,350
Note: Includes climate-carbon feedbacks. Source: Myhre, G., D. Shindell, F.-M. Breon, W. Collins, J. Fuglestvedt, J. Huang, D. Koch, J.-F. Lamarque, D. Lee, B.
Mendoza, T. Nakajima, A. Robock, G. Stephens, T. Takemura and H. Zhang, 2013: Anthropogenic and Natural Radiative Forcing. In: Climate Change 2013: The Physical Science Basis. Contribution of Working Group 1 to the Fifth Assessment Report of the Intergovernmental Panel on Climate Change [Stocker, R.F., D. Qin, G.-K. Plattner, M. Tignor, S.K. Allen, J. Boschung, A. Nauels, Y. Zia, V. Bex and P.M. Midgley (eds)]. Cambridge University Press, Cambridge, United Kingdom and New York, NY, USA.
a No single lifetime can be defined for carbon dioxide due to different rates of uptake by different removal processes. b These values do not include carbon dioxide from methane oxidation. Perturbation lifetime is used in the calculation of metrics.

11–5
TRANSPORTATION ENERGY DATA BOOK: EDITION 36—2017
Carbon dioxide emissions in 2015 were 5% higher than in 1990, but down from the highest annual emissions of this data series in 2007. Carbon dioxide accounts for the majority (82%) of greenhouse gases.
Table 11.3
U.S. Emissions of Greenhouse Gases, Based on Global Warming Potential, 1990–2015 (million metric tons of carbon dioxide equivalenta)
Year Carbon dioxide Methane
Nitrous oxide
High GWP gasesb Total
1990 5,089.8 780.7 359.4 99.6 6,329.5 1991 5,034.7 785.1 358.6 90.6 6,269.0 1992 5,141.3 784.2 361.7 95.2 6,382.4 1993 5,253.8 769.0 373.9 94.9 6,491.6 1994 5,344.6 772.8 364.9 97.9 6,580.2 1995 5,410.0 765.1 377.0 116.6 6,668.7 1996 5,596.2 756.4 383.3 127.0 6,862.9 1997 5,671.6 740.3 374.1 133.8 6,919.8 1998 5,711.7 725.6 388.7 149.2 6,975.2 1999 5,784.4 713.8 362.8 145.6 7,006.6 2000 5,955.8 704.0 361.8 146.3 7,167.9 2001 5,849.8 695.6 363.7 132.8 7,041.9 2002 5,892.4 684.1 362.0 140.6 7,079.1 2003 5,932.9 684.3 365.8 130.4 7,113.4 2004 6,046.0 675.8 385.8 137.4 7,245.0 2005 6,074.0 680.9 361.5 138.8 7,255.2 2006 5,992.8 682.1 371.2 141.7 7,187.8 2007 6,078.7 685.9 378.7 153.5 7,296.8 2008 5,883.5 695.0 361.4 155.6 7,095.5 2009 5,448.6 690.4 362.1 151.8 6,652.9 2010 5,653.4 692.0 370.3 163.0 6,878.7 2011 5,523.6 672.1 363.9 170.9 6,730.5 2012 5,313.7 666.0 340.5 169.3 6,489.5 2013 5,466.1 658.8 335.5 171.7 6,632.1 2014 5,519.1 659.1 335.4 179.5 6,693.1 2015 5,364.9 655.7 334.6 184.6 6,539.8
Note: This greenhouse gas emissions inventory includes fossil fuel combustion, use of fluorinated gases and other transportation categories. Source: U.S. Environmental Protection Agency, Inventory of U. S. Greenhouse Gas Emissions and Sinks: 1990-2015, April 13,
2017, EPA 430-P-17-001. (Additional resources: www.epa.gov/ghgemissions/inventory-us-greenhouse-gas-emissions-and-sinks-1990-2015)
a Carbon dioxide equivalents are computed by multiplying the weight of the gas being measured by its estimated Global Warming Potential (See Table 11.2). b GWP = Global warming potential. Includes HFC-hydrofluorocarbons; PFC-perfluorocarbons; and SF6-sulfur hexaflouride.
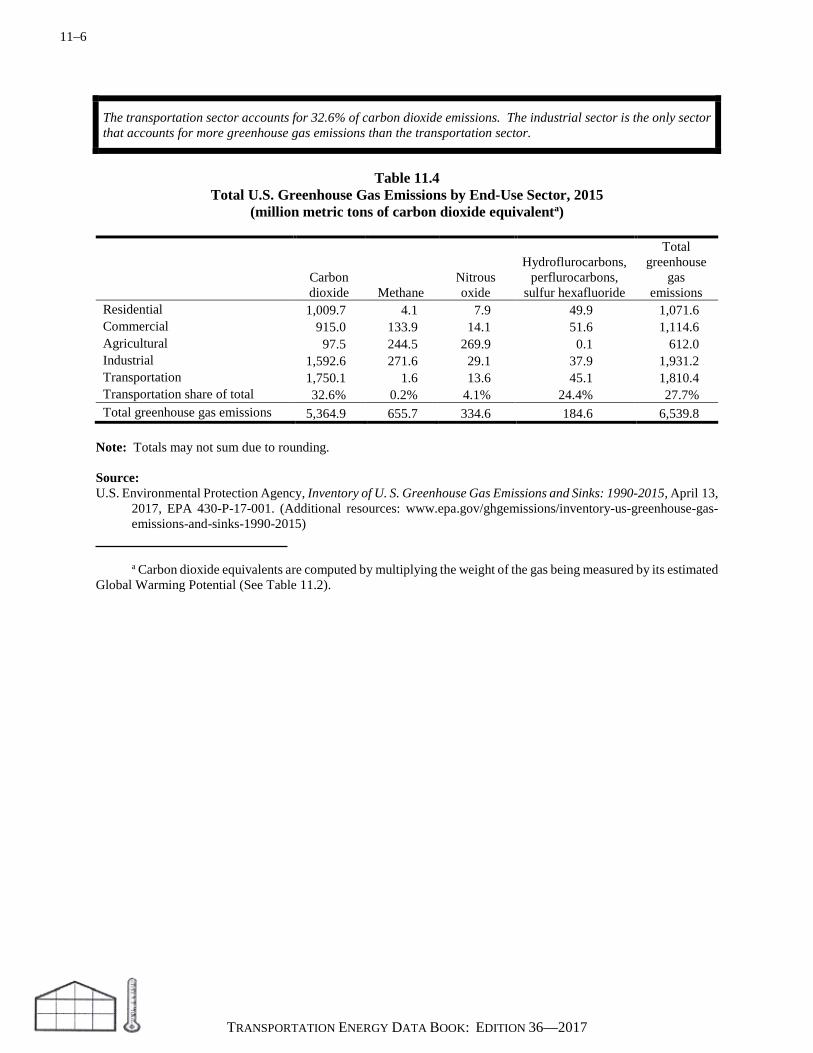
11–6
TRANSPORTATION ENERGY DATA BOOK: EDITION 36—2017
The transportation sector accounts for 32.6% of carbon dioxide emissions. The industrial sector is the only sector that accounts for more greenhouse gas emissions than the transportation sector.
Table 11.4
Total U.S. Greenhouse Gas Emissions by End-Use Sector, 2015 (million metric tons of carbon dioxide equivalenta)
Carbon dioxide Methane
Nitrous oxide
Hydroflurocarbons, perflurocarbons,
sulfur hexafluoride
Total greenhouse
gas emissions
Residential 1,009.7 4.1 7.9 49.9 1,071.6 Commercial 915.0 133.9 14.1 51.6 1,114.6 Agricultural 97.5 244.5 269.9 0.1 612.0 Industrial 1,592.6 271.6 29.1 37.9 1,931.2 Transportation 1,750.1 1.6 13.6 45.1 1,810.4 Transportation share of total 32.6% 0.2% 4.1% 24.4% 27.7% Total greenhouse gas emissions 5,364.9 655.7 334.6 184.6 6,539.8
Note: Totals may not sum due to rounding. Source: U.S. Environmental Protection Agency, Inventory of U. S. Greenhouse Gas Emissions and Sinks: 1990-2015, April 13,
2017, EPA 430-P-17-001. (Additional resources: www.epa.gov/ghgemissions/inventory-us-greenhouse-gas-emissions-and-sinks-1990-2015)
a Carbon dioxide equivalents are computed by multiplying the weight of the gas being measured by its estimated Global Warming Potential (See Table 11.2).

11–7
TRANSPORTATION ENERGY DATA BOOK: EDITION 36—2017
Gases which contain carbon can be measured in terms of the full molecular weight of the gas or just in terms of their carbon content. This table presents carbon dioxide gas. The ratio of the weight of carbon to carbon dioxide is 0.2727. The transportation sector accounts for approximately one-third of carbon emissions.
Table 11.5
U.S. Carbon Emissions from Fossil Fuel Consumption by End-Use Sector, 1990–2015a
(million metric tons of carbon dioxide)
End use sector Transportation CO2 from Residential Commercial Industrial Transportation percentage all sectors
1990 931.4 755.4 1529.2 1496.8 31.8% 4,712.8 1991 949.1 762.1 1497.0 1450.6 31.1% 4,658.8 1992 945.2 758.0 1557.0 1499.8 31.5% 4,760.0 1993 998.0 782.3 1565.1 1535.4 31.5% 4,880.8 1994 989.0 794.8 1588.4 1580.1 31.9% 4,952.3 1995 994.7 812.4 1586.7 1612.9 32.2% 5,006.7 1996 1055.4 843.2 1644.2 1657.4 31.9% 5,200.2 1997 1045.2 883.0 1662.3 1673.2 31.8% 5,263.7 1998 1049.7 901.2 1639.6 1709.8 32.3% 5,300.3 1999 1070.5 912.8 1619.2 1764.3 32.9% 5,366.8 2000 1133.2 972.2 1643.8 1808.9 32.5% 5,558.1 2001 1124.9 980.7 1578.8 1793.1 32.7% 5,477.5 2002 1151.7 978.8 1553.5 1834.1 33.2% 5,518.1 2003 1181.7 989.4 1572.5 1826.5 32.8% 5,570.1 2004 1179.6 1007.7 1598.1 1871.7 33.1% 5,657.1 2005 1214.1 1026.8 1564.6 1891.8 33.2% 5,697.3 2006 1151.8 1007.2 1564.2 1887.2 33.6% 5,610.4 2007 1204.5 1047.3 1563.1 1891.1 33.1% 5,706.0 2008 1190.4 1039.3 1499.8 1796.5 32.5% 5,526.0 2009 1122.7 976.5 1329.5 1721.4 33.4% 5,150.1 2010 1174.6 993.0 1416.5 1732.7 32.6% 5,316.8 2011 1116.2 958.4 1399.6 1711.9 33.0% 5,186.1 2012 1007.8 897.0 1375.7 1700.6 34.1% 4,981.1 2013 1064.6 925.5 1407.0 1717.0 33.6% 5,114.1 2014 1080.1 934.7 1399.3 1746.9 33.8% 5,161.0 2015 1003.9 909.4 1355.0 1740.1 34.7% 5,008.4
Average annual percentage change 1990–2015 0.3% 0.7% -0.5% 0.6% 0.2% 2005–2015 -1.9% -1.2% -1.4% -0.8% -1.3%
Note: The CO2 from all sectors does not match Table 11.3 since it is only from fossil fuel consumption and does not include the use of fluorinated gases and other transportation categories. Source: U.S. Environmental Protection Agency, Inventory of U. S. Greenhouse Gas Emissions and Sinks: 1990-2015, April 13,
2017, EPA 430-P-17-001. (Additional resources: www.epa.gov/ghgemissions/inventory-us-greenhouse-gas-emissions-and-sinks-1990-2015)
a Includes energy from petroleum, coal, and natural gas. Electric utility emissions are distributed across consumption sectors.
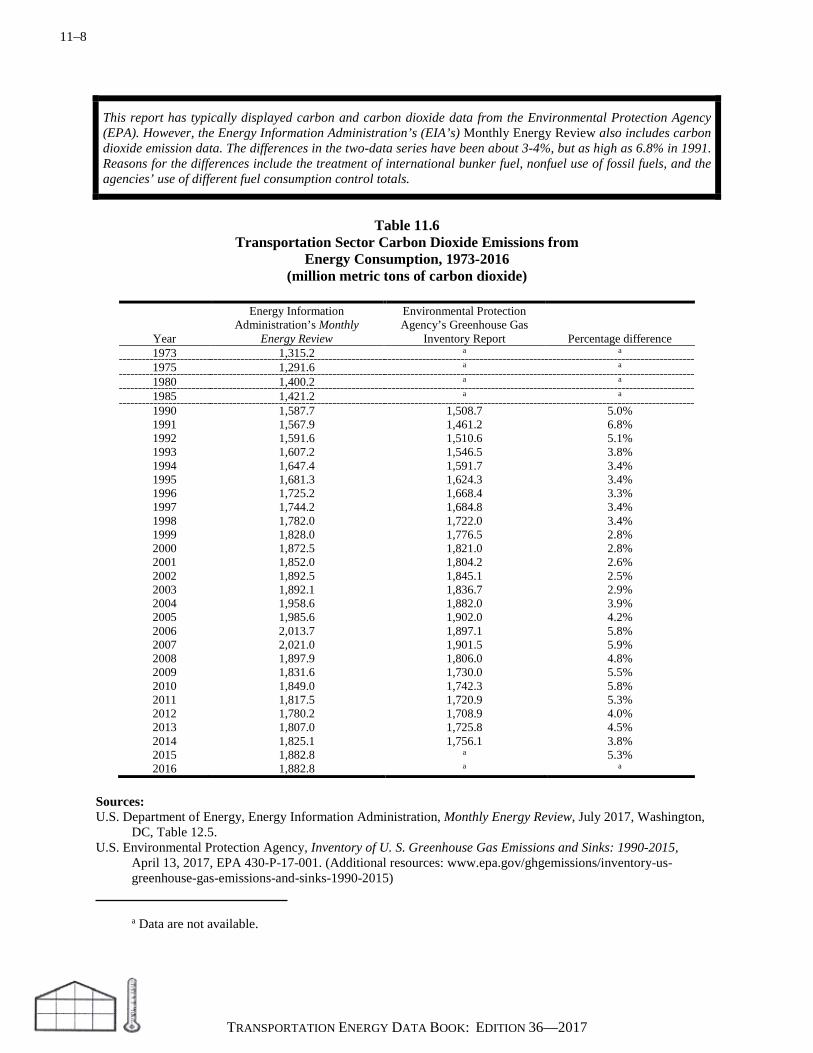
11–8
TRANSPORTATION ENERGY DATA BOOK: EDITION 36—2017
This report has typically displayed carbon and carbon dioxide data from the Environmental Protection Agency (EPA). However, the Energy Information Administration’s (EIA’s) Monthly Energy Review also includes carbon dioxide emission data. The differences in the two-data series have been about 3-4%, but as high as 6.8% in 1991. Reasons for the differences include the treatment of international bunker fuel, nonfuel use of fossil fuels, and the agencies’ use of different fuel consumption control totals.
Table 11.6
Transportation Sector Carbon Dioxide Emissions from Energy Consumption, 1973-2016
(million metric tons of carbon dioxide)
Year
Energy Information Administration’s Monthly
Energy Review
Environmental Protection Agency’s Greenhouse Gas
Inventory Report Percentage difference 1973 1,315.2 a a
1975 1,291.6 a a
1980 1,400.2 a a
1985 1,421.2 a a
1990 1,587.7 1,508.7 5.0% 1991 1,567.9 1,461.2 6.8% 1992 1,591.6 1,510.6 5.1% 1993 1,607.2 1,546.5 3.8% 1994 1,647.4 1,591.7 3.4% 1995 1,681.3 1,624.3 3.4% 1996 1,725.2 1,668.4 3.3% 1997 1,744.2 1,684.8 3.4% 1998 1,782.0 1,722.0 3.4% 1999 1,828.0 1,776.5 2.8% 2000 1,872.5 1,821.0 2.8% 2001 1,852.0 1,804.2 2.6% 2002 1,892.5 1,845.1 2.5% 2003 1,892.1 1,836.7 2.9% 2004 1,958.6 1,882.0 3.9% 2005 1,985.6 1,902.0 4.2% 2006 2,013.7 1,897.1 5.8% 2007 2,021.0 1,901.5 5.9% 2008 1,897.9 1,806.0 4.8% 2009 1,831.6 1,730.0 5.5% 2010 1,849.0 1,742.3 5.8% 2011 1,817.5 1,720.9 5.3% 2012 1,780.2 1,708.9 4.0% 2013 1,807.0 1,725.8 4.5% 2014 1,825.1 1,756.1 3.8% 2015 1,882.8 a 5.3% 2016 1,882.8 a a
Sources: U.S. Department of Energy, Energy Information Administration, Monthly Energy Review, July 2017, Washington,
DC, Table 12.5. U.S. Environmental Protection Agency, Inventory of U. S. Greenhouse Gas Emissions and Sinks: 1990-2015,
April 13, 2017, EPA 430-P-17-001. (Additional resources: www.epa.gov/ghgemissions/inventory-us-greenhouse-gas-emissions-and-sinks-1990-2015)
a Data are not available.

11–9
TRANSPORTATION ENERGY DATA BOOK: EDITION 36—2017
Most U.S. transportation sector carbon dioxide emissions come from petroleum fuels. Motor gasoline has been responsible for 60%-67% of U.S. carbon dioxide emissions over the last twenty-five years.
Table 11.7
U.S. Carbon Emissions from Fossil Fuel Combustion in the Transportation End-Use Sector, 1990–2015
(million metric tons of carbon dioxide equivalent)
Year Motor
gasoline LPGa Jet fuel Distillate
fuel Residual
fuel Aviation
gas Natural
gas Electricityb Total 1990 983.5 1.4 184.2 262.9 22.6 3.1 36.0 3.0 1,496.7 1991 969.7 1.3 168.8 255.2 16.9 2.9 32.9 3.0 1,450.6 1992 992.8 1.2 166.6 271.2 30.0 2.8 32.2 3.0 1,499.7 1993 1,010.9 1.2 168.2 287.6 27.6 2.7 34.2 3.0 1,535.4 1994 1,022.9 2.1 175.5 309.4 26.9 2.6 37.6 3.1 1,580.1 1995 1,042.4 1.1 172.2 323.8 29.1 2.7 38.4 3.1 1,612.9 1996 1,063.6 1.0 184.5 339.9 23.6 2.6 39.1 3.1 1,657.4 1997 1,075.6 0.9 184.5 354.8 10.3 2.7 41.4 3.1 1,673.2 1998 1,107.5 1.1 188.4 366.0 5.9 2.5 35.3 3.2 1,710.0 1999 1,128.0 0.9 192.4 387.9 13.2 2.7 35.8 3.2 1,764.3 2000 1,136.2 0.7 194.9 402.1 33.3 2.5 35.6 3.4 1,808.8 2001 1,149.4 0.8 189.6 400.3 12.0 2.4 34.9 3.6 1,793.0 2002 1,174.6 0.9 185.3 413.4 17.1 2.3 37.0 3.5 1,834.1 2003 1,177.2 1.1 179.3 421.9 7.4 2.1 33.2 4.3 1,826.5 2004 1,194.1 1.2 186.6 437.1 14.0 2.2 31.9 4.5 1,871.7 2005 1,183.7 1.7 189.4 457.5 19.3 2.4 33.1 4.7 1,891.7 2006 1,171.8 1.7 182.3 468.5 23.0 2.3 33.1 4.5 1,887.2 2007 1,166.0 1.4 179.5 472.9 29.0 2.2 35.2 5.1 1,891.3 2008 1,109.2 2.5 173.0 448.1 20.4 2.0 36.7 4.7 1,796.6 2009 1,101.5 1.7 154.1 405.9 13.9 1.8 37.9 4.5 1,721.3 2010 1,092.5 1.8 151.5 422.0 20.4 1.9 38.1 4.5 1,732.7 2011 1,068.8 2.1 146.6 430.0 19.4 1.9 38.9 4.3 1,712.0 2012 1,064.7 2.3 143.4 427.5 15.8 1.7 41.3 3.9 1,700.6 2013 1,065.6 2.7 147.1 433.9 15.1 1.5 47.0 4.0 1,716.9 2014 1,096.1 2.9 148.6 447.7 5.8 1.5 40.3 4.1 1,747.0 2015 1,070.5 3.0 157.7 460.7 4.2 1.5 38.8 3.7 1,740.1
Average annual percentage change 1990-2015 0.3% 3.1% -0.6% 2.3% -6.5% -2.9% 0.3% 0.8% 0.6% 2005-2015 -1.0% 5.8% -1.8% 0.1% -14.2% -4.6% 1.6% -2.4% -0.8% Note: Emissions from U.S. Territories are not included. Emissions from International Bunker Fuels are not included. Source: U.S. Environmental Protection Agency, Inventory of U. S. Greenhouse Gas Emissions and Sinks: 1990-2015, April 13,
2017, EPA 430-P-17-001. (Additional resources: www.epa.gov/ghgemissions/inventory-us-greenhouse-gas-emissions-and-sinks-1990-2015)
a Liquefied petroleum gas. b Share of total electric utility carbon dioxide emissions weighted by sales to the transportation sector.

11–10
TRANSPORTATION ENERGY DATA BOOK: EDITION 36—2017
Highway vehicles are responsible for the majority of greenhouse gas emissions in the transportation sector.
Table 11.8
Transportation Carbon Dioxide Emissions by Mode, 1990–2015 (Million metric tons of carbon dioxide equivalent)
Year Passenger Vehicles
Heavy Trucks
Highway Total Water Air Rail Pipeline Total
1990 951.8 238.7 1,190.5 44.3 187.4 38.5 36.0 1,496.7 1991 936.9 233.3 1,170.2 39.5 171.7 36.4 32.9 1,450.7 1992 968.5 243.8 1,212.3 48.5 169.4 37.4 32.2 1,499.8 1993 988.1 256.9 1,245.0 47.1 170.9 38.3 34.2 1,535.5 1994 1,001.6 273.9 1,275.5 47.7 178.1 41.2 37.6 1,580.1 1995 1,015.1 284.2 1,299.3 57.7 174.9 42.7 38.4 1,613.0 1996 1,037.7 296.5 1,334.2 53.7 187.1 43.4 39.1 1,657.5 1997 1,051.4 310.5 1,361.9 39.4 187.2 43.5 41.4 1,673.4 1998 1,082.5 323.9 1,406.4 33.4 190.9 43.9 35.2 1,709.8 1999 1,116.1 342.6 1,458.7 29.3 195.1 45.4 35.7 1,764.2 2000 1,113.4 356.6 1,470.0 60.3 197.4 45.5 35.4 1,808.6 2001 1,124.3 354.6 1,478.9 41.8 192.0 45.8 34.6 1,793.1 2002 1,150.1 367.7 1,517.8 46.5 187.6 45.4 36.6 1,833.9 2003 1,163.8 365.0 1,528.8 36.5 181.4 47.1 32.7 1,826.5 2004 1,182.2 380.3 1,562.5 39.3 188.8 49.6 31.3 1,871.5 2005 1,165.0 408.0 1,573.0 44.4 191.8 50.2 32.4 1,891.8 2006 1,153.6 417.0 1,570.6 47.4 184.6 52.2 32.4 1,887.2 2007 1,123.7 446.0 1,569.7 53.9 181.7 51.3 34.4 1,891.0 2008 1,065.3 428.0 1,493.3 44.7 175.1 47.6 35.9 1,796.6 2009 1,061.3 388.5 1,449.8 38.0 155.9 40.4 37.1 1,721.2 2010 1,053.4 401.4 1,454.8 44.0 153.4 43.1 37.3 1,732.6 2011 1,034.3 400.8 1,435.1 45.5 148.5 44.7 38.1 1,711.9 2012 1,030.1 402.2 1,432.3 39.3 145.1 43.4 40.5 1,700.6 2013 1,030.3 409.1 1,439.4 38.6 148.6 44.1 46.2 1,716.9 2014 1,071.9 422.8 1,494.7 16.9 150.1 45.7 39.4 1,746.8 2015 1,037.4 429.7 1,467.1 32.3 159.2 43.6 38.0 1,740.2
Average annual percentage change 1990-2015 0.3% 2.4% 0.8% -1.3% -0.7% 0.5% 0.2% 0.6% 2005-2015 -1.2% 0.5% -0.7% -3.1% -1.8% -1.4% 1.6% -0.8%
Note: Emissions from U.S. Territories are not included. Emissions from International Bunker Fuels are not included. Passenger vehicles include cars, light trucks and motorcycles. Heavy trucks include medium and heavy trucks and buses. Source: U.S. Environmental Protection Agency, Inventory of U. S. Greenhouse Gas Emissions and Sinks: 1990-2015, April 13,
2017, EPA 430-P-17-001. (Additional resources: www.epa.gov/ghgemissions/inventory-us-greenhouse-gas-emissions-and-sinks-1990-2015)
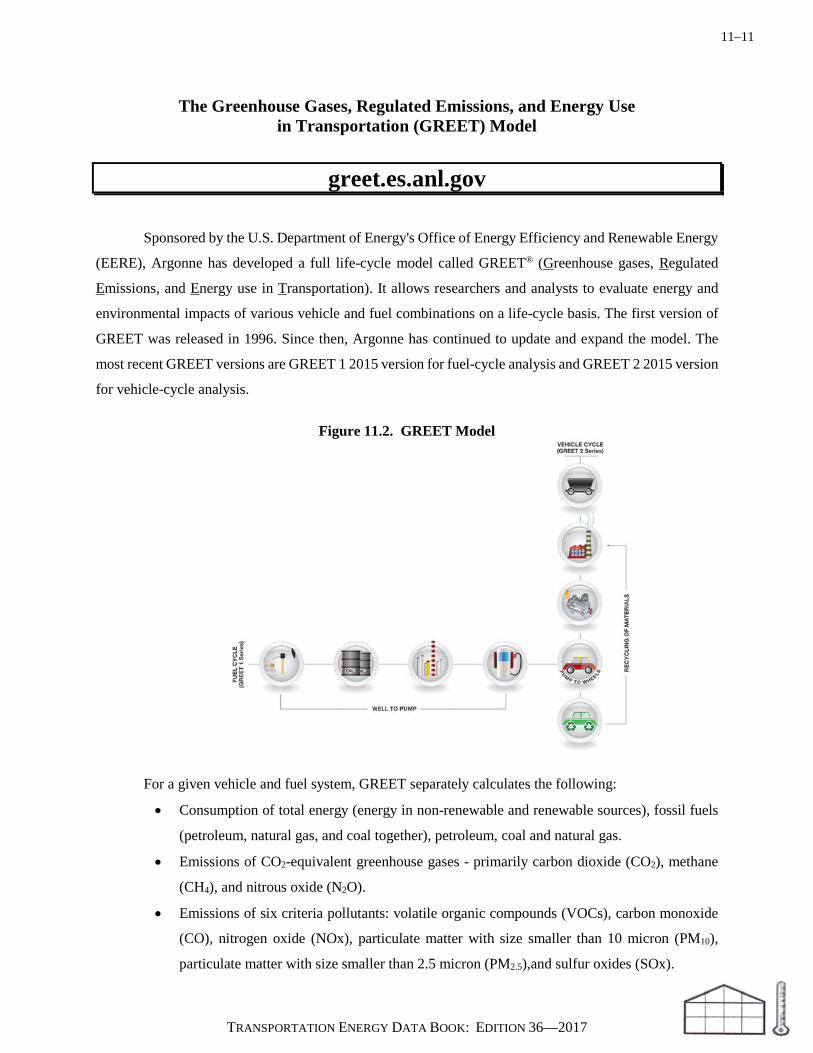
11–11
TRANSPORTATION ENERGY DATA BOOK: EDITION 36—2017
The Greenhouse Gases, Regulated Emissions, and Energy Use in Transportation (GREET) Model
greet.es.anl.gov
Sponsored by the U.S. Department of Energy's Office of Energy Efficiency and Renewable Energy
(EERE), Argonne has developed a full life-cycle model called GREET® (Greenhouse gases, Regulated
Emissions, and Energy use in Transportation). It allows researchers and analysts to evaluate energy and
environmental impacts of various vehicle and fuel combinations on a life-cycle basis. The first version of
GREET was released in 1996. Since then, Argonne has continued to update and expand the model. The
most recent GREET versions are GREET 1 2015 version for fuel-cycle analysis and GREET 2 2015 version
for vehicle-cycle analysis.
Figure 11.2. GREET Model
For a given vehicle and fuel system, GREET separately calculates the following:
• Consumption of total energy (energy in non-renewable and renewable sources), fossil fuels
(petroleum, natural gas, and coal together), petroleum, coal and natural gas.
• Emissions of CO2-equivalent greenhouse gases - primarily carbon dioxide (CO2), methane
(CH4), and nitrous oxide (N2O).
• Emissions of six criteria pollutants: volatile organic compounds (VOCs), carbon monoxide
(CO), nitrogen oxide (NOx), particulate matter with size smaller than 10 micron (PM10),
particulate matter with size smaller than 2.5 micron (PM2.5),and sulfur oxides (SOx).

11–12
TRANSPORTATION ENERGY DATA BOOK: EDITION 36—2017
GREET includes more than 100 fuel production pathways and more than 80 vehicle/fuel systems.
These vehicle/fuel systems cover current and advanced vehicle technologies such as conventional spark-
ignition engine vehicles, compression-ignition engine vehicles, hybrid electric vehicles, plug-in hybrid
electric vehicles, battery-powered electric vehicles and fuel-cell electric vehicles. GREET also evaluates
transportation modes other than light-duty vehicles, such as heavy-duty vehicles, aviation, rail and marine.
Figure 11.3. GREET Model Feedstocks and Fuels
To address technology improvements over time, GREET 2015 simulates current and future vehicle/fuel
systems up to year 2040.
For additional information about the GREET model and associated documentation, please visit the GREET website www.greet.es.anl.gov, or contact [email protected].

11–13
TRANSPORTATION ENERGY DATA BOOK: EDITION 36—2017
Results from the GREET 2015 model on emissions of carbon dioxide per mile are shown below for various fuels and vehicle technologies. A full description of the model is on the preceding pages.
Figure 11.4. Well-to-Wheel Emissions for Various Fuels and Vehicle Technologies
Note: PHEV40 = Plug-in hybrid electric vehicle with 40-mile electric range. Source: Argonne National Laboratory, GREET 1 2015 Model.
11–14
TRANSPORTATION ENERGY DATA BOOK: EDITION 36—2017
Carbon Footprint
The carbon footprint measures a vehicle’s impact on climate change in tons of carbon dioxide (CO2)
emitted annually. The following three tables show the carbon footprint for various vehicle classes. The
sales-weighted average fuel economy rating for each vehicle class, based on 45% highway and 55% city
driving, is used to determine the average annual carbon footprint for vehicles in the class. An estimate of
15,000 annual miles is used for each vehicle class and for each year in the series.
CarbonFootprint
where:
CO2 = (Tailpipe CO2 + Upstream Greenhouse Gases) in grams per million Btu
LHV = Lower (or net) Heating Value in million Btu per gallon
CH4 = Tailpipe CO2 equivalent methane in grams per mile
N2O = Tailpipe CO2 equivalent nitrous oxide in grams per mile
Note: The Environmental Protection Agency publishes tailpipe emissions in terms of grams of CO2 per mile in the Light-Duty Automotive Technology, Carbon Dioxide Emissions, and Fuel Economy Trends: 1975 through 2016, www.epa.gov/fueleconomy/trends-report.
( )= × ×
+ + ×CO LHV AnnualMiles
CombinedMPGCH N O AnnualMiles2 4 2
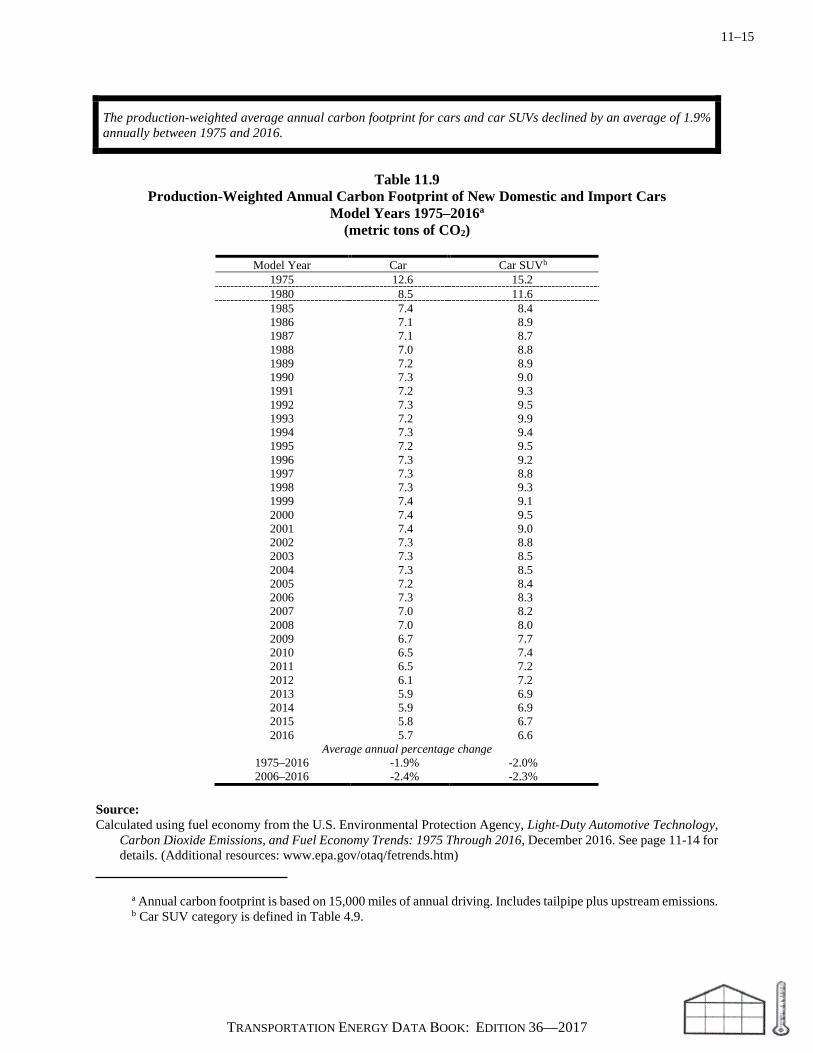
11–15
TRANSPORTATION ENERGY DATA BOOK: EDITION 36—2017
The production-weighted average annual carbon footprint for cars and car SUVs declined by an average of 1.9% annually between 1975 and 2016.
Table 11.9
Production-Weighted Annual Carbon Footprint of New Domestic and Import Cars Model Years 1975–2016a
(metric tons of CO2)
Model Year Car Car SUVb 1975 12.6 15.2 1980 8.5 11.6 1985 7.4 8.4 1986 7.1 8.9 1987 7.1 8.7 1988 7.0 8.8 1989 7.2 8.9 1990 7.3 9.0 1991 7.2 9.3 1992 7.3 9.5 1993 7.2 9.9 1994 7.3 9.4 1995 7.2 9.5 1996 7.3 9.2 1997 7.3 8.8 1998 7.3 9.3 1999 7.4 9.1 2000 7.4 9.5 2001 7.4 9.0 2002 7.3 8.8 2003 7.3 8.5 2004 7.3 8.5 2005 7.2 8.4 2006 7.3 8.3 2007 7.0 8.2 2008 7.0 8.0 2009 6.7 7.7 2010 6.5 7.4 2011 6.5 7.2 2012 6.1 7.2 2013 5.9 6.9 2014 5.9 6.9 2015 5.8 6.7 2016 5.7 6.6
Average annual percentage change 1975–2016 -1.9% -2.0% 2006–2016 -2.4% -2.3%
Source: Calculated using fuel economy from the U.S. Environmental Protection Agency, Light-Duty Automotive Technology,
Carbon Dioxide Emissions, and Fuel Economy Trends: 1975 Through 2016, December 2016. See page 11-14 for details. (Additional resources: www.epa.gov/otaq/fetrends.htm)
a Annual carbon footprint is based on 15,000 miles of annual driving. Includes tailpipe plus upstream emissions. b Car SUV category is defined in Table 4.9.
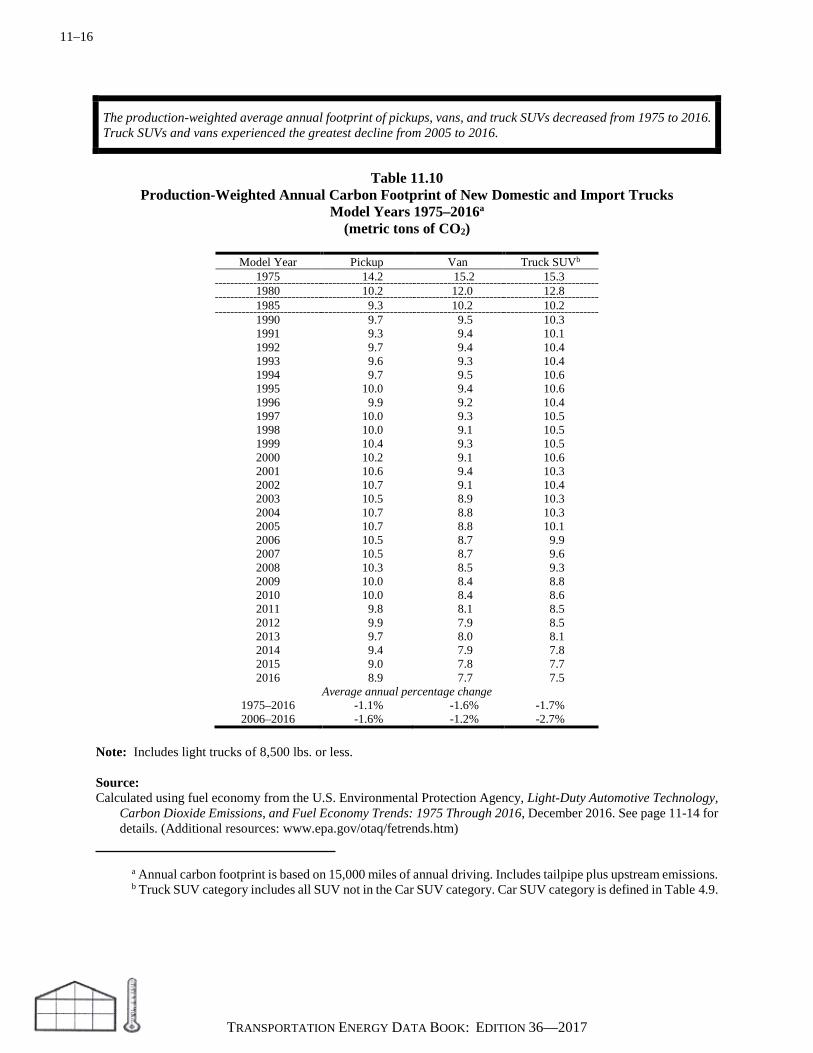
11–16
TRANSPORTATION ENERGY DATA BOOK: EDITION 36—2017
The production-weighted average annual footprint of pickups, vans, and truck SUVs decreased from 1975 to 2016. Truck SUVs and vans experienced the greatest decline from 2005 to 2016.
Table 11.10
Production-Weighted Annual Carbon Footprint of New Domestic and Import Trucks Model Years 1975–2016a
(metric tons of CO2)
Model Year Pickup Van Truck SUVb 1975 14.2 15.2 15.3 1980 10.2 12.0 12.8 1985 9.3 10.2 10.2 1990 9.7 9.5 10.3 1991 9.3 9.4 10.1 1992 9.7 9.4 10.4 1993 9.6 9.3 10.4 1994 9.7 9.5 10.6 1995 10.0 9.4 10.6 1996 9.9 9.2 10.4 1997 10.0 9.3 10.5 1998 10.0 9.1 10.5 1999 10.4 9.3 10.5 2000 10.2 9.1 10.6 2001 10.6 9.4 10.3 2002 10.7 9.1 10.4 2003 10.5 8.9 10.3 2004 10.7 8.8 10.3 2005 10.7 8.8 10.1 2006 10.5 8.7 9.9 2007 10.5 8.7 9.6 2008 10.3 8.5 9.3 2009 10.0 8.4 8.8 2010 10.0 8.4 8.6 2011 9.8 8.1 8.5 2012 9.9 7.9 8.5 2013 9.7 8.0 8.1 2014 9.4 7.9 7.8 2015 9.0 7.8 7.7 2016 8.9 7.7 7.5
Average annual percentage change 1975–2016 -1.1% -1.6% -1.7% 2006–2016 -1.6% -1.2% -2.7%
Note: Includes light trucks of 8,500 lbs. or less. Source: Calculated using fuel economy from the U.S. Environmental Protection Agency, Light-Duty Automotive Technology,
Carbon Dioxide Emissions, and Fuel Economy Trends: 1975 Through 2016, December 2016. See page 11-14 for details. (Additional resources: www.epa.gov/otaq/fetrends.htm)
a Annual carbon footprint is based on 15,000 miles of annual driving. Includes tailpipe plus upstream emissions. b Truck SUV category includes all SUV not in the Car SUV category. Car SUV category is defined in Table 4.9.

11–17
TRANSPORTATION ENERGY DATA BOOK: EDITION 36—2017
Between 1975 and 2016, the production-weighted average annual carbon footprint for new light vehicles dropped dramatically. Total new cars experienced a decrease of 53.4% while the carbon footprint for light trucks decreased by 45.4%.
Table 11.11
Average Annual Carbon Footprint of New Vehicles by Vehicle Classification, Model Years 1975 and 2016a
(metric tons of CO2)
Production share Carbon footprint Percent change
1975 - 2016 Vehicle class Model year
1975 Model year
2016 Model year
1975 Model year
2016 Cars
Car 80.6% 51.4% 12.6 5.7 -54.6% Car SUVb 0.1% 10.7% 15.2 6.6 -56.3% Total cars 80.7% 62.1% 12.6 5.9 -53.4%
Light trucks Van 4.5% 3.7% 15.2 7.7 -49.1% Truck SUVb 1.7% 23.4% 15.3 7.5 -51.1% Pickup 13.1% 10.8% 14.2 8.9 -37.1% Total light trucks 19.3% 37.9% 14.5 7.9 -45.4%
Source: Calculated using fuel economy from the U.S. Environmental Protection Agency, Light-Duty Automotive Technology,
Carbon Dioxide Emissions, and Fuel Economy Trends: 1975 Through 2016, December 2016. See page 11-14 for details. (Additional resources: www.epa.gov/otaq/fetrends.htm)
a Annual carbon footprint is based on 15,000 miles of annual driving. Includes tailpipe and upstream emissions. b Car SUV category is defined in Table 4.9. Truck SUV category includes all SUVs not in the Car SUV category.

11–18
TRANSPORTATION ENERGY DATA BOOK: EDITION 36—2017
The amount of carbon dioxide released into the atmosphere by a vehicle is primarily determined by the carbon content of the fuel. However, there is a small portion of the fuel that is not oxidized into carbon dioxide when the fuel is burned. The Environmental Protection Agency (EPA) has published information on carbon dioxide emissions from gasoline and diesel which takes the oxidation factor into account and is based on the carbon content used in EPA’s fuel economy analyses. The other fuels listed come from the Energy Information Administration.
Table 11.12
Direct Carbon Dioxide Emissions from a Gallon of Fuela
Grams Kilograms Pounds per gallon per gallon per gallon Gasoline 8,887 8.9 19.6 Diesel 10,180 10.2 22.4 E85 1,340 1.3 3.0 B20 8,120 8.1 17.9 LPG 5,805 5.8 12.8 Propane 5,740 5.8 12.7 Aviation gasoline 8,320 8.3 18.3 Jet fuel 9,751 9.6 21.5 Kerosene 9,751 9.8 21.5 Residual fuel 11,791 11.8 26.0
Sources: Gasoline and Diesel: U.S. Environmental Protection Agency, “Greenhouse Gas Emissions from a Typical Passenger
Vehicle,” May 2014. (Additional resources: www.epa.gov/otaq) All others: Energy Information Administration, Voluntary Reporting of Greenhouse Gases Program, Fuel and Energy
Source Codes and Emission Coefficients. a Direct emissions are from the “tank-to-wheels” process. No upstream emissions are included.

11–19
TRANSPORTATION ENERGY DATA BOOK: EDITION 36—2017
The average carbon content of 11 different transportation fuels comes from the GREET Model. Residual oil (used in ships) has the highest carbon content of those listed. Ethanol has the lowest carbon content per gallon.
Table 11.13
Carbon Content of Transportation Fuels
Fuel Type Density
(grams/gallon)
Carbon ratio (grams of carbon per grams of fuel)
Carbon content (grams/gallon)
Carbon contenta (grams per Btu)
Gasoline blendstock 2,819 0.863 2,433 0.0196 Ethanol 2,988 0.522 1,560 0.0185 Gasoline (E10) 2,836 0.828 2,347 0.0195 U.S. conventional diesel 3,167 0.865 2,739 0.0199 Low-sulfur diesel 3,206 0.871 2,792 0.0202 Conventional jet fuel 3,036 0.862 2,617 0.0197 Ultra low-sulfur jet fuel 2,998 0.860 2,578 0.0196 Residual oil 3,752 0.868 3,257 0.0217 Liquefied petroleum gas (LPG) 1,923 0.820 1,577 0.0173 Methyl ester (biodiesel, BD) 3,361 0.776 2,608 0.0204
Source: Argonne National Laboratory, GREET 1 2015 Model. a Based on higher heating values.

11–20
TRANSPORTATION ENERGY DATA BOOK: EDITION 36—2017
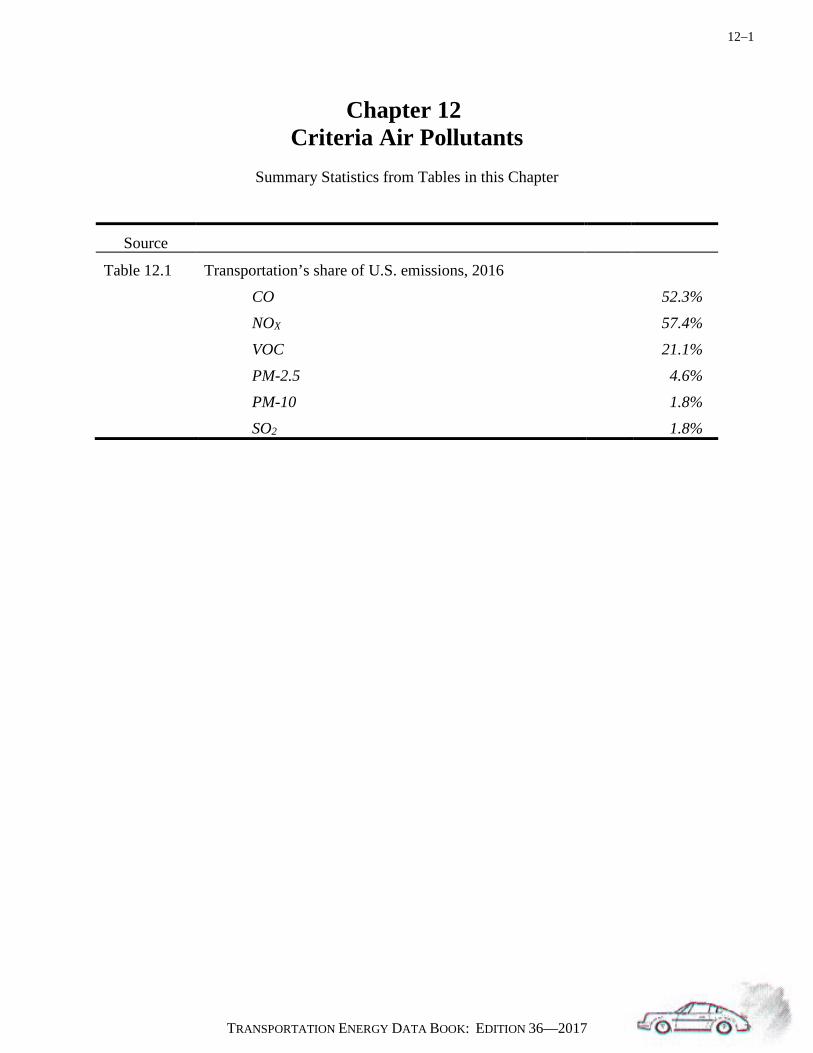
12–1
TRANSPORTATION ENERGY DATA BOOK: EDITION 36—2017
Chapter 12 Criteria Air Pollutants
Summary Statistics from Tables in this Chapter
Source
Table 12.1 Transportation’s share of U.S. emissions, 2016 CO 52.3% NOX 57.4% VOC 21.1% PM-2.5 4.6% PM-10 1.8% SO2 1.8%

12–2
TRANSPORTATION ENERGY DATA BOOK: EDITION 36—2017
Transportation accounts for the majority of carbon monoxide and nitrogen oxide emissions. Highway vehicles are responsible for the largest share of transportation emission.
Table 12.1
Total National Emissions of the Criteria Air Pollutants by Sector, 2016 (millions of short tons/percentage)
Sector CO NOx VOC PM-10 PM-2.5 SO2 Highway vehicles 17.87 3.61 1.77 0.29 0.13 0.02 30.3% 34.4% 11.1% 1.2% 2.2% 0.7% Other off-highway 12.99 2.42 1.58 0.16 0.15 0.03 22.0% 23.0% 9.9% 0.7% 2.5% 1.1% Transportation total 30.86 6.02 3.34 0.45 0.28 0.05 52.3% 57.4% 21.1% 1.8% 4.6% 1.8% Stationary source fuel combustion 4.13 2.78 0.53 0.92 0.78 1.97 7.0% 26.5% 3.4% 3.8% 12.7% 72.8% Industrial processes 2.22 1.29 7.30 0.96 0.42 0.50 3.8% 12.3% 46.0% 3.9% 6.8% 18.5% Waste disposal and recycling total 2.16 0.11 0.20 0.31 0.25 0.04 3.7% 1.1% 1.2% 1.2% 4.1% 1.4% Miscellaneous 19.62 0.29 4.49 21.80 4.43 0.15 33.3% 2.8% 28.3% 89.2% 71.8% 5.5% Total of all sources 58.98 10.49 15.86 24.44 6.16 2.71 100.0% 100.0% 100.0% 100.0% 100.0% 100.0%
Note: CO = Carbon monoxide. NOx = Nitrogen oxides. VOC = Volatile organic compounds. PM-10 = Particulate matter less than 10 microns. PM-2.5 = Particulate matter less than 2.5 microns. SO2 = Sulfur dioxide. Source: U. S. Environmental Protection Agency, National Emission Inventory Air Pollutant Emission Trends website
www.epa.gov/air-emissions-inventories/air-pollutant-emissions-trends-data. (Additional resources: www.epa.gov/air-emissions-inventories/national-emissions-inventory)
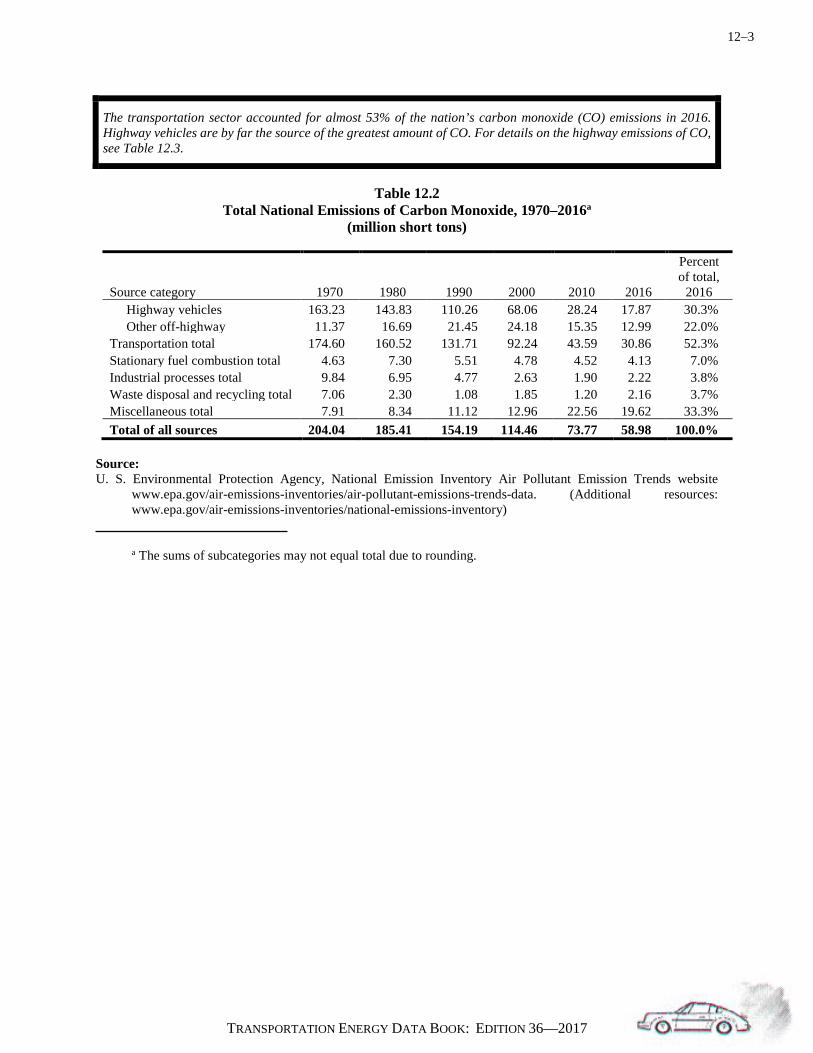
12–3
TRANSPORTATION ENERGY DATA BOOK: EDITION 36—2017
The transportation sector accounted for almost 53% of the nation’s carbon monoxide (CO) emissions in 2016. Highway vehicles are by far the source of the greatest amount of CO. For details on the highway emissions of CO, see Table 12.3.
Table 12.2
Total National Emissions of Carbon Monoxide, 1970–2016a (million short tons)
Source category 1970 1980 1990 2000 2010 2016
Percent of total,
2016 Highway vehicles 163.23 143.83 110.26 68.06 28.24 17.87 30.3% Other off-highway 11.37 16.69 21.45 24.18 15.35 12.99 22.0% Transportation total 174.60 160.52 131.71 92.24 43.59 30.86 52.3% Stationary fuel combustion total 4.63 7.30 5.51 4.78 4.52 4.13 7.0% Industrial processes total 9.84 6.95 4.77 2.63 1.90 2.22 3.8% Waste disposal and recycling total 7.06 2.30 1.08 1.85 1.20 2.16 3.7% Miscellaneous total 7.91 8.34 11.12 12.96 22.56 19.62 33.3% Total of all sources 204.04 185.41 154.19 114.46 73.77 58.98 100.0%
Source: U. S. Environmental Protection Agency, National Emission Inventory Air Pollutant Emission Trends website
www.epa.gov/air-emissions-inventories/air-pollutant-emissions-trends-data. (Additional resources: www.epa.gov/air-emissions-inventories/national-emissions-inventory)
a The sums of subcategories may not equal total due to rounding.

12–4
TRANSPORTATION ENERGY DATA BOOK: EDITION 36—2017
Though gasoline-powered light vehicles continue to be responsible for the majority of carbon monoxide emissions from highway vehicles, the total pollution from light vehicles in 2005 is less than a fifth of what it was in 1970. This is despite the fact that there were many more light vehicles on the road in 2005. Between 2005 and 2011 the Environmental Protection Agency updated their source from the MOBILE 6.2 emissions model to the MOVES emission model. MOVES results typically show higher emissions, especially for heavy trucks. The 2014 data are the latest available.
Table 12.3
Emissions of Carbon Monoxide from Highway Vehicles, 1970–2014a (million short tons)
Source category 1970 1980 1990 2000 2005
2011b 2014b
Percent of total, 2014
Gasoline powered Light vehicles & motorcycles 119.14 98.21 67.24 36.40 24.19
c
c c
Light trucksd 22.27 28.83 32.23 27.04 21.19 c c c
Subtotal light vehicles 141.41 127.04 99.47 63.44 45.38 25.34 20.03 91.7% Heavy vehicles 21.27 15.35 8.92 3.42 1.97 0.86 0.90 4.1% Subtotal gasoline vehicles 162.68 142.39 108.39 66.86 47.35 26.20 20.93 95.8%
Diesel powered Light vehicles 0.01 0.03 0.04 0.01 0.01 c c c
Light trucksd 0.06 0.05 0.03 0.01 0.01 c c c
Subtotal light vehicles 0.07 0.08 0.07 0.02 0.02 0.38 0.24 1.1% Heavy vehicles 0.49 1.36 1.81 1.19 0.85 0.77 0.67 3.1% Subtotal diesel vehicles 0.56 1.43 1.87 1.20 0.87 1.15 0.91 4.2%
Total Highway vehicle total 163.23 143.83 110.26 68.06 48.22 27.36 21.84 100.0% Percent diesel 0.3% 1.0% 1.7% 1.8% 1.8% 4.2% 4.2%
Source: U. S. Environmental Protection Agency, National Emission Inventory Air Pollutant Emission Trends website
www.epa.gov/air-emissions-inventories/national-emissions-inventory-nei. (Additional resources: www.epa.gov/air-emissions-inventories/national-emissions-inventory)
a The sums of subcategories may not equal total due to rounding. b These data are not directly comparable to the older data due to the change in source from the MOBILE emissions model to the MOVES emissions model. c Data are not available. d Less than 8,500 pounds.

12–5
TRANSPORTATION ENERGY DATA BOOK: EDITION 36—2017
The transportation sector accounted for almost 60% of the nation’s nitrogen oxide (NOx) emissions in 2016, with the majority coming from highway vehicles. For details on the highway emissions of NOx, see Table 12.5.
Table 12.4
Total National Emissions of Nitrogen Oxides, 1970–2016a (million short tons)
Source category 1970 1980 1990 2000 2010 2016
Percent of total,
2016 Highway vehicles 12.62 11.49 9.59 8.39 5.70 3.61 34.4% Other off-highway 2.65 3.35 3.78 4.17 3.32 2.42 23.0% Transportation total 15.27 14.84 13.37 12.56 9.02 6.02 57.4% Stationary fuel combustion total 10.06 11.32 10.89 8.82 4.33 2.78 26.5% Industrial processes total 0.78 0.56 0.80 0.81 1.12 1.29 12.3% Waste disposal and recycling total 0.44 0.11 0.09 0.13 0.09 0.11 1.1% Miscellaneous total 0.33 0.25 0.37 0.28 0.30 0.29 2.8% Total of all sources 26.88 27.08 25.52 22.60 14.86 10.49 100.0%
Source: U. S. Environmental Protection Agency, National Emission Inventory Air Pollutant Emission Trends website
www.epa.gov/air-emissions-inventories/air-pollutant-emissions-trends-data. (Additional resources: www.epa.gov/air-emissions-inventories/national-emissions-inventory)
a The sums of subcategories may not equal total due to rounding.

12–6
TRANSPORTATION ENERGY DATA BOOK: EDITION 36—2017
Diesel-powered vehicles were responsible for nearly one-half (49%) of highway vehicle nitrogen oxide emissions in 2014, while light gasoline vehicles were responsible for the rest. Between 2005 and 2011 the Environmental Protection Agency updated their source from the MOBILE 6.2 emissions model to the MOVES emission model. MOVES results typically show higher emissions, especially for heavy trucks. The 2014 data are the latest available.
Table 12.5
Emissions of Nitrogen Oxides from Highway Vehicles, 1970–2014a (million short tons)
Source category 1970 1980 1990 2000 2005
2011b 2014b
Percent of total, 2014
Gasoline powered Light vehicles & motorcycles 8.54 6.63 4.26 2.31 1.63
c
c c
Light trucksd 1.54 1.58 1.50 1.44 1.56 c c c
Subtotal light vehicles 10.08 8.21 5.76 3.75 3.19 3.09 2.29 49.1% Heavy vehicles 0.72 0.62 0.57 0.45 0.38 0.09 0.09 1.9% Subtotal gasoline vehicles 10.81 8.83 6.33 4.20 3.57 3.18 2.38 51.0%
Diesel powered Light vehicles 0.00 0.03 0.04 0.01 0.00 c c c
Light trucksd 0.07 0.05 0.02 0.01 0.01 c c c
Subtotal light vehicles 0.07 0.08 0.06 0.02 0.01 0.13 0.11 2.4% Heavy vehicles 1.76 2.59 3.19 4.18 2.81 2.56 2.17 46.6% Subtotal diesel vehicles 1.83 2.66 3.26 4.19 2.82 2.69 2.28 49.0%
Total Highway vehicle total 12.64 11.49 9.59 8.39 6.39 5.87 4.67 100.0%
Percent diesel 14.5% 23.1% 34.0% 49.9% 44.1% 45.8% 49.0%
Source: U. S. Environmental Protection Agency, National Emission Inventory Air Pollutant Emission Trends website
www.epa.gov/air-emissions-inventories/national-emissions-inventory-nei. (Additional resources: www.epa.gov/air-emissions-inventories/national-emissions-inventory)
a The sums of subcategories may not equal total due to rounding. b These data are not directly comparable to the older data due to the change in source from the MOBILE emissions model to the MOVES emissions model. c Data are not available. d Less than 8,500 pounds.
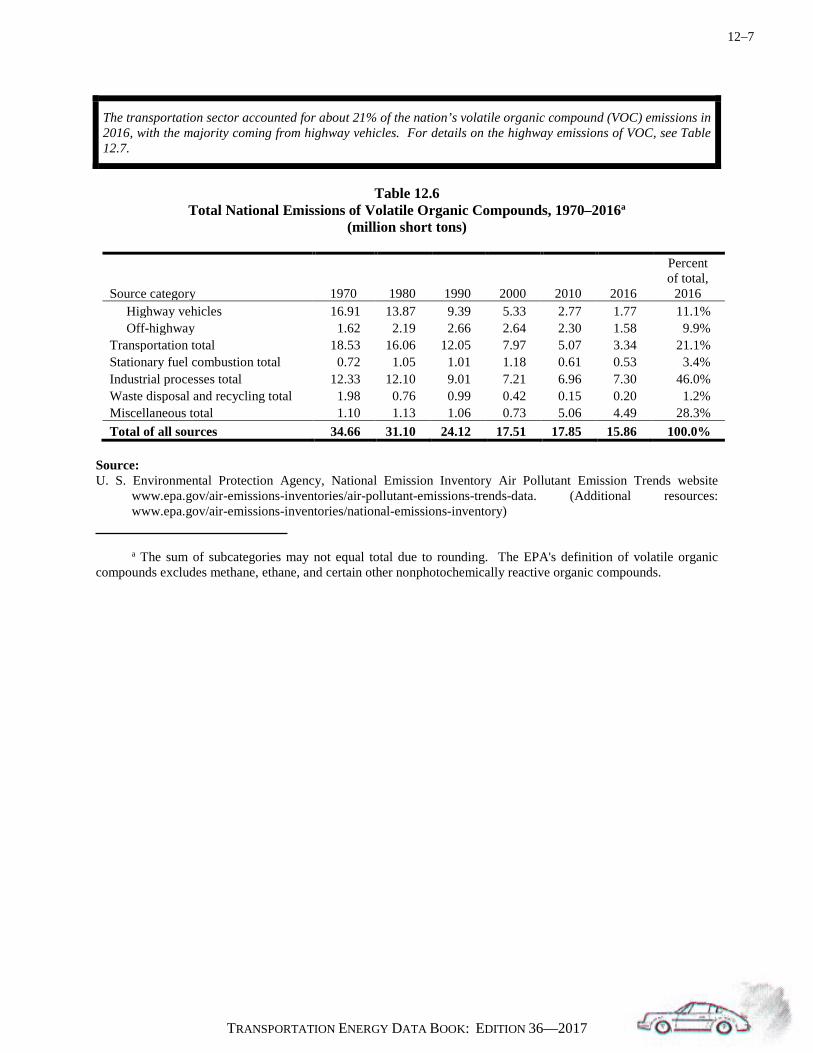
12–7
TRANSPORTATION ENERGY DATA BOOK: EDITION 36—2017
The transportation sector accounted for about 21% of the nation’s volatile organic compound (VOC) emissions in 2016, with the majority coming from highway vehicles. For details on the highway emissions of VOC, see Table 12.7.
Table 12.6
Total National Emissions of Volatile Organic Compounds, 1970–2016a (million short tons)
Source category 1970 1980 1990 2000 2010 2016
Percent of total,
2016 Highway vehicles 16.91 13.87 9.39 5.33 2.77 1.77 11.1% Off-highway 1.62 2.19 2.66 2.64 2.30 1.58 9.9% Transportation total 18.53 16.06 12.05 7.97 5.07 3.34 21.1% Stationary fuel combustion total 0.72 1.05 1.01 1.18 0.61 0.53 3.4% Industrial processes total 12.33 12.10 9.01 7.21 6.96 7.30 46.0% Waste disposal and recycling total 1.98 0.76 0.99 0.42 0.15 0.20 1.2% Miscellaneous total 1.10 1.13 1.06 0.73 5.06 4.49 28.3% Total of all sources 34.66 31.10 24.12 17.51 17.85 15.86 100.0%
Source: U. S. Environmental Protection Agency, National Emission Inventory Air Pollutant Emission Trends website
www.epa.gov/air-emissions-inventories/air-pollutant-emissions-trends-data. (Additional resources: www.epa.gov/air-emissions-inventories/national-emissions-inventory)
a The sum of subcategories may not equal total due to rounding. The EPA's definition of volatile organic compounds excludes methane, ethane, and certain other nonphotochemically reactive organic compounds.
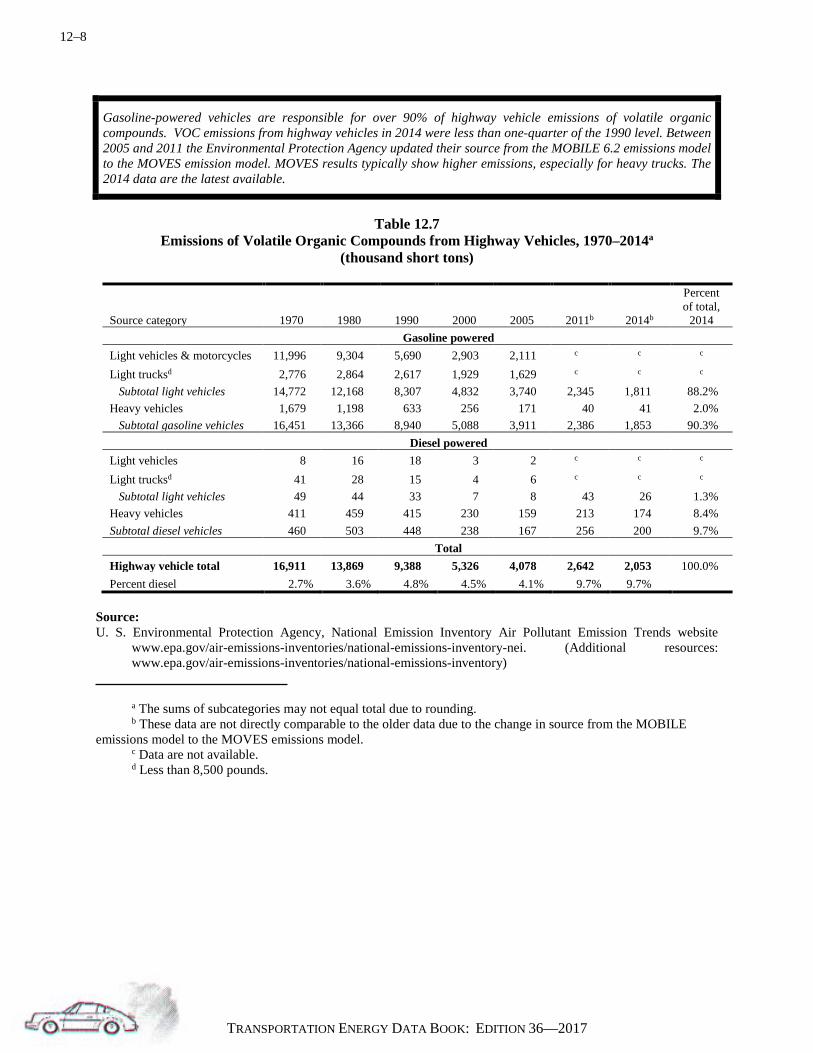
12–8
TRANSPORTATION ENERGY DATA BOOK: EDITION 36—2017
Gasoline-powered vehicles are responsible for over 90% of highway vehicle emissions of volatile organic compounds. VOC emissions from highway vehicles in 2014 were less than one-quarter of the 1990 level. Between 2005 and 2011 the Environmental Protection Agency updated their source from the MOBILE 6.2 emissions model to the MOVES emission model. MOVES results typically show higher emissions, especially for heavy trucks. The 2014 data are the latest available.
Table 12.7
Emissions of Volatile Organic Compounds from Highway Vehicles, 1970–2014a (thousand short tons)
Source category 1970 1980 1990 2000 2005
2011b 2014b
Percent of total,
2014 Gasoline powered
Light vehicles & motorcycles 11,996 9,304 5,690 2,903 2,111 c c c
Light trucksd 2,776 2,864 2,617 1,929 1,629 c c c
Subtotal light vehicles 14,772 12,168 8,307 4,832 3,740 2,345 1,811 88.2% Heavy vehicles 1,679 1,198 633 256 171 40 41 2.0% Subtotal gasoline vehicles 16,451 13,366 8,940 5,088 3,911 2,386 1,853 90.3%
Diesel powered Light vehicles 8 16 18 3 2 c c c
Light trucksd 41 28 15 4 6 c c c
Subtotal light vehicles 49 44 33 7 8 43 26 1.3% Heavy vehicles 411 459 415 230 159 213 174 8.4% Subtotal diesel vehicles 460 503 448 238 167 256 200 9.7%
Total Highway vehicle total 16,911 13,869 9,388 5,326 4,078 2,642 2,053 100.0% Percent diesel 2.7% 3.6% 4.8% 4.5% 4.1% 9.7% 9.7%
Source: U. S. Environmental Protection Agency, National Emission Inventory Air Pollutant Emission Trends website
www.epa.gov/air-emissions-inventories/national-emissions-inventory-nei. (Additional resources: www.epa.gov/air-emissions-inventories/national-emissions-inventory)
a The sums of subcategories may not equal total due to rounding. b These data are not directly comparable to the older data due to the change in source from the MOBILE emissions model to the MOVES emissions model. c Data are not available. d Less than 8,500 pounds.
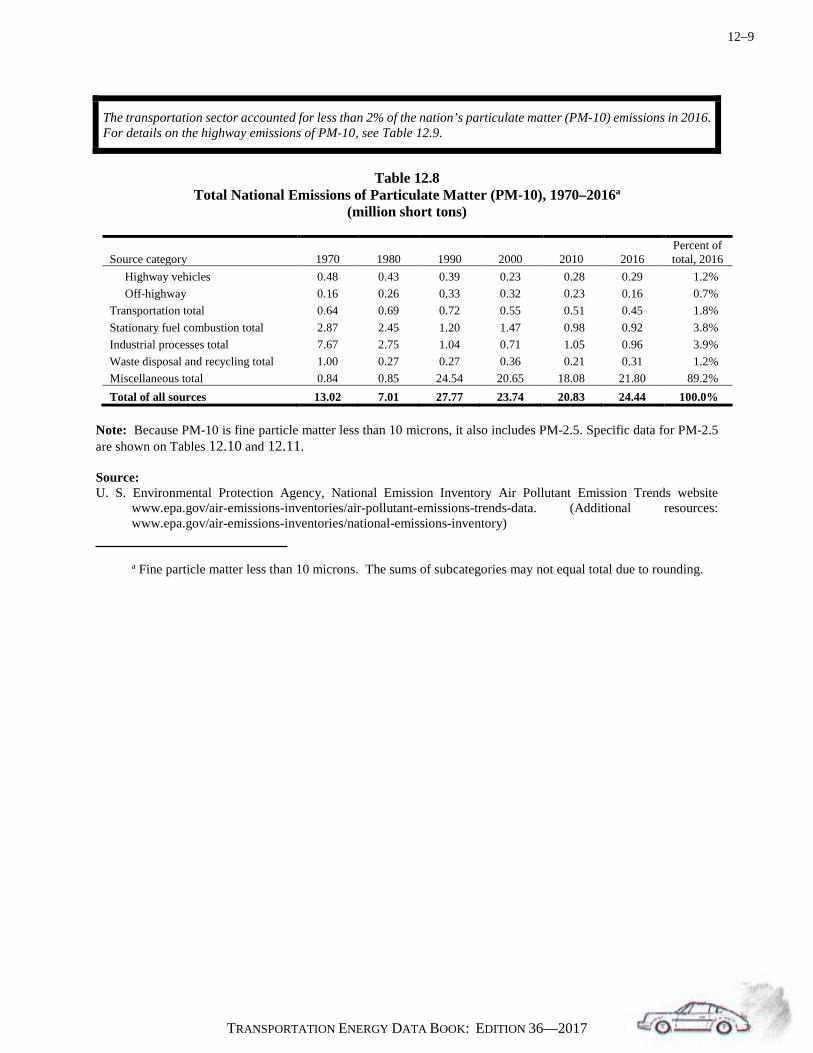
12–9
TRANSPORTATION ENERGY DATA BOOK: EDITION 36—2017
The transportation sector accounted for less than 2% of the nation’s particulate matter (PM-10) emissions in 2016. For details on the highway emissions of PM-10, see Table 12.9.
Table 12.8
Total National Emissions of Particulate Matter (PM-10), 1970–2016a (million short tons)
Source category 1970 1980 1990 2000 2010 2016 Percent of total, 2016
Highway vehicles 0.48 0.43 0.39 0.23 0.28 0.29 1.2% Off-highway 0.16 0.26 0.33 0.32 0.23 0.16 0.7% Transportation total 0.64 0.69 0.72 0.55 0.51 0.45 1.8% Stationary fuel combustion total 2.87 2.45 1.20 1.47 0.98 0.92 3.8% Industrial processes total 7.67 2.75 1.04 0.71 1.05 0.96 3.9% Waste disposal and recycling total 1.00 0.27 0.27 0.36 0.21 0.31 1.2% Miscellaneous total 0.84 0.85 24.54 20.65 18.08 21.80 89.2% Total of all sources 13.02 7.01 27.77 23.74 20.83 24.44 100.0%
Note: Because PM-10 is fine particle matter less than 10 microns, it also includes PM-2.5. Specific data for PM-2.5 are shown on Tables 12.10 and 12.11. Source: U. S. Environmental Protection Agency, National Emission Inventory Air Pollutant Emission Trends website
www.epa.gov/air-emissions-inventories/air-pollutant-emissions-trends-data. (Additional resources: www.epa.gov/air-emissions-inventories/national-emissions-inventory)
a Fine particle matter less than 10 microns. The sums of subcategories may not equal total due to rounding.
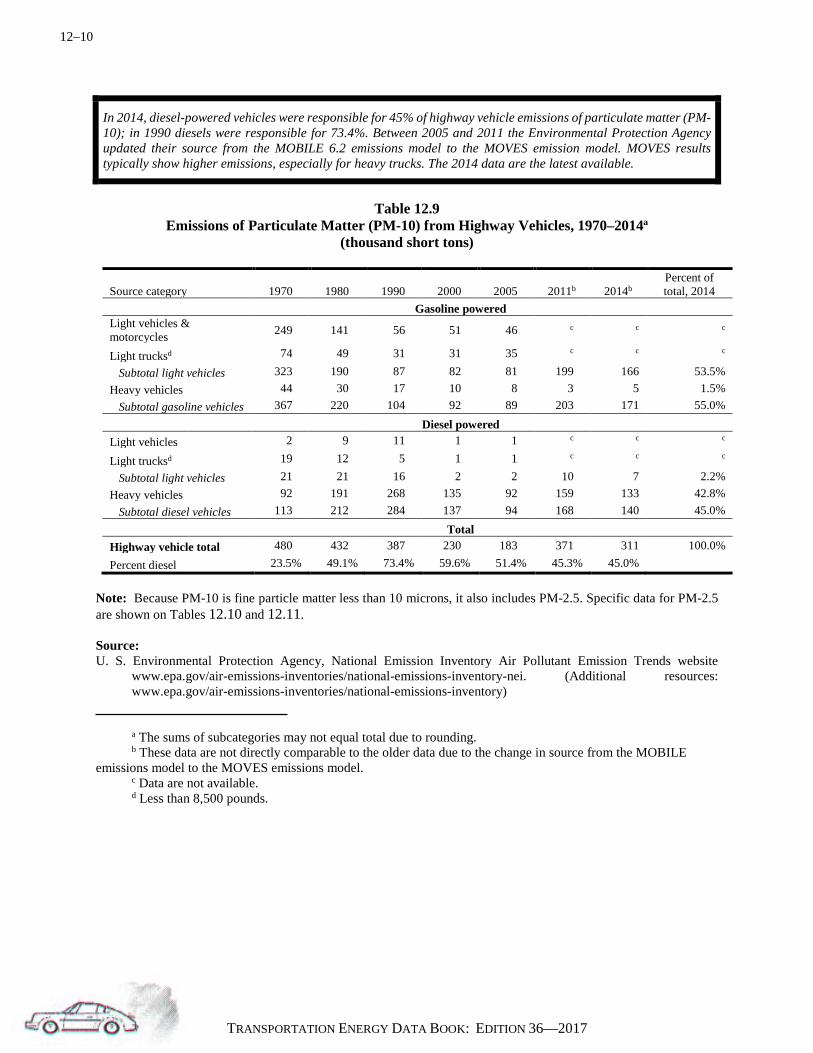
12–10
TRANSPORTATION ENERGY DATA BOOK: EDITION 36—2017
In 2014, diesel-powered vehicles were responsible for 45% of highway vehicle emissions of particulate matter (PM-10); in 1990 diesels were responsible for 73.4%. Between 2005 and 2011 the Environmental Protection Agency updated their source from the MOBILE 6.2 emissions model to the MOVES emission model. MOVES results typically show higher emissions, especially for heavy trucks. The 2014 data are the latest available.
Table 12.9
Emissions of Particulate Matter (PM-10) from Highway Vehicles, 1970–2014a (thousand short tons)
Source category 1970 1980 1990 2000 2005
2011b 2014b Percent of total, 2014
Gasoline powered Light vehicles & motorcycles 249 141 56 51 46 c c c
Light trucksd 74 49 31 31 35 c c c
Subtotal light vehicles 323 190 87 82 81 199 166 53.5% Heavy vehicles 44 30 17 10 8 3 5 1.5% Subtotal gasoline vehicles 367 220 104 92 89 203 171 55.0%
Diesel powered Light vehicles 2 9 11 1 1 c c c
Light trucksd 19 12 5 1 1 c c c
Subtotal light vehicles 21 21 16 2 2 10 7 2.2% Heavy vehicles 92 191 268 135 92 159 133 42.8% Subtotal diesel vehicles 113 212 284 137 94 168 140 45.0%
Total Highway vehicle total 480 432 387 230 183 371 311 100.0% Percent diesel 23.5% 49.1% 73.4% 59.6% 51.4% 45.3% 45.0%
Note: Because PM-10 is fine particle matter less than 10 microns, it also includes PM-2.5. Specific data for PM-2.5 are shown on Tables 12.10 and 12.11. Source: U. S. Environmental Protection Agency, National Emission Inventory Air Pollutant Emission Trends website
www.epa.gov/air-emissions-inventories/national-emissions-inventory-nei. (Additional resources: www.epa.gov/air-emissions-inventories/national-emissions-inventory)
a The sums of subcategories may not equal total due to rounding. b These data are not directly comparable to the older data due to the change in source from the MOBILE emissions model to the MOVES emissions model. c Data are not available. d Less than 8,500 pounds.

12–11
TRANSPORTATION ENERGY DATA BOOK: EDITION 36—2017
The transportation sector accounted for almost 5% of the nation’s particulate matter (PM-2.5) emissions in 2016. For details on the highway emissions of PM-2.5, see Table 12.11.
Table 12.10
Total National Emissions of Particulate Matter (PM-2.5), 1990–2016a (million short tons)
Source category 1990 1995 2000 2005 2010 2016
Percent of total,
2016 Highway vehicles 0.32 0.25 0.17 0.31 0.20 0.13 2.2% Off-highway 0.30 0.31 0.30 0.29 0.21 0.15 2.5% Transportation total 0.62 0.56 0.47 0.60 0.41 0.28 4.6% Stationary fuel combustion total 0.91 0.90 1.29 1.13 0.84 0.78 12.7% Industrial processes total 0.56 0.50 0.50 0.53 0.42 0.42 6.8% Waste disposal and recycling total 0.23 0.25 0.33 0.27 0.18 0.25 4.1% Miscellaneous total 5.23 4.73 4.69 3.07 4.15 4.43 71.8% Total of all sources 7.55 6.94 7.28 5.60 6.00 6.16 100.0%
Source: U. S. Environmental Protection Agency, National Emission Inventory Air Pollutant Emission Trends website
www.epa.gov/air-emissions-inventories/air-pollutant-emissions-trends-data. (Additional resources: www.epa.gov/air-emissions-inventories/national-emissions-inventory)
a The sums of subcategories may not equal total due to rounding.

12–12
TRANSPORTATION ENERGY DATA BOOK: EDITION 36—2017
Diesel vehicles are responsible for the majority of highway vehicle PM-2.5 emissions. Nearly two-thirds of the highway vehicles’ PM-2.5 emissions are from heavy diesel trucks. Between 2005 and 2011 the Environmental Protection Agency updated their source from the MOBILE 6.2 emissions model to the MOVES emission model. MOVES results typically show higher emissions, especially for heavy trucks. The 2014 data are the latest available.
Table 12.11
Emissions of Particulate Matter (PM-2.5) from Highway Vehicles, 1990–2014a (thousand short tons)
Source category 1990 1995 2000 2005
2011b
2014b
Percent of total,
2014 Gasoline powered
Light vehicles & motorcycles 35 30 27 23 c c c
Light trucksd 21 20 18 18 c c c
Subtotal light vehicles 56 50 45 41 68 59 37.2% Heavy vehicles 11 9 7 6 2 2 1.1% Subtotal gasoline vehicles 67 59 52 47 70 61 38.3%
Diesel powered Light vehicles 9 4 1 1 c c c
Light trucksd 4 2 1 1 c c c
Subtotal light vehicles 13 6 2 2 6 4 2.8% Heavy vehicles 243 179 119 79 120 93 58.9% Subtotal diesel vehicles 256 185 121 81 126 97 61.7%
Total Highway vehicle total 323 244 173 128 196 159 100.0% Percent diesel 79.3% 75.8% 69.9% 63.3% 64.6% 61.7%
Source: U. S. Environmental Protection Agency, National Emission Inventory Air Pollutant Emission Trends website
www.epa.gov/air-emissions-inventories/national-emissions-inventory-nei. (Additional resources: www.epa.gov/air-emissions-inventories/national-emissions-inventory)
a The sums of subcategories may not equal total due to rounding. b These data are not directly comparable to the older data due to the change in source from the MOBILE emissions model to the MOVES emissions model. The 2011 data include condensable plus filterable PM-2.5. c Data are not available. d Less than 8,500 pounds.

12–13
TRANSPORTATION ENERGY DATA BOOK: EDITION 36—2017
The transportation sector accounted for only 2% of the nation’s sulfur dioxide (SO2) emissions in 2016, with off-highway vehicles responsible for most of the emissions. Stationary fuel combustion (e.g., factories) was responsible for nearly 73% of all SO2 emissions in 2016.
Table 12.12
Total National Emissions of Sulfur Dioxide, 1970–2016a (million short tons)
Source category 1970 1980 1990 2000 2010 2016
Percent of total,
2016 Highway vehicles 0.27 0.39 0.50 0.26 0.04 0.02 0.7% Other off-highway 0.28 0.32 0.37 0.44 0.12 0.03 1.1% Transportation total 0.55 0.72 0.87 0.70 0.16 0.05 1.8% Stationary fuel combustion total 23.46 21.39 20.21 14.16 6.75 1.97 72.8% Industrial processes total 7.10 3.81 1.90 1.42 0.68 0.50 18.5% Waste disposal and recycling total 0.01 0.03 0.04 0.03 0.02 0.04 1.4% Miscellaneous total 0.11 0.01 0.01 0.07 0.16 0.15 5.5% Total of all sources 31.22 25.93 23.08 16.35 7.73 2.71 100.0%
Source: U. S. Environmental Protection Agency, National Emission Inventory Air Pollutant Emission Trends website
www.epa.gov/air-emissions-inventories/air-pollutant-emissions-trends-data. (Additional resources: www.epa.gov/air-emissions-inventories/national-emissions-inventory)
a The sums of subcategories may not equal total due to rounding.
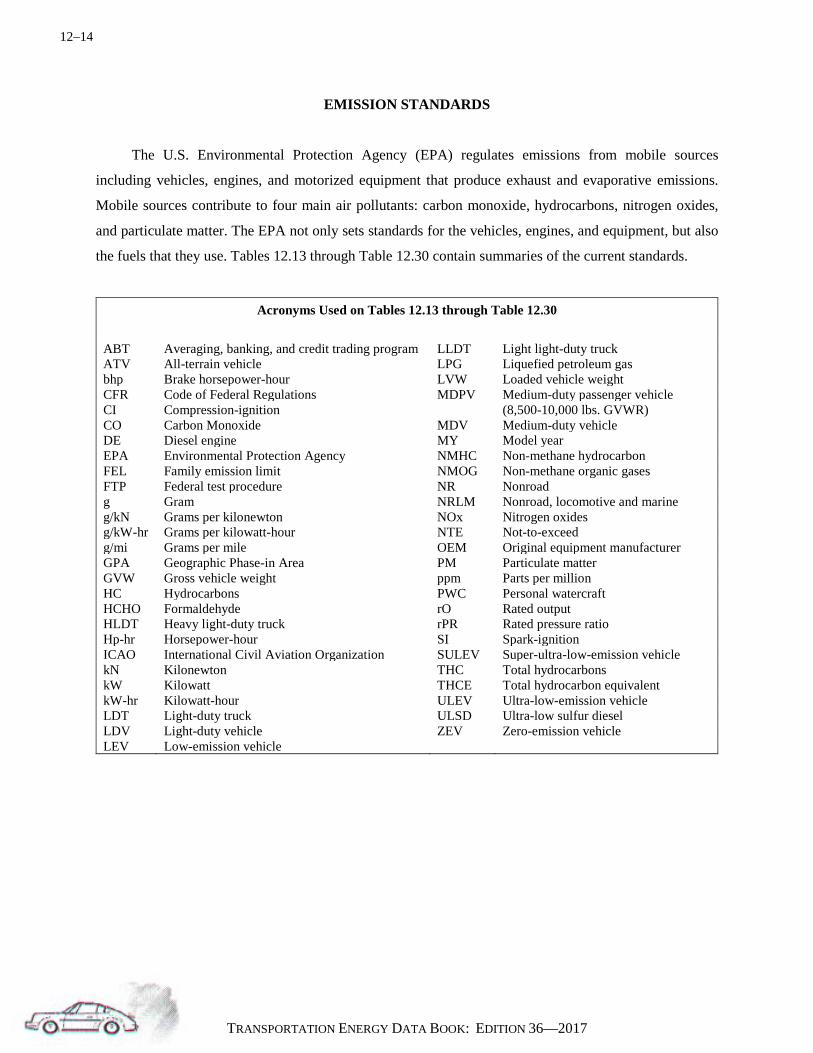
12–14
TRANSPORTATION ENERGY DATA BOOK: EDITION 36—2017
EMISSION STANDARDS
The U.S. Environmental Protection Agency (EPA) regulates emissions from mobile sources
including vehicles, engines, and motorized equipment that produce exhaust and evaporative emissions.
Mobile sources contribute to four main air pollutants: carbon monoxide, hydrocarbons, nitrogen oxides,
and particulate matter. The EPA not only sets standards for the vehicles, engines, and equipment, but also
the fuels that they use. Tables 12.13 through Table 12.30 contain summaries of the current standards.
Acronyms Used on Tables 12.13 through Table 12.30
ABT Averaging, banking, and credit trading program LLDT Light light-duty truck ATV All-terrain vehicle LPG Liquefied petroleum gas bhp Brake horsepower-hour LVW Loaded vehicle weight CFR Code of Federal Regulations MDPV Medium-duty passenger vehicle CI Compression-ignition (8,500-10,000 lbs. GVWR) CO Carbon Monoxide MDV Medium-duty vehicle DE Diesel engine MY Model year EPA Environmental Protection Agency NMHC Non-methane hydrocarbon FEL Family emission limit NMOG Non-methane organic gases FTP Federal test procedure NR Nonroad g Gram NRLM Nonroad, locomotive and marine g/kN Grams per kilonewton NOx Nitrogen oxides g/kW-hr Grams per kilowatt-hour NTE Not-to-exceed g/mi Grams per mile OEM Original equipment manufacturer GPA Geographic Phase-in Area PM Particulate matter GVW Gross vehicle weight ppm Parts per million HC Hydrocarbons PWC Personal watercraft HCHO Formaldehyde rO Rated output HLDT Heavy light-duty truck rPR Rated pressure ratio Hp-hr Horsepower-hour SI Spark-ignition ICAO International Civil Aviation Organization SULEV Super-ultra-low-emission vehicle kN Kilonewton THC Total hydrocarbons kW Kilowatt THCE Total hydrocarbon equivalent kW-hr Kilowatt-hour ULEV Ultra-low-emission vehicle LDT Light-duty truck ULSD Ultra-low sulfur diesel LDV Light-duty vehicle ZEV Zero-emission vehicle LEV Low-emission vehicle

12–15
TRANSPORTATION ENERGY DATA BOOK: EDITION 36—2017
The Environmental Protection Agency issued final Tier 3 emission standards in 2014. The combined emissions of non-methane organic gases (NMOG) and nitrogen oxides (NOx) that new gasoline engines are allowed to produce from model years 2017 to 2025 are regulated in these new standards. These standards apply to a corporate average, meaning that some vehicles produced in those model years will emit more than the standard, while others will emit less, so long as the average for each Original Equipment Manufacturer (OEM) product offerings meets the standard.
Table 12.13
Tier 3 Non-Methane Organic Gases and Nitrogen Oxide Standards (milligrams per mile)
Model Year
Light-duty vehicles and
LDT1
LDT2, 3, 4, and medium-duty
passenger vehicles Class 2b trucks Class 3 trucks 2016 a a 333b 548b 2017 86 101 310b 508b 2018 79 92 278 451 2019 72 83 253 400 2020 65 74 228 349 2021 58 65 203 298 2022 51 56 178 247 2023 44 47 178 247 2024 37 38 178 247
2025 and later 30 30 178 247
Notes: Standards are for the Federal Test Procedure. Different standards apply for the Supplemental Federal Test Procedure. For vehicles over 6,000 lbs. gross vehicle weight rating (GVWR), the standards apply beginning in MY 2018. LDT1 = Light trucks less than 6,000 lbs. GVWR and less than 3,750 lbs. loaded vehicle weight (LVW). LDT2, 3, 4 = Light trucks less than 8,500 lbs. GVWR and more than 3,750 lbs. LVW. Class 2b trucks = trucks 8,501-10,000 lbs. GVWR. Class 3 trucks = trucks 10,001-14,000 lbs. GVWR. Source: Federal Register Vol. 79, No. 81, Monday, April 28, 2014. a Not applicable. b Voluntary standard.

12–16
TRANSPORTATION ENERGY DATA BOOK: EDITION 36—2017
Table 12.14
Tier 3 Particulate Matter Emission Standards for Light Gasoline Vehicles, MY 2017 and Beyond (milligrams per mile)
Model Year Certification standard (milligrams per mile)
In-use standard (milligrams per mile)
Phase-in (percent of U.S. sales)
2017 3 6 20a 2018 3 6 20 2019 3 6 40 2020 3 6 70 2021 3 6 100
2022-on 3 3 100 Note: Standards are for the Federal Test Procedure. The standards apply to all light-duty vehicles, light-duty trucks, and medium-duty passenger vehicles. For vehicles over 6,000 lbs. gross vehicle weight rating, the standards apply beginning in MY 2018. Source: Federal Register Vol. 79, No. 81, Monday, April 28, 2014.
Table 12.15 Tier 3 Evaporative Emission Standards
(grams per test)
Vehicle class Highest hot soak + diurnal level
(over both 2-day and 3-day diurnal tests) Light-duty vehicles and LDT1 0.3 LDT2 0.4 LDT3, LT4, and medium-duty passenger vehicles 0.5 Heavy-duty gasoline vehicles 0.6
Note: LDT1 = Light trucks less than 6,000 lbs. gross vehicle weight rating (GVWR) and less than 3,750 lbs. loaded vehicle weight (LVW). LDT2 = Light trucks less than 6,000 lbs. GVWR and less than 3,750 lbs. LVW. LDT3, 4 = Light trucks less than 8,500 lbs. GVWR and more than 3,750 lbs. LVW. Heavy-duty gasoline vehicles = trucks over 10,000 lbs. GVWR. Source: Federal Register Vol. 79, No. 81, Monday, April 28, 2014. a Manufacturers comply with 20% of their light-duty truck fleet under 6,000 lbs. gross vehicle weight, alternatively with 10% of their total light-duty vehicle, light-duty trucks and medium-duty passenger vehicle fleet.
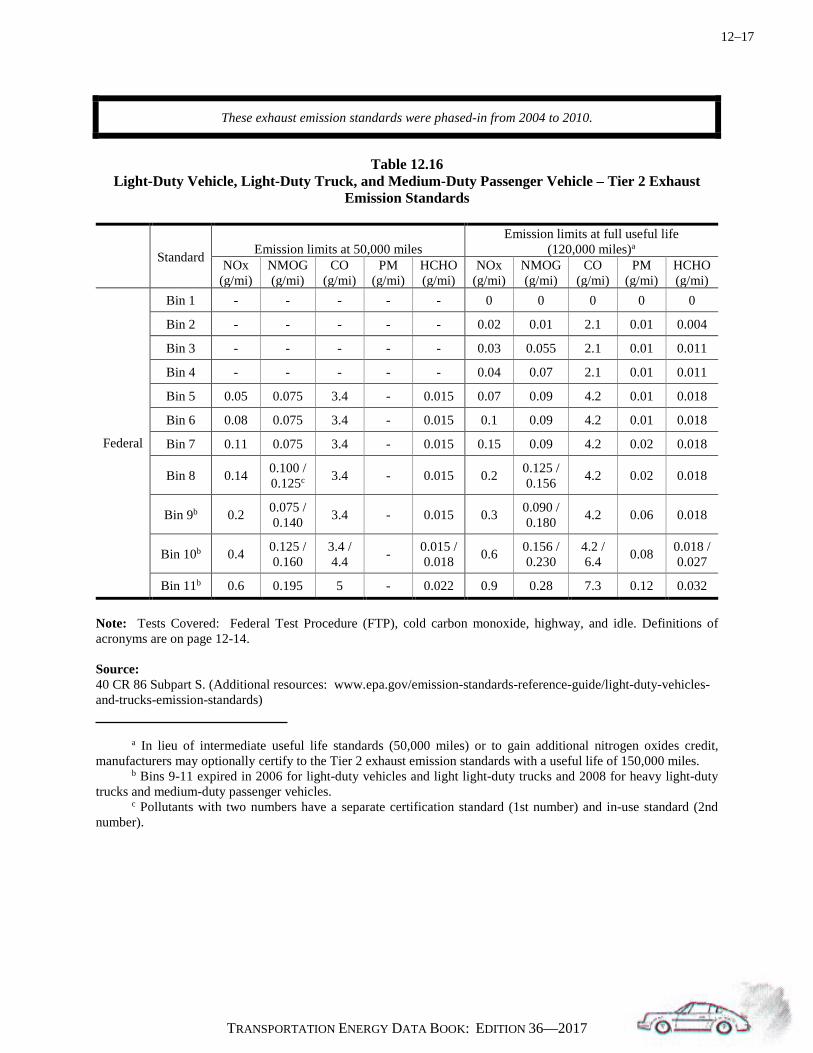
12–17
TRANSPORTATION ENERGY DATA BOOK: EDITION 36—2017
These exhaust emission standards were phased-in from 2004 to 2010.
Table 12.16
Light-Duty Vehicle, Light-Duty Truck, and Medium-Duty Passenger Vehicle – Tier 2 Exhaust Emission Standards
Standard Emission limits at 50,000 miles Emission limits at full useful life
(120,000 miles)a NOx
(g/mi) NMOG (g/mi)
CO (g/mi)
PM (g/mi)
HCHO (g/mi)
NOx (g/mi)
NMOG (g/mi)
CO (g/mi)
PM (g/mi)
HCHO (g/mi)
Federal
Bin 1 - - - - - 0 0 0 0 0
Bin 2 - - - - - 0.02 0.01 2.1 0.01 0.004
Bin 3 - - - - - 0.03 0.055 2.1 0.01 0.011
Bin 4 - - - - - 0.04 0.07 2.1 0.01 0.011
Bin 5 0.05 0.075 3.4 - 0.015 0.07 0.09 4.2 0.01 0.018
Bin 6 0.08 0.075 3.4 - 0.015 0.1 0.09 4.2 0.01 0.018
Bin 7 0.11 0.075 3.4 - 0.015 0.15 0.09 4.2 0.02 0.018
Bin 8 0.14 0.100 / 0.125c 3.4 - 0.015 0.2 0.125 /
0.156 4.2 0.02 0.018
Bin 9b 0.2 0.075 / 0.140 3.4 - 0.015 0.3 0.090 /
0.180 4.2 0.06 0.018
Bin 10b 0.4 0.125 / 0.160
3.4 / 4.4 - 0.015 /
0.018 0.6 0.156 / 0.230
4.2 / 6.4 0.08 0.018 /
0.027
Bin 11b 0.6 0.195 5 - 0.022 0.9 0.28 7.3 0.12 0.032
Note: Tests Covered: Federal Test Procedure (FTP), cold carbon monoxide, highway, and idle. Definitions of acronyms are on page 12-14. Source: 40 CR 86 Subpart S. (Additional resources: www.epa.gov/emission-standards-reference-guide/light-duty-vehicles-and-trucks-emission-standards) a In lieu of intermediate useful life standards (50,000 miles) or to gain additional nitrogen oxides credit, manufacturers may optionally certify to the Tier 2 exhaust emission standards with a useful life of 150,000 miles. b Bins 9-11 expired in 2006 for light-duty vehicles and light light-duty trucks and 2008 for heavy light-duty trucks and medium-duty passenger vehicles. c Pollutants with two numbers have a separate certification standard (1st number) and in-use standard (2nd number).

12–18
TRANSPORTATION ENERGY DATA BOOK: EDITION 36—2017
Table 12.17 Light-Duty Vehicle, Light-Duty Truck, and Medium-Duty Passenger Vehicle – Tier 2 Evaporative
Emission Standards
Vehicle type Model year
3 Day diurnal + hot soak
(g/test)
Supplemental 2 day diurnal
+ hot soak (g/test)
Running loss
(g/mi)
Federal
LDV/LLDTsa 2004 0.95 1.20 0.05 HLDTsb 2004 1.20 1.50 0.05 MDPVsa, b 2004 1.40 1.75 0.05 LDVa 2009 0.50 0.65 0.05 LLDTa 2009 0.65 0.85 0.05 HLDTb 2010 0.90 1.15 0.05 MDPVa, b 2010 1.00 1.25 0.05
Note: Multi-fuel vehicle phase-in applies. Definitions of acronyms are on page 12-14. Source: 40 CR 86 Subpart S. (Additional resources: www.epa.gov/emission-standards-reference-guide/light-duty-vehicles-
and-trucks-emission-standards) a For liquefied petroleum gas-fueled light-duty vehicles (LDV), light-duty trucks (LDT), and medium-duty passenger vehicles (MDPV): 0.15 grams hydrocarbon per gallon (0.04 grams per liter) of fuel dispensed. b Refueling standards for heavy light-duty trucks (HLDT) are subject to phase-in requirements. MDPVs must also comply with the phase-in requirement and must be grouped with HLDTs to determine phase-in compliance.
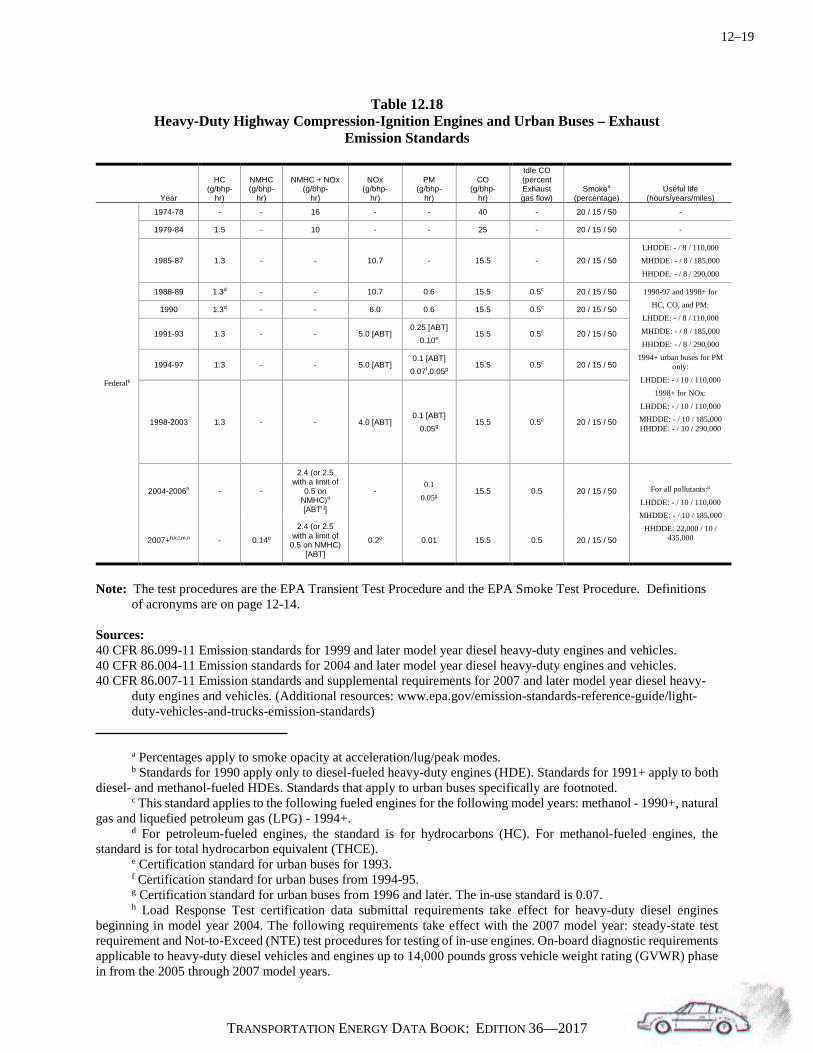
12–19
TRANSPORTATION ENERGY DATA BOOK: EDITION 36—2017
Table 12.18 Heavy-Duty Highway Compression-Ignition Engines and Urban Buses – Exhaust
Emission Standards
Year
HC (g/bhp-
hr)
NMHC (g/bhp-
hr)
NMHC + NOx (g/bhp-
hr)
NOx (g/bhp-
hr)
PM (g/bhp-
hr)
CO (g/bhp-
hr)
Idle CO (percent Exhaust gas flow)
Smokea (percentage)
Useful life (hours/years/miles)
Federalb
1974-78 - - 16 - - 40 - 20 / 15 / 50 -
1979-84 1.5 - 10 - - 25 - 20 / 15 / 50 -
1985-87 1.3 - - 10.7 - 15.5 - 20 / 15 / 50 LHDDE: - / 8 / 110,000 MHDDE: - / 8 / 185,000
HHDDE: - / 8 / 290,000
1988-89 1.3d - - 10.7 0.6 15.5 0.5c 20 / 15 / 50 1990-97 and 1998+ for HC, CO, and PM:
LHDDE: - / 8 / 110,000
MHDDE: - / 8 / 185,000 HHDDE: - / 8 / 290,000
1994+ urban buses for PM only:
LHDDE: - / 10 / 110,000 1998+ for NOx:
LHDDE: - / 10 / 110,000 MHDDE: - / 10 / 185,000 HHDDE: - / 10 / 290,000
1990 1.3d - - 6.0 0.6 15.5 0.5c 20 / 15 / 50
1991-93 1.3 - - 5.0 [ABT] 0.25 [ABT]
0.10e 15.5 0.5c 20 / 15 / 50
1994-97 1.3 - - 5.0 [ABT] 0.1 [ABT]
0.07f,0.05g 15.5 0.5c 20 / 15 / 50
1998-2003 1.3 - - 4.0 [ABT] 0.1 [ABT]
0.05g 15.5 0.5c 20 / 15 / 50
2004-2006h - -
2.4 (or 2.5 with a limit of
0.5 on NMHC)o [ABTi,j]
- 0.1
0.05g 15.5 0.5 20 / 15 / 50 For all pollutants:p
LHDDE: - / 10 / 110,000 MHDDE: - / 10 / 185,000
HHDDE: 22,000 / 10 / 435,000 2007+h,k,l,m,n - 0.14o
2.4 (or 2.5 with a limit of
0.5 on NMHC) [ABT]
0.2o 0.01 15.5 0.5 20 / 15 / 50
Note: The test procedures are the EPA Transient Test Procedure and the EPA Smoke Test Procedure. Definitions
of acronyms are on page 12-14. Sources: 40 CFR 86.099-11 Emission standards for 1999 and later model year diesel heavy-duty engines and vehicles. 40 CFR 86.004-11 Emission standards for 2004 and later model year diesel heavy-duty engines and vehicles. 40 CFR 86.007-11 Emission standards and supplemental requirements for 2007 and later model year diesel heavy-
duty engines and vehicles. (Additional resources: www.epa.gov/emission-standards-reference-guide/light-duty-vehicles-and-trucks-emission-standards)
a Percentages apply to smoke opacity at acceleration/lug/peak modes. b Standards for 1990 apply only to diesel-fueled heavy-duty engines (HDE). Standards for 1991+ apply to both diesel- and methanol-fueled HDEs. Standards that apply to urban buses specifically are footnoted. c This standard applies to the following fueled engines for the following model years: methanol - 1990+, natural gas and liquefied petroleum gas (LPG) - 1994+. d For petroleum-fueled engines, the standard is for hydrocarbons (HC). For methanol-fueled engines, the standard is for total hydrocarbon equivalent (THCE). e Certification standard for urban buses for 1993. f Certification standard for urban buses from 1994-95. g Certification standard for urban buses from 1996 and later. The in-use standard is 0.07. h Load Response Test certification data submittal requirements take effect for heavy-duty diesel engines beginning in model year 2004. The following requirements take effect with the 2007 model year: steady-state test requirement and Not-to-Exceed (NTE) test procedures for testing of in-use engines. On-board diagnostic requirements applicable to heavy-duty diesel vehicles and engines up to 14,000 pounds gross vehicle weight rating (GVWR) phase in from the 2005 through 2007 model years.

12–20
TRANSPORTATION ENERGY DATA BOOK: EDITION 36—2017
Table 12.18 (continued) Heavy-Duty Highway Compression-Ignition Engines and Urban Buses – Exhaust
Emission Standards i The modified averaging, banking, and trading program for 1998 and later model year engines applies only to diesel cycle engines. Credits generated under the modified program may be used only in 2004 and later model years. j For heavy-duty diesel engines, there are three options to the measurement procedures currently in place for alternative fueled engines: (1) use a THC measurement in place of an non-methane hydrocarbon (NMHC) measurement; (2) use a measurement procedure specified by the manufacturer with prior approval of the Administrator; or (3) subtract two percent from the measured THC value to obtain an NMHC value. The methodology must be specified at time of certification and will remain the same for the engine family throughout the engines' useful life. For natural gas vehicles, EPA allows the option of measuring NMHC through direct quantification of individual species by gas chromatography. k Starting in 2006, refiners must begin producing highway diesel fuel that meets a maximum sulfur standard of 15 parts per million (ppm). l Subject to a Supplemental Emission Test (1.0 x Federal Test Procedure [FTP] standard (or Family Emission Limit [FEL]) for nitrogen oxides [NOx], NMHC, and particulate matter [PM]) and a NTE test (1.5 x FTP standard [or FEL] for NOx, NMHC, and PM). m EPA adopted the lab-testing and field-testing specifications in 40 CFR Part 1065 for heavy-duty highway engines, including both diesel and Otto-cycle engines. These procedures replace those previously published in 40 Code of Federal Regulations (CFR) Part 86, Subpart N. Any new testing for 2010 and later model years must be done using the 40 CFR Part 1065 procedures. n Two-phase in-use NTE testing program for heavy-duty diesel vehicles. The program begins with the 2007 model year for gaseous pollutants and 2008 for PM. The requirements apply to diesel engines certified for use in heavy-duty vehicles (including buses) with GVWRs greater than 8,500 pounds. However, the requirements do not apply to any heavy-duty diesel vehicle that was certified using a chassis dynamometer, including medium-duty passenger vehicles with GVWRs of between 8,500 and 10,000 pounds. o NOx and NMHC standards will be phased in together between 2007 and 2010. The phase-in will be on a percent-of-sales basis: 50 percent from 2007 to 2009 and 100 percent in 2010. p Note that for an individual engine, if the useful life hours interval is reached before the engine reaches 10 years or 100,000 miles, the useful life shall become 10 years or 100,000 miles, whichever occurs first, as required under Clean Air Act section 202(d).

12–21
TRANSPORTATION ENERGY DATA BOOK: EDITION 36—2017
Table 12.19 Heavy-Duty Highway Spark-Ignition Engines – Exhaust Emission Standards
Engine or
vehicle Year
Gross vehicle weight (lbs)
HCa (g/bhp-hr)
NMHCb (g/bhp-
hr) NOx
(g/bhp-hr)
NOx + NMHCc
(g/bhp-hr)
PM (g/bhp-
hr) CO
(g/bhp-hr)
Idle CO (% exhaust gas flow)
Formaldehyde (g/mile)
Useful life (years / miles)
Federal
Heavy duty
enginesd
Prior to Control - 12.7 - - 6.86 - 155 - -
5 / 50,000
1970-73 - 275 ppm - - - - 1.50% - -
1974-78 - - - 16 - - 40 - -
1979-84 - 1.5 - 10 - - 25 - -
1985-86 - 1.9 - - 10.6 - 37.1 - -
1987 ≤ 14,000 1.1 - - 10.6 - 14.4
0.5 -
> 14,000 1.9 - - 10.6 - 37.1 -
1988-90 ≤ 14,000 1.1 - - 6.0 - 14.4 - -
> 14,000 1.9 - - 6.0 - 37.1 - -
1990e ≤ 14,000 1.1 - - 6.0 - 14.4
0.5j
-
8 / 110,000k
> 14,000 1.9 - - 6.0 - 37.1 -
1991-97f ≤ 14,000 1.1g - - 5.0 - 14.4 -
> 14,000 1.9h - - 5.0 - 37.1 -
1998-2004f
≤ 14,000 1.1g - - 4.0i
- 14.4 -
> 14,000 1.9h - - - 37.1 -
2005-2007f
≤ 14,000 1.1g - 1.0l
- - 14.4 -
10 / 110,000 > 14,000 1.9h - - - 37.1 -
2008+ All - 0.14 0.2 - 0.01 14.4
Complete heavy-duty vehiclesn, q
2005-2007
8,500 - 10,000 - 0.280m - 0.9 - 7.3 -
11 / 110,000
10,000 - 14,000 - 0.330m - 1.0 - 8.1 -
2008+p
8,500 - 10,000 - 0.195o - 0.2 0.02 7.3 0.032
10,000 - 14,000 - 0.230o - 0.4 0.02 8.1 0.04
Note: Definitions of acronyms are on page 12-14. Sources: 40 CFR 86.1816-05, 86.1816-08 Emission standards for complete heavy-duty vehicles 40 CFR 86.1806-01, 86.1806-04, 86.1806-05 Onboard diagnostics requirements 40 CFR 86.1817-05, 86.1817-08 Complete heavy-duty vehicle averaging, banking, and trading program 40 CFR 86.091-10 Heavy-duty engine averaging, banking, and trading program for 1991 and later - Not available in
the e-CFR 40 CFR Part 86 Subpart B Vehicle test procedures (Additional resources: www.epa.gov/emission-standards-
reference-guide/light-duty-vehicles-and-trucks-emission-standards)
a For methanol-fueled engines, the standard is for total hydrocarbon equivalent (THCE). b For methanol and alcohol fueled vehicles the standard is for non-methane hydrocarbon equivalent (NMHCE). c For methanol fueled engines the standard is for nitrogen oxides (NOx) plus NMHCE. d Standards for heavy-duty engines are expressed in grams per brake horsepower-hour (g/bhp-hr). Starting with the 1998 model year, crankcase emissions are not allowed. e Standards for 1990 apply to gasoline and methanol-fueled engines. f Standards for 1991 and later apply to gasoline and methanol engines and are optional for natural gas and Liquefied Petroleum Gas-fueled engines through the 1996 model year. g For natural gas fueled engines the standard is 0.9 g/bhp-hr non-methane hydrocarbon (NMHC).

12–22
TRANSPORTATION ENERGY DATA BOOK: EDITION 36—2017
Table 12.19 (continued) Heavy-Duty Highway Spark-Ignition Engines – Exhaust Emission Standards
h For natural gas fueled engines the standard is 1.7 g/bhp-hr NMHC. i The NOx standard is 5.0 for all natural gas-fueled engines. j This standard applies to the following engines utilizing aftertreatment technology (except for methanol) for the following model years: gasoline/1990+; natural gas and LPG/1991+; methanol/1990+. Starting in 2005, engines certified to on-board diagnostics requirements are not required to meet the idle carbon monoxide (CO) standard. k Useful life is expressed in years or miles, whichever comes first. Useful life for the 1998 and later NOx standard and for all 2004 standards is 10 years or 110,000 miles, whichever comes first. l Manufacturers can choose this standard or one of the following options: (1) a standard of 1.5 g/bhp-hr NMHC+NOX that applies to the 2004 through 2007 model years, with complete heavy-duty vehicle standards taking effect in 2005; or (2) a standard of 1.5 g/bhp-hr NMHC + NOX that would apply to the 2003 through 2007 heavy-duty engines and optionally to 2003 through 2006 complete heavy-duty vehicles. m Standard is expressed as non-methane organic gas, but compliance can optionally be shown using measurement of NMHC or total hydrocarbon (THC). n Complete heavy-duty vehicles have the primary load-carrying container or device attached. Incomplete heavy-duty vehicles are certified to heavy-duty engine standards. Standards for complete heavy-duty vehicles are expressed in grams per mile (g/mi). Starting in 2005 (or 2003 or 2004 depending on the selected phase in option; see footnote l), complete heavy-duty vehicles under 14,000 lbs gross vehicle weight are tested on chassis-based rather than engine-based procedures and must meet these complete heavy-duty vehicle standards. o Although expressed as NMHC, compliance can optionally be shown using measurement of NMOG or THC. p At least 50 percent of a manufacturer's sales must meet these standards in 2008, with 100 percent required in 2009. q Gross vehicle weight ranges are more accurately specified as follows: 8,500 ≤ GVW ≤ 10,000 and 10,000 < GVW < 14,000.

12–23
TRANSPORTATION ENERGY DATA BOOK: EDITION 36—2017
Table 12.20 Heavy-Duty Highway Compression-Ignition and Spark-Ignition Engines – Evaporative
Emission Standards
Engine
type Year Gross vehicle weight (lbs)
Conventional diurnal + hot soak (g/test)a
Three-diurnal test sequence
(g/test)b
Supplemental two-diurnal
test sequence (g/test)c
Running loss
(g/mi)c Spitback (g/test)c Useful lifed
Federal
SI
1991-95 ≤ 14,000 3.0 - - - -
8 / 110,000 > 14,000e 4.0 - - - -
1996-2007 (Enhanced)f
≤ 14,000 - 3.0 3.5
0.05
1.0 10 / 120,000
> 14,000e - 4.0 4.5 -
2008+ (Enhanced)
8500-14,000 - 1.4 1.75 1.0 11 / 110,000
> 14,000e - 1.9 2.3 -
CI
1996-97 ≤ 14,000 - 3.0 - - -
MHDDE: 8 / 185,000 HHDDE: 8 / 290,000 MHDDE: 8 / 185,000 HHDDE: 8 / 290,000
> 14,000e - 4.0 - - -
1998+ (Enhanced)g
≤ 14,000 - 3.0 3.5 0.05
1.0
> 14,000e - 4.0 4.5 -
Note: Definitions of acronyms are on page 12-14. Sources: 40 CFR 86.099-11 Emission standards for 1999 and later model year diesel heavy-duty engines and vehicles. 40 CFR 86.004-11 Emission standards for 2004 and later model year diesel heavy-duty engines and vehicles. CFR 86.007-11 Emission standards and supplemental requirements for 2007 and later model year diesel heavy-duty
engines and vehicles. (Additional resources: www.epa.gov/emission-standards-reference-guide/light-duty-vehicles-and-trucks-emission-standards)
a Applies to gasoline and methanol engines. Standard is hydrocarbon (HC) for gasoline engines, total hydrocarbon equivalent (THCE) for methanol engines. b For spark-ignition (SI) engines, standard applies to gasoline, methanol, natural gas, and liquefied petroleum gas engines. For compression-ignition (CI) engines, standard applies to methanol, natural gas, and liquefied petroleum gas engines. Standard is THCE for methanol engines, HC for others. c For SI engines, standard applies to gasoline and methanol engines. For CI engines, standard applies to methanol engines. Standard is THCE for methanol engines, HC for others. d Useful life is expressed in years or miles, whichever comes first. e Vehicles over 26,000 pounds gross vehicle weight may demonstrate compliance with an engineering design evaluation in lieu of testing. f A new enhanced evaporative test procedure applies, which is considerably more stringent than the previous test procedure despite the fact that the standard values do not change from prior years. Gasoline and methanol engines are phased in at the following rates of a manufacturer's sales for the specified model year: 1996: 20 percent; 1997: 40 percent; 1998: 90 percent; 1999: 100 percent. g A new enhanced evaporative test procedure applies, which is considerably more stringent than the previous test procedure despite the fact that the standard values do not change from prior years. Methanol-fueled vehicles are phased in at a rate of 90 percent of a manufacturer's production in 1998 and 100 percent in 1999.

12–24
TRANSPORTATION ENERGY DATA BOOK: EDITION 36—2017
The LEV III exhaust standards apply to new cars, light trucks, and medium vehicles, including fuel-flexible, bi-fuel, and dual-fuel vehicles from model year 2015-on.
Table 12.21
California New Car, Light Truck and Medium Truck Emission Certification Standards, Model Year 2015-On
Vehicle type
Vehicle emission category
Non-methane organic gases
+ nitrogen oxides (g/mi)
Carbon monoxide
(g/mi) Formaldehyde
(mg/mi) Particulates
(g/mi) All passenger cars; LDTs 8,500 lbs. GVW or less All MDPVs Vehicles in this category are tested at their loaded vehicle weight
LEV160 0.16 4.2 4 0.01
ULEV125 0.125 2.1 4 0.01
ULEV70 0.07 1.7 4 0.01
ULEV50 0.05 1.7 4 0.01
SULEV30 0.03 1.0 4 0.01
SULEV20 0.02 1.0 4 0.01
MDVs 8,501-10,000 lbs. GVW Vehicles in this category are tested at their adjusted loaded vehicle weight
LEV395 0.395 6.4 6 0.12
ULEV340 0.34 6.4 6 0.06
ULEV250 0.25 6.4 6 0.06
ULEV200 0.2 4.2 6 0.06
SULEV170 0.17 4.2 6 0.06
SULEV150 0.15 3.2 6 0.06
MDVs 10,000-14,000 lbs. GVW Vehicles in this category are tested at their adjusted loaded vehicle weight
LEV630 0.63 7.3 6 0.12
ULEV570 0.57 7.3 6 0.06
ULEV400 0.4 7.3 6 0.06
ULEV270 0.27 4.2 6 0.06
SULEV230 0.23 4.2 6 0.06
SULEV200 0.2 3.7 6 0.06
Note: Definitions of acronyms are on page 12-14. Source: California LEV III Regulations with amendments effective January 1, 2016,
www.arb.ca.gov/msprog/levprog/cleandoc/cleancomplete%201ev-ghg%20regs%201-16.pdf. (Additional resources: www.arb.ca.gov)

12–25
TRANSPORTATION ENERGY DATA BOOK: EDITION 36—2017
These exhaust emission standards apply to commercial aircraft engines.
Table 12.22
Aircraft – Exhaust Emission Standards
Year Pressure ratio (PR) Applicabilitya HC (g/kN) NOx CO
(g/kN) Smoke
Federalb
1974+ - T8 - - - 30 1976+ - TF with rOc ≥ 129 kN - - - 83.6(rO)-0.274 1978+ - T3d - - - 25
1983+ - TF with rO < 26.7 kN - - - 83.6(rO)-0.274 NTE max of SN=50
1984+
- T3, T8, TF with rO ≥ 26.7 kN 19.6 - - 83.6(rO)-0.274 NTE
max of SN=50
- TSS 140(.92)rPR - - 83.6(rO)-0.274 NTE max of SN=50
- TSS with rO ≥ 26.7 kN 140(.92)rPR - - 83.6(rO)-0.274 NTE max of SN=50
- TP with rO ≥ 1,000 kW - - - 187(rO)-0.168
1997+
- T3, T8, TF with rO > 26.7 kN 19.6 40+2(rPR) 118 83.6(rO)-0.274 NTE
max of SN=50
- T3, T8, TF newly
certified with rO > 26.7 kN
19.6 32+1.6(rPR) 118 83.6(rO)-0.274 NTE max of SN=50
2000+ - T3, T8, TF newly
manufactured with rO > 26.7 kN
19.6 32+1.6(rPR) 118 83.6(rO)-0.274 NTE max of SN=50
2005+
PR ≤ 30
T3, T8, TF newly certified with rO > 89 kN - 19+1.6(rPR) - -
T3, T8, TF newly certified with 26.7 kN <
rO ≤ 89 kN - 37.572+1.6(rPR)-
0.2087(rO) - -
30 < PR < 62.5
T3, T8, TF newly certified with rO>89 kN - 7+2.0(rPR) - -
T3, T8, TF newly certified with 26.7kN < r0
≤ 89kN -
42.71+1.4286(rPR)-0.4013(rO)+0.00642(rP
R)(rO) - -
PR ≤ 62.5 T3, T8, TF - 32+1.6(rPR) - -
Note: The test procedures are the International Civil Aviation Organization (ICAO) Smoke Emission Test Procedure and the ICAO Gaseous Emissions Test Procedure. There is no useful life or warranty period for purposes of compliance with aircraft emissions standards. Definitions of acronyms are on page 12-14. Source: 40 CFR Part 87, Aircraft emission standards, test procedures, certification requirements (Additional resources:
www.epa.gov/emission-standards-reference-guide/nonroad-engines-and-vehicles-emission-standards) a T8=all aircraft gas turbine engines of the JT8D model family TF=all turbofan and turbojet aircraft engines except engines of Class T3, T8, and TSS T3=all aircraft gas turbine engines of the JT3D model family TSS=all aircraft gas turbine engines for aircraft operations at supersonic flight speeds TP=all aircraft turboprop engines b Federal standards apply to planes operating in the United States, regardless of where they were manufactured. c Rated output (rO) is the maximum power/thrust available for takeoff. d T3 engines are no longer manufactured but are in the existing fleet.

12–26
TRANSPORTATION ENERGY DATA BOOK: EDITION 36—2017
These standards apply to construction and agricultural equipment, such as excavators, paving equipment, tractors, combines, bulldozers, and skidders.
Table 12.23
Nonroad Compression-Ignition Engines – Exhaust Emission Standards
Rated power (kW) Tier
Model year
NMHC (g/kW
-hr)
NMHC + NOx (g/kW
-hr)
NOx (g/kW
-hr)
PM (g/kW
-hr)
CO (g/kW
-hr) Smokea
percentage Useful life
(hours/years)b
Federal
kW < 8 1 2000-2004 -- 10.5 -- 1.0 8.0
20 / 15 / 50
3,000 / 5 2 2005-2007 -- 7.5 -- 0.80 8.0 4 2008+ -- 7.5 -- 0.40c 8.0
8 ≤ kW < 19 1 2000-2004 -- 9.5 -- 0.80 6.6
3,000 / 5 2 2005-2007 -- 7.5 -- 0.80 6.6 4 2008+ -- 7.5 -- 0.40 6.6
19 ≤ kW < 37
1 1999-2003 -- 9.5 -- 0.80 5.5
5,000 / 7d 2 2004-2007 -- 7.5 -- 0.60 5.5
4 2008-2012 -- 7.5 -- 0.30 5.5
2013+ -- 4.7 -- 0.03 5.5
37 ≤ kW < 56
1 1998-2003 -- -- 9.2 -- --
8,000 / 10
2 2004-2007 -- 7.5 -- 0.40 5.0 3e 2008-2011 -- 4.7 -- 0.40 5.0
4 (Option 1)f 2008-2012 -- 4.7 -- 0.30 5.0 4 (Option 2)f 2012 -- 4.7 -- 0.03 5.0
4 2013+ -- 4.7 -- 0.03 5.0
56 ≤ kW < 75
1 1998-2003 -- -- 9.2 -- -- 2 2004-2007 -- 7.5 -- 0.40 5.0 3 2008-2011 -- 4.7 -- 0.40 5.0
4 2012-2103g -- 4.7 -- 0.02 5.0
2014+h 0.19 -- 0.4 0.02 5.0
75 ≤ kW < 130
1 1997-2002 -- -- 9.2 -- -- 2 2003-2006 -- 6.6 -- 0.3 5.0 3 2007-2011 -- 4.0 -- 0.3 5.0
4 2012-2013g -- 4.0 -- 0.02 5.0
2014+ 0.19 -- 0.4 0.02 5.0
130 ≤ kW < 225
1 1996-2002 1.3i -- 9.2 0.54 11.4 2 2003-2005 -- 6.6 -- 0.20 3.5 3 2006-2010 -- 4.0 -- 0.20 3.5
4 2011-2013g -- 4.0 -- 0.02 3.5
2014+h 0.19 -- 0.4 0.02 3.5
225 ≤ kW < 450
1 1996-2000 1.3i -- 9.2 0.54 11.4 2 2001-2005 -- 6.4 -- 0.20 3.5 3 2006-2010 -- 4.0 -- 0.20 3.5
4 2011-2013g -- 4.0 -- 0.02 3.5
2014+h 0.19 -- 0.4 0.02 3.5
450 ≤ kW < 560
1 1996-2001 1.3i -- 9.2 0.54 11.4 2 2002-2005 -- 6.4 -- 0.20 3.5 3 2006-2010 -- 4.0 -- 0.20 3.5
4 2011-2013g -- 4.0 -- 0.02 3.5
2014+h 0.19 -- 0.4 0.02 3.5
560 ≤ kW < 900
1 2000-2005 1.3i -- 9.2 0.54 11.4 2 2006-2010 -- 6.4 -- 0.20 3.5
4 2011-2014 0.4 -- 3.5 0.10 3.5
2015+h 0.19 -- 3.5j 0.04k 3.5

12–27
TRANSPORTATION ENERGY DATA BOOK: EDITION 36—2017
Table 12.23 (continued) Nonroad Compression-Ignition Engines – Exhaust Emission Standards
Rated power (kW)
Tier Model year
NMHC (g/kW
-hr)
NMHC + NOx (g/kW
-hr)
NOx (g/kW
-hr)
PM (g/kW
-hr)
CO (g/kW
-hr)
Smokea
percentage Useful life
(hours/years)b
Federal kW > 900
1 2000-2005 1.3i -- 9.2 0.54 11.4
20 / 15 / 50 8,000 / 10 2 2006-2010 -- 6.4 -- 0.20 3.5
4 2011-2014 0.4 -- 3.5j 0.10 3.5
2015+h 0.19 -- 3.5j 0.04k 3.5
Note: Definitions of acronyms are on page 12-14. Sources: 40 CFR 98.112 = Exhaust emission standards 40 CFR 1039.101 = Exhaust emission standards for after 2014 model year 40 CFR 1039.102 = Exhaust emission standards for model year 2014 and earlier 40 CFR 1039 Subpart F = Exhaust emissions transient and steady state test procedures 40 CFR 86 Subpart I = Smoke emission test procedures 40 CFR 1065 = Test equipment and emissions measurement procedures (Additional resources: www.epa.gov/emission-standards-reference-guide/nonroad-engines-and-vehicles-emission-standards) a Smoke emissions may not exceed 20 percent during the acceleration mode, 15 percent during the lugging mode, and 50 percent during the peaks in either mode. Smoke emission standards do not apply to single-cylinder engines, constant-speed engines, or engines certified to a PM emission standard of 0.07 grams per kilowatt-hour (g/kW-hr) or lower. Smoke emissions are measured using procedures in 40 CFR Part 86 Subpart I. b Useful life and warranty period are expressed hours and years, whichever comes first. c Hand-startable air-cooled direct injection engines may optionally meet a PM standard of 0.60 g/kW-hr. These engines may optionally meet Tier 2 standards through the 2009 model years. In 2010 these engines are required to meet a PM standard of 0.60 g/kW-hr. d Useful life for constant speed engines with rated speed 3,000 revolutions per minute (rpm) or higher is 5 years or 3,000 hours, whichever comes first. e These Tier 3 standards apply only to manufacturers selecting Tier 4 Option 2. Manufacturers selecting Tier 4 Option 1 will be meeting those standards in lieu of Tier 3 standards. f A manufacturer may certify all their engines to either Option 1 or Option 2 sets of standards starting in the indicated model year. Manufacturers selecting Option 2 must meet Tier 3 standards in the 2008-2011 model years. g These standards are phase-out standards. Not more than 50 percent of a manufacturer's engine production is allowed to meet these standards in each model year of the phase out period. Engines not meeting these standards must meet the final Tier 4 standards. h These standards are phased in during the indicated years. At least 50 percent of a manufacturer's engine production must meet these standards during each year of the phase in. Engines not meeting these standards must meet the applicable phase-out standards. i For Tier 1 engines the standard is for total hydrocarbons. j The NOx standard for generator sets is 0.67 g/kW-hr. k The PM standard for generator sets is 0.03 g/kW-hr.
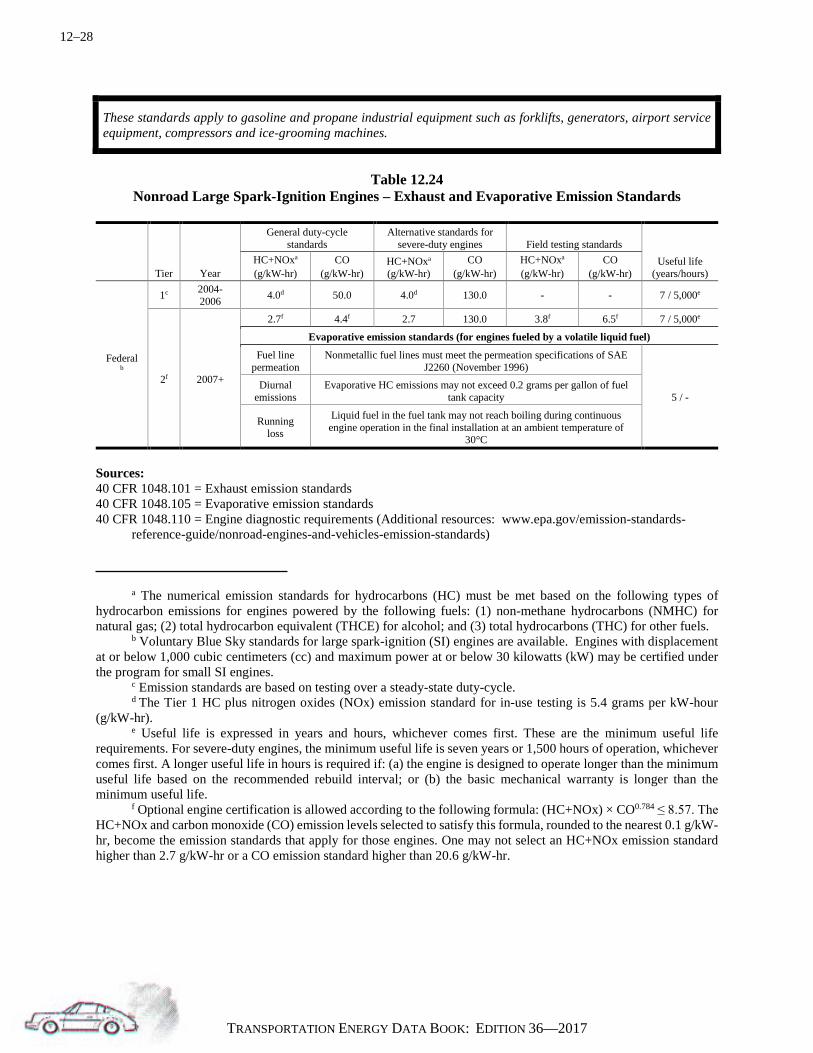
12–28
TRANSPORTATION ENERGY DATA BOOK: EDITION 36—2017
These standards apply to gasoline and propane industrial equipment such as forklifts, generators, airport service equipment, compressors and ice-grooming machines.
Table 12.24
Nonroad Large Spark-Ignition Engines – Exhaust and Evaporative Emission Standards
Tier Year
General duty-cycle standards
Alternative standards for severe-duty engines Field testing standards
Useful life (years/hours)
HC+NOxa
(g/kW-hr) CO
(g/kW-hr) HC+NOxa (g/kW-hr)
CO (g/kW-hr)
HC+NOxa
(g/kW-hr) CO
(g/kW-hr)
Federal b
1c 2004-2006 4.0d 50.0 4.0d 130.0 - - 7 / 5,000e
2f 2007+
2.7f 4.4f 2.7 130.0 3.8f 6.5f 7 / 5,000e
Evaporative emission standards (for engines fueled by a volatile liquid fuel)
Fuel line permeation
Nonmetallic fuel lines must meet the permeation specifications of SAE J2260 (November 1996)
5 / - Diurnal
emissions Evaporative HC emissions may not exceed 0.2 grams per gallon of fuel
tank capacity
Running loss
Liquid fuel in the fuel tank may not reach boiling during continuous engine operation in the final installation at an ambient temperature of
30°C
Sources: 40 CFR 1048.101 = Exhaust emission standards 40 CFR 1048.105 = Evaporative emission standards 40 CFR 1048.110 = Engine diagnostic requirements (Additional resources: www.epa.gov/emission-standards- reference-guide/nonroad-engines-and-vehicles-emission-standards) a The numerical emission standards for hydrocarbons (HC) must be met based on the following types of hydrocarbon emissions for engines powered by the following fuels: (1) non-methane hydrocarbons (NMHC) for natural gas; (2) total hydrocarbon equivalent (THCE) for alcohol; and (3) total hydrocarbons (THC) for other fuels. b Voluntary Blue Sky standards for large spark-ignition (SI) engines are available. Engines with displacement at or below 1,000 cubic centimeters (cc) and maximum power at or below 30 kilowatts (kW) may be certified under the program for small SI engines. c Emission standards are based on testing over a steady-state duty-cycle. d The Tier 1 HC plus nitrogen oxides (NOx) emission standard for in-use testing is 5.4 grams per kW-hour (g/kW-hr). e Useful life is expressed in years and hours, whichever comes first. These are the minimum useful life requirements. For severe-duty engines, the minimum useful life is seven years or 1,500 hours of operation, whichever comes first. A longer useful life in hours is required if: (a) the engine is designed to operate longer than the minimum useful life based on the recommended rebuild interval; or (b) the basic mechanical warranty is longer than the minimum useful life. f Optional engine certification is allowed according to the following formula: (HC+NOx) × CO0.784 ≤ 8.57. The HC+NOx and carbon monoxide (CO) emission levels selected to satisfy this formula, rounded to the nearest 0.1 g/kW-hr, become the emission standards that apply for those engines. One may not select an HC+NOx emission standard higher than 2.7 g/kW-hr or a CO emission standard higher than 20.6 g/kW-hr.

12–29
TRANSPORTATION ENERGY DATA BOOK: EDITION 36—2017
Table 12.25 Locomotives – Exhaust Emission Standards
Duty-cycleb Tier Yearc
HCi (g/hp-hr)
NOx (g/bhp-hr)
PM (g/bhp-hr)
CO (g/bhp-hr)
Smoke (percentage)m
Minimum useful life (hours / years / miles)n
Federala
Line-haul
Tier 0 1973-1992d,e 1.0 9.5 [ABT] 0.22 [ABT] 5.0 30 / 40 / 50 (7.5 x hp) / 10 /
750,000o
Tier 1 1993-2004d,e 0.55 7.4 [ABT] 0.22 [ABT] 2.2 25 / 40 / 50
(7.5 x hp) / 10 / 750,000o
(7.5 x hp) / 10 / -
Tier 2 2005-2011d 0.30 5.5 [ABT] 0.10k [ABT] 1.5 20 / 40 / 50 (7.5 x hp) / 10 / -
Tier 3 2012-2014f 0.30 5.5 [ABT] 0.10 [ABT] 1.5 20 / 40 / 50 (7.5 x hp) / 10 / -
Tier 4 2015+g 0.14 1.3 [ABT] 0.03 [ABT] 1.5 - (7.5 x hp) / 10 / -
Switch
Tier 0 1973-2001 2.10 11.8 [ABT] 0.26 [ABT] 8.0 30 / 40 / 50 (7.5 x hp) / 10 /
750,000o
Tier 1 2002-2004h 1.20 11.0 [ABT] 0.26 [ABT] 2.5 25 / 40 / 50 (7.5 x hp) / 10 / -
Tier 2 2005-2010h 0.60 8.1 [ABT] 0.13l [ABT] 2.4 20 / 40 / 50 (7.5 x hp) / 10 / -
Tier 3 2011-2014 0.60 5.0 [ABT] 0.10 [ABT] 2.4 20 / 40 / 50 (7.5 x hp) / 10 / -
Tier 4 2015+ 0.14j 1.3j[ABT] 0.03 [ABT] 2.4 - (7.5 x hp) / 10 / -
Source: 40 CFR 1033.101 = Emission Standards and Useful Life. (Additional resources: www.epa.gov/emission-standards-
reference-guide/nonroad-engines-and-vehicles-emission-standards) a These standards apply to locomotives that are propelled by engines with total rated horsepower (hp) of 750 kilowatts (kW) (1006 hp) or more, unless the owner chooses to have the equipment certified to meet the requirements of locomotives. This does not include vehicles propelled by engines with total rated horsepower of less than 750 kW (1006 hp); see the requirements in 40 Code of Federal Regulations (CFR) Parts 86, 89 and 1039. The test procedures specify chassis-based testing of locomotives. These test procedures include certification testing, production line testing, and in-use testing using the Federal Test Procedure (FTP) when the locomotive has reached between 50-70 percent of its useful life. b Line-haul locomotives are powered by an engine with a maximum rated power (or a combination of engines having a total rated power) greater than 2300 hp. Switch locomotives are powered by an engine with a maximum rated power (or a combination of engines having a total rated power) of 2300 hp or less. c The Tier 0 standards apply to locomotives manufactured after 1972 when they are manufactured or remanufactured. Note that interim standards may apply for Tier 0 or Tier 1 locomotives remanufactured in 2008 or 2009, or for Tier 2 locomotives manufactured or remanufactured in 2008-2012. d Line-haul locomotives subject to the Tier 0 through Tier 2 emission standards must also meet switch standards of the same tier. e The Tier 0 standards apply for 1993-2001 locomotives not originally manufactured with a separate loop intake air cooling system. f Tier 3 line-haul locomotives must also meet Tier 2 switch standards. g Manufacturers using credits may elect to meet a combined nitrogen oxides (NOx) plus hydrocarbon (HC) standard of 1.4 grams per brakehorsepower-hour (g/bhp-hr) instead of the otherwise applicable Tier 4 NOx and HC standards. h Tier 1 and Tier 2 switch locomotives must also meet line-haul standards of the same tier. i The numerical emission standards for HC must be met based on the following types of hydrocarbon emissions for locomotives powered by the following fuels: (1) alcohol: total hydrocarbon equivalent (THCE) emissions for Tier 3 and earlier locomotives, and non-methane hydrocarbon equivalent (NMHCE) for Tier 4; (2) natural gas and liquefied petroleum gas: non-methane hydrocarbon (NMHC) emissions; and (3) diesel: total hydrocarbon (THC) emissions for Tier 3 and earlier locomotives, and NMHC for Tier 4.
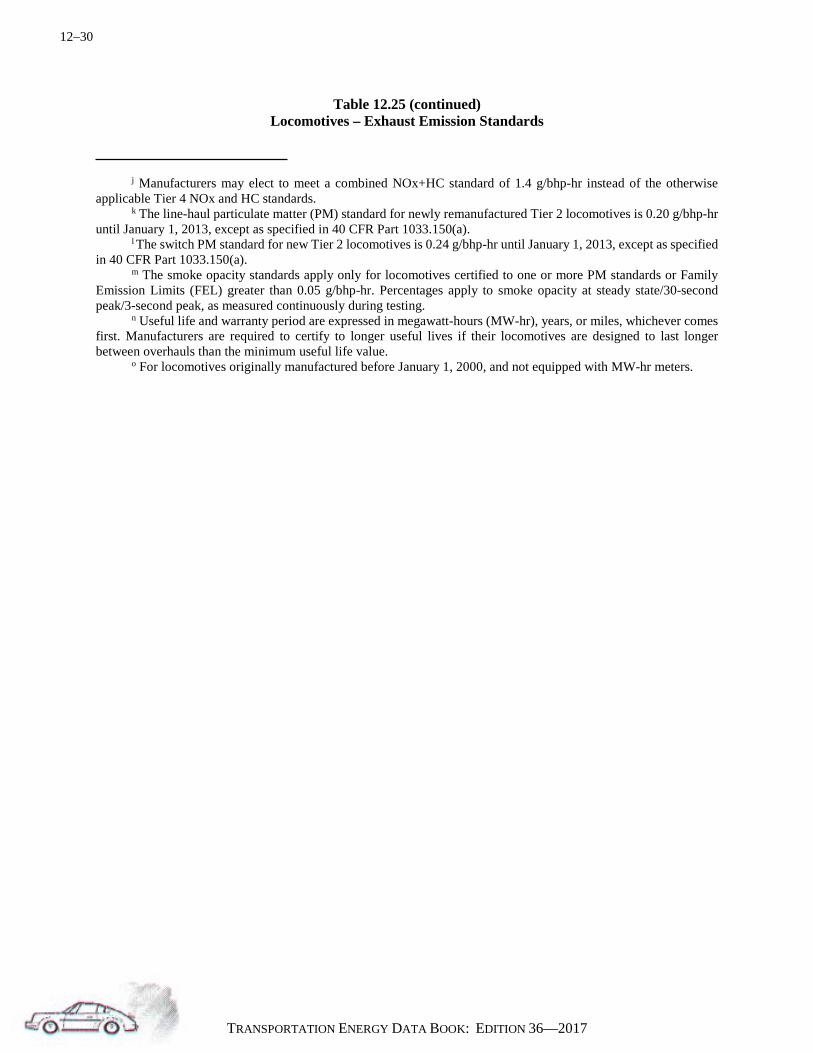
12–30
TRANSPORTATION ENERGY DATA BOOK: EDITION 36—2017
Table 12.25 (continued) Locomotives – Exhaust Emission Standards
j Manufacturers may elect to meet a combined NOx+HC standard of 1.4 g/bhp-hr instead of the otherwise applicable Tier 4 NOx and HC standards. k The line-haul particulate matter (PM) standard for newly remanufactured Tier 2 locomotives is 0.20 g/bhp-hr until January 1, 2013, except as specified in 40 CFR Part 1033.150(a). l The switch PM standard for new Tier 2 locomotives is 0.24 g/bhp-hr until January 1, 2013, except as specified in 40 CFR Part 1033.150(a). m The smoke opacity standards apply only for locomotives certified to one or more PM standards or Family Emission Limits (FEL) greater than 0.05 g/bhp-hr. Percentages apply to smoke opacity at steady state/30-second peak/3-second peak, as measured continuously during testing. n Useful life and warranty period are expressed in megawatt-hours (MW-hr), years, or miles, whichever comes first. Manufacturers are required to certify to longer useful lives if their locomotives are designed to last longer between overhauls than the minimum useful life value. o For locomotives originally manufactured before January 1, 2000, and not equipped with MW-hr meters.
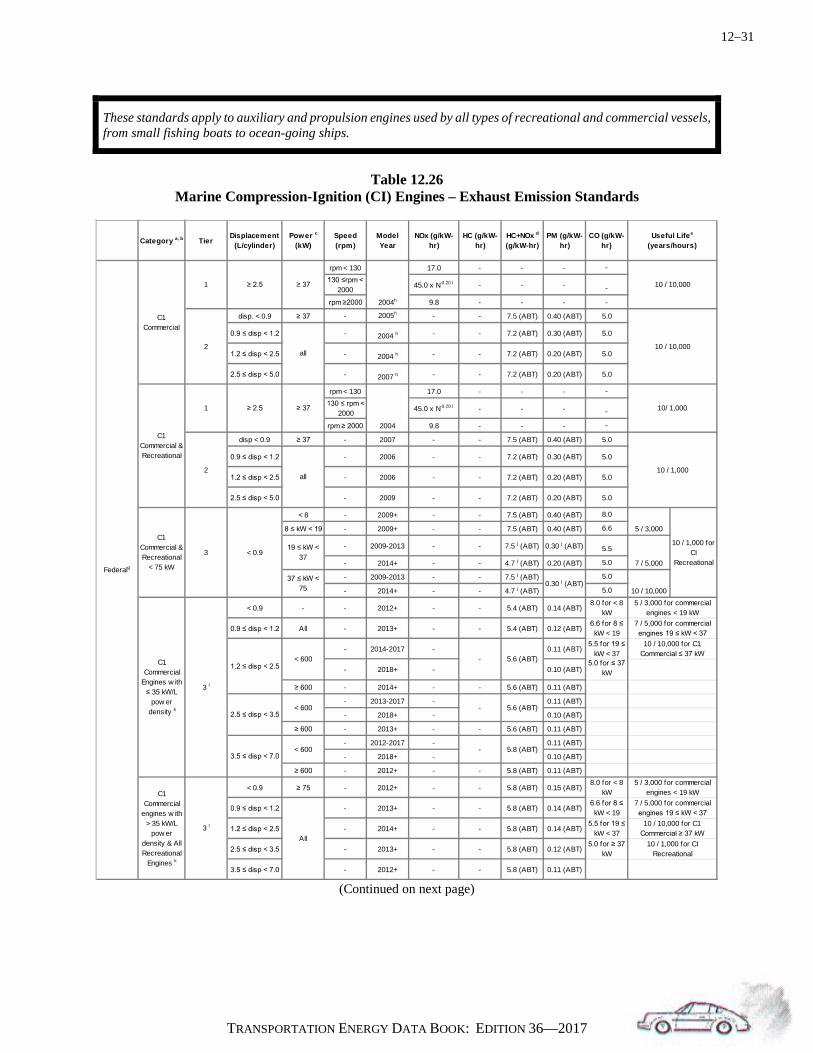
12–31
TRANSPORTATION ENERGY DATA BOOK: EDITION 36—2017
These standards apply to auxiliary and propulsion engines used by all types of recreational and commercial vessels, from small fishing boats to ocean-going ships.
Table 12.26
Marine Compression-Ignition (CI) Engines – Exhaust Emission Standards
(Continued on next page)
Category a, b TierDisplacement
(L/cylinder)Power c
(kW)Speed (rpm)
Model Year
NOx (g/kW-hr)
HC (g/kW-hr)
HC+NOx d
(g/kW-hr)PM (g/kW-
hr)CO (g/kW-
hr)
rpm < 130 17.0 - - - -
130 ≤rpm < 2000 45.0 x N-0.20 i - - - -
rpm ≥2000 9.8 - - - -
disp. < 0.9 ≥ 37 - 2005h - - 7.5 (ABT) 0.40 (ABT) 5.0
0.9 ≤ disp < 1.2 - 2004 h - - 7.2 (ABT) 0.30 (ABT) 5.0
1.2 ≤ disp < 2.5 - 2004 h - - 7.2 (ABT) 0.20 (ABT) 5.0
2.5 ≤ disp < 5.0 - 2007 h - - 7.2 (ABT) 0.20 (ABT) 5.0
rpm < 130 17.0 - - - -
130 ≤ rpm < 2000 45.0 x N-0.20 i - - - -
rpm ≥ 2000 9.8 - - - -
disp < 0.9 ≥ 37 - 2007 - - 7.5 (ABT) 0.40 (ABT) 5.0
0.9 ≤ disp < 1.2 - 2006 - - 7.2 (ABT) 0.30 (ABT) 5.0
1.2 ≤ disp < 2.5 - 2006 - - 7.2 (ABT) 0.20 (ABT) 5.0
2.5 ≤ disp < 5.0 - 2009 - - 7.2 (ABT) 0.20 (ABT) 5.0
< 8 - 2009+ - - 7.5 (ABT) 0.40 (ABT) 8.0
8 ≤ kW < 19 - 2009+ - - 7.5 (ABT) 0.40 (ABT) 6.6
- 2009-2013 - - 7.5 j (ABT) 0.30 j (ABT) 5.5
- 2014+ - - 4.7 j (ABT) 0.20 (ABT) 5.0
- 2009-2013 - - 7.5 j (ABT) 5.0
- 2014+ - - 4.7 j (ABT) 5.0
< 0.9 - - 2012+ - - 5.4 (ABT) 0.14 (ABT)8.0 for < 8
kW
0.9 ≤ disp < 1.2 All - 2013+ - - 5.4 (ABT) 0.12 (ABT)6.6 for 8 ≤ kW < 19
- 2014-2017 - 0.11 (ABT)5.5 for 19 ≤
kW < 37
- 2018+ - 0.10 (ABT)5.0 for ≤ 37
kW
≥ 600 - 2014+ - - 5.6 (ABT) 0.11 (ABT)
- 2013-2017 - 0.11 (ABT)
- 2018+ - 0.10 (ABT)
≥ 600 - 2013+ - - 5.6 (ABT) 0.11 (ABT)
- 2012-2017 - 0.11 (ABT)
- 2018+ - 0.10 (ABT)
≥ 600 - 2012+ - - 5.8 (ABT) 0.11 (ABT)
< 0.9 ≥ 75 - 2012+ - - 5.8 (ABT) 0.15 (ABT)8.0 for < 8
kW
0.9 ≤ disp < 1.2 - 2013+ - - 5.8 (ABT) 0.14 (ABT)6.6 for 8 ≤ kW < 19
1.2 ≤ disp < 2.5 - 2014+ - - 5.8 (ABT) 0.14 (ABT)5.5 for 19 ≤
kW < 37
2.5 ≤ disp < 3.5 - 2013+ - - 5.8 (ABT) 0.12 (ABT)5.0 for ≥ 37
kW
3.5 ≤ disp < 7.0 - 2012+ - - 5.8 (ABT) 0.11 (ABT)
Federalg
C1 Commercial
engines w ith > 35 kW/L
pow er density & All Recreational
Engines k
3 l
5 / 3,000 for commercial engines < 19 kW
All
7 / 5,000 for commercial engines 19 ≤ kW < 37
10 / 10,000 for C1 Commercial ≥ 37 kW
10 / 1,000 for CI Recreational
3.5 ≤ disp < 7.0< 600 - 5.8 (ABT)
2.5 ≤ disp < 3.5< 600 - 5.6 (ABT)
C1 Commercial
Engines w ith ≤ 35 kW/L
pow er density k
3 l
5 / 3,000 for commercial engines < 19 kW
7 / 5,000 for commercial engines 19 ≤ kW < 37
1.2 ≤ disp < 2.5< 600 - 5.6 (ABT)
10 / 10,000 for C1 Commercial ≤ 37 kW
C1 Commercial & Recreational
< 75 kW
3 < 0.9
5 / 3,000
10 / 1,000 for CI
Recreational
19 ≤ kW < 37
7 / 5,000
37 ≤ kW < 75 0.30 j (ABT)
10 / 10,000
C1 Commercial & Recreational
1 ≥ 2.5 ≥ 37
2004
10/ 1,000
2 10 / 1,000all
Useful Lifee
(years/hours)
C1 Commercial
1 ≥ 2.5 ≥ 37
2004h
10 / 10,000
2 10 / 10,000all

12–32
TRANSPORTATION ENERGY DATA BOOK: EDITION 36—2017
Table 12.26 (continued) Marine Compression-Ignition (CI) Engines – Exhaust Emission Standards
Sources: 40 CFR 89.104 = Tiers 1 and 2 useful life & warranty period for marine CI engines less than 37 kW 40 CFR 89.112 = Tiers 1 and 2 emission standards for marine CI engines less than 37 kW 40 CFR 89 Subpart E = Tiers 1 and 2 test procedures for marine CI engines less than 37 kW 40 CFR 94.8 = Tiers 1 and 2 emission standards for C1 (both commercial & recreational), C2 and C3 engines 40 CFR 94.9 = Tiers 1 and 2 useful life for C1 (both commercial & recreational), C2 and C3 engines 40 CFR 94 Subpart B = Tiers 1 and 2 test procedures for C1 (both commercial & recreational), C2 and C3 engines 40 CFR 1042.101 = Tiers 3 and 4 exhaust emission standards and useful life
Category a, b TierDisplacement
(L/cylinder)Power c
(kW)Speed (rpm)
Model Year
NOx (g/kW-hr)
HC (g/kW-hr)
HC+NOx d
(g/kW-hr)PM (g/kW-
hr)CO (g/kW-
hr)
All600 ≤ kW <
1,400 - 2017+ 1.8 (ABT) - 0.19 HCn 0.04 (ABT)
All1,400 ≤ kW
< 2,000 - 2016+ 1.8 (ABT) - 0.19 HCn 0.04 (ABT)
All2,000 ≤ kW
< 3,700 - 2014+ 1.8 (ABT) - 0.19 HCn 0.04 (ABT)
- 2014-2015 1.8 (ABT) - 0.19 HCn 0.12 (ABT)
- 2016+ 1.8 (ABT) - 0.19 HCn 0.06 (ABT)
rpm < 130 17.0 - - - -130 ≤ rpm <
2,000 45.0 x N-0.20 i - - - -
rpm ≥ 2,000 9.8 - - - -5.0 ≤ disp <
15.0 all - - - 7.8 (ABT) 0.27 (ABT) 5.0
15.0 ≤ disp < 20.0 < 3,300 - - - 8.7 (ABT) 0.50 (ABT) 5.0
15.0 ≤ disp < 20.0 ≥ 3,300 - - - 9.8 (ABT) 0.50 (ABT) 5.0
20.0 ≤ disp < 25.0 all - - - 9.8 (ABT) 0.50 (ABT) 5.0
25.0 ≤ disp < 30.0 all - - - 11.0 (ABT) 0.50 (ABT) 5.0
< 2,000 - - - 6.2 (ABT) 0.14 (ABT) 5.02,000 ≤ kW
< 3,700 - - - 7.8 (ABT) 0.14 (ABT) 5.0
15.0 ≤ disp < 20.0 < 2,000 - - - 7.0 (ABT) 0.34 (ABT) 5.0
20.0 ≤ disp < 25.0 < 2,000 - - - 9.8 (ABT) 0.27 (ABT) 5.0
25.0 ≤ disp < 30.0 < 2,000 - - - 11.0 (ABT) 0.27 (ABT) 5.0
All600 ≤ kW <
1,400 - 2017+ 1.8 (ABT) - 0.19 HCn 0.04 (ABT)
All1400 ≤ kW
< 2,000 - 2016+ 1.8 (ABT) - 0.19 HCn 0.04 (ABT)
All2,000 ≤ kW
< 3,700q - 2014+ 1.8 (ABT) - 0.19 HCn 0.04 (ABT)
< 15.0 - 2014-2015 1.8 (ABT) - 0.19 HCn 0.12 (ABT)15.0 ≤ disp <
30.0 - 2014-2015 1.8 (ABT) - 0.19 HCn 0.25 (ABT)
All - 2016+ 1.8 (ABT) - 0.19 HCn 0.06 (ABT)
rpm < 130 17.0 - - - -
130 ≤ rpm < 2,000 45.0 × N-0.20 i - - - -
rpm ≥ 2,000 9.8 - - - -
rpm < 130 14.4 - -130 ≤ rpm <
2,000 44.0 × N-0.23 i - -
rpm ≥ 2,000 7.7 - -
rpm < 130 3.4 - -130 ≤ rpm <
2,000 9.0 × N-0.20 i - -
rpm ≥ 2,000 2.0 - -
Federalg
Useful Lifee
(years/hours)
2.0 5.0 3 / 10,000
3 ≥ 30.0 All 2016 2.0 5.0 3 / 10,000
C3
1 ≥30.0 All 2004 3 / 10,000
2 ≥30.0 All 2011
7.0 ≤ disp < 15.0 2013+
10 / 20,000
2014+
4m,p
5.0
10 / 20,000
≥ 3,700
C2
1 ≥ 2.5 ≥ 37 2004 10 / 20,000
2 2007 10 / 20,000
3o,p
C1 Commercial >
600 kW4m 5.0 10 / 10,000
< 7.0 ≥ 3,700

12–33
TRANSPORTATION ENERGY DATA BOOK: EDITION 36—2017
Table 12.26 (continued) Marine Compression-Ignition (CI) Engines – Exhaust Emission Standards
Sources (continued): 40 CFR 1042.107 = Tiers 3 and 4 evaporative emission standards engines using a volatile liquid fuel (e.g., methanol) 40 CFR 1042.120 = Tiers 3 and 4 warranty period 40 CFR 1042 Subpart F = Tiers 3 and 4 test procedures (Additional resources: www.epa.gov/emission-standards-
reference-guide/nonroad-engines-and-vehicles-emission-standards) a For Tiers 1 and 2, Category 1 marine engines are greater than or equal to 37 kilowatts (kW) and have a displacement less than 5.0 liters per cylinder (L/cylinder); Category 2 marine engines have a displacement greater than or equal to 5.0 L/cylinder and less than 30 L/cylinder; and Category 3 marine engines have a displacement greater than or equal to 30.0 L/cylinder. For Tiers 3 and 4, Category 1 represents engines up to 7 L/cylinder displacement; and Category 2 includes engines from 7 to 30 L/cylinder. The definition of Category 3 marine engines remains the same. b Tiers 1 and 2 for marine engines less than 37 kW are subject to the same emission standards as for land-based engines. See Table 1 in 40 Code of Federal Regulations (CFR) Part 89.112 and 40 CFR Part 89.104. c For Tiers 1 and 2, this refers to the rated power; for Tiers 3 and 4, this refers to the maximum engine power. d Total hydrocarbon (THC) plus nitrogen oxides (NOx) for Tier 2 standards. e Useful life is expressed in hours or years, whichever comes first. For Tiers 3 and 4, a longer useful life in hours for an engine family must be specified if either:1) the engine is designed, advertised, or marketed to operate longer than the minimum useful life; or 2) the basic mechanical warranty is longer than the minimum useful life. f Warranty period is expressed in years and hours, whichever comes first. g For Tiers 3 and 4, there are no evaporative emission standards for diesel-fueled engines, or engines using other nonvolatile or nonliquid fuels (e.g., natural gas). If an engine uses a volatile liquid fuel, such as methanol, the engine's fuel system and the vessel in which the engine is installed must meet the evaporative emission requirements of 40 Code of Federal Regulations (CFR) Part 1045 that apply with respect to spark-ignition engines. Manufacturers subject to evaporative emission standards must meet the requirements of 40 CFR 1045.112 as described in 40 CFR 1060.1(a)(2). h Indicates the model years for which the specified standards start. i N is the maximum test speed of the engine in revolutions per minute (rpm). j Manufacturers of Tier 3 engines greater than or equal to 19 kW and less than 75 kW with displacement below 0.9 L/cylinder may alternatively certify some or all of their engine families to a particulate matter (PM) emission standard of 0.20 grams per kilowatt-hour (g/kW-hr) and a NOx+HC emission standard fo 5.8 g/kW-hr for 2014 and later model years. k The applicable Tier 2 NOx+HC standards continue to apply instead of the Tier 3 values for engines at or above 2000 kW. l These Tier 3 standards apply to Category 1 engines below 3700 kW except for recreational marine engines at or above 3700 kW (with any displacement), which must meet the Tier 3 standards specified for recreational marine engines with a displacement of 3.5 to 7.0 L/cylinder. m The following provisions are optional: 1) Manufacturers may use NOx credits to certify Tier 4 engines to a NOX+HC emission standard of 1.9 g/kW-hr instead of the NOX and HC standards. See 40 CFR 1042.101(a)(8)(i) for more details. 2) For engines below 1000 kW, manufacturers may delay complying with the Tier 4 standards until October 1, 2017. 3) For engines at or above 3700 kW, manufacturers may delay complying with the Tier 4 standards until December 31, 2016. n The Tier 4 standard is for HC (not HC+NOx) in g/kW-hr. o These Tier 3 standards apply to Category 2 engines below 3700 kW; no Tier 3 standards apply for Category 2 engines at or above 3700 kW, although there are Tier 4 standards that apply.
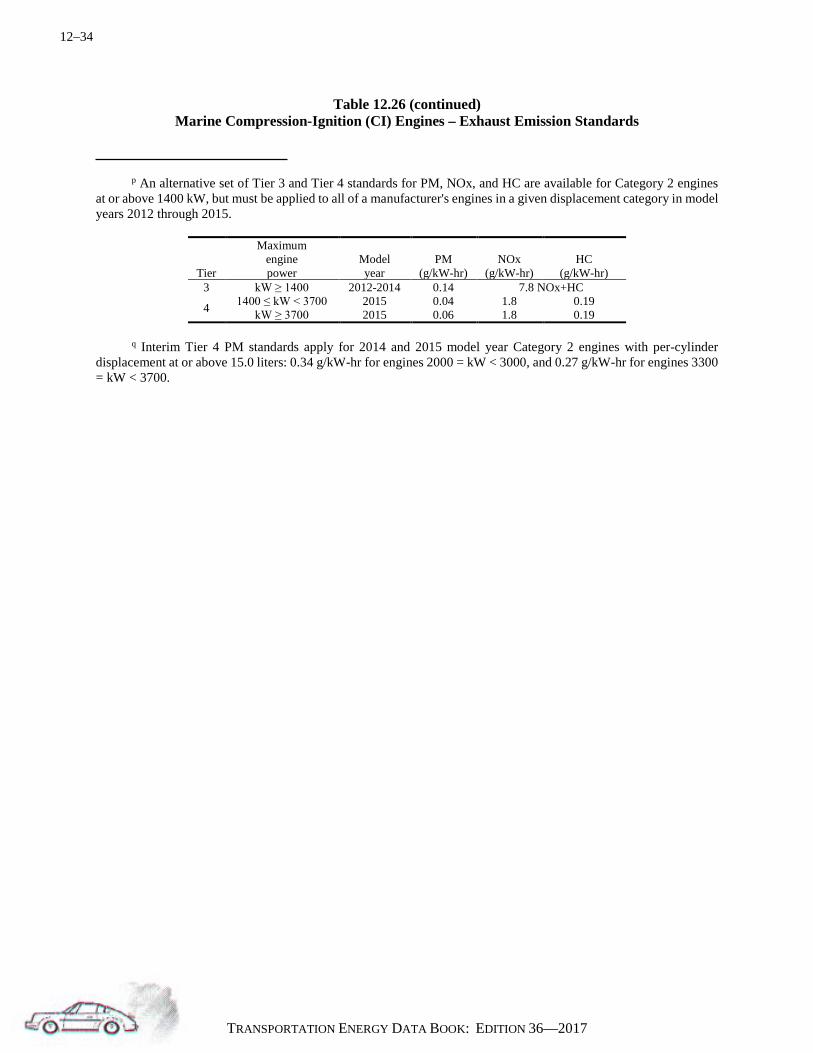
12–34
TRANSPORTATION ENERGY DATA BOOK: EDITION 36—2017
Table 12.26 (continued) Marine Compression-Ignition (CI) Engines – Exhaust Emission Standards
p An alternative set of Tier 3 and Tier 4 standards for PM, NOx, and HC are available for Category 2 engines at or above 1400 kW, but must be applied to all of a manufacturer's engines in a given displacement category in model years 2012 through 2015.
Tier
Maximum engine power
Model year
PM (g/kW-hr)
NOx (g/kW-hr)
HC (g/kW-hr)
3 kW ≥ 1400 2012-2014 0.14 7.8 NOx+HC
4 1400 ≤ kW < 3700 2015 0.04 1.8 0.19 kW ≥ 3700 2015 0.06 1.8 0.19
q Interim Tier 4 PM standards apply for 2014 and 2015 model year Category 2 engines with per-cylinder displacement at or above 15.0 liters: 0.34 g/kW-hr for engines 2000 = kW < 3000, and 0.27 g/kW-hr for engines 3300 = kW < 3700.

12–35
TRANSPORTATION ENERGY DATA BOOK: EDITION 36—2017
These standards apply to gasoline boats and personal watercraft, such as pleasure boats, jet-skis, outboard engines and sterndrive/inboard engines.
Table 12.27
Marine Spark-Ignition Engines and Vessels – Exhaust Emission Standards
Engine type Model year
HC + NOxa (g/KW-hr)
COc (g/KW-hr)
Useful life (hours/years)d P ≤ 4.3 kWb P > 4.3 kWb
P ≤ 4.3 kWb
P > 4.3 kWb
Federale
Personal watercraft & outboard marine engines
1998 278 ABT (0.917 x (151 + 557/P0.9 + 2.44) -- --
350 / 5
[ABT]
1999 253 ABT (0.833 x (151 + 557/P0.9 + 2.89) -- --
[ABT]
2000 228 ABT (0.750 x (151 + 557/P0.9) + 3.33 -- --
[ABT]
2001 204 ABT (0.667 x (151 + 557/P0.9) + 3.78 -- --
[ABT]
2002 179 ABT (0.583 x (151 + 557/P0.9) + 4.22 -- --
[ABT]
2003 155 ABT (0.500 x (151 + 557/P0.9) + 4.67 -- --
[ABT]
2004 130 ABT (0.417 x (151 + 557/P0.9) + 5.11 -- --
[ABT]
2005 105 ABT (0.333 x (151 + 557/P0.9) + 5.56 -- --
[ABT]
2006-2009
81 ABT (0.250 x (151 + 557/P0.9) + 6.00 -- --
[ABT]
2010 +g 30 ABT
2.1 + 0.09 x (151 +
557/P0.9) 500 - 5.0 x P 300
Personal Watercraft: 350
/ 5h Outboard: 350
/ 10h [ABT]
Sterndrive/ inboard engines
Conventional enginesg 2010 + 5.0 75
480 / 10i [ABT] [ABT]
High-performance
engines
P ≤ kWb P > 485 kWb
350
P ≤ 485 kW: 150 / 3
2010 20.0 25.0 P > 485 kW: 50 / 1
2011+ 16.0 22.0 Sources: 40 CFR 91.104 = Outboard and personal watercraft (PWC) exhaust emission standards (1998-2009) 40 CFR 91.105 = Outboard and PWC useful life (1998-2009) 40 CFR 1045.103 = Outboard and PWC exhaust emission standards (2010+) 40 CFR 1045.105 = Sterndrive/Inboard exhaust emission standards 40 CFR 1045.107 = Not-to-exceed exhaust emission standards (Additional resources: www.epa.gov/emission-standards-reference-guide/nonroad-engines-and-vehicles-emission-standards) a The numerical emission standards for hydrocarbons (HC) must be met based on the following types of HC emissions for engines powered by the following fuels: (1) total hydrocarbon equivalent for alcohol; (2) non-methane hydrocarbon for natural gas; and (3) total hydrocarbons for other fuels.

12–36
TRANSPORTATION ENERGY DATA BOOK: EDITION 36—2017
Table 12.27 (continued) Marine Spark-Ignition Engines and Vessels – Exhaust Emission Standards
b P stands for the maximum engine power in kilowatts. c Manufacturers may generate or use emission credits for averaging, but not for banking or trading. d Useful life and warranty period are expressed hours or years of operation (unless otherwise indicated), whichever comes first. e The test procedure for federal standards uses the International Organization for Standardization (ISO) 8178 E4 5-Mode Steady-State Test Cycle. f Also applies to model year (MY) 1997 engine families certified pursuant to 40 Code of Federal Regulations (CFR) 91.205. g Not-to-exceed emission standards specified in 40 CFR 1045.107 also apply. h A longer useful life in terms of hours must be specified for the engine family if the average service life is longer than the minimum value as described in 40 CFR 1045.103(e)(3). i The useful life may not be shorter than: (1) 150 hours of operation; (2) the recommended overhaul interval; or (3) the engine's mechanical warranty. A longer useful life must be specified in terms of hours if the average service life is longer than the minimum value as described in 40 CFR 1045.105(e)(3).
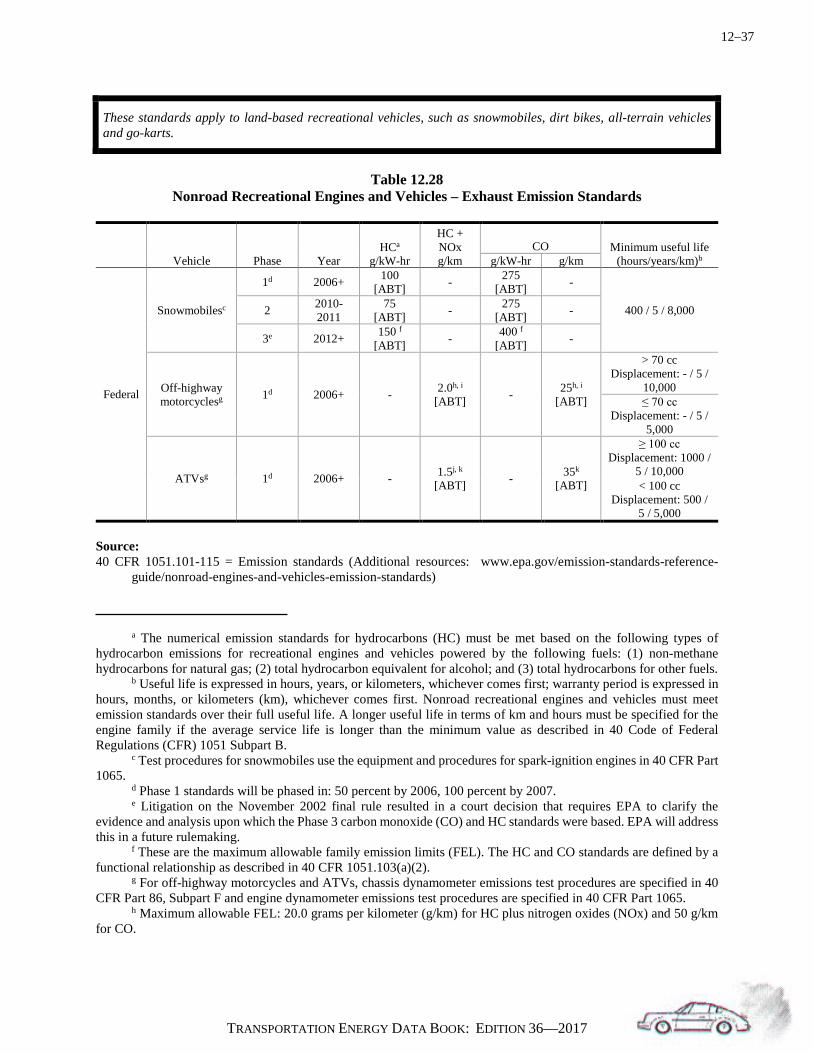
12–37
TRANSPORTATION ENERGY DATA BOOK: EDITION 36—2017
These standards apply to land-based recreational vehicles, such as snowmobiles, dirt bikes, all-terrain vehicles and go-karts.
Table 12.28
Nonroad Recreational Engines and Vehicles – Exhaust Emission Standards
Vehicle Phase Year HCa
g/kW-hr
HC + NOx g/km
CO Minimum useful life (hours/years/km)b g/kW-hr g/km
Federal
Snowmobilesc
1d 2006+ 100 [ABT] - 275
[ABT] -
400 / 5 / 8,000 2 2010-2011
75 [ABT] - 275
[ABT] -
3e 2012+ 150 f [ABT] - 400 f
[ABT] -
Off-highway motorcyclesg 1d 2006+ - 2.0h, i
[ABT] - 25h, i
[ABT]
> 70 cc Displacement: - / 5 /
10,000 ≤ 70 cc
Displacement: - / 5 / 5,000
ATVsg 1d 2006+ - 1.5j, k
[ABT] - 35k
[ABT]
≥ 100 cc Displacement: 1000 /
5 / 10,000 < 100 cc
Displacement: 500 / 5 / 5,000
Source: 40 CFR 1051.101-115 = Emission standards (Additional resources: www.epa.gov/emission-standards-reference-
guide/nonroad-engines-and-vehicles-emission-standards) a The numerical emission standards for hydrocarbons (HC) must be met based on the following types of hydrocarbon emissions for recreational engines and vehicles powered by the following fuels: (1) non-methane hydrocarbons for natural gas; (2) total hydrocarbon equivalent for alcohol; and (3) total hydrocarbons for other fuels. b Useful life is expressed in hours, years, or kilometers, whichever comes first; warranty period is expressed in hours, months, or kilometers (km), whichever comes first. Nonroad recreational engines and vehicles must meet emission standards over their full useful life. A longer useful life in terms of km and hours must be specified for the engine family if the average service life is longer than the minimum value as described in 40 Code of Federal Regulations (CFR) 1051 Subpart B. c Test procedures for snowmobiles use the equipment and procedures for spark-ignition engines in 40 CFR Part 1065. d Phase 1 standards will be phased in: 50 percent by 2006, 100 percent by 2007. e Litigation on the November 2002 final rule resulted in a court decision that requires EPA to clarify the evidence and analysis upon which the Phase 3 carbon monoxide (CO) and HC standards were based. EPA will address this in a future rulemaking. f These are the maximum allowable family emission limits (FEL). The HC and CO standards are defined by a functional relationship as described in 40 CFR 1051.103(a)(2). g For off-highway motorcycles and ATVs, chassis dynamometer emissions test procedures are specified in 40 CFR Part 86, Subpart F and engine dynamometer emissions test procedures are specified in 40 CFR Part 1065. h Maximum allowable FEL: 20.0 grams per kilometer (g/km) for HC plus nitrogen oxides (NOx) and 50 g/km for CO.

12–38
TRANSPORTATION ENERGY DATA BOOK: EDITION 36—2017
Table 12.28 (continued) Nonroad Recreational Engines and Vehicles – Exhaust Emission Standards
i Manufacturers may certify off-highway motorcycles with engines that have total displacement of 70 cubic centimeters (cc) or less to an HC+NOx standard of 16.1 grams per kilowatt-hour (g/kW-hr) (with an FEL cap of 32.2 g/kW-hr) and a CO standard of 519 g/kW-hr. j Maximum allowable FEL for HC+NOx is 20.0 g/km. k Manufacturers may certify all-terrain vehicles with engines that have total displacement of less than 100 cc to an HC+NOx standard of 25.0 g/kW-hr (with an FEL cap of 40.0 g/kW-hr) and a CO standard of 500 g/kW-hr.

12–39
TRANSPORTATION ENERGY DATA BOOK: EDITION 36—2017
The latest standards were established by the Environmental Protection Agency in conjunction with the Tier 3 emission standards.
Table 12.29
Gasoline Sulfur Standards
Regulated entity Refinery average and per-gallon cap by year (ppm)
2004 2005 2006 2007 2008-2016 2017-2019 2020
Federal
Large refiners / importersa 120b / 300c 30 / 90b / 300 30 / 80 30 / 80 30 / 80 10 / 80 10 / 80
GPA refiners d, e 150 / 300c 150 / 300 150 / 300 30 / 80 30 / 80 30 / 80 10 / 80
Small refiners f, g, h
k k k k 30 / 80 30 / 80 10 / 80
Downstream standards i, j 378 326 95 95 95 95 95
Source: 40 CFR 80 Subpart H (Additional resources: www.epa.gov/emission-standards-reference-guide/fuel-sulfur-
standards) a Standards effective January 1 at the refinery gate. b No Refinery Average Standard applies in 2004; Corporate Average Standard applies in 2004 (120 ppm) and 2005 (90 ppm). c Cap exceedances up to 50 ppm in 2004 must be made up in 2005. d Geographic Phase-in Area (GPA) refiners must also comply with the corporate average standards in 2004 and 2005 if less than 50% of the refiner's gasoline is designated as GPA gasoline in a given compliance period. e GPA refiners may receive an additional two years (i.e., through 2008) to comply with the 30 / 80 ppm gasoline sulfur standards in exchange for producing 95% of their highway diesel fuel at the 15 ppm sulfur standard by June 1, 2006. f Small refiners may receive an additional two years (i.e., through 2009) to comply with the 30 / 80 ppm gasoline sulfur standards via a hardship demonstration. g Small refiners may receive an additional three years (i.e., through 2010) to comply with the 30 / 80 ppm gasoline sulfur standards in exchange for producing 95% of their highway diesel fuel at the 15 ppm sulfur standard by June 1, 2006. h Small refiners may receive a 20% increase in their annual average and per-gallon cap standards in exchange for producing 95% of their highway, nonroad, locomotive, and marine diesel fuel at the 15 ppm sulfur standard by June 1, 2006. i Downstream standards are effective February 1 at any downstream location other than at a retail outlet or wholesale purchaser-consumer (e.g., pipelines and terminals) and March 1 at any downstream location. j Downstream standards for gasoline that is not blended with small refiner gasoline are shown. Refer to the Code of Federal Regulations (CFR) for the downstream standards that apply when a gasoline blend includes small refiner gasoline. k
1997-98 Refinery baseline sulfur level
(ppm)
Small refiner interim gasoline sulfur standards (ppm) 2004 - 2007
Average Cap 0 to 30 30 300
31 to 200 baseline level 300 201 to 400 200 300 401 to 600 50% of baseline 1.5 x avg. standard
601 and above 300 450

12–40
TRANSPORTATION ENERGY DATA BOOK: EDITION 36—2017
Ultra-low sulfur diesel (ULSD) fuel is necessary for new advanced emission control technologies. It also reduces particulate matter in the existing fleet of nonroad engines and equipment.
Table 12.30
Highway, Nonroad, Locomotive, and Marine (NRLM) Diesel Fuel Sulfur Standards
Regulated entity Covered
fuel Per-gallon maximum sulfur level by year (ppm)
2006a 2007b 2008 2009 2010c,d 2011 2012 2013 2014
Federal
Large refiners & importers Highway
80% 15 15 20% 500
Small refiners Highway 500
Large refiners & importers
NR - 500 500 500 15 15 15 15 15 LM - 500 500 500 500 500 15 15 15
NRLM with
creditse - HS HS HS 500 500 500 500 15
Small refiners NRLMf - HS HS HS 500 500 500 500 15 Transmix
processor & in-use NRe - HS HS HS 500 500 500 500 15 LMe - HS HS HS 500 500 500 500 500
Source: 40 CFR 80 Subpart I (Additional resources: www.epa.gov/emission-standards-reference-guide/fuel-sulfur-
standards) a For highway diesel fuel, standards are effective June 1 for refiners/importers, September 1 for pipelines and terminals, and October 15 for retailers and wholesale purchaser-consumers. Anti-downgrading provisions effective October 16, 2006. b For Nonroad, Locomotive, and Marine (NRLM) diesel fuel, standards are effective June 1 for refiners; downstream requirements apply for Northeast/Mid-Atlantic area only (August 1 for terminals, October 1 for retailers and wholesale purchaser-consumers, and December 1 for in-use). c For highway diesel fuel, standards are effective June 1 for refiners/importers, October 1 for pipelines and terminals, and December 1 for retailers and wholesale purchaser-consumers. d For NRLM diesel fuel, standards are effective June 1 for refiners, August 1 for terminals, October 1 for retailers and wholesale purchaser-consumers, and December 1 for in-use. e Excluding the Northeast and Alaska. f Excluding the Northeast, with approval in Alaska.

A–1
TRANSPORTATION ENERGY DATA BOOK: EDITION 36—2017
SOURCES & METHODOLOGIES

A–2
TRANSPORTATION ENERGY DATA BOOK: EDITION 36—2017

A–3
TRANSPORTATION ENERGY DATA BOOK: EDITION 36—2017
SOURCES & METHODOLOGIES
This appendix contains documentation of the estimation procedures used by ORNL. The
reader can examine the methodology behind the estimates and form an opinion as to their utility.
The appendix is arranged by subject heading. Only tables which contain ORNL estimations are
documented in Appendix A; all other tables have sources listed at the bottom of the table. Since
abbreviations are used throughout the appendix, a list of abbreviations is also included.
Contents of Appendix A
1. List of Abbreviations Used in Appendix A .......................................................................... A–4
2. Energy Use Sources .............................................................................................................. A–5
2.1 Highway energy use ..................................................................................................... A–5
2.2 Off-highway energy use ............................................................................................. A–14
2.3 Nonhighway energy use ............................................................................................. A–14
2.4 Calculation of Million Barrels per Day Crude Oil Equivalent .................................. A–24
3. Passenger Travel and Energy Use ....................................................................................... A–24
4. Highway Passenger Mode Energy Intensities ..................................................................... A–28
5. Nonhighway Mode Energy Intensities................................................................................ A–31
6. Freight Mode Energy Intensities ......................................................................................... A–32
7. Car/Light Truck Shares ....................................................................................................... A–33

A–4
TRANSPORTATION ENERGY DATA BOOK: EDITION 36—2017
1. LIST OF ABBREVIATIONS USED IN APPENDIX A
AAR Association of American Railroads
APTA American Public Transportation Association
Amtrak National Railroad Passenger Corporation
BTS Bureau of Transportation Statistics
Btu British thermal unit
CD Compact Disc
CNG Compressed Natural Gas
CO2 Carbon Dioxide
CPI Consumer Price Index
CY Calendar Year
DOE Department of Energy
DOT Department of Transportation
EIA Energy Information Administration
EPA Environmental Protection Agency
FAA Federal Aviation Administration
FHWA Federal Highway Administration
IRS Internal Revenue Service
gal Gallons
kWhr Kilowatt hour
L Liter
lb Pound
lng Liquefied Natural Gas
lpg Liquefied Petroleum Gas
mpg Miles per Gallon
NHTS National Household Travel Survey
NPTS Nationwide Personal Transportation Survey
NVPP National Vehicle Population Profile
ORNL Oak Ridge National Laboratory
RTECS Residential Transportation Energy Consumption Survey
SCF Standard Cubic Feet
TIUS Truck Inventory and Use Survey
VIUS Vehicle Inventory and Use Survey
vmt vehicle-miles traveled

A–5
TRANSPORTATION ENERGY DATA BOOK: EDITION 36—2017
2. ENERGY USE SOURCES 2.1 HIGHWAY ENERGY USE 2.1.1 Cars Fuel use in gallons (1970-2008) – DOT, FHWA, Highway Statistics 2008, Table VM-1 and annual editions back to 1996; DOT, FHWA, Highway Statistics Summary to 1995. Fuel use in gallons (2009 – 2015) – See Section 7. Appendix A Car and Light Truck Shares. Fuel type distribution for gallons – Fuel use was distributed among fuel types using the percentages shown in Table A.1. The FHWA discontinued gasohol data in 2005. Therefore, data from EIA, Alternatives to Traditional Transportation Fuels, 2006-2011, Table C1 were used. Electricity use (2014) – U.S. Department of Energy, Energy Information Administration, Annual Energy Outlook 2016, July 2016, Table 37. Total light vehicle electricity usage was split between cars and light trucks using cumulative vehicle sales as a proxy. Electricity use (2015) – Estimates derived using cumulative electric vehicle (EV) and plug-in hybrid vehicle (PHEV) sales as a proxy for vehicle population; sales-weighted vehicle efficiencies from the U.S. Department of Energy and U.S. Environmental Protection Agency’s vehicle database on www.fueleconomy.gov; and annual miles traveled from varying PHEV utility factors and EV usage assumptions. A report documenting this methodology is forthcoming.

A–6
TRANSPORTATION ENERGY DATA BOOK: EDITION 36—2017
Table A.1 Car Fuel Use and Fuel Type Shares for Calculation of Energy Use
Fuel use Source for Source for Shares by fuel typeb
Year (million gallons) gasohol shares gasoline/diesel shares Gasoline Gasohol Diesel 1970 67,820
1984 NVPP 99.8% 0.0% 0.2%
1971 71,346
interpolated 99.2% 0.0% 0.8% 1972 75,937
interpolated 98.7% 0.0% 1.3%
1973 78,233
interpolated 98.1% 0.0% 1.9% 1974 74,229
interpolated 97.5% 0.0% 2.5%
1975 74,140
interpolated 97.0% 0.0% 3.0% 1976 78,297
interpolated 96.4% 0.0% 3.6%
1977 79,060
interpolated 95.8% 0.0% 4.2% 1978 80,652
interpolated 95.3% 0.0% 4.7%
1979 76,588
1979 RTECS 94.7% 0.0% 5.3% 1980 69,981 FHWA, MF-33e interpolated 93.9% 0.5% 5.6% 1981 69,112 FHWA, MF-33e 1981 RTECS 93.4% 0.7% 5.9% 1982 69,116 FHWA, MF-33e interpolated 93.5% 2.3% 4.2% 1983 70,322 FHWA, MF-33e 1983 RTECS 93.2% 4.3% 2.5% 1984 70,663 FHWA, MF-33e interpolated 92.7% 5.3% 2.0% 1985 71,518 FHWA, MF-33e 1985 RTECS 90.8% 7.7% 1.5% 1986 73,174 FHWA, MF-33e interpolated 91.0% 7.6% 1.4% 1987 73,308 FHWA, MF-33e interpolated 92.4% 6.3% 1.3% 1988 73,345 FHWA, MF-33e 1988 RTECS 91.4% 7.4% 1.2% 1989 73,913 FHWA, MF-33e interpolated 92.6% 6.2% 1.2% 1990 69,568 FHWA, MF-33e interpolated 92.0% 6.8% 1.2% 1991 64,318 FHWA, MF-33e 1991 RTECS 90.8% 8.0% 1.2% 1992 65,436 FHWA, MF-33e interpolated 90.8% 7.9% 1.2% 1993 67,047 FHWA, MF-33e interpolated 89.7% 9.1% 1.3% 1994 67,874 FHWA, MF-33e 1994 RTECS 89.1% 9.6% 1.3% 1995 68,072 FHWA, MF-33e interpolated 87.6% 11.2% 1.2% 1996 69,221 FHWA, MF-33e interpolated 88.8% 10.1% 1.0% 1997 69,892 FHWA, MF-33e interpolated 86.9% 12.2% 0.9% 1998 71,695 FHWA, MF-33e interpolated 88.0% 11.2% 0.8% 1999 73,283 FHWA, MF-33e interpolated 88.3% 11.0% 0.6% 2000 73,065 FHWA, MF-33e 2000 NVPP 86.9% 12.6% 0.5% 2001 73,559 FHWA, MF-33e 2001 NVPP 86.5% 13.0% 0.5% 2002 75,471 FHWA, MF-33e 2001 NVPP 83.9% 15.6% 0.5% 2003 74,590 FHWA, MF-33e 2001 NVPP 75.3% 24.2% 0.5% 2004 75,402 FHWA, MF-33e 2001 NVPP 67.2% 32.3% 0.5% 2005 77,418 FHWA, MF-33e 2001 NVPP 66.9% 32.6% 0.5% 2006 75,009 EIA, C1 2001 NVPP 78.2% 21.3% 0.5% 2007 74,377 EIA, C1 2001 NVPP 72.9% 26.6% 0.5% 2008 71,497 a EIA, C1 2001 NVPP 61.8% 37.7% 0.5% 2009 66,587 EIA, C1 2001 NVPP 55.8% 43.7% 0.5% 2010 62,245 EIA, C1 2001 NVPP 49.5% 50.0% 0.5% 2011 59,646 EIA, C1 2001 NVPP 48.7% 50.8% 0.5% 2012 57,899 EIA, C1 2001 NVPP 48.7% 50.8% 0.5% 2013 57,290 EIA, C1 2001 NVPP 49.0% 50.5% 0.5% 2014 56,420 EIA, C1 2001 NVPP 50.1% 49.4% 0.5% 2015 55,212 EIA, C1 2001 NVPP 50.0% 49.5% 0.5% Heat content used for conversion to btu: 125,000 120,900 138,700 btu/gallon btu/gallon btu/gallon
a Data are not continuous between 2008 and 2009 due to changes in source. b Percentages may not sum due to rounding.

A–7
TRANSPORTATION ENERGY DATA BOOK: EDITION 36—2017
2.1.2 Motorcycles DOT, FHWA, Highway Statistics 2015, Table VM-1, and annual editions. The FHWA made methodology changes for Highway Statistics 2009-10. At that time, they published historical data back to 2007 which do not match the previous data.
Table A.2
Motorcycle Fuel Use
Fuel use Fuel use Year (thousand gallons) Year (thousand gallons) 1970 59,580 1993 198,120 1971 72,140 1994 204,800 1972 86,620 1995 198,262 1973 103,880 1996 195,940 1974 108,900 1997 201,620 1975 112,580 1998 205,660 1976 120,060 1999 211,680 1977 126,980 2000 209,380 1978 143,160 2001 192,780 1979 172,740 2002 191,040 1980 204,280 2003 190,780 1981 213,800 2004 202,447 1982 198,200 2005 189,495
1983 175,200 2006 221,030 a 1984 175,680 2007 474,923
1985 181,720 2008 489,417 1986 187,940 2009 482,290 1987 190,120 2010 426,732 1988 200,480 2011 426,378 1989 207,420 2012 491,130 1990 191,140 2013 467,716 1991 183,560 2014 458,628 1992 191,140 2015 447,879 Heat content used for conversion to btu: 125,000 btu/gallon
a Data are not continuous between 2006 and 2007 due to changes in estimation methodology. See source document for details.
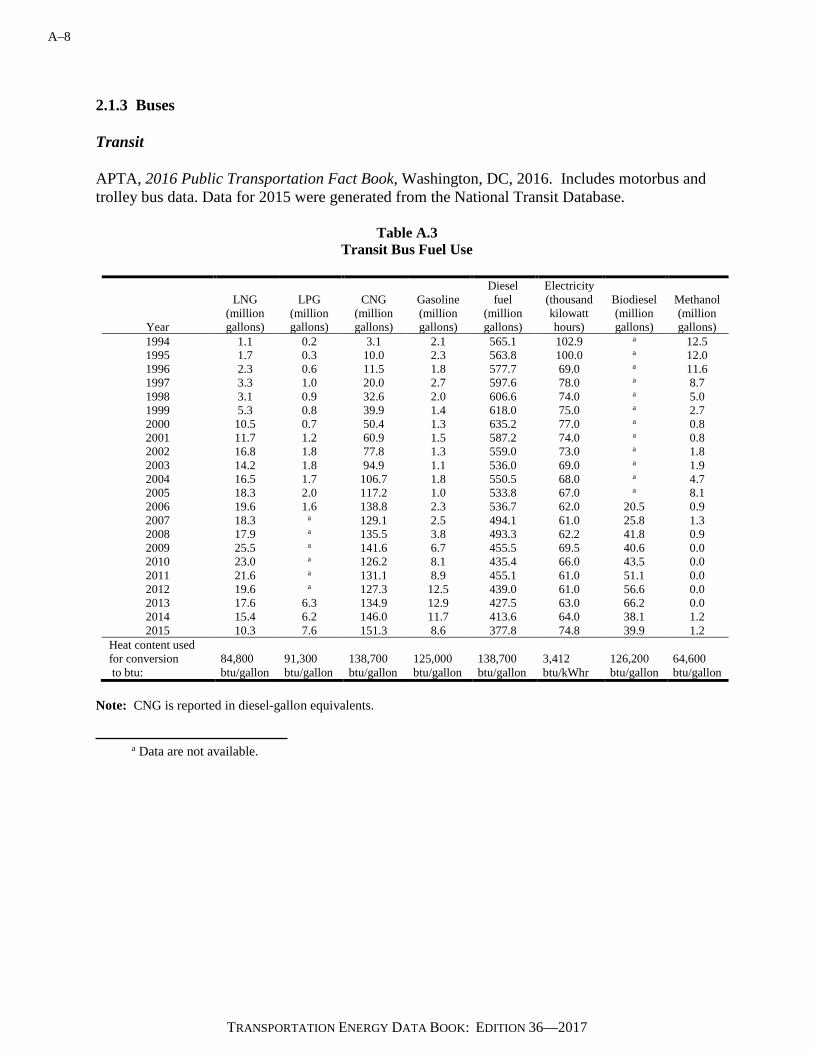
A–8
TRANSPORTATION ENERGY DATA BOOK: EDITION 36—2017
2.1.3 Buses Transit APTA, 2016 Public Transportation Fact Book, Washington, DC, 2016. Includes motorbus and trolley bus data. Data for 2015 were generated from the National Transit Database.
Table A.3 Transit Bus Fuel Use
LNG LPG CNG Gasoline Diesel fuel
Electricity (thousand Biodiesel Methanol
(million (million (million (million (million kilowatt (million (million Year gallons) gallons) gallons) gallons) gallons) hours) gallons) gallons) 1994 1.1 0.2 3.1 2.1 565.1 102.9 a 12.5 1995 1.7 0.3 10.0 2.3 563.8 100.0 a 12.0 1996 2.3 0.6 11.5 1.8 577.7 69.0 a 11.6 1997 3.3 1.0 20.0 2.7 597.6 78.0 a 8.7 1998 3.1 0.9 32.6 2.0 606.6 74.0 a 5.0 1999 5.3 0.8 39.9 1.4 618.0 75.0 a 2.7 2000 10.5 0.7 50.4 1.3 635.2 77.0 a 0.8 2001 11.7 1.2 60.9 1.5 587.2 74.0 a 0.8 2002 16.8 1.8 77.8 1.3 559.0 73.0 a 1.8 2003 14.2 1.8 94.9 1.1 536.0 69.0 a 1.9 2004 16.5 1.7 106.7 1.8 550.5 68.0 a 4.7 2005 18.3 2.0 117.2 1.0 533.8 67.0 a 8.1 2006 19.6 1.6 138.8 2.3 536.7 62.0 20.5 0.9 2007 18.3 a 129.1 2.5 494.1 61.0 25.8 1.3 2008 17.9 a 135.5 3.8 493.3 62.2 41.8 0.9 2009 25.5 a 141.6 6.7 455.5 69.5 40.6 0.0 2010 23.0 a 126.2 8.1 435.4 66.0 43.5 0.0 2011 21.6 a 131.1 8.9 455.1 61.0 51.1 0.0 2012 19.6 a 127.3 12.5 439.0 61.0 56.6 0.0 2013 17.6 6.3 134.9 12.9 427.5 63.0 66.2 0.0 2014 15.4 6.2 146.0 11.7 413.6 64.0 38.1 1.2 2015 10.3 7.6 151.3 8.6 377.8 74.8 39.9 1.2
Heat content used for conversion 84,800 91,300 138,700 125,000 138,700 3,412 126,200 64,600 to btu: btu/gallon btu/gallon btu/gallon btu/gallon btu/gallon btu/kWhr btu/gallon btu/gallon
Note: CNG is reported in diesel-gallon equivalents. a Data are not available.
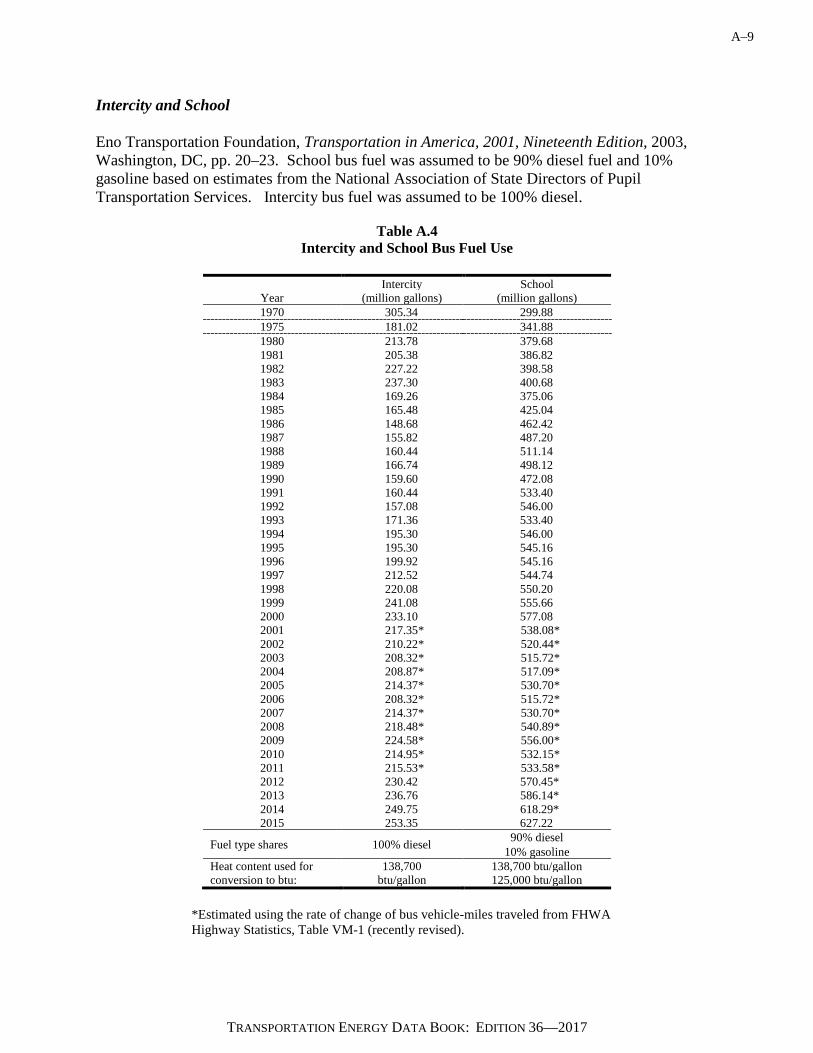
A–9
TRANSPORTATION ENERGY DATA BOOK: EDITION 36—2017
Intercity and School Eno Transportation Foundation, Transportation in America, 2001, Nineteenth Edition, 2003, Washington, DC, pp. 20–23. School bus fuel was assumed to be 90% diesel fuel and 10% gasoline based on estimates from the National Association of State Directors of Pupil Transportation Services. Intercity bus fuel was assumed to be 100% diesel.
Table A.4 Intercity and School Bus Fuel Use
Intercity School
Year (million gallons) (million gallons) 1970 305.34 299.88 1975 181.02 341.88 1980 213.78 379.68 1981 205.38 386.82 1982 227.22 398.58 1983 237.30 400.68 1984 169.26 375.06 1985 165.48 425.04 1986 148.68 462.42 1987 155.82 487.20 1988 160.44 511.14 1989 166.74 498.12 1990 159.60 472.08 1991 160.44 533.40 1992 157.08 546.00 1993 171.36 533.40 1994 195.30 546.00 1995 195.30 545.16 1996 199.92 545.16 1997 212.52 544.74 1998 220.08 550.20 1999 241.08 555.66 2000 233.10 577.08 2001 217.35* 538.08* 2002 210.22* 520.44* 2003 208.32* 515.72* 2004 208.87* 517.09* 2005 214.37* 530.70* 2006 208.32* 515.72* 2007 214.37* 530.70* 2008 218.48* 540.89* 2009 224.58* 556.00* 2010 214.95* 532.15* 2011 215.53* 533.58* 2012 230.42 570.45* 2013 236.76 586.14* 2014 249.75 618.29* 2015 253.35 627.22
Fuel type shares 100% diesel 90% diesel 10% gasoline
Heat content used for 138,700 138,700 btu/gallon conversion to btu: btu/gallon 125,000 btu/gallon
*Estimated using the rate of change of bus vehicle-miles traveled from FHWA Highway Statistics, Table VM-1 (recently revised).
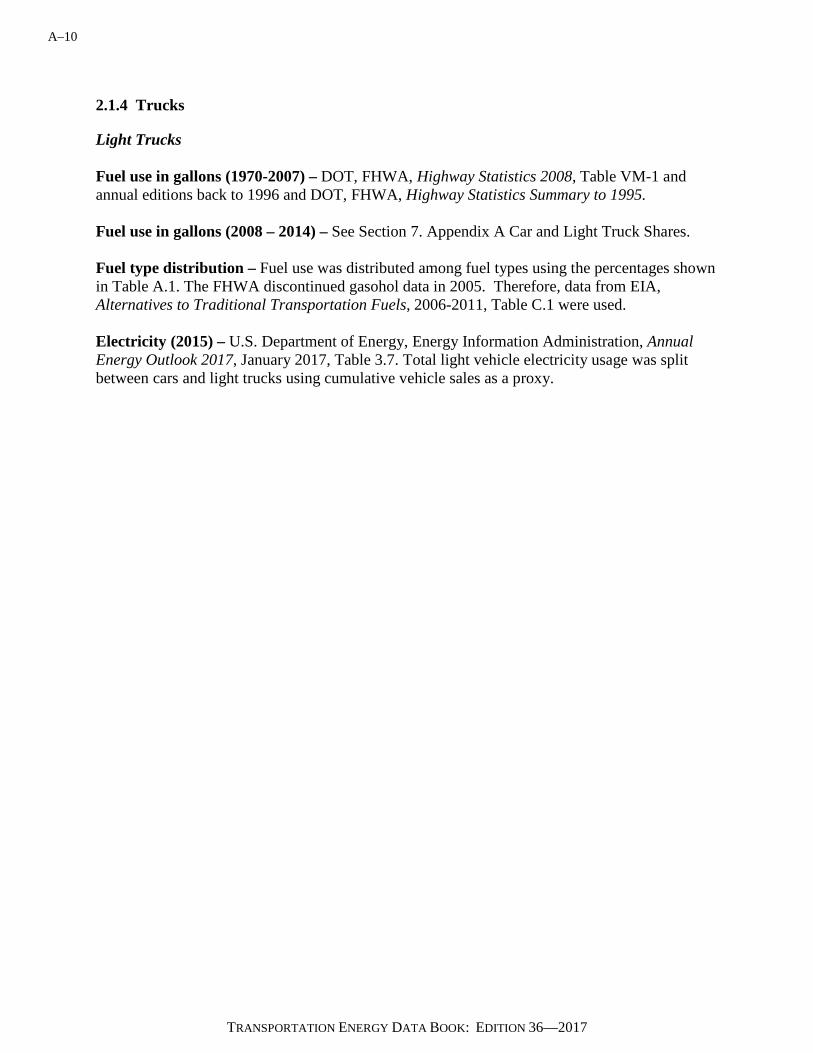
A–10
TRANSPORTATION ENERGY DATA BOOK: EDITION 36—2017
2.1.4 Trucks
Light Trucks Fuel use in gallons (1970-2007) – DOT, FHWA, Highway Statistics 2008, Table VM-1 and annual editions back to 1996 and DOT, FHWA, Highway Statistics Summary to 1995. Fuel use in gallons (2008 – 2014) – See Section 7. Appendix A Car and Light Truck Shares. Fuel type distribution – Fuel use was distributed among fuel types using the percentages shown in Table A.1. The FHWA discontinued gasohol data in 2005. Therefore, data from EIA, Alternatives to Traditional Transportation Fuels, 2006-2011, Table C.1 were used. Electricity (2015) – U.S. Department of Energy, Energy Information Administration, Annual Energy Outlook 2017, January 2017, Table 3.7. Total light vehicle electricity usage was split between cars and light trucks using cumulative vehicle sales as a proxy.
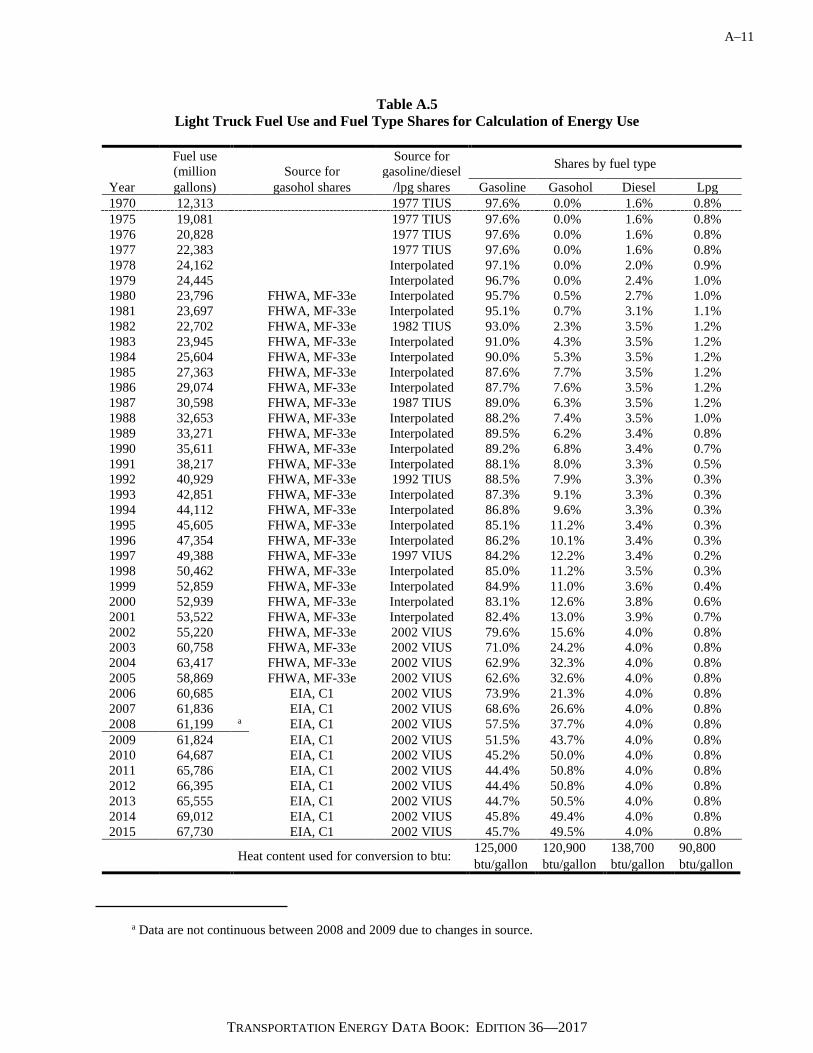
A–11
TRANSPORTATION ENERGY DATA BOOK: EDITION 36—2017
Table A.5 Light Truck Fuel Use and Fuel Type Shares for Calculation of Energy Use
Fuel use (million
Source for
Source for gasoline/diesel Shares by fuel type
Year gallons) gasohol shares /lpg shares Gasoline Gasohol Diesel Lpg 1970 12,313
1977 TIUS 97.6% 0.0% 1.6% 0.8%
1975 19,081
1977 TIUS 97.6% 0.0% 1.6% 0.8% 1976 20,828
1977 TIUS 97.6% 0.0% 1.6% 0.8%
1977 22,383
1977 TIUS 97.6% 0.0% 1.6% 0.8% 1978 24,162
Interpolated 97.1% 0.0% 2.0% 0.9%
1979 24,445
Interpolated 96.7% 0.0% 2.4% 1.0% 1980 23,796 FHWA, MF-33e Interpolated 95.7% 0.5% 2.7% 1.0% 1981 23,697 FHWA, MF-33e Interpolated 95.1% 0.7% 3.1% 1.1% 1982 22,702 FHWA, MF-33e 1982 TIUS 93.0% 2.3% 3.5% 1.2% 1983 23,945 FHWA, MF-33e Interpolated 91.0% 4.3% 3.5% 1.2% 1984 25,604 FHWA, MF-33e Interpolated 90.0% 5.3% 3.5% 1.2% 1985 27,363 FHWA, MF-33e Interpolated 87.6% 7.7% 3.5% 1.2% 1986 29,074 FHWA, MF-33e Interpolated 87.7% 7.6% 3.5% 1.2% 1987 30,598 FHWA, MF-33e 1987 TIUS 89.0% 6.3% 3.5% 1.2% 1988 32,653 FHWA, MF-33e Interpolated 88.2% 7.4% 3.5% 1.0% 1989 33,271 FHWA, MF-33e Interpolated 89.5% 6.2% 3.4% 0.8% 1990 35,611 FHWA, MF-33e Interpolated 89.2% 6.8% 3.4% 0.7% 1991 38,217 FHWA, MF-33e Interpolated 88.1% 8.0% 3.3% 0.5% 1992 40,929 FHWA, MF-33e 1992 TIUS 88.5% 7.9% 3.3% 0.3% 1993 42,851 FHWA, MF-33e Interpolated 87.3% 9.1% 3.3% 0.3% 1994 44,112 FHWA, MF-33e Interpolated 86.8% 9.6% 3.3% 0.3% 1995 45,605 FHWA, MF-33e Interpolated 85.1% 11.2% 3.4% 0.3% 1996 47,354 FHWA, MF-33e Interpolated 86.2% 10.1% 3.4% 0.3% 1997 49,388 FHWA, MF-33e 1997 VIUS 84.2% 12.2% 3.4% 0.2% 1998 50,462 FHWA, MF-33e Interpolated 85.0% 11.2% 3.5% 0.3% 1999 52,859 FHWA, MF-33e Interpolated 84.9% 11.0% 3.6% 0.4% 2000 52,939 FHWA, MF-33e Interpolated 83.1% 12.6% 3.8% 0.6% 2001 53,522 FHWA, MF-33e Interpolated 82.4% 13.0% 3.9% 0.7% 2002 55,220 FHWA, MF-33e 2002 VIUS 79.6% 15.6% 4.0% 0.8% 2003 60,758 FHWA, MF-33e 2002 VIUS 71.0% 24.2% 4.0% 0.8% 2004 63,417 FHWA, MF-33e 2002 VIUS 62.9% 32.3% 4.0% 0.8% 2005 58,869 FHWA, MF-33e 2002 VIUS 62.6% 32.6% 4.0% 0.8% 2006 60,685 EIA, C1 2002 VIUS 73.9% 21.3% 4.0% 0.8% 2007 61,836 EIA, C1 2002 VIUS 68.6% 26.6% 4.0% 0.8% 2008 61,199 a EIA, C1 2002 VIUS 57.5% 37.7% 4.0% 0.8% 2009 61,824 EIA, C1 2002 VIUS 51.5% 43.7% 4.0% 0.8% 2010 64,687 EIA, C1 2002 VIUS 45.2% 50.0% 4.0% 0.8% 2011 65,786 EIA, C1 2002 VIUS 44.4% 50.8% 4.0% 0.8% 2012 66,395 EIA, C1 2002 VIUS 44.4% 50.8% 4.0% 0.8% 2013 65,555 EIA, C1 2002 VIUS 44.7% 50.5% 4.0% 0.8% 2014 69,012 EIA, C1 2002 VIUS 45.8% 49.4% 4.0% 0.8% 2015 67,730 EIA, C1 2002 VIUS 45.7% 49.5% 4.0% 0.8% Heat content used for conversion to btu: 125,000 120,900 138,700 90,800 btu/gallon btu/gallon btu/gallon btu/gallon
a Data are not continuous between 2008 and 2009 due to changes in source.

A–12
TRANSPORTATION ENERGY DATA BOOK: EDITION 36—2017
Medium/Heavy Trucks DOT, FHWA, Highway Statistics 2015, Table VM-1 and annual editions back to 1996 and DOT, FHWA, Highway Statistics Summary to 1995. The FHWA made methodology changes for Highway Statistics 2009. At that time, they published historical data back to 2007 which do not match the previous data. Total gallons for medium/heavy trucks are the sum of single-unit trucks and combination trucks.
Table A.6 Medium/Heavy Truck Fuel Use and Fuel Type Shares for Calculation of Energy Use
Fuel use Source for Shares by fuel type Year (million gallons) fuel type shares Gasoline Diesel Lpg
1970 11,316 1977 TIUS 10.4% 89.5% 0.1% 1975 14,598 1977 TIUS 10.4% 89.5% 0.1% 1980 19,960 Interpolated 27.9% 71.4% 0.6% 1981 20,376 Interpolated 33.8% 65.4% 0.8% 1982 20,386 1982 TIUS 39.6% 59.4% 1.0% 1983 20,761 Interpolated 35.6% 63.6% 0.8% 1984 21,428 Interpolated 31.5% 67.8% 0.7% 1985 21,405 Interpolated 27.5% 72.0% 0.5% 1986 21,861 Interpolated 23.4% 76.2% 0.4% 1987 22,513 1987 TIUS 19.4% 80.4% 0.2% 1988 22,925 Interpolated 18.8% 81.0% 0.3% 1989 23,512 Interpolated 18.1% 81.6% 0.3% 1990 24,490 Interpolated 17.5% 82.1% 0.4% 1991 24,981 Interpolated 16.8% 82.7% 0.4% 1992 25,453 1992 TIUS 16.2% 83.3% 0.5% 1993 26,236 Interpolated 15.4% 84.1% 0.5% 1994 27,685 Interpolated 14.7% 84.8% 0.5% 1995 28,828 Interpolated 13.9% 85.6% 0.5% 1996 29,601 Interpolated 13.2% 86.3% 0.5% 1997 29,878 1997 VIUS 12.4% 87.1% 0.5% 1998 30,841 Interpolated 12.1% 87.4% 0.5% 1999 33,909 Interpolated 11.8% 87.6% 0.5% 2000 35,229 Interpolated 11.6% 87.9% 0.5% 2001 35,179 Interpolated 11.3% 88.1% 0.5% 2002 36,800 2002 VIUS 11.0% 88.4% 0.5% 2003 35,775 2002 VIUS 11.0% 88.4% 0.5% 2004 33,150 2002 VIUS 11.0% 88.4% 0.5% 2005 37,190 2002 VIUS 11.0% 88.4% 0.5% 2006 37,959 a 2002 VIUS 11.0% 88.4% 0.5% 2007 47,218 2002 VIUS 11.0% 88.4% 0.5% 2008 47,705 2002 VIUS 11.0% 88.4% 0.5% 2009 44,303 2002 VIUS 11.0% 88.4% 0.5% 2010 45,024 2002 VIUS 11.0% 88.4% 0.5% 2011 42,396 2002 VIUS 11.0% 88.4% 0.5% 2012 42,351 2002 VIUS 11.0% 88.4% 0.5% 2013 43,297 2002 VIUS 11.0% 88.4% 0.5% 2014 44,012 2002 VIUS 11.0% 88.4% 0.5% 2015 43,734 2002 VIUS 11.0% 88.4% 0.5%
Heat content used for conversion to btu: 125,000 138,700 90,800 btu/gallon btu/gallon btu/gallon
a Data are not continuous between 2006 and 2007 due to changes in methodology. See source for details.
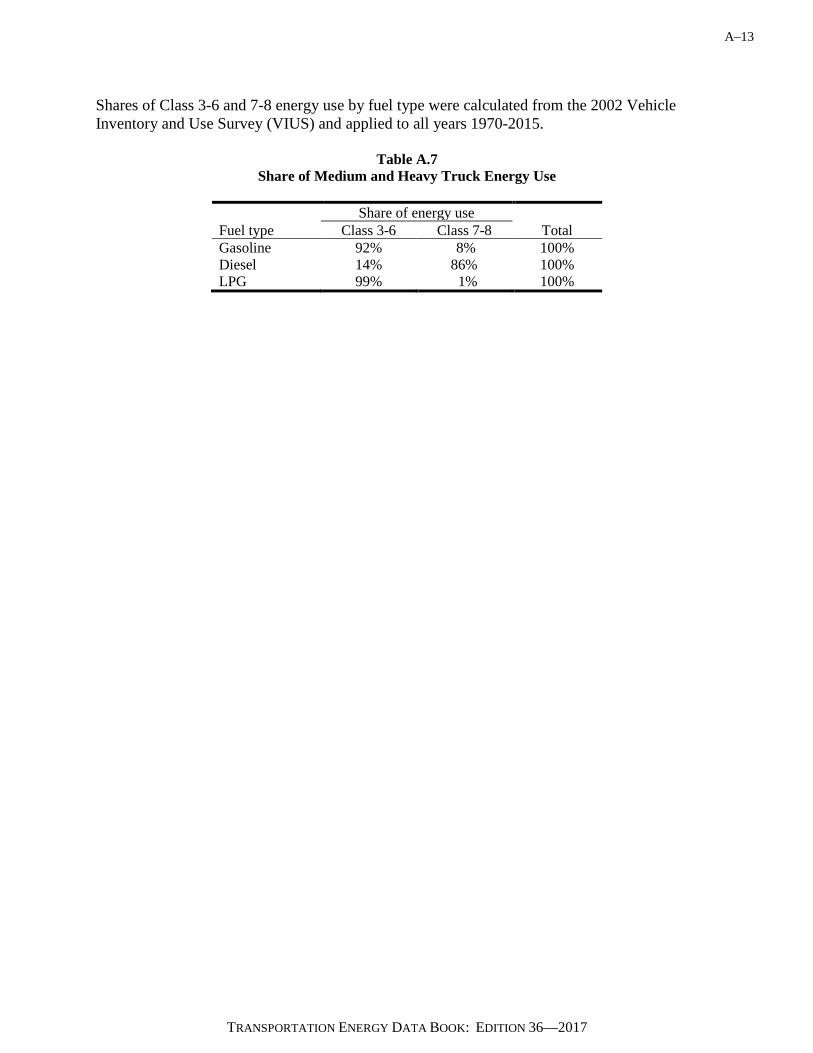
A–13
TRANSPORTATION ENERGY DATA BOOK: EDITION 36—2017
Shares of Class 3-6 and 7-8 energy use by fuel type were calculated from the 2002 Vehicle Inventory and Use Survey (VIUS) and applied to all years 1970-2015.
Table A.7 Share of Medium and Heavy Truck Energy Use
Share of energy use Fuel type Class 3-6 Class 7-8 Total Gasoline 92% 8% 100% Diesel 14% 86% 100% LPG 99% 1% 100%

A–14
TRANSPORTATION ENERGY DATA BOOK: EDITION 36—2017
2.2 OFF-HIGHWAY ENERGY USE U.S. Environmental Protection Agency, MOVES2014a model, results generated August 2017. Gallons of fuel by fuel type were produced for agricultural equipment, airport equipment, construction and mining equipment, industrial equipment, lawn and garden equipment, logging equipment, railroad maintenance equipment, and recreational equipment. Some non-transportation-related equipment, such as generators, chain saws, compressors, and pumps, were excluded from the data. 2.3 NONHIGHWAY ENERGY USE 2.3.1 Air General Aviation DOT, FAA, On-line General Aviation Activity and Air Taxi Activity Surveys: Annual Summary Report Calendar Year 2015, Table 5.1, and annual. 2011 Data: Aviation Forecasts, Tables 28 and 29, May 2013. (Additional resources: www.faa.gov/data_research/aviation_data_statistics/general_aviation/CY2015/)
Table A.8 General Aviation Fuel Use
Year
Jet fuel (million gallons)
Aviation gasoline (million gallons) Year
Jet fuel (million gallons)
Aviation gasoline (million gallons)
1970 208.0 551.0 1993 454.1 268.4 1971 226.0 508.0 1994 470.8 264.1 1972 245.0 584.0 1995 544.0 276.0 1973 304.0 411.0 1996 567.5 286.5 1974 357.0 443.0 1997 639.4 289.7 1975 453.0 412.0 1998 814.6 311.4 1976 495.0 432.0 1999 967.2 345.4 1977 536.0 456.0 2000 998.1 336.3 1978 763.0 518.0 2001 938.7 319.3 1979 736.0 570.0 2002 815.5 261.4 1980 766.0 520.0 2003 820.0 255.5 1981 759.0 489.0 2004 1,075.2 256.1 1982 887.0 448.0 2005 1,507.4 323.6 1983 613.0 428.0 2006 1,636.3 294.7 1984 738.9 462.4 2007 1,516.3 314.8 1985 691.0 421.0 2008 1,688.6 306.3 1986 732.1 408.6 2009 1,350.6 226.6 1987 672.7 401.8 2010 1,451.5 210.3 1988 746.0 398.0 2011 1,490.7 215.5 1989 688.0 342.8 2012 1,492.1 227.7 1990 662.0 353.0 2013 1,353.6 173.3 1991 579.0 348.0 2014 1,454.1 205.8 1992 496.0 306.0 2015 1,384.4 183.2
Heat content used for conversion to btu:
135,000 btu/gallon
120,200 btu/gallon
135,000 btu/gallon
120,200 btu/gallon

A–15
TRANSPORTATION ENERGY DATA BOOK: EDITION 36—2017
Domestic and International Air Carrier DOT, Bureau of Transportation Statistics, "Fuel Cost and Consumption Tables," www.transtats.bts.gov/fuel. The table below shows all international fuel use. Because the data for international include fuel purchased abroad, for the tables in Chapter 2, the international total was divided in half to estimate domestic fuel use for international flights.
Table A.9 Air Carrier Fuel Use
Year Domestic
(thousand gallons) International
(thousand gallons) Total
(thousand gallons) 1970 Separate estimates for domestic 10,085,000 1975 and international are not available 10,412,640 1976 from 1970-1976. 10,400,040 1977 8,202,051 1,708,376 9,910,427 1978 8,446,117 1,741,918 10,188,035 1979 8,865,885 1,828,435 10,694,320 1980 8,519,233 1,747,306 10,266,539 1981 8,555,249 2,032,520 10,587,769 1982 8,432,465 1,967,733 10,400,198 1983 8,672,574 1,998,289 10,670,863 1984 9,625,958 2,286,407 11,912,365 1985 10,115,007 2,487,929 12,602,936 1986 11,137,331 2,544,996 13,682,327 1987 11,586,838 2,893,617 14,480,455 1988 11,917,904 3,262,824 15,180,728 1989 11,905,144 3,557,294 15,462,438 1990 12,429,305 3,963,081 16,392,386 1991 11,506,477 3,939,666 15,446,144 1992 11,762,852 4,120,132 15,882,983 1993 11,958,663 4,113,321 16,071,984 1994 12,475,549 4,310,879 16,786,428 1995 12,811,717 4,511,418 17,323,135 1996 13,187,305 4,658,093 17,845,398 1997 13,659,581 4,964,181 18,623,762 1998 13,876,971 5,185,562 19,062,533 1999 14,402,127 5,250,492 19,652,619 2000 14,844,592 5,474,685 20,319,277 2001 14,017,461 5,237,487 19,254,948 2002 12,848,329 4,990,798 17,839,127 2003 12,958,581 4,836,356 17,794,936 2004 13,622,603 4,931,546 18,554,149 2005 13,778,869 5,520,889 19,309,758 2006 13,694,437 6,017,638 19,712,075 2007 13,681,664 6,204,502 19,886,165 2008 12,666,911 6,186,747 18,853,658 2009 11,339,220 5,721,298 17,060,517 2010 11,256,900 6,041,500 17,288,400 2011 11,035,400 6,522,600 17,558,000 2012 10,439,700 6,506,300 16,946,000 2013 10,337,000 6,487,300 16,824,300 2014 10,458,600 6,321,400 16,780,000 2015 10,928,600 6,420,600 17,349,200
Heat content used for conversion to btu:
135,000 btu/gallon
135,000 btu/gallon
135,000 btu/gallon

A–16
TRANSPORTATION ENERGY DATA BOOK: EDITION 36—2017
2.3.2 Water Freight Total – DOE, EIA, Petroleum and Other Liquids Database, August 2017. Adjusted sales of distillate and residual fuel oil for vessel bunkering. (This may include some amounts of bunker fuels used for recreational purposes.)
Table A.10 Diesel and Residual Fuel Oil for Vessel Bunkering
Year Distillate fuel oil
(thousand gallons) Residual fuel oil
(thousand gallons) 1970 819,000 3,774,120 1975 1,097,880 4,060,140 1980 717,376 7,454,242 1981 1,723,143 7,922,512 1982 1,423,216 6,408,818 1983 1,418,890 5,724,115 1984 1,692,045 5,688,931 1985 1,894,265 5,269,733 1986 2,034,215 5,690,250 1987 2,223,258 5,869,154 1988 2,310,367 6,025,511 1989 2,356,444 6,621,100 1990 2,197,004 6,248,095 1991 2,167,640 6,786,055 1992 2,240,170 7,199,078 1993 2,043,745 6,269,882 1994 2,026,899 5,944,383 1995 1,978,105 6,431,238 1996 2,177,608 5,804,977 1997 2,107,561 4,789,861 1998 2,125,568 4,640,153 1999 2,064,590 5,598,630 2000 2,041,433 6,192,294 2001 2,099,011 4,345,284 2002 2,056,465 4,783,956 2003 1,863,150 3,801,425 2004 2,313,448 4,886,978 2005 2,115,381 5,533,552 2006 2,206,690 6,000,434 2007 2,158,930 6,773,950 2008 1,980,729 6,274,047 2009 2,138,690 5,331,657 2010 2,427,051 6,032,367 2011 2,651,859 5,207,886 2012 1,842,107 4,560,546 2013 1,655,258 3,876,795 2014 1,626,527 2,987,363 2015 2,415,253 3,103,402
Heat content used for conversion to btu:
138,700 btu/gallon
149,700 btu/gallon
Domestic share of total fuel use 77.5% 9.3%
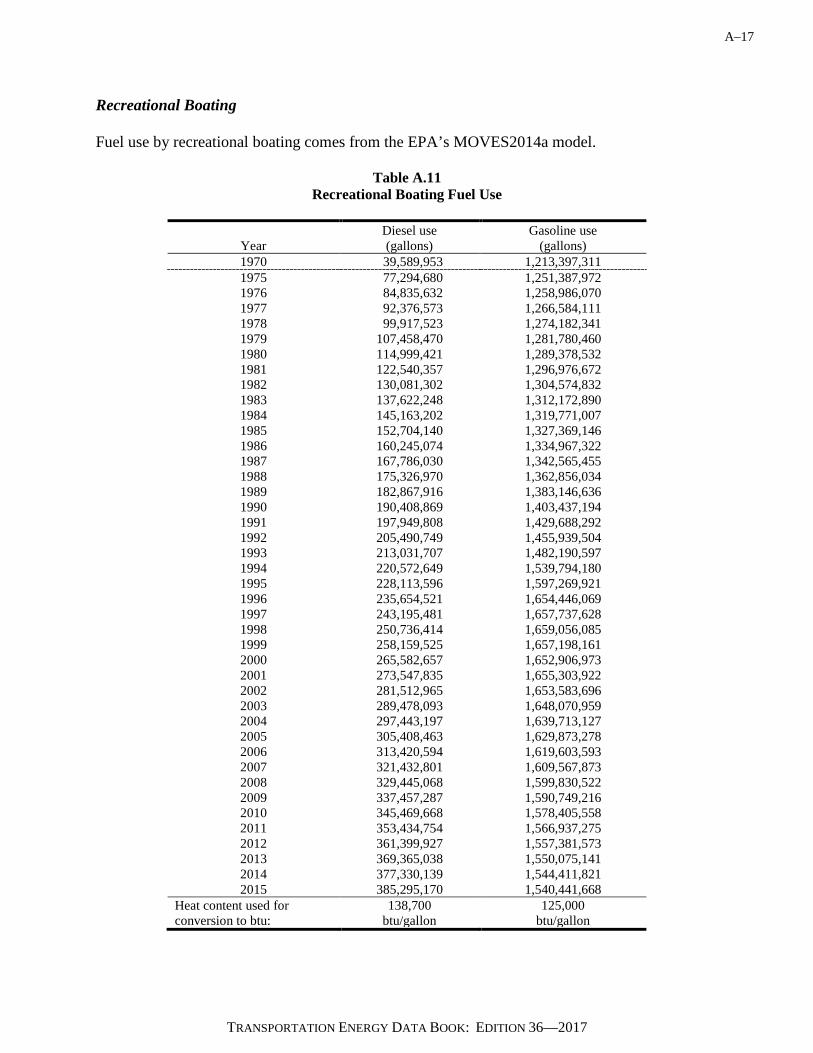
A–17
TRANSPORTATION ENERGY DATA BOOK: EDITION 36—2017
Recreational Boating Fuel use by recreational boating comes from the EPA’s MOVES2014a model.
Table A.11 Recreational Boating Fuel Use
Diesel use Gasoline use
Year (gallons) (gallons) 1970 39,589,953 1,213,397,311 1975 77,294,680 1,251,387,972 1976 84,835,632 1,258,986,070 1977 92,376,573 1,266,584,111 1978 99,917,523 1,274,182,341 1979 107,458,470 1,281,780,460 1980 114,999,421 1,289,378,532 1981 122,540,357 1,296,976,672 1982 130,081,302 1,304,574,832 1983 137,622,248 1,312,172,890 1984 145,163,202 1,319,771,007 1985 152,704,140 1,327,369,146 1986 160,245,074 1,334,967,322 1987 167,786,030 1,342,565,455 1988 175,326,970 1,362,856,034 1989 182,867,916 1,383,146,636 1990 190,408,869 1,403,437,194 1991 197,949,808 1,429,688,292 1992 205,490,749 1,455,939,504 1993 213,031,707 1,482,190,597 1994 220,572,649 1,539,794,180 1995 228,113,596 1,597,269,921 1996 235,654,521 1,654,446,069 1997 243,195,481 1,657,737,628 1998 250,736,414 1,659,056,085 1999 258,159,525 1,657,198,161 2000 265,582,657 1,652,906,973 2001 273,547,835 1,655,303,922 2002 281,512,965 1,653,583,696 2003 289,478,093 1,648,070,959 2004 297,443,197 1,639,713,127 2005 305,408,463 1,629,873,278 2006 313,420,594 1,619,603,593 2007 321,432,801 1,609,567,873 2008 329,445,068 1,599,830,522 2009 337,457,287 1,590,749,216 2010 345,469,668 1,578,405,558 2011 353,434,754 1,566,937,275 2012 361,399,927 1,557,381,573 2013 369,365,038 1,550,075,141 2014 377,330,139 1,544,411,821 2015 385,295,170 1,540,441,668
Heat content used for 138,700 125,000 conversion to btu: btu/gallon btu/gallon
A–18
TRANSPORTATION ENERGY DATA BOOK: EDITION 36—2017
2.3.3 Pipeline The sum of natural gas, crude petroleum and petroleum product, and coal slurry and water. Natural Gas The amount of natural gas used to transport natural gas was defined as "pipeline fuel" as reported in DOE, EIA, Natural Gas Annual 2015, Table 1. Cubic feet were converted to Btu using 1,031 Btu/ft3. Electricity use was estimated using the following procedure as reported on p. 5-110 of J. N. Hooker et al., End Use Energy Consumption DataBase: Transportation Sector. The energy consumption of a natural gas pipeline was taken to be the energy content of the fuel used to drive the pumps. Some 94% of the installed pumping horsepower was supplied by natural gas. The remaining 6% of the horsepower was generated more efficiently, mostly by electric motors. The energy consumed by natural gas pipeline pumps that were electrically powered was not known. In order to estimate the electricity consumed, the Btu of natural gas pipeline fuel consumed was multiplied by a factor of 0.015. Crude Petroleum and Petroleum Product J. N. Hooker, Oil Pipeline Energy Consumption and Efficiency, ORNL-5697, ORNL, Oak Ridge, TN, 1981. (Data held constant; Latest available data.) Coal Slurry and Water W. F. Banks, Systems, Science and Software, Energy Consumption in the Pipeline Industry, LaJolla, CA, October 1977. (Data held constant; Latest available data.)

A–19
TRANSPORTATION ENERGY DATA BOOK: EDITION 36—2017
Table A.12 Pipeline Fuel Use
Year
Natural gas (million cubic
feet)
Estimated natural gas pipeline
electricity use (million kWhr)
Electricity constant
(trillion btu) 1970 722,166 3,272.9 70.0 1975 582,963 2,642.0 70.0 1976 548,323 2,485.0 70.0 1977 532,669 2,414.1 70.0 1978 530,451 2,404.0 70.0 1979 600,964 2,723.6 70.0 1980 634,622 2,876.1 70.0 1981 642,325 2,911.0 70.0 1982 596,411 2,703.0 70.0 1983 490,042 2,220.9 70.0 1984 528,754 2,396.3 70.0 1985 503,766 2,283.1 70.0 1986 485,041 2,198.2 70.0 1987 519,170 2,352.9 70.0 1988 613,912 2,782.3 70.0 1989 629,308 2,852.0 70.0 1990 659,816 2,990.3 70.0 1991 601,305 2,725.1 70.0 1992 587,710 2,663.5 70.0 1993 624,308 2,829.4 70.0 1994 685,362 3,106.1 70.0 1995 700,335 3,173.9 70.0 1996 711,446 3,224.3 70.0 1997 751,470 3,405.7 70.0 1998 635,477 2,880.0 70.0 1999 645,319 2,924.6 70.0 2000 642,210 2,910.5 70.0 2001 624,964 2,832.3 70.0 2002 666,920 3,022.5 70.0 2003 591,492 2,680.7 70.0 2004 566,187 2,566.0 70.0 2005 584,026 2,646.8 70.0 2006 584,213 2,647.7 70.0 2007 621,364 2,816.0 70.0 2008 647,956 2,936.6 70.0 2009 670,174 3,037.2 70.0 2010 674,124 3,055.1 70.0 2011 687,784 3,117.0 70.0 2012 730,790 3,312.0 70.0 2013 833,061 3,775.4 70.0 2014 700,150 3,173.1 70.0 2015 666,214 3,019.3 70.0
Heat content used for conversion to btu:
1,031 btu/cubic foot
3,412 Btu/kWhr
Note: Formula for estimating electricity use for natural gas pipelines is: Natural gas use (in million cubic ft) × 1,031 btu/cubic ft × 0.015 × 29.305 ×10-5 kWhr/btu.
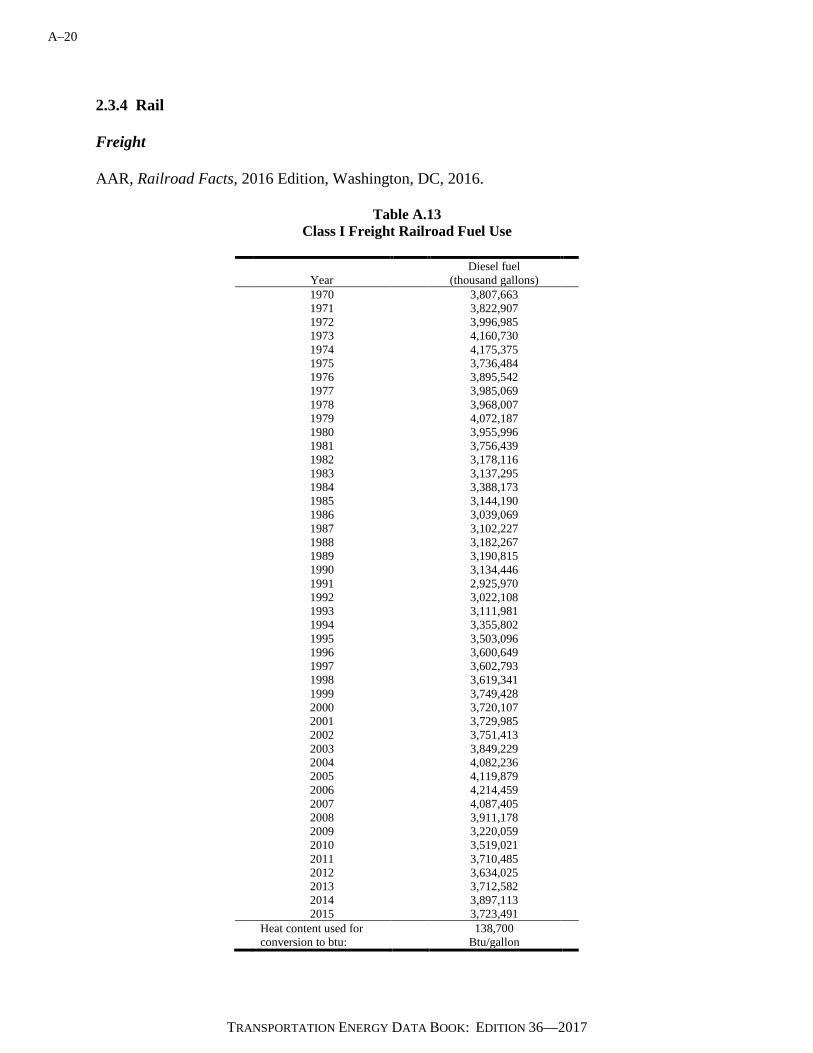
A–20
TRANSPORTATION ENERGY DATA BOOK: EDITION 36—2017
2.3.4 Rail Freight AAR, Railroad Facts, 2016 Edition, Washington, DC, 2016.
Table A.13 Class I Freight Railroad Fuel Use
Year Diesel fuel
(thousand gallons) 1970 3,807,663 1971 3,822,907 1972 3,996,985 1973 4,160,730 1974 4,175,375 1975 3,736,484 1976 3,895,542 1977 3,985,069 1978 3,968,007 1979 4,072,187 1980 3,955,996 1981 3,756,439 1982 3,178,116 1983 3,137,295 1984 3,388,173 1985 3,144,190 1986 3,039,069 1987 3,102,227 1988 3,182,267 1989 3,190,815 1990 3,134,446 1991 2,925,970 1992 3,022,108 1993 3,111,981 1994 3,355,802 1995 3,503,096 1996 3,600,649 1997 3,602,793 1998 3,619,341 1999 3,749,428 2000 3,720,107 2001 3,729,985 2002 3,751,413 2003 3,849,229 2004 4,082,236 2005 4,119,879 2006 4,214,459 2007 4,087,405 2008 3,911,178 2009 3,220,059 2010 3,519,021 2011 3,710,485 2012 3,634,025 2013 3,712,582 2014 3,897,113 2015 3,723,491
Heat content used for conversion to btu:
138,700 Btu/gallon
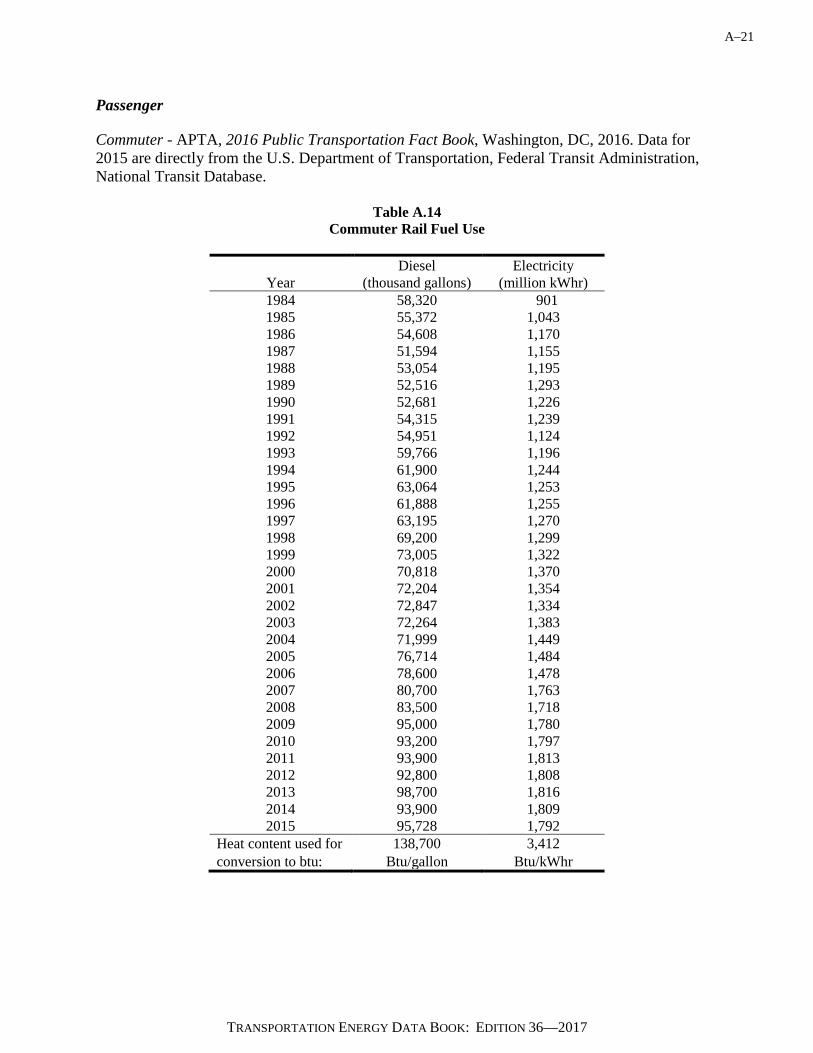
A–21
TRANSPORTATION ENERGY DATA BOOK: EDITION 36—2017
Passenger
Commuter - APTA, 2016 Public Transportation Fact Book, Washington, DC, 2016. Data for 2015 are directly from the U.S. Department of Transportation, Federal Transit Administration, National Transit Database.
Table A.14 Commuter Rail Fuel Use
Diesel Electricity
Year (thousand gallons) (million kWhr) 1984 58,320 901 1985 55,372 1,043 1986 54,608 1,170 1987 51,594 1,155 1988 53,054 1,195 1989 52,516 1,293 1990 52,681 1,226 1991 54,315 1,239 1992 54,951 1,124 1993 59,766 1,196 1994 61,900 1,244 1995 63,064 1,253 1996 61,888 1,255 1997 63,195 1,270 1998 69,200 1,299 1999 73,005 1,322 2000 70,818 1,370 2001 72,204 1,354 2002 72,847 1,334 2003 72,264 1,383 2004 71,999 1,449 2005 76,714 1,484 2006 78,600 1,478 2007 80,700 1,763 2008 83,500 1,718 2009 95,000 1,780 2010 93,200 1,797 2011 93,900 1,813 2012 92,800 1,808 2013 98,700 1,816 2014 93,900 1,809 2015 95,728 1,792
Heat content used for 138,700 3,412 conversion to btu: Btu/gallon Btu/kWhr

A–22
TRANSPORTATION ENERGY DATA BOOK: EDITION 36—2017
Transit – APTA, 2016 Public Transportation Fact Book, Washington, DC, 2016. Includes light rail and heavy rail. Data for 2015 are directly from the U.S. Department of Transportation, Federal Transit Administration, National Transit Database.
Table A.15 Transit Rail Fuel Use
Electricity (million kWhr)
Year Light rail Heavy rail Total 1970 2,561 1975 2,646 1976 Light rail and heavy rail data are 2,576 1977 not available separately from 2,303 1978 1970 to 1985. 2,223 1979 2,473 1980 2,446 1981 2,655 1982 2,722 1983 2,930 1984 3,092 1985 2,928 1986 173 3,066 3,239 1987 191 3,219 3,410 1988 243 3,256 3,499 1989 242 3,286 3,528 1990 239 3,284 3,523 1991 274 3,248 3,522 1992 297 3,193 3,490 1993 281 3,287 3,568 1994 282 3,431 3,713 1995 288 3,401 3,689 1996 321 3,322 3,643 1997 363 3,253 3,616 1998 382 3,280 3,662 1999 416 3,385 3,801 2000 563 3,549 4,112 2001 587 3,646 4,233 2002 510 3,683 4,193 2003 507 3,632 4,138 2004 553 3,684 4,237 2005 571 3,769 4,339 2006 634 3,709 4,343 2007 687 3,817 4,505 2008 721 3,898 4,619 2009 738 3,866 4,624 2010 749 3,780 4,529 2011 789 3,854 4,643 2012 806 3,795 4,601 2013 882 3,856 4,738 2014 985 3,812 4,797 2015 898 3,816 4,713
Heat content used for 3,412 3,412 3,412 conversion to btu: Btu/kWhr Btu/kWhr Btu/kWhr
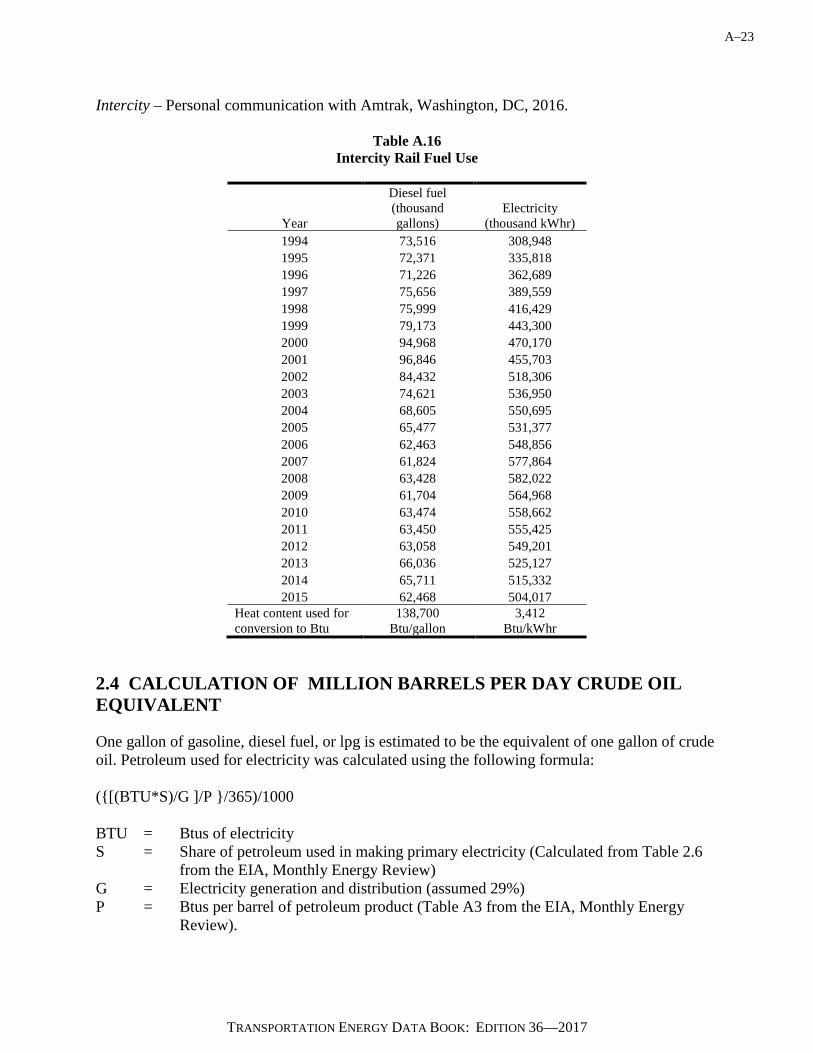
A–23
TRANSPORTATION ENERGY DATA BOOK: EDITION 36—2017
Intercity – Personal communication with Amtrak, Washington, DC, 2016.
Table A.16 Intercity Rail Fuel Use
Year
Diesel fuel (thousand gallons)
Electricity (thousand kWhr)
1994 73,516 308,948 1995 72,371 335,818 1996 71,226 362,689 1997 75,656 389,559 1998 75,999 416,429 1999 79,173 443,300 2000 94,968 470,170 2001 96,846 455,703 2002 84,432 518,306 2003 74,621 536,950 2004 68,605 550,695 2005 65,477 531,377 2006 62,463 548,856 2007 61,824 577,864 2008 63,428 582,022 2009 61,704 564,968 2010 63,474 558,662 2011 63,450 555,425 2012 63,058 549,201 2013 66,036 525,127 2014 65,711 515,332 2015 62,468 504,017
Heat content used for conversion to Btu
138,700 Btu/gallon
3,412 Btu/kWhr
2.4 CALCULATION OF MILLION BARRELS PER DAY CRUDE OIL EQUIVALENT One gallon of gasoline, diesel fuel, or lpg is estimated to be the equivalent of one gallon of crude oil. Petroleum used for electricity was calculated using the following formula: ({[(BTU*S)/G ]/P }/365)/1000 BTU = Btus of electricity S = Share of petroleum used in making primary electricity (Calculated from Table 2.6
from the EIA, Monthly Energy Review) G = Electricity generation and distribution (assumed 29%) P = Btus per barrel of petroleum product (Table A3 from the EIA, Monthly Energy Review).

A–24
TRANSPORTATION ENERGY DATA BOOK: EDITION 36—2017
3. PASSENGER TRAVEL AND ENERGY USE 3.1 CARS Number of vehicles – DOT, FHWA, Highway Statistics 2014, Table MV-1 and annual editions
back to 2009. Vehicle-miles – See Appendix A, Section 7. Car and Light Truck Shares. Passenger-miles – Vehicle-miles multiplied by an average load factor. Load factor – 2009 NHTS shows car load factor as 1.55 persons per vehicle. Energy intensities –
Btu per vehicle-mile – Car energy use divided by vehicle-miles. Btu per passenger-mile – Car energy use divided by passenger-miles.
Energy use – See Section 2. Energy Use Sources. Data series shown in Table 2.9. 3.2 LIGHT TRUCKS Number of vehicles – DOT, FHWA, Highway Statistics 2014, Table MV-9 and annual editions
back to 2009. Columns for pickups, vans, sport utility vehicles, and other light trucks. Data were multiplied by the shares of light trucks which are for personal use (Table A.17) which were derived by ORNL from the 2002 VIUS Micro Data File on CD.
Vehicle-miles – See Appendix A, Section 7. Car and Light Truck Shares. Data were multiplied by the shares of vehicle miles which are for personal use (Table A.17) which were derived by ORNL from the 2002 VIUS Micro Data File on CD.
Passenger-miles – Vehicle-miles multiplied by an average load factor. Load factor – 2009 NHTS shows personal light truck load factor as 1.84 persons per vehicle. Energy intensities -
Btu per vehicle-mile – Personal light truck energy use divided by personal light truck vehicle-miles.
Btu per passenger-mile – Personal light truck energy use divided by personal light truck passenger-miles.
Energy use – See Section 2. Energy Use Sources (light trucks, medium/heavy trucks). Data by truck type were multiplied by the shares of truck fuel use which are for personal use (Table A.17) which were derived by ORNL from the 2002 VIUS Micro Data File on CD.

A–25
TRANSPORTATION ENERGY DATA BOOK: EDITION 36—2017
Table A.17 Share of Trucks, Truck Travel,
and Fuel Use for Personal Travel
Personal trucks 85.6% 2-axle, 4-tire trucks 26.9% Other single-unit and combination trucks Personal truck travel 80.9% 2-axle, 4-tire trucks 13.1% Other single-unit and combination trucks Personal truck fuel use 78.0% 2-axle, 4-tire trucks 6.0% Other single-unit and combination trucks
Note: Since these shares come from the 2002 VIUS, they may underestimate the amount of personal trucks, truck travel, and energy use for 2015.
3.3 MOTORCYCLES Number of vehicles, vehicle-miles – DOT, FHWA, Highway Statistics 2015, Table VM-1. Passenger-miles – Vehicle-miles multiplied by an average load factor. Load factor - 2009 NHTS shows motorcycle load factor as 1.16 persons per vehicle. Energy intensities –
Btu per vehicle-mile – Motorcycle energy use divided by vehicle-miles. Btu per passenger-mile – Motorcycle energy use divided by passenger-miles.
Energy use – See Section 2. Energy Use Sources. Data series shown in Table 2.9. 3.4 DEMAND RESPONSE
Number of vehicles, vehicle-miles, passenger-miles – APTA, 2016 Public Transportation Fact Book, Washington, DC, 2016.
Load factor – Passenger-miles divided by vehicle-miles. Energy intensities –
Btu per vehicle-mile – Energy use divided by vehicle-miles. Btu per passenger-mile – Energy use divided by passenger-miles.
Energy use – APTA, 2016 Public Transportation Fact Book, Washington, DC, 2016. Note that all Demand Response data are for 2014.
A–26
TRANSPORTATION ENERGY DATA BOOK: EDITION 36—2017
3.5 BUSES 3.5.1 Transit
Number of vehicles, vehicle-miles, passenger-miles – APTA, 2016 Public Transportation Fact Book, Washington, DC, 2016. Data series shown on Table 5.18. Data for 2015 are directly from the U.S. Department of Transportation, Federal Transit Administration, National Transit Database.
Load factor – Passenger-miles divided by vehicle-miles. Energy intensities –
Btu per vehicle-mile – Transit bus energy use divided by transit bus vehicle-miles. Btu per passenger-mile – Transit bus energy use divided by transit bus passenger-miles.
Energy use – See Section 2. Energy Use Sources. Data series shown in Table 5.18. 3.5.2 Intercity Energy use – See Section 2. Energy Use Sources. Because the data past 2000 are not available,
the rate of change in bus VMT from FHWA, Highway Statistics 2015, was used to estimate the change in energy use.
3.5.3 School Number of vehicles – DOT, FHWA, Highway Statistics 2015, Table MV-10. Energy use – See Section 2. Energy Use Sources. Because the data past 2000 are not available,
the rate of change in bus VMT from FHWA, Highway Statistics 2015, was used to estimate the change in energy use.
3.6 AIR 3.6.1 Certificated Air Carriers Aircraft-miles, passenger-miles – DOT, BTS, U.S. Air Traffic Statistics Through December
2016, www.transtats.bts.gov, Washington, DC. Load factor – Passenger-miles divided by aircraft-miles. Energy intensities –
Btu per passenger-mile – Certificated air carrier energy use divided by passenger-miles. Energy use – See Section 2. Energy Use Sources. All of domestic fuel use and half of
international fuel use was considered to be domestic use. Note: These data differ from the data in Table 9.2 because that table contains data on ALL domestic AND international air carrier energy use and passenger-miles.
3.6.2 General Aviation
Number of vehicles – DOT, FAA, General Aviation and Air Taxi Activity Surveys - CY 2015.
2011 Data: Aviation Forecasts, Tables 28 and 29, May 2013. Data series shown in Table 9.3.
A–27
TRANSPORTATION ENERGY DATA BOOK: EDITION 36—2017
Energy intensities – Btu per passenger-mile – General aviation energy use divided by passenger-miles.
Energy use – See Section 2. Energy Use Sources. Data series shown in Table 9.3. 3.7 RECREATIONAL BOATING Number of vehicles and energy use – U.S. EPA’s MOVES2014a model. 3.8 RAIL 3.8.1 Intercity Number of vehicles, vehicle-miles, passenger-miles – AAR, Railroad Facts, 2016 Edition,
Washington, DC, 2016. Load factor – Passenger-miles divided by vehicle-miles. Energy Intensities – Btu per vehicle-mile – Intercity rail energy use divided by vehicle-miles.
Btu per passenger-mile – Intercity rail energy use divided by passenger-miles. Energy use – See Section 2. Energy Use Sources. Data series shown in Table 9.10. 3.8.2 Transit Number of vehicles, vehicle-miles, passenger-miles – APTA, 2016 Public Transportation Fact
Book, Washington, DC, 2016. Sum of light and heavy rail transit. Data series shown on Table 9.12. Data for 2015 are directly from the U.S. Department of Transportation, Federal Transit Administration, National Transit Database.
Load factor – Passenger-miles divided by vehicle-miles. Energy intensities –
Btu per vehicle-mile – Light and heavy transit rail energy use divided by vehicle-miles. Btu per passenger-mile – Light and heavy transit rail energy use divided by passenger-
miles. Energy use – See Section 2. Energy Use Sources. Data series shown in Table 9.12. 3.8.3 Commuter Number of vehicles, vehicle-miles, passenger-miles – APTA, 2016 Public Transportation Fact
Book, Washington, DC, 2016. Data series shown on Table 9.11. Data for 2015 are directly from the U.S. Department of Transportation, Federal Transit Administration, National Transit Database.
Load factor – Passenger-miles divided by vehicle-miles. Energy intensities –
Btu per vehicle-mile – Commuter rail energy use divided by vehicle-miles. Btu per passenger-mile – Commuter rail energy use divided by passenger-miles.
Energy use – See Section 2. Energy Use Sources. Data series shown in Table 9.11.

A–28
TRANSPORTATION ENERGY DATA BOOK: EDITION 36—2017
4. HIGHWAY PASSENGER MODE ENERGY INTENSITIES 4.1 CARS Btu per vehicle-mile – Car energy use divided by car vehicle miles of travel. Energy use – See Section 2. Energy Use Sources. Data series shown in Table 2.9.
Vehicle-miles – 1970-2008: DOT, FHWA, Highway Statistics 2009, Table VM-1 and annual editions back to 1996 and DOT, FHWA, Highway Statistics Summary to 1995. Data series shown in Table 4.1.
2009-2015: See Appendix A, Section 7. Car and Light Truck Shares. Btu per passenger-mile – Car energy use divided by car passenger-miles. Energy use – See Section 2. Energy Use Sources. Data series shown in Table 2.9. Passenger miles – Vehicle miles multiplied by an average load factor.
Vehicle-miles – 1970-2008: DOT, FHWA, Highway Statistics 2009, Table VM-1 and annual editions back to 1996 and DOT, FHWA, Highway Statistics Summary to 1995. Data series shown in Table 4.1.
2009-2015: See Appendix A, Section 7. Car and Light Truck Shares. Load factor – NPTS 1969, 1977, 1983/84, 1990, and 1995; NHTS 2001 and 2009. Data
series shown in Table A.18.

A–29
TRANSPORTATION ENERGY DATA BOOK: EDITION 36—2017
Table A.18 Car Load Factor used to Calculate Passenger-Miles
Year Source Load Factor 1970 1969 NPTS 1.90 1971 Interpolated 1.90 1972 Interpolated 1.90 1973 Interpolated 1.90 1974 Interpolated 1.90 1975 Interpolated 1.90 1976 Interpolated 1.90 1977 1977 NPTS 1.90 1978 Interpolated 1.88 1979 Interpolated 1.87 1980 Interpolated 1.85 1981 Interpolated 1.83 1982 Interpolated 1.82 1983 1983/84 NPTS 1.80 1984 Interpolated 1.77 1985 Interpolated 1.74 1986 Interpolated 1.71 1987 Interpolated 1.69 1988 Interpolated 1.66 1989 Interpolated 1.63 1990 1990 NPTS 1.60 1991 Interpolated 1.60 1992 Interpolated 1.60 1993 Interpolated 1.60 1994 Interpolated 1.60 1995 1995 NPTS 1.60 1996 Interpolated 1.60 1997 Interpolated 1.59 1998 Interpolated 1.59 1999 Interpolated 1.58 2000 Interpolated 1.58 2001 2001 NHTS 1.57 2002 2001 NHTS 1.57 2003 2001 NHTS 1.57 2004 2001 NHTS 1.57 2005 2001 NHTS 1.57 2006 2001 NHTS 1.57 2007 2001 NHTS 1.57 2008 2009 NHTS 1.55 2009 2009 NHTS 1.55 2010 2009 NHTS 1.55 2011 2009 NHTS 1.55 2012 2009 NHTS 1.55 2013 2009 NHTS 1.55 2014 2009 NHTS 1.55 2015 2009 NHTS 1.55

A–30
TRANSPORTATION ENERGY DATA BOOK: EDITION 36—2017
4.2 LIGHT TRUCKS Btu per vehicle-mile – Light truck energy use divided by light truck vehicle miles of travel. Energy use – See Section 2. Energy Use Sources. Data series shown in Table 2.9.
Vehicle-miles – 1970-2008: DOT, FHWA, Highway Statistics 2008, Table VM-1 and annual editions back to 1996 and DOT, FHWA, Highway Statistics Summary to 1995. Data series shown in Table 4.2. 2009-2015: See Appendix A, Section 7. Car and Light Truck Shares.
4.3 Buses 4.3.1 Transit Btu per vehicle-mile – Transit bus energy use divided by transit bus vehicle-miles. Energy use – See Section 2. Energy Use Sources. Data series shown in Table 7.9.
Vehicle-miles – APTA, 2016 Public Transportation Fact Book, Washington, DC, 2016. Data series shown on Table 7.9. Data for 2015 are directly from the U.S. Department of Transportation, Federal Transit Administration, National Transit Database.
Btu per passenger-mile – Transit bus energy use divided by transit bus passenger-miles. Energy use – See Section 2. Energy Use Sources. Data series shown in Table 7.9.
Passenger-miles – APTA, 2016 Public Transportation Fact Book, Washington, DC, 2016. Data series shown on Table 7.9. Data for 2015 are directly from the U.S. Department of Transportation, Federal Transit Administration, National Transit Database.
4.3.2 Intercity Btu per passenger-mile – Data are not available.
Energy use – See Section 2. Energy Use Sources. Because the data past 2000 are not available, the rate of change in bus VMT from FHWA, Highway Statistics 2015, was used to estimate the change in energy use.
Passenger-miles – Data are not available.

A–31
TRANSPORTATION ENERGY DATA BOOK: EDITION 36—2017
5. NONHIGHWAY MODE ENERGY INTENSITIES 5.1 AIR 5.1.1 Certificated Air Carriers Btu per passenger-mile – Certificated air carrier energy use divided by passenger-miles.
Energy use – See Section 2. Energy Use Sources. All of domestic fuel use and half of international fuel use was considered to be domestic use.
Passenger-miles – DOT, BTS, Air Carrier Traffic Statistics, Washington, DC, www.transtats.bts.gov. Pre-1994 data are from various editions of the FAA Statistical Handbook of Aviation (no longer published). Scheduled service passenger-miles of domestic air carriers and half of international air carriers were used to coincide with fuel use.
Note: These data differ from the data in Table 9.2 because that table contains data on ALL domestic AND international air carrier energy use and passenger-miles. 5.1.2 General Aviation Btu per passenger-mile – Data are not available. Energy use – See Section 2. Energy Use Sources. Data series shown in Table 9.3.
Passenger-miles – Data are not available. 5.2 RAIL 5.2.1 Intercity Btu per passenger-mile – Intercity rail energy use divided by passenger-miles. Energy use – See Section 2. Energy Use Sources. Data series shown in Table 9.10. Passenger-miles – AAR, Railroad Facts, 2016 Edition, and previous annual editions. 5.2.2 Transit Btu per passenger-mile – Transit rail energy use divided by passenger-miles. Energy use – See Section 2. Energy Use Sources. Data series shown in Table 9.12.
Passenger-miles – APTA, 2016 Public Transportation Fact Book, Washington, DC, 2016. Data series shown on Table 9.12. Data for 2015 are directly from the U.S. Department of Transportation, Federal Transit Administration, National Transit Database.
A–32
TRANSPORTATION ENERGY DATA BOOK: EDITION 36—2017
5.2.3 Commuter Btu per passenger-mile – Commuter rail energy use divided by passenger-miles. Energy use – See Section 2. Energy Use Sources. Data series shown in Table 9.11.
Passenger-miles – APTA, 2016 Public Transportation Fact Book, Washington, DC, 2016. Data series shown on Table 9.11. Data for 2015 are directly from the U.S. Department of Transportation, Federal Transit Administration, National Transit Database.

A–33
TRANSPORTATION ENERGY DATA BOOK: EDITION 36—2017
6. FREIGHT MODE ENERGY INTENSITIES 6.1 TRUCK Btu per vehicle-mile – Heavy single-unit and combination truck energy use divided by vehicle
miles Energy use – See Section 2. Energy Use Sources (medium/heavy trucks).
Vehicle-miles – DOT, FHWA, Highway Statistics 2015, Table VM-1 and annual editions back to 1996 and DOT, FHWA, Highway Statistics Summary to 1995. Data series is the total of vehicle travel data on Tables 5.1 and 5.2.
6.2 RAIL
Btu per freight car-mile – Class I rail energy use divided by freight car-miles.
Energy use – See Section 2. Energy Use Sources. Data series shown in Table 9.8. Freight car miles – AAR, Railroad Facts, 2016 Edition, Washington, DC, 2016. Data
series shown in Table 9.8.
Btu per ton-mile – Class I rail energy use divided by ton-miles. Energy use – See Section 2. Energy Use Sources. Data series shown in Table 9.8. Ton-miles – AAR, Railroad Facts, 2016 Edition, Washington, DC, 2016. Data series
shown in Table 9.8. 6.3 WATER Btu per ton-mile – Domestic waterborne commerce energy use on taxable waterways divided
by ton-miles on taxable waterways. Energy use – Modeled by Chrisman A. Dager, University of Tennessee, Knoxville, using
Waterborne Commerce Statistics Center detail records and annual IRS reports on the Inland Waterway Trust Fund tax on diesel fuel used on the inland waterway.
Note: These data are not available for 2015. Ton-miles – Based on detailed records from the U.S. Department of the Army, Army
Corps of Engineers, Waterborne Commerce Statistics Center. Includes only ton-miles on taxable waterways.
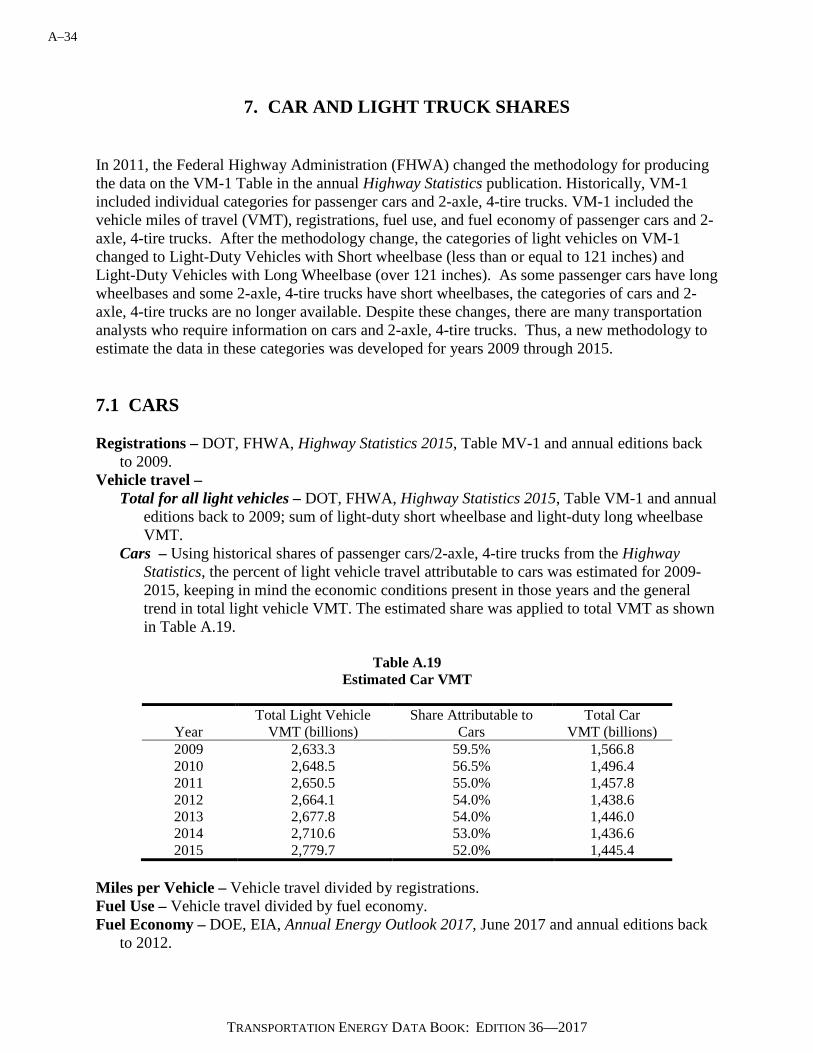
A–34
TRANSPORTATION ENERGY DATA BOOK: EDITION 36—2017
7. CAR AND LIGHT TRUCK SHARES In 2011, the Federal Highway Administration (FHWA) changed the methodology for producing the data on the VM-1 Table in the annual Highway Statistics publication. Historically, VM-1 included individual categories for passenger cars and 2-axle, 4-tire trucks. VM-1 included the vehicle miles of travel (VMT), registrations, fuel use, and fuel economy of passenger cars and 2-axle, 4-tire trucks. After the methodology change, the categories of light vehicles on VM-1 changed to Light-Duty Vehicles with Short wheelbase (less than or equal to 121 inches) and Light-Duty Vehicles with Long Wheelbase (over 121 inches). As some passenger cars have long wheelbases and some 2-axle, 4-tire trucks have short wheelbases, the categories of cars and 2-axle, 4-tire trucks are no longer available. Despite these changes, there are many transportation analysts who require information on cars and 2-axle, 4-tire trucks. Thus, a new methodology to estimate the data in these categories was developed for years 2009 through 2015. 7.1 CARS Registrations – DOT, FHWA, Highway Statistics 2015, Table MV-1 and annual editions back
to 2009. Vehicle travel –
Total for all light vehicles – DOT, FHWA, Highway Statistics 2015, Table VM-1 and annual editions back to 2009; sum of light-duty short wheelbase and light-duty long wheelbase VMT.
Cars – Using historical shares of passenger cars/2-axle, 4-tire trucks from the Highway Statistics, the percent of light vehicle travel attributable to cars was estimated for 2009-2015, keeping in mind the economic conditions present in those years and the general trend in total light vehicle VMT. The estimated share was applied to total VMT as shown in Table A.19.
Table A.19
Estimated Car VMT
Year Total Light Vehicle
VMT (billions) Share Attributable to
Cars Total Car
VMT (billions) 2009 2,633.3 59.5% 1,566.8 2010 2,648.5 56.5% 1,496.4 2011 2,650.5 55.0% 1,457.8 2012 2,664.1 54.0% 1,438.6 2013 2,677.8 54.0% 1,446.0 2014 2,710.6 53.0% 1,436.6 2015 2,779.7 52.0% 1,445.4
Miles per Vehicle – Vehicle travel divided by registrations. Fuel Use – Vehicle travel divided by fuel economy. Fuel Economy – DOE, EIA, Annual Energy Outlook 2017, June 2017 and annual editions back
to 2012.
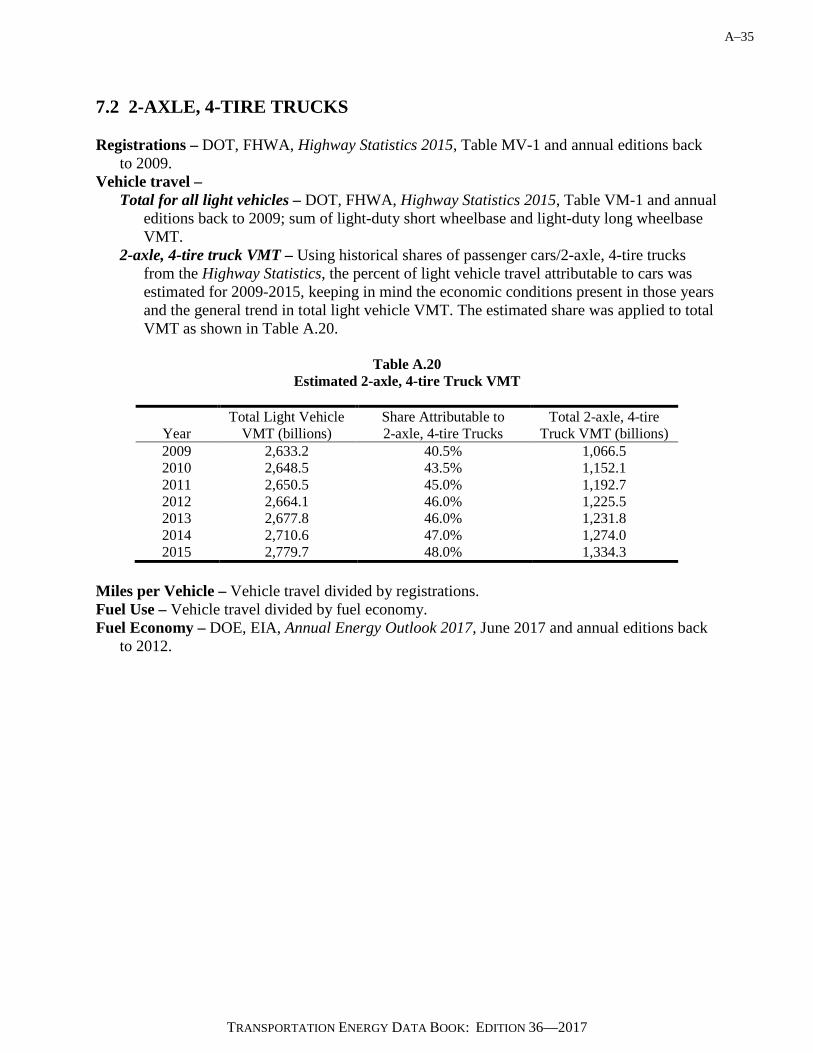
A–35
TRANSPORTATION ENERGY DATA BOOK: EDITION 36—2017
7.2 2-AXLE, 4-TIRE TRUCKS Registrations – DOT, FHWA, Highway Statistics 2015, Table MV-1 and annual editions back
to 2009. Vehicle travel –
Total for all light vehicles – DOT, FHWA, Highway Statistics 2015, Table VM-1 and annual editions back to 2009; sum of light-duty short wheelbase and light-duty long wheelbase VMT.
2-axle, 4-tire truck VMT – Using historical shares of passenger cars/2-axle, 4-tire trucks from the Highway Statistics, the percent of light vehicle travel attributable to cars was estimated for 2009-2015, keeping in mind the economic conditions present in those years and the general trend in total light vehicle VMT. The estimated share was applied to total VMT as shown in Table A.20.
Table A.20
Estimated 2-axle, 4-tire Truck VMT
Year Total Light Vehicle
VMT (billions) Share Attributable to 2-axle, 4-tire Trucks
Total 2-axle, 4-tire Truck VMT (billions)
2009 2,633.2 40.5% 1,066.5 2010 2,648.5 43.5% 1,152.1 2011 2,650.5 45.0% 1,192.7 2012 2,664.1 46.0% 1,225.5 2013 2,677.8 46.0% 1,231.8 2014 2,710.6 47.0% 1,274.0 2015 2,779.7 48.0% 1,334.3
Miles per Vehicle – Vehicle travel divided by registrations. Fuel Use – Vehicle travel divided by fuel economy. Fuel Economy – DOE, EIA, Annual Energy Outlook 2017, June 2017 and annual editions back
to 2012.

A–36
TRANSPORTATION ENERGY DATA BOOK: EDITION 36—2017

B–1
TRANSPORTATION ENERGY DATA BOOK: EDITION 36—2017
CONVERSIONS

B–2
TRANSPORTATION ENERGY DATA BOOK: EDITION 36—2017

B–3
TRANSPORTATION ENERGY DATA BOOK: EDITION 36—2017
CONVERSIONS
A Note about Heating Values
The heat content of a fuel is the quantity of energy released by burning a unit amount of
that fuel. However, this value is not absolute and can vary according to several factors. For
example, empirical formulae for determining the heating value of liquid fuels depend on the fuels'
American Petroleum Institute (API) gravity. The API gravity varies depending on the percent by
weight of the chemical constituents and impurities in the fuel, both of which are affected by the
combination of raw materials used to produce the fuel and by the type of manufacturing process.
Temperature and climatic conditions are also factors.
Because of these variations, the heating values in Table B.4 may differ from values in other
publications. The figures in this report are representative or average values, not absolute ones.
The gross (higher) heating values used here agree with those used by the Energy Information
Administration (EIA).
Heating values fall into two categories, usually referred to as “higher” (or gross) and
“lower” (or net). If the products of fuel combustion are cooled back to the initial fuel-air or fuel-
oxidizer mixture temperature and the water formed during combustion is condensed, the energy
released by the process is the higher (gross) heating value. If the products of combustion are
cooled to the initial fuel-air temperature, but the water is considered to remain as a vapor, the
energy released by the process is the lower (net) heating value. Usually the difference between
the gross and net heating values for fuels used in transportation is around 5 to 8 percent; however,
it is important to be consistent in their use.
The Transportation Energy Data Book has always used gross heating values for fuel
conversion.

B–4
TRANSPORTATION ENERGY DATA BOOK: EDITION 36—2017
Table B.1 Hydrogen Heat Content
1 kilogram hydrogen =
Higher heating value Lower heating value 134,200 Btu 113,400 Btu 39.3 kWhr 33.2 kWhr 141,600 kJ 119,600 kJ
33,800 kCal 28,560 kCal
Table B.2
Hydrogen Conversions
Weight Gas Liquid
Pounds
(lb) Kilograms
(kg)
Standard cubic feet
(SCF)
Normal cubic meter
(Nm3) Gallons
(gal) Liters
(L) 1 lb 1.0 0.4536 192.00 5.047 1.6928 6.408 1 kg 2.205 1.0 423.3 11.126 3.733 14.128 1 SCF gas 0.005209 0.002363 1.0 0.02628 0.00882 0.0339 1 Nm3 gas 0.19815 0.08988 38.04 1.0 0.3355 1.2699 1 gal liquid 0.5906 0.2679 113.41 2.981 1.0 3.785 1 L liquid 0.15604 0.07078 29.99 0.77881 0.2642 1.0
Table B.3 Pressure Conversions
Bar Atmosphere lb/in2 (or psi) Bar 1.0 0.987 14.5 Atmosphere 1.013 1.0 14.696 lb/in2 (or psi) 0.0689 0.0680 1.0
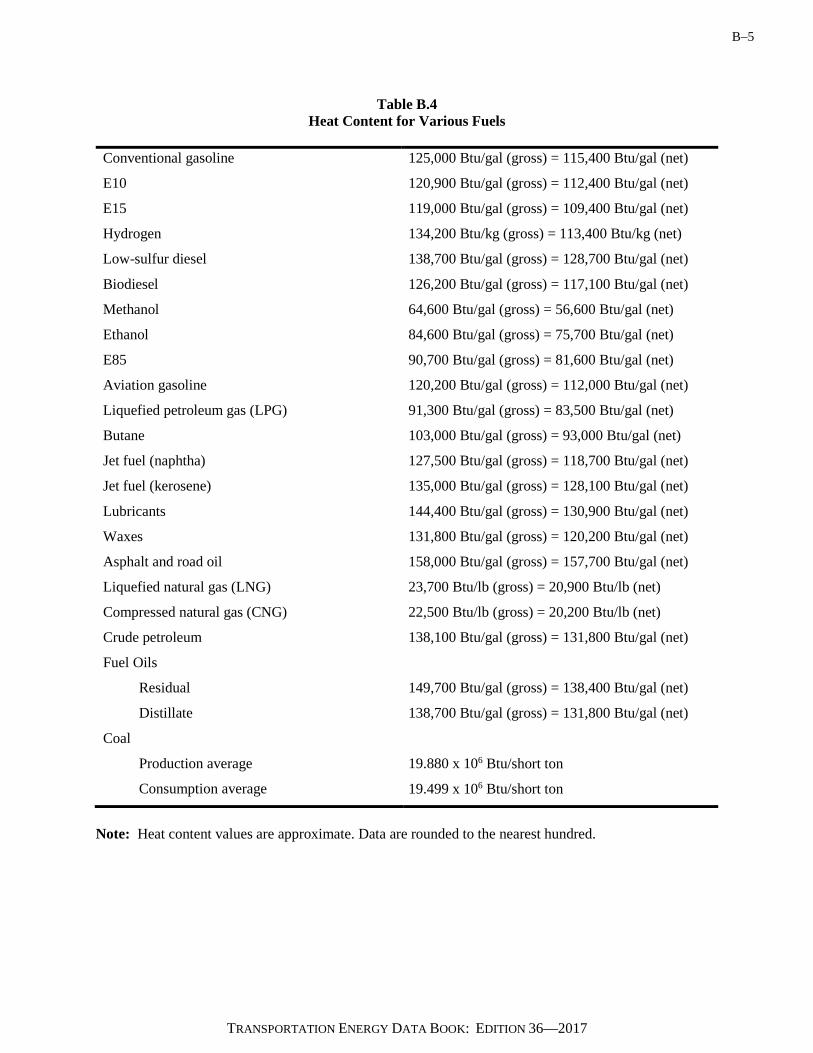
B–5
TRANSPORTATION ENERGY DATA BOOK: EDITION 36—2017
Table B.4 Heat Content for Various Fuels
Conventional gasoline
E10
E15
Hydrogen
Low-sulfur diesel
Biodiesel
Methanol
Ethanol
E85
Aviation gasoline
Liquefied petroleum gas (LPG)
Butane
Jet fuel (naphtha)
Jet fuel (kerosene)
Lubricants
Waxes
Asphalt and road oil
Liquefied natural gas (LNG)
Compressed natural gas (CNG)
Crude petroleum
Fuel Oils
Residual
Distillate
Coal
Production average
Consumption average
125,000 Btu/gal (gross) = 115,400 Btu/gal (net)
120,900 Btu/gal (gross) = 112,400 Btu/gal (net)
119,000 Btu/gal (gross) = 109,400 Btu/gal (net)
134,200 Btu/kg (gross) = 113,400 Btu/kg (net)
138,700 Btu/gal (gross) = 128,700 Btu/gal (net)
126,200 Btu/gal (gross) = 117,100 Btu/gal (net)
64,600 Btu/gal (gross) = 56,600 Btu/gal (net)
84,600 Btu/gal (gross) = 75,700 Btu/gal (net)
90,700 Btu/gal (gross) = 81,600 Btu/gal (net)
120,200 Btu/gal (gross) = 112,000 Btu/gal (net)
91,300 Btu/gal (gross) = 83,500 Btu/gal (net)
103,000 Btu/gal (gross) = 93,000 Btu/gal (net)
127,500 Btu/gal (gross) = 118,700 Btu/gal (net)
135,000 Btu/gal (gross) = 128,100 Btu/gal (net)
144,400 Btu/gal (gross) = 130,900 Btu/gal (net)
131,800 Btu/gal (gross) = 120,200 Btu/gal (net)
158,000 Btu/gal (gross) = 157,700 Btu/gal (net)
23,700 Btu/lb (gross) = 20,900 Btu/lb (net)
22,500 Btu/lb (gross) = 20,200 Btu/lb (net)
138,100 Btu/gal (gross) = 131,800 Btu/gal (net)
149,700 Btu/gal (gross) = 138,400 Btu/gal (net)
138,700 Btu/gal (gross) = 131,800 Btu/gal (net)
19.880 x 10⁶ Btu/short ton
19.499 x 10⁶ Btu/short ton
Note: Heat content values are approximate. Data are rounded to the nearest hundred.

B–6
TRANSPORTATION ENERGY DATA BOOK: EDITION 36—2017
Table B.5 Fuel Equivalents
1 million bbl crude oil/day
= 0.365 billion bbl crude oil/year = 2.089 quadrillion Btu/year = 107.110 million short tons coal/year = 97.170 million metric tons coal/year = 2.016 trillion ft3 natural gas/year = 2,203 petajoules/year
1 billion bbl crude oil/year
= 2.740 million bbl crude oil/day = 5.722 quadrillion Btu/year = 293.451 million short tons coal/year = 266.219 million metric tons coal/year = 5.523 trillion ft3 natural gas/year = 6,037 petajoules/year
1 quadrillion Btu/year
= 8.000 million gasoline gallon equivalents = 0.479 million bbl crude oil/day = 174.764 million bbl crude oil/year = 51.285 million short tons coal/year = 46.525 million metric tons coal/year = 965.251 billion ft3 natural gas/year = 1,055 petajoules/year
1 billion short tons coal/year
= 0.907 billion metric tons coal/year = 9.336 million bbl crude oil/day = 3.408 billion bbl crude oil/year = 19.499 quadrillion Btu/year = 18.821 trillion ft3 natural gas/year = 20,572 petajoules/year
1 billion metric tons coal/year
= 1.102 billion short tons coal/year = 8.470 million bbl crude oil/day = 3.091 billion bbl crude oil/year = 17.689 quadrillion btu/year = 17.075 trillion ft3 natural gas/year = 18,662 petajoules/year
1 trillion ft3 natural gas/year
= 0.496 million bbl crude oil/day = 0.181 billion bbl crude oil/year = 1.036 quadrillion Btu/year = 53.131 million short tons coal/year = 48.200 million metric tons coal/year = 1,093 petajoules/year
1 petajoule/year
= 453.844 bbl crude oil/day = 165.653 thousand bbl crude oil/year = 0.948 trillion Btu/year = 48.661 thousand short tons coal/year = 44.100 thousand metric tons coal/year = 0.915 billion ft3 natural gas/year
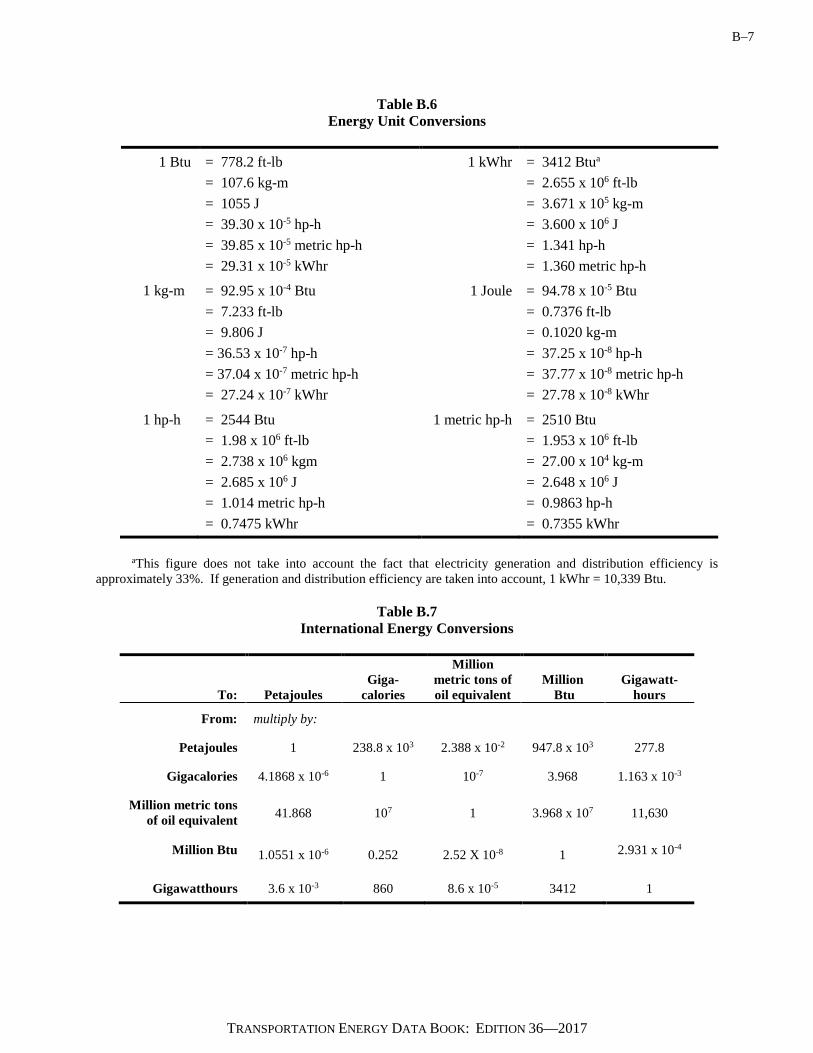
B–7
TRANSPORTATION ENERGY DATA BOOK: EDITION 36—2017
Table B.6 Energy Unit Conversions
1 Btu = 778.2 ft-lb
= 107.6 kg-m = 1055 J = 39.30 x 10⁻⁵ hp-h = 39.85 x 10⁻⁵ metric hp-h = 29.31 x 10⁻⁵ kWhr
1 kWhr
= 3412 Btua
= 2.655 x 106 ft-lb = 3.671 x 10⁵ kg-m = 3.600 x 10⁶ J = 1.341 hp-h = 1.360 metric hp-h
1 kg-m
= 92.95 x 10⁻⁴ Btu = 7.233 ft-lb = 9.806 J = 36.53 x 10⁻⁷ hp-h = 37.04 x 10⁻⁷ metric hp-h = 27.24 x 10⁻⁷ kWhr
1 Joule = 94.78 x 10⁻⁵ Btu = 0.7376 ft-lb = 0.1020 kg-m = 37.25 x 10⁻⁸ hp-h = 37.77 x 10⁻⁸ metric hp-h = 27.78 x 10⁻⁸ kWhr
1 hp-h = 2544 Btu = 1.98 x 106 ft-lb = 2.738 x 10⁶ kgm = 2.685 x 10⁶ J = 1.014 metric hp-h = 0.7475 kWhr
1 metric hp-h = 2510 Btu = 1.953 x 106 ft-lb = 27.00 x 10⁴ kg-m = 2.648 x 10⁶ J = 0.9863 hp-h = 0.7355 kWhr
aThis figure does not take into account the fact that electricity generation and distribution efficiency is approximately 33%. If generation and distribution efficiency are taken into account, 1 kWhr = 10,339 Btu.
Table B.7 International Energy Conversions
To: Petajoules Giga-
calories
Million metric tons of oil equivalent
Million Btu
Gigawatt-hours
From: multiply by:
Petajoules 1 238.8 x 10³ 2.388 x 10⁻² 947.8 x 10³ 277.8
Gigacalories 4.1868 x 10⁻⁶ 1 10-7 3.968 1.163 x 10⁻³
Million metric tons of oil equivalent 41.868 107 1 3.968 x 10⁷ 11,630
Million Btu 1.0551 x 10⁻⁶ 0.252 2.52 X 10⁻⁸ 1 2.931 x 10⁻⁴
Gigawatthours 3.6 x 10⁻³ 860 8.6 x 10⁻⁵ 3412 1
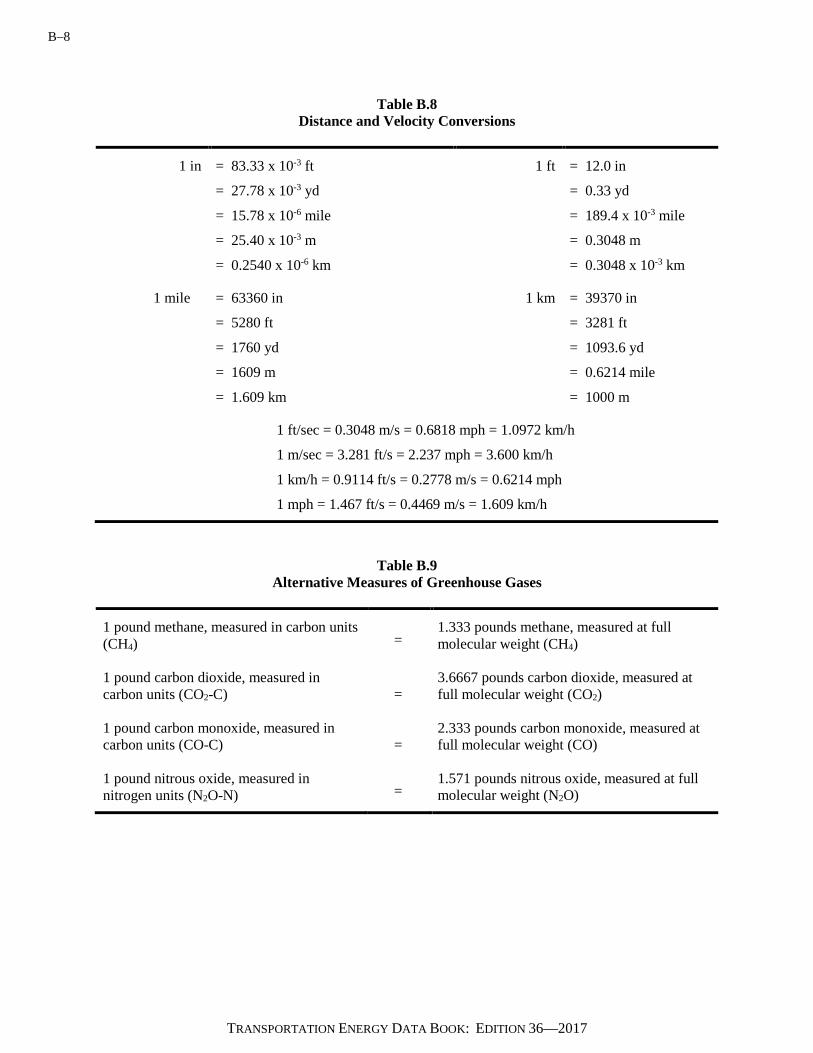
B–8
TRANSPORTATION ENERGY DATA BOOK: EDITION 36—2017
Table B.8 Distance and Velocity Conversions
1 in = 83.33 x 10⁻³ ft
= 27.78 x 10⁻³ yd
= 15.78 x 10⁻⁶ mile
= 25.40 x 10⁻³ m
= 0.2540 x 10⁻⁶ km
1 ft = 12.0 in
= 0.33 yd
= 189.4 x 10⁻³ mile
= 0.3048 m
= 0.3048 x 10⁻³ km
1 mile = 63360 in
= 5280 ft
= 1760 yd
= 1609 m
= 1.609 km
1 km = 39370 in
= 3281 ft
= 1093.6 yd
= 0.6214 mile
= 1000 m
1 ft/sec = 0.3048 m/s = 0.6818 mph = 1.0972 km/h
1 m/sec = 3.281 ft/s = 2.237 mph = 3.600 km/h
1 km/h = 0.9114 ft/s = 0.2778 m/s = 0.6214 mph
1 mph = 1.467 ft/s = 0.4469 m/s = 1.609 km/h
Table B.9 Alternative Measures of Greenhouse Gases
1 pound methane, measured in carbon units (CH4)
= 1.333 pounds methane, measured at full molecular weight (CH4)
1 pound carbon dioxide, measured in carbon units (CO2-C)
= 3.6667 pounds carbon dioxide, measured at full molecular weight (CO2)
1 pound carbon monoxide, measured in carbon units (CO-C)
= 2.333 pounds carbon monoxide, measured at full molecular weight (CO)
1 pound nitrous oxide, measured in nitrogen units (N2O-N) =
1.571 pounds nitrous oxide, measured at full molecular weight (N2O)
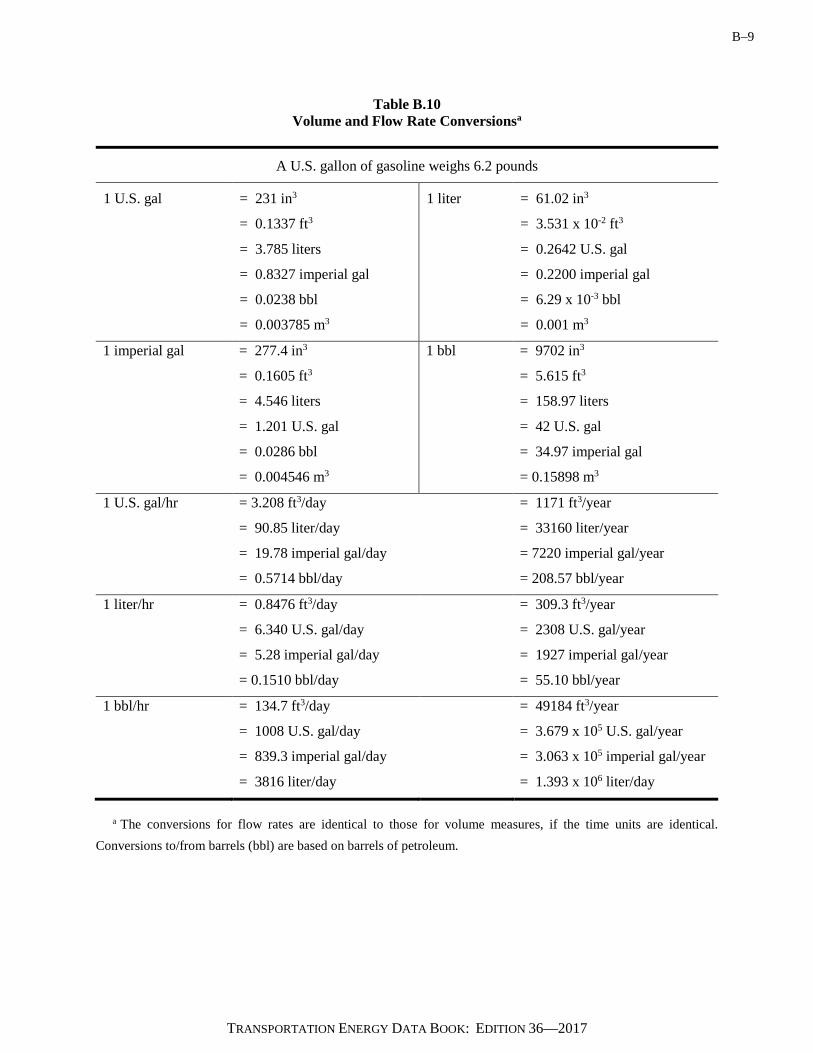
B–9
TRANSPORTATION ENERGY DATA BOOK: EDITION 36—2017
Table B.10 Volume and Flow Rate Conversionsa
A U.S. gallon of gasoline weighs 6.2 pounds
1 U.S. gal = 231 in3
= 0.1337 ft3
= 3.785 liters
= 0.8327 imperial gal
= 0.0238 bbl
= 0.003785 m3
1 liter = 61.02 in3
= 3.531 x 10⁻² ft3
= 0.2642 U.S. gal
= 0.2200 imperial gal
= 6.29 x 10⁻³ bbl
= 0.001 m3
1 imperial gal = 277.4 in3
= 0.1605 ft3
= 4.546 liters
= 1.201 U.S. gal
= 0.0286 bbl
= 0.004546 m3
1 bbl = 9702 in3
= 5.615 ft3
= 158.97 liters
= 42 U.S. gal
= 34.97 imperial gal
= 0.15898 m3
1 U.S. gal/hr = 3.208 ft3/day
= 90.85 liter/day
= 19.78 imperial gal/day
= 0.5714 bbl/day
= 1171 ft3/year
= 33160 liter/year
= 7220 imperial gal/year
= 208.57 bbl/year
1 liter/hr = 0.8476 ft3/day
= 6.340 U.S. gal/day
= 5.28 imperial gal/day
= 0.1510 bbl/day
= 309.3 ft3/year
= 2308 U.S. gal/year
= 1927 imperial gal/year
= 55.10 bbl/year
1 bbl/hr = 134.7 ft3/day
= 1008 U.S. gal/day
= 839.3 imperial gal/day
= 3816 liter/day
= 49184 ft3/year
= 3.679 x 10⁵ U.S. gal/year
= 3.063 x 10⁵ imperial gal/year
= 1.393 x 10⁶ liter/day
a The conversions for flow rates are identical to those for volume measures, if the time units are identical. Conversions to/from barrels (bbl) are based on barrels of petroleum.
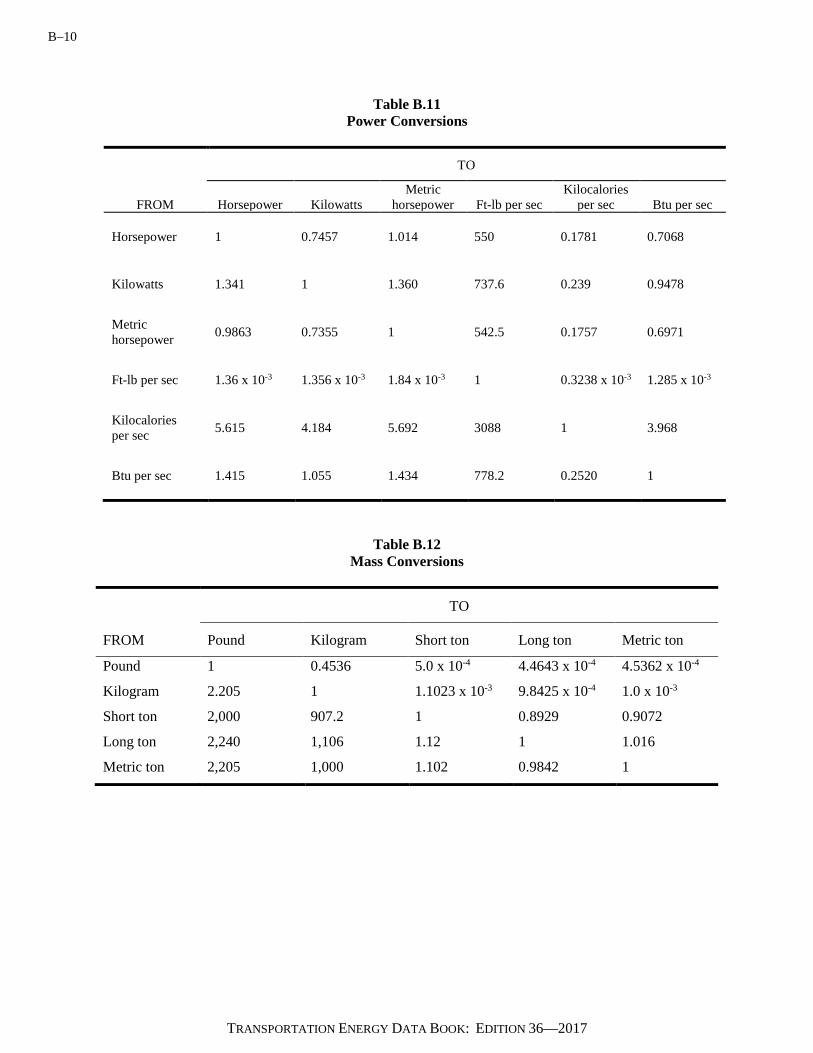
B–10
TRANSPORTATION ENERGY DATA BOOK: EDITION 36—2017
Table B.11 Power Conversions
TO
FROM Horsepower Kilowatts Metric
horsepower Ft-lb per sec Kilocalories
per sec Btu per sec
Horsepower 1 0.7457 1.014 550 0.1781 0.7068
Kilowatts 1.341 1 1.360 737.6 0.239 0.9478
Metric horsepower 0.9863 0.7355 1 542.5 0.1757 0.6971
Ft-lb per sec 1.36 x 10⁻³ 1.356 x 10⁻³ 1.84 x 10⁻³ 1 0.3238 x 10⁻³ 1.285 x 10⁻³
Kilocalories per sec 5.615 4.184 5.692 3088 1 3.968
Btu per sec 1.415 1.055 1.434 778.2 0.2520 1
Table B.12 Mass Conversions
TO
FROM Pound Kilogram Short ton Long ton Metric ton
Pound 1 0.4536 5.0 x 10⁻⁴ 4.4643 x 10⁻⁴ 4.5362 x 10⁻⁴
Kilogram 2.205 1 1.1023 x 10⁻³ 9.8425 x 10⁻⁴ 1.0 x 10⁻³
Short ton 2,000 907.2 1 0.8929 0.9072
Long ton 2,240 1,106 1.12 1 1.016
Metric ton 2,205 1,000 1.102 0.9842 1
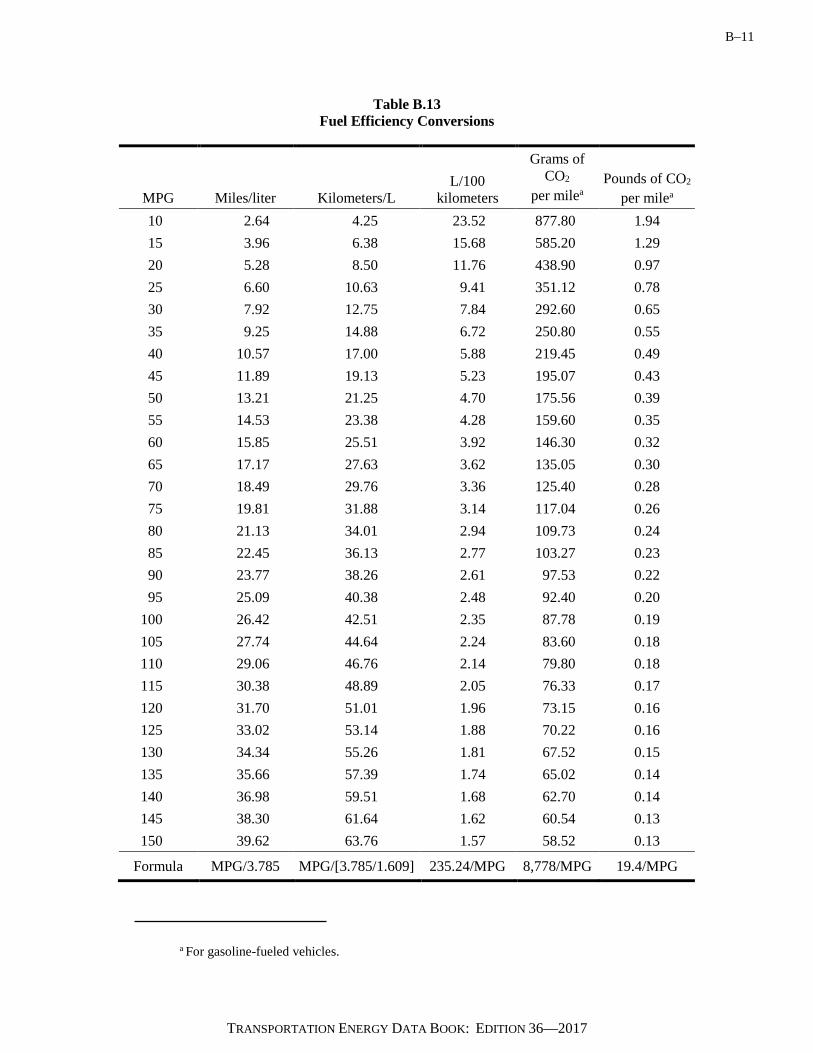
B–11
TRANSPORTATION ENERGY DATA BOOK: EDITION 36—2017
Table B.13 Fuel Efficiency Conversions
MPG
Miles/liter
Kilometers/L
L/100
kilometers
Grams of CO2
per milea
Pounds of CO2
per milea 10 2.64 4.25 23.52 877.80 1.94 15 3.96 6.38 15.68 585.20 1.29 20 5.28 8.50 11.76 438.90 0.97 25 6.60 10.63 9.41 351.12 0.78 30 7.92 12.75 7.84 292.60 0.65 35 9.25 14.88 6.72 250.80 0.55 40 10.57 17.00 5.88 219.45 0.49 45 11.89 19.13 5.23 195.07 0.43 50 13.21 21.25 4.70 175.56 0.39 55 14.53 23.38 4.28 159.60 0.35 60 15.85 25.51 3.92 146.30 0.32 65 17.17 27.63 3.62 135.05 0.30 70 18.49 29.76 3.36 125.40 0.28 75 19.81 31.88 3.14 117.04 0.26 80 21.13 34.01 2.94 109.73 0.24 85 22.45 36.13 2.77 103.27 0.23 90 23.77 38.26 2.61 97.53 0.22 95 25.09 40.38 2.48 92.40 0.20 100 26.42 42.51 2.35 87.78 0.19 105 27.74 44.64 2.24 83.60 0.18 110 29.06 46.76 2.14 79.80 0.18 115 30.38 48.89 2.05 76.33 0.17 120 31.70 51.01 1.96 73.15 0.16 125 33.02 53.14 1.88 70.22 0.16 130 34.34 55.26 1.81 67.52 0.15 135 35.66 57.39 1.74 65.02 0.14 140 36.98 59.51 1.68 62.70 0.14 145 38.30 61.64 1.62 60.54 0.13 150 39.62 63.76 1.57 58.52 0.13
Formula MPG/3.785 MPG/[3.785/1.609] 235.24/MPG 8,778/MPG 19.4/MPG
a For gasoline-fueled vehicles.
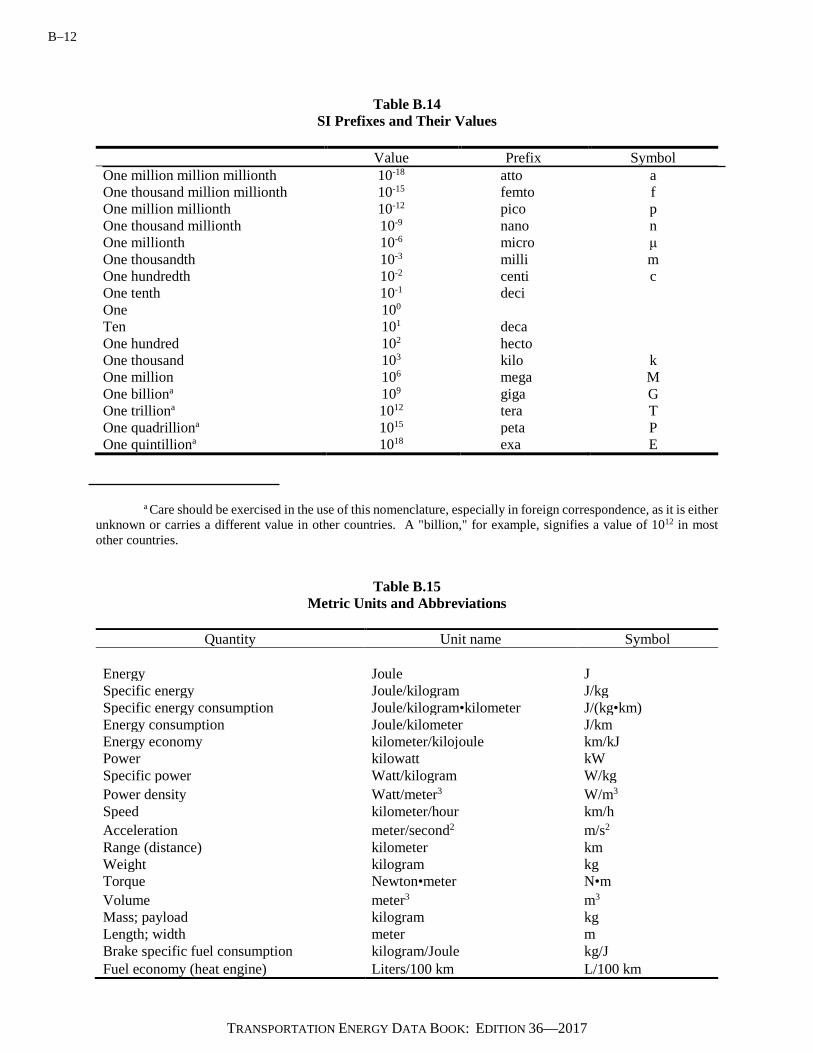
B–12
TRANSPORTATION ENERGY DATA BOOK: EDITION 36—2017
Table B.14 SI Prefixes and Their Values
Value Prefix Symbol One million million millionth 10-18 atto a One thousand million millionth 10-15 femto f One million millionth 10-12 pico p One thousand millionth 10-9 nano n One millionth 10-6 micro μ One thousandth 10-3 milli m One hundredth 10-2 centi c One tenth 10-1 deci One 100 Ten 101 deca One hundred 102 hecto One thousand 103 kilo k One million 106 mega M One billiona 109 giga G One trilliona 1012 tera T One quadrilliona 1015 peta P One quintilliona 1018 exa E
a Care should be exercised in the use of this nomenclature, especially in foreign correspondence, as it is either unknown or carries a different value in other countries. A "billion," for example, signifies a value of 1012 in most other countries.
Table B.15 Metric Units and Abbreviations
Quantity Unit name Symbol
Energy Joule J Specific energy Joule/kilogram J/kg Specific energy consumption Joule/kilogram•kilometer J/(kg•km) Energy consumption Joule/kilometer J/km Energy economy kilometer/kilojoule km/kJ Power kilowatt kW Specific power Watt/kilogram W/kg Power density Watt/meter3 W/m3 Speed kilometer/hour km/h Acceleration meter/second2 m/s2 Range (distance) kilometer km Weight kilogram kg Torque Newton•meter N•m Volume meter3 m3 Mass; payload kilogram kg Length; width meter m Brake specific fuel consumption kilogram/Joule kg/J Fuel economy (heat engine) Liters/100 km L/100 km
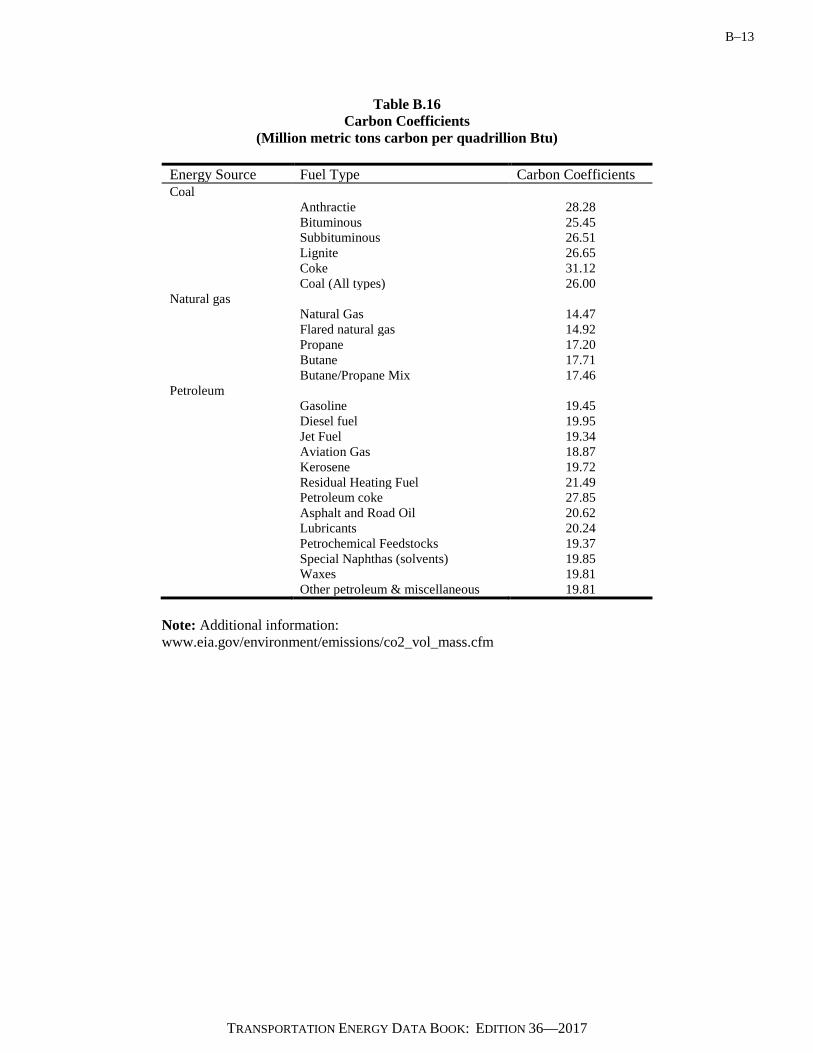
B–13
TRANSPORTATION ENERGY DATA BOOK: EDITION 36—2017
Table B.16 Carbon Coefficients
(Million metric tons carbon per quadrillion Btu)
Energy Source Fuel Type Carbon Coefficients Coal Anthractie 28.28 Bituminous 25.45 Subbituminous 26.51 Lignite 26.65 Coke 31.12 Coal (All types) 26.00 Natural gas Natural Gas 14.47 Flared natural gas 14.92 Propane 17.20 Butane 17.71 Butane/Propane Mix 17.46 Petroleum Gasoline 19.45 Diesel fuel 19.95 Jet Fuel 19.34 Aviation Gas 18.87 Kerosene 19.72 Residual Heating Fuel 21.49 Petroleum coke 27.85 Asphalt and Road Oil 20.62 Lubricants 20.24 Petrochemical Feedstocks 19.37 Special Naphthas (solvents) 19.85 Waxes 19.81 Other petroleum & miscellaneous 19.81
Note: Additional information: www.eia.gov/environment/emissions/co2_vol_mass.cfm

B–14
TRANSPORTATION ENERGY DATA BOOK: EDITION 36—2017
Conversion of Constant Dollar Values Many types of information in this data book are expressed in dollars. Generally, constant
dollars are used–that is, dollars of a fixed value for a specific year, such as 2010 dollars.
Converting current dollars to constant dollars, or converting constant dollars for one year to
constant dollars for another year, requires conversion factors (Table B.17 and Table B.18). Table
B.17 shows conversion factors for the Consumer Price Index inflation factors. Table B.18 shows
conversion factors using the Gross National Product Implicit Price Deflator.

B–15
TRANSPORTATION ENERGY DATA BOOK: EDITION 36—2017
Table B.17 Consumer Price Inflation (CPI) Index
From: 1970 1971 1972 1973 1974 1975 1976 1977 1978 1979 1970 1.000 1.044 1.077 1.144 1.271 1.387 1.466 1.562 1.680 1.871 1971 0.958 1.000 1.032 1.096 1.217 1.328 1.405 1.496 1.610 1.793 1972 0.928 0.969 1.000 1.062 1.179 1.287 1.361 1.450 1.560 1.737 1973 0.874 0.912 0.941 1.000 1.110 1.212 1.282 1.365 1.468 1.635 1974 0.787 0.822 0.848 0.901 1.000 1.091 1.154 1.229 1.323 1.473 1975 0.721 0.753 0.777 0.825 0.916 1.000 1.058 1.126 1.212 1.349 1976 0.682 0.712 0.735 0.780 0.866 0.946 1.000 1.065 1.146 1.276 1977 0.640 0.668 0.690 0.733 0.814 0.888 0.939 1.000 1.076 1.198 1978 0.595 0.621 0.641 0.681 0.756 0.825 0.873 0.929 1.000 1.113 1979 0.534 0.558 0.576 0.612 0.679 0.741 0.784 0.835 0.898 1.000 1980 0.471 0.492 0.507 0.539 0.598 0.653 0.691 0.735 0.791 0.881 1981 0.427 0.446 0.460 0.488 0.542 0.592 0.626 0.667 0.717 0.799 1982 0.402 0.420 0.433 0.460 0.511 0.558 0.590 0.628 0.676 0.752 1983 0.390 0.407 0.420 0.446 0.495 0.540 0.571 0.608 0.655 0.729 1984 0.373 0.390 0.402 0.427 0.474 0.518 0.548 0.583 0.628 0.699 1985 0.361 0.376 0.388 0.413 0.458 0.500 0.529 0.563 0.606 0.675 1986 0.354 0.370 0.381 0.405 0.450 0.491 0.519 0.553 0.595 0.662 1987 0.342 0.357 0.368 0.391 0.434 0.474 0.501 0.533 0.574 0.639 1988 0.328 0.342 0.353 0.375 0.417 0.455 0.481 0.512 0.551 0.614 1989 0.313 0.327 0.337 0.358 0.398 0.434 0.459 0.489 0.526 0.585 1990 0.297 0.310 0.320 0.340 0.377 0.412 0.435 0.464 0.499 0.555 1991 0.285 0.297 0.307 0.326 0.362 0.395 0.418 0.445 0.479 0.533 1992 0.277 0.289 0.298 0.316 0.351 0.383 0.406 0.432 0.465 0.517 1993 0.269 0.280 0.289 0.307 0.341 0.372 0.394 0.419 0.451 0.502 1994 0.262 0.273 0.282 0.300 0.333 0.363 0.384 0.409 0.440 0.490 1995 0.255 0.266 0.274 0.291 0.323 0.353 0.373 0.398 0.428 0.476 1996 0.247 0.258 0.266 0.283 0.314 0.343 0.363 0.386 0.416 0.463 1997 0.242 0.252 0.260 0.277 0.307 0.335 0.355 0.378 0.406 0.452 1998 0.238 0.248 0.256 0.272 0.302 0.330 0.349 0.372 0.400 0.445 1999 0.233 0.243 0.251 0.267 0.296 0.323 0.342 0.364 0.391 0.436 2000 0.225 0.235 0.243 0.258 0.286 0.312 0.330 0.352 0.379 0.422 2001 0.219 0.229 0.236 0.251 0.278 0.304 0.321 0.342 0.368 0.410 2002 0.216 0.225 0.232 0.247 0.274 0.299 0.316 0.337 0.362 0.404 2003 0.211 0.220 0.227 0.241 0.268 0.292 0.309 0.329 0.354 0.395 2004 0.205 0.214 0.221 0.235 0.261 0.285 0.301 0.321 0.345 0.384 2005 0.199 0.207 0.214 0.227 0.252 0.275 0.291 0.310 0.334 0.372 2006 0.192 0.201 0.207 0.220 0.245 0.267 0.282 0.301 0.323 0.360 2007 0.187 0.195 0.202 0.214 0.238 0.259 0.274 0.292 0.314 0.350 2008 0.180 0.188 0.194 0.206 0.229 0.250 0.264 0.281 0.303 0.337 2009 0.181 0.189 0.195 0.207 0.230 0.251 0.265 0.282 0.304 0.338 2010 0.178 0.186 0.192 0.204 0.226 0.247 0.261 0.278 0.299 0.333 2011 0.172 0.180 0.186 0.197 0.219 0.239 0.253 0.269 0.290 0.323 2012 0.169 0.176 0.182 0.193 0.215 0.234 0.248 0.264 0.284 0.316 2013 0.167 0.174 0.179 0.191 0.212 0.231 0.244 0.260 0.280 0.312 2014 0.164 0.171 0.177 0.188 0.208 0.227 0.240 0.256 0.275 0.307 2015 0.164 0.171 0.176 0.187 0.208 0.227 0.240 0.256 0.275 0.306
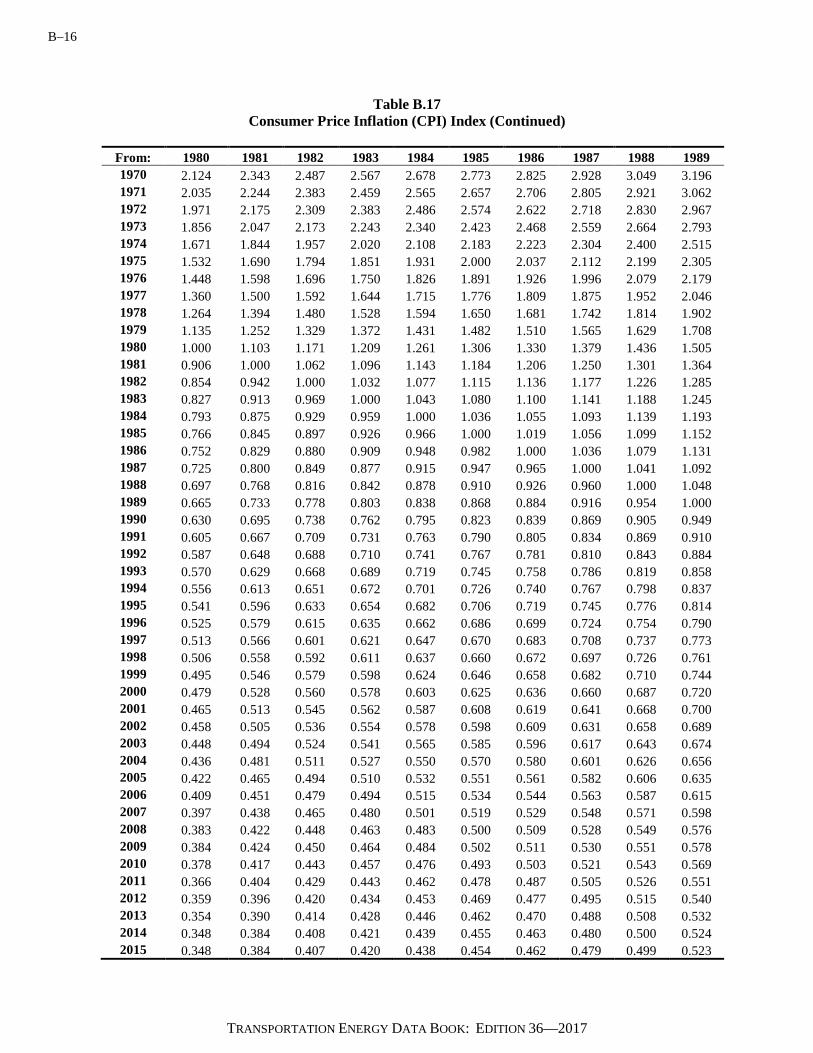
B–16
TRANSPORTATION ENERGY DATA BOOK: EDITION 36—2017
Table B.17 Consumer Price Inflation (CPI) Index (Continued)
From: 1980 1981 1982 1983 1984 1985 1986 1987 1988 1989 1970 2.124 2.343 2.487 2.567 2.678 2.773 2.825 2.928 3.049 3.196 1971 2.035 2.244 2.383 2.459 2.565 2.657 2.706 2.805 2.921 3.062 1972 1.971 2.175 2.309 2.383 2.486 2.574 2.622 2.718 2.830 2.967 1973 1.856 2.047 2.173 2.243 2.340 2.423 2.468 2.559 2.664 2.793 1974 1.671 1.844 1.957 2.020 2.108 2.183 2.223 2.304 2.400 2.515 1975 1.532 1.690 1.794 1.851 1.931 2.000 2.037 2.112 2.199 2.305 1976 1.448 1.598 1.696 1.750 1.826 1.891 1.926 1.996 2.079 2.179 1977 1.360 1.500 1.592 1.644 1.715 1.776 1.809 1.875 1.952 2.046 1978 1.264 1.394 1.480 1.528 1.594 1.650 1.681 1.742 1.814 1.902 1979 1.135 1.252 1.329 1.372 1.431 1.482 1.510 1.565 1.629 1.708 1980 1.000 1.103 1.171 1.209 1.261 1.306 1.330 1.379 1.436 1.505 1981 0.906 1.000 1.062 1.096 1.143 1.184 1.206 1.250 1.301 1.364 1982 0.854 0.942 1.000 1.032 1.077 1.115 1.136 1.177 1.226 1.285 1983 0.827 0.913 0.969 1.000 1.043 1.080 1.100 1.141 1.188 1.245 1984 0.793 0.875 0.929 0.959 1.000 1.036 1.055 1.093 1.139 1.193 1985 0.766 0.845 0.897 0.926 0.966 1.000 1.019 1.056 1.099 1.152 1986 0.752 0.829 0.880 0.909 0.948 0.982 1.000 1.036 1.079 1.131 1987 0.725 0.800 0.849 0.877 0.915 0.947 0.965 1.000 1.041 1.092 1988 0.697 0.768 0.816 0.842 0.878 0.910 0.926 0.960 1.000 1.048 1989 0.665 0.733 0.778 0.803 0.838 0.868 0.884 0.916 0.954 1.000 1990 0.630 0.695 0.738 0.762 0.795 0.823 0.839 0.869 0.905 0.949 1991 0.605 0.667 0.709 0.731 0.763 0.790 0.805 0.834 0.869 0.910 1992 0.587 0.648 0.688 0.710 0.741 0.767 0.781 0.810 0.843 0.884 1993 0.570 0.629 0.668 0.689 0.719 0.745 0.758 0.786 0.819 0.858 1994 0.556 0.613 0.651 0.672 0.701 0.726 0.740 0.767 0.798 0.837 1995 0.541 0.596 0.633 0.654 0.682 0.706 0.719 0.745 0.776 0.814 1996 0.525 0.579 0.615 0.635 0.662 0.686 0.699 0.724 0.754 0.790 1997 0.513 0.566 0.601 0.621 0.647 0.670 0.683 0.708 0.737 0.773 1998 0.506 0.558 0.592 0.611 0.637 0.660 0.672 0.697 0.726 0.761 1999 0.495 0.546 0.579 0.598 0.624 0.646 0.658 0.682 0.710 0.744 2000 0.479 0.528 0.560 0.578 0.603 0.625 0.636 0.660 0.687 0.720 2001 0.465 0.513 0.545 0.562 0.587 0.608 0.619 0.641 0.668 0.700 2002 0.458 0.505 0.536 0.554 0.578 0.598 0.609 0.631 0.658 0.689 2003 0.448 0.494 0.524 0.541 0.565 0.585 0.596 0.617 0.643 0.674 2004 0.436 0.481 0.511 0.527 0.550 0.570 0.580 0.601 0.626 0.656 2005 0.422 0.465 0.494 0.510 0.532 0.551 0.561 0.582 0.606 0.635 2006 0.409 0.451 0.479 0.494 0.515 0.534 0.544 0.563 0.587 0.615 2007 0.397 0.438 0.465 0.480 0.501 0.519 0.529 0.548 0.571 0.598 2008 0.383 0.422 0.448 0.463 0.483 0.500 0.509 0.528 0.549 0.576 2009 0.384 0.424 0.450 0.464 0.484 0.502 0.511 0.530 0.551 0.578 2010 0.378 0.417 0.443 0.457 0.476 0.493 0.503 0.521 0.543 0.569 2011 0.366 0.404 0.429 0.443 0.462 0.478 0.487 0.505 0.526 0.551 2012 0.359 0.396 0.420 0.434 0.453 0.469 0.477 0.495 0.515 0.540 2013 0.354 0.390 0.414 0.428 0.446 0.462 0.470 0.488 0.508 0.532 2014 0.348 0.384 0.408 0.421 0.439 0.455 0.463 0.480 0.500 0.524 2015 0.348 0.384 0.407 0.420 0.438 0.454 0.462 0.479 0.499 0.523
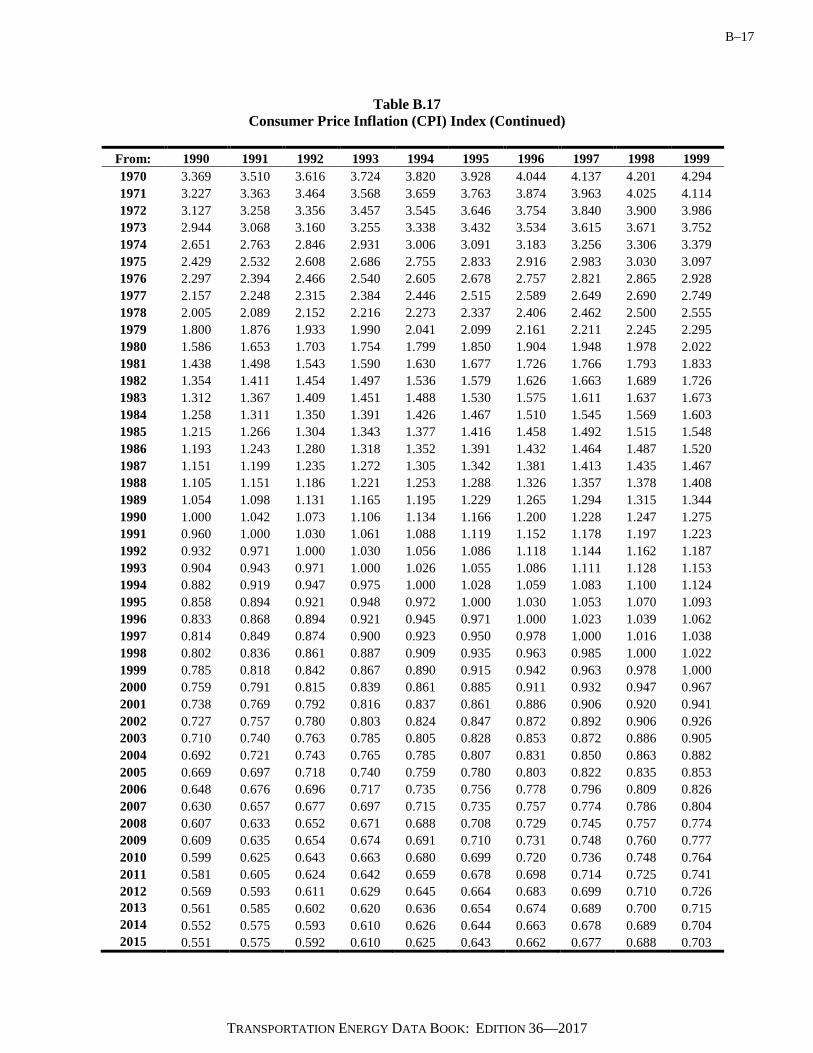
B–17
TRANSPORTATION ENERGY DATA BOOK: EDITION 36—2017
Table B.17 Consumer Price Inflation (CPI) Index (Continued)
From: 1990 1991 1992 1993 1994 1995 1996 1997 1998 1999 1970 3.369 3.510 3.616 3.724 3.820 3.928 4.044 4.137 4.201 4.294 1971 3.227 3.363 3.464 3.568 3.659 3.763 3.874 3.963 4.025 4.114 1972 3.127 3.258 3.356 3.457 3.545 3.646 3.754 3.840 3.900 3.986 1973 2.944 3.068 3.160 3.255 3.338 3.432 3.534 3.615 3.671 3.752 1974 2.651 2.763 2.846 2.931 3.006 3.091 3.183 3.256 3.306 3.379 1975 2.429 2.532 2.608 2.686 2.755 2.833 2.916 2.983 3.030 3.097 1976 2.297 2.394 2.466 2.540 2.605 2.678 2.757 2.821 2.865 2.928 1977 2.157 2.248 2.315 2.384 2.446 2.515 2.589 2.649 2.690 2.749 1978 2.005 2.089 2.152 2.216 2.273 2.337 2.406 2.462 2.500 2.555 1979 1.800 1.876 1.933 1.990 2.041 2.099 2.161 2.211 2.245 2.295 1980 1.586 1.653 1.703 1.754 1.799 1.850 1.904 1.948 1.978 2.022 1981 1.438 1.498 1.543 1.590 1.630 1.677 1.726 1.766 1.793 1.833 1982 1.354 1.411 1.454 1.497 1.536 1.579 1.626 1.663 1.689 1.726 1983 1.312 1.367 1.409 1.451 1.488 1.530 1.575 1.611 1.637 1.673 1984 1.258 1.311 1.350 1.391 1.426 1.467 1.510 1.545 1.569 1.603 1985 1.215 1.266 1.304 1.343 1.377 1.416 1.458 1.492 1.515 1.548 1986 1.193 1.243 1.280 1.318 1.352 1.391 1.432 1.464 1.487 1.520 1987 1.151 1.199 1.235 1.272 1.305 1.342 1.381 1.413 1.435 1.467 1988 1.105 1.151 1.186 1.221 1.253 1.288 1.326 1.357 1.378 1.408 1989 1.054 1.098 1.131 1.165 1.195 1.229 1.265 1.294 1.315 1.344 1990 1.000 1.042 1.073 1.106 1.134 1.166 1.200 1.228 1.247 1.275 1991 0.960 1.000 1.030 1.061 1.088 1.119 1.152 1.178 1.197 1.223 1992 0.932 0.971 1.000 1.030 1.056 1.086 1.118 1.144 1.162 1.187 1993 0.904 0.943 0.971 1.000 1.026 1.055 1.086 1.111 1.128 1.153 1994 0.882 0.919 0.947 0.975 1.000 1.028 1.059 1.083 1.100 1.124 1995 0.858 0.894 0.921 0.948 0.972 1.000 1.030 1.053 1.070 1.093 1996 0.833 0.868 0.894 0.921 0.945 0.971 1.000 1.023 1.039 1.062 1997 0.814 0.849 0.874 0.900 0.923 0.950 0.978 1.000 1.016 1.038 1998 0.802 0.836 0.861 0.887 0.909 0.935 0.963 0.985 1.000 1.022 1999 0.785 0.818 0.842 0.867 0.890 0.915 0.942 0.963 0.978 1.000 2000 0.759 0.791 0.815 0.839 0.861 0.885 0.911 0.932 0.947 0.967 2001 0.738 0.769 0.792 0.816 0.837 0.861 0.886 0.906 0.920 0.941 2002 0.727 0.757 0.780 0.803 0.824 0.847 0.872 0.892 0.906 0.926 2003 0.710 0.740 0.763 0.785 0.805 0.828 0.853 0.872 0.886 0.905 2004 0.692 0.721 0.743 0.765 0.785 0.807 0.831 0.850 0.863 0.882 2005 0.669 0.697 0.718 0.740 0.759 0.780 0.803 0.822 0.835 0.853 2006 0.648 0.676 0.696 0.717 0.735 0.756 0.778 0.796 0.809 0.826 2007 0.630 0.657 0.677 0.697 0.715 0.735 0.757 0.774 0.786 0.804 2008 0.607 0.633 0.652 0.671 0.688 0.708 0.729 0.745 0.757 0.774 2009 0.609 0.635 0.654 0.674 0.691 0.710 0.731 0.748 0.760 0.777 2010 0.599 0.625 0.643 0.663 0.680 0.699 0.720 0.736 0.748 0.764 2011 0.581 0.605 0.624 0.642 0.659 0.678 0.698 0.714 0.725 0.741 2012 0.569 0.593 0.611 0.629 0.645 0.664 0.683 0.699 0.710 0.726 2013 0.561 0.585 0.602 0.620 0.636 0.654 0.674 0.689 0.700 0.715 2014 0.552 0.575 0.593 0.610 0.626 0.644 0.663 0.678 0.689 0.704 2015 0.551 0.575 0.592 0.610 0.625 0.643 0.662 0.677 0.688 0.703
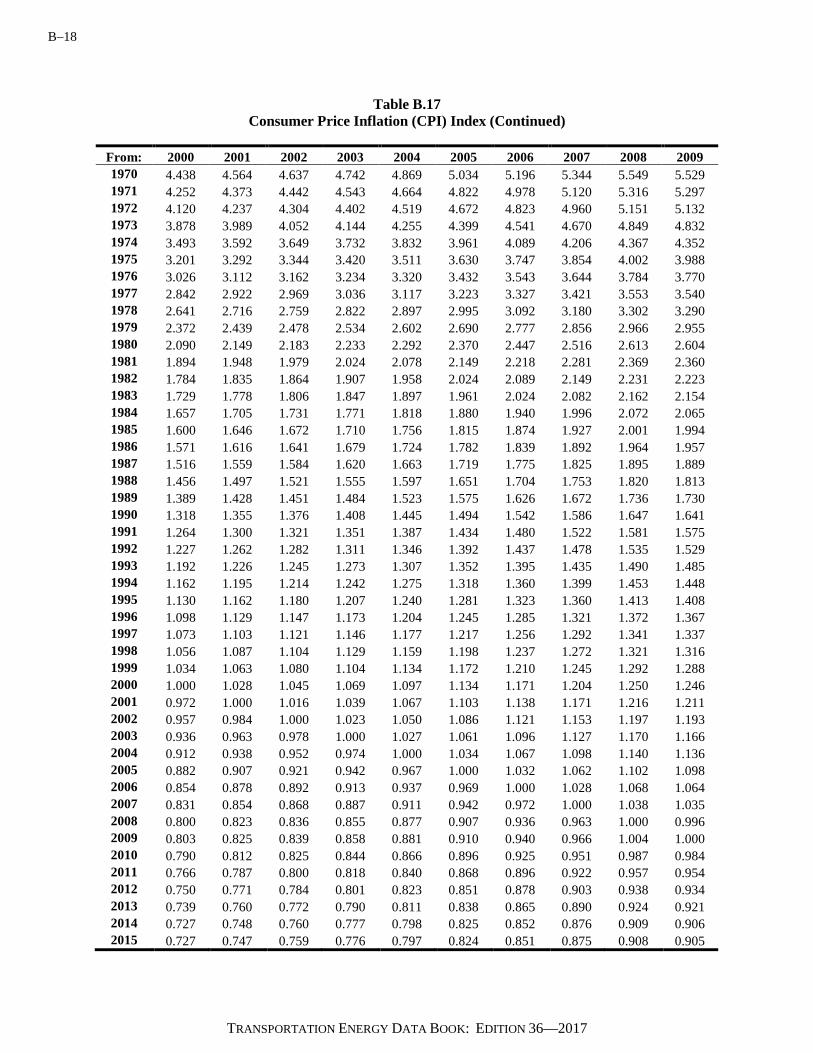
B–18
TRANSPORTATION ENERGY DATA BOOK: EDITION 36—2017
Table B.17 Consumer Price Inflation (CPI) Index (Continued)
From: 2000 2001 2002 2003 2004 2005 2006 2007 2008 2009 1970 4.438 4.564 4.637 4.742 4.869 5.034 5.196 5.344 5.549 5.529 1971 4.252 4.373 4.442 4.543 4.664 4.822 4.978 5.120 5.316 5.297 1972 4.120 4.237 4.304 4.402 4.519 4.672 4.823 4.960 5.151 5.132 1973 3.878 3.989 4.052 4.144 4.255 4.399 4.541 4.670 4.849 4.832 1974 3.493 3.592 3.649 3.732 3.832 3.961 4.089 4.206 4.367 4.352 1975 3.201 3.292 3.344 3.420 3.511 3.630 3.747 3.854 4.002 3.988 1976 3.026 3.112 3.162 3.234 3.320 3.432 3.543 3.644 3.784 3.770 1977 2.842 2.922 2.969 3.036 3.117 3.223 3.327 3.421 3.553 3.540 1978 2.641 2.716 2.759 2.822 2.897 2.995 3.092 3.180 3.302 3.290 1979 2.372 2.439 2.478 2.534 2.602 2.690 2.777 2.856 2.966 2.955 1980 2.090 2.149 2.183 2.233 2.292 2.370 2.447 2.516 2.613 2.604 1981 1.894 1.948 1.979 2.024 2.078 2.149 2.218 2.281 2.369 2.360 1982 1.784 1.835 1.864 1.907 1.958 2.024 2.089 2.149 2.231 2.223 1983 1.729 1.778 1.806 1.847 1.897 1.961 2.024 2.082 2.162 2.154 1984 1.657 1.705 1.731 1.771 1.818 1.880 1.940 1.996 2.072 2.065 1985 1.600 1.646 1.672 1.710 1.756 1.815 1.874 1.927 2.001 1.994 1986 1.571 1.616 1.641 1.679 1.724 1.782 1.839 1.892 1.964 1.957 1987 1.516 1.559 1.584 1.620 1.663 1.719 1.775 1.825 1.895 1.889 1988 1.456 1.497 1.521 1.555 1.597 1.651 1.704 1.753 1.820 1.813 1989 1.389 1.428 1.451 1.484 1.523 1.575 1.626 1.672 1.736 1.730 1990 1.318 1.355 1.376 1.408 1.445 1.494 1.542 1.586 1.647 1.641 1991 1.264 1.300 1.321 1.351 1.387 1.434 1.480 1.522 1.581 1.575 1992 1.227 1.262 1.282 1.311 1.346 1.392 1.437 1.478 1.535 1.529 1993 1.192 1.226 1.245 1.273 1.307 1.352 1.395 1.435 1.490 1.485 1994 1.162 1.195 1.214 1.242 1.275 1.318 1.360 1.399 1.453 1.448 1995 1.130 1.162 1.180 1.207 1.240 1.281 1.323 1.360 1.413 1.408 1996 1.098 1.129 1.147 1.173 1.204 1.245 1.285 1.321 1.372 1.367 1997 1.073 1.103 1.121 1.146 1.177 1.217 1.256 1.292 1.341 1.337 1998 1.056 1.087 1.104 1.129 1.159 1.198 1.237 1.272 1.321 1.316 1999 1.034 1.063 1.080 1.104 1.134 1.172 1.210 1.245 1.292 1.288 2000 1.000 1.028 1.045 1.069 1.097 1.134 1.171 1.204 1.250 1.246 2001 0.972 1.000 1.016 1.039 1.067 1.103 1.138 1.171 1.216 1.211 2002 0.957 0.984 1.000 1.023 1.050 1.086 1.121 1.153 1.197 1.193 2003 0.936 0.963 0.978 1.000 1.027 1.061 1.096 1.127 1.170 1.166 2004 0.912 0.938 0.952 0.974 1.000 1.034 1.067 1.098 1.140 1.136 2005 0.882 0.907 0.921 0.942 0.967 1.000 1.032 1.062 1.102 1.098 2006 0.854 0.878 0.892 0.913 0.937 0.969 1.000 1.028 1.068 1.064 2007 0.831 0.854 0.868 0.887 0.911 0.942 0.972 1.000 1.038 1.035 2008 0.800 0.823 0.836 0.855 0.877 0.907 0.936 0.963 1.000 0.996 2009 0.803 0.825 0.839 0.858 0.881 0.910 0.940 0.966 1.004 1.000 2010 0.790 0.812 0.825 0.844 0.866 0.896 0.925 0.951 0.987 0.984 2011 0.766 0.787 0.800 0.818 0.840 0.868 0.896 0.922 0.957 0.954 2012 0.750 0.771 0.784 0.801 0.823 0.851 0.878 0.903 0.938 0.934 2013 0.739 0.760 0.772 0.790 0.811 0.838 0.865 0.890 0.924 0.921 2014 0.727 0.748 0.760 0.777 0.798 0.825 0.852 0.876 0.909 0.906 2015 0.727 0.747 0.759 0.776 0.797 0.824 0.851 0.875 0.908 0.905

B–19
TRANSPORTATION ENERGY DATA BOOK: EDITION 36—2017
Table B.17 Consumer Price Inflation (CPI) Index (Continued)
From: 2010 2011 2012 2013 2014 2015 1970 5.620 5.797 5.917 6.004 6.101 6.109 1971 5.384 5.554 5.669 5.752 5.845 5.852 1972 5.217 5.381 5.493 5.573 5.664 5.670 1973 4.911 5.066 5.171 5.247 5.332 5.338 1974 4.423 4.563 4.657 4.725 4.802 4.808 1975 4.053 4.181 4.268 4.330 4.400 4.406 1976 3.832 3.953 4.035 4.094 4.161 4.166 1977 3.598 3.712 3.789 3.844 3.907 3.911 1978 3.344 3.450 3.521 3.573 3.631 3.635 1979 3.004 3.098 3.162 3.209 3.261 3.265 1980 2.646 2.730 2.786 2.827 2.873 2.876 1981 2.399 2.475 2.526 2.563 2.604 2.607 1982 2.260 2.331 2.379 2.414 2.453 2.456 1983 2.189 2.258 2.305 2.339 2.377 2.380 1984 2.099 2.165 2.210 2.242 2.278 2.281 1985 2.027 2.091 2.134 2.165 2.200 2.203 1986 1.990 2.052 2.095 2.126 2.160 2.163 1987 1.920 1.980 2.021 2.051 2.084 2.086 1988 1.843 1.901 1.941 1.969 2.001 2.004 1989 1.759 1.814 1.852 1.879 1.909 1.911 1990 1.668 1.721 1.757 1.782 1.811 1.813 1991 1.601 1.652 1.686 1.710 1.738 1.740 1992 1.554 1.603 1.636 1.660 1.687 1.689 1993 1.509 1.557 1.589 1.612 1.638 1.640 1994 1.471 1.518 1.549 1.572 1.597 1.599 1995 1.431 1.476 1.507 1.529 1.553 1.555 1996 1.390 1.434 1.463 1.485 1.509 1.511 1997 1.359 1.401 1.430 1.451 1.475 1.477 1998 1.338 1.380 1.409 1.429 1.452 1.454 1999 1.309 1.350 1.378 1.398 1.421 1.423 2000 1.266 1.306 1.333 1.353 1.375 1.376 2001 1.231 1.270 1.296 1.315 1.337 1.338 2002 1.212 1.250 1.276 1.295 1.316 1.317 2003 1.185 1.222 1.248 1.266 1.287 1.288 2004 1.154 1.191 1.215 1.233 1.253 1.255 2005 1.117 1.152 1.176 1.193 1.212 1.214 2006 1.082 1.116 1.139 1.156 1.174 1.176 2007 1.052 1.085 1.107 1.124 1.142 1.143 2008 1.013 1.045 1.066 1.082 1.100 1.101 2009 1.016 1.048 1.070 1.086 1.103 1.105 2010 1.000 1.032 1.053 1.068 1.086 1.087 2011 0.969 1.000 1.021 1.036 1.052 1.054 2012 0.950 0.980 1.000 1.015 1.031 1.032 2013 0.936 0.966 0.986 1.000 1.016 1.017 2014 0.921 0.950 0.970 0.984 1.000 1.001 2015 0.920 0.949 0.969 0.983 0.999 1.000
Source: U.S. Bureau of Labor Statistics.
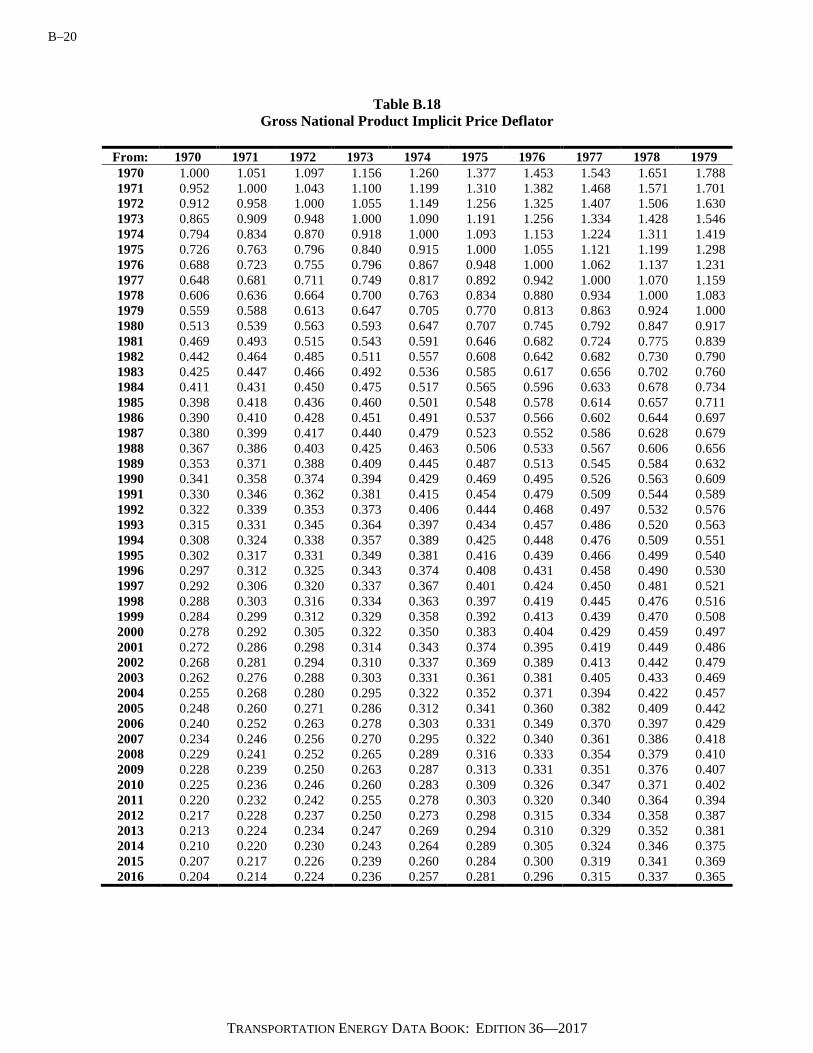
B–20
TRANSPORTATION ENERGY DATA BOOK: EDITION 36—2017
Table B.18 Gross National Product Implicit Price Deflator
From: 1970 1971 1972 1973 1974 1975 1976 1977 1978 1979 1970 1.000 1.051 1.097 1.156 1.260 1.377 1.453 1.543 1.651 1.788 1971 0.952 1.000 1.043 1.100 1.199 1.310 1.382 1.468 1.571 1.701 1972 0.912 0.958 1.000 1.055 1.149 1.256 1.325 1.407 1.506 1.630 1973 0.865 0.909 0.948 1.000 1.090 1.191 1.256 1.334 1.428 1.546 1974 0.794 0.834 0.870 0.918 1.000 1.093 1.153 1.224 1.311 1.419 1975 0.726 0.763 0.796 0.840 0.915 1.000 1.055 1.121 1.199 1.298 1976 0.688 0.723 0.755 0.796 0.867 0.948 1.000 1.062 1.137 1.231 1977 0.648 0.681 0.711 0.749 0.817 0.892 0.942 1.000 1.070 1.159 1978 0.606 0.636 0.664 0.700 0.763 0.834 0.880 0.934 1.000 1.083 1979 0.559 0.588 0.613 0.647 0.705 0.770 0.813 0.863 0.924 1.000 1980 0.513 0.539 0.563 0.593 0.647 0.707 0.745 0.792 0.847 0.917 1981 0.469 0.493 0.515 0.543 0.591 0.646 0.682 0.724 0.775 0.839 1982 0.442 0.464 0.485 0.511 0.557 0.608 0.642 0.682 0.730 0.790 1983 0.425 0.447 0.466 0.492 0.536 0.585 0.617 0.656 0.702 0.760 1984 0.411 0.431 0.450 0.475 0.517 0.565 0.596 0.633 0.678 0.734 1985 0.398 0.418 0.436 0.460 0.501 0.548 0.578 0.614 0.657 0.711 1986 0.390 0.410 0.428 0.451 0.491 0.537 0.566 0.602 0.644 0.697 1987 0.380 0.399 0.417 0.440 0.479 0.523 0.552 0.586 0.628 0.679 1988 0.367 0.386 0.403 0.425 0.463 0.506 0.533 0.567 0.606 0.656 1989 0.353 0.371 0.388 0.409 0.445 0.487 0.513 0.545 0.584 0.632 1990 0.341 0.358 0.374 0.394 0.429 0.469 0.495 0.526 0.563 0.609 1991 0.330 0.346 0.362 0.381 0.415 0.454 0.479 0.509 0.544 0.589 1992 0.322 0.339 0.353 0.373 0.406 0.444 0.468 0.497 0.532 0.576 1993 0.315 0.331 0.345 0.364 0.397 0.434 0.457 0.486 0.520 0.563 1994 0.308 0.324 0.338 0.357 0.389 0.425 0.448 0.476 0.509 0.551 1995 0.302 0.317 0.331 0.349 0.381 0.416 0.439 0.466 0.499 0.540 1996 0.297 0.312 0.325 0.343 0.374 0.408 0.431 0.458 0.490 0.530 1997 0.292 0.306 0.320 0.337 0.367 0.401 0.424 0.450 0.481 0.521 1998 0.288 0.303 0.316 0.334 0.363 0.397 0.419 0.445 0.476 0.516 1999 0.284 0.299 0.312 0.329 0.358 0.392 0.413 0.439 0.470 0.508 2000 0.278 0.292 0.305 0.322 0.350 0.383 0.404 0.429 0.459 0.497 2001 0.272 0.286 0.298 0.314 0.343 0.374 0.395 0.419 0.449 0.486 2002 0.268 0.281 0.294 0.310 0.337 0.369 0.389 0.413 0.442 0.479 2003 0.262 0.276 0.288 0.303 0.331 0.361 0.381 0.405 0.433 0.469 2004 0.255 0.268 0.280 0.295 0.322 0.352 0.371 0.394 0.422 0.457 2005 0.248 0.260 0.271 0.286 0.312 0.341 0.360 0.382 0.409 0.442 2006 0.240 0.252 0.263 0.278 0.303 0.331 0.349 0.370 0.397 0.429 2007 0.234 0.246 0.256 0.270 0.295 0.322 0.340 0.361 0.386 0.418 2008 0.229 0.241 0.252 0.265 0.289 0.316 0.333 0.354 0.379 0.410 2009 0.228 0.239 0.250 0.263 0.287 0.313 0.331 0.351 0.376 0.407 2010 0.225 0.236 0.246 0.260 0.283 0.309 0.326 0.347 0.371 0.402 2011 0.220 0.232 0.242 0.255 0.278 0.303 0.320 0.340 0.364 0.394 2012 0.217 0.228 0.237 0.250 0.273 0.298 0.315 0.334 0.358 0.387 2013 0.213 0.224 0.234 0.247 0.269 0.294 0.310 0.329 0.352 0.381 2014 0.210 0.220 0.230 0.243 0.264 0.289 0.305 0.324 0.346 0.375 2015 0.207 0.217 0.226 0.239 0.260 0.284 0.300 0.319 0.341 0.369 2016 0.204 0.214 0.224 0.236 0.257 0.281 0.296 0.315 0.337 0.365

B–21
TRANSPORTATION ENERGY DATA BOOK: EDITION 36—2017
Table B.18 Gross National Product Implicit Price Deflator (Continued)
From: 1980 1981 1982 1983 1984 1985 1986 1987 1988 1989 1970 1.949 2.131 2.263 2.353 2.436 2.514 2.565 2.631 2.723 2.830 1971 1.854 2.028 2.153 2.239 2.318 2.392 2.441 2.504 2.591 2.693 1972 1.777 1.943 2.064 2.145 2.222 2.293 2.339 2.399 2.484 2.580 1973 1.685 1.843 1.957 2.034 2.107 2.174 2.218 2.275 2.355 2.447 1974 1.547 1.691 1.796 1.867 1.933 1.995 2.036 2.088 2.161 2.246 1975 1.415 1.548 1.644 1.709 1.769 1.826 1.863 1.911 1.978 2.055 1976 1.341 1.467 1.558 1.619 1.677 1.731 1.766 1.811 1.875 1.948 1977 1.263 1.381 1.467 1.525 1.579 1.629 1.662 1.705 1.765 1.834 1978 1.180 1.290 1.370 1.425 1.475 1.522 1.553 1.593 1.649 1.714 1979 1.090 1.192 1.266 1.316 1.363 1.406 1.435 1.472 1.523 1.583 1980 1.000 1.093 1.161 1.207 1.250 1.290 1.316 1.350 1.398 1.452 1981 0.915 1.000 1.062 1.104 1.143 1.180 1.204 1.235 1.278 1.328 1982 0.861 0.942 1.000 1.040 1.076 1.111 1.133 1.163 1.203 1.250 1983 0.828 0.906 0.962 1.000 1.035 1.069 1.090 1.118 1.158 1.203 1984 0.800 0.875 0.929 0.966 1.000 1.032 1.053 1.080 1.118 1.162 1985 0.775 0.848 0.900 0.936 0.969 1.000 1.020 1.047 1.083 1.126 1986 0.760 0.831 0.882 0.917 0.950 0.980 1.000 1.026 1.062 1.103 1987 0.741 0.810 0.860 0.894 0.926 0.956 0.975 1.000 1.035 1.075 1988 0.716 0.782 0.831 0.864 0.895 0.923 0.942 0.966 1.000 1.039 1989 0.689 0.753 0.800 0.831 0.861 0.888 0.906 0.930 0.962 1.000 1990 0.664 0.726 0.771 0.802 0.830 0.857 0.874 0.897 0.928 0.964 1991 0.643 0.703 0.746 0.776 0.803 0.829 0.846 0.867 0.898 0.933 1992 0.628 0.687 0.730 0.758 0.785 0.810 0.827 0.848 0.878 0.912 1993 0.614 0.671 0.713 0.741 0.767 0.792 0.808 0.828 0.858 0.891 1994 0.601 0.657 0.698 0.725 0.751 0.775 0.791 0.811 0.840 0.872 1995 0.588 0.644 0.683 0.710 0.736 0.759 0.775 0.795 0.822 0.855 1996 0.578 0.632 0.671 0.698 0.722 0.746 0.761 0.780 0.808 0.839 1997 0.568 0.621 0.660 0.686 0.710 0.733 0.748 0.767 0.794 0.825 1998 0.562 0.615 0.653 0.679 0.703 0.725 0.740 0.759 0.786 0.816 1999 0.554 0.606 0.644 0.669 0.693 0.715 0.729 0.748 0.774 0.805 2000 0.542 0.592 0.629 0.654 0.677 0.699 0.713 0.732 0.757 0.787 2001 0.530 0.579 0.615 0.639 0.662 0.683 0.697 0.715 0.740 0.769 2002 0.522 0.570 0.606 0.630 0.652 0.673 0.687 0.704 0.729 0.757 2003 0.511 0.559 0.594 0.617 0.639 0.660 0.673 0.691 0.715 0.743 2004 0.498 0.544 0.578 0.601 0.622 0.642 0.655 0.672 0.696 0.723 2005 0.482 0.527 0.560 0.582 0.603 0.622 0.635 0.651 0.674 0.700 2006 0.468 0.512 0.543 0.565 0.585 0.604 0.616 0.632 0.654 0.679 2007 0.456 0.498 0.529 0.550 0.570 0.588 0.600 0.615 0.637 0.662 2008 0.447 0.489 0.519 0.540 0.559 0.577 0.588 0.604 0.625 0.649 2009 0.444 0.485 0.515 0.536 0.555 0.572 0.584 0.599 0.620 0.644 2010 0.438 0.479 0.508 0.529 0.547 0.565 0.576 0.591 0.612 0.636 2011 0.429 0.469 0.499 0.518 0.537 0.554 0.565 0.580 0.600 0.623 2012 0.422 0.461 0.490 0.509 0.527 0.544 0.555 0.570 0.590 0.613 2013 0.416 0.455 0.483 0.502 0.520 0.536 0.547 0.561 0.581 0.604 2014 0.409 0.447 0.475 0.493 0.511 0.527 0.538 0.552 0.571 0.593 2015 0.402 0.440 0.467 0.486 0.503 0.519 0.530 0.543 0.562 0.584 2016 0.397 0.435 0.461 0.480 0.497 0.513 0.523 0.537 0.555 0.577
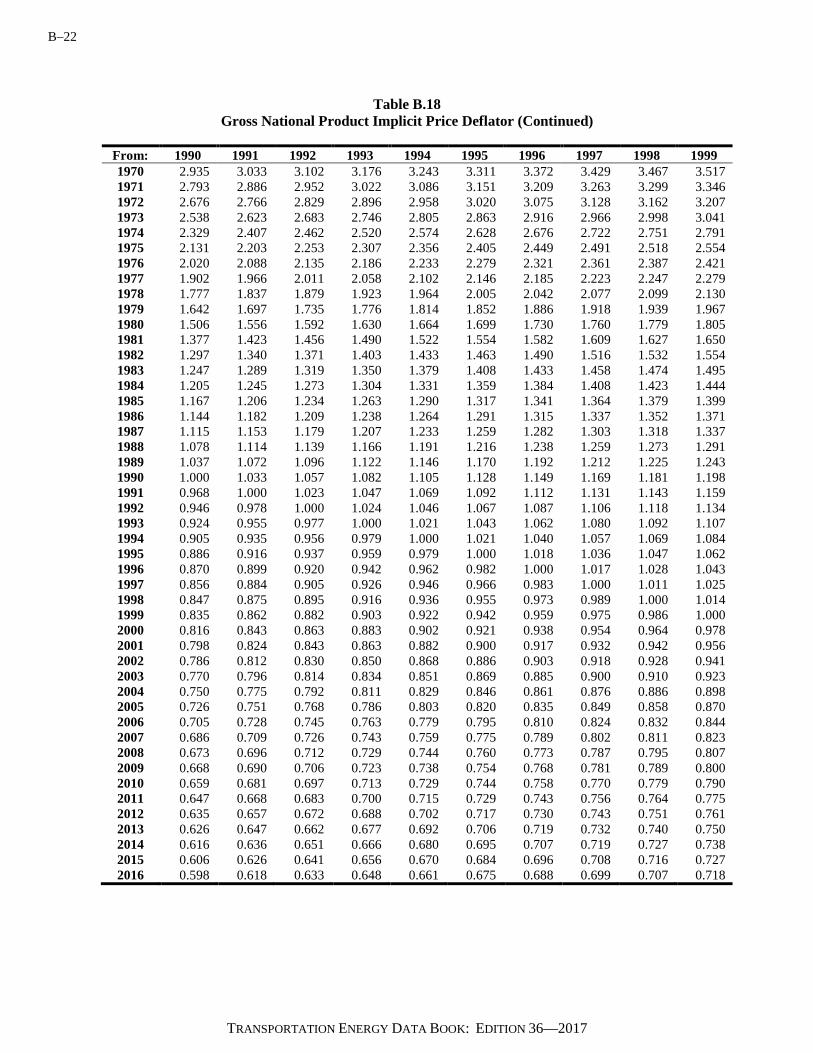
B–22
TRANSPORTATION ENERGY DATA BOOK: EDITION 36—2017
Table B.18 Gross National Product Implicit Price Deflator (Continued)
From: 1990 1991 1992 1993 1994 1995 1996 1997 1998 1999 1970 2.935 3.033 3.102 3.176 3.243 3.311 3.372 3.429 3.467 3.517 1971 2.793 2.886 2.952 3.022 3.086 3.151 3.209 3.263 3.299 3.346 1972 2.676 2.766 2.829 2.896 2.958 3.020 3.075 3.128 3.162 3.207 1973 2.538 2.623 2.683 2.746 2.805 2.863 2.916 2.966 2.998 3.041 1974 2.329 2.407 2.462 2.520 2.574 2.628 2.676 2.722 2.751 2.791 1975 2.131 2.203 2.253 2.307 2.356 2.405 2.449 2.491 2.518 2.554 1976 2.020 2.088 2.135 2.186 2.233 2.279 2.321 2.361 2.387 2.421 1977 1.902 1.966 2.011 2.058 2.102 2.146 2.185 2.223 2.247 2.279 1978 1.777 1.837 1.879 1.923 1.964 2.005 2.042 2.077 2.099 2.130 1979 1.642 1.697 1.735 1.776 1.814 1.852 1.886 1.918 1.939 1.967 1980 1.506 1.556 1.592 1.630 1.664 1.699 1.730 1.760 1.779 1.805 1981 1.377 1.423 1.456 1.490 1.522 1.554 1.582 1.609 1.627 1.650 1982 1.297 1.340 1.371 1.403 1.433 1.463 1.490 1.516 1.532 1.554 1983 1.247 1.289 1.319 1.350 1.379 1.408 1.433 1.458 1.474 1.495 1984 1.205 1.245 1.273 1.304 1.331 1.359 1.384 1.408 1.423 1.444 1985 1.167 1.206 1.234 1.263 1.290 1.317 1.341 1.364 1.379 1.399 1986 1.144 1.182 1.209 1.238 1.264 1.291 1.315 1.337 1.352 1.371 1987 1.115 1.153 1.179 1.207 1.233 1.259 1.282 1.303 1.318 1.337 1988 1.078 1.114 1.139 1.166 1.191 1.216 1.238 1.259 1.273 1.291 1989 1.037 1.072 1.096 1.122 1.146 1.170 1.192 1.212 1.225 1.243 1990 1.000 1.033 1.057 1.082 1.105 1.128 1.149 1.169 1.181 1.198 1991 0.968 1.000 1.023 1.047 1.069 1.092 1.112 1.131 1.143 1.159 1992 0.946 0.978 1.000 1.024 1.046 1.067 1.087 1.106 1.118 1.134 1993 0.924 0.955 0.977 1.000 1.021 1.043 1.062 1.080 1.092 1.107 1994 0.905 0.935 0.956 0.979 1.000 1.021 1.040 1.057 1.069 1.084 1995 0.886 0.916 0.937 0.959 0.979 1.000 1.018 1.036 1.047 1.062 1996 0.870 0.899 0.920 0.942 0.962 0.982 1.000 1.017 1.028 1.043 1997 0.856 0.884 0.905 0.926 0.946 0.966 0.983 1.000 1.011 1.025 1998 0.847 0.875 0.895 0.916 0.936 0.955 0.973 0.989 1.000 1.014 1999 0.835 0.862 0.882 0.903 0.922 0.942 0.959 0.975 0.986 1.000 2000 0.816 0.843 0.863 0.883 0.902 0.921 0.938 0.954 0.964 0.978 2001 0.798 0.824 0.843 0.863 0.882 0.900 0.917 0.932 0.942 0.956 2002 0.786 0.812 0.830 0.850 0.868 0.886 0.903 0.918 0.928 0.941 2003 0.770 0.796 0.814 0.834 0.851 0.869 0.885 0.900 0.910 0.923 2004 0.750 0.775 0.792 0.811 0.829 0.846 0.861 0.876 0.886 0.898 2005 0.726 0.751 0.768 0.786 0.803 0.820 0.835 0.849 0.858 0.870 2006 0.705 0.728 0.745 0.763 0.779 0.795 0.810 0.824 0.832 0.844 2007 0.686 0.709 0.726 0.743 0.759 0.775 0.789 0.802 0.811 0.823 2008 0.673 0.696 0.712 0.729 0.744 0.760 0.773 0.787 0.795 0.807 2009 0.668 0.690 0.706 0.723 0.738 0.754 0.768 0.781 0.789 0.800 2010 0.659 0.681 0.697 0.713 0.729 0.744 0.758 0.770 0.779 0.790 2011 0.647 0.668 0.683 0.700 0.715 0.729 0.743 0.756 0.764 0.775 2012 0.635 0.657 0.672 0.688 0.702 0.717 0.730 0.743 0.751 0.761 2013 0.626 0.647 0.662 0.677 0.692 0.706 0.719 0.732 0.740 0.750 2014 0.616 0.636 0.651 0.666 0.680 0.695 0.707 0.719 0.727 0.738 2015 0.606 0.626 0.641 0.656 0.670 0.684 0.696 0.708 0.716 0.727 2016 0.598 0.618 0.633 0.648 0.661 0.675 0.688 0.699 0.707 0.718

B–23
TRANSPORTATION ENERGY DATA BOOK: EDITION 36—2017
Table B.18 Gross National Product Implicit Price Deflator (Continued)
From: 2000 2001 2002 2003 2004 2005 2006 2007 2008 2009 1970 3.596 3.679 3.735 3.810 3.915 4.040 4.164 4.275 4.359 4.393 1971 3.422 3.501 3.555 3.626 3.725 3.845 3.963 4.068 4.148 4.180 1972 3.280 3.355 3.407 3.475 3.570 3.685 3.798 3.899 3.976 4.006 1973 3.110 3.181 3.230 3.295 3.385 3.494 3.601 3.697 3.770 3.799 1974 2.854 2.920 2.965 3.024 3.107 3.206 3.305 3.393 3.460 3.487 1975 2.612 2.672 2.713 2.767 2.843 2.934 3.025 3.105 3.166 3.191 1976 2.476 2.532 2.571 2.623 2.695 2.781 2.867 2.943 3.001 3.024 1977 2.331 2.384 2.421 2.470 2.537 2.619 2.699 2.771 2.825 2.847 1978 2.178 2.228 2.262 2.307 2.371 2.447 2.522 2.589 2.640 2.660 1979 2.012 2.058 2.090 2.131 2.190 2.260 2.330 2.392 2.439 2.457 1980 1.846 1.888 1.917 1.955 2.009 2.073 2.137 2.194 2.237 2.254 1981 1.688 1.726 1.753 1.788 1.837 1.896 1.954 2.006 2.046 2.062 1982 1.589 1.626 1.651 1.684 1.730 1.785 1.840 1.889 1.926 1.941 1983 1.529 1.564 1.588 1.620 1.664 1.717 1.770 1.817 1.853 1.867 1984 1.476 1.510 1.533 1.564 1.607 1.659 1.710 1.755 1.789 1.803 1985 1.431 1.463 1.486 1.516 1.557 1.607 1.657 1.701 1.734 1.747 1986 1.402 1.434 1.456 1.485 1.526 1.575 1.624 1.667 1.700 1.713 1987 1.367 1.398 1.420 1.448 1.488 1.536 1.583 1.625 1.657 1.670 1988 1.321 1.351 1.372 1.399 1.437 1.484 1.529 1.570 1.601 1.613 1989 1.271 1.300 1.320 1.347 1.383 1.428 1.472 1.511 1.541 1.553 1990 1.225 1.254 1.273 1.298 1.334 1.377 1.419 1.457 1.485 1.497 1991 1.186 1.213 1.232 1.256 1.291 1.332 1.373 1.410 1.437 1.448 1992 1.159 1.186 1.204 1.228 1.262 1.302 1.343 1.378 1.405 1.416 1993 1.132 1.158 1.176 1.200 1.233 1.272 1.311 1.346 1.373 1.383 1994 1.109 1.134 1.152 1.175 1.207 1.246 1.284 1.318 1.344 1.355 1995 1.086 1.111 1.128 1.151 1.182 1.220 1.258 1.291 1.317 1.327 1996 1.067 1.091 1.108 1.130 1.161 1.198 1.235 1.268 1.293 1.303 1997 1.049 1.073 1.089 1.111 1.141 1.178 1.214 1.247 1.271 1.281 1998 1.037 1.061 1.077 1.099 1.129 1.165 1.201 1.233 1.257 1.267 1999 1.023 1.046 1.062 1.083 1.113 1.149 1.184 1.216 1.240 1.249 2000 1.000 1.023 1.039 1.059 1.088 1.123 1.158 1.189 1.212 1.222 2001 0.978 1.000 1.015 1.036 1.064 1.098 1.132 1.162 1.185 1.194 2002 0.963 0.985 1.000 1.020 1.048 1.082 1.115 1.145 1.167 1.176 2003 0.944 0.966 0.980 1.000 1.027 1.060 1.093 1.122 1.144 1.153 2004 0.919 0.940 0.954 0.973 1.000 1.032 1.064 1.092 1.114 1.122 2005 0.890 0.911 0.925 0.943 0.969 1.000 1.031 1.058 1.079 1.087 2006 0.864 0.883 0.897 0.915 0.940 0.970 1.000 1.027 1.047 1.055 2007 0.841 0.861 0.874 0.891 0.916 0.945 0.974 1.000 1.020 1.028 2008 0.825 0.844 0.857 0.874 0.898 0.927 0.955 0.981 1.000 1.008 2009 0.819 0.837 0.850 0.867 0.891 0.920 0.948 0.973 0.992 1.000 2010 0.808 0.826 0.839 0.856 0.879 0.908 0.936 0.960 0.979 0.987 2011 0.792 0.810 0.823 0.839 0.862 0.890 0.917 0.942 0.960 0.968 2012 0.779 0.797 0.809 0.825 0.848 0.875 0.902 0.926 0.944 0.951 2013 0.767 0.785 0.797 0.813 0.835 0.862 0.888 0.912 0.930 0.937 2014 0.755 0.772 0.784 0.800 0.822 0.848 0.874 0.898 0.915 0.922 2015 0.744 0.761 0.772 0.788 0.809 0.835 0.861 0.884 0.901 0.908 2016 0.734 0.751 0.762 0.778 0.799 0.825 0.850 0.873 0.890 0.897

B–24
TRANSPORTATION ENERGY DATA BOOK: EDITION 36—2017
Table B.18 Gross National Product Implicit Price Deflator (Continued)
From: 2010 2011 2012 2013 2014 2015 2016 1970 4.451 4.539 4.618 4.688 4.767 4.841 4.903 1971 4.236 4.319 4.395 4.461 4.536 4.607 4.666 1972 4.059 4.140 4.212 4.275 4.348 4.415 4.472 1973 3.849 3.925 3.994 4.054 4.123 4.187 4.241 1974 3.533 3.602 3.665 3.720 3.784 3.842 3.892 1975 3.233 3.297 3.354 3.405 3.463 3.516 3.562 1976 3.064 3.125 3.179 3.227 3.282 3.333 3.376 1977 2.885 2.942 2.993 3.038 3.090 3.138 3.179 1978 2.696 2.749 2.797 2.839 2.887 2.932 2.970 1979 2.490 2.539 2.583 2.622 2.667 2.708 2.743 1980 2.284 2.329 2.370 2.406 2.447 2.485 2.517 1981 2.089 2.130 2.167 2.200 2.237 2.272 2.301 1982 1.967 2.006 2.041 2.072 2.107 2.139 2.167 1983 1.892 1.929 1.963 1.993 2.027 2.058 2.085 1984 1.827 1.863 1.896 1.924 1.957 1.987 2.013 1985 1.771 1.806 1.837 1.865 1.896 1.926 1.951 1986 1.735 1.770 1.801 1.828 1.859 1.888 1.912 1987 1.692 1.725 1.755 1.782 1.812 1.840 1.864 1988 1.634 1.667 1.696 1.721 1.751 1.778 1.801 1989 1.573 1.604 1.632 1.657 1.685 1.711 1.733 1990 1.517 1.547 1.574 1.597 1.625 1.650 1.671 1991 1.468 1.497 1.523 1.546 1.572 1.596 1.617 1992 1.435 1.463 1.489 1.511 1.537 1.561 1.581 1993 1.402 1.429 1.454 1.476 1.501 1.525 1.544 1994 1.372 1.400 1.424 1.445 1.470 1.493 1.512 1995 1.344 1.371 1.395 1.416 1.440 1.462 1.481 1996 1.320 1.346 1.370 1.390 1.414 1.436 1.454 1997 1.298 1.324 1.347 1.367 1.390 1.412 1.430 1998 1.284 1.309 1.332 1.352 1.375 1.397 1.415 1999 1.266 1.291 1.313 1.333 1.354 1.375 1.393 2000 1.238 1.262 1.284 1.303 1.324 1.345 1.362 2001 1.210 1.234 1.255 1.274 1.295 1.315 1.332 2002 1.192 1.215 1.236 1.255 1.275 1.295 1.312 2003 1.168 1.191 1.212 1.230 1.250 1.270 1.286 2004 1.137 1.160 1.180 1.198 1.217 1.236 1.252 2005 1.102 1.123 1.143 1.160 1.179 1.197 1.213 2006 1.069 1.090 1.109 1.126 1.144 1.161 1.176 2007 1.041 1.062 1.080 1.097 1.114 1.131 1.146 2008 1.021 1.041 1.059 1.075 1.092 1.109 1.124 2009 1.013 1.033 1.051 1.067 1.084 1.101 1.115 2010 1.000 1.020 1.038 1.053 1.070 1.086 1.100 2011 0.981 1.000 1.017 1.033 1.048 1.064 1.078 2012 0.964 0.983 1.000 1.015 1.030 1.045 1.059 2013 0.949 0.968 0.985 1.000 1.015 1.029 1.042 2014 0.935 0.954 0.971 0.986 1.000 1.010 1.024 2015 0.920 0.940 0.957 0.972 0.990 1.000 1.013 2016 0.909 0.928 0.945 0.960 0.977 0.987 1.000
Source: U.S. Department of Commerce, Bureau of Economic Analysis, Survey of Current Business, Washington, DC,
monthly.
C–1
TRANSPORTATION ENERGY DATA BOOK: EDITION 36—2017
APPENDIX C
MAPS

C–2
TRANSPORTATION ENERGY DATA BOOK: EDITION 36—2017

C–3
TRANSPORTATION ENERGY DATA BOOK: EDITION 36—2017
Table C.1 Census Regions and Divisions
Northeast Region
Mid-Atlantic division New England division New Jersey New York
Pennsylvania Connecticut Maine Massachusetts
New Hampshire Rhode Island Vermont
South Region West South Central
division East South Central
division South Atlantic
division Arkansas Louisiana Oklahoma Texas
Alabama Kentucky Mississippi Tennessee
Delaware Florida Georgia Maryland North Carolina
South Carolina Virginia Washington, DC West Virginia
West Region Pacific division Mountain division
Alaska California Hawaii
Oregon Washington
Arizona Colorado Idaho Montana
Nevada New Mexico Utah Wyoming
Midwest Region West North Central division East North Central division
Iowa Kansas Minnesota Missouri
Nebraska North Dakota South Dakota
Illinois Indiana Michigan
Ohio Wisconsin
Source: U.S. Census Bureau.
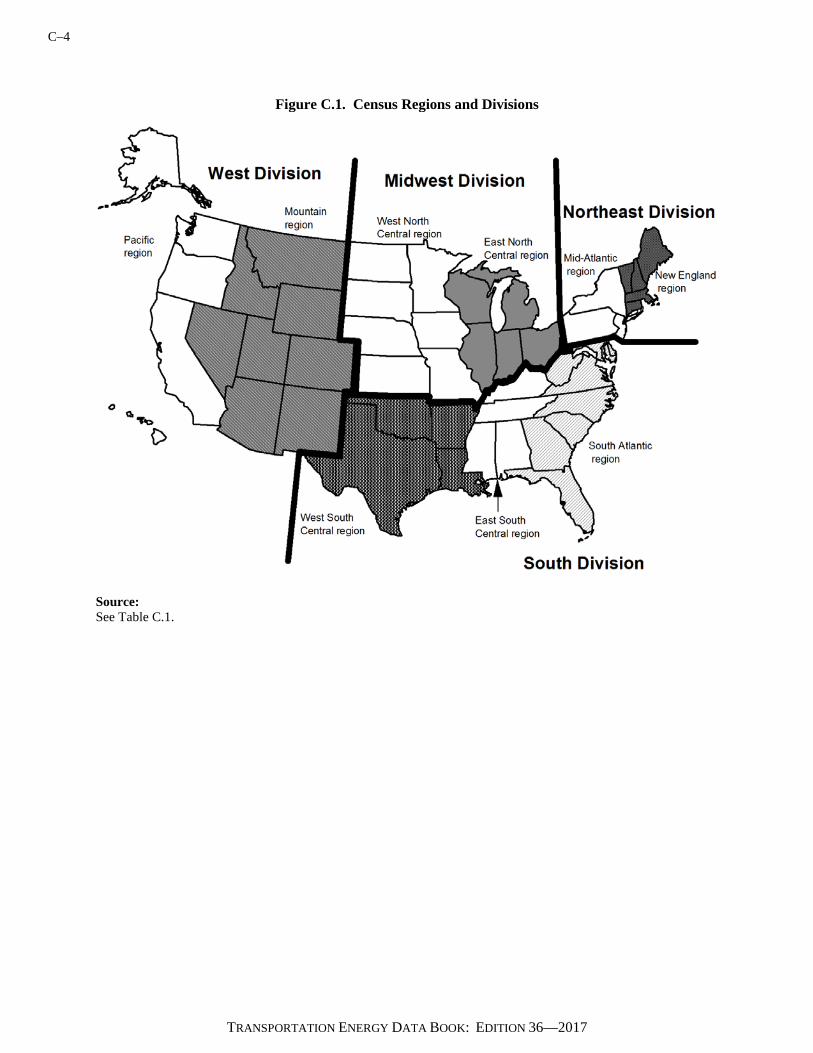
C–4
TRANSPORTATION ENERGY DATA BOOK: EDITION 36—2017
Figure C.1. Census Regions and Divisions
Source: See Table C.1.

C–5
TRANSPORTATION ENERGY DATA BOOK: EDITION 36—2017
Table C.2 Petroleum Administration for Defense Districts (PADD)
District Subdistrict States
PAD District 1 East Coast
Subdistrict 1A New England
Connecticut, Maine, Massachusetts, New Hampshire, Rhode Island, Vermont
Subdistrict 1B Central Atlantic
Delaware, District of Columbia, Maryland, New Jersey, New York, Pennsylvania
Subdistrict 1C Lower Atlantic
Florida, Georgia, North Carolina, South Carolina, Virginia, West Virginia
PAD District 2 Midwest
Illinois, Indiana, Iowa, Kansas, Kentucky, Michigan, Minnesota, Missouri, Nebraska, North Dakota, South Dakota, Ohio, Oklahoma, Tennessee, Wisconsin
PAD District 3 Gulf Coast
Alabama, Arkansas, Louisiana, Mississippi, New Mexico, Texas
PAD District 4 Rocky Mountains
Colorado Idaho, Montana, Utah, Wyoming
PAD District 5 West Coast
Alaska, Arizona, California, Hawaii, Nevada, Oregon, Washington
Source: Energy Information Administration web site:
http://www.eia.gov/tools/glossary/index.cfm?id=P#PADD_def

C–6
TRANSPORTATION ENERGY DATA BOOK: EDITION 36—2017
Figure C.2. Petroleum Administration for Defense Districts
Source: See Table C.2.
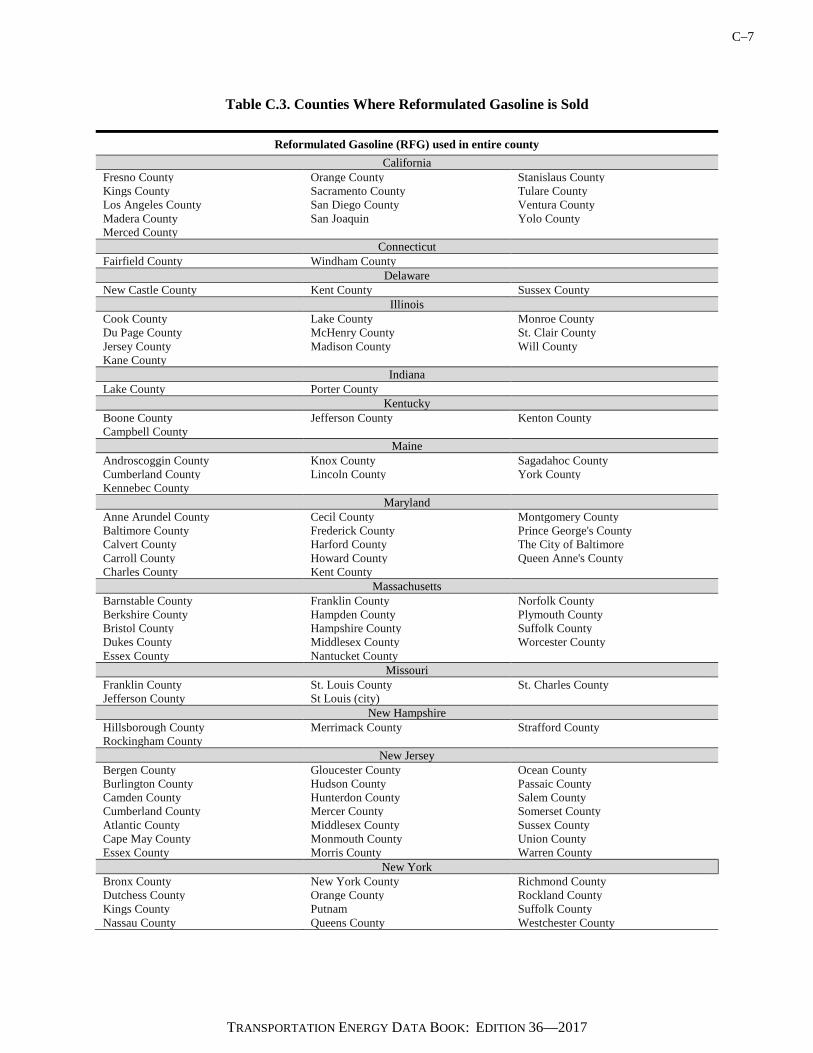
C–7
TRANSPORTATION ENERGY DATA BOOK: EDITION 36—2017
Table C.3. Counties Where Reformulated Gasoline is Sold
Reformulated Gasoline (RFG) used in entire county California
Fresno County Orange County Stanislaus County Kings County Sacramento County Tulare County Los Angeles County San Diego County Ventura County Madera County San Joaquin Yolo County Merced County
Connecticut Fairfield County Windham County
Delaware New Castle County Kent County Sussex County
Illinois Cook County Lake County Monroe County Du Page County McHenry County St. Clair County Jersey County Madison County Will County Kane County
Indiana Lake County Porter County
Kentucky Boone County Jefferson County Kenton County Campbell County
Maine Androscoggin County Knox County Sagadahoc County Cumberland County Lincoln County York County Kennebec County
Maryland Anne Arundel County Cecil County Montgomery County Baltimore County Frederick County Prince George's County Calvert County Harford County The City of Baltimore Carroll County Howard County Queen Anne's County Charles County Kent County
Massachusetts Barnstable County Franklin County Norfolk County Berkshire County Hampden County Plymouth County Bristol County Hampshire County Suffolk County Dukes County Middlesex County Worcester County Essex County Nantucket County
Missouri Franklin County St. Louis County St. Charles County Jefferson County St Louis (city)
New Hampshire Hillsborough County Merrimack County Strafford County Rockingham County
New Jersey Bergen County Gloucester County Ocean County Burlington County Hudson County Passaic County Camden County Hunterdon County Salem County Cumberland County Mercer County Somerset County Atlantic County Middlesex County Sussex County Cape May County Monmouth County Union County Essex County Morris County Warren County
New York Bronx County New York County Richmond County Dutchess County Orange County Rockland County Kings County Putnam Suffolk County Nassau County Queens County Westchester County

C–8
TRANSPORTATION ENERGY DATA BOOK: EDITION 36—2017
Table C.3. Counties Where Reformulated Gasoline is Sold (continued)
RFG used in entire county (continued) Pennsylvania
Bucks County Delaware County Philadelphia County Chester County Montgomery County
Rhode Island Bristol County Newport County Washington County Kent County Providence County
Texas Brazoria County Denton County Liberty County Chambers County Fort Bend County Montgomery County Collin County Galveston County Tarrant County Dallas County Harris County Waller County
Virginia Alexandria Hanover County Poquoson Arlington County Henrico County Portsmouth Charles City County Hopewell Prince William County Chesapeake James City County Richmond Chesterfield County Loudoun County Stafford County Colonial Heights Manassas Suffolk Fairfax Manassas Park Virginia Beach Fairfax County Newport News Williamsburg Falls Church Norfolk York County Hampton
Wisconsin Kenosha County Ozaukee County Washington County Milwaukee County Racine County Waukesha County
Partial RFG Counties California
El Dorado County Riverside County Solano County Kern County San Bernardino County Sutter County Placer County
Connecticut Hartford County Middlesex County New London County Litchfield County New Haven County Tolland County
Illinois Grundy County Kendall County
Kentucky Bullitt County Oldham County
New York Essex County
Note: RFG is also sold in the District of Columbia. Reformulated gasoline is a motor gasoline specially formulated to achieve significant reductions in vehicle emissions of ozone-forming and toxic air pollutants. The Clean Air Act of 1990 mandates reformulated gasoline use in areas with ozone-air pollution problems, but some of these counties opted-in to the RFG program. Source: U.S. Environmental Protection Agency, RFG Areas, accessed September 15, 2017, http://www.epa.gov/gasoline-
standards/reformulated-gasoline
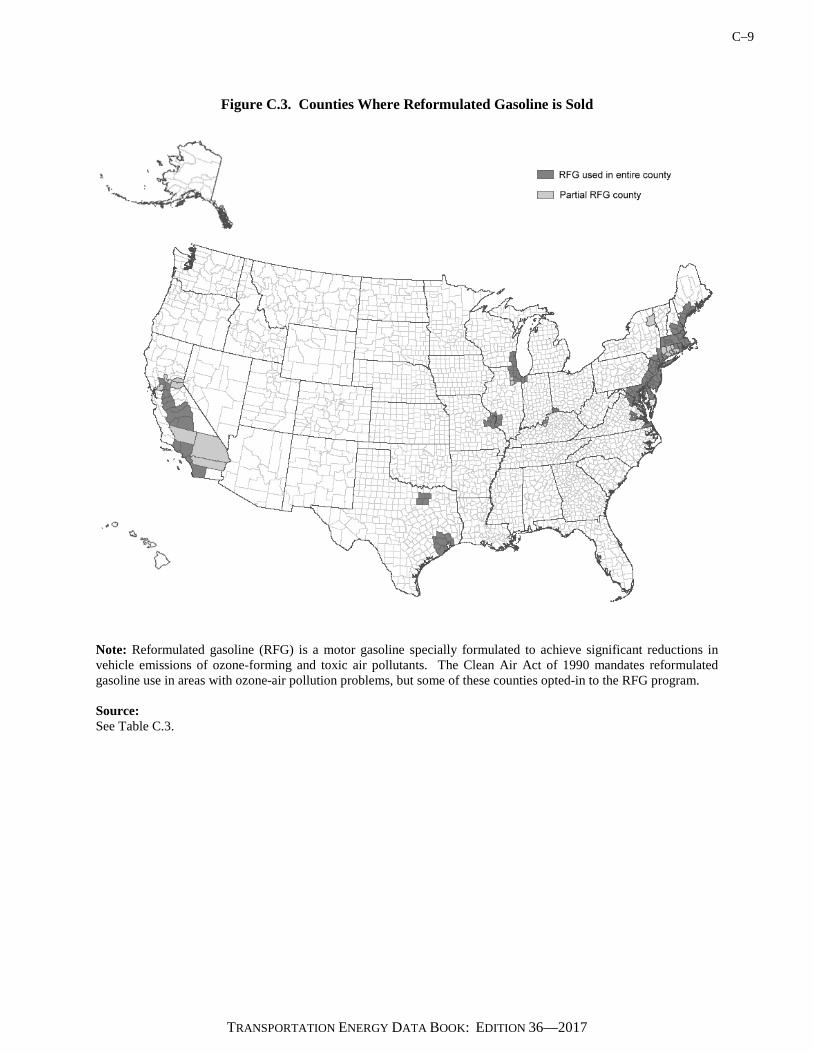
C–9
TRANSPORTATION ENERGY DATA BOOK: EDITION 36—2017
Figure C.3. Counties Where Reformulated Gasoline is Sold
Note: Reformulated gasoline (RFG) is a motor gasoline specially formulated to achieve significant reductions in vehicle emissions of ozone-forming and toxic air pollutants. The Clean Air Act of 1990 mandates reformulated gasoline use in areas with ozone-air pollution problems, but some of these counties opted-in to the RFG program. Source: See Table C.3.

C–10
TRANSPORTATION ENERGY DATA BOOK: EDITION 36—2017

G–1
TRANSPORTATION ENERGY DATA BOOK: EDITION 36—2017
GLOSSARY
Acceleration power – Often measured in kilowatts. Pulse power obtainable from a battery used to accelerate a vehicle. This is based on a constant current pulse for 30 seconds at no less than 2/3 of the maximum open-circuit-voltage, at 80% depth-of-discharge relative to the battery's rated capacity and at 20○ C ambient temperature.
Age – The amount of time a person or thing has existed. Air Carrier – The commercial system of air transportation consisting of certificated air carriers,
air taxis (including commuters), supplemental air carriers, commercial operators of large aircraft, and air travel clubs.
Certificated route air carrier: An air carrier holding a Certificate of Public Convenience
and Necessity issued by the Department of Transportation to conduct scheduled interstate services. Nonscheduled or charter operations may also be conducted by these carriers. These carriers operate large aircraft (30 seats or more, or a maximum payload capacity of 7,500 pounds or more) in accordance with Federal Aviation Regulation part 121.
Domestic air operator: Commercial air transportation within and between the 50 States
and the District of Columbia. Includes operations of certificated route air carriers, Pan American, local service, helicopter, intra-Alaska, intra-Hawaii, all-cargo carriers and other carriers. Also included are transborder operations conducted on the domestic route segments of U.S. air carriers. Domestic operators are classified based on their operating revenue as follows:
Majors - over $1 billion Nationals - $100 million to $1 billion Large Regionals - $20 million to $99 million Medium Regionals – Less than $20 million International air operator: Commercial air transportation outside the territory of the
United States, including operations between the U.S. and foreign countries and between the U.S. and its territories and possessions.
Supplemental air carrier: A class of air carriers which hold certificates authorizing them
to perform passenger and cargo charter services supplementing the scheduled service of the certificated route air carriers. Supplemental air carriers are often referred to as nonscheduled air carriers or "nonskeds."
Alcohol – The family name of a group of organic chemical compounds composed of carbon,
hydrogen, and oxygen. The molecules in the series vary in chain length and are composed of a hydrocarbon plus a hydroxyl group. Alcohol includes methanol and ethanol.
G–2
TRANSPORTATION ENERGY DATA BOOK: EDITION 36—2017
Alternative fuel – For transportation applications, includes the following: methanol; denatured ethanol, and other alcohols; fuel mixtures containing 85 percent or more by volume of methanol, denatured ethanol, and other alcohols with gasoline or other fuels; natural gas; liquefied petroleum gas (propane); hydrogen; coal-derived liquid fuels; fuels (other than alcohol) derived from biological materials (biofuels such as soy diesel fuel); and electricity (including electricity from solar energy). The term "alternative fuel" does not include alcohol or other blended portions of primarily petroleum-based fuels used as oxygenates or extenders, i.e. MTBE, ETBE, other ethers, and the 10-percent ethanol portion of gasohol.
Amtrak – See Rail. Anthropogenic – Human made. Usually used in the context of emissions that are produced as the
result of human activities. Aviation – See General aviation. Aviation gasoline – All special grades of gasoline for use in aviation reciprocating engines, as
given in the American Society for Testing and Materials (ASTM) Specification D 910. Includes all refinery products within the gasoline range that are to be marketed straight or in blends as aviation gasoline without further processing (any refinery operation except mechanical blending). Also included are finished components in the gasoline range which will be used for blending or compounding into aviation gasoline.
Barges – Shallow, non-self-propelled vessels used to carry bulk commodities on the rivers and the
Great Lakes. Battery efficiency – Measured in percentage. Net DC energy delivered on discharge, as a
percentage of the total DC energy required to restore the initial state-of-charge. The efficiency value must include energy losses resulting from self-discharge, cell equalization, thermal loss compensation, and all battery-specific auxiliary equipment.
Btu – British thermal unit. The amount of energy required to raise the temperature of 1 pound of
water 1 degree Fahrenheit at or near 39.2 degrees Fahrenheit. An average Btu content of fuel is the heat value per quantity of fuel as determined from tests of fuel samples.
Bunker – A storage tank. Bunker fuels – Fuel supplied to ships and aircraft, both domestic and foreign, consisting primarily
of residual and distillate fuel oil for ships and kerosene-based jet fuel for aircraft. Bus –A mode of transit service characterized by roadway vehicles powered by diesel, gasoline,
battery, or alternative fuel engines contained within the vehicle.
Intercity bus: A standard size bus equipped with front doors only, high backed seats, luggage compartments separate from the passenger compartment and usually with restroom facilities, for high-speed long distance service.
G–3
TRANSPORTATION ENERGY DATA BOOK: EDITION 36—2017
Motor bus: Rubber-tired, self-propelled, manually-steered bus with fuel supply on board the vehicle. Motor bus types include intercity, school, and transit.
School and other nonrevenue bus: Bus services for which passengers are not directly
charged for transportation, either on a per passenger or per vehicle basis. Transit bus: A bus designed for frequent stop service with front and center doors,
normally with a rear-mounted diesel engine, low-back seating, and without luggage storage compartments or restroom facilities.
Trolley coach: Rubber-tired electric transit vehicle, manually-steered, propelled by a
motor drawing current, normally through overhead wires, from a central power source not on board the vehicle.
Calendar year – The period of time between January 1 and December 31 of any given year. Captive imports – Products produced overseas specifically for domestic manufacturers. Car size classifications – Size classifications of cars are established by the Environmental
Protection Agency (EPA) as follows: Minicompact – less than 85 cubic feet of passenger and luggage volume. Subcompact – between 85 to 99 cubic feet of passenger and luggage volume. Compact – between 100 to 109 cubic feet of passenger and luggage volume. Midsize – between 110 to 119 cubic feet of passenger and luggage volume. Large – 120 cubic feet or more of passenger and luggage volume. Two seater – cars designed primarily to seat only two adults. Small station wagon – less than 130 cubic feet of passenger and luggage volume.
Mid-size station wagon – between 130 to 159 cubic feet of passenger and luggage volume.
Large station wagon – 160 or more cubic feet of passenger and luggage volume. Carbon dioxide (CO2) – A colorless, odorless, non-poisonous gas that is a normal part of the
ambient air. Carbon dioxide is a product of fossil fuel combustion. Carbon monoxide (CO) – A colorless, odorless, highly toxic gas that is a by-product of
incomplete fossil fuel combustion. Carbon monoxide, one of the major air pollutants, can be harmful in small amounts if breathed over a certain period of time.
Car-mile (railroad) – A single railroad car moved a distance of one mile. Cargo ton-mile – See Ton-mile. Certificated route air carriers – See Air carriers. Class I freight railroad – See Rail. Coal slurry – Finely crushed coal mixed with sufficient water to form a fluid.

G–4
TRANSPORTATION ENERGY DATA BOOK: EDITION 36—2017
Combination trucks – Consist of a power unit (a truck tractor) and one or more trailing units (a semi-trailer or trailer). The most frequently used combination is popularly referred to as a "tractor-semitrailer" or "tractor trailer."
Commercial sector – An energy-consuming sector that consists of service-providing facilities of:
businesses; Federal, State, and local governments; and other private and public organizations, such as religious, social or fraternal groups. Includes institutional living quarters.
Commuter rail – A mode of transit service (also called metropolitan rail, regional rail, or
suburban rail) characterized by an electric or diesel propelled railway for urban passenger train service consisting of local short distance travel operating between a central city and adjacent suburbs.
Compact car – See car size classifications. Compression ignition – The form of ignition that initiates combustion in a diesel engine. The
rapid compression of air within the cylinders generates the heat required to ignite the fuel as it is injected.
Constant dollars – A time series of monetary figures is expressed in constant dollars when the effect of change over time in the purchasing power of the dollar has been removed. Usually the data are expressed in terms of dollars of a selected year or the average of a set of years.
Consumer Price Index (CPI) – A measure of the average change over time in the prices paid by
urban consumers for a market basket of consumer goods and services.
Continuous discharge capacity – Measured as percent of rated energy capacity. Energy delivered in a constant power discharge required by an electric vehicle for hill climbing and/or high-speed cruise, specified as the percent of its rated energy capacity delivered in a one hour constant-power discharge.
Conventional Refueling Station – An establishment for refueling motor vehicles with traditional
transportation fuels, such as gasoline and diesel fuel. Corporate Average Fuel Economy (CAFE) Standards – CAFE standards were originally
established by Congress for new cars, and later for light trucks, in Title V of the Motor Vehicle Information and Cost Savings Act (15 U.S.C.1901, et seq.) with subsequent amendments. Under CAFE, car manufacturers are required by law to produce vehicle fleets with a composite sales-weighted fuel economy which cannot be lower than the CAFE standards in a given year, or for every vehicle which does not meet the standard, a fine of $5.00 is paid for every one-tenth of a mpg below the standard.
Criteria pollutant – A pollutant determined to be hazardous to human health and regulated under
EPA's National Ambient Air Quality Standards. The 1970 amendments to the Clean Air Act require EPA to describe the health and welfare impacts of a pollutant as the "criteria" for inclusion in the regulatory regime.

G–5
TRANSPORTATION ENERGY DATA BOOK: EDITION 36—2017
Crude oil – A mixture of hydrocarbons that exists in the liquid phase in natural underground reservoirs and remains liquid at atmospheric pressure after passing through surface separating facilities. Crude oil production is measured at the wellhead and includes lease condensate.
Crude oil imports – The volume of crude oil imported into the 50 States and the District of
Columbia, including imports from U.S. territories, but excluding imports of crude oil into the Hawaiian Foreign Trade Zone.
Curb weight – The weight of a vehicle including all standard equipment, spare tire and wheel, all
fluids and lubricants to capacity, full tank of fuel, and the weight of major optional accessories normally found on the vehicle.
Current dollars – Represents dollars current at the time designated or at the time of the
transaction. In most contexts, the same meaning would be conveyed by the use of the term "dollars." See also constant dollars.
Demand Response – A transit mode that includes passenger cars, vans, and small buses operating
in response to calls from passengers to the transit operator who dispatches the vehicles. The vehicles do not operate over a fixed route on a fixed schedule. Can also be known as paratransit or dial-a-ride.
Diesel fuel – See Distillate fuel oil. Disposable personal income – See Income. Distillate fuel oil – The lighter fuel oils distilled off during the refining process. Included are
products known as ASTM grades numbers 1 and 2 heating oils, diesel fuels, and number 4 fuel oil. The major uses of distillate fuel oils include heating, fuel for on-and off-highway diesel engines, and railroad diesel fuel.
Domestic air operator – See Air carrier. Domestic water transportation – See Internal water transportation. E85 – 85% ethanol and 15% gasoline. E95 – 95% ethanol and 5% gasoline. Electric utilities sector – Consists of privately and publicly owned establishments which generate
electricity primarily for resale. Emission standards – Limits or ranges established for pollution levels emitted by vehicles as well
as stationary sources. The first standards were established under the 1963 Clean Air Act.
End-use sector – See Sector.
Energy capacity – Often measured in kilowatt hours. The energy delivered by the battery up to termination of discharge specified by the battery manufacturer.
G–6
TRANSPORTATION ENERGY DATA BOOK: EDITION 36—2017
Energy efficiency – In reference to transportation, the inverse of energy intensiveness: the ratio
of outputs from a process to the energy inputs; for example, miles traveled per gallon of fuel (mpg).
Energy intensity – In reference to transportation, the ratio of energy inputs to a process to the
useful outputs from that process; for example, gallons of fuel per passenger-mile or Btu per ton-mile.
Ethanol (C2H5OH) – Otherwise known as ethyl alcohol, alcohol, or grain-spirit. A clear,
colorless, flammable oxygenated hydrocarbon with a boiling point of 78.5 degrees Celsius in the anhydrous state. In transportation, ethanol is used as a vehicle fuel by itself (E100 – 100% ethanol by volume), blended with gasoline (E85 – 85% ethanol by volume), or as a gasoline octane enhancer and oxygenate (10% by volume).
Excise tax – Paid when purchases are made on a specific good, such as gasoline. Excise taxes are
often included in the price of the product. There are also excise taxes on activities, such as highway usage by trucks.
Ferry boat – A transit mode comprising vessels carrying passengers and in some cases vehicles over a body of water, and that are generally steam or diesel-powered.
Fixed operating cost – See Operating cost. Fleet vehicles – Private fleet vehicles: Ideally, a vehicle could be classified as a member of a fleet if it is: a) operated in mass by a corporation or institution, b) operated under unified control, or c) used for non-personal activities. However, the definition of a fleet is not consistent throughout the fleet industry. Some
companies make a distinction between cars that were bought in bulk rather than singularly, or whether they are operated in bulk, as well as the minimum number of vehicles that constitute a fleet (i.e. 4 or 10).
Government fleet vehicles: Includes vehicles owned by all Federal, state, county, city, and metro units of government, including toll road operations. Foreign freight – Movements between the United States and foreign countries and between Puerto
Rico, the Virgin Islands, and foreign countries. Trade between U.S. territories and possessions (e.g. American Samoa, Guam, North Mariana Islands and U.S. Outlying Islands) and foreign countries is excluded. Traffic to or from the Panama Canal Zone is included, but traffic with U.S. origin and U.S. destination traveling through the Panama Canal is not.
Gas Guzzler Tax – Originates from the 1978 Energy Tax Act (Public Law 95-618). A new car purchaser is required to pay the tax if the car purchased has a combined city/highway fuel economy rating that is below the standard for that year. For model years 1986 and later, the standard is 22.5 mpg.
G–7
TRANSPORTATION ENERGY DATA BOOK: EDITION 36—2017
Gasohol – A mixture of 10% anhydrous ethanol and 90% gasoline by volume; 7.5% anhydrous ethanol and 92.5% gasoline by volume; or 5.5% anhydrous ethanol and 94.5% gasoline by volume. There are other fuels that contain methanol and gasoline, but these fuels are not referred to as gasohol.
Gasoline – See Motor gasoline. General aviation – That portion of civil aviation which encompasses all facets of aviation except
air carriers. It includes any air taxis, commuter air carriers, and air travel clubs which do not hold Certificates of Public Convenience and Necessity.
Global warming potential (GWP) – An index used to compare the relative radiative forcing of
different gases without directly calculating the changes in atmospheric concentrations. GWPs are calculated as the ratio of the radiative forcing that would result from the emission of one kilogram of a greenhouse gas to that from the emission of one kilogram of carbon dioxide over a fixed period of time, such as 100 years.
Greenhouse gases – Those gases, such as water vapor, carbon dioxide, nitrous oxide, methane, hydrofluorocarbons (HFCs), perfluorocarbons (PFCs) and sulfur hexafluoride, that are transparent to solar (short-wave) radiation but opaque to long-wave (infrared) radiation, thus preventing long-wave radiant energy from leaving Earth's atmosphere. The net effect is a trapping of absorbed radiation and a tendency to warm the planet's surface.
Gross National Product – A measure of monetary value of the goods and services becoming available to the nation from economic activity. Total value at market prices of all goods and services produced by the nation's economy. Calculated quarterly by the Department of Commerce, the Gross National Product is the broadest available measure of the level of economic activity.
Gross vehicle weight (gvw) – The weight of the empty truck plus the maximum anticipated load
weight, including passengers, fluids, and cargo. Gross vehicle weight rating (gvwr) – The gross vehicle weight which is assigned to each new
truck by the manufacturer. This rating may be different for trucks of the same model because of certain features, such as heavy-duty suspension. Passenger cars are not assigned gross vehicle weight ratings.
Heavy-heavy truck – See Truck size classifications. Heavy rail – A mode of transit service (also called metro, subway, rapid transit, or rapid rail)
operating on an electric railway with the capacity for a heavy volume of traffic. Characterized by high speed and rapid acceleration of passenger rail cars.
Household – Consists of all persons who occupy a housing unit, including the related family members and all unrelated persons, if any, who share the housing unit.
Housing unit – A house, apartment, a group of rooms, or a single room occupied or intended for
occupancy as separate living quarters. Separate living quarters are those in which the

G–8
TRANSPORTATION ENERGY DATA BOOK: EDITION 36—2017
occupants do not live and eat with any other persons in the structure and which have either (1) direct access from the outside of the building or through a common hallway intended to be used by the occupants of another unit or by the general public, or (2) complete kitchen facilities for the exclusive use of the occupants. The occupants may be a single family, one person living alone, two or more families living together, or any other group of related or unrelated persons who share living arrangements.
Hybrid-electric vehicles – Combines the benefits of gasoline engines and electric motors and can
be configured to obtain different objectives, such as improved fuel economy, increased power, or additional auxiliary power for electronic devices and power tools.
Hydrocarbon (HC) – A compound that contains only hydrogen and carbon. The simplest and lightest forms of hydrocarbon are gaseous. With greater molecular weights they are liquid, while the heaviest are solids.
Income – Disposable personal income: Personal income less personal tax and non-tax payments. National income: The aggregate earnings of labor and property which arise in the current
production of goods and services by the nation's economy. Personal income: The current income received by persons from all sources, net of
contributions for social insurance. Industrial sector – Construction, manufacturing, agricultural and mining establishments. Inertia weight – The curb weight of a vehicle plus 300 pounds. Intercity bus – See Bus. Intermodal – Transportation activities involving more than one mode of transportation, including
transportation connections and coordination of various modes.
Internal water transportation – Includes all local (intraport) traffic and traffic between ports or landings wherein the entire movement takes place on inland waterways. Also termed internal are movements involving carriage on both inland waterways and the water of the Great Lakes, and inland movements that cross short stretches of open water that link inland systems.
International air operator – See Air carrier. International freight – See Foreign freight. Jet fuel – Includes both naphtha-type and kerosene-type fuels meeting standards for use in aircraft
turbine engines. Although most jet fuel is used in aircraft, some is used for other purposes such as generating electricity in gas turbines.
Kerosene-type jet fuel: A quality kerosene product with an average gravity of 40.7
degrees API and 10% to 90% distillation temperatures of 217 to 261 degrees Celsius. Used

G–9
TRANSPORTATION ENERGY DATA BOOK: EDITION 36—2017
primarily as fuel for commercial turbojet and turboprop aircraft engines. It is a relatively low freezing point distillate of the kerosene type.
Naphtha-type jet fuel: A fuel in the heavy naphtha boiling range with an average gravity
of 52.8 degrees API and 10% to 90% distillation temperatures of 117 to 233 degrees Celsius used for turbojet and turboprop aircraft engines, primarily by the military. Excludes ramjet and petroleum.
Kerosene – A petroleum distillate in the 300 to 500 degrees Fahrenheit boiling range and generally
having a flash point higher than 100 degrees Fahrenheit by the American Society of Testing and Material (ASTM) Method D56, a gravity range from 40 to 46 degrees API, and a burning point in the range of 150 to 175 degrees Fahrenheit. It is a clean-burning product suitable for use as an illuminant when burned in wick lamps. Includes grades of kerosene called range oil having properties similar to Number 1 fuel oil, but with a gravity of about 43 degrees API and an end point of 625 degrees Fahrenheit. Used in space heaters, cooking stoves, and water heaters.
Kerosene-type jet fuel – See Jet fuel. Large car – See Car size classifications. Lease Condensate – A liquid recovered from natural gas at the well or at small gas/oil separators
in the field. Consists primarily of pentanes and heavier hydrocarbons (also called field condensate).
Light duty vehicles – Cars and light trucks combined. Light truck – Unless otherwise noted, light trucks are defined in this publication as two-axle,
four-tire trucks. The U.S. Bureau of Census classifies all trucks with a gross vehicle weight less than 10,000 pounds as light trucks (See Truck size classifications).
Light-heavy truck – See Truck size classifications. Light rail – Mode of transit service (also called streetcar, tramway or trolley) operating passenger
rail cars singly (or in short, usually two-car or three-car trains) on fixed rails in right-of-way that is often separated from other traffic for part or much of the way.
Liquefied petroleum gas (lpg) – Consists of propane and butane and is usually derived from natural gas. In locations where there is no natural gas and the gasoline consumption is low, naphtha is converted to lpg by catalytic reforming.
Load factor – Total passenger miles divided by total vehicle miles. Low emission vehicle – Any vehicle certified to the low emission standards which are set by the
Federal government and/or the state of California. M85 – 85% methanol and 15% gasoline. M100 – 100% methanol.

G–10
TRANSPORTATION ENERGY DATA BOOK: EDITION 36—2017
Medium truck – See Truck size classifications. Methanol (CH3OH) – A colorless highly toxic liquid with essentially no odor and very little taste.
It is the simplest alcohol and boils at 64.7 degrees Celsius. In transportation, methanol is used as a vehicle fuel by itself (M100), or blended with gasoline (M85).
Midsize car – See Car size classifications. Minicompact car – See Car size classifications. Model year – In this publication, model year is referring to the "sales" model year, the period from
October 1 to the next September 31. Motor bus – See Bus. Motor gasoline – A mixture of volatile hydrocarbons suitable for operation of an internal
combustion engine whose major components are hydrocarbons with boiling points ranging from 78 to 217 degrees Celsius and whose source is distillation of petroleum and cracking, polymerization, and other chemical reactions by which the naturally occurring petroleum hydrocarbons are converted into those that have superior fuel properties.
Regular gasoline: Gasoline having an antiknock index, i.e., octane rating, greater than or
equal to 85 and less than 88. Note: Octane requirements may vary by altitude. Midgrade gasoline: Gasoline having an antiknock index, i.e., octane rating, greater than
or equal to 88 and less than or equal to 90. Note: Octane requirements may vary by altitude. Premium gasoline: Gasoline having an antiknock index, i.e., octane rating, greater than
90. Note: Octane requirements may vary by altitude. Reformulated gasoline: Finished motor gasoline formulated for use in motor vehicles,
the composition and properties of which meet the requirements of the reformulated gasoline regulations promulgated by the U.S. Environmental Protection Agency under Section 211(k) of the Clean Air Act. For more details on this clean fuel program see http://www.epa.gov/otaq/fuels/gasolinefuels/rfg/index.htm. Note: This category includes oxygenated fuels program reformulated gasoline (OPRG) but excludes reformulated gasoline blendstock for oxygenate blending (RBOB).
MTBE – Methyl Tertiary Butyl Ether–a colorless, flammable, liquid oxygenated hydrocarbon
containing 18.15 percent oxygen. Naphtha-type jet fuel – See Jet fuel. National income – See Income. Nationwide Personal Transportation Survey (NPTS) – A nationwide survey of households that
provides information on the characteristics and personal travel patterns of the U.S.
G–11
TRANSPORTATION ENERGY DATA BOOK: EDITION 36—2017
population. Surveys were conducted in 1969, 1977, 1983, 1990, and 1995 by the U.S. Bureau of Census for the U.S. Department of Transportation.
Natural gas – A mixture of hydrocarbon compounds and small quantities of various non-
hydrocarbons existing in the gaseous phase or in solution with crude oil in natural underground reservoirs at reservoir conditions.
Natural gas, dry: Natural gas which remains after: 1) the liquefiable hydrocarbon portion
has been removed from the gas stream; and 2) any volumes of nonhydrocarbon gases have been removed where they occur in sufficient quantity to render the gas unmarketable. Dry natural gas is also known as consumer-grade natural gas. The parameters for measurement are cubic feet at 60 degrees Fahrenheit and 14.73 pounds per square inch absolute.
Natural gas, wet: The volume of natural gas remaining after removal of lease condensate
in lease and/or field separation facilities, if any, and after exclusion of nonhydrocarbon gases where they occur in sufficient quantity to render the gas unmarketable. Natural gas liquids may be recovered from volumes of natural gas, wet after lease separation, at natural gas processing plants.
Natural gas plant liquids: Natural gas liquids recovered from natural gas in processing
plants and from natural gas field facilities and fractionators. Products obtained include ethane, propane, normal butane, isobutane, pentanes plus, and other products from natural gas processing plants.
Nitrogen oxides (NOx) – A product of combustion of fossil fuels whose production increases with
the temperature of the process. It can become an air pollutant if concentrations are excessive.
Nonattainment area – Any area that does not meet the national primary or secondary ambient air
quality standard established by the Environmental Protection Agency for designated pollutants, such as carbon monoxide and ozone.
Oil Stocks – Oil stocks include crude oil (including strategic reserves), unfinished oils, natural gas
plant liquids, and refined petroleum products. Operating cost – Fixed operating cost: In reference to passenger car operating cost, refers to those
expenditures that are independent of the amount of use of the car, such as insurance costs, fees for license and registration, depreciation and finance charges.
Variable operating cost: In reference to passenger car operating cost, expenditures which
are dependent on the amount of use of the car, such as the cost of gas and oil, tires, and other maintenance.
Organization for Economic Cooperation and Development (OECD) – Consists of Australia,
Austria, Belgium, Canada, Chile, Czech Republic, Denmark, Estonia, Finland, France, Germany, Greece, Hungary, Iceland, Ireland, Israel, Italy, Japan, Luxembourg, Mexico, Netherlands, New Zealand, Norway, Poland, Portugal, Slovak Republic, Slovenia, South Korea, Spain, Sweden, Switzerland, Turkey, United Kingdom, and United States. Total

G–12
TRANSPORTATION ENERGY DATA BOOK: EDITION 36—2017
OECD includes the United States Territories (Guam, Puerto Rico, and the U.S. Virgin Islands). Total OECD excludes data for Czech Republic, Hungary, Mexico, Poland, and South Korea which are not yet available.
OECD Europe: Consists of Austria, Belgium, Czech Republic, Denmark, Estonia,
Finland, France, Germany, Greece, Hungary, Iceland, Ireland, Italy, Luxembourg, Netherlands, Norway, Poland, Portugal, Slovak Republic, Slovenia, Spain, Sweden, Switzerland, Turkey, and United Kingdom. OECD Europe excludes data for Czech Republic, Hungary, and Poland which are not yet available.
OECD Pacific: Consists of Australia, Japan, South Korea, and New Zealand. Organization for Petroleum Exporting Countries (OPEC) – Includes Algeria, Angola,
Ecuador, Iran, Iraq, Kuwait, Libya, Nigeria, Qatar, Saudi Arabia, United Arab Emirates, and Venezuela.
Arab OPEC – Consists of Algeria, Bahrain, Egypt, Iraq, Kuwait, Libya, Qatar, Saudi Arabia, Syria, Tunisia, and the United Arab Emirates.
Other single-unit truck – See Single-unit truck. Oxygenate – A substance which, when added to gasoline, increases the amount of oxygen in that
gasoline blend. Includes fuel ethanol, methanol, and methyl tertiary butyl ether (MTBE).
Paratransit – Mode of transit service (also called demand response or dial-a-ride) characterized by the use of passenger cars, vans or small buses operating in response to calls from passengers or their agents to the transit operator, who then dispatches a vehicle to pick up the passengers and transport them to their destinations.
Particulates – Carbon particles formed by partial oxidation and reduction of the hydrocarbon fuel. Also included are trace quantities of metal oxides and nitrides, originating from engine wear, component degradation, and inorganic fuel additives. In the transportation sector, particulates are emitted mainly from diesel engines.
Passenger-miles traveled (PMT) – One person traveling the distance of one mile. Total
passenger-miles traveled, thus, give the total mileage traveled by all persons. Passenger rail – See Rail, "Amtrak" and "Transit Railroad". Persian Gulf countries – Consists of Bahrain, Iran, Iraq, Kuwait, Qatar, Saudi Arabia, and the
United Emirates. Personal Consumption Expenditures (PCE) – As used in the national accounts, the market value
of purchases of goods and services by individuals and nonprofit institutions and the value of food, clothing, housing, and financial services received by them as income in kind. It includes the rental value of owner-occupied houses but excludes purchases of dwellings, which are classified as capital goods (investment).
Personal income – See Income.

G–13
TRANSPORTATION ENERGY DATA BOOK: EDITION 36—2017
Petroleum – A generic term applied to oil and oil products in all forms, such as crude oil, lease
condensate, unfinished oil, refined petroleum products, natural gas plant liquids, and non-hydrocarbon compounds blended into finished petroleum products.
Petroleum consumption: A calculated demand for petroleum products obtained by
summing domestic production, imports of crude petroleum and natural gas liquids, imports of petroleum products, and the primary stocks at the beginning of the period and then subtracting the exports and the primary stocks at the end of the period.
Petroleum exports: Shipments of petroleum products from the 50 States and the District
of Columbia to foreign countries, Puerto Rico, the Virgin Islands, and other U.S. possessions and territories.
Petroleum imports: All imports of crude petroleum, natural gas liquids, and petroleum
products from foreign countries and receipts from Guam, Puerto Rico, the Virgin Islands, and the Hawaiian Trade Zone. The commodities included are crude oil, unfinished oils, plant condensate, and refined petroleum products.
Petroleum inventories: The amounts of crude oil, unfinished oil, petroleum products, and
natural gas liquids held at refineries, at natural gas processing plants, in pipelines, at bulk terminals operated by refining and pipeline companies, and at independent bulk terminals. Crude oil held in storage on leases is also included; these stocks are known as primary stocks. Secondary stocks–those held by jobbers dealers, service station operators, and consumers–are excluded. Prior to 1975, stock held at independent bulk terminals were classified as secondary stocks.
Petroleum products supplied: For each petroleum product, the amount supplied is
calculated by summing production, crude oil burned directly, imports, and net withdrawals from primary stocks and subtracting exports.
Plug-in hybrid-electric vehicles (PHEVs) — Hybrid-electric vehicles with high capacity
batteries that can be charged by plugging them into an electrical outlet or charging station. There are two basic PHEV configurations:
Parallel or Blended PHEV: Both the engine and electric motor are mechanically connected to the wheels, and both propel the vehicle under most driving conditions. Electric-only operation usually occurs only at low speeds.
Series PHEVs, also called Extended Range Electric Vehicles (EREVs): Only the electric motor turns the wheels; the gasoline engine is only used to generate electricity. Series PHEVs can run solely on electricity until the battery needs to be recharged. The gasoline engine will then generate the electricity needed to power the electric motor. For shorter trips, these vehicles might use no gasoline at all.
Processing Gain – The amount by which the total volume of refinery output is greater than the volume of input for given period of time. The processing gain arises when crude oil and

G–14
TRANSPORTATION ENERGY DATA BOOK: EDITION 36—2017
other hydrocarbons are processed into products that are, on average, less dense than the input.
Processing Loss – The amount by which the total volume of refinery output is less than the volume
of input for given period of time. The processing loss arises when crude oil and other hydrocarbons are processed into products that are, on average, denser than the input.
Proved Reserves of Crude Oil – The estimated quantities of all liquids defined as crude oil, which
geological and engineering data demonstrate with reasonable certainty to be recoverable in future years from known reservoirs under existing economic and operating conditions.
Quad – Quadrillion, 1015. In this publication, a Quad refers to Quadrillion Btu. Rail – Amtrak (American Railroad Tracks): Operated by the National Railroad Passenger
Corporation of Washington, DC. This rail system was created by President Nixon in 1970, and was given the responsibility for the operation of intercity, as distinct from suburban, passenger trains between points designated by the Secretary of Transportation.
Class I freight railroad: Defined by the Interstate Commerce Commission each year based on annual operating revenue. A railroad is dropped from the Class I list if it fails to meet the annual earnings threshold for three consecutive years.
Commuter railroad: Those portions of mainline railroad (not electric railway)
transportation operations which encompass urban passenger train service for local travel between a central city and adjacent suburbs. Commuter railroad service–using both locomotive-hauled and self-propelled railroad passenger cars–is characterized by multi-trip tickets, specific station-to-station fares, and usually only one or two stations in the central business district. Also known as suburban railroad.
Transit railroad: Includes "heavy" and "light" transit rail. Heavy transit rail is
characterized by exclusive rights-of-way, multi-car trains, high speed rapid acceleration, sophisticated signaling, and high platform loading. Also known as subway, elevated railway, or metropolitan railway (metro). Light transit rail may be on exclusive or shared rights-of-way, high or low platform loading, multi-car trains or single cars, automated or manually operated. In generic usage, light rail includes streetcars, trolley cars, and tramways.
Refiner sales price – Sales from the refinery made directly to ultimate consumers, including bulk
consumers (such as agriculture, industry, and electric utilities) and residential and commercial consumers.
Reformulated gasoline (RFG) – See Motor gasoline. RFG area – An ozone nonattainment area designated by the Environmental Protection Agency
which requires the use of reformulated gasoline. Residential sector – An energy consuming sector that consists of living quarters for private
households. Excludes institutional living quarters.
G–15
TRANSPORTATION ENERGY DATA BOOK: EDITION 36—2017
Residential Transportation Energy Consumption Survey (RTECS) – This survey was
designed by the Energy Information Administration of the Department of Energy to provide information on how energy is used by households for personal vehicles. It has been conducted five times since 1979, the most recent being 1991.
Residual fuel oil – The heavier oils that remain after the distillate fuel oils and lighter
hydrocarbons are boiled off in refinery operations. Included are products know as ASTM grade numbers 5 and 6 oil, heavy diesel oil, Navy Special Fuel Oil, Bunker C oil, and acid sludge and pitch used as refinery fuels. Residual fuel oil is used for the production of electric power, for heating, and for various industrial purposes.
Rural – Usually refers to areas with population less than 5,000. Sales period – October 1 of the previous year to September 30 of the given year. Approximately
the same as a model year. Sales-weighted miles per gallon (mpg) – Calculation of a composite vehicle fuel economy based
on the distribution of vehicle sales. Scrappage rate – As applied to motor vehicles, it is usually expressed as the percentage of
vehicles of a certain type in a given age class that are retired from use (lacking registration) in a given year.
School and other nonrevenue bus – See Bus. Sector – A group of major energy-consuming components of U.S. society developed to measure
and analyze energy use. The sectors most commonly referred to are: residential, commercial, industrial, transportation, and electric power.
Single-unit truck – Includes two-axle, four-tire trucks and other single-unit trucks. Two-axle, four-tire truck: A motor vehicle consisting primarily of a single motorized
device with two axles and four tires. Other single-unit truck: A motor vehicle consisting primarily of a single motorized
device with more than two axles or more than four tires. Spark ignition engine – An internal combustion engine in which the charge is ignited electrically
(e.g., with a spark plug).
Special fuels – Consist primarily of diesel fuel with small amount of liquefied petroleum gas, as defined by the Federal Highway Administration.
Specific acceleration power – Measured in watts per kilogram. Acceleration power divided by
the battery system weight. Weight must include the total battery system. Specific energy – Measured in watt hours per kilogram. The rated energy capacity of the battery
divided by the total battery system weight.
G–16
TRANSPORTATION ENERGY DATA BOOK: EDITION 36—2017
Subcompact car – See Car size classifications. Supplemental air carrier – See Air carrier. Survival rate – As applied to motor vehicles, it is usually expressed as the percentage of vehicles
of a certain type in a given age class that will be in use at the end of a given year.
Tax incentives – In general, a means of employing the tax code to stimulate investment in or development of a socially desirable economic objective without direct expenditure from the budget of a given unit of government. Such incentives can take the form of tax exemptions or credits.
Test weight – The weight setting at which a vehicle is tested on a dynamometer by the U.S. Environmental Protection Agency (EPA). This weight is determined by the EPA using the inertia weight of the vehicle.
Ton-mile – The movement of one ton of freight the distance of one mile. Ton-miles are computed
by multiplying the weight in tons of each shipment transported by the distance hauled. Transmission types – A3 – Automatic three speed A4 – Automatic four speed A5 – Automatic five speed L4 – Automatic lockup four speed M5 – Manual five speed Transit bus – See Bus. Transit railroad – See Rail. Transportation sector – Consists of both private and public passenger and freight transportation,
as well as government transportation, including military operations. Truck Inventory and Use Survey (TIUS) – Survey designed to collect data on the characteristics
and operational use of the nation's truck population. It is conducted every five years by the U.S. Bureau of the Census. Surveys were conducted in 1963, 1967, 1972, 1977, 1982, 1987, and 1992. For the 1997 survey, it was renamed the Vehicle Inventory and Use Survey in anticipation of including additional vehicle types. However, no additional vehicle types were added to the 1997 survey.
Trolleybus – Mode of transit service (also called transit coach) using vehicles propelled by a motor
drawing current from overhead wires via connecting poles called a trolley pole, from a central power source not onboard the vehicle.
Truck size classifications – U.S. Bureau of the Census has categorized trucks by gross vehicle weight (gvw) as follows:
Light – Less than 10,000 pounds gvw (Also see Light Truck.)

G–17
TRANSPORTATION ENERGY DATA BOOK: EDITION 36—2017
Medium – 10,001 to 20,000 pounds gvw Light-heavy – 20,001 to 26,000 pounds gvw Heavy-heavy – 26,001 pounds gvw or more. Two-axle, four-tire truck – See Single-unit truck. Two seater car – See Car size classifications. Ultra-low emission vehicle – Any vehicle certified to the ultra-low emission standards which are
set by the Federal government and/or the state of California. Urban – Usually refers to areas with population of 5,000 or greater. Vanpool: A ridesharing prearrangement using vans or small buses providing round-trip
transportation between the participant’s prearranged boarding points and a common and regular destination.
Variable operating cost – See Operating cost. Vehicle Inventory and Use Survey – Last conducted in 2002. See Truck Inventory and Use
Survey. Vehicle-miles traveled (vmt) – One vehicle traveling the distance of one mile. Total vehicle
miles, thus, is the total mileage traveled by all vehicles. Volatile organic compounds (VOCs) – Organic compounds that participate in atmospheric
photochemical reactions. Waterborne Commerce –
Coastwise: Domestic traffic receiving a carriage over the ocean, or the Gulf of Mexico. Traffic between Great Lakes ports and seacoast ports, when having a carriage over the ocean, is also termed Coastwise.
Domestic: Includes coastwise, lakewise, and internal waterborne movements.
Foreign: Waterborne import, export, and in-transit traffic between the United States, Puerto Rico and the Virgin Islands and any foreign country.
Internal: Vessel movements (origin and destination) which take place solely on inland waterways. An inland waterway is one geographically located within the boundaries of the contiguous 48 states or within the boundaries of the State of Alaska.
Lakewise: Waterborne traffic between the United States ports on the Great Lakes System. The Great Lakes System is treated as a separate waterway system rather than as a part of the inland waterway system. In comparing historical data for the Great Lakes System, one should note that prior to calendar year 1990, marine products, sand and gravel being moved
G–18
TRANSPORTATION ENERGY DATA BOOK: EDITION 36—2017
from the Great Lakes to Great Lake destinations were classified as local traffic. From 1990-on, these activities are classified as lakewise traffic.
Well-to-wheel – A life cycle analysis used in transportation to consider the entire energy cycle for a given mode, rather than just tailpipe emissions. The analysis starts at the primary energy source and ends with the turning wheels of the vehicle.
Zero-emission vehicle – Any vehicle certified to the zero emission standards which are set by the
Federal government and/or the state of California. These standards apply to the vehicle emissions only.
![ENERGY EFFICIENCY OF ROAD VEHICLES TRENDS AND …vehicles (LDV) accounted for the major share, with about 50-60% [8, 9]. Nowadays, road transportation is almost entirely dependent](https://img.pdfslide.us/doc/110x75/5f06586c7e708231d4178781/energy-efficiency-of-road-vehicles-trends-and-vehicles-ldv-accounted-for-the-major.jpg)