Embed Size (px)
Citation preview
Transportation, Distribution and Logistics in Indiana
Reha Uzsoy, Ph.D., P.E.Director, Laboratory for Extended Enterprises at Purdue
Professor of Industrial Engineering
(765) 494-0829
Supported by the Central Indiana Corporate Partnership
Strengths in Indiana
• Location and infrastructure– Major interstates, crossroads of America
• Extensive industrial base that is used to operating in demanding TDL environments– JIT logistics for the auto companies
• Strong universities• Extensive network of regional campuses
and community colleges
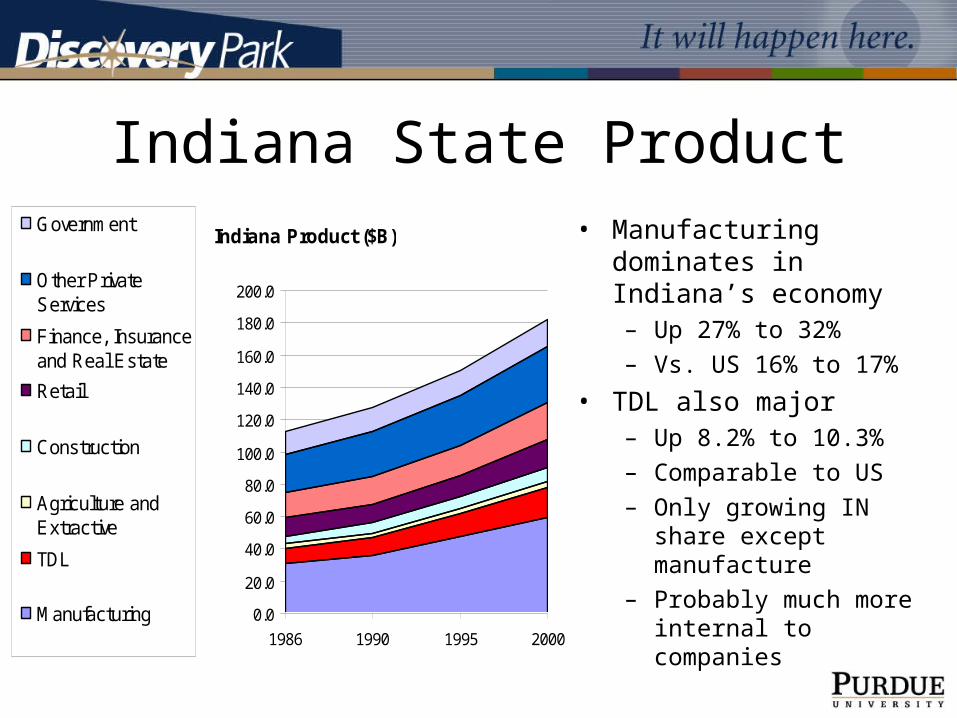
Indiana State Product• Manufacturing dominates in
Indiana’s economy– Up 27% to 32%
– Vs. US 16% to 17%
• TDL also major– Up 8.2% to 10.3%
– Comparable to US
– Only growing IN share except manufacture
– Probably much more internal to companies
Indiana Product ($B)
0.0
20.0
40.0
60.0
80.0
100.0
120.0
140.0
160.0
180.0
200.0
1986 1990 1995 2000
Government
Other PrivateServices
Finance, Insuranceand Real Estate
Retail
Construction
Agriculture andExtractive
TDL
Manufacturing
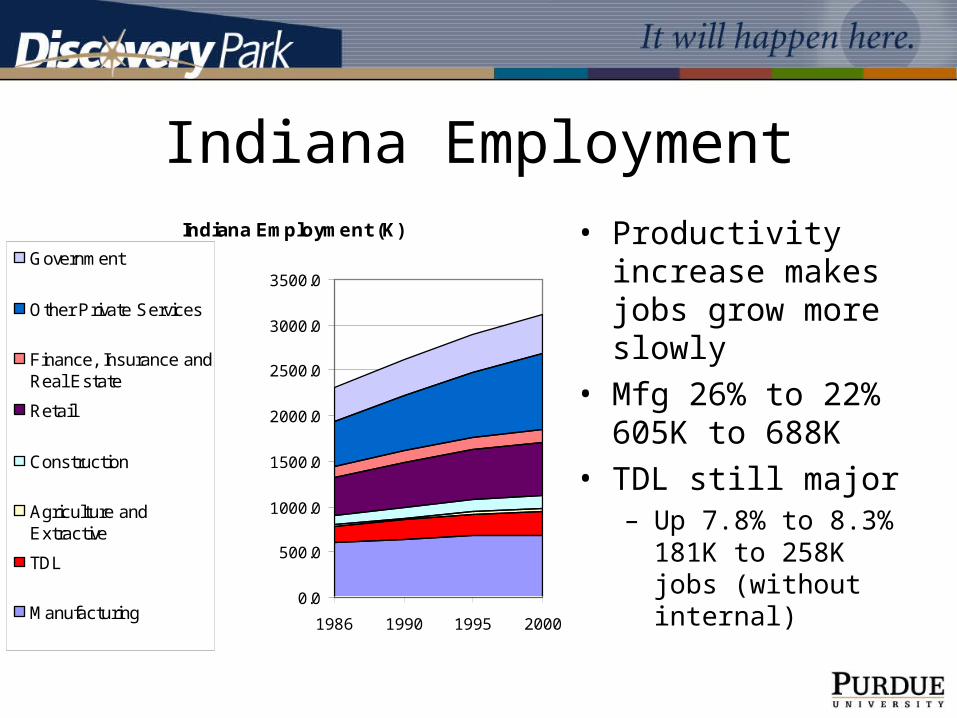
Indiana Employment• Productivity increase
makes jobs grow more slowly
• Mfg 26% to 22% 605K to 688K
• TDL still major– Up 7.8% to 8.3% 181K
to 258K jobs (without internal)
Indiana Employment (K)
0.0
500.0
1000.0
1500.0
2000.0
2500.0
3000.0
3500.0
1986 1990 1995 2000
Government
Other Private Services
Finance, Insurance andReal Estate
Retail
Construction
Agriculture andExtractive
TDL
Manufacturing
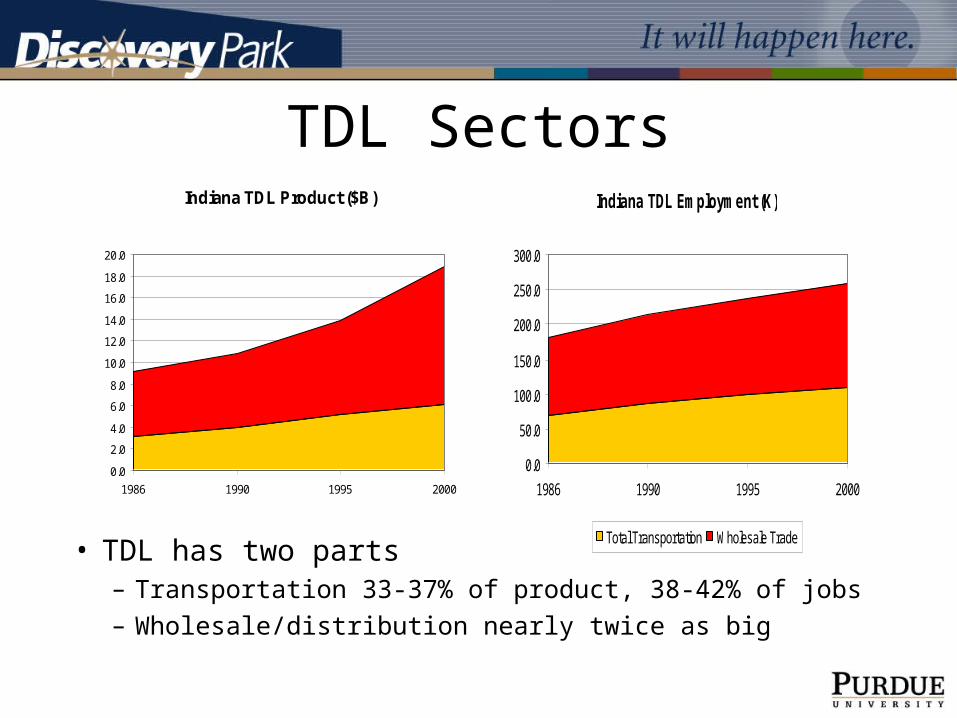
TDL SectorsIndiana TDL Product ($B)
0.0
2.0
4.0
6.0
8.0
10.0
12.0
14.0
16.0
18.0
20.0
1986 1990 1995 2000
Indiana TDL Employment (K)
0.0
50.0
100.0
150.0
200.0
250.0
300.0
1986 1990 1995 2000
Total Transportation Wholesale Trade• TDL has two parts
– Transportation 33-37% of product, 38-42% of jobs– Wholesale/distribution nearly twice as big
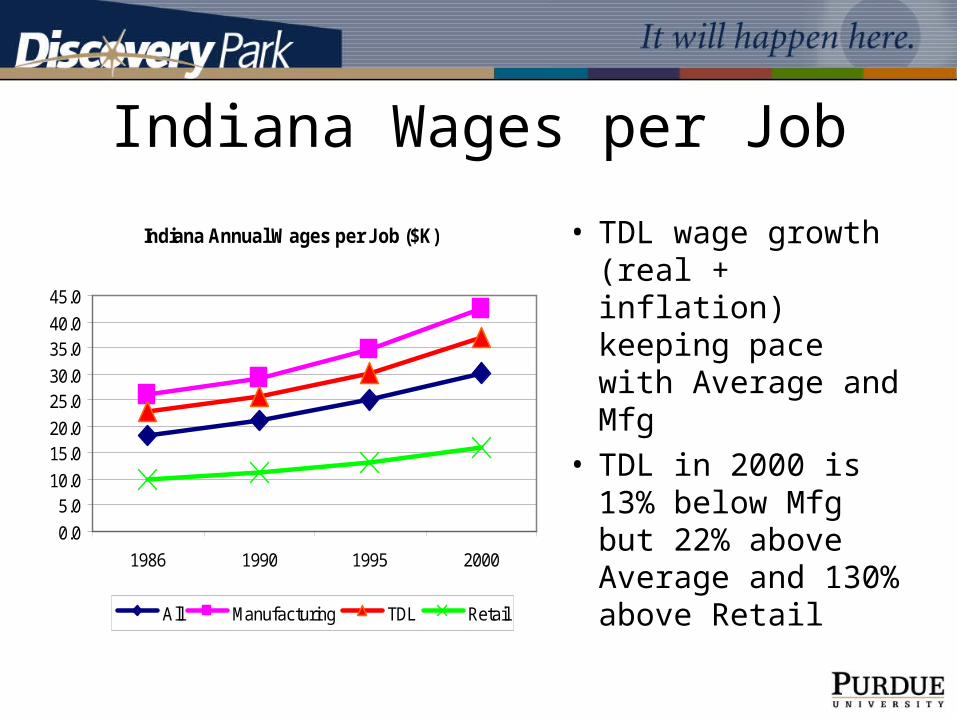
Indiana Wages per Job
Indiana Annual Wages per Job ($K)
0.0
5.010.0
15.020.0
25.030.0
35.040.0
45.0
1986 1990 1995 2000
All Manufacturing TDL Retail
• TDL wage growth (real + inflation) keeping pace with Average and Mfg
• TDL in 2000 is 13% below Mfg but 22% above Average and 130% above Retail
TDL Effects on Other Industries• Input-Output multipliers try to estimate the impact of
economic activity in one sector on the whole economy
• For purposes of this study we used Regional Input-Output Multipliers (RIMS II) information purchased from the U.S. Bureau of Economic Analysis (BEA)– Based on 1997 national benchmark data, in combination with 2000
regional and national output and employment estimates
– Separate values for Indiana alone, and whole United States
Two Directions
• We considered multiplier effects in two directions
• First, what is the full economic impact of TDL activity within different categories?– On total demand, wages, and employment
• Second, what would be the impact on TDL demand of expanded manufacturing activity, especially in high tech “Battelle” categories?
• Both done for all U.S. and for Indiana alone
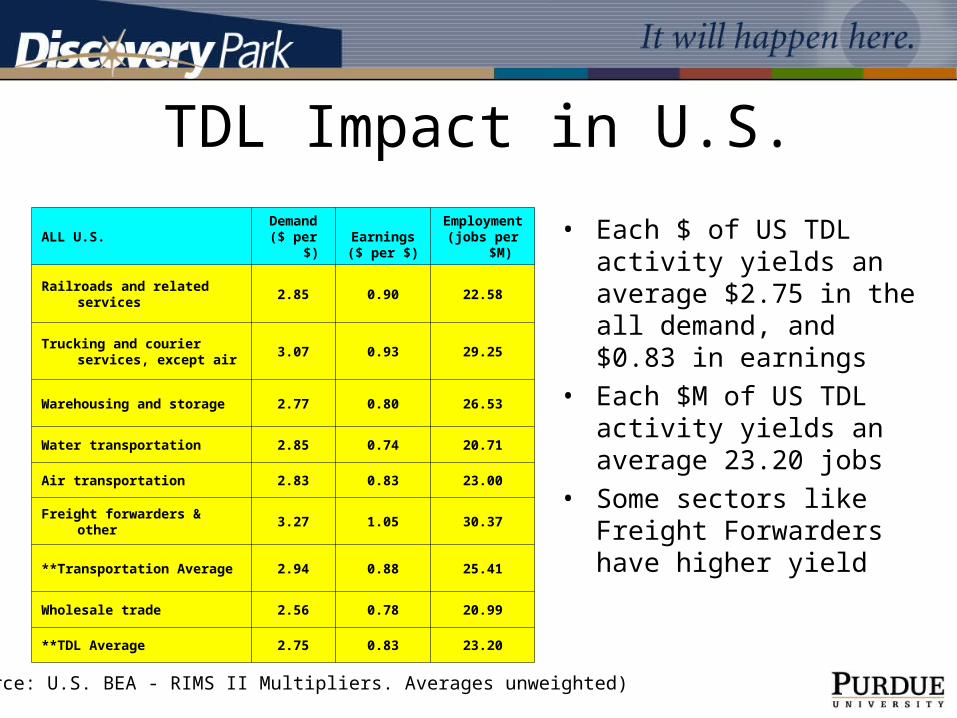
TDL Impact in U.S.
• Each $ of US TDL activity yields an average $2.75 in the all demand, and $0.83 in earnings
• Each $M of US TDL activity yields an average 23.20 jobs
• Some sectors like Freight Forwarders have higher yield
ALL U.S. Demand($ per $)
Earnings($ per $)
Employment(jobs per $M)
Railroads and related services 2.85 0.90 22.58
Trucking and courier services, except air
3.07 0.93 29.25
Warehousing and storage 2.77 0.80 26.53
Water transportation 2.85 0.74 20.71
Air transportation 2.83 0.83 23.00
Freight forwarders & other 3.27 1.05 30.37
**Transportation Average 2.94 0.88 25.41
Wholesale trade 2.56 0.78 20.99
**TDL Average 2.75 0.83 23.20
(Source: U.S. BEA - RIMS II Multipliers. Averages unweighted)
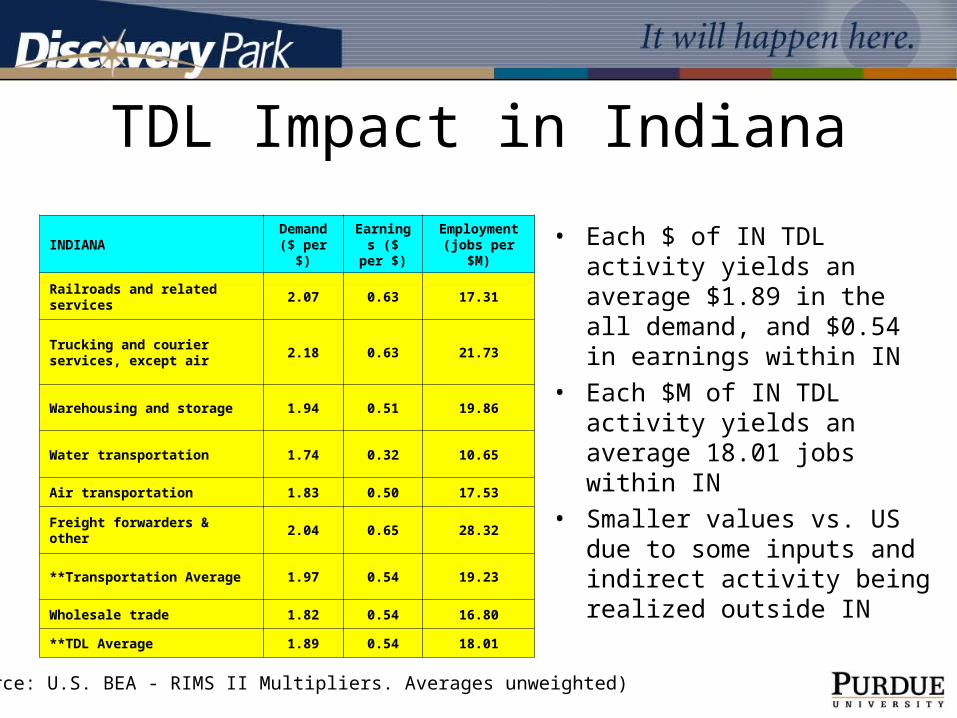
TDL Impact in Indiana
INDIANA Demand ($ per $)
Earnings ($ per $)
Employment (jobs per $M)
Railroads and related services 2.07 0.63 17.31
Trucking and courier services, except air
2.18 0.63 21.73
Warehousing and storage 1.94 0.51 19.86
Water transportation 1.74 0.32 10.65
Air transportation 1.83 0.50 17.53
Freight forwarders & other 2.04 0.65 28.32
**Transportation Average 1.97 0.54 19.23
Wholesale trade 1.82 0.54 16.80
**TDL Average 1.89 0.54 18.01
• Each $ of IN TDL activity yields an average $1.89 in the all demand, and $0.54 in earnings within IN
• Each $M of IN TDL activity yields an average 18.01 jobs within IN
• Smaller values vs. US due to some inputs and indirect activity being realized outside IN
(Source: U.S. BEA - RIMS II Multipliers. Averages unweighted)
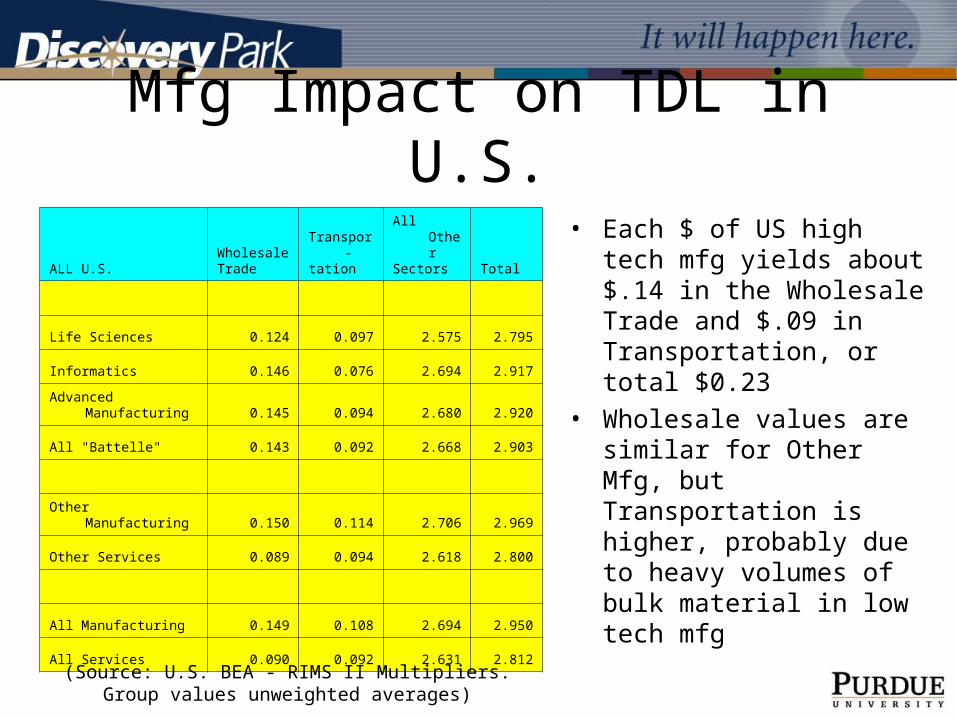
Mfg Impact on TDL in U.S.
• Each $ of US high tech mfg yields about $.14 in the Wholesale Trade and $.09 in Transportation, or total $0.23
• Wholesale values are similar for Other Mfg, but Transportation is higher, probably due to heavy volumes of bulk material in low tech mfg
ALL U.S.WholesaleTrade
Transpor-tation
All OtherSectors Total
Life Sciences 0.124 0.097 2.575 2.795
Informatics 0.146 0.076 2.694 2.917
Advanced Manufacturing 0.145 0.094 2.680 2.920
All "Battelle" 0.143 0.092 2.668 2.903
Other Manufacturing 0.150 0.114 2.706 2.969
Other Services 0.089 0.094 2.618 2.800
All Manufacturing 0.149 0.108 2.694 2.950
All Services 0.090 0.092 2.631 2.812
(Source: U.S. BEA - RIMS II Multipliers.Group values unweighted averages)
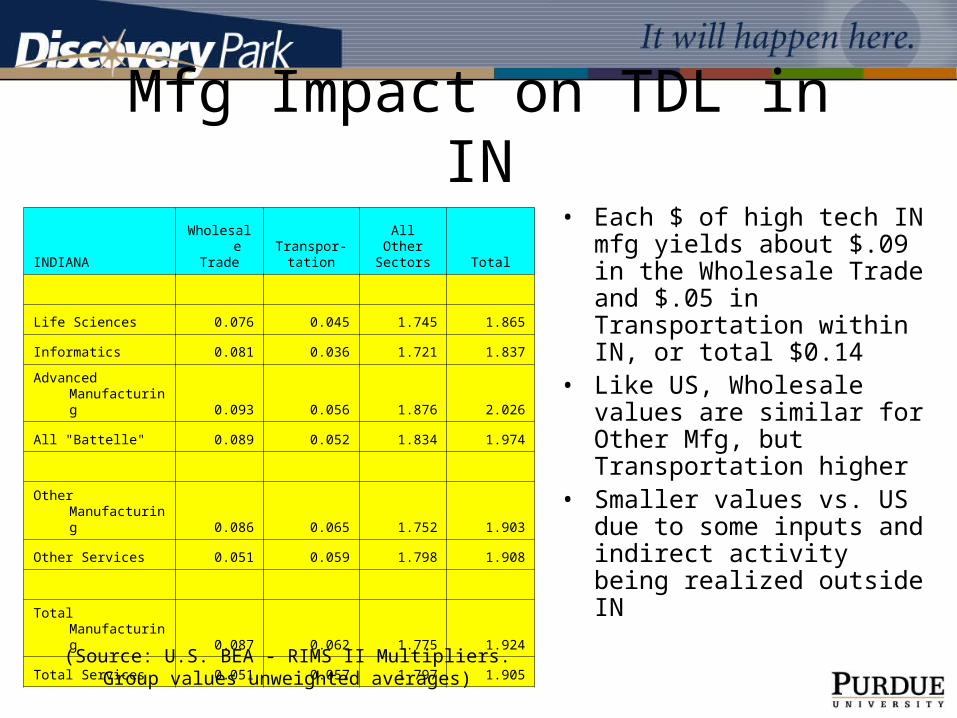
Mfg Impact on TDL in IN
INDIANAWholesale
TradeTranspor-
tation
AllOther
Sectors Total
Life Sciences 0.076 0.045 1.745 1.865
Informatics 0.081 0.036 1.721 1.837
Advanced Manufacturing 0.093 0.056 1.876 2.026
All "Battelle" 0.089 0.052 1.834 1.974
Other Manufacturing 0.086 0.065 1.752 1.903
Other Services 0.051 0.059 1.798 1.908
Total Manufacturing 0.087 0.062 1.775 1.924
Total Services 0.051 0.057 1.797 1.905
• Each $ of high tech IN mfg yields about $.09 in the Wholesale Trade and $.05 in Transportation within IN, or total $0.14
• Like US, Wholesale values are similar for Other Mfg, but Transportation higher
• Smaller values vs. US due to some inputs and indirect activity being realized outside IN
(Source: U.S. BEA - RIMS II Multipliers.Group values unweighted averages)
And So…
• Case for TDL as an important part of the Indiana economy appears pretty solid
• Potential for significant growth in the future
• Significant effects on other industries in the state as well as employment
• Many advantages in Indiana!– Even the competition says so!

Vision
• Indiana as the home of an innovative, world-class TDL sector supported by creative public-private partnerships, innovative technology firms and enlightened, informed economic policies developed with the participation of all stakeholders

Role of Higher Education
• Provide intellectual capital through federal and industrial research
• Work with stakeholders to support economic policy decisions
• Significant role in workforce development
• We are all in this together!!
Current Status
• TDL initiative located in Purdue’s Center for Advanced Manufacturing
• 21st century proposal submitted with significant industrial, academic support– Not successful
• Currently reworking concepts, seeking industrial and academic partners