Embed Size (px)
Citation preview
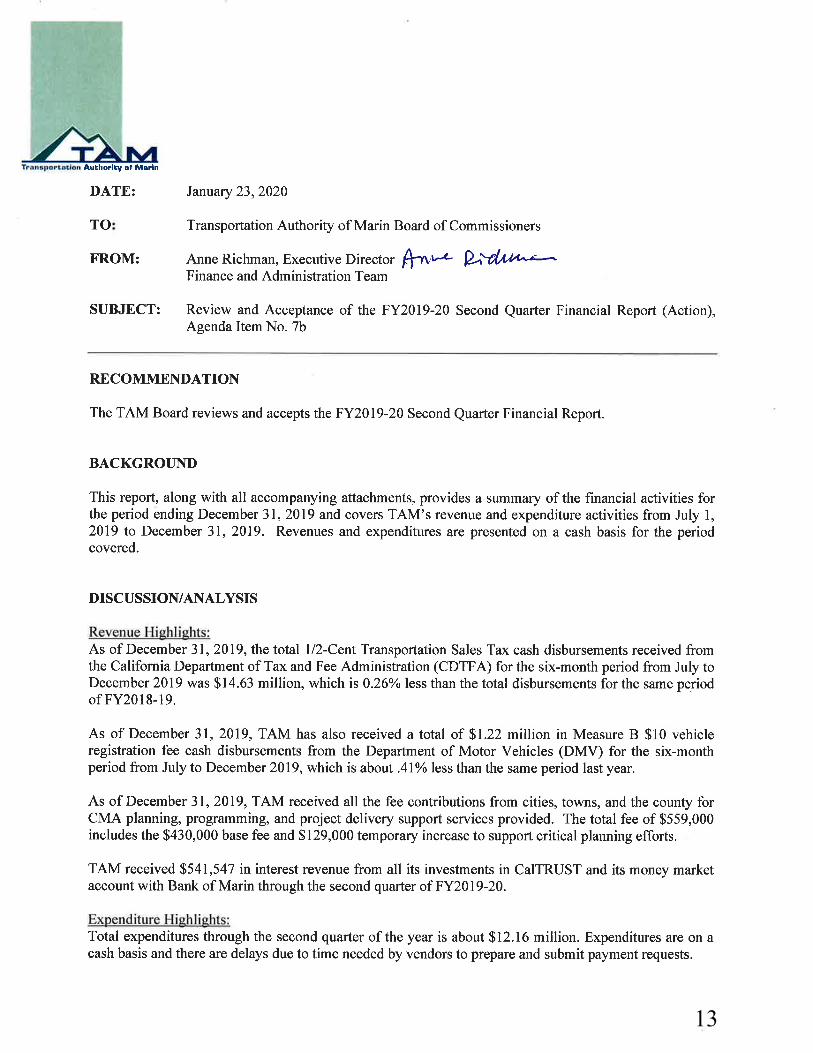
13

TAM Board Meeting, Item 7b Page 2 of 3 January 23, 2020
Budget Amendments: The following previously approved budget amendments are included in the FY2019-20 Second Quarter Financial Report:
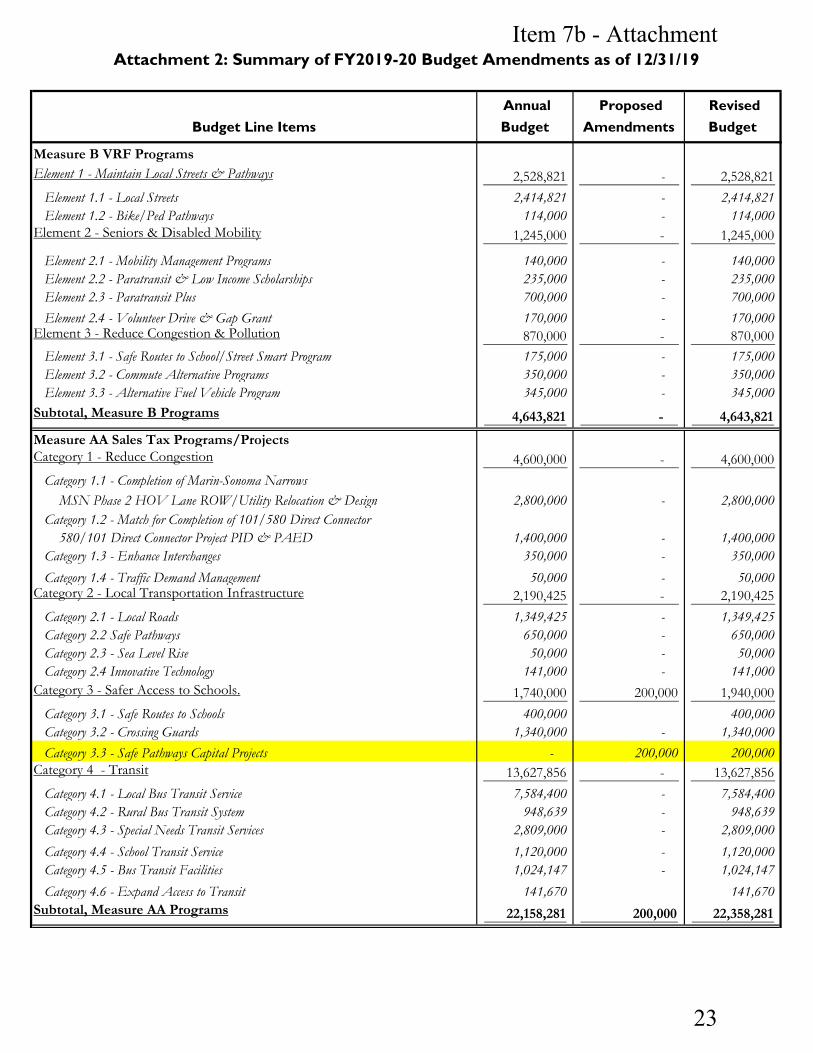
• Increase the “Category 3.3 – Safe Pathways Capital Projects” budget line by $200,000, from none to $200,000. This increase is based on the programming of funds for Small Projects under the Measure AA Fourth Cycle Safe Pathways to Schools Call for Projects to accommodate the reimbursement requests that are expected during the current fiscal year. The bulk of the reimbursement requests are expected in FY2021-22 and FY2022-23. This budget amendment was approved by the TAM Board at its October 24, 2019 meeting.
• Increase the “Bellam Blvd 101 Off-ramp Improvements – Design & R/W” budget line by $170,000, from $250,000 to $420,000, to cover the additional design work and the right-of-way costs so the project can be shovel ready. Funds from the Measure AA Major Roads Set-Aside will be used for this effort. The amount was approved by the TAM Board at its November 21, 2019 meeting, as part of the actions associated with the access improvements for the approaches to the Richmond-San Rafael Bridge.
• Increase the “Sir Francis Drake Flyover Bike Path Barrier” budget line by $80,000, from $100,000
to $180,000, to cover the consultant support needed to finalize the Class IV Bikeway construction documents. Funds from the Measure AA Major Roads Set-Aside will be used for this effort. The amount was approved by the TAM Board at its November 21, 2019 meeting, as part of the actions associated with the access improvements for the approaches to the Richmond-San Rafael Bridge.
• Add the “BATA – Class IV Bikeway on the I-580 Sir Francis Drake Blvd Off-Ramp” budget line
for $1.30 million, for an interagency agreement with BATA to provide construction oversight and administration during construction of the bikeway. Funds from the Measure AA Major Roads Set-Aside will be used for this effort. The amount was approved by the TAM Board at its November 21, 2019 meeting as part of the actions associated with the access improvements for the approaches to the Richmond-San Rafael Bridge.
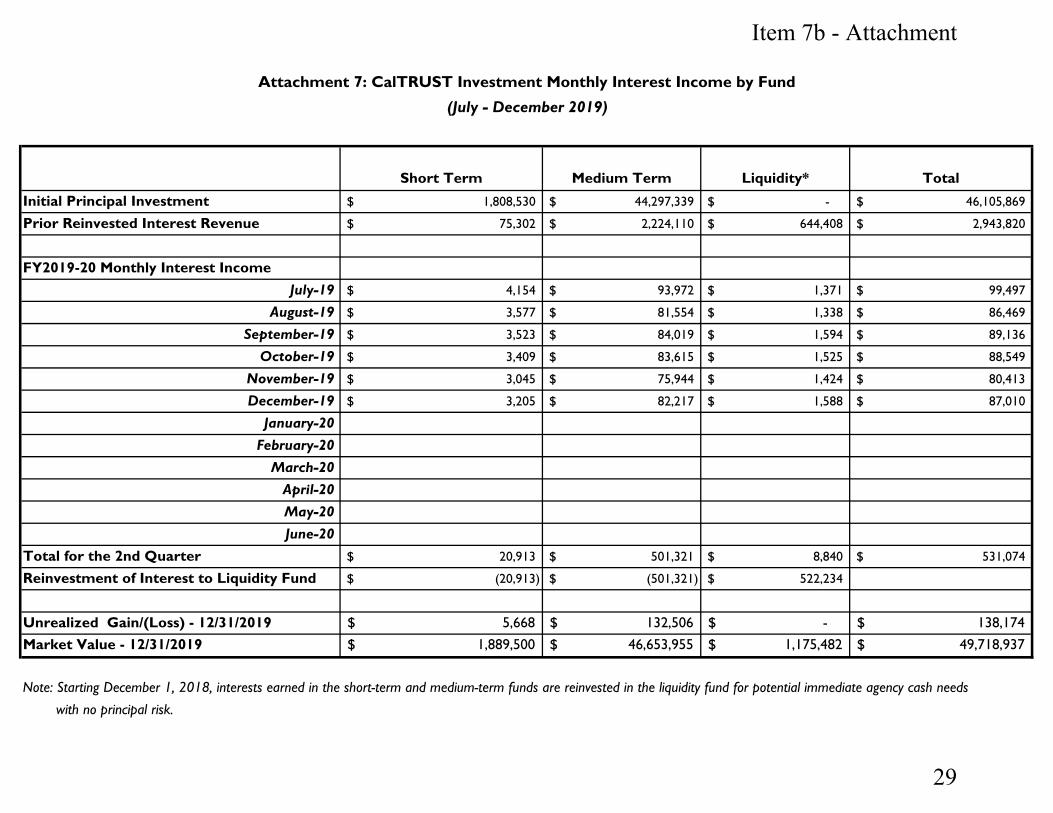
Investment with CalTRUST: Attachment 7 of the staff report provides a detailed investment report for each of the CalTRUST funds TAM invests in. As of December 31, 2019, interest earning from all funds totaled $531,075, with unrealized gain of $138,174. FISCAL CONSIDERATION None NEXT STEPS Third Quarter Financial Report for FY2019-20 will be provided for review in April 2020. ATTACHMENTS Attachment 1 FY2019-20 Budget to Actual Comparison as of 12/31/2019
14

TAM Board Meeting, Item 7b Page 3 of 3 January 23, 2020
Attachment 2 Summary of FY2019-20 Budget Amendments as of 12/31/2019 Attachment 3 FY2019-20 Revenue and Expenditure Report as of 12/31/2019– Measure A Sales Tax
Detail Attachment 4 FY2019-20 Revenue and Expenditure Report as of 12/31/2019 – Measure AA Sales Tax
Detail Attachment 5 5.1: Monthly Measure A/AA Sales Tax Disbursement Comparison
5.2: Annual Measure A/AA Sales Tax Actual Vs. Budget Comparison Attachment 6 FY2019 and FY2020 Monthly Measure B VRF Disbursement Comparison Attachment 7 CalTRUST Investment Monthly Interest Income by Fund Attachment 8 8.1: FY2019-20 Budget Revenue Overview by Funding Source
8.2: FY2019-20 Budget Expenditure Overview by Category Attachment 9 Transportation Acronyms
15

THIS PAGE LEFT BLANK INTENTIONALLY
16

Budget Line Items Annual Budget
Actual 12/31/19
$ Difference
Actual as % of Budget
Measure A/AA Sales Tax Revenue 27,500,000 14,630,672 (12,869,328) 53.20%Measure B VRF Revenue 2,400,000 1,218,657 (1,181,343) 50.78%Cities/Towns and County Contribution 559,000 558,999 (1) 100.00%Interest Revenue - Note 1 910,000 541,546 (368,454) 59.51%MTC STP/CMAQ Planning Fund and OBAG Grants 1,039,487 132,218 (907,269) 12.72%MTC Regional Measure 2 Fund 5,528,889 - (5,528,889) 0.00%Marin Transportation For Clean Air Funding 363,000 - (363,000) 0.00%Regional TFCA Competitive Grant 283,637 - (283,637) 0.00%State STIP PPM Fund 160,813 27,685 (133,128) 17.22%STIP/RTIP/ITIP Funds/SB1 Local Partnership 948,500 - (948,500) 0.00%Nonmotorized Transportation Pilot Program Fund 19,000 - (19,000) 0.00%MTC Climate Initiatives Program Grant 72,091 20,349 (51,742) 28.23%Federal STP Fund 600,000 - (600,000) 0.00%Caltrans Bus On Shoulder Grant 88,000 - (88,000) 0.00%Realized Highway 101 ROW Excess Fund 4,349,000 - (4,349,000) 0.00%Total Revenue Available 44,821,417 17,130,127 (27,691,290) 38.22%
EXPENDITURESAdministrationSalaries & Benefits 2,600,596 1,376,048 1,224,548 52.91%Pension and OPEB Section 115 Trust Pre-Funding 157,470 - 157,470 0.00%Office Lease 260,000 149,860 110,140 57.64%Agencywide IT and Computer Equipment Upgrade 10,000 2,651 7,349 26.51%Equipment Purchase/Lease 10,000 3,554 6,446 35.54%Telephone/Internet/ Web Hosting Services 25,000 13,916 11,084 55.66%Office Supplies 31,000 12,245 18,755 39.50%Updates and Technical Support for TAM Website 20,000 2,368 17,632 11.84%Classification Study 30,000 - 30,000 0.00%Insurance 11,000 10,496 504 95.42%Financial Audit 20,000 - 20,000 0.00%Legal Services 80,000 12,781 67,219 15.98%Document/Video/Marketing Material Production 45,000 15,109 29,891 33.58%Memberships 25,000 17,271 7,729 69.09%Travel/Meetings/Conferences 40,000 16,347 23,653 40.87%Professional Development 8,000 576 7,424 7.20%Human Resources/Board Support 60,000 6,114 53,886 10.19%Information Technology Support 45,000 19,808 25,193 44.02%Annual Support & Upgrade of Financial System 10,000 - 10,000 0.00%Misc. Expenses 15,000 9,648 5,352 64.32%Subtotal, Administration 3,503,066 1,668,791 1,834,275 47.64%
Professional Services - Bellam Blvd 101 Off-ramp Improvements - Design & R/W 250,000 119,529 130,471 47.81%
Attachment 1: FY2019-20 Budget to Actual Comparison as of 12/31/19Item 7b - Attachment
17

Budget Line Items Annual Budget
Actual 12/31/19
$ Difference
Actual as % of Budget
Attachment 1: FY2019-20 Budget to Actual Comparison as of 12/31/19
SFD Flyover Bike Path Barrier 100,000 - 100,000 0.00%CMP Update/Traffic Monitoring 60,000 30,671 29,329 51.12%Traffic Model Maintenance & Update 80,000 29,315 50,685 36.64%Trip Monitoring and Reporting 25,000 - 25,000 0.00%Project Management Oversight 400,000 46,298 353,702 11.57%MSN B7/B8 Phase 2 ROW Utilityn 1,100,000 551,105 548,895 50.10%MSN San Antonio Curve Correction Construction Support 40,000 14,491 25,509 36.23%HOV Gap Closure Mitigation - Brookdale /Maintenance 6,000 3,000 3,000 50.00%State Legislative Assistance 42,000 17,500 24,500 41.67%Financial Advisor/Sales Tax Audit Services 40,000 35,226 4,774 88.06%North-South Greenway Gap Closure / PS&E & CM Services 400,000 13,929 386,071 3.48%Public Outreach Service Support 45,000 - 45,000 0.00%Street Smart Program Implementation 19,000 9,400 9,600 49.47%CMFC Onsite Re-Vegetation Mitigation Monitoring and Reporting 2,500 3,388 (888) 135.53%Bus On Shoulder Feasibility Study 100,000 - 100,000 0.00%Consulting Pool 70,000 - 70,000 0.00%Subtotal, Professional Services 2,779,500 873,851 1,905,649 31.44%
Measure A Sales Tax Programs/ProjectsMeasure A Compliance Audit 20,000 - 20,000 0.00%Bike/Ped Path Maintenance 100,000 - 100,000 0.00%Central Marin Ferry Connector - SMART Insurance Policy 10,000 - 10,000 0.00%Strategy 1 - Transit 5,284,100 1,924,935 3,359,165 36.43%
Substrategy 1.1 - Local Bus Transit Service 2,015,600 1,699,572 316,028 84.32%Substrategy 1.2 - Rural Bus Transit System - - - 0.00%Substrategy 1.3 - Special Needs Transit Services - - - 0.00%Substrategy 1.4 - Bus Transit Facilities 3,268,500 225,363 3,043,137 6.89%
Strategy 2 - Hwy 101 Gap Closure 300,000 - 300,000 0.00%STP/HIP Swap Project 300,000 - 300,000 0.00%
Strategy 3 - Local Transportation Infrastructure 6,243,544 1,857,537 4,386,007 29.75%Substrategy 3.1 - Major Roads 3,800,000 172,107 3,627,893 4.53%Substrategy 3.2 - Local Roads 2,443,544 1,685,430 758,114 68.97%
Strategy 4 - Safer Access to Schools. 2,151,000 639,050 1,511,950 29.71%Substrategy 4.1 - Safe Routes to Schools 550,000 353,708 196,292 64.31%Substrategy 4.2 - Crossing Guards 350,000 285,343 64,657 81.53%Substrategy 4.3 - Safe Pathways to School
Safe Pathways Plan Development - - - 0.00% Safe Pathway Capital Projects 1,251,000 - 1,251,000 0.00%
Subtotal, Measure A Programs 14,108,644 4,421,522 9,687,122 31.34%
Item 7b - Attachment
18

Budget Line Items Annual Budget
Actual 12/31/19
$ Difference
Actual as % of Budget
Attachment 1: FY2019-20 Budget to Actual Comparison as of 12/31/19
Measure B VRF ProgramsElement 1 - Maintain Local Streets & Pathways 2,528,821 1,665,619 863,202 65.87%
Element 1.1 - Local Streets 2,414,821 1,665,619 749,202 Element 1.2 - Bike/Ped Pathways 114,000 - 114,000 0.00%
Element 2 - Seniors & Disabled Mobility 1,245,000 210,472 1,034,528 16.91%
Element 2.1 - Mobility Management Programs 140,000 16,225 123,775 11.59%Element 2.2 - Paratransit & Low Income Scholarships 235,000 68,484 166,516 29.14%Element 2.3 - Paratransit Plus 700,000 97,265 602,735 13.90%Element 2.4 - Volunteer Drive & Gap Grant 170,000 28,498 141,502 16.76%
Element 3 - Reduce Congestion & Pollution 870,000 173,302 696,698 19.92%Element 3.1 - Safe Routes to School/Street Smart Program 175,000 54,150 120,850 30.94%Element 3.2 - Commute Alternative Programs 350,000 82,816 267,184 23.66%Element 3.3 - Alternative Fuel Vehicle Program 345,000 36,336 308,664 10.53%
Subtotal, Measure B Programs 4,643,821 2,049,394 2,594,427 44.13%
Measure AA Sales Tax Programs/ProjectsCategory 1 - Reduce Congestion 4,600,000 55,506 4,544,494 1.21%
Category 1.1 - Completion of Marin-Sonoma Narrows MSN Phase 2 HOV Lane ROW/Utility Relocation & Design 2,800,000 - 2,800,000 0.00%Category 1.2 - Match for Completion of 101/580 Direct Connector 580/101 Direct Connector Project PID & PAED 1,400,000 55,506 1,344,494 3.96%Category 1.3 - Enhance Interchanges 350,000 - 350,000 0.00%Category 1.4 - Traffic Demand Management 50,000 - 50,000 0.00%
Category 2 - Local Transportation Infrastructure 2,190,425 930,765 1,259,660 42.49%Category 2.1 - Local Roads 1,349,425 930,765 418,660 68.97%Category 2.2 Safe Pathways 650,000 - 650,000 0.00%Category 2.3 - Sea Level Rise 50,000 - 50,000 0.00%Category 2.4 Innovative Technology 141,000 - 141,000 0.00%
Category 3 - Safer Access to Schools. 1,740,000 159,100 1,580,900 9.14%Category 3.1 - Safe Routes to Schools 400,000 - 400,000 0.00%Category 3.2 - Crossing Guards 1,340,000 159,100 1,180,900 Category 3.3 - Safe Pathways Capital Projects - - -
Category 4 - Transit 13,627,856 1,950,092 11,677,764 14.31%Category 4.1 - Local Bus Transit Service 7,584,400 918,440 6,665,960 12.11%Category 4.2 - Rural Bus Transit System 948,639 456,901 491,738 48.16%Category 4.3 - Special Needs Transit Services 2,809,000 309,568 2,499,432 11.02%Category 4.4 - School Transit Service 1,120,000 265,185 854,815 23.68%Category 4.5 - Bus Transit Facilities 1,024,147 - 1,024,147 0.00%Category 4.6 - Expand Access to Transit 141,670 - 141,670 0.00%
Subtotal, Measure AA Programs 22,158,281 3,095,463 19,062,818 13.97%
Item 7b - Attachment
19

Budget Line Items Annual Budget
Actual 12/31/19
$ Difference
Actual as % of Budget
Attachment 1: FY2019-20 Budget to Actual Comparison as of 12/31/19
Interagency AgreementsNorth-South Greenway (Southern Segment)- County Project Management 150,000 - 150,000 0.00%North-South Greenway (Northern Segment) Cooperative Agreement with Caltrans for Construction 5,000,000 - 5,000,000 0.00%HOV Gap Closure Offsite Landscaping Mitigation Funding Agreement - Caltrans 400,000 - 400,000 0.00%Funding Agreement with County of Marin for Bellam Boulevard Construction and Construction Management 3,955,000 - 3,955,000 0.00%County Lower Marin City Drainage Study Agreement 45,000 33,007 11,993 73.35%Novato Pedestrian Access to Transit and Crosswalk Improvement Project Agreement 318,000 - 318,000 0.00%Marin Transit Bus Facility Lease or Purchase Fund Contribution 1,100,000 - 1,100,000 0.00%Sausalito - Gate 6 Bridgeway Intersection Improvements 73,000 - 73,000 0.00%Corte Madera - Tamal Vista Blvd Bike/Ped Improvements 526,000 - 526,000 0.00%San Anselmo-Hub Reconfiguration Phase I Study 309,000 - 309,000 0.00%Marin County/Caltrans Planning Grant Match Manzanita & Southern Marin Flooding 24,000 - 24,000 0.00%San Rafael - Canal Neighborhood CBTP 55,000 - 55,000 0.00%Caltrans - MSN Phase 2 HOV Lanes ROW and Construction Support 3,750,000 - 3,750,000 0.00%Subtotal, Interagency Agreements 15,705,000 33,007 15,671,993 0.21%
TFCA Programs/Projects ExpendituresNorth/South Greenway Construction 283,637 - 283,637 0.00%TFCA - Reimbursement of Various Capital Projects 768,000 17,250 750,750 2.25%Subtotal, TFCA Programs/Projects 1,051,637 17,250 1,034,387 1.64%Total Expenditures 63,949,949 12,159,279 51,790,670 19.01%
Note 1: Interest includes $7,155 Bank of America Credit Card Account Bonus
Item 7b - Attachment
20

Budget Line Items Annual Budget
Proposed Amendments
Revised Budget
Measure A/AA Sales Tax Revenue 27,500,000 27,500,000 Measure B VRF Revenue 2,400,000 2,400,000 Cities/Towns and County Contribution 559,000 559,000 Interest Revenue 910,000 910,000 MTC STP/CMAQ Planning Fund and OBAG Grants 1,039,487 1,039,487 MTC Regional Measure 2 Fund 5,528,889 5,528,889 Marin Transportation For Clean Air Funding 363,000 363,000 Regional TFCA Competitive Grant 283,637 283,637 State STIP PPM Fund 160,813 160,813 STIP/RTIP/ITIP Funds/SB1 Local Partnership 948,500 948,500 Nonmotorized Transportation Pilot Program Fund 19,000 19,000 MTC Climate Initiatives Program Grant 72,091 72,091 Federal STP Fund 600,000 600,000 Caltrans Bus On Shoulder Grant 88,000 88,000 Realized Highway 101 ROW Excess Fund 4,349,000 4,349,000 Total Revenue Available 44,821,417 - 44,821,417
EXPENDITURESAdministrationSalaries & Benefits 2,600,596 2,600,596 Pension and OPEB Section 115 Trust Pre-Funding 157,470 157,470 Office Lease 260,000 260,000 Agencywide IT and Computer Equipment Upgrade 10,000 10,000 Equipment Purchase/Lease 10,000 10,000 Telephone/Internet/ Web Hosting Services 25,000 25,000 Office Supplies 31,000 31,000 Updates and Technical Support for TAM Website 20,000 20,000 Classification Study 30,000 30,000 Insurance 11,000 11,000 Financial Audit 20,000 20,000 Legal Services 80,000 80,000 Document/Video/Markting Material Production 45,000 45,000 Memberships 25,000 25,000 Travel/Meetings/Conferences 40,000 40,000 Professional Development 8,000 8,000 Human Resources/Board Support 60,000 60,000 Information Technology Support 45,000 45,000 Annual Support & Upgrade of Financial System 10,000 10,000 Misc. Expenses 15,000 15,000 Subtotal, Administration 3,503,066 - 3,503,066
Professional Services - Bellam Blvd 101 Off-ramp Improvements - Design & R/W 250,000 170,000 420,000
Attachment 2: Summary of FY2019-20 Budget Amendments as of 12/31/19Item 7b - Attachment
21

Budget Line Items Annual Budget
Proposed Amendments
Revised Budget
Attachment 2: Summary of FY2019-20 Budget Amendments as of 12/31/19
SFD Flyover Bike Path Barrier 100,000 80,000 180,000 CMP Update/Traffic Monitoring 60,000 60,000 Traffic Model Maintenance & Update 80,000 80,000 Trip Monitoring and Reporting 25,000 25,000 Project Management Oversight 400,000 400,000 MSN B7/B8 Phase 2 ROW Utilityn 1,100,000 1,100,000 MSN San Antonio Curve Correction Construction Support 40,000 40,000 HOV Gap Closure Mitigation - Brookdale /Maintenance 6,000 6,000 State Legislative Assistance 42,000 42,000 Financial Advisor/Sales Tax Audit Services 40,000 40,000 North-South Greenway Gap Closure / PS&E & CM Services 400,000 400,000 Public Outreach Service Support 45,000 45,000 Street Smart Program Implementation 19,000 19,000 CMFC Onsite Re-Vegetation Mitigation Monitoring and Reporting 2,500 2,500 Bus On Shoulder Feasibility Study 100,000 100,000 Consulting Pool 70,000 70,000 Subtotal, Professional Services 2,779,500 250,000 3,029,500
Measure A Sales Tax Programs/ProjectsMeasure A Compliance Audit 20,000 20,000 Bike/Ped Path Maintenance 100,000 - 100,000 Central Marin Ferry Connector - SMART Insurance Policy 10,000 - 10,000 Strategy 1 - Transit 5,284,100 - 5,284,100
Substrategy 1.1 - Local Bus Transit Service 2,015,600 - 2,015,600 Substrategy 1.2 - Rural Bus Transit System - - - Substrategy 1.3 - Special Needs Transit Services - - - Substrategy 1.4 - Bus Transit Facilities 3,268,500 - 3,268,500
Strategy 2 - Hwy 101 Gap Closure 300,000 - 300,000 STP/HIP Swap Project 300,000 - 300,000
Strategy 3 - Local Transportation Infrastructure 6,243,544 - 6,243,544 Substrategy 3.1 - Major Roads 3,800,000 - 3,800,000 Substrategy 3.2 - Local Roads 2,443,544 - 2,443,544
Strategy 4 - Safer Access to Schools. 2,151,000 - 2,151,000 Substrategy 4.1 - Safe Routes to Schools 550,000 - 550,000 Substrategy 4.2 - Crossing Guards 350,000 - 350,000 Substrategy 4.3 - Safe Pathways to School
Safe Pathways Plan Development - - - Safe Pathway Capital Projects 1,251,000 - 1,251,000
Subtotal, Measure A Programs 14,108,644 - 14,108,644
Item 7b - Attachment
22
Budget Line Items Annual Budget
Proposed Amendments
Revised Budget
Attachment 2: Summary of FY2019-20 Budget Amendments as of 12/31/19
Measure B VRF ProgramsElement 1 - Maintain Local Streets & Pathways 2,528,821 - 2,528,821
Element 1.1 - Local Streets 2,414,821 - 2,414,821 Element 1.2 - Bike/Ped Pathways 114,000 - 114,000
Element 2 - Seniors & Disabled Mobility 1,245,000 - 1,245,000
Element 2.1 - Mobility Management Programs 140,000 - 140,000 Element 2.2 - Paratransit & Low Income Scholarships 235,000 - 235,000 Element 2.3 - Paratransit Plus 700,000 - 700,000 Element 2.4 - Volunteer Drive & Gap Grant 170,000 - 170,000
Element 3 - Reduce Congestion & Pollution 870,000 - 870,000 Element 3.1 - Safe Routes to School/Street Smart Program 175,000 - 175,000 Element 3.2 - Commute Alternative Programs 350,000 - 350,000 Element 3.3 - Alternative Fuel Vehicle Program 345,000 - 345,000
Subtotal, Measure B Programs 4,643,821 - 4,643,821
Measure AA Sales Tax Programs/ProjectsCategory 1 - Reduce Congestion 4,600,000 - 4,600,000
Category 1.1 - Completion of Marin-Sonoma Narrows MSN Phase 2 HOV Lane ROW/Utility Relocation & Design 2,800,000 - 2,800,000 Category 1.2 - Match for Completion of 101/580 Direct Connector 580/101 Direct Connector Project PID & PAED 1,400,000 - 1,400,000 Category 1.3 - Enhance Interchanges 350,000 - 350,000 Category 1.4 - Traffic Demand Management 50,000 - 50,000
Category 2 - Local Transportation Infrastructure 2,190,425 - 2,190,425 Category 2.1 - Local Roads 1,349,425 - 1,349,425 Category 2.2 Safe Pathways 650,000 - 650,000 Category 2.3 - Sea Level Rise 50,000 - 50,000 Category 2.4 Innovative Technology 141,000 - 141,000
Category 3 - Safer Access to Schools. 1,740,000 200,000 1,940,000 Category 3.1 - Safe Routes to Schools 400,000 400,000 Category 3.2 - Crossing Guards 1,340,000 - 1,340,000 Category 3.3 - Safe Pathways Capital Projects - 200,000 200,000
Category 4 - Transit 13,627,856 - 13,627,856 Category 4.1 - Local Bus Transit Service 7,584,400 - 7,584,400 Category 4.2 - Rural Bus Transit System 948,639 - 948,639 Category 4.3 - Special Needs Transit Services 2,809,000 - 2,809,000 Category 4.4 - School Transit Service 1,120,000 - 1,120,000 Category 4.5 - Bus Transit Facilities 1,024,147 - 1,024,147 Category 4.6 - Expand Access to Transit 141,670 141,670
Subtotal, Measure AA Programs 22,158,281 200,000 22,358,281
Item 7b - Attachment
23

Budget Line Items Annual Budget
Proposed Amendments
Revised Budget
Attachment 2: Summary of FY2019-20 Budget Amendments as of 12/31/19
Interagency AgreementsNorth-South Greenway (Southern Segment)- County Project Management 150,000 - 150,000 North-South Greenway (Northern Segment) Cooperative Agreement with Caltrans for Construction 5,000,000 - 5,000,000 HOV Gap Closure Offsite Landscaping Mitigation Funding Agreement - Caltrans 400,000 - 400,000 Funding Agreement with County of Marin for Bellam Boulevard Construction and Construction Management 3,955,000 - 3,955,000 County Lower Marin City Drainage Study Agreement 45,000 - 45,000 Novato Pedestrian Access to Transit and Crosswalk Improvement Project Agreement 318,000 - 318,000 Marin Transit Bus Facility Lease or Purchase Fund Contribution 1,100,000 - 1,100,000 Sausalito - Gate 6 Bridgeway Intersection Improvements 73,000 - 73,000 Corte Madera - Tamal Vista Blvd Bike/Ped Improvements 526,000 - 526,000 San Anselmo-Hub Reconfiguration Phase I Study 309,000 - 309,000 Marin County/Caltrans Planning Grant Match Manzanita & Southern Marin Flooding 24,000 - 24,000 San Rafael - Canal Neighborhood CBTP 55,000 - 55,000 Caltrans - MSN Phase 2 HOV Lanes ROW and Construction Support 3,750,000 - 3,750,000 BATA - Class IV Bikeway on the I-580 Sir Francis Drake Blvd Off-Ramp - 1,300,000 1,300,000 Subtotal, Interagency Agreements 15,705,000 1,300,000 17,005,000
TFCA Programs/Projects ExpendituresNorth/South Greenway Construction 283,637 - 283,637 TFCA - Reimbursement of Various Capital Projects 768,000 - 768,000 Subtotal, TFCA Programs/Projects 1,051,637 - 1,051,637 Total Expenditures 63,949,949 1,750,000 65,699,949
Item 7b - Attachment
24

Budget Line Interest 5%
Reserve 1%
Admin 4%
Program Strategy
PM S - 1.1
Local BusS - 1.2
Rural BusS - 1.3Para.
S - 1.4Cap. Imp.
S - 2 Gap Closure/Debt
ReserveS - 3.1
Major RoadsS - 3.2
Local RoadsS - 4.1SR2S
S- 4.2C. Guards
S - 4.3Pathways Total
REVENUE FY2019 Accrual Balance 4,273,288 5,678,498 300,474 303,235 - 2,661,038 (540) (1,620) 4,367,058 - 10,608,769 2,818,844 1,433,119 307,479 1,020,142 33,769,785 FY2020 Revenue 284,940 - 1,033 4,126 - 39,197 3,178 9,534 6,356 - 14,036 14,036 3,495 4,450 3,708 388,087
EXPENSES
ADMINISTRATION Salaries & Benefits 84,909 84,909
Office Lease 149,860 149,860
Agencywide IT and Computer Equipment Upgrade 2,651 2,651
Equipment Purchase/Lease 3,554 3,554
Telephone/Internet/ Web Hosting Services 13,916 13,916
Office Supplies 12,240 12,240
Update/Improvement of TAM Website 2,105 2,105
Classification Study -
Insurance 10,496 10,496
Financial Audit -
Legal Services 10,481 10,481
Document/Video/Markting Material Production 10,637 10,637
Memberships 4,771 4,771
Travel/Meetings/Conferences 13,562 13,562
Professional Development 576 576
Human Resources/Payroll/Board Support 3,882 3,882
Information Technology Support 19,808 19,808
Annual Support & Upgrade of Financial System -
Misc Expenses 909 909
PROFESSIONAL SERVICES -
Bellam Blvd 101 Off-ramp Improvements - Design & R/W -
SFD Flyover Bike Path Barrier -
Project Management Oversight -
Financial Advisor/Sales Tax Audit Services 3,234 3,234
North-South Greenway Gap Closure / PS&E & Services 13,929 13,929
Public Outreach Support -
Consulting Pool -
MEASURE A SALES TAX PROGRAMS/PROJECTS -
Measure A Compliance Audit -
Bike/Ped Path Maintenance -
Central Marin Ferry Connector - SMART Insurance Policy -
Strategy 1 - Transit 1,699,572 225,363 1,924,935
Strategy 2 - Gap Closure / Debt Reserve -
Strategy 3 - Streets & Roads 172,107 1,685,430 1,857,537
Strategy 4- Safe Routes 353,708 265,850 619,558
INTERAGENCY AGREEMENTS -
FA with County of Marin for Bellam Boulevard Construction and Construction Management -
County Lower Marin City Drainage Study Agreement 33,007 33,007
Novato Pedestrian Access to Transit and Crosswalk Improvement Project Agreement -
Marin Transit Bus Facility Lease or Purchase Fund Contribution -
Total Expenses 13,929 - - 347,593 - 1,732,579 - - 225,363 - 172,107 1,685,430 353,708 265,850 - 4,796,559
BALANCE 4,544,299 5,678,498 301,507 (40,232) - 967,655 2,638 7,914 4,148,051 - 10,450,698 1,147,449 1,082,907 46,079 1,023,850 29,361,314
Attachment 3: FY2019-20 Revenue and Expenditure Report as of 12/31/19 – Measure A Sales Tax DetailItem 7b - Attachment
25

Budget Line Interest
Major Road Set Aside $2.35M/Yr
Measure AA 5%
Reserve
Admin Sal & Ben
1%
Programming Management
4%Category 1-4 DM
Subcat 1.1 MSN
Subcat 1.2
101/580
SubCat 1.3
Intrchngs/Flood
SubCat 1.4
TDMSubCat 2.1 Local Roads
SubCat 2.2
Safe Pathways
SubCat 2.3
Sea Level Rise
SubCat 2.4 Innovative
Tech
SubCat 3.1
SR2S
SubCat 3.2
Crossing Guards
SubCat 3.3 SP
Capital Projects
Sub Cat 4.1 Local
Transit
SubCat 4.2 Rural
Transit
SubCat 4.3
Special Needs
SubCat 4.4
School Transit
Svc
SubCat 4.5 Bus
Transit Facilities
SubCat 4.6
Expand Access to
Transit Total
REVENUE
FY2019 Accrual Balance 33,371 410,971 322,284 64,454 257,734 73,816 98,421 147,630 24,606 1,082,620 147,630 49,209 24,605 172,235 344,470 49,209 1,623,929 81,179 350,975 246,051 196,840 24,605 5,826,845
FY2020 Revenue 68,817 783,332 475,920 95,185 380,736 225,000 102,463 136,617 204,926 34,154 1,677,719 228,780 76,261 38,130 247,050 494,102 70,586 2,548,465 231,679 733,649 386,130 308,905 38,613 9,587,218
EXPENSES
ADMINISTRATION
Salaries & Benefits 410,878 410,878
Travel/Meetings/Conferences 45 45
PROFESSIONAL SERVICES -
Bellam Blvd 101 Off-ramp Improvements - Design & R/W 119,529 119,529
Project Management Oversight 10,808 10,808
MEASURE AA SALES TAX PROGRAMS/PROJECTS -
Category 1 - Reduce Congestion 55,506 55,506
Category 2 - Local Transportation Infrastructure 930,765 930,765
Category 3 - Safer Access to Schools 153,846 153,846
Category 4 - Transit 918,440 456,901 309,568 265,185 1,950,092
INTERAGENCY AGREEMENTS -
Funding Agreement with County of Marin for Bellam Boulevard Construction and Construction Management -
Total Expenses - 130,337 - - 410,878 - - 55,506 45 - 930,765 - - - - 153,846 - 918,440 456,901 309,568 265,185 - - 3,631,469
BALANCE 102,188 1,063,966 798,204 159,639 227,592 225,000 176,279 179,531 352,511 58,760 1,829,574 376,410 125,470 62,735 419,285 684,726 119,796 3,253,955 (144,043) 775,057 366,997 505,746 63,218 11,782,593
Attachment 4: FY2019-20 Revenue and Expenditure Report as of 12/31/19 – Measure AA Sales Tax Detail
Item 7b - Attachment
26

FY2019 FY2020 $ Difference % Difference
July 2,399,312 2,532,734 133,421 5.56%
August 2,005,277 2,493,913 488,636 24.37%
September 2,263,404 2,376,037 112,634 4.98%
October 2,914,689 2,731,580 (183,108) -6.28%
November 2,593,145 2,188,080 (405,065) -15.62%
December 2,492,363 2,308,328 (184,035) -7.38%
January 2,526,400
February 2,570,735
March 2,190,995
April 2,357,186
May 1,840,627
June 2,217,415
July - December 14,668,190 14,630,672 (37,518) -0.26%
Annual Disbursement 28,371,547
FY2020 Annual Budget 27,500,000
Attachment 5.1: FY2019 and FY2020 Monthly Measure A/AA Sales Tax Disbursement Comparison(Cash Disbursement from July to June)
Attachment 5.2 Measure A/AA Sales Tax Actual Vs. Budget Comparison
Act
ual /
Bud
get
Act
uals
$15,000,000
$17,000,000
$19,000,000
$21,000,000
$23,000,000
$25,000,000
$27,000,000
$29,000,000
$31,000,000 Actual/Estimate* Budget Expenditure Plan Estimate
Item 7b - Attachment
27

FY2019 FY2020 $ Difference % Difference
July 202,207 191,900 (10,306) -5.10%
August 206,595 222,192 15,597 7.55%
September 193,419 210,893 17,474 9.03%
October 212,902 208,020 (4,882) -2.29%
November 203,044 203,257 213 0.10%
December 205,529 182,395 (23,134) -11.26%
January 187,241
February 185,018
March 230,188
April 179,015
May 207,947
June 198,723
July - December 1,223,696 1,218,657 (5,039) -0.41%
Annual Disbursement 2,411,827
FY2020 Annual Budget 2,400,000
Attachment 6: FY2019 and FY2020 Monthly Measure B VRF Disbursement Comparison(Cash Disbursement from July to June)
Act
ual /
Bud
get
Act
ual
Item 7b - Attachment
28
Short Term Medium Term Liquidity* TotalInitial Principal Investment 1,808,530$ 44,297,339$ -$ 46,105,869$
Prior Reinvested Interest Revenue 75,302$ 2,224,110$ 644,408$ 2,943,820$
FY2019-20 Monthly Interest IncomeJuly-19 4,154$ 93,972$ 1,371$ 99,497$
August-19 3,577$ 81,554$ 1,338$ 86,469$
September-19 3,523$ 84,019$ 1,594$ 89,136$
October-19 3,409$ 83,615$ 1,525$ 88,549$
November-19 3,045$ 75,944$ 1,424$ 80,413$
December-19 3,205$ 82,217$ 1,588$ 87,010$
January-20February-20
March-20April-20May-20June-20
Total for the 2nd Quarter 20,913$ 501,321$ 8,840$ 531,074$
Reinvestment of Interest to Liquidity Fund (20,913)$ (501,321)$ 522,234$
Unrealized Gain/(Loss) - 12/31/2019 5,668$ 132,506$ -$ 138,174$ Market Value - 12/31/2019 1,889,500$ 46,653,955$ 1,175,482$ 49,718,937$
Note: Starting December 1, 2018, interests earned in the short-term and medium-term funds are reinvested in the liquidity fund for potential immediate agency cash needs
with no principal risk.
Attachment 7: CalTRUST Investment Monthly Interest Income by Fund (July - December 2019)
Item 7b - Attachment
29

Attachment 8.1: FY2019-20 Budget Revenue Overview by Funding Source
Attachment 8.2: FY2019-20 Budget Expenditure Overview by Category
Note: Administration category includes all TAM's staff costs at $2.6 million. Please note that the majority of the staff costs are for direct project and program management.
Federal $6,079,578 13%
State $1,197,313 3%
Regional$6,175,526 14%
Local$31,369,000 70%
Administration$3,503,066
5%
Professional Services
$2,779,500 4%
Measure A/AA Sales Tax
Programs & Projects
$36,266,925 57%
Measure B VRF Programs
$4,643,821 7%
Interagency Agreements$15,705,000
25%
TFCA Programs/Projects
Expenditures$1,051,637
2%
Item 7b - Attachment
30

Acronym Full Term
ABAG Association of Bay Area Governments
ADA Americans with Disabilities Act
BAAQMD Bay Area Air Quality Management District
BATA Bay Area Toll Authority
BART Bay Area Rapid Transit
BCDC Bay Conservation and Development Commission
BPAC Bicycle / Pedestrian Advisory Committee
BRT Bus Rapid Transit
BTA Bicycle Transportation Account
Caltrans California Department of Transportation
CEQA California Environmental Quality Act
CIP Capital Investment Program
CMA Congestion Management Agency
CMAQ Congestion Mitigation and Air Quality
CMFC Central Marin Ferry Connection
CMP Congestion Management Program
CO-OP Cooperative Agreement
CTC California Transportation Commission
DPW Department of Public Works
EIR Environmental Impact Report
EV Electric Vehicle
FASTER Freedom, Affordability, Speed, Transparency, Equity, Reliability
FHWA Federal Highway Administration
FTA Federal Transit Administration
FY Fiscal Year
GGT Golden Gate Transit
GGBHTD Golden Gate Bridge Highway and Transportation District
HOT Lane High Occupancy Toll Lane
HOV Lane High Occupancy Vehicle Lane
ITIP Interregional Transportation Improvement Program
ITS Intelligent Transportation Systems
JARC Job Access and Reverse Commute
LATIP Local Area Transportation Improvement Program
LOS Level of Service
MCBC Marin County Bicycle Coalition
MPO Metropolitan Planning Organization
MPWA Marin Public Works Association
MT Marin Transit
MTC Metropolitan Transportation Commission
Attachment 9: Transportation AcronymsItem 7b - Attachment
31

Acronym Full Term
Attachment 9: Transportation Acronyms
MTS Metropolitan Transportation System
Neg Dec Negative Declaration
NEPA National Environmental Policy Act
NOP Notice of Preparation
NTPP Non-motorized Transportation Pilot Program
OBAG One Bay Area Grant
PAED Project Approval and Environmental Document
PCA Priority Conservation Area
PCI Pavement Condition Index
PDA Priority Development Area
PS&E Plans, Specifications and Engineers Estimate
PSR Project Study Report
RHNA Regional Housing Needs Allocation
RM2 Regional Measure 2 (Bridge Toll)
RTIP Regional Transportation Improvement Program
RTP Regional Transportation Plan
SCS Sustainable Communities Strategy
SLPP State-Local Partnership Program
SMART Sonoma Marin Area Rail Transit
SR State Route
SR2S/SRTS Safe Routes to Schools
STA State Transit Assistance
STIP State Transportation Improvement Program
STP Surface Transportation Program
TCM Transportation Control Measures
TCRP Transportation Congestion Relief Program
TDA Transportation Development Act
TDM Transportation Demand Management
TFCA Transportation Fund for Clean Air
TIP Federal Transportation Improvement Program
TLC Transportation for Livable Communities
TMP Traffic Management Plan
TMS Transportation Management System
TNC Transportation Network Company
TOD Transit-Oriented Development
TOS Transportation Operations Systems
VMT Vehicle Miles Traveled
VRF Vehicle Registration Fee
Item 7b - Attachment
32