Embed Size (px)
Citation preview
1 | MONTANA DOT TRANSP ORTATION ASSET MANAGEMENT PLA N
Transportation Asset Management Plan
December 2015
MONTANA
DEPARTMENT OF TRANSPORTATION

2 | MDT TRANSPORTATION ASSET MANAGEMENT PLAN
Table of Contents
1. Managing Our Assets ............................................................................................................................. 3
Transportation Asset Management Overview ................................................................................. 5
2. Managing Pavements ............................................................................................................................ 6
Pavement Inventory ......................................................................................................................... 6 Measuring Pavement Condition ...................................................................................................... 6 Pavement Condition Trends ............................................................................................................ 7 Pavement Goals and Performance Targets .................................................................................... 9 Identifying and Selecting Pavement Projects .................................................................................. 9
Pavement Life Cycle Cost Considerations .................................................................................... 11 Projecting Future Pavement Conditions ........................................................................................ 12
3. Managing Bridges ................................................................................................................................ 13
Bridge Inventory ............................................................................................................................. 13 Measuring Bridge Condition .......................................................................................................... 13 Bridge Condition Trends ................................................................................................................ 14 Bridge Goals and Performance Targets ........................................................................................ 16 Identifying and Selecting Bridge Projects ...................................................................................... 16 Bridge Life Cycle Cost Considerations .......................................................................................... 17
Projecting Future Bridge Conditions .............................................................................................. 18
4. Managing Risk ..................................................................................................................................... 20
Risk and Risk Management Definitions ......................................................................................... 20 Identifying, Assessing, and Prioritizing Risks ................................................................................ 20 Risk Management .......................................................................................................................... 21
5. Financial Plan ....................................................................................................................................... 23
Valuing Montana’s Assets ............................................................................................................. 23 Funding Sources ............................................................................................................................ 23 Balancing Needs and Funding ...................................................................................................... 23 Allocating Funds for Asset Management ....................................................................................... 24
Anticipated Funding Levels ........................................................................................................... 25 Performance Gap Assessment ...................................................................................................... 26
6. TAMP Investment Strategies ............................................................................................................... 27
7. Future TAMP Enhancements ............................................................................................................... 28
Photo: MDT, Two Medicine Bridge Project

3 | MDT TRANSPORTATION ASSET MANAGEMENT PLAN
1. Managing Our AssetsIn an era of constrained resources, effective management of transportation assets is an increasingly important function of transportation agencies. The Montana Department of Transportation (MDT) is committed to managing assets as a key business practice. MDT strives to maintain transportation assets in a state of good repair over the long-term with the most efficient investment of resources.
Beginning in 1999, MDT began the annual Performance Programming Process (P3) to develop an optimal investment plan and measure progress towards strategic transportation goals established by TranPlan 21 - MDT’s statewide long range transportation plan. Through P3, MDT sets condition targets, tracks progress, and evaluates network level conditions for pavements and bridges to maintain consistent conditions throughout the state. As part of P3, MDT allocates funds based on scenario analyses with consideration of budget and work type tradeoffs. These analyses are a fundamental part of a comprehensive asset management program and MDT continues to build technical capacity to actively manage our transportation infrastructure assets.
This Transportation Asset Management Plan (TAMP) is MDT’s first formal plan that builds from the foundation established by P3 and describes how MDT manages pavements and bridges to fulfill the requirements of MAP-21. The 2015 TAMP extends beyond federal compliance and positions MDT as a leader in managing assets for performance. The plan emphasizes:
Communicating asset management objectives and outcomes to MDT’s internal and external stakeholders;
Documenting a management approach for transportation assets that align strategic policy goals with project selection and budgeting decisions;
Synthesizing information to develop a complete story of the state of transportation assets in Montana and how condition is expected to change over time with available funding;
Identifying potential investment strategies that will help MDT achieve performance goals in a fiscally constrained environment;
Assessing risks affecting transportation assets in Montana and MDT’s ability to manage these risks; and
Documenting current gaps in MDT’s asset management framework and identifying the activities and resources needed to close those gaps and enhance asset management practices.
The 2015 TAMP was developed throughout 2014 and finalized December of 2015. MDT staff and a TAMP Steering Committee, composed of managers from various agency functions, guided the effort and contributed significantly to identifying risk management and mitigation activities, examining current gaps and potential enhancements, and developing investment strategies.
Transportation Asset Management is a process to strategically
manage transportation systems in a cost-effective, safe, efficient, and environmentally sensitive manner.
This approach focuses on performance to manage systems
for optimal results.
The previous federal transportation reauthorization legislation Moving Ahead for
Progress in the 21st Century Act (MAP-21) further institutionalized asset management by requiring
that all state departments of transportation develop a risk-
based transportation asset management plan (TAMP) for
pavements and bridges on the National Highway System.
MDT’s TAMP meets current federal requirements and
positions MDT to respond to expected future guidance
on asset management rules and performance guidelines.
What is Asset Management?

4 | MDT TRANSPORTATION ASSET MANAGEMENT PLAN
MDT’s 2015 TAMP aligns with MAP-21 requirements to develop a risk-based asset management plan. The TAMP includes detailed analysis and reporting of current pavement and bridge conditions; identifies strategies to manage risks; provides a 10-year financial plan and investment scenarios; and, describes current gaps and future enhancements to MDT’s asset management framework. The document is organized into the following chapters:
Chapter 2: Managing Pavement – Provides an overview and trends in MDT’s pavement condition and details how MDT manages pavement decisions. This section defines the goals of the pavement program, discusses life cycle cost considerations, describes MDT’s pavement project selection process, and discusses how future pavement conditions will be addressed.
Chapter 3: Managing Bridges – Describes trends in MDT’s historical bridge conditions and defines bridge program goals. This section provides an overview MDT bridge project selection process and discusses expected future bridge conditions.
Chapter 4: Managing Risk – Presents MDT’s initial asset management risk register, which is a consensus scoring of risks based on likelihood and consequences. This section identifies mitigation strategies to address major risks that could impact MDT’s ability to meet asset management goals.
Chapter 5: Financial Plan – Summarizes MDT’s funding outlook and documents expected MDT funding for asset management activities over the next 10 years. This section describes future condition levels and potential performance levels MDT can achieve with projected funding.
Chapter 6: Investment Scenarios – Introduces the investment strategies MDT will employ to achieve asset management goals and targets.
Chapter 7: Asset Management Enhancements – Describes how MDT intends to enhance asset management practices in the future.

5 | MDT TRANSPORTATION ASSET MANAGEMENT PLAN
Transportation Asset Management Overview MDT’s 2015 TAMP covers a historical period from 2005 through 2014 and looks ahead from 2015 through 2024. The plan addresses pavements and bridges on the National Highway System including both Interstate and Non-Interstate roadways as well as MDT’s Primary Highway System.
The National Highway System (NHS) includes the Interstate Highway System as well as other non-Interstate highways important to the nation's economy, defense, and mobility. The U.S. Department of Transportation (US DOT) in cooperation with state, regional, and local officials developed the NHS. MAP-21 expanded the system to include additional Principal Arterials in Montana.
MDT designates a strategic system of Primary, Secondary, and Urban highways that are critical to state and local economies and interregional travel. The Primary Highway System consists of a system of connected roads important to interstate, statewide and regional travel, including rural arterial routes and their extensions in urban areas. This system includes routes functionally classified as principal or minor arterials and others selected by the Montana Transportation Commission. This TAMP focuses on the NHS and state Primary Highway System (Primary).
MDT is responsible for over 16,583 lane miles of paved roadways and 1,660 bridges on Interstate, Non-Interstate NHS and Primary roadways. Roads and bridges that are owned and maintained exclusively by Federal agencies or tribal governments and locally-owned roads and bridges are not covered in this TAMP. The map below illustrates the extent of the three main highway systems and bridge structures addressed under the asset management program.
PrimaryInterstate Non- Interstate NHS Bridges

6 | MDT TRANSPORTATION ASSET MANAGEMENT PLAN
2. Managing Pavements
Pavement Inventory
There are approximately 75,000 centerline road miles open to public travel in Montana which carry over 12 billion vehicle miles of travel annually. The majority of miles travelled (over 60 percent) occur on just 9 percent of the roadway system – the Interstate, Non-Interstate-NHS and Primary road networks. For the purposes of this TAMP, MDT focuses on these three major highway systems. Table 2.1 shows the breakdown of pavement centerline (single roadway) and lane miles (individual lanes on a roadway) by system.
TABLE 2.1 MDT PAVEMENT INVENTORY, 2014
System Centerline Miles Lane Miles
Assets Included in TAMP
Interstate 1,192 4,770
Non-Interstate NHS 2,990 6,625
Primary 2,575 5,188
Total 6,757 16,583
Source: MDT TIS Roadlog
Measuring Pavement Condition MDT collects pavement condition data on a regular basis using road profiling systems, lasers, and 3D cameras. MDT manages pavement condition data using a Pavement Management System (PvMS) and analyzes data collected to calculate the following condition rating metrics.
Ride Index (RI) – A measure of traveler perception of ride smoothness. Ride Index is based on the International Roughness Index (IRI), which is the international standard for smoothness. MDT calculates RI by converting IRI to a 0-100 scale and assigning Good, Fair, Poor categories using the thresholds outlined in the table below. These thresholds are consistent with those used by MDT for P3 performance measures. Further condition performance measure guidance from FHWA is pending and, until that guidance is updated, MDT will use the thresholds defined below throughout this TAMP.
RIDE INDEX COMPARED TO INTERNATIONAL ROUGHNESS INDEX State of Repair P3 Designation Ride Index IRI
Good Superior ≥80 <75 Fair Desirable ≥60 and <80 76-150 Poor Undesirable <60 >150
Rut Index (Rut) - A measure of rutting in the wheel path, reported on a 0-100 scale.
Alligator Crack Index (ACI) - A measure of the amount of cracking caused by repeated traffic loading (also known as fatigue cracking), reported on a 0-100 scale.
Miscellaneous Crack Index (MCI) - A measure of the amount of cracking caused by environmental changes or material or design deficiencies (also known longitudinal or transverse cracking) reported on a 0-100 scale.

7 | MDT TRANSPORTATION ASSET MANAGEMENT PLAN
MDT uses each of these measures for different purposes. For instance, Ride Index (RI) is used as the main performance measure for pavements in P3. MDT establishes RI performance targets by roadway system to achieve consistent pavement conditions throughout the state. RI, Rut, and both ACI and MCI measures are used to identify potential pavement project treatments. MDT engineering staff utilizes pavement condition data along with traffic and truck volumes as well as in-place materials to select appropriate projects to preserve pavement condition while addressing safety, capacity, and additional needs.
Pavement Condition Trends Beginning in 1999, MDT began to utilize the annual Performance Programming Process (P3) to develop an optimal investment plan and measure progress towards statewide strategic transportation goals. Through P3, MDT establishes condition targets, tracks progress, and evaluates network level conditions for pavements to maintain consistent conditions throughout the state. MDT sets a P3 performance target of maintaining the Interstate, Non-Interstate NHS and Primary systems in the Desirable to Superior range.
Figure 2.1, below, illustrates the impact of MDT’s performance management approach to maintaining and improving the condition of Montana roadways. The figure depicts average pavement condition ratings for MDT’s three roadway systems along with RI-defined performance categories of Superior, Desirable, and Undesirable. Over the past 15 years, pavement conditions in Montana are generally remaining stable with slight deterioration.
FIGURE 2.1 HISTORICAL PAVEMENT CONDITION - RIDE INDEX
The series of graphics in Figure 2.2, on following page, illustrates changes in pavement condition over the past ten years for MDT’s major highway systems. The following charts appear to show large changes in condition between 2010 and 2011. However, these shifts are the result of a combination of events including: extensive flooding, increased lapsed time between treatments, and updated data collection equipment that improved data quality. Overall, the majority of Interstate and Non-Interstate NHS roadway lane miles remain in Superior condition, but are declining and will likely continue to do so. Primary system lane miles largely remain in Desirable condition but could worsen over time.
Superior
Desirable
Undesirable
73.97
76.7
72.3
74.8275.3
72.6
78.482.3 81.6
50
60
70
80
90
100
1997 1998 1999 2000 2001 2002 2003 2004 2005 2006 2007 2008 2009 2010 2011 2012 2013 2014
Interstate Non-Interstate NHS Primary
P3 Instituted
Con
ditio
n R
atin
g –
Rid
e In
dex
Source: MDT, Materials Bureau, PvMS data

8 | MDT TRANSPORTATION ASSET MANAGEMENT PLAN
FIGURE 2.2 HISTORIC PAVEMENT CONDITION BY SYSTEM (PERCENT LANE MILES)
83% 85%74%
17% 15%24%
0% 0% 2%0%
20%
40%
60%
80%
100%
2005 2006 2007 2008 2009 2010 2011 2012 2013 2014
Perc
ent o
f Lan
e-Mi
les
Interstate
Good (RI 100-80) Fair (RI 79.9-60) Poor (RI 59.9- 0)
49%
49% 42%49%
49% 52%
2% 2% 6%
0%
20%
40%
60%
80%
100%
2005 2006 2007 2008 2009 2010 2011 2012 2013 2014
Perc
ent o
f Lan
e-Mi
les
Non-Interstate NHS
Good (RI 100-80) Fair (RI 79.9-60) Poor (RI 59.9- 0)
35% 33%25%
63% 64% 67%
2% 3% 8%
0%
20%
40%
60%
80%
100%
2005 2006 2007 2008 2009 2010 2011 2012 2013 2014
Perc
ent o
f Lan
e-Mi
les
Primary
Good (RI 100-80) Fair (RI 79.9-60) Poor (RI 59.9- 0)Desirable (RI 80-60) Undesirable (RI 60-0)Superior (RI 100-80)

9 | MDT TRANSPORTATION ASSET MANAGEMENT PLAN
Pavement Goals and Performance Targets
MDT’s Pavement Program directly supports the statewide goals established by TranPlan 21. MDT’s system wide asset management priorities focus on implementing the right pavement treatments in the right places at the right times. MDT continues to implement the following activities and actions in support of strategic statewide goals:
Preservation of the existing system – provide the “right treatment at the right time” to actively manage pavements using cost-effective treatments. Activities include crack seal, seal and cover, rut fill, mill/fill, overlay, micro-surfacing, cold-in-place recycle, and hot-in-place recycle treatments.
Capacity expansion and mobility improvements – improving the roadway network when the current roadway can no longer support continued growth using current geometrics. Activities include major rehabilitation and reconstruction treatments to address level of service deficiencies by adding lanes and/or shoulder width.
Safety and other improvements – maintaining pavement condition to ensure safety for the traveling public. Activities related to safety include rut-fill, chip seal, concrete diamond grind.
Identifying and Selecting Pavement Projects
MDT’s PvMS divides highways into segments that are similar in structure, number of lanes, and traffic volumes for the purposes of identifying pavement treatments. PvMS calculates average condition for each segment using measures of ride, rut, fatigue cracking and miscellaneous cracking. The system forecasts future condition for each condition metric and then applies decision tree logic in order to determine appropriate pavement treatment types. Pavement treatment types consist of the following maintenance and preservation activities:
Preventive Maintenance – MDT considers both scheduled maintenance and pavement preservation activities as preventive maintenance. Preservation work applies to pavements in good condition and can slow deterioration rates. Typical preventative treatments include crack seals, chip seals, overlays and microsurfacing. Crack seals are generally completed between three and six years after project completion or as needed. Chip seals are initially completed with pavement resurfacing projects and then reapplied between six and twelve years after project completion. MDT generally uses overlays and microsurfacing on roads over twelve years old to address observed pavement distresses.
Minor Rehabilitation - MDT applies minor rehabilitation activities to rehabilitate existing pavement surfaces through an engineered approach that considers observed pavement distress and in-place materials. This treatment extends the life of the pavement structure by rehabilitating the wearing surface only. Typical treatments include: thin overlays, mill-fills, hot in-place recycle, or cold in-place recycle with overlay.
Pavement Preservation Strategic Goal MDT also defines a specific pavement goal through P3. This goal is to “preserve highway pavement condition at existing or higher levels on the Interstate, Non-Interstate NHS, and Primary Systems.” MDT also establishes the following performance target corresponding to this goal:
Average Ride Index Desirable or Superior (RI>=60)

10 | MDT TRANSPORTATION ASSET MANAGEMENT PLAN
Major Rehabilitation - MDT applies major rehabilitation activities to extend the life of the pavement, improve ride quality, and/or enhance capacity. The majority of major rehabilitation work is on existing alignments, but may include rebuilding substandard horizontal or vertical curves. Typical treatments include milling and overlay and recycle pulverization with overlay.
Reconstruction - MDT applies reconstruction treatments at the end of a pavement’s serviceable life or when geometric improvements are required.
MDT’s Materials Bureau provides recommended pavement treatments from PvMS to District Offices and District Engineering staff, through the annual Pavement Performance and Condition Report. This report is a resource used by the Districts when selecting the best mix of projects to address needs while also meeting performance and funding targets established by P3. Districts also consider other factors when selecting pavement projects including: level of service, safety, environmental impacts, and maintenance activities to determine appropriate projects. Districts follow guidance provided in the Guidelines for Nomination and Development of Pavement Projects Joint Agreement. These pavement project guidelines are summarized in Table 2.2.
TABLE 2.2 GUIDELINES FOR NOMINATION AND DEVELOPMENT OF PAVEMENT PROJECTS
Category Preventative Maintenance Rehabilitation
Reconstruction Scheduled Maintenance Pavement Preservation Minor Major
Surface Engineering
None < 0.20 ft Overlay None < 0.20 ft Overlay Engineered Engineered Engineered
Environmental Documentation NEPA/MEPA NEPA/MEPA NEPA/MEPA NEPA NEPA
Geometric Standards As-Built As-Built As-Built As-Built to Current
Standards Current
Standards
Safety and Capacity
Considerations
Crash Cluster and ADA
Evaluations
Treatable Trends, Clusters, Clear Zone,
Signage, Guardrail Criteria, ADA Evaluations
Treatable Trends, Clusters, Clear Zone, Signage, Guardrail & ADA Criteria,
Width, Slope, and Geometric Evaluations Full Safety and
Capacity
Applied Treatments
Seal & Cover, Crack, Joint, Fog, & Sand Seal, Micro Surfacing Overlay
Seal and Cover, Crack, Sand, & Fog Seal, Rut Fill, Mill OGFC, Micro
Surfacing Overlay, Mill & Fill, Cold In-Place
Recycle with Chip Seal
Overlay, Mill & Fill, with Overlay, Cold In-Place Recycle with Overlay, No
Exposure of Base Gravel
Overlay, Mill, Overlay, Recycle
Pulverize with Overlay, If Base Gravel Exposed
Treat/Modify Gravels
Full Surfacing Standards
How Needs Are Identified
Scheduled Treatments
Observed Distress PvMS Recommendations
Observed Distress PvMS
Recommendations
Observed Distress Geometrics,
Safety Considerations
Operational Factors,
Geometrics
Eligible Funding Source
Maintenance Funds Maintenance Funds ---- ---- ----
State Construction State Construction State Construction ---- ----
Federal Aid Federal Aid Federal Aid Federal Aid Federal Aid
Source: MDT Guidelines for Nomination and Development of Pavement Projects

11 | MDT TRANSPORTATION ASSET MANAGEMENT PLAN
Pavement Life Cycle Cost Considerations
In 1999, MDT implemented a pavement preservation program after analyzing and comparing the effectiveness of worst-first and pavement preservation strategies. The objective of the pavement preservation program is to slow the rate of deterioration, while providing a smooth, safe, and durable roadway at the lowest lifecycle cost. This strategy includes establishing funding “plugs” or allocations for preservation treatments - a practice that continues today.
Pavement deterioration results from environmental factors and traffic volumes. As pavements deteriorate they lose structural and/or functional capacity. Preventative maintenance and rehabilitation improves pavement condition, extends pavement service life, postpones major reconstruction needs, and provides a safe driving surface.
MDT manages pavement assets in a strategic and proactive way by:
Aggressively applying preventive maintenance solutions such as chip seals with each new surfacing project.
Deploying trained maintenance personnel and advanced technology to apply needed maintenance actions at the right place at the right time.
Designing new facilities for durability and longer life using state-of-the-art materials and methods.
PvMS recommends treatments based on a series of decision trees that reflect life-cycle cost considerations MDT provides these recommendations for MDT engineering staff to use in minimizing pavement’s life cycle costs. MDT also conducts detailed life cycle cost analysis for major rehabilitation and reconstruction projects. As part of this analysis, design staff evaluate multiple design alternatives and estimate the cost of future activities over a life cycle of 40 or more years.
The goal of this process is to select a design alternative that leads to the lowest life cycle cost and not necessarily the one that has the lowest initial construction cost. The activities and timings assumed for the life cycle cost analysis in the design phase are provided in Figure 2.3 below.
FIGURE 2.3 PAVEMENT LIFE CYCLE TREATMENTS
Salvage Value for Remaining
Service Life
Overlay or Mill / Fill
Chip SealMajor Rehab
Chip SealMinor Rehab
Chip SealMinor Rehab
Chip Seal
Diamond Grind, Joint Seal and Slab Replacement
Salvage Value for Remaining
Service Life
PCC Pavement Treatments
AC Pavement Treatments
Clean/Refill Joints and Cracks. Slab Replacement, Diamond Grind, Mill / Fill Shoulders
Year 7Year 14
Year 21Year 28
Year 35Year 42
Year 49
Year 56Year 60
Year 22
Year 42 Year 60
12 | MDT TRANSPORTATION ASSET MANAGEMENT PLAN
Projecting Future Pavement Conditions
MDT is currently upgrading its pavement management system with improved analytics. Additionally, MDT will further review the system’s performance models (ride and rut) and verify accuracy after completing a software upgrade that is expected early 2016.
Using the existing analytics and based on flat growth P3 analysis, MDT expects the condition of the Interstate, Non-Interstate NHS and Primary systems to decline slightly over the next 10 years, while remaining within the current performance target thresholds. MDT’s confidence in these projections is based on years of experience projecting future conditions and monitoring progress towards specific targets through P3. The previously noted effort to update PvMS analytics will address gaps in this analysis and ensure MAP-21 compliance. Current gaps and future enhancements are detailed below.
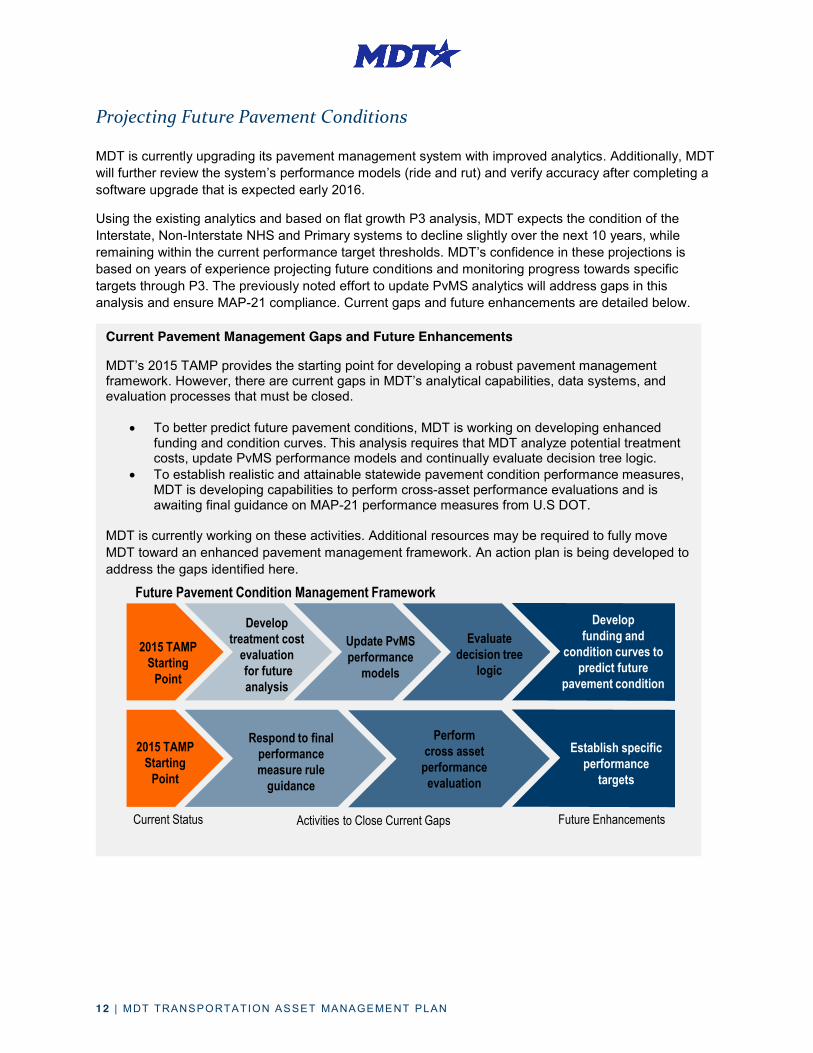
Current Pavement Management Gaps and Future Enhancements
MDT’s 2015 TAMP provides the starting point for developing a robust pavement management framework. However, there are current gaps in MDT’s analytical capabilities, data systems, and evaluation processes that must be closed.
x To better predict future pavement conditions, MDT is working on developing enhanced funding and condition curves. This analysis requires that MDT analyze potential treatment costs, update PvMS performance models and continually evaluate decision tree logic.
x To establish realistic and attainable statewide pavement condition performance measures, MDT is developing capabilities to perform cross-asset performance evaluations and is awaiting final guidance on MAP-21 performance measures from U.S DOT.
MDT is currently working on these activities. Additional resources may be required to fully move MDT toward an enhanced pavement management framework. An action plan is being developed to address the gaps identified here.
Develop treatment cost
evaluationfor future analysis
Update PvMSperformance
models
Evaluate decision tree
logic
Develop funding and
condition curves to predict future
pavement condition
2015 TAMPStarting
Point
Respond to final performance measure rule
guidance
Perform cross asset
performance evaluation
Establish specific performance
targets
2015 TAMPStarting
Point
Future Pavement Condition Management Framework
Current Status Activities to Close Current Gaps Future Enhancements
13 | MDT TRANSPORTATION ASSET MANAGEMENT PLAN
3. Managing Bridges
Bridge Inventory
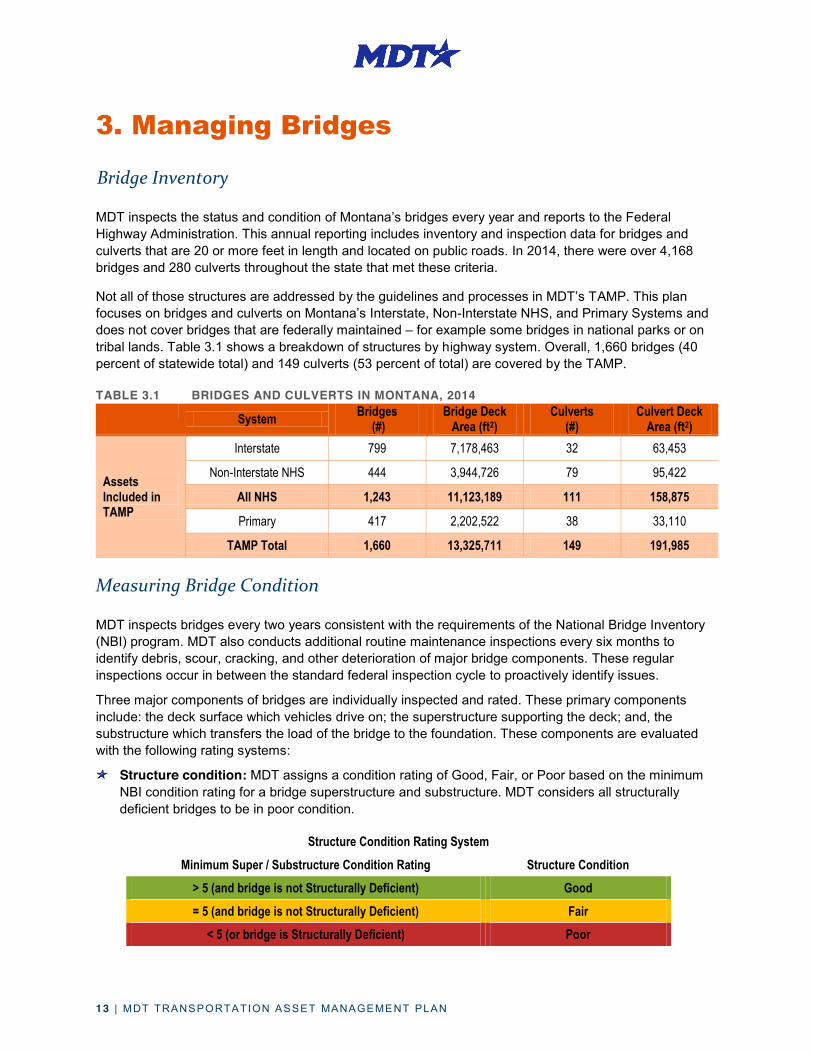
MDT inspects the status and condition of Montana’s bridges every year and reports to the Federal Highway Administration. This annual reporting includes inventory and inspection data for bridges and culverts that are 20 or more feet in length and located on public roads. In 2014, there were over 4,168 bridges and 280 culverts throughout the state that met these criteria.
Not all of those structures are addressed by the guidelines and processes in MDT’s TAMP. This plan focuses on bridges and culverts on Montana’s Interstate, Non-Interstate NHS, and Primary Systems and does not cover bridges that are federally maintained – for example some bridges in national parks or on tribal lands. Table 3.1 shows a breakdown of structures by highway system. Overall, 1,660 bridges (40 percent of statewide total) and 149 culverts (53 percent of total) are covered by the TAMP.
TABLE 3.1 BRIDGES AND CULVERTS IN MONTANA, 2014 System Bridges
(#) Bridge Deck
Area (ft2) Culverts
(#) Culvert Deck
Area (ft2)
Assets Included in TAMP
Interstate 799 7,178,463 32 63,453
Non-Interstate NHS 444 3,944,726 79 95,422
All NHS 1,243 11,123,189 111 158,875
Primary 417 2,202,522 38 33,110
TAMP Total 1,660 13,325,711 149 191,985
Measuring Bridge Condition
MDT inspects bridges every two years consistent with the requirements of the National Bridge Inventory (NBI) program. MDT also conducts additional routine maintenance inspections every six months to identify debris, scour, cracking, and other deterioration of major bridge components. These regular inspections occur in between the standard federal inspection cycle to proactively identify issues.
Three major components of bridges are individually inspected and rated. These primary components include: the deck surface which vehicles drive on; the superstructure supporting the deck; and, the substructure which transfers the load of the bridge to the foundation. These components are evaluated with the following rating systems:
Structure condition: MDT assigns a condition rating of Good, Fair, or Poor based on the minimum NBI condition rating for a bridge superstructure and substructure. MDT considers all structurally deficient bridges to be in poor condition.
Structure Condition Rating System Minimum Super / Substructure Condition Rating Structure Condition
> 5 (and bridge is not Structurally Deficient) Good = 5 (and bridge is not Structurally Deficient) Fair
< 5 (or bridge is Structurally Deficient) Poor

14 | MDT TRANSPORTATION ASSET MANAGEMENT PLAN
Deck condition: MDT evaluates deck condition based on NBI ratings and assigns a rating of Good,
Fair, or Poor based on the thresholds provided in the table below. To support internal decision-making, MDT further divides the Fair category into “Fair-1” and “Fair-2”. These rating scales are used to determine appropriate preservation treatments for bridges.
Deck Condition Rating System Deck NBI
Condition Rating Deck Condition (for reporting)
Deck Condition (for decision making)
> 6 Good Good 6
Fair Fair-1
5 Fair-2 < 5 Poor Poor
Structural deficiency: NBI condition ratings are assessed on a scale of 1 to 9. A bridge is considered structurally deficient if any of the deck, superstructure or substructure has a NBI condition rating of less than 5. This term is not meant to imply that a bridge is unsafe. Rather, it is used to identify bridges that require significant repair work to remain in service and will eventually require more substantial work such as rehabilitation or replacement to address underlying deficiencies.
Bridge Condition Trends
Figure 3.1, below, displays the percent of structurally deficient bridges by roadway system over the past decade. Historic trends appear to indicate an increase in deficient bridges between 2009 and 2010. This increase is not necessarily a reflection of actual conditions, but a result of MDT’s effort to improve quality assurance and coverage in its bridge inspection program. With better inspection data a more accurate picture of the bridge network became available.
FIGURE 3.1 PERCENT OF STRUCTURALLY DEFICIENT BRIDGES BY SYSTEM
1.0% 1.0% 1.6% 1.9% 0.7% 1.1%4.1% 5.0%
6.8% 6.4%8.8%
2004 2005 2006 2007 2008 2009 2010 2011 2012 2013 2014
Interstate
2.2% 1.9% 2.2% 2.3% 1.9%4.4%
10.0% 9.9%
5.7%4.1% 4.9%
2004 2005 2006 2007 2008 2009 2010 2011 2012 2013 2014
Non-Interstate NHS
1.7% 2.1% 1.9% 1.6% 1.9% 0.9% 1.4%4.2% 5.2% 5.7%
8.0%
2004 2005 2006 2007 2008 2009 2010 2011 2012 2013 2014
Primary

15 | MDT TRANSPORTATION ASSET MANAGEMENT PLAN
Figure 3.2, below, illustrates bridge structure and deck conditions over the past 10 years. These data demonstrate that the condition of MDT’s bridges are steadily declining. While the percent of bridges rated in poor condition remain relatively stable, over time more and more good condition bridges are deteriorating into fair condition.
FIGURE 3.2 HISTORIC BRIDGE CONDITIONS
97%
80%
2% 12%1%
9%0%
25%
50%
75%
100%
2005 2008 2011 2014
Interstate Structure Condition
64%
42%35%
53%
1% 6%0%
25%
50%
75%
100%
2005 2008 2011 2014
Interstate Deck Condition
94%83%
5%12%
2%5%
0%
25%
50%
75%
100%
2005 2008 2011 2014
Non-Interstate NHS Structure Condition
64%55%
35%41%
1% 4%0%
25%
50%
75%
100%
2005 2008 2011 2014
Non-Interstate NHS Deck Condition
91%
77%
7%15%
2%8%
0%
25%
50%
75%
100%
2005 2008 2011 2014
Primary Structure Condition
71%
50%
28% 44%
1%5%
0%
25%
50%
75%
100%
2005 2008 2011 2014
Primary Deck Condition
Percent of Bridges in Good/Fair/Poor Condition by Bridge Structure and Deck Area
Good Fair Poor

16 | MDT TRANSPORTATION ASSET MANAGEMENT PLAN
Bridge Goals and Performance Targets
MDT’s Bridge Program supports the goals established in, TranPlan 21, through the following priorities:
Preservation of the existing system – providing the “right treatment at the right time” in order to manage pavements using cost-effective treatments. Activities include bridge deck rehabilitation, corrosion mitigation, joint repair or replacement, and bridge rail upgrades.
Capacity expansion and mobility improvements – improving the roadway network when the current roadway can no longer support continued growth using current geometrics. Activities include full replacements on new alignments with increased traffic capacity
Safety and other improvements – maintaining bridge condition to ensure safety for the traveling public. Activities related to traffic safety range from simple skid treatments to full replacements or new alignments. Other activities cover seismic retrofitting of vulnerable bridges and installation of scour countermeasures on susceptible bridges.
Identifying and Selecting Bridge Projects
MDT applies a series of decision trees when selecting bridge maintenance and preservation treatments. Utilizing the bridge improvement type decision process illustrated in Figure 3.3, below, MDT determines if a bridge is a candidate for repair, replacement, or preservation.
FIGURE 3.3 BRIDGE IMPROVEMENT TYPE DECISION TREE
Based on NBI ratings, bridges are grouped by overall condition. Overall rating identify trends in the condition of critical elements of bridge structures. Trends help show common types of deterioration or may highlight repair or preservation needs that are applicable across all bridges, regardless of condition. This analysis helps develop cost effective strategies to address bridge needs and the decision process helps ensure that appropriate bridge projects are selected.
MDT considers preservation activities for bridges in Fair or Good condition based on the potential of these activities to reduce life-cycle costs and delay the time at which more substantial and expensive bridge improvements are required. Decision tree logic provides a simple and quick determination of whether preservation is likely to be cost-effective for a particular bridge given its condition. MDT uses this rationale to identify when preservation treatments should be considered from a life-cycle cost perspective.
Start
Is the bridge Structurally Deficient?
Is the superstructure or substructure rating = 5
YES PoorBridge is candidate for repair or replacement
FairBridge is candidate for repair
GoodBridge is candidate for preservation
YES
NO
NO
17 | MDT TRANSPORTATION ASSET MANAGEMENT PLAN
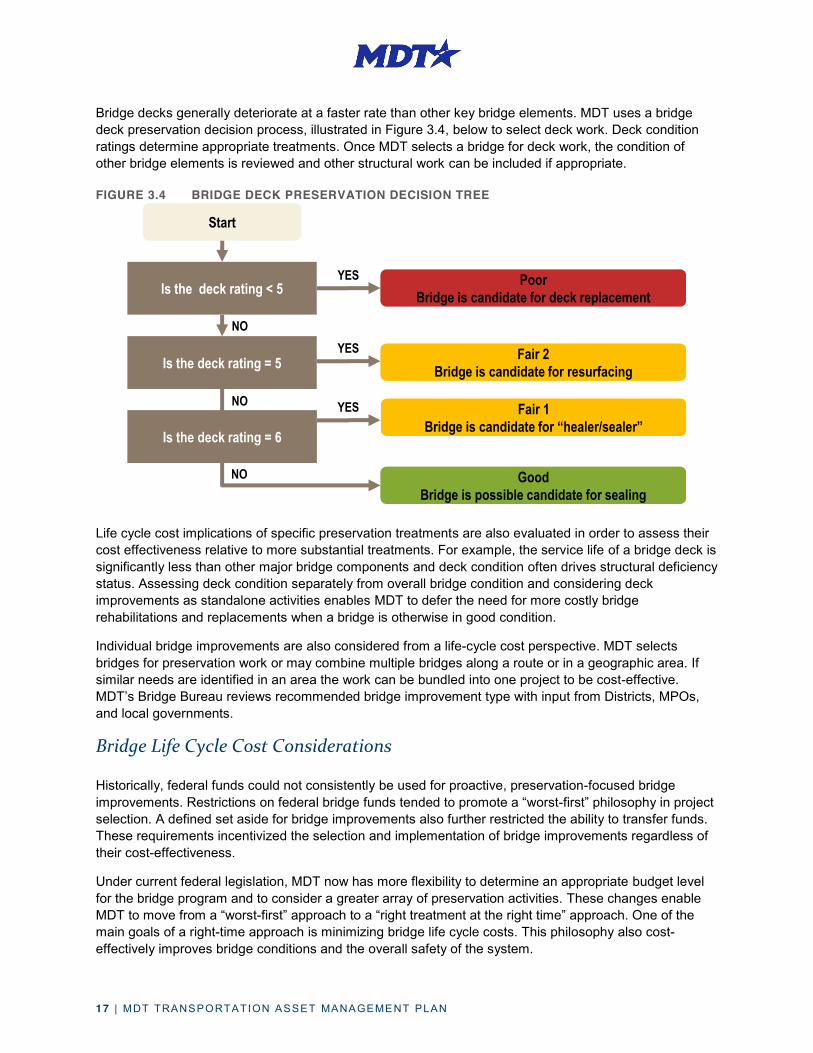
Bridge decks generally deteriorate at a faster rate than other key bridge elements. MDT uses a bridge deck preservation decision process, illustrated in Figure 3.4, below to select deck work. Deck condition ratings determine appropriate treatments. Once MDT selects a bridge for deck work, the condition of other bridge elements is reviewed and other structural work can be included if appropriate.
FIGURE 3.4 BRIDGE DECK PRESERVATION DECISION TREE
Life cycle cost implications of specific preservation treatments are also evaluated in order to assess their cost effectiveness relative to more substantial treatments. For example, the service life of a bridge deck is significantly less than other major bridge components and deck condition often drives structural deficiency status. Assessing deck condition separately from overall bridge condition and considering deck improvements as standalone activities enables MDT to defer the need for more costly bridge rehabilitations and replacements when a bridge is otherwise in good condition.
Individual bridge improvements are also considered from a life-cycle cost perspective. MDT selects bridges for preservation work or may combine multiple bridges along a route or in a geographic area. If similar needs are identified in an area the work can be bundled into one project to be cost-effective. MDT’s Bridge Bureau reviews recommended bridge improvement type with input from Districts, MPOs, and local governments.
Bridge Life Cycle Cost Considerations
Historically, federal funds could not consistently be used for proactive, preservation-focused bridge improvements. Restrictions on federal bridge funds tended to promote a “worst-first” philosophy in project selection. A defined set aside for bridge improvements also further restricted the ability to transfer funds. These requirements incentivized the selection and implementation of bridge improvements regardless of their cost-effectiveness.
Under current federal legislation, MDT now has more flexibility to determine an appropriate budget level for the bridge program and to consider a greater array of preservation activities. These changes enable MDT to move from a “worst-first” approach to a “right treatment at the right time” approach. One of the main goals of a right-time approach is minimizing bridge life cycle costs. This philosophy also cost-effectively improves bridge conditions and the overall safety of the system.
Start
Is the deck rating < 5
Is the deck rating = 5
YES PoorBridge is candidate for deck replacement
Fair 2Bridge is candidate for resurfacing
GoodBridge is possible candidate for sealing
NO
NO
Is the deck rating = 6
Fair 1Bridge is candidate for “healer/sealer”
NO
YES
YES
18 | MDT TRANSPORTATION ASSET MANAGEMENT PLAN
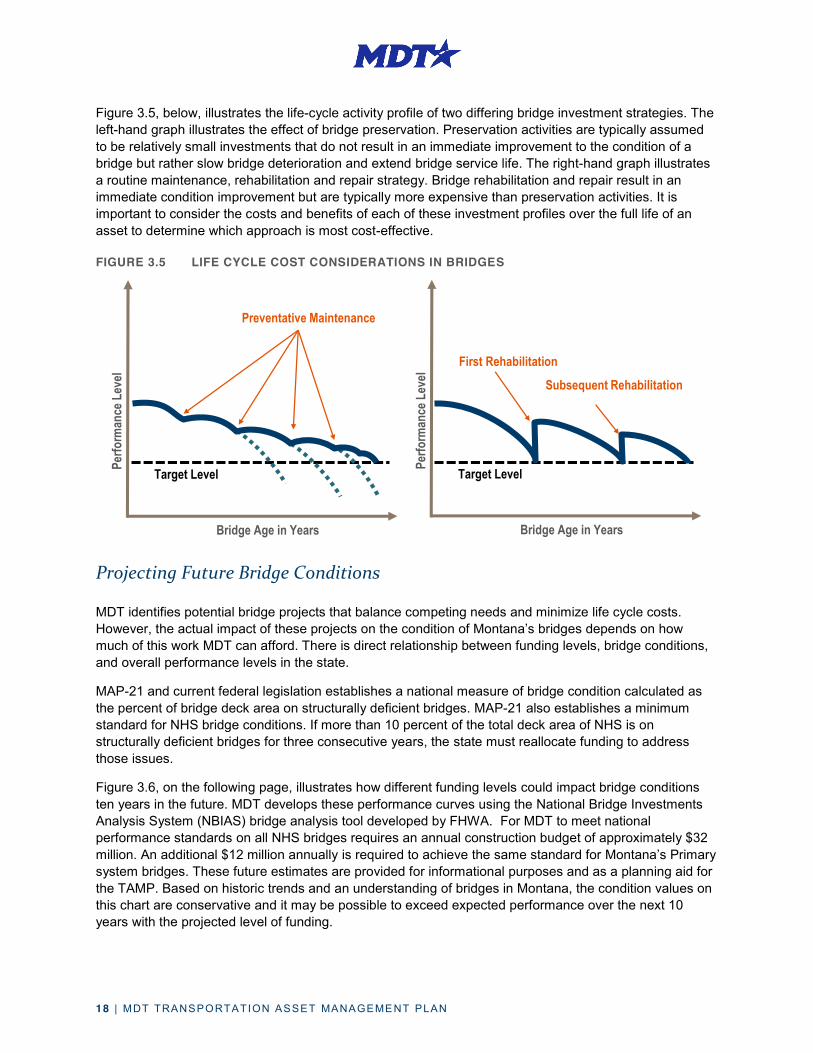
Figure 3.5, below, illustrates the life-cycle activity profile of two differing bridge investment strategies. The left-hand graph illustrates the effect of bridge preservation. Preservation activities are typically assumed to be relatively small investments that do not result in an immediate improvement to the condition of a bridge but rather slow bridge deterioration and extend bridge service life. The right-hand graph illustrates a routine maintenance, rehabilitation and repair strategy. Bridge rehabilitation and repair result in an immediate condition improvement but are typically more expensive than preservation activities. It is important to consider the costs and benefits of each of these investment profiles over the full life of an asset to determine which approach is most cost-effective.
FIGURE 3.5 LIFE CYCLE COST CONSIDERATIONS IN BRIDGES
Projecting Future Bridge Conditions
MDT identifies potential bridge projects that balance competing needs and minimize life cycle costs. However, the actual impact of these projects on the condition of Montana’s bridges depends on how much of this work MDT can afford. There is direct relationship between funding levels, bridge conditions, and overall performance levels in the state.
MAP-21 and current federal legislation establishes a national measure of bridge condition calculated as the percent of bridge deck area on structurally deficient bridges. MAP-21 also establishes a minimum standard for NHS bridge conditions. If more than 10 percent of the total deck area of NHS is on structurally deficient bridges for three consecutive years, the state must reallocate funding to address those issues.
Figure 3.6, on the following page, illustrates how different funding levels could impact bridge conditions ten years in the future. MDT develops these performance curves using the National Bridge Investments Analysis System (NBIAS) bridge analysis tool developed by FHWA. For MDT to meet national performance standards on all NHS bridges requires an annual construction budget of approximately $32 million. An additional $12 million annually is required to achieve the same standard for Montana’s Primary system bridges. These future estimates are provided for informational purposes and as a planning aid for the TAMP. Based on historic trends and an understanding of bridges in Montana, the condition values on this chart are conservative and it may be possible to exceed expected performance over the next 10 years with the projected level of funding.
Bridge Age in Years
Perfo
rman
ce L
evel
Target Level
Preventative Maintenance
Bridge Age in Years
Perfo
rman
ce L
evel
Target Level
First Rehabilitation
Subsequent Rehabilitation

19 | MDT TRANSPORTATION ASSET MANAGEMENT PLAN
FIGURE 3.6 RELATIONSHIP BETWEEN FUNDING AND FUTURE BRIDGE CONDITIONS
Moving forward, MDT will develop a performance curve using a tool calibrated to Montana historical bridge data. This is a critical current gap in the current bridge management process, as the NBIAS tool uses national default data for key assumptions. MDT will incorporate refined versions of this analysis in future versions of the TAMP. These activities and other enhancements are detailed below.
Percent of Deck Area in Good Condition
90%90%91% 91%National Highway System
$10 $15 $20 $25 $30 $35 $40 $45 $50
65%
80%85% 87%
$10 $15 $20 $25 $30 $35 $40 $45 $50
90% MAP-21 Target
Primary95% 95% 95% 95% 95% 95% 95%
Annual Construction Investment
90% MAP-21 Target
95%
85%
Current Bridge Management Gaps and Future Enhancements
MDT’s 2015 TAMP provides a starting point for developing a robust bridge management framework. However, there are gaps in MDT’s current analytical capabilities, data systems, and evaluation processes. Over the near-term, these gaps must be closed.
x To explore options for a fully functional statewide Bridge Management System.
x To establish realistic and attainable statewide bridge condition performance measures, MDT is working to perform cross-asset performance evaluations.
Additional activities and resources may be required to fully implement an enhanced bridge management system. An action plan is being developed to address the gaps identified here.
Future Bridge Management Framework
Respond to final performance measure rule
guidance
Perform cross asset
performance evaluation
Establish specific performance
targets
2015 TAMPStarting
Point
Current Status Activities to Close Current Gaps Future Enhancements
Develop and implement Bridge Management System in Montana
Develop funding and
condition curves to predict future bridge condition
2015 TAMPStarting
Point
20 | MDT TRANSPORTATION ASSET MANAGEMENT PLAN
4. Managing Risk
Risk and Risk Management Definitions
The U.S. DOT defines risk as the positive or negative effects of uncertainty or variability upon agency objectives. Risk management is a process and framework for managing potential risks, including identifying, analyzing, evaluating, and addressing the risks to assets and system performance.
Major risk management elements within the context of MDT’s asset management program are as follows:
Risk identification – identifies events that could impact MDT’s ability to effectively manage Montana’s bridges and pavements.
Risk assessment – assesses the likelihood of an event happening and the consequences if that event does occur.
Risk prioritization – determines, based on risk assessment, where to focus attention and resources.
Risk treatment – identifies and implements a treatment or mitigation activity for each priority risk.
Risk monitoring – monitors and responds to possible events, evaluates the effectiveness of treatments, and periodically updates risk priorities.
Identifying, Assessing, and Prioritizing Risks
During the TAMP development process, MDT Executive, Engineering, IT, Planning, and Administration, staff assessed the likelihood and impacts of risks related to asset management. An online survey was distributed to agency staff across these functional areas to help identify, assess, and prioritize potential risks and provide valuable insights in the following areas:
Identifying top three asset management risks;
Describing potential consequences of risks with respect to safety, mobility, asset damage, financial impact, and agency reputation;
Specifying the assets impacted by these risks (i.e., bridge, pavement, or both);
Assessing the likelihoods of these risks occurring; and,
Evaluating the consequences of these risks should they occur.
The survey resulted in set of risks evaluated by the TAMP Steering Committee at a risk workshop. Using the risks identified in the survey as a starting point, the Steering Committee finalized a list of 13 risks to include in the 2015 TAMP and assessed each through a formal evaluation process. As part of this process, the participants evaluated and scored each risk in the following categories:
Risk Likelihood – Risks are assigned a likelihood level based on their probability of occurrence. Steering Committee members assessed risk likelihood on a 1 (low) to 5 (high) scale and responses were averaged to determine the overall score.
21 | MDT TRANSPORTATION ASSET MANAGEMENT PLAN
Risk Consequence – Risks are assigned a consequence level based on their assumed impacts should they occur. Steering Committee members assessed these consequences related to the following factors:
− Safety - the impact of the risk on fatal or serious injury crashes;
− Mobility - the impact of the risk on people and freight movement between locations;
− Asset damage – the impact of the risk on the physical and/or functional condition of an asset; and
− Financial – the impact of the risk on agency or other costs pertaining to asset management.
Steering Committee values were averaged for each category of impacts to determine overall safety, mobility, asset damage, and financial scores. MDT then calculates the overall consequence level for each risk as the weighted average of the safety, mobility, asset damage, and financial scores. For the purpose of determining a risk score, MDT considers all impact areas to be of equal importance and assigned each a weight of 25 percent.
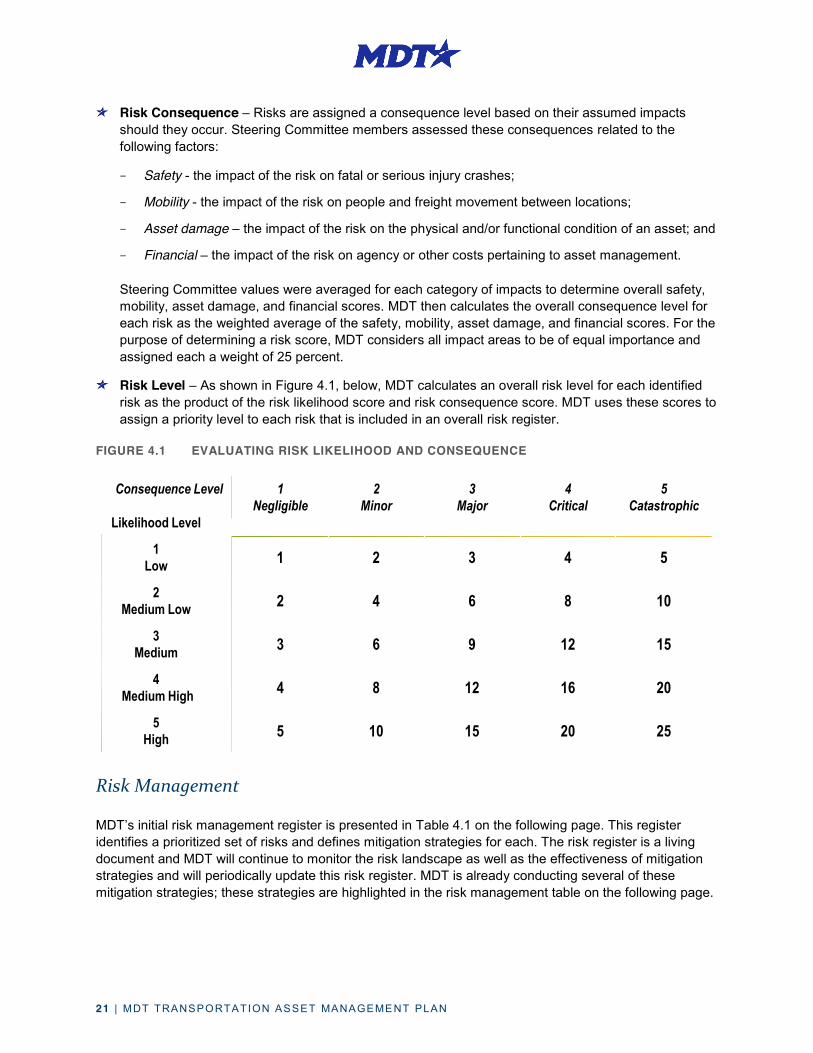
Risk Level – As shown in Figure 4.1, below, MDT calculates an overall risk level for each identified risk as the product of the risk likelihood score and risk consequence score. MDT uses these scores to assign a priority level to each risk that is included in an overall risk register.
FIGURE 4.1 EVALUATING RISK LIKELIHOOD AND CONSEQUENCE
Risk Management
MDT’s initial risk management register is presented in Table 4.1 on the following page. This register identifies a prioritized set of risks and defines mitigation strategies for each. The risk register is a living document and MDT will continue to monitor the risk landscape as well as the effectiveness of mitigation strategies and will periodically update this risk register. MDT is already conducting several of these mitigation strategies; these strategies are highlighted in the risk management table on the following page.
Likelihood Level
1 Low 1 2 3 4 5
2 Medium Low 2 4 6 8 10
3 Medium 3 6 9 12 15
4Medium High 4 8 12 16 20
5 High 5 10 15 20 25
Consequence Level 1 Negligible
2 Minor
3 Major
4 Critical
5 Catastrophic

22 | MDT TRANSPORTATION ASSET MANAGEMENT PLAN
TABLE 4.1 RISK MANAGEMENT REGISTER Priority Risk Mitigation Strategy
1 A. Purchasing power decreases by more than 3% due to inflation, price volatility, mandates, etc.
x Educate lawmakers on importance of asset management x Coordinate with FHWA and AASHTO to address funding uncertainty at the national level x Revert to TranPlan 21 policy of preservation first and reassess programmatic funding levels
2
B. Extreme weather event
x Document emergency response protocol x Set aside funds for routine emergency response x Work with federal partners to streamline emergency response process in terms of public
involvement, environmental review, and right-of-way acquisition
C. Change in political climate x Educate lawmakers on importance of asset management x Formalize and document asset management processes so they are not easily disrupted x Improve IT resources to enable scenario analysis and response to legislative inquiries
D. Transportation funding is reduced by 20% in real dollars x Revert to TranPlan 21 policy of preservation first and reassess funding levels
E. Bubble in asset replacement needs due to uneven asset age distribution
x Quantify and communicate the problem x Implement a Bridge Management System and assess opportunities to delay
replacement by investing in bridge preservation, repair, and rehabilitation x Finalize and implement asset management plan x Address longer term asset management needs (beyond 10-year) in long range plan
F. Increased ongoing, seasonal weather events
x Update hydraulic standards x Clean major culverts to ensure uninhibited flow
3
G. Suboptimal project prioritization and selection
x Document and formalize repeatable and defensible method for prioritizing projects x Compare planned projects to actual projects implemented x Improve ability of management systems to recommend optimal strategies
H. Catastrophic infrastructure failure for reasons other than deterioration or scour (e.g., vehicle impact, natural disaster, etc.)
x Implement seismic retrofit program x Implement, update as needed, and ensure compliance with the Business Continuity
Plan and Emergency Response Plan
I. A freight-intensive market sector or unexpected development changes traffic volumes/patters or negatively impacts infrastructure
x Conduct impact reviews as part of permitting process x Track and make adjustments to traffic data so that management systems reflect impacts on
bridge and pavement infrastructure
J. Reduced flexibility with federal funding x Revert to TranPlan 21 policy of preservation first and reassess programmatic funding levels
4
L. Data, management systems, and other IT infrastructure are unable to support decision, analysis or business needs.
x Implement a Bridge Management System and enhance Pavement Management System
x Enhance Financial Management Suite and Program & Project Management System x Develop and implement a data governance plan
M. Lack of internal or external staffing resources
x Conduct succession planning throughout agency x Update recruitment strategy to reflect changing workforce needs
N. Significant increase in federal funding
x Keep backlog of federal funding eligible projects "on shelf" and ready for implementation x Investigate strategies to increase Highway State Special Funds available for match.
MDT is already conducting several of these mitigation strategies; these strategies are highlighted in orange.

23 | MDT TRANSPORTATION ASSET MANAGEMENT PLAN
5. Financial Plan
Valuing Montana’s Assets
MDT’s completes an infrastructure valuation to ensure compliance with Montana Operations Manual, Chapter 335: Capital Asset Accounting. Under Section III.B.3 of this manual, infrastructure is required to be capitalized at its historical cost and depreciated over its useful life. MDT uses the Government Accounting Standards Board Statement No. 34 (GASB-34) depreciation approach to determine the value of state infrastructure assets annually.
MDT estimates the value of the state’s surface transportation infrastructure at nearly $3.75 billion in 2014. This value covers all existing assets within the state, primarily completed roadway projects, and includes many more roads, bridges, and structures than are covered by this TAMP. In addition, this figure represents a book value based on depreciation and nationally accepted accounting standards. It does notrepresent replacement value of those assets and should not be confused with other estimates of needs and value for the state’s multimodal transportation system. This accounting book value does represent a significant portfolio and illustrates the importance of MDT’s ability to manage the system for performance and cost-effectiveness.
Infrastructure is defined as long-lived assets that are stationary in nature and can be preserved for a significantly greater number of years than most capital assets. Examples of infrastructure assets include roads, bridges, tunnels, drainage systems, water and sewer systems, dams, and lighting systems. Approximately one quarter of the total valuation is attributable to unfinished projects (e.g. construction work in progress). Assets used mainly for the purpose of MDT to gather information or conduct enforcement and maintenance are considered capitalized assets.
Funding Sources
MDT’s budget is a combination of federal and state funds provided through federal authorization. The majority of federal funds that support asset management activities in Montana are provided through two key federal funding programs and state revenues:
Federal National Highway Performance Program (NHPP) provides funding to improve the condition and performance of bridges and pavements on the NHS. With the introduction of MAP-21, and more recently the FAST act, bridge funds now compete with other eligible activities within the NHPP funding pot.
Federal Surface Transportation Program (STP) funds may be used to preserve or improve conditions and performance on the federal-aid highway system.
State Highway Special Revenue funds are generated by state fuel taxes and vehicle weight permits and fees. The majority (87 percent) of Highway State Special Revenue funds are constitutionally restricted for the construction, reconstruction, repair, operation, and maintenance of Montana’s federal, state, and local highway roadway systems.
Balancing Needs and Funding
TranPlan 21, sets the direction and vision and establish priorities for how the statewide transportation system is managed and developed. To meet statewide priorities, MDT performs P3 tradeoff analyses and

24 | MDT TRANSPORTATION ASSET MANAGEMENT PLAN
develops a performance-based Funding Distribution Plan. The aim of P3 is to balance available funding against needs and develop an optimal budget that delivers the best possible highway system performance outcomes. However, achieving targeted performance outcomes with increasingly limited funding is challenging. According to Bureau of Labor Statistics inflation data, the cost of construction rose over 60 percent between 1999 and 2015. This reflects the increasing cost of key construction inputs, including labor, fuel, materials, and equipment. When construction costs and inflation increase at a faster pace than funding levels, the purchasing power of federal and state funds decreases. As shown in Figure 5.1, below, federal obligations to Montana continue to grow. Yet, the value of those funds in real terms is not keeping pace with rising construction costs or overall statewide investment needs.
FIGURE 5.1 FEDERAL FUNDING FLOWS AND INFLATION INDICES
Allocating Funds for Asset Management
MDT managed approximately $805 million in total funding in 2014. Total funding available is a combination of Federal and State Highway Special funds. Not all of these funds are available for asset management activities.
MDT allocates $360 million (45 percent) of available federal and state funds for general operations, planning, maintenance, multimodal activities, and for distribution to other state agencies and tribal and local governments. The remaining $445 million is directed to the Highway Construction Program, which is then further broken down into the Funding Distribution Plan. Typically, P3 utilizes approximately 70 percent of the Highway Construction Program for Core Program allocations. P3 driven Core Program consists of Interstate, Non-Interstate NHS, Primary and Bridge categories. The remaining distributions provided through state statute or federal programs are included in the “Other” category for purposes of the TAMP.
Figure 5.2, on the following page, illustrates how MDT’s funds are allocated from total funding allocations to the Core Program. This allocation by system is based on need as determined in P3.
Source: MDT, Bureau of Labor Statistics
$257 $252 $261 $279 $277 $304 $280 $284 $315 $318 $334$383 $394 $378 $393 $395 $400
$0
$50
$100
$150
$200
$250
$300
$350
$400
$450
0
0.2
0.4
0.6
0.8
1
1.2
1999 2000 2001 2002 2003 2004 2005 2006 2007 2008 2009 2010 2011 2012 2013 2014 2015
Millio
ns
Cons
tructi
on C
ost In
dex
Federal Obligation Construction Cost Index

25 | MDT TRANSPORTATION ASSET MANAGEMENT PLAN
FIGURE 5.2 MDT FUNDING ALLOCATION
Anticipated Funding Levels
MDT allocates construction funds to the Core Program each year as part of the annual P3. The outputs from this process include recommended funding for the Bridge Program as a whole and Pavement by MDT District, System (Interstate, Non-Interstate NHS, and Primary), and type of work (Preservation, Rehab, or Reconstruction). MDT allocates funding to bridge and pavement programs in order to maintain target condition levels and based on an analysis of the relationships between funding and performance. Table 5.1 displays anticipated funding levels for the TAMP assets over the next 10 years.
TABLE 5.1 ESTIMATED FUNDS FOR CONSTRUCTION IMPROVEMENTS TO TAMP ASSETS BY MDT FUNDING PROGRAM, 2015-2024
Year Pavement Bridge
Interstate Non-Interstate NHS Primary Statewide
2015 $57.8 m $83.2 m $84.4 m $41.5 m 2016 $55.3 m $89.9 m $85.3 m $42.7 m 2017 $55.0 m $90.9 m $93.3 m $44.0 m 2018 $54.6 m $91.8 m $101.7 m $45.3 m 2019 $58.8 m $109.5 m $98.8 m $46.7 m 2020 $60.8 m $113.3 m $102.2 m $48.1 m 2021 $62.8 m $117.1 m $105.6 m $49.6 m 2022 $64.9 m $121.0 m $109.2 m $51.0 m 2023 $67.1 m $125.1 m $112.9 m $52.6 m 2024 $69.4 m $129.3 m $116.7 m $54.1 m
Source: MDT 2015 Funding Distribution Plan. Millions of 2015 Dollars
For the purposes of this TAMP, MDT makes the following adjustments to estimate funds available for construction activities:
Reducing distribution values by 10 percent to account for Federal obligation limitation;
45% 55%
Federal State Special
87% 13%
2014 MDT Highway Construction Program
Federal State Special
16%
23%18%
9%
34%
2014 MDT Funding Distribution Plan
2014 Total MDT Funding
$805 m $445 m
InterstateNon-Interstate NHSPrimaryBridgeOther
Core Program

26 | MDT TRANSPORTATION ASSET MANAGEMENT PLAN
Further reducing distribution values by 28 percent to adjust for obligation limits and account for non-construction phases;
Reducing adjusted values by 10.37 percent to account for Indirect Cost Allocation Plan; and,
Increasing adjusted values to account for the state match of 8.76 percent for the Interstate program and 13.42 percent for all other programs.
MDT presents P3 recommended funding levels to the Montana Transportation Commission for concurrence and uses P3 funding levels to develop a Funding Distribution Plan. Not all of the federal allocations in the distribution plan are available to improve assets covered in this TAMP
Performance Gap Assessment
The difference between MDT’s performance targets and expected performance levels - given projected funding levels - is the state’s performance gap. MDT is in the process of updating its pavement management system capabilities and exploring options for implementing a bridge management system. As pavement and bridge modelling improves, MDT anticipates eliminating any significant performance gap by more accurately projecting future conditions based on available funding. The graphic below details current activities and actions to enhance MDT’s capabilities and close current gaps in the process.
Current Financial Planning Gaps and Future Enhancements MDT’s 2015 TAMP provides the starting point for developing a detailed financial plan to actively manage Montana’s roads and bridges. However, there are current gaps in MDT’s current analytical capabilities, data systems, and evaluation processes that must be closed.
x To better predict future bridge and road conditions, MDT is implementing a statewide Bridge Management System and will continue to update PvMS and validate performance models.
x To establish realistic and attainable statewide performance measures, MDT is working to perform cross-asset evaluations and better define funding and performance relationships.
Additional resources may be required to move MDT forward and to fully close future performance gaps. An action plan is being developed to address the gaps and activities identified here.
Future Financial Plan Framework
Respond to final performance measure rule
guidance
Perform cross asset
performance evaluation
Establish specific performance
targets
2015 TAMPStarting
Point
Current Status Activities to Close Current Gaps Future Enhancements
Develop funding and
condition curves to predict future
condition
2015 TAMPStarting
Point
Update PvMS and validate
performance models
Develop Bridge Management System

27 | MDT TRANSPORTATION ASSET MANAGEMENT PLAN
6. TAMP Investment StrategiesAsset management investment strategies are defined by the U.S. DOT in a recent asset management rulemaking notice, as strategies that result from evaluating various levels of funding to achieve a desired level of condition that sustain state of good repair and system performance at a minimum practicable cost while managing risks.
TranPlan 21 sets policy goals and actions that guide how MDT manages, operates, improves, and maintains Montana’s transportation system. MDT’s asset management investment strategies support statewide goals and performance objectives through the following key focus areas:
Funding levels. MDT conducts analyses of performance and tradeoffs between competing needs to develop funding levels that meet targets. These funding levels reflect the relative priority of MDT’s assets and systems.
Guidelines for identifying projects. Chapters 2 and 3 of this document describe how MDT allocates funds to specific work activities. To support the overall objective of doing the right work at the right place at the right time, and to minimize life cycle costs, MDT uses the logic described to select appropriate treatments.
Risk mitigation activities. Chapter 4 presents MDT’s initial risk register. This table identifies risks that could impede MDT’s ability to achieve its asset management objectives, and defines a series of risk mitigation strategies for each risk.
Taken collectively, projected funding levels, project identification guidelines, and risk mitigation activities will enable MDT to achieve its asset management goals and performance targets.

28 | MDT TRANSPORTATION ASSET MANAGEMENT PLAN
7. Future TAMP EnhancementsThis section of the TAMP presents potential enhancements that can improve asset management practices moving forward. A comprehensive gap assessment undertaken during the TAMP development process identified a set of enhancements to strengthen the asset management program.
To support the TAMP development process, MDT staff completed the asset management self-assessment survey from Volume I of the AASHTO Asset Management Guide. The purpose of this survey is to assess MDT in terms of state-of-the-art asset management practices. MDT managers also participated in detailed interviews to describe existing practices and discuss potential opportunities for improvement. MDT staff convened a self-assessment workshop that provided insights and established consensus on priorities for improvement.
Based on MDT input, priorities for enhancing the asset management program include:
Clarify Alignment between P3 and the 5-year Tentative Construction Program. This initiative addresses the potential disconnect between the program-level funding decisions made during P3 and the final allocation of funds. MDT will address this issue by:
− Further documenting the Tentative Construction Program development process; − Clarifying the impact of how transfers between programs and District-specific factors impede the
agency’s ability to meet the goals, objectives, and targets established through P3; and, − Further documenting the process used to verify that the Tentative Construction Program is
consistent with P3 results.
Implement a Bridge Management System. MDT currently uses a bridge information system for storing and managing inventory and condition data. MDT is in the process of exploring options for implementing a more comprehensive bridge management system that:
− Forecasts bridge deterioration; − Evaluates life-cycle costs; − Identifies short and long-term budget needs; and, − Recommends optimal work strategies and implementation schedules.
Enhance the Pavement Management System. MDT’s PvMS currently recommends treatments based on an analytical approach that relies on pavement ride quality. MDT is currently working to improve modeling capabilities in order to more accurately forecast future pavement conditions. MDT is also investigating how to address other elements of pavement performance upon future guidance. The pavement management system can then be used to recommend treatments based on a comprehensive view of pavement life cycle costs.
Improve Coordination Between Maintenance and Capital Activities. This initiative is aimed at taking a comprehensive view of potential asset treatments and minimizing budget and organizational constraints to implement them. The initiative involves the following activities:
− Identifying a tool kit of strategies for effectively managing pavements throughout their life. − Determining the most efficient way to implement each strategy. For example, with maintenance
forces or through a capital project; or with internal forces or contractor forces.

29 | MDT TRANSPORTATION ASSET MANAGEMENT PLAN
− For strategies flagged for implementation through the maintenance program, pursing funding and ensuring that MDT has the training, equipment, and staffing capacity to implement them.
Develop a Transportation Asset Management Information System (TAMIS). MDT is making significant advancements in data and information systems to support asset management decisions. A TAMIS can help ensure that MDT implements future systems and system updates in a way that maximizes the ability to support asset management. TAMIS is a set of software and business processes that help turn data from multiple systems into useable information. Potential elements of MDT’s TAMIS include:
− An enterprise data dictionary that defines core data items; − A data governance plan that identifies responsibility for collecting and managing core data items,
defines a source of record for each item, and documents a data QA/QC process; − Linear Referencing System standards that enable data from multiple systems to be integrated
efficiently via Geographic Information System; − Dashboards, mapping systems, and other applications that enable staff to quickly query and
obtain data from multiple sources; and − A system architecture that illustrates how core systems interact with one another now, and
provides a vision for how they should interact in the future.
Integrate Risk Management into the Asset Management Process. The risk register provided in this document is an important first step in managing asset management risks. MDT will use this register to communicate priority risks and track the implementation of mitigation strategies. Longer term, MDT will investigate how to develop a more comprehensive approach for considering risk in the asset management process. For example, risk analysis could be considered in the prioritization of potential bridge and pavement projects.
Address Additional Assets in the Asset Management Program. MDT focuses initial asset management efforts on bridges and pavements. Longer term, MDT will work to develop formal asset management programs for other assets. In determining priorities for additional assets, MDT will:
− Assess the relative risk for asset groups (e.g. likelihood of a failure and consequences of failure); − Assess the degree to which MDT could/should proactively mitigate the risk of failure; − Estimate the costs of implementing and sustaining each asset management element; and − Compare the implementation costs to the costs of potential asset failure, and determine which
elements, if any, should be implemented.
30 | MDT TRANSPORTATION ASSET MANAGEMENT PLAN
For more information on MDT’s TAMP visit: http://www.mdt.mt.gov or contact:
Christopher J. DeVerniero, P.E. Montana Department of Transportation | [email protected] | (406) 444-9194