Embed Size (px)
Citation preview

Development of the transportation sector in changing economic conditions
June 5, 2014
Igors Kasjanovs
Presentation outline
• The importance of the transportation sector in Latvia
• Latest data on transportation sector: are there any evidences of a
slowdown due to geopolitical risks?
• Forecasting of transportation sector: is it really possible?

The importance of the transportation sector in Latvia

GDP growth has been decelerating in the last quarters, however deceleration is mostly related to internal issues
3.8 4.4 4.6
3.6 2.8
-6.0
-4.0
-2.0
0.0
2.0
4.0
6.0
8.0
10.0
12.0
14.0
2013 Q1 Q2 Q3 Q4 2014 Q1*
GDP
Manufacturing
Construction
Trade
Transportation
Real estate
Professional services
Real GDP and largest sector growth rate, y-o-y, %
Source: Central statistical Bureau; * Flash estimate
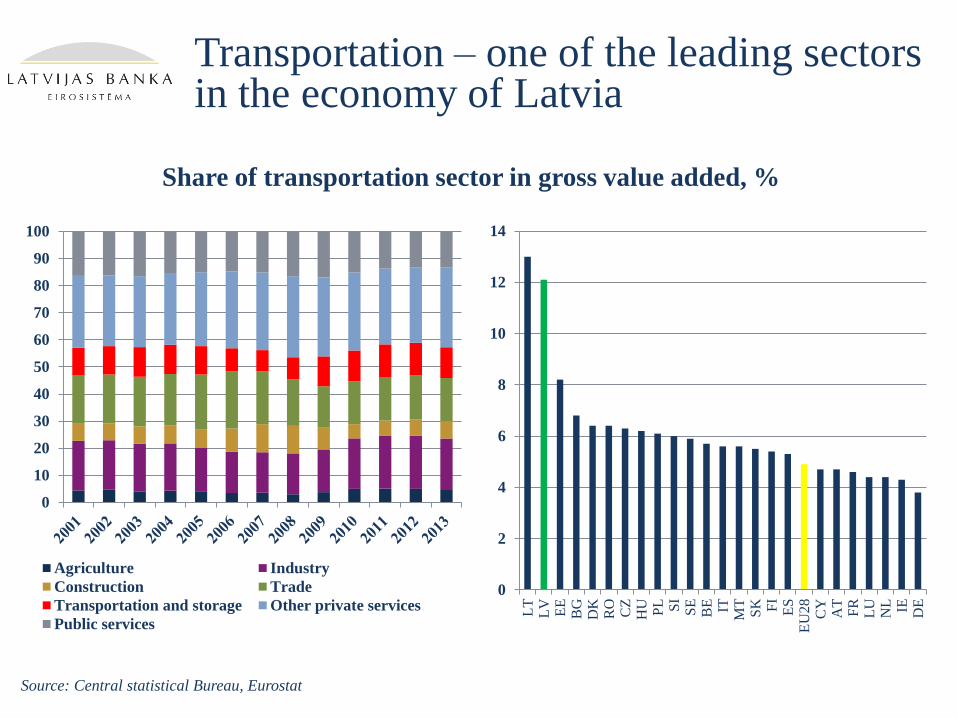
Transportation – one of the leading sectors in the economy of Latvia
0
10
20
30
40
50
60
70
80
90
100
Agriculture Industry
Construction Trade
Transportation and storage Other private services
Public services
0
2
4
6
8
10
12
14
LT
LV
EE
BG
DK
RO
CZ
HU PL SI
SE
BE IT
MT
SK FI
ES
EU
28
CY
AT
FR
LU
NL IE DE
Share of transportation sector in gross value added, %
Source: Central statistical Bureau, Eurostat

Transportation sector also plays a notable social role
Agriculture
Industry
Construction
Trade
Transportation
Other private
services
Public services 0
1
2
3
4
5
6
7
8
9
LV
EE
LT
LU
HU FI
CZ
SK
PL
BU
BE
DK SL
FR
MT
EU
-28
AT IE DE
NL
UK
CY IT
Employment structure of Latvia, % Share of employed persons in transportation sector, % of total employment
Source: Central Statistical Bureau

In 2013 transportation sector faced a deceleration, but the amount of investments points to further development
-25.0
-20.0
-15.0
-10.0
-5.0
0.0
5.0
10.0
15.0
2008
Q1
Q3 2009
Q1
Q3 2010
Q1
Q3 2011
Q1
Q3 2012
Q1
Q3 2013
Q1
Q3
Total economy Transportation
0
2
4
6
8
10
12
14
16
18
20
0
200
400
600
800
1000
1200
1400
1600
Total economy Transportation Share, % (RHS)
Value added growth, y-o-y % Share of non-financial investments in total economy, %
Source: Central Statistica Bureau

Profitability rates have been higher than in total economy; the financial position is strong, however there are disparities among the sector
-8
-6
-4
-2
0
2
4
6
8
10
12
20
10
Q1
Q2
Q3
Q4
20
11
Q1
Q2
Q3
Q4
20
12
Q1
Q2
Q3
Q4
20
13
Q1
Q2
Q3
Q4
20
14
Q1
TOTAL Transportation and storage (H)
-100
-80
-60
-40
-20
0
20
40
60
Total economy
Transportation and storage
Land transport
Water transport
Air transport
Warehousing and support act.
Postal and courier activities
Profitability rate (net profit/turnover), % Share of equity capital in liabilities, %
Source: Central Statistical Bureau

Transportation sector is important player in service exports
0
100
200
300
400
500
600
700
800
900
1000
20
11Q
1
Q2
Q3
Q4
20
12Q
1
Q2
Q3
Q4
20
13Q
1
Q2
Q3
Q4
Government services, n.i.e.
Personal, cultural and recreational
servicesOther bussiness services
Royalties and licence fees
Computer and information services
Financial services
Insurance services
Construction services
Communication services
Travel
Transportation
Exports of services (millions EUR)
Source: Bank of Latvia

Latest data on transportation sector: are there any evidences of a slowdown due
to geopolitical risks?

Competition increases in the Baltic Sea region; Latvian ports loose their shares
0
10
20
30
40
50
60
70
80
2012 2013
Cargoes loaded and unloaded in Baltic sea ports, mln. tons
0
50
100
150
200
250
300
350
400
Baltic sea
region
+0.35%
Source: Klaipeda Seaport Authority

Further growth of cargo amount is observed in Port of Riga
0
5000
10000
15000
20000
25000
Small ports
Liepaja
Ventspils
Riga
Total
Cargo handled in ports of Latvia, thsd. tons
Source: Central Statistical Bureau

The diversification of ports of Latvia is still weak – two main cargo categories account for approx. 60%. Therefore ports are subject to specific demand risks.
0
10000
20000
30000
40000
50000
60000
70000
80000
2000 2001 2002 2003 2004 2005 2006 2007 2008 2009 2010 2011 2012 2013
Perishables
Grain and cereal products
Mineral building materials
Sugar
Other goods
Liquid chemicals
Metals and scrap
Timber and wood
Dry chemicals
Oil
Roll on/ roll off
Cargo in containers
Wood ships
Iron ore
Coal
Oil products
Handled cargos in ports of Latvia, thsd. tons
Source: Central Statistical Bureau

The Q1 increase in cargoes loaded and unloaded in ports is due to the significant increase in oil product cargoes at the Riga port
-15.0
-10.0
-5.0
0.0
5.0
10.0
15.0
20.0
25.0
30.0
2011
I
II III IV 2012
I
II III IV 2013
I
II III IV 2014
I
Goods in containers
Other
Metals
Wood
Oil
Coal
Grain
Total
Y-o-Y contributions of the main cargoe types and the change in overall cargoe turnover, percentage points
Source: Central Statistical Bureau

After a slight deceleration in 2013, cargo amount transported by rail rebounded in Q1 of 2014
0
2000
4000
6000
8000
10000
12000
14000
16000
18000
20000
2003
Q1
Q3 2004
Q1
Q2 2005
Q1
Q1 2006
Q1
Q4 2007
Q1
Q3 2008
Q1
Q2 2009
Q1
Q1 2010
Q1
Q4 2011
Q1
Q3 2012
Q1
Q2 2013
Q1
Q1
Internal traffic Transit Export Import
Cargo transported by rail, thsd. tons
Source: Central statistical Bureau

Geographically transportation sector highly relies on the economical and political situation in Russia
71%
21%
4%
3%
1% 0%
0%
Russia
Belarus
Kazakhstan
Lithuania
Ukraine
Estonia
Others
Import freight transport by rail, % (2012)
Source: Central statistical Bureau
0%
10%
20%
30%
40%
50%
60%
70%
80%
90%
100%
National traffic Exports
Imports Transit
Structure of freight transport by rail, % (2012)

Cargo amount transported by road has been increasing steadily. However a drop in turnover has been observed in Q4 of 2013
0
500
1000
1500
2000
2500
3000
3500
4000
0
2000
4000
6000
8000
10000
12000
14000
16000
18000
20000
2005
1Q
3Q
2006
1Q
3Q
2007
1Q
3Q
2008
1Q
3Q
2009
1Q
3Q
2010
1Q
3Q
2011
1Q
3Q
2012
1Q
3Q
2013
1Q
3Q
2014
1Q
Freight traffic - total, thsd t
Freight turnover, mln tonne kilometres
0%
10%
20%
30%
40%
50%
60%
70%
80%
90%
100%
20
06
Q1
Q3
20
07
Q1
Q2
20
08
Q1
Q1
20
09
Q1
Q4
20
10
Q1
Q3
20
11
Q1
Q2
20
12
Q1
Q1
20
13
Q1
Q4
Domestic traffic International traffic
Freight traffic by road Freight turnover, %
Source: Central statistical Bureau
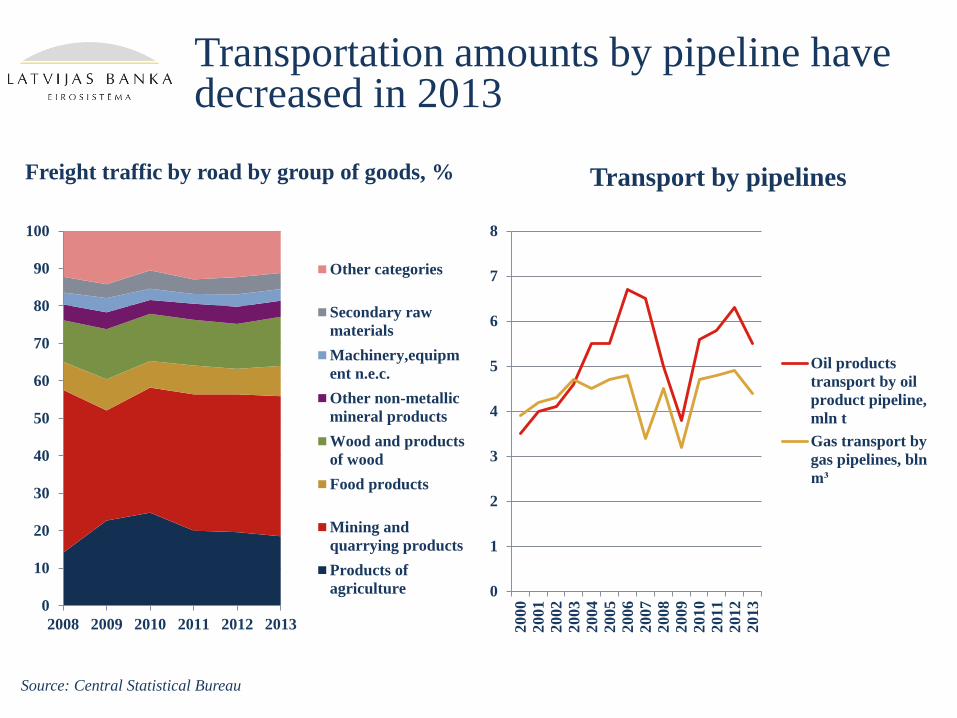
Transportation amounts by pipeline have decreased in 2013
0
10
20
30
40
50
60
70
80
90
100
2008 2009 2010 2011 2012 2013
Other categories
Secondary raw
materials
Machinery,equipm
ent n.e.c.
Other non-metallic
mineral products
Wood and products
of wood
Food products
Mining and
quarrying products
Products of
agriculture 0
1
2
3
4
5
6
7
8
2000
2001
2002
2003
2004
2005
2006
2007
2008
2009
2010
2011
2012
2013
Oil products
transport by oil
product pipeline,
mln t
Gas transport by
gas pipelines, bln
m³
Freight traffic by road by group of goods, % Transport by pipelines
Source: Central Statistical Bureau

Cargoes at ports and rail freight turnover figures suggest a successful Q1, but there are doubts about the sustainability of these results
-30
-20
-10
0
10
20
30
40
small ports
Liepaja port
Ventspils port
Riga port
Cargoes in ports
Rail freight turnover
Road freight turnover-40.0
-30.0
-20.0
-10.0
0.0
10.0
20.0
30.0
2013'I II III
IV V VI
VII
VII
I
IX X XI
XII
2014'I II III
IV
Cargoes at ports
Rail freight turnover
Cargoes at ports, rail and road freight, % change Y-o-Y, and contributions to cargoes at ports by port, percentage points
Monthly cargoes loaded and unloaded at ports and freight turnover by rail, % change Y-o-Y
Source: Central Statistical Bureau

There was a slight pick-up in internal passenger traffic in 2013
0
10000
20000
30000
40000
50000
60000
70000
20
02 Q
1
Q3
20
03 Q
1
Q2
20
04 Q
1
Q1
20
05 Q
1
Q4
20
06 Q
1
Q3
20
07 Q
1
Q2
20
08 Q
1
Q1
20
09 Q
1
Q4
20
10 Q
1
Q3
20
11 Q
1
Q2
20
12 Q
1
Q1
20
13 Q
1
Q4
20
14 Q
1
Rail
Bus
Tram
Trolley-bus
Passenger traffic (thsd. passengers) by means of transport
Source: Central statistical Bureau

International passenger traffic is decreasing a bit on the back of consolidation of the largest air-carrier
0
200
400
600
800
1000
1200
1400
1600
1800
20
02
Q1
Q4
Q2
Q4
20
05
Q1
Q1
Q3
Q1
20
08
Q1
Q2
Q4
Q2
20
11
Q1
Q3
Q1
Q3
20
14
Q1
Non seasonaly adjusted Seasonaly adjusted
0
50
100
150
200
250
300
350
20
04
Q1
Q3
20
05
Q1
Q2
20
06
Q1
Q1
20
07
Q1
Q4
20
08
Q1
Q3
20
09
Q1
Q2
20
10
Q1
Q1
20
11
Q1
Q4
20
12
Q1
Q3
20
13
Q1
Q2
20
14
Q1
Non seasonaly adjusted Seasonaly adjusted
Passengers in airport “Riga”, thsd. pers. Passengers in port “Riga”, thsd. pers.
Source: Central statistical Bureau

Forecasting of transportation sector: is it really possible?

Forecasting of transportation sector is easy in case of central Europe, not the case in the Baltics
-15
-10
-5
0
5
10
15
2004 2005 2006 2007 2008 2009 2010 2011 2011
Manufacturing Trade Transportation
-30
-25
-20
-15
-10
-5
0
5
10
15
20
25
2004 2005 2006 2007 2008 2009 2010 2011 2012
Manufacturing Trade Transport
Transportation sector in EU-28 Transportation sector in Latvia
Source: Eurostat, Central Statistical Bureau

Top-down approach: econometrically possible, but have to rely on international environment forecasts which also contain an error
-20
-15
-10
-5
0
5
10
15
20
25
-20
-15
-10
-5
0
5
10
15
20
25
2001 Q
1
Q4
Q3
Q2
2004 Q
1
Q4
Q3
Q2
2007 Q
1
Q4
Q3
Q2
2010 Q
1
Q4
Q3
Q2
2013 Q
1
Q4
GDP of EU-28
Value added in transportation sector (LV)
Real imports of EU-28
-20
-15
-10
-5
0
5
10
15
20
25
-20
-15
-10
-5
0
5
10
15
20
25
2001
Q1
Q4
Q3
Q2
2004
Q1
Q4
Q3
Q2
2007
Q1
Q4
Q3
Q2
2010
Q1
Q4
Q3
Q2
2013
Q1
Q4
GDP of Russia
Value added in transportation sector (LV)
EU-28 GDP, real import and VA of transportation sector of Latvia, y-o-y, %
Russia GDP and VA of transportation sector of Latvia, y-o-y, %
Source: OECD, Central Statistical Bureau

However, life is not much easier in case of bottom-up approach
-40.0
-30.0
-20.0
-10.0
0.0
10.0
20.0
30.0
2000 2001 2002 2003 2004 2005 2006 2007 2008 2009 2010 2011 2012 2013
Transportation sector value
added
Cargo by rail
Cargo in ports
Cargo by road
Passengers
Annual growth rates of transportation sub-sectors
Source: Central Statistical Bureau

However, there are some relations that can be used
0
10
20
30
40
50
60
70
80
90
0
2000
4000
6000
8000
10000
12000
14000
16000
18000
20000
20
06
I
III
20
07
I
III
20
08
I
III
20
09
I
III
20
10
I
III
20
11
I
III
20
12
I
III
20
13
I
III
20
14
I
Carbo by road Diesel oil
-60
-50
-40
-30
-20
-10
0
10
20
30
0
2000
4000
6000
8000
10000
12000
14000
16000
18000
20000
Cargo by road Confidence indicator
Relation between consumption of diesel oil and cargo by road
Relation between confidence indicator of land transport sub-branch and cargo by road
Source: Central Statistical Bureau

Coal amount growth in ports can be easily forecasted as a lagged function of regional coal prices
-40
-30
-20
-10
0
10
20
30
40
50
60
-80
-60
-40
-20
0
20
40
60
80
100
120
Q3
Q4
20
09 Q
1
Q2
Q3
Q4
20
10 Q
1
Q2
Q3
Q4
20
11 Q
1
Q2
Q3
Q4
20
12 Q
1
Q2
Q3
Q4
20
13 Q
1
Q2
Q3
Q4
20
14 Q
1
Q2
Coal price
Coal cargo in ports
Coal price and coal handling amount y-o-y growth, %
Source: Bloomberg; Central Statistical Bureau

Closing remarks
• No hard data suggests any real problems or slowdown in the
transportation sector in Q1 of 2014;
• However, some forward looking indicators and operative statistics
point to a possible period of weaker results;
• The transportation sector remains highly vulnerable to external
demand shocks – both in terms of geographical exposures and
types of cargo;
• Forecasting of transportation sector of Latvia is highly problematic
– a lot of factors have to be taken into account;
• Still, the most important quote: “The success is in the details”