Embed Size (px)
Citation preview
TRANSPORT OF H+, NA+ AND K+ ACROSS THE
POSTERIOR MIDGUT OF BLOOD-FED
MOSQUITOES (AEDES AEGYPTI)
TRANSPORT OF H+, NA+ AND K+ ACROSS THE
POSTERIOR MIDGUT OF BLOOD-FED MOSQUITOES
(AEDES AEGYPTI)
By
EVAN K. PACEY, BSc (Honours)
A Thesis Submitted to the School of Graduate Studies
in Partial Fulfillment of the Requirements for the Degree
Master of Science
Copyright © 2013 by Evan K. Pacey

ii
MASTER OF SCIENCE (2013)
McMaster University, Department of Biology
Hamilton, ON
Canada
Title: Transport of H+, Na
+ and K
+ across the posterior midgut of blood-
fed mosquitoes (Aedes aegypti)
Author: Evan K. Pacey, BSc (Honours)
Supervisor: Dr. Michael J. O’Donnell
Number of Pages: xii, 68
iii
Abstract
Mosquitoes pose significant threats to human health because they act as vectors
for disease causing viruses and protozoans. Indeed, Aedes aegypti is known as the Yellow
Fever Mosquito because of its role as a vector for viral infections that kill thousands of
people each year. A more thorough understanding of mosquito physiology will aid
development of novel control strategies. Previous work on ion transport across the midgut
has been focused primarily on larval A. aegypti, while research on the midgut of the adult
stage is less complete. The posterior midgut of the adult female is of particular interest
because it is used for the storage and digestion of the blood meal which is required for the
production of eggs. This study used an array of electrophysiological methodologies such
as the Scanning Ion Electrode Technique (SIET) in order to elucidate the patterns and
mechanisms of Na+, H
+ and K
+ transport across the posterior midgut at intervals during
postprandial diuresis and digestion of the blood meal. Measurements of transepithelial
potential indicated that the lumen was at its most negative (-13.2 mV) three hours after
the blood meal and then gradually became less negative during the time course of
digestion. Na+ was absorbed (from lumen to bath) at all intervals after the blood meal (6
min, 30 min, 2h, 24 h); calculations of the electrochemical potential indicated that
absorption required active transport. H+ absorption at all times (6 min – 48 h) after the
blood meal was also active (i.e. against the electrochemical gradient for H+) and was
greatly reduced by inhibition of carbonic anhydrase. K+ transport across the midgut
exhibited two distinct phases. During diuresis, luminal concentrations of K+ were in the
range 24 – 28 mM and secretion into the midgut was opposed by the electrochemical

iv
gradient, indicating active transport. After diuresis, during blood meal digestion,
concentrations of K+ in the midgut contents were high (95 – 134 mM) and absorption of
K+ was favoured by the electrochemical gradient. K
+ absorption was sensitive to the
channel blocker Ba2+
during this period.

v
Acknowledgements
First and foremost, I would like to thank my supervisor Dr. Michael O’Donnell
for providing the laboratory and the equipment necessary to make this thesis research
possible. His knowledge and experience of the subject matter were instrumental in
making this project a success and his patience with me as I struggled through the first
quarter of my Masters was greatly appreciated.
I’d also like to thank Dr. Colin Nurse for his helpful suggestions while serving as
a committee member, for being extremely easy to work with while I was a T.A. for his
course and for helping me in the pursuit of an academic career.
I must also thank the members of the O’Donnell lab for helping me with all the
problems that arose in my project during the last two years and extend a special thank you
to Natalie whose professionalism and in-depth knowledge of the field helped me
whenever I couldn’t find Mike.
A big thank you must also go out to all the medical equipment that somehow
survived the many beatings that I gave them over the course of the last two years. This
project literally could not have happened without them. I must also mention the electric
mosquito swatter that provided me with my only line of defence against the endless
onslaught of escapees that inhabited the mosquito room.
Last, but not least my biggest thank you goes to my parents whose love and
support got me through these challenging years at McMaster. The fact that they were
always there to listen to me vent about the trials of the day and were always willing to

vi
make that long drive down from Ottawa to help me when I could no longer physically do
this on my own made me forever realize how lucky I am to have them.
vii
THESIS ORGANIZATION AND FORMAT
This thesis is presented as a “sandwich thesis” with a general introduction and
objectives of the research presented in chapter 1, followed by two research papers
presented as chapter 2 and chapter 3, which are in the format of manuscripts to be
submitted for publication in peer-reviewed journals. The last chapter is a general
discussion of the findings of the project.
Chapter 1: General introduction and project objectives
Chapter 2: Postprandial changes in transport of Na+, H
+ and K
+ across the posterior
midgut of blood-fed mosquitoes (Aedes aegypti).
Chapter 3: Effects of ion transport inhibitors on transport of Na+, H
+ and K
+ across the
posterior midgut of blood-fed mosquitoes (Aedes aegypti).
Chapter 4: General discussion and future studies

viii
TABLE OF CONTENTS
Chapter 1: 1
General Introduction 1
Locating hosts and feeding 1
Blood components 2
Heat stress 2
Diuresis 3
The peritrophic matrix 4
Luminal pH 5
Trypsin 5
NH4+
7
Heme and iron 8
Waste products 8
Larval mosquitoes 9
Electrophysiological methods 10
Transepithelial potential measurements 10
Luminal ion concentrations 10
Calculation of electrochemical potential 11
Scanning Ion-Selective Electrode Technique 11
Objectives 12
Hypotheses 13

ix
Chapter 2: Postprandial changes in transport of Na+, K
+ and H
+ across
the posterior midgut of blood-fed mosquitoes (Aedes aegypti) 16
Abstract 16
Introduction 17
Materials and Methods 18
Insect rearing 18
Physiological salines and dissection 19
Measurement of transepithelial potential and
luminal Na+ and K
+ concentrations 19
Calculation of Electrochemical Potentials 20
Scanning Ion Electrode Technique (SIET) 21
Statistical Analyses 25
Results 25
Transepithelial potential (TEP) 25
Concentrations of Na+ and K
+ in the contents
of the posterior midgut 26
Net electrochemical potentials for Na+, K
+ and H
+ 26
Transepithelial fluxes of Na+, K
+ and H
+ 27
Discussion 28
x
Chapter 3: Effects of ion transport inhibitors on transport of Na+, H
+
and K+ across the posterior midgut of blood-fed mosquitoes
(Aedes aegypti). 41
Abstract 41
Introduction 43
Materials and Methods 45
Insect rearing 45
Physiological salines and dissection 45
Pharmacological reagents 45
Scanning Ion Electrode Technique (SIET) 45
Statistical Analyses 45
Results 46
H+ fluxes 46
Na+ fluxes 46
K+ fluxes 47
Discussion 47
Chapter 4: General Discussion 57
A working model of ion transport across the posterior
midgut of blood-fed mosquitoes: transport across the
basolateral membrane. 57
Transport across the apical membrane. 59

xi
References 61
LIST OF FIGURES
CHAPTER 1
FIGURE 1 A typical blood-fed A. aegypti posterior midgut. 14
FIGURE 2 Measurement of K+ fluxes using the Scanning
Ion-Selective Electrode Technique (SIET). 15
CHAPTER 2
FIGURE 1 Transepithelial potential of the posterior midgut of
A. aegypti at intervals following a blood meal. 35
FIGURE 2 Concentrations of Na+ and K
+ in the contents of the
posterior midgut of A. aegypti at intervals following
a blood meal. 36
FIGURE 3 Electrochemical potential (Δμ/F, mV) for Na+, K
+
and H+ at intervals after the blood meal. 37
FIGURE 4 Fluxes of Na+, H
+ and K
+ across the posterior
midgut of A. aegypti at intervals after the blood meal. 38
FIGURE 5 Schematic diagram summarizing electrochemical
potentials and measured fluxes for Na+, H
+ and K
+ across
the posterior midgut 39

xii
CHAPTER 3
FIGURE 1 Fluxes of H+ across the posterior midgut of A. aegypti
before and after drug treatment. 53
FIGURE 2 Fluxes of Na+ across the posterior midgut of A. aegypti
before and after drug treatment. 54
FIGURE 3 Fluxes of K+ across the posterior midgut of A. aegypti
before and after drug treatment. 55
FIGURE 4 Possible mechanisms of ion transport in the posterior
midgut of A. aegypti during diuresis and digestion of
the blood meal. 56

MSc Thesis – EK Pacey; McMaster University – Department of Biology
1
Chapter 1:
General Introduction
Mosquitoes are a serious health threat to the world’s population causing over a
million deaths annually (Isoe & Scaraffia, 2013). The majority of these deaths occur from
parasites or viruses that are introduced into the host’s blood stream when the mosquito is
acquiring a blood meal. Aedes aegypti is a particularly dangerous species as it is the
vector for a number of diseases such as yellow fever, dengue fever and chikungunya.
Locating hosts and feeding
Only female mosquitoes spread disease because only they require blood in order
to reproduce. Indeed, female mosquitoes have evolved many adaptations in order to
become extremely efficient at locating hosts and feeding on blood. They detect hosts
mainly by the use of chemical and visual cues. Their antennae are specifically designed to
recognize CO2 and 1-octen-3-ol being exhaled by the host and are also able to detect
other odours in sweat. They also have heat sensors around their mouthparts that allow
them to detect warm-blooded organisms while their compound eyes allow them to
visualize potential hosts. Once a mosquito has found a host she will either prod around
the skin looking for suitable blood vessels or bite the organism immediately. She bites by
first inserting her long needle-like proboscis into the skin and then releasing saliva into
the punctured blood vessel. The saliva is a mixture of secreted proteins that cause
inflammation and help to prevent vasoconstriction, coagulation, platelet aggregation,

MSc Thesis – EK Pacey; McMaster University – Department of Biology
2
angiogenesis as well as immune responses. It is during this deposition of saliva that the
majority of mosquito-borne parasites and viruses are introduced into the host.
Blood components
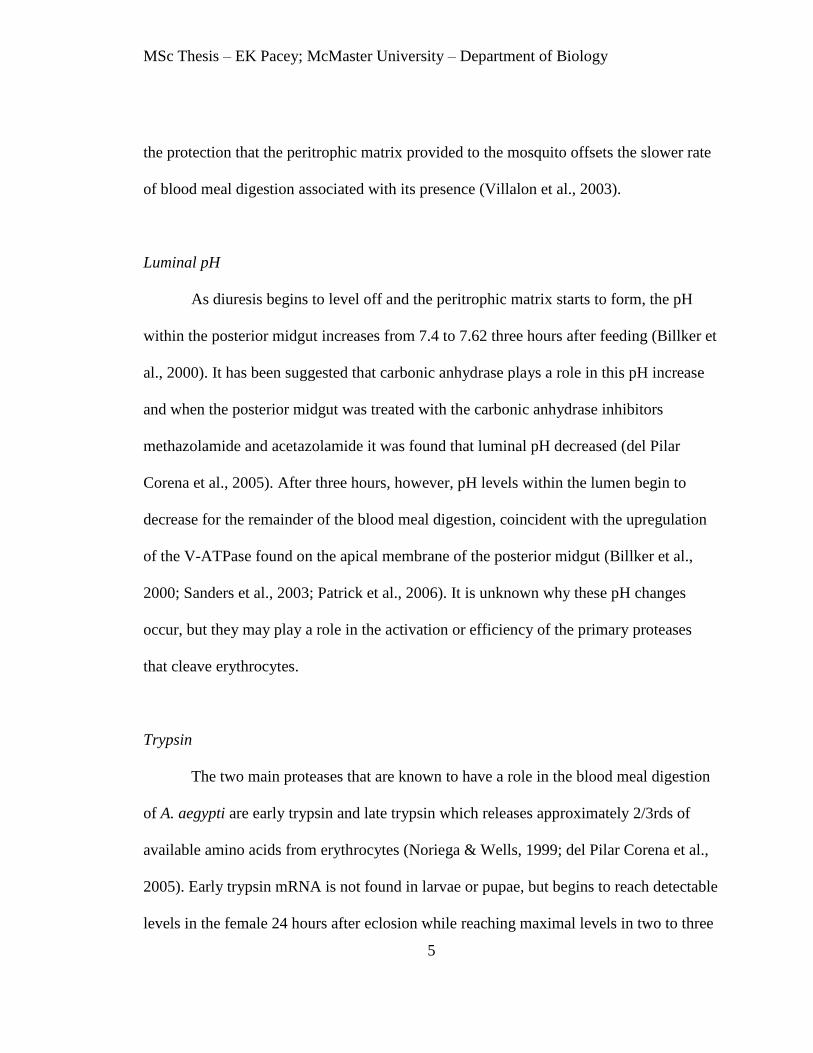
After the mosquito has prepared the blood vessel for feeding it will begin to ingest
a blood meal from the host into its posterior midgut for storage and digestion (Figure 1).
The blood meal is composed primarily of two different components; the plasma portion
which is high in water and Na+ and the erythrocyte portion which is rich in intracellular
K+ as well as the proteins which are the desired component of the meal. Studies of
14C-
protein metabolic labeling have shown that only 3% of the amino acids derived from
digestion of the blood meal proteins are allocated for oogenesis while the remainder is
converted into lipids, carbohydrates or are oxidized in order to provide energy (Zhou et
al., 2004). More than 60% of the amino acids are oxidized to carbon dioxide to provide
the energy needed for egg production (Briegel, 1985; Zhoe et al., 2004). The mosquito
doubles its body weight in less than two minutes during feeding, resulting in an array of
different physiological stresses on the mosquito (Beyenbach, 2012).
Heat stress
The first stress the mosquito experiences after ingestion of the blood meal is heat
stress. Mosquitoes are ectothermic animals while the majority of their suitable hosts are
endothermic. This means that when the blood meal is first ingested it retains a significant
amount of heat from the host which could be deleterious to the mosquito. Indeed, it has

MSc Thesis – EK Pacey; McMaster University – Department of Biology
3
been shown that when A. aegypti drinks fresh blood from a human (37°C) it will begin to
transcribe and translate heat shock protein 70 in response to this stress (Benoit et al.,
2011). Heat shock protein 70 plays a role in supporting the normal digestion of the blood
meal because when its expression is suppressed using RNA interference the rate of
digestion is impaired and egg production decreases by 25% (Benoit et al., 2011).
Diuresis
Ingesting a large blood meal renders the mosquito barely maneuverable, easy to
spot and thus at high risk of predation. The mosquito counteracts this problem by
excreting 40% of the meal’s water content within two hours (Williams et al., 1983). The
Na+/K
+-ATPase located on the basolateral membrane of the posterior midgut may
contribute to diuresis (Sanders et al., 2003; Patrick et al., 2006). The sodium pump has
been suggested to play a role in creation of osmotic gradients driving transcellular water
transport through aquaporins 1, 2, 4 and 5 which are expressed in the midgut. Aquaporins
1, 2 and 4 are down regulated by 3 h after the blood meal, corresponding to the time by
which excretion of the bulk of the blood meal-derived water has been excreted (Drake et
al., 2010). Furthermore, the mosquito releases diuretic peptides from the brain such as
aedeskinin and mosquito naturietic peptide into the hemolymph immediately after
feeding; these then stimulate the fluid-secreting Malpighian tubules of the mosquito
(Beyenbach, 2012). Through the activation of G-protein coupled receptors and the release
of intracellular Ca2+
stores, the paracellular resistance of the Malpighian tubules decreases
tenfold leading to a “leaky epithelium” that allows a dramatic increase in the

MSc Thesis – EK Pacey; McMaster University – Department of Biology
4
transepithelial secretion of NaCl, KCl and water which are then eliminated by the
mosquito (Beyebach, 2012). The peak phase of diuresis occurs around six minutes after
the acquisition of a blood meal and steadily declines until two hours after feeding
(Williams et al., 1983). It is interesting to note that the mosquito does not completely
excrete the entire plasma/water portion of the meal, but begins to reduce the number of
water-transporting aquaporins in the posterior midgut after diuresis (Sanders et al., 2003;
Drake et al., 2010). It is believed that the mosquito retains this fluid that surrounds the
erythrocytes in the posterior midgut in order to serve as a template for the formation of
the peritrophic matrix (Sanders et al., 2003).
The peritrophic matrix
Soon after the end of diuresis the peritrophic matrix begins to form in the posterior
midgut. Its purposes are to protect the posterior midgut cells from mechanical and
chemical damage caused by the blood meal itself or the products of its digestion, as well
as to serve as a barrier against pathogenic infection (Pascoa et al., 2002; Villalon et al.,
2003). The peritrophic matrix surrounds the blood bolus and separates it from the midgut
epithelium in order to accomplish these beneficial tasks. However, this extra barrier
makes it difficult for digestive enzymes secreted by epithelial cells to reach the blood
meal and for digestion products to be absorbed by these same cells. When Villalon et al.
in 2003 disrupted the formation of the chitin-containing peritrophic matrix by the use of
chitinase and antibodies they found that the rate of blood meal digestion increased
indicating that the matrix was slowing down the digestion process. They suggested that
MSc Thesis – EK Pacey; McMaster University – Department of Biology
5
the protection that the peritrophic matrix provided to the mosquito offsets the slower rate
of blood meal digestion associated with its presence (Villalon et al., 2003).
Luminal pH
As diuresis begins to level off and the peritrophic matrix starts to form, the pH
within the posterior midgut increases from 7.4 to 7.62 three hours after feeding (Billker et
al., 2000). It has been suggested that carbonic anhydrase plays a role in this pH increase
and when the posterior midgut was treated with the carbonic anhydrase inhibitors
methazolamide and acetazolamide it was found that luminal pH decreased (del Pilar
Corena et al., 2005). After three hours, however, pH levels within the lumen begin to
decrease for the remainder of the blood meal digestion, coincident with the upregulation
of the V-ATPase found on the apical membrane of the posterior midgut (Billker et al.,
2000; Sanders et al., 2003; Patrick et al., 2006). It is unknown why these pH changes
occur, but they may play a role in the activation or efficiency of the primary proteases
that cleave erythrocytes.
Trypsin
The two main proteases that are known to have a role in the blood meal digestion
of A. aegypti are early trypsin and late trypsin which releases approximately 2/3rds of
available amino acids from erythrocytes (Noriega & Wells, 1999; del Pilar Corena et al.,
2005). Early trypsin mRNA is not found in larvae or pupae, but begins to reach detectable
levels in the female 24 hours after eclosion while reaching maximal levels in two to three
MSc Thesis – EK Pacey; McMaster University – Department of Biology
6
day-old adults (Noriega & Wells, 1999). The mRNA of late trypsin on the other hand is
not found in adults prior to blood feeding, but becomes transcribed only through a
complex regulatory system (Noriega & Wells, 1999). Although this system is not
completely understood, it appears that early trypsin is acting as a “sensor” that detects
whether or not the ingested meal is suitable for egg production and worth the energy-
consuming process of transcribing large amounts of late trypsin (Noriega & Wells, 1999;
Caroci & Noriega, 2003). Early trypsin translation was not triggered in mosquitoes
engorged with meals of saline, latex beads or sugar solutions and the meal was rapidly
excreted, indicating that mechanical distension of the posterior midgut is not the primary
activator of blood meal digestion (Noriega & Wells, 1999; Caroci & Noriega, 2003).
Instead it seems that free amino acids within the lumen are the primary activators of early
trypsin translation which is the beginning of the digestion process (Caroci & Noriega,
2003). These free amino acids are most likely cleaved by early trypsin and then “activate”
the transcription of late trypsin mRNA. When mosquitoes were fed a blood meal that
contained soybean trypsin inhibitor there was no transcription of late trypsin indicating
that the free amino acids cleaved by early trypsin were not present (Barillas-Mury et al.,
1995). However, when mosquitoes were fed a protein meal that had been partially
digested by bovine trypsin (which mimics the activity of early trypsin) transcription of
late trypsin occurred at control levels (Barillas-Mury et al., 1995). Interestingly, the
mosquito also uses these free amino acids as building blocks for the synthesis of late
trypsin as was shown by Schneider et al. in 1986 when they observed radioactive amino
acids being incorporated into the protease indicating that they may serve as a rate-limiting

MSc Thesis – EK Pacey; McMaster University – Department of Biology
7
step in the production of the enzyme. This unique regulatory system allows mosquitoes to
control whether or not they commit the energy to digesting a blood meal and lets them
remove low-quality meals quickly and efficiently so that they are able to acquire a more
nutritious meal in the near future.
NH4+
After the requirements of the early digestion process have been achieved the
mosquito begins to synthesize large amounts of late trypsin 8 to 36 hours post-blood
feeding (Noriega & Wells, 1999). This is the time of greatest amino acid accumulation in
the mosquito and represents a period of stress due to high rates of nitrogenous waste
production. Amino acid catabolism releases the toxic by-product NH4+
(Scaraffia et al.,
2005; Isoe & Scaraffia, 2013). NH4+ toxicity is minimized through a three-phase strategy
of fixation, assimilation and excretion (Isoe & Scaraffia, 2013). In the posterior midgut
NH4+
is fixed and assimilated into glutamine and alanine by glutamine synthase and
alanine aminotransferase while in the fat body NH4+ is fixed and assimilated into
glutamine and proline by glutamine synthase and pyrroline-5-carboxylate synthase (Isoe
& Scaraffia, 2013). Proline and glutamine are known to be the most abundant amino acids
in the mosquito hemolymph and during this time of high abundance proline can be
utilized as an energy substrate for flight (Scaraffia & Wells, 2003; Scaraffia et al., 2005).

MSc Thesis – EK Pacey; McMaster University – Department of Biology
8
Heme and iron
After 24 hours the peak phase of digestion is over and the mosquito now has to
deal with the toxic heme groups released from lysed erythrocytes. The free iron from
these cells and metabolism of the heme group can produce reactive oxygen species which
cause a multitude of deleterious effects. Indeed, this is when the chemical protection
provided by the peritrophic matrix is particularly useful. At this time the peritrophic
matrix reaches its maximal thickness and begins to turn a brownish colour due to its
binding of free heme in the lumen (Pascoa et al., 2002). Moreover, it is also during this
time frame that the iron-storing protein ferritin is upregulated in the posterior midgut
which then acts as a further means of binding the potentially reactive free iron (Sanders et
al., 2003). Control of heme toxicity in the gut is accomplished by a combination of the
formation of heme aggregates, heme degradation, antioxidant enzymes and low molecular
weight free radical scavengers. In addition, low molecular weight antioxidants and heme-
binding proteins in the hemolymph such as ferritin act as a second line of defence,
preventing generation of free radicals and thereby resulting in a low level of oxidative
stress in the other tissues (Graca-Souza et al., 2006).
Waste products
At 72 hours post-blood feeding the mosquito has completed its digestive process
and removes the remainder of the former blood meal in the form of water, dark brown
specks of the indigestible blood residue hematin and colourless crystals of ammonium
urate (Van Handel, 1975).
MSc Thesis – EK Pacey; McMaster University – Department of Biology
9
Larval mosquitoes
Larval A. aegypti do not acquire blood meals so the physiology of their digestive
system differs from that of the adult female. The main diet of mosquito larvae is plant
detritus which requires its own complex system for proper digestion (Boudko et al.,
2001a; Boudko et al., 2001b; del Pilar Corena et al., 2002; Jagadeshwaran et al., 2010).
When the larvae ingests its meal it first enters the foregut which has a pH ~7 then it enters
the anterior midgut (pH ~11) and then finally moves into the posterior midgut (pH ~7.5)
where the nutrients of the meal are absorbed (Boudko et al., 2001a; Boudko et al., 2001b;
del Pilar Corena et al., 2002; Jagadeshwaran et al., 2010). The highly alkaline pH of the
anterior midgut is one of the most alkaline environments known in any biological system
and it is believed that this environment exists in order to sterilize food from pathogens
and toxins, allow digestive enzymes to work at their optimal pH, enhance the assimilation
of proteins and dissociate tannin-protein complexes (Boudko et al., 2001a; Boudko et al.,
2001b; del Pilar Corena et al., 2002; Jagadeshwaran et al., 2010). This highly alkaline pH
has been demonstrated to be mostly the result of carbonic anhydrase and a basolateral V-
ATPase as ingestion of the carbonic anhydrase inhibitor acetazolamide and application of
the V-ATPase inhibitor bafilomycin decreased lumen alkalization significantly (Boudko
et al., 2001a; Boudko et al., 2001b; Patrick et al., 2006). In regards to the relatively more
acidic posterior midgut it was found that serotonin could stimulate both ion transport as
well as the transepithelial potential bringing it back to its normal lumen-positive levels of
(+75 mV) after rundown (Clark et al., 1999). In contrast to the anterior midgut, the
posterior midgut has a V-ATPase located on the apical membrane that could play a role in
MSc Thesis – EK Pacey; McMaster University – Department of Biology
10
the acidification of that region despite the fact that application of bafilomycin on the
hemolymph side had no effect on H+ gradients (Boudko et al., 2001a; Patrick et al.,
2006).
Electrophysiological methods
Although much work has already been done uncovering the patterns and
mechanisms of ion transport in the digestive systems of the larval mosquito, the patterns
and mechanisms of ion transport in the adult female posterior midgut are unclear.
Therefore, in order to elucidate these unknowns a number of electrophysiological
techniques were used in this thesis.
Transepithelial potential measurements
Transepithelial potential can be measured by impaling the lumen of the isolated
and intact posterior midgut bathed in physiological saline with a microelectrode
backfilled with 3M KCl and measuring the voltage with respect to a reference electrode
placed in the bath.
Luminal ion concentrations
Luminal ions concentrations were measured by placing the isolated midgut under
paraffin oil and then rupturing it with a pair of forceps. An ion-selective and reference
electrode placed into the luminal contents can then be used to provide a measurement of
ion concentration.

MSc Thesis – EK Pacey; McMaster University – Department of Biology
11
Calculation of electrochemical potential
The electrochemical potential (Δμ/F, in mV) of an ion indicates whether the
activity of an ion is at, above or below the activity consistent with passive equilibrium. It
is calculated using the equation: Δμ/F = 59 log([ion]lumen/[ion]bath) + zTEP, where
[ion]lumen is the concentration of the ion in the lumen (mM), [ion]bath is the concentration
of the ion in the bath (mM), z is the valency and TEP is the transepithelial potential (mV).
A positive value of Δμ/F indicates that the ion concentration in the midgut lumen is in
excess of equilibrium, i.e. net passive movement from the gut lumen to bath is favoured,
whereas a negative value indicates that the luminal ion concentration is below equilibrium
and that net passive movement from the bath to the gut lumen was favoured.
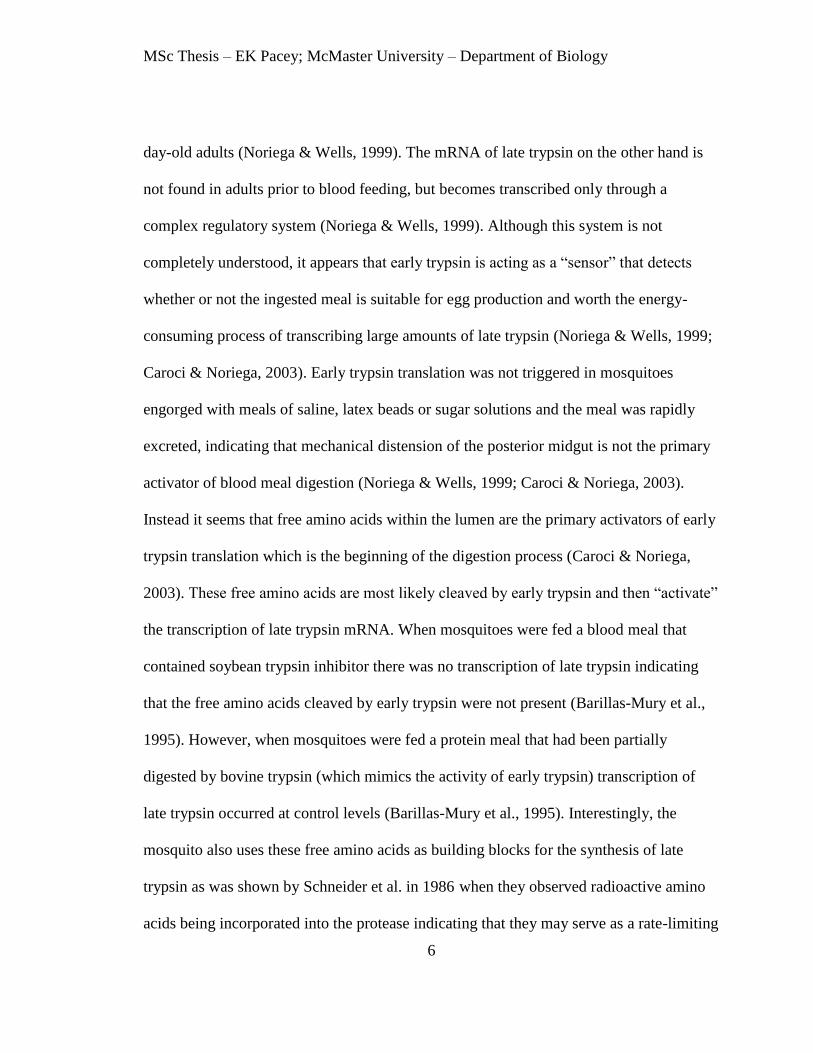
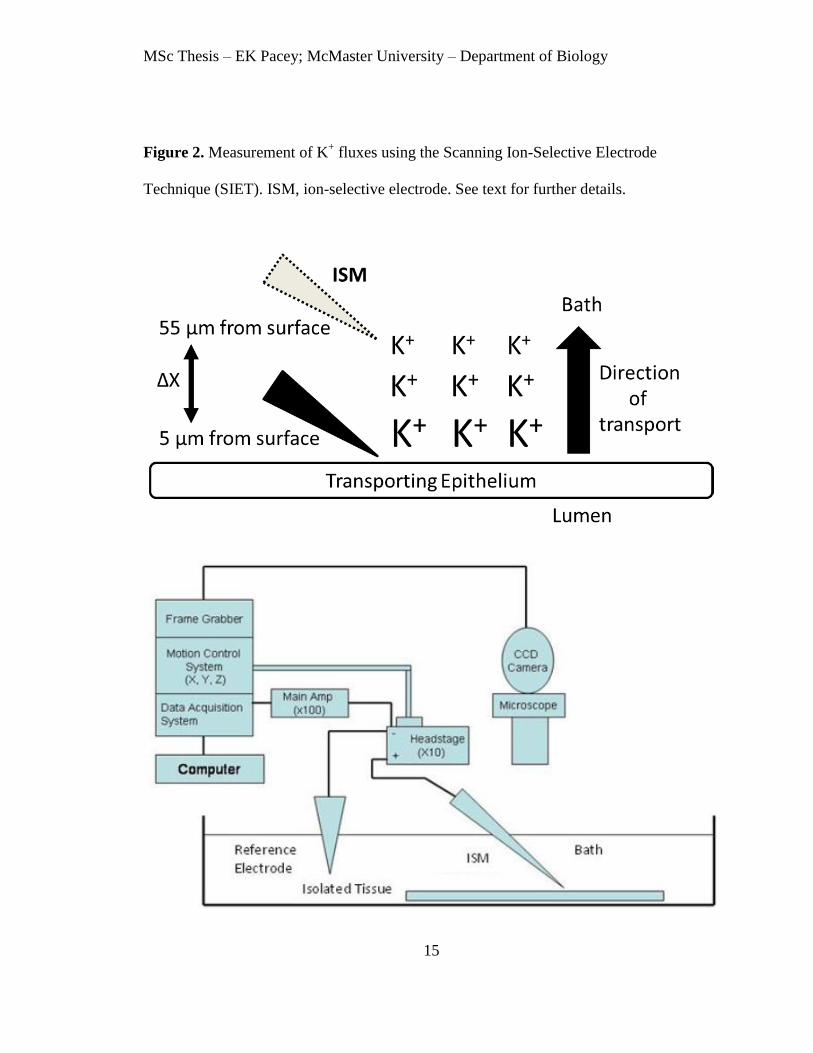
Scanning Ion-Selective Electrode Technique
The Scanning Ion-Selective Electrode Technique (SIET) is described in detail in
the methods of chapter 2.
SIET provides a particularly effective alternative for measuring transepithelial ion
fluxes in ion-transporting epithelia that are too small to be easily studied using Ussing
chambers. SIET measures ion gradients in the unstirred boundary layer that are caused by
ion-transporting epithelia. The ion-selective electrode is placed near the transporting
epithelium (~5 μm) to record a voltage which is then compared to another voltage
measured after the microelectrode is moved 50 μm further away. A concentration gradient
(∆C) of the desired ion can calculated from this voltage gradient using the equation: ∆C =
CB x 10(ΔV /S)
- CB, where CB represents the background ion concentration (the average of

MSc Thesis – EK Pacey; McMaster University – Department of Biology
12
the concentrations at the inner and outer limits of microelectrode excursion) in μmol cm-3
;
ΔV represents the voltage gradient measured at the tissue surface less the voltage gradient
at the reference site in μV; S is the slope of the electrode in μV. The concentration
difference can then be converted to the corresponding flux (mol cm–2
s–1
) using Fick's
Law: J = DΔC/ΔX, where D is the diffusion coefficient of the ion of interest and ΔX is
the excursion distance. Ion fluxes are reported as picomoles per square centimeter per
second (pmol cm-2
s-1
) in this thesis. When an ion flux was positive it indicates that the
epithelium is absorbing the ion from the lumen to the bath whereas a negative flux
indicates that the epithelium is secreting the ion from the bath to the lumen. A schematic
diagram of the SIET process and setup is shown in figure 2.
Objectives
The goals of this study were to elucidate the patterns and mechanisms of ion
transport in the posterior midgut during diuresis and blood meal digestion. The three
questions to be answered were:
1: What are the patterns of Na+, K
+ and H
+ transport across the posterior midgut during
diuresis and the digestion of the blood meal?
2: What are the electrochemical gradients of these three ions across the posterior midgut
during the time course of diuresis and blood meal digestion? Calculation of the
electrochemical gradients is important in determining whether measured fluxes represent
passive or active transport.

MSc Thesis – EK Pacey; McMaster University – Department of Biology
13
3: What are the mechanisms of transport for these three ions across the posterior midgut
during diuresis and blood meal digestion?
Hypotheses
Considering that much of the Na+-rich plasma of the blood meal is excreted
quickly during diuresis it is believed that there will be higher rates of Na+
absorption
during the peak phase of diuresis than during post-peak and late phases of diuresis
(Williams et al., 1983). It is known that there is a Na+/K
+-ATPase on the basolateral side
of the posterior midgut which could play a role in this Na+
transport and could be
sensitive to the pharmacological inhibitor ouabain (Patrick et al., 2006).
Since the lumen of the posterior midgut becomes more basic during the first three
hours after the acquisition of a blood meal it is expected that rates of H+ absorption or
secretion should be low during this time-frame (Billker et al., 2000). Once the lumen
begins to turn more acidic following the first three hours post-feeding H+
secretion should
then increase as H+ is being pumped into the lumen by the V-ATPase located on the
apical membrane (Patrick et al., 2006). Treatment with the V-ATPase inhibitor
bafilomycin could decrease the rate of this H+ secretion. As digestion enters its peak
phase from 8-36 hours post-feeding H+
transport could become absorptive as metabolites
are oxidized to CO2 which could then be converted to free H+ by carbonic anhydrase
(Isoe & Scaraffia, 2013). Absorption of H+
could be mediated by the Na+/H
+ antiporter
NHE3 known to exist on the basolateral membrane which has been shown to be
insensitive to the pharmacological inhibitor amiloride (Pullikuth et al., 2006).

MSc Thesis – EK Pacey; McMaster University – Department of Biology
14
I hypothesize that K+ will be secreted into the lumen during diuresis as the
Na+/K
+-ATPase is transporting Na
+ out into the hemolymph while transporting K
+
inwards (Patrick et al., 2006). Once blood meal digestion begins its peak phase with the
introduction of late trypsin, K+ concentrations within the lumen should increase as
intracellular K+ is being released by lysis of the erythrocytes. The luminal concentration
of K+
should then decrease as K+ transport becomes absorptive into the hemolymph which
would then allow the excess ion to be excreted.
Figure 1. A typical blood-fed A. aegypti posterior midgut. Anterior is to the left and the
Malpighian tubules can be seen joining the gut at the midgut-hindgut junction.
MSc Thesis – EK Pacey; McMaster University – Department of Biology
15
Figure 2. Measurement of K+ fluxes using the Scanning Ion-Selective Electrode
Technique (SIET). ISM, ion-selective electrode. See text for further details.

MSc Thesis – EK Pacey; McMaster University – Department of Biology
16
Chapter 2
Postprandial changes in transport of Na+, K
+ and H
+ across
the posterior midgut of blood-fed mosquitoes (Aedes aegypti)
Evan Kendal Pacey and Michael J. O’Donnell
Abstract
Following ingestion of a blood meal, the adult female mosquito undergoes a
massive diuresis during which Na+, Cl
- and water are secreted at high rates by the
Malpighian tubules. In the hours following completion of diuresis, digestion of the K+-
rich blood cells provides a source of amino acids for proteins in the developing eggs.
Although the transport of inorganic ions by the Malpighian tubules of blood-fed
mosquitoes has been extensively characterized, relatively little is known of the epithelial
transport mechanisms responsible for movement of Na+, H
+, and K
+ across the posterior
midgut. In this paper we have used the Scanning Ion Electrode Technique (SIET) to
measure transport of K+, Na
+ and H
+ across the posterior midgut at intervals during
postprandial diuresis and subsequent digestion of the blood meal. We have also measured
luminal concentrations of Na+ and K
+ and the transepithelial electrical potential at the
same time points and have calculated the electrochemical potentials for Na+, K
+ and H
+
across the midgut. SIET measurements reveal absorption (lumen to bath) of Na+ and H
+
and secretion of K+ for the first two hours after blood-feeding. By 24 hours after the meal,
absorption of Na+
and H+ remains active while there is an electrochemical gradient
favouring absorption of K+.
MSc Thesis – EK Pacey; McMaster University – Department of Biology
17
Introduction
Adult female Aedes aegypti undergo rapid diuresis following ingestion of a blood
meal. Diuresis removes excess Na+ and water, thereby reducing the flying weight of the
mosquito so that it is less susceptible to predation (Williams et al., 1983). Diuresis in A.
aegypti peaks a few minutes after the blood meal and urine flow rates remain elevated for
~30 minutes (Stobbart, 1977; Williams et al., 1983). Following diuresis, erythrocytes
within the posterior midgut are digested by two proteases known as early and late phase
trypsin (Noriega & Wells, 1999). The amino acids in the blood meal proteins are
converted into the amino acids incorporated into the mosquito eggs over the next 36
hours; 80% of protein digestion is completed within 24 h of feeding (Briegel & Lea,
1975). Small amounts of what is termed early trypsin are synthesized 4 – 6 h after the
blood meal, whereas large amounts of late trypsin are synthesized between 8 and 36 h
after the blood meal (Noriega & Wells, 1999). Lysis of the cell membranes during
digestion will also tend to release intracellular K+ into the midgut lumen.
Although the secretion of fluid and ions during diuresis have been studied
extensively (reviewed by Beyenbach, 2003), relatively little is known of the patterns and
mechanisms of inorganic ion transport across the posterior midgut during and after
diuresis. Immunohistochemical studies have revealed the locations of the Na+/K
+-
ATPase, the V-type H+-ATPase in the adult midgut (Patrick et al., 2006), but the roles of
these transporters in movement of ions across the midgut after the blood meal have not
been determined. Measurements with pH microelectrodes have shown that the pH of the
blood in the posterior midgut increases from 7.4 before ingestion to 7.63 by 3 hours after
MSc Thesis – EK Pacey; McMaster University – Department of Biology
18
ingestion, then declines to pH 7.4 by 48 hours after the blood meal (Billker et al., 2000).
It has been suggested that carbonic anhydrase activity contributes to the increase in pH in
the gut during this digestion (del Pilar Corena et al., 2005).
The purpose of this study is to examine transport of H+, Na
+ and K
+ across the
midgut during specific time intervals after blood feeding (6 and 30 minutes, 1, 2, 3, 6, 12,
24, 48 and 72 hours). The intervals were selected to encompass both diuresis and the
periods during and after digestion of the blood meal. Rates of H+, Na
+ and K
+ across the
posterior midgut have been measured using the scanning ion-selective electrode technique
(SIET). We have also measured Na+ and K
+ concentrations in the blood meal and
transepithelial electrical potential at the same intervals, and have used these data to
calculate the net electrochemical potential for Na+, K
+ and H
+ across the posterior midgut.
In conjunction with measurement of the direction and rate of transport for the each of
three ions, these calculations allow us to determine whether the transport of each is
consistent with thermodynamically active or passive mechanisms.
Materials and Methods
Insect rearing
A. aegypti larva were raised in an incubator (28°C; photoperiod 12D:12L) and fed
1 gram of brewer’s yeast and 1 gram of liver extract dissolved in 50 mL of deionized
water every second day. Individual pupae were transferred to mosquito cages (24°C,
photoperiod 12D:12L; relative humidity 70-90%) and allowed to mature into adults that
were fed a solution of 10% sucrose.
MSc Thesis – EK Pacey; McMaster University – Department of Biology
19
Adult female mosquitoes were fed heated (37°C) sheep’s blood in Alsever’s
solution (1:1) at pH 7.4 (Cedarlane Laboratories, Burlington, ON). Alsever’s solution
contains (in mM): 7.2 NaCl, 27.2 trisodium citrate dihydrate, 2.6 citric acid monohydrate
and 11.4 glucose. Blood was placed in a small beaker covered with Parafilm™ through
which the mosquitoes inserted their mouthparts.
Physiological salines and dissection
Mosquitoes were dissected using spring scissors with a 5 mm cutting edge and
Dumont #5 forceps (Fine Science Tools, North Vancouver, BC) under Aedes saline
containing (in mM): 150 NaCl, 3.4 KCl, 1.7 CaCl2-2H20, 1.8 NaHCO3, 1 MgSO4-7H20,
25 HEPES, 5 Glucose. Saline pH was adjusted to 7.1. For measurement of Na+ transport
by SIET, Na+ concentration was reduced to 20 mM by equimolar substitution with N-
methyl-D-glucamine. Posterior midguts were removed from blood-fed adults by removal
of the head and abdominal cuticle and cutting at the junction of the thorax and abdomen.
Posterior midguts were then transferred to a 35 mm Petri dish filled with saline. Petri
dishes were pre-coated with 70 µl droplets of 62.5 µg ml-1
poly-L-lysine then air dried to
promote adhesion of the gut to the bottom of the dish.
Measurement of transepithelial potential and luminal Na+ and K
+ concentrations
Isolated midguts were ruptured using Dumont #5 forceps (Fine Science Tools,
Vancouver, Canada) under paraffin oil and concentrations of Na+ and K
+ were measured
using ion-selective microelectrodes. Micropipettes used for measurements under paraffin
MSc Thesis – EK Pacey; McMaster University – Department of Biology
20
oil were pulled from unfilamented borosilicate glass capillaries (1.5 mm o.d, 0.84 mm i.d;
WPI, Sarasota, Fl) using a vertical puller (Narishige, Tokyo, Japan) and silanized with 0.2
µl dichlorodimethylsilane placed in a 10 cm glass petri dish and inverted over batches of
14 micropipettes on a hot plate at 200 ºC. This low level of silanization rendered the glass
sufficiently hydrophobic to retain the hydrophobic ionophore cocktail and prevent its
displacement by capillary rise of aqueous solutions, but not so hydrophobic as to allow
capillary rise of paraffin oil into the tip when the microelectrode was used under paraffin
oil. Na+-selective microelectrodes were calibrated in solutions of 15 mM NaCl/135
mM KCl and 150 mM NaCl. K+-selective microelectrodes were calibrated in solutions of
3 mM KCl/147 mM NaCl and 30 mM KCl/120 mM NaCl. Slopes (mV) for a 10-fold
change in ion concentration were (mean ± S.E.M.) 57.5±0.2 (N=10) for K+-selective
microelectrodes and 62.8±0.1 (N=10) for Na+-selective microelectrodes.
Transepithelial potential was measured by impaling the lumen of the intact
isolated gut in physiological saline with a microelectrode pulled from filamented 1.5 mm
o.d., 0.84 mm i.d borosilicate capillary glass (WPI, Sarasota, Fl ) mounted on a hydraulic
micromanipulator (Narishige, Tokyo, Japan). Tip resistances of the microelectrodes
backfilled with 3M KCl were > 20 MΩ.
Calculation of Electrochemical Potentials
The electrochemical potential (Δμ/F, in mV) of an ion is calculated using the
equation:
Δμ/F = 59 log([ion]lumen/[ion]bath) + zTEP
MSc Thesis – EK Pacey; McMaster University – Department of Biology
21
Where [ion]lumen is the concentration of the ion in the lumen (mM), [ion]bath is the
concentration of the ion in the bath (mM), z is the valency and TEP is the transepithelial
potential (mV). A positive value indicates a luminal ion concentration in excess of
equilibrium, i.e. net passive movement from gut lumen to bath is favoured. A negative
value indicates a luminal ion concentration below equilibrium, i.e. net passive movement
from bath to gut lumen is favoured.
Scanning Ion Electrode Technique (SIET)
Ion-selective microelectrodes used for SIET were prepared as described
previously (Donini & O’Donnell, 2005). Unfilamented borosilicate glass capillaries (1.5
mm o.d, 0.84 mm i.d; WPI, Sarasota, Fl) were pulled to tip diameters of 3 – 5 μm on a P-
97 Flaming-Brown micropiptette puller (Sutter Instrument, Novato, CA), silanized with
75 µl of N, N-dimethyltrimethylsilylamine placed in a 10 cm glass petri dish and inverted
over batches of 20 micropipettes at 200 °C for 20 min and stored in a desiccator. Na+-
selective microelectrodes were made by first backfilling the micropipettes with 150
mM NaCl and then tip filling them with a column (∼200 μm) of Na+ ionophore cocktail,
which consisted of 10% Na+ ionophore X (Fluka), 89.75% nitrophenyl octyl ether and
0.25% sodium tetraphenylborate (Messerli et al., 2008). The Na+ ionophore cocktail is
more selective for Na+
relative to K+ by a factor of 10
2.6 (Messerli et al., 2008). Na
+-
selective microelectrodes were calibrated in solutions of 15 mM NaCl/135 mM KCl and
150 mM NaCl. K+-selective microelectrodes were made by first backfilling the
micropipettes with 150 mM KCl and then tip filling them with a column (∼200 μm) of
MSc Thesis – EK Pacey; McMaster University – Department of Biology
22
K+ ionophore I, cocktail B (Sigma-Aldrich, St. Louis, MO). The K
+ ionophore cocktail is
more selective for K+ relative to Na
+ by a factor of 10
3.9 (Amman et al., 1987). K
+-
selective microelectrodes were calibrated in solutions of 3 mM KCl/147 mM NaCl and 30
mM KCl/120 mM NaCl. Slopes (mV) for a 10-fold change in ion concentration were
(mean ± S.E.M.) 57.17±0.2 (N=10) for K+-selective microelectrodes and 60.53±0.2
(N=10) for Na+-selective microelectrodes. H
+-selective microelectrodes were backfilled
with a solution of 100 mmol l–1
NaCl and 100 mmol l–1
sodium citrate at pH 6, then tip-
filled with a 300–500 μm column of H+ ionophore I, cocktail B (Fluka). H
+-
selective microelectrodes calibrated in saline buffered with 25 mmol l–1
Hepes gave
slopes of 58±0.3 (N=10) mV per pH unit in the range pH 6.5 – pH 7.5. Reference
electrodes were constructed from 10 cm borosilicate glass capillaries that were bent 1 cm
from the end at a 45 degree angle to facilitate placement in the sample dish. Capillaries
were filled with boiling Aedes saline solution containing 3-5% agar and were stored at
4°C in Aedes saline.
Gradients in ion concentration created in the unstirred layer by ion transport
across the posterior midgut were measured by SIET. Concentration gradients were then
converted into fluxes using the Fick equation. SIET is particularly useful for spatial and
temporal analysis of ion transport across epithelial preparations which show regional
differentiation (Rheault & O’Donnell, 2001) or are too small for the use of Ussing
chambers. The microelectrode was positioned by an orthogonal array (X, Y, Z) of
computer-controlled stepper motors and moved between two points at each measurement
site. The shape of dissected midgut can be approximated as a prolate spheroid and the Z-
MSc Thesis – EK Pacey; McMaster University – Department of Biology
23
position was adjusted during SIET scans so that measurements were taken along the
equator of the major axis. Measurements of voltage gradients were made by moving the
microelectrode tip perpendicularly from the midgut surface between two points separated
by 50 μm. Initially, the microelectrode tip was positioned within 5 μm of the tissue
surface, representing the inner limit of the microelectrode’s 50 μm excursion. Positioning
was followed by a 4.0 second wait period during which no measurements were made to
allow the re-establishment of ion gradients at the tissue surface following the localized
disturbance of the microelectrode movement. A wait time of at least 3 seconds is
sufficient to allow the gradients to fully re-establish (Naikkhwah & O’Donnell, 2012).
The voltage at the microelectrode tip was recorded for 0.5 seconds following the wait
period. The microelectrode was then moved at 200 μm s-1
to a position at the outer limit
of the 50 μm range where another wait and sample period was completed. The move,
wait, and sample cycle at both extremes of the microelectrode excursion was completed
in 9.5 seconds and was repeated three times, requiring a total of 28.5 seconds to measure
the voltage gradient at each tissue site. Depending on the size of the blood-distended
midgut, 14 – 32 sites were scanned at intervals of 60 μm. Preliminary measurements
indicated that there were no significant differences in Na+, K
+ or H
+ in anterior versus
posterior regions of the posterior midgut. The microelectrode tip was moved > 2500 μm
perpendicularly away from the tissue surface to a reference site following completion of
the scans of each midgut. At this site, which is sufficiently distant from the tissue that the
influence of epithelial ion flux is negligible, the voltage gradient was recorded across the
microelectrode’s 50 μm excursion in the same manner as when making measurements at
MSc Thesis – EK Pacey; McMaster University – Department of Biology
24
the tissue surface. Voltages at the reference site were subtracted from the voltage
gradients at the measurement sites to correct for any voltage drift during scanning. The
corrected voltage difference between the two limits of the microelectrode excursion (ΔV)
was then used to calculate a corresponding concentration difference (ΔC) in μmol cm-3
.
Concentration gradients for Na+ and K
+ in the unstirred layer were calculated using the
equation:
∆C = CB x 10(ΔV /S)
- CB
where CB represents the background ion concentration (the average of the concentrations
at the inner and outer limits of microelectrode excursion) in μmol cm-3
; ΔV represents the
voltage gradient measured at the tissue surface less the voltage gradient at the reference
site in μV; S is the slope of the electrode in μV. The concentration difference is then
converted to flux (mol cm–2
s–1
) using Fick's Law: J = DΔC/ΔX, where D is the diffusion
coefficient of the ion of interest (Donini & O’Donnell, 2005) and ΔX is the excursion
distance. In this paper, ion fluxes are reported as picomoles per square centimeter per
second (pmol cm-2
s-1
). For each posterior midgut, a single flux (based on 3 replicate
measurements at each of 14 – 32 sites) was calculated at each interval after feeding. Scans
were completed within ~20 minutes. Preliminary measurements showed that fluxes were
stable for > 45 minutes after dissection for all three of the ions measured (N = 3
preparations each; data not shown).
Proton fluxes were corrected because protons may diffuse either in a free state or
bound to the buffers (HEPES and bicarbonate) present in the saline. The actual H+ flux
from a source is therefore the sum of the measured free H+ flux and the unmeasured H
+
MSc Thesis – EK Pacey; McMaster University – Department of Biology
25
flux moving as H+ bound to buffer. Corrections for the effects of buffers on H
+ flux were
made using the equations provided by Messerli et al., (2006).
Statistical Analyses
Data are expressed as mean ± S.E.M. for the indicated number of preparations.
For SIET measurements, each mean value was based on measurements at 14 – 32 sites at
60 μm along the midgut, and there were three replicate measurements at each site.
Significance of differences between means of fluxes measured at different times after the
blood meal was tested by means of an ANOVA with a Tukey’s multiple comparisons test
using P < 0.05 as the level of significance. Graphing of data and statistical testing was
done using GraphPad Prism 4.0 (GraphPad Software, Inc., La Jolla, CA).
Results
Transepithelial potential (TEP)
The lumen of the posterior midgut was at a negative potential with respect to the
bathing saline at all intervals after the blood meal (Fig. 1). TEP increased from -4.6 mV at
6 minutes after the blood meal to -13.2 mV by 3 h. The TEP then declined from -9.2 mV
at 6 h to -2.4 mV by 72 h after the blood meal. We also measured the TEP in saline in
which the Na+ concentration was reduced to 20 mM by equimolar replacement with N-
methyl D-glucamine. The values of -8.2 mV at 30 min and -6.0 ±1.3 mV (N = 3) at 24 h
fall within the 95% confidence intervals around the corresponding mean values in saline
containing 151.8 mm saline (Student’s t-test, P > 0.05).
MSc Thesis – EK Pacey; McMaster University – Department of Biology
26
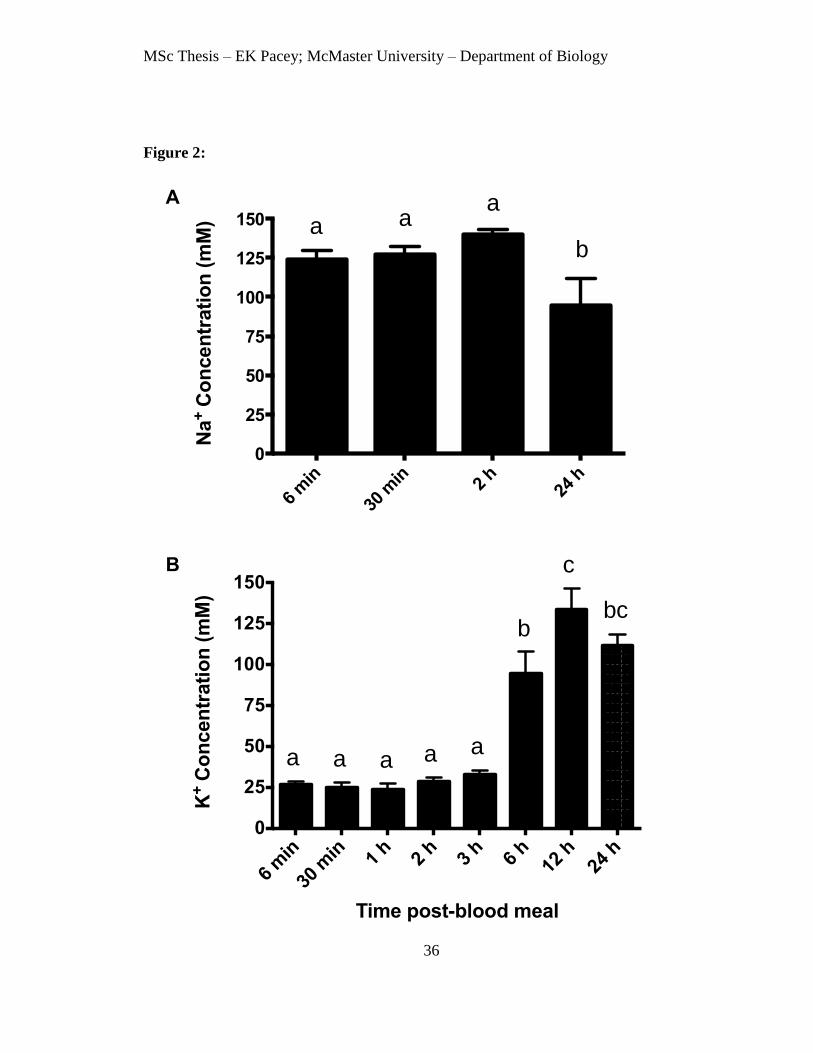
Concentrations of Na+ and K
+ in the contents of the posterior midgut
The concentration of Na+ in the posterior midgut contents was lower than in the
bathing saline (151.8 mM), and typical values for sheep blood on which the mosquitoes
were fed (140 mM; Curran-Everett et al., 1988). Na+ and K
+ concentrations measured by
ion-selective microelectrodes in the 1:1 mixture of sheep blood and Alsever’s solution
were 121.3 ± 4.3 mM and 15.8 ± 1.9 mM, respectively (N = 5 samples). Na+
concentration of the gut contents did not change between 6 min and 2 h after the blood
meal, but dropped from 140 mM at 2 h to 94 mM at 24 h (Fig. 2A). Luminal K+
concentrations (27 – 33 mM) did not change significantly in the first 3 hours following
the blood meal, but then rose to 95 mM at 6 h and 134 mM at 12 h after the blood meal
(Fig. 2B).
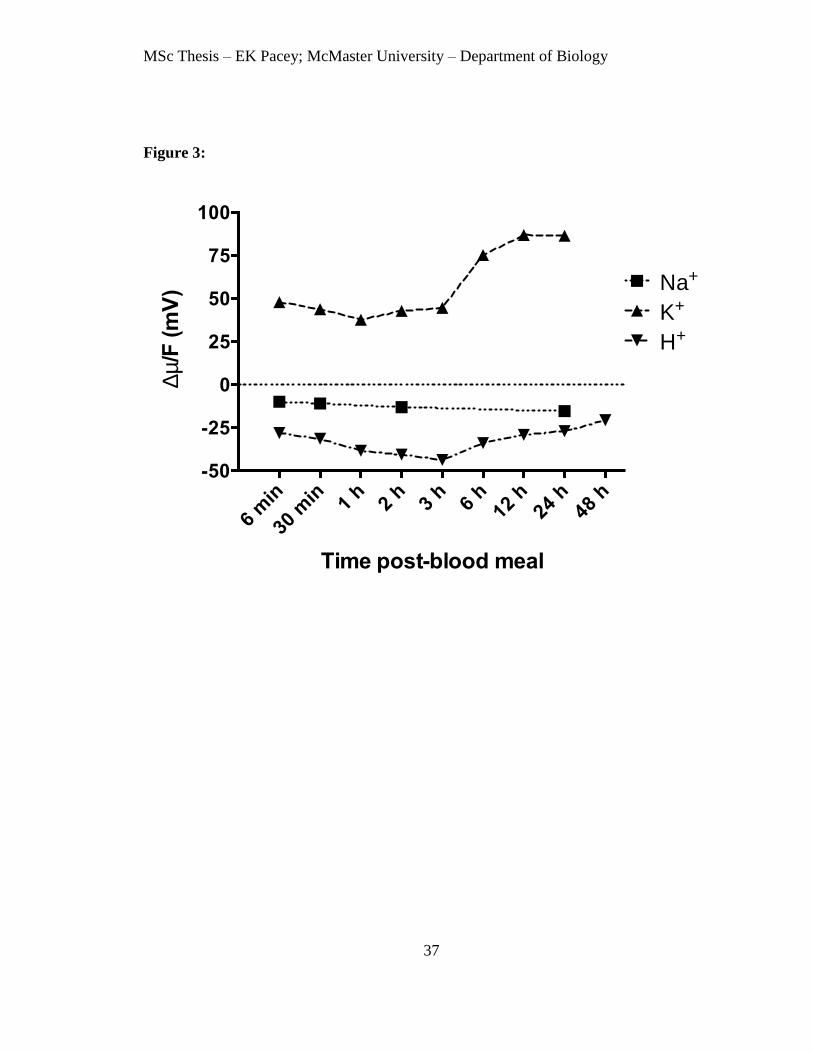
Net electrochemical potentials for Na+, K
+ and H
+
The net electrochemical potentials (Δμ/F, mV) for Na+, K
+ and H
+ were calculated
using measured transepithelial potentials and concentrations of Na+ and K
+ in the midgut
contents and the previously reported values of luminal pH (Billker et al., 2000). A
positive value of Δμ/F for the ion indicates that passive movement from midgut lumen to
bath is favoured. In saline containing 151.8 mM Na+ and 3.4 mM K
+ at pH 7.1, the
electrochemical potential for K+ was positive at all points after the blood meal,
particularly after the increase in midgut content K+ concentration 6 h or more after the
blood meal (Fig. 3). The electrochemical potential for Na+ was -10 to -13 mV for midguts
bathed in saline containing 151.8 mM Na+. However, for saline containing 20 mM Na
+,
MSc Thesis – EK Pacey; McMaster University – Department of Biology
27
as used in SIET measurements described below, the value of Δμ/F shifts to 39 mV at 30
min and 34 mV at 24 h after the blood meal, indicating that passive movement from
midgut lumen to bath is favoured. The electrochemical potential for H+, based on our
measurements of transepithelial potential and the pH of the midgut lumen determined by
Billker et al. (2000), was -25 to -40 mV. The latter values indicate that passive entry of
H+ from bath to lumen is favoured.
Transepithelial fluxes of Na+, K
+ and H
+
Sodium was absorbed from midgut lumen to the bath for preparations bathed in
saline containing 20 mM Na+ (Fig. 4A). Preliminary measurements showed that it was
not feasible to measure Na+ fluxes in saline containing 151.8 mM Na
+; as a consequence
of such a high background concentration of Na+ the change in unstirred layer Na
+
concentration produced by Na+ transport across the posterior midgut epithelium was too
small to be reliably measured by the SIET technique. There was no significant decline in
Na+ transport over the first 2 h after the blood meal (ANOVA, Tukey’s multiple
comparisons test). At 24 h after the blood meal, the value of Na+ transport was 273.3
pmol cm-2
s-1
and was not significantly different from Na+ transport during the first 2
hours after the blood meal (ANOVA, Tukey’s multiple comparisons test). By contrast, K+
was secreted for the first 2 hours after the blood meal, then absorbed into the bathing
saline, and there was a linear trend (P < 0.001) towards increasing rates of absorption,
peaking at 71 pmol cm-2
s-1
by 72 h after the blood meal. A one-way ANOVA followed by
Tukey’s multiple comparison test showed that the K+ flux at 72 h was significantly
MSc Thesis – EK Pacey; McMaster University – Department of Biology
28
different than at earlier times. We also compared the values at 6 min, 30 min, 1, 2 and 3 h
to all fluxes at 6 h or longer after the blood meal. The rationale for these planned
comparisons was two-fold. Firstly, we expected K+ transport to be lower during the
period of diuresis, which is generally complete within 2-3 h after the blood meal
(Williams et al., 1983). Secondly, the K+ concentration in the midgut contents (Fig. 2B)
increased significantly at 6 h, coincident with the rise in late phase trypsin synthesis
(Noriega & Wells, 1999). The results of uncorrected Fisher’s Least Squares Difference
tests indicated significant differences (P < 0.05) between the K+ fluxes at 6 min, 30 min 1
and 2 h after the blood meal from those measured at 6, 12, 24, 48 and 72 h. There was a
trend towards increasing H+ absorption, from ~50 pmol cm
-2 s
-1 for the first 6 h after the
blood meal, to a peak of 193 pmol cm-2
s-1
by 24 h (ANOVA, Tukey’s multiple
comparisons test).
Discussion
The results of this study provide new information on the temporal patterns of Na+,
K+ and H
+ transport across the posterior midgut of blood-fed mosquitoes. We have also
calculated electrochemical potentials from measurements of transepithelial potential and
ion concentrations in the gut contents at the same time intervals. Taken together, the data
permit assessment of the active or passive nature of transepithelial Na+, K
+ and H
+
transport across the midgut during diuresis and subsequent protein digestion. Figure 5
presents a schematic diagram showing the rates of ion transport and the corresponding
electrochemical potentials at 3 times after the blood meal: 6 min, 2 h and 24 h.
MSc Thesis – EK Pacey; McMaster University – Department of Biology
29
H+ absorption occurs against an opposing electrochemical potential throughout the
period of diuresis and blood cell digestion (Figs. 3, 5). It is important to note that our
calculations of the electrochemical potential for H+ are estimates, based on our
measurements of transepithelial potential and the gut lumen pH values reported in Billker
et al., (2000). Although the latter authors used mouse blood (pH 7.4), we used a 1:1
mixture of sheep blood:Alsever’s solution which was also at pH 7.4. H+ absorption across
the midgut is unlikely to be a direct consequence of V-ATPase activity because
immunohistochemical studies have indicated an apical location for the protein, consistent
with transport of H+ into the gut lumen (Patrick et al., 2006). It will be of interest in
subsequent studies to examine the effects of inhibitors of transporters such as the V-
ATPase and sodium proton exchangers (NHEs) on midgut H+ transport. In addition, given
the dependence of midgut alkalization on carbonic anhydrase activity (del Pilar Corena et
al., 2005), measurement of H+ fluxes in the presence of carbonic anhydrase inhibitors
such as acetazolamide will be of use in evaluating the role of carbonic anhydrase in
providing a source of H+ for transport.
There was no significant change in the rate of transport of Na+ or the
concentration of Na+ over the first 24 h after the blood meal. The concentration of Na
+ in
the gut contents at 24 h after the blood meal was 94 mM, below the concentrations of 124
mM – 140 mM measured during diuresis, but still above the level of < 10 mM in many
mammalian cells (Lee, 1981). This suggests that not all of the extracellular fluid in the
blood meal, which contains high levels of Na+, is eliminated during diuresis. In addition,
it is worth noting that sheep erythrocytes contain relatively high concentrations of Na+
MSc Thesis – EK Pacey; McMaster University – Department of Biology
30
(37 – 41 mM; Tosteson and Hoffman, 1960). High rates of Na+ absorption after
completion of diuresis may thus represent Na+ derived both from the extracellular fluid
and from intracellular sources of Na+ as the blood cells are digested.
It is important to point out that for preparations bathed in saline containing 20 mM
Na+ the estimated electrochemical gradient (34 to 39 mV, lumen positive) favours passive
movement of Na+ from posterior midgut lumen to the bath (Figs. 3, 5). The
electrochemical potential for hemolymph containing 96 mM Na+ (Williams et al., 1983)
is estimated to be ~2 mV, inside positive, assuming that the transepithelial potential
remains unchanged from the values we have measured in 20 mM – 151.8 mM Na+. This
estimate suggests that, in vivo, Na+ is close to electrochemical equilibrium and that either
active or passive transport mechanisms, or both, may contribute to net Na+ absorption. In
this context, subsequent studies examining the effects of the inhibitor ouabain on Na+
absorption will be of interest, given that previous immunohistochemical studies have
identified the presence of the Na+/K
+-ATPase in the basolateral membrane of the
posterior midgut (Patrick et al., 2006).
K+ is secreted across the posterior midgut at low rates in the first 2 hours after the
blood meal. Given that the electrochemical potential favours passive absorption of K+,
this finding suggests the operation of some form of active transporter, such as the Na+/K
+-
ATPase (Figs. 3, 5). The concentration of K+ in the gut contents (24 – 33 mM) is above
that in the blood meal (15.8 mM). The difference may reflect a low level of blood cell
lysis in response to early phase trypsin, plus the effects of inward transport of K+. The
shift from K+ secretion to absorption at 3 h after the blood meal coincides with the
MSc Thesis – EK Pacey; McMaster University – Department of Biology
31
introduction into the posterior midgut of late phase trypsin, which is known to digest the
majority of the blood meal, releasing 2/3rds of available amino acids (Noriega & Wells,
1999; del Pilar Corena et al., 2005). Cell lysis during the period of late phase trypsin
secretion will result in release of intracellular K+ from the blood cells. Indeed, K
+
concentrations in the gut contents were at their highest (Fig. 2B) when trypsin levels were
approaching their peak. Rates of K+ absorption from gut lumen to bath were also highest
during this period (> 6 h). The electrochemical potential for K+ favours passive
movement from gut lumen to bath (Figs. 3, 5), raising the possibility that K+ channels
may contribute to the K+ absorption across the midgut epithelium. It is worth noting that
the rate of K+ absorption is ~1/3 the rate of Na
+ absorption at 24 h after the blood meal.
This may reflect the favourable electrochemical potential for Na+ absorption when the
posterior midgut is bathed in saline containing 20 mM Na+. In saline containing Na
+ at
the concentration found in the hemolmyph (96 mM), it seems likely that the rate of Na+
absorption would be several fold lower and less than that of K+, consistent with the gut
concentrations of the two ions at 24 h after the blood meal.
Future electrophysiological studies can provide further insight into the mechanisms of
Na+, H
+ and K
+ transport across the midgut of blood-fed mosquitoes. In addition to
analyses of the effects of putative transport blockers on ion fluxes measured by SIET, it
will be revealing to determine the effects of changes in bathing saline ion concentrations
(Na+, K
+, Cl
-) on transepithelial potential. Such measurements would be of use in
estimating the contribution of conductive pathways (e.g. K+ channels) to transepithelial
transport. In addition, little is known of the effects of diuretic factors on ion transport

MSc Thesis – EK Pacey; McMaster University – Department of Biology
32
across the posterior midgut. Mosquito natriuretic factor and leucokinin both stimulate
fluid secretion by the Malpighian tubules (Beyenbach, 2003), and it would be of interest
to determine the effects of these peptides on Na+ transport across the posterior midgut.
MSc Thesis – EK Pacey; McMaster University – Department of Biology
33
Figure captions
Figure 1. Transepithelial potential of the posterior midgut of A. aegypti at intervals
following a blood meal. Letters denote significant differences between time points
(ANOVA; P<0.05). The height of the bar and the vertical lines indicate the mean +
S.E.M. N = 5-7 blood fed adult females for each time interval.
Figure 2. Concentrations of Na+ and K
+ in the contents of the posterior midgut of A.
aegypti at intervals following a blood meal. The height of the bar and the vertical lines
indicate the mean + S.E.M. (N = 3-7 blood fed adult females for each time interval).
Letters denote significant differences between time points (ANOVA; P<0.05).
Figure 3. Electrochemical potential (Δμ/F, mV) for Na+, K
+ and H
+ at intervals after the
blood meal. Values were calculated using the transepithelial potential measurements in
Fig. 1, gut content Na+ and K
+ concentrations (Fig. 2) and published values of luminal pH
(Billker et al., 2000). A positive value indicates that passive transport from gut lumen to
bath is favoured. A negative value indicates that passive transport from the bath to gut
lumen is favoured.
MSc Thesis – EK Pacey; McMaster University – Department of Biology
34
Figure 4. Fluxes of Na+, H
+ and K
+ across the posterior midgut of A. aegypti at intervals
after the blood meal. Positive fluxes indicate ion absorption from the lumen to the
hemolymph while negative fluxes indicate ion secretion from the hemolymph to the
lumen. The height of the bars and the vertical lines indicate the mean + S.E.M. (N = 3-7
blood fed adult females for each time interval). Letters denote significant differences
between time points (ANOVA; P<0.05). Additional statistical tests for K+ fluxes at
different times points are described in the text.
Figure 5. Schematic diagram summarizing electrochemical potentials and measured
fluxes for Na+, H
+ and K
+ across the posterior midgut at A) 6 minutes, B) 2 hours and C)
24 hours after the blood meal. The width of the open arrows is proportional to the
magnitude of the electrochemical potential.

MSc Thesis – EK Pacey; McMaster University – Department of Biology
35
Figure 1:
MSc Thesis – EK Pacey; McMaster University – Department of Biology
36
Figure 2:
6 m
in
30 m
in 2 h
24 h
0
25
50
75
100
125
150N
a+ C
on
cen
trati
on
(m
M) a a
a
b
6 m
in
30 m
in 1 h
2 h
3 h
6 h
12 h
24 h
0
25
50
75
100
125
150
Time post-blood meal
K+ C
on
cen
trati
on
(m
M)
a a a a a
b
c
bc
A
B
MSc Thesis – EK Pacey; McMaster University – Department of Biology
37
Figure 3:
6 m
in
30 m
in 1 h
2 h
3 h
6 h
12 h
24 h
48 h
-50
-25
0
25
50
75
100
Time post-blood meal
Dm/F
(m
V) Na+
K+
H+

MSc Thesis – EK Pacey; McMaster University – Department of Biology
38
Figure 4:
6 m
in
30 m
in 2 h
24 h
0
50
100
150
200
250
300
350
Na
+ F
lux
(p
mo
l c
m-2
s-1
) a
a a
a
6 m
in
30 m
in 1 h
2 h
3 h
6 h
12 h
24 h
48 h
72 h
0
50
100
150
200
250
H+ F
lux
(p
mo
l cm
-2 s
-1) a
cd cdd cd d cd
bcd
ab
abc
6 m
in
30 m
in 1 h
2 h
3 h
6 h
12 h
24 h
48 h
72 h
-20
0
20
40
60
80
100
Time post-blood meal
K+ F
lux
(p
mo
l cm
-2 s
-1)
a
b b b b
ab
ab ab abab
A
B
C

MSc Thesis – EK Pacey; McMaster University – Department of Biology
39
Figure 5:
A)
B)
Midgut Lumen
2 hours after blood meal
TEP=-11.2mV
∆µNa/F=-13.3mV
H+
Na+
K+
pH=7.6pH=7.1
140.1mM151.8mM
3.4mM28.5mMFlux
FluxFlux
Bath
∆µH/F=-40.7mV
∆µK/F=42.8mV
-2.2 pmol cm-2 s-1
115.4 pmol cm-2 s-1
∆µ/F = 59log([Ion]lumen/[Ion]bath) + zTEP
43 pmol cm-2 s-1
Midgut LumenBath
6 min after blood meal
TEP=-4.6mV
∆µH/F=-28.2mV
∆µNa/F=-9.9mV
∆µK/F=47.7mV
H+
Na+
K+
pH=7.5pH=7.1
124.3mM151.8mM
3.4mM26.6mM
∆µ/F = 59log([Ion]lumen/[Ion]bath) + zTEP
Flux
Flux
Flux
66 pmol cm-2 s-1
235 pmol cm-2 s-1
-8.5 pmol cm-2 s-1

MSc Thesis – EK Pacey; McMaster University – Department of Biology
40
C)
Midgut Lumen
24 hours after blood meal
TEP=-5.9mV
∆µH/F=-27.2mV
H+
K+
pH=7.5pH=7.1
3.4mM111.8mMFlux
Bath
∆µK/F=86.2mV
50.3 pmol cm-2 s-1
∆µ/F = 59log([Ion]lumen/[Ion]bath) + zTEP
Flux
Flux
∆µNa/F=-15.5mV
Na+
192.6 pmol cm-2 s-1
273.3 pmol cm-2 s-1
151.8mM 94.4mM

MSc Thesis – EK Pacey; McMaster University – Department of Biology
41
Chapter 3
Effects of ion transport inhibitors on transport of Na+, H
+ and K
+ across the
posterior midgut of blood-fed mosquitoes (Aedes aegypti).
Evan Kendal Pacey and M. J. O’Donnell
Abstract
The effects of epithelial ion transport inhibitors on transport of Na+, H
+ and K
+
across the posterior midgut of blood-fed mosquitoes were examined. Fluxes of Na+, H
+
and K+ were measured at 6 min, 24 h and 72 h after the blood meal, respectively,
corresponding to the times at which absorption of each ion (midgut lumen to bath) are
maximal. Fluxes of each ion were measured before and after application of each drug to
the bathing saline. Na+ absorption was reduced 51% by the Na
+/K
+-ATPase inhibitor
ouabain (1 mM) and K+ transport was reversed from absorption to secretion in the
presence of the K+ channel blocker Ba
2+ (5 mM). H
+ transport was reduced 80% by the
carbonic anhydrase inhibitor acetazolamide (1 mM). There was no effect of the
Na+:K
+:2Cl
- cotransport inhibitor bumetanide (100 μM) on transport of Na
+, K
+ or H
+ or
of the V-type H+-ATPase inhibitor bafilomycin (5 μM) on H
+ transport. Amiloride (1
mM) also had no significant effects on either H+ or Na
+ absorption. A working model of
transepithelial ion transport across the posterior midgut proposes that net transport of Na+
and K+ from cell to hemolymph is mediated by basolateral Na
+/K
+-ATPase and K
+
MSc Thesis – EK Pacey; McMaster University – Department of Biology
42
channels. H+ and HCO3
- produced from the actions of carbonic anhydrase on cellular CO2
are transferred into the hemolymph and midgut lumen, respectively.

MSc Thesis – EK Pacey; McMaster University – Department of Biology
43
Introduction
Ingestion of a blood meal is required for egg production by the mosquito Aedes
aegypti. During a post prandial diuresis, much of the Na+, Cl
- and water in the blood
plasma is absorbed across the posterior midgut into the hemolymph, then eliminated
through secretion of Na+-rich urine by the Malpighian tubules. Following diuresis, K
+
released from digestion of the blood cells is transported across the posterior midgut and
secreted at low rates by the tubules. Although the mechanisms and control of ion
transport by the Malpighian tubules have been the subject of intense study (reviewed by
Beyenbach & Piermarini, 2011), much less is known of the mechanisms of ion transport
across the posterior midgut. Immunohistochemical studies have revealed expression of
basolateral P-type Na+/K
+-A TPase and apical V-type H
+-ATPase in each cell of the adult
posterior midgut (Patrick et al., 2006). Carbonic anhydrase is associated with the
posterior midgut and carbonic anhydrase inhibitors reduce midgut pH in blood-fed
mosquitoes, suggesting that the enzyme is implicated in maintenance of the lumen pH
(del Pilar Corena et al., 2005). In addition, an isoform of sodium/proton exchanger 3
(NHE3) is found on the basolateral membrane of the anterior and posterior midgut of
adult female A. aegypti (Pullikuth et al., 2006).
Our previous study analysed transport of Na+, K
+ and H
+ across the posterior
midgut using the scanning ion-selective electrode technique (SIET). Electrochemical
gradients for each ion calculated from measurements of transepithelial electrical potential
and luminal ion concentrations indicate that Na+, H
+, and K
+ absorption are
thermodynamically uphill at specific times after the blood meal, consistent with active ion
MSc Thesis – EK Pacey; McMaster University – Department of Biology
44
transport, whereas Na+ and K
+ may move passively in response to favourable
electrochemical gradients at other times (Chapter 2). In this study, therefore, we have
examined the effects of drugs known to block specific ion transporting ATPases or
channels which may mediate transport of Na+, K
+ and H
+. Absorption of Na
+ across the
midgut of blood-fed Rhodnius prolixus, for example, is reduced 81% by the Na+/K
+-
ATPase inhibitor ouabain (Farmer et al., 1981). In many insect epithelia, however, fluxes
of Na+ and K
+ are energized by H
+ gradients created by a V-type H
+-ATPase (reviewed
by Harvey, 2009). Secretion of Na+ and K
+ driven by the resulting H
+ gradients across the
apical membrane of Malpighian tubules can be inhibited by application of the
sodium:proton exchanger (NHE) inhibitor amiloride applied to the bathing saline
(Maddrell & O’Donnell, 1992). Given the involvement of carbonic anhydrase in
maintenance of midgut pH, we have also measured the effects of the carbonic anhydrase
inhibitor acetazolamide on H+ fluxes. Lastly, because epithelial K
+ channels implicated in
secretion or absorption of K+ by insect Malpighain tubules and the midgut are known to
be blocked by barium ions (Leyssens et al., 1994; Schirmanns & Zeiske, 1994; Haley &
O’Donnell, 1997), we have examined the effects of Ba2+
on absorption of K+ across the
posterior midgut. In each experiment, ion fluxes across the isolated posterior midgut have
been measured by SIET before and after application of each drug.

MSc Thesis – EK Pacey; McMaster University – Department of Biology
45
Materials and Methods
Insect rearing
Insects were reared as previously described in chapter 2.
Physiological salines and dissection
Physiological salines were prepared and dissections were performed as described
previously in chapter 2.
Pharmacological reagents
Stock solutions of the ion transport inhibitors were prepared at 10 times the
desired final concentration. Solutions of acetazolamide and ouabain were prepared in
saline. Amiloride stock solution was prepared in warmed saline (~60° C) to facilitate
dissolution. Salines containing Ba2+
were prepared by addition of BaCl2 to sulphate-free
saline prepared by substitution of MgCl2 for MgSO4. Bumetanide and bafilomycin were
prepared in ethanol; the final concentration of ethanol was < 1%. Control experiments
indicated no significant effects of 1% ethanol on ion transport across the posterior midgut.
Scanning Ion Electrode Technique (SIET)
The methods for preparation of SIET were as described in chapter 2.
Statistical Analyses
Statistical analyses were done as described in chapter 2.

MSc Thesis – EK Pacey; McMaster University – Department of Biology
46
Results
The effects of each of the drugs used in this study were analysed at specific time
intervals after the blood meal. In order to increase the scope for detection of drug effects,
we selected the times at which the flux of each ion maximal. For Na+, H
+ and K
+, the
times selected were 6 min, 24 h and 72 h, respectively, based on previous SIET
measurements of postprandial ion flux (Chap. 2). Fluxes were measured 10 – 15 minutes
after addition of each drug to the bathing saline. Previous studies have shown that Na+, K
+
and H+ fluxes are stable for > 45 minutes after dissection (Chap. 2). Control experiments
showed no effect of the addition of the vehicle for bumetanide and bafilomycin (1%
ethanol in saline) on H+, Na
+ or K
+ absorption (N = 3 preparations each; data not shown).
H+ fluxes
Absorption of H+ across the posterior midgut was reduced 80% by the carbonic
anhydrase inhibitor acetazolamide (Fig. 1). There was no effect of either the NHE
inhibitor amiloride or the V-ATPase inhibitor bafilomycin (Fig. 1).
Na+ fluxes
Absorption of Na+ across the posterior midgut was unaffected by amiloride,
bafilomycin or the Na+:K
+:2Cl
- cotransporter inhibitor bumetanide (Fig. 2). However,
addition of ouabain (1 mM) to the bathing saline resulted in a 51% decrease in the rate of
Na+ absorption.

MSc Thesis – EK Pacey; McMaster University – Department of Biology
47
K+ fluxes
Absorption of K+ across the posterior midgut was reversed by application of Ba
2+
to sulphate-free saline (Fig. 3). In control saline, there was no effect of either bafilomycin
or bumetanide on K+ absorption.
Discussion
The results of this study provide new insight into the mechanisms of ion transport
across the posterior midgut of blood-fed mosquitoes. A role for the Na+/K
+-ATPase in
Na+ absorption during diuresis is suggested by the inhibition of Na
+ transport by ouabain.
Although we have not measured the effects of ouabain on K+ transport, it is worth noting
that K+ is secreted from bath to midgut lumen during diuresis (Chap. 2). Thus, the
Na+/K
+-ATPase may energize both K
+ secretion and Na
+ absorption during the
postprandial diuresis in blood-fed mosquitoes.
K+ is absorbed from the midgut at 6 h or longer after the blood meal, coincident
with an increase in late trypsin activity (Noriega & Wells, 1999) and a consequent
increase in K+ concentration in the midgut contents from ~25 mM to 95 mM at 6 h and
134 mM at 12 h after the blood meal (Chap. 2). The reversal of K+ absorption by Ba
2+
suggests the involvement of Ba2+
-sensitive K+
channels in K+ absorption, in response to
an electrochemical potential favouring passive movement of K+ from gut lumen to the
bathing saline. Ba2+
blocks K+ channels in the midgut epithelium of Manduca sexta
(Schirmanns & Zeiske, 1994) and also blocks K+ transport in both the secretory (Leyssens

MSc Thesis – EK Pacey; McMaster University – Department of Biology
48
et al., 1994) and reabsorptive (Haley & O’Donnell, 1997) segments of insect Malpighian
tubules.
Although the V-type H+-ATPase is present in the apical membrane of the
posterior midgut (Patrick et al., 2006), there was no effect of the V-ATPase inhibitor
bafilomycin on fluxes of Na+, H
+ or K
+ at selected intervals after the blood meal. These
findings suggest that, in contrast to the Malpighian tubules, the V-type H+-ATPase is not
the primary means by which ion transport across the apical membrane is energized. In the
related species A. stephensi, more than 80% of midgut ATPase activity is inhibited by
ouabain (MacVicker et al., 1993), suggesting that the Na+/K
+-ATPase may be the primary
energizer of transepithelial ion transport across the posterior midgut of Aedes. One caveat
is that bafilomycin was applied to the bathing saline rather than the gut lumen in our
experiments. However, bath application of bafilomycin effectively inhibits the V-ATPase
on the apical membrane of Malpighian tubules of multiple species (Beyenbach et al.,
2000). Bafilomycin is also known to inhibit transport dependent upon an apical H+-
ATPase in the tardigrade midgut when applied from the basolateral side (Halberg &
Møbjerg, 2012). This suggests that sufficient quantities of the drug are able to diffuse
through epithelial tissues to reach sites on the apical membrane, but further studies using
perfused gut preparations and luminal application of bafilomycin are required to define
the functional roles of the apical V-ATPase in transport across the posterior midgut.
The Na+:K
+:2Cl
- cotransporter on either the basolateral or apical membrane
contributes to secretion or absorption, respectively, of the three ions in different types of
epithelia (Epstein et al., 1983). Bumetanide is well-known as an inhibitor of basolateral

MSc Thesis – EK Pacey; McMaster University – Department of Biology
49
Na+:K
+:2Cl
- cotransport in the Malpighian tubules of dipterans (Scott et al., 2004;
Ianowski & O’Donnell, 2004) and other species (e.g. crickets; Coast, 2012). In humans, it
is used as a “loop diuretic”, and is effective at blocking salt reabsorption in the thick
ascending loop of Henle. Since both K+ and Na
+ are transported in the same direction
across the posterior midgut of blood-fed mosquitoes following completion of diuresis, we
examined the effects of bumetanide. Addition of bumetanide to the bathing saline had no
effect on Na+ absorption at 6 min post-blood meal, or on K
+ absorption at 72 h. For
bumetanide, as for bafilomycin described above, further experiments are required to
determine the effectiveness of the drug if applied from the luminal side.
A working model of ion transport across the posterior midgut is present in Figure
4. The model incorporates the results of the present study, as well as those of a previous
publication (Chap. 2). We propose that a basolateral Na+/K
+-ATPase is responsible for
Na+ absorption and K
+ secretion during diuresis, and that Ba
2+-sensitive basolateral K
+
channels mediate transport from cell to hemolymph across the basolateral membrane. The
ion transporters mediating transport of Na+ and K
+ across the apical membrane are
unknown. Proton gradients established by the apical H+-ATPase may be used to drive
amino acid uptake into the cells through an apical proton amino acid transporter (PAT)
that is present in the midgut epithelial cells of A. aegypti (AaePAT1; Evans et al., 2009).
We suggest that HCO3- and H
+ resulting from acetazolamide-sensitive carbonic anhydrase
activity exit the cell across the apical and basolateral membrane, respectively. An apical
Cl-/HCO3
- exchanger is a candidate transporter mediating HCO3
- movement into the
lumen in exchange for luminal Cl-. Transfer of HCO3
- into the gut lumen may contribute
MSc Thesis – EK Pacey; McMaster University – Department of Biology
50
to maintenance of an alkaline pH, as proposed by del Pilar Corena et al., (2005). Cl- may
then exit into the hemolymph via basolateral Cl- channels (Fig. 4). Both K
+ and Cl
-
conductances have been identified in the basolateral membrane of the Drosophila
Malpighian tubule (Ianowski & O’Donnell, 2004). The H+ resulting from carbonic
anhydrase may exit basolaterally, perhaps through the NHE3 exchanger which is present
on the basolateral surface of the midgut and is insensitive to amiloride (Pullikuth et al.,
2006).
It is worth noting that Na+ absorption across the midgut of the blood-feeding
hemipteran insect Rhodnius prolixus is inhibited 81% by 1 mM ouabain (Farmer et al.,
1981). The latter authors also propose that K+ moves passively from cell to hemolymph.
There are thus similarities in the transport models for midgut ion transport in blood-
feeders in two different insect orders (Diptera and Hemiptera). It is also worth noting that
Na+ transport by the Malpighian tubules of both Rhodnius and Aedes during diuresis is
energized by a bafilomycin-sensitive apical V-type H+-ATPase. There are thus striking
differences in the means by which primary active transport is energized in epithelia of the
midgut versus the Malpighian tubule.

MSc Thesis – EK Pacey; McMaster University – Department of Biology
51
Figure captions
Figure 1. Fluxes of H+ across the posterior midgut of A. aegypti before and after drug
treatment. Open bars indicate fluxes before drug treatment while closed bars indicate
fluxes 10 – 15 minutes after the addition of drug to the bath. Positive fluxes indicate ion
absorption from the lumen to the hemolymph. The asterisks denote significant differences
(P < 0.05) relative to non-treated posterior midguts. N = 3-7 blood fed adult females for
each drug.
Figure 2. Fluxes of Na+ across the posterior midgut of A. aegypti before and after drug
treatment. Open bars indicate fluxes before drug treatment while closed bars indicate
fluxes 10 – 15 minutes after the addition of drug to the bath. Positive fluxes indicate ion
absorption from the lumen to the hemolymph. The asterisks denote significant differences
(P < 0.05) relative to non-treated posterior midguts. N = 3-7 blood fed adult females for
each drug.
Figure 3. Fluxes of K+ across the posterior midgut of A. aegypti before and after drug
treatment. Open bars indicate fluxes before drug treatment while closed bars indicate
fluxes 10 – 15 minutes after the addition of drug to the bath. Positive fluxes indicate ion
absorption from the lumen to the hemolymph while negative fluxes indicate ion secretion
from the hemolymph to the lumen. The asterisks denote significant differences (P < 0.05)
relative to non-treated posterior midguts. N = 5-7 blood fed adult females for each drug.
MSc Thesis – EK Pacey; McMaster University – Department of Biology
52
Figure 4. Possible mechanisms of ion transport in the posterior midgut of A. aegypti
during diuresis and digestion of the blood meal. Ion and water channels are indicated by
cylinders, exchangers by ovals, cotransporters by rectangles and ATPases by circles.
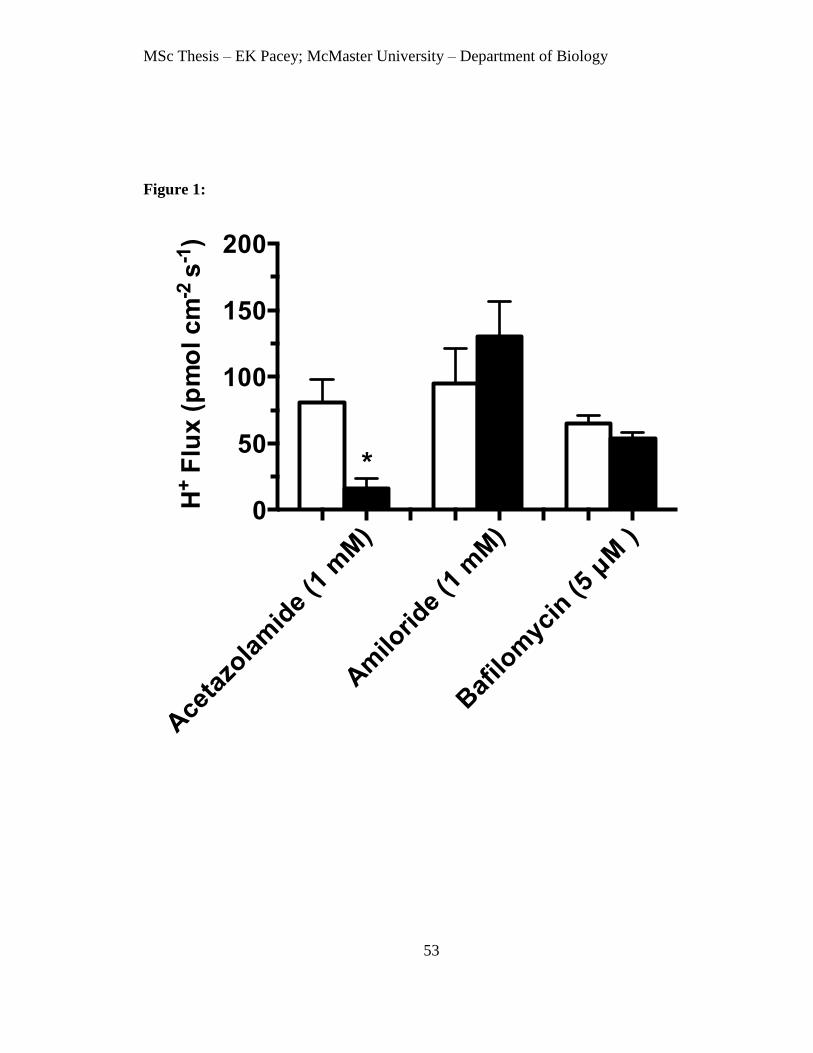
MSc Thesis – EK Pacey; McMaster University – Department of Biology
53
Figure 1:
Ace
tazo
lam
ide
(1 m
M)
Am
iloride
(1 m
M)
Baf
ilom
ycin
(5 µ
M )
0
50
100
150
200
H+ F
lux
(p
mo
l cm
-2 s
-1)
*

MSc Thesis – EK Pacey; McMaster University – Department of Biology
54
Figure 2:
Am
iloride
(1 m
M)
Baf
ilom
ycin
(5 µ
M)
Bum
etan
ide
(100
µM
)
Ouab
ain (1
mM
)0
100
200
300
400
Na
+ F
lux
(p
mo
l c
m-2
s-1
)
*

MSc Thesis – EK Pacey; McMaster University – Department of Biology
55
Figure 3:
Ba2+
(5 m
M)
Baf
ilom
ycin
(5µM
)
Bum
etan
ide
(100
µM
)-50
-25
0
25
50
75
100
125
K+ F
lux
(p
mo
l cm
-2 s
-1)
*

MSc Thesis – EK Pacey; McMaster University – Department of Biology
56
Figure 4:

MSc Thesis – EK Pacey; McMaster University – Department of Biology
57
Chapter 4
General Discussion
This thesis has examined the patterns and mechanisms of Na+, H
+ and K
+
transport across the posterior midgut of A. aegypti during postprandial diuresis and blood
meal digestion. This general discussion integrates the results from chapters 2 and 3 and
extends the discussion of the working model that has been presented in Chapter 3 (Fig. 4).
In addition, suggestions for subsequent research that could test specific proposals in the
model are presented.
A working model of ion transport across the posterior midgut of blood-fed mosquitoes:
transport across the basolateral membrane.
The ouabain-sensitive Na+/K
+-ATPase plays a significant role in the transport of
Na+ and appears to be the primary energizer of secondary active transport systems in the
apical or basolateral membranes. As noted in chapter 3, transport of Na+ and water across
the midgut of blood-fed Rhodnius prolixus is also ouabain-sensitive (Farmer et al., 1981).
Thus, it appears that although the bafilomycin-sensitive V-type ATPase plays a cardinal
role in transport of energizing secretion of water and ions by the Malpighian tubules in
both mosquitoes and R. prolixus (reviewed in O’Donnell, 2008; Beyenbach et al., 2010),
the ouabain-sensitive Na+/K
+-ATPase is the primary driver of water and ion transport
across the midgut, particularly during the period of diuresis. It would be of interest in
future studies to examine the effects of ouabain on Na+ absorption at later time intervals,
after the completion of diuresis.
MSc Thesis – EK Pacey; McMaster University – Department of Biology
58
Since the electrochemical potential for K+ favours absorption of K
+ from lumen to
bath at all times after the blood meal, some form of ATP-dependent pump is required for
secretion of K+ during the first 2 hours after the blood meal. The stoichiometry of the
basolateral Na+/K
+-ATPase is appropriate for secretion of K
+. Although the Na
+/K
+-
ATPase may continue to energize Na+ absorption at later intervals, the dramatic increase
in luminal K+ concentration by 6 hours after the blood meal and the corresponding
increase in the electrochemical potential favouring K+ absorption may mask the K
+
transport by the Na+/K
+-ATPase. At these times, K
+ is absorbed through a Ba
2+-sensitive
pathway (i.e. K+ channels). It is worth noting that secretion of K
+ was restored in the
presence of Ba2+
, consistent with continued operation of the Na+/K
+-ATPase after
inhibition of Ba2+
-sensitive K+ channels. In future work, the effects of changes in bathing
saline K+ concentration on transepithelial potential could be used to determine if K
+
channels are present in the basolateral membrane. Similarly, the effects of changes in
bathing saline Cl- concentration could be used to assess whether a conductive paracellular
or transcellular pathway for Cl- is present. Paracellular Cl
- absorption could be driven by
the lumen-negative transepithelial potential. Alternatively, the effects of Cl- channel
blockers such as diphenylamine-2-carboxylate and 5-nitro-2-(3-phenylpropylamino)
benzoic acid (NPPB) on changes in transepithelial potential produced by varying bathing
saline Cl- concentration could be used to assess transcellular Cl
- transport through
basolateral Cl- channels (Haley et al., 1998).
For H+, the drop in absorption that occurs when carbonic anhydrase is inhibited by
acetazolamide indicates that the bulk of H+ in epithelial cells comes from the conversion
MSc Thesis – EK Pacey; McMaster University – Department of Biology
59
of CO2 and H2O into free H+ by the enzyme. This CO2 is most likely a waste product
from the oxidative metabolism that provides energy (ATP) to drive transport of ions and
amino acids across the posterior midgut (Briegel, 1985; Zhoe et al., 2004). How H+ is
transported across the basolateral membrane of the posterior midgut is unknown, but
some form of energy-dependent transport is required because the electrochemical
potential for H+ was negative at all time points studied up to 48 hours after the blood
meal. As noted in chapter 3, an amiloride-insensitive sodium:proton exchanger remains a
possibility (Pullikuth et al., 2006).
Transport across the apical membrane.
Although the V-type H+-ATPase has been clearly identified in the apical
membrane of the midgut of adult A. aegypti (Patrick et al., 2006) there was no effect of
the V-ATPase inhibitor bafilomycin on fluxes of H+, Na
+ or K
+. Protons may be cycled
across the apical membrane through the coordinated actions of the apical V-ATPase and
the proton:amino acid transporter (Evans et al., 2009). In subsequent studies, perfusion of
the midgut lumen could be used in conjunction with transepithelial potential
measurements to determine if there are conductive pathways for Na+ or K
+. SIET could
be used to measure ion transport in midguts dissected so as to expose the luminal surface.
The latter approach has been used to measure Cd2+
uptake, for example, from the lumen
side of the dissected midgut of the midge larva Chironomus riparius (Leonard et al.,
2009). Such an approach could be used to determine if H+ transport across the apical

MSc Thesis – EK Pacey; McMaster University – Department of Biology
60
membrane is sensitive to the V-ATPase inhibitor bafilomycin applied from the luminal
side.

MSc Thesis – EK Pacey; McMaster University – Department of Biology
61
References
Ammann, D., Chao, P. and Simon, W. (1987) Valinomycin-based K+-selective
microelectrodes with low electrical membrane resistance. Neurosci. lett. 74: 221-226.
Barillas-Mury, C. V., Noriega, F. G. and Wells, M. A. (1995) Early trypsin activity is part
of the signal transduction system that activates transcription of the late trypsin gene in
the midgut of the mosquito, Aedes aegypti. Insect Biochem. Mol. Biol. 25: 241-246.
Benoit, J. B., Lopez-Martineza, G., Patrick, K. R., Phillips, Z. P., Krause, T. B.
and Denlinger, D. L. (2011) Drinking a hot blood meal elicits a protective
heat shock response in mosquitoes. Proc. Natl. Acad. Sci. U. S. A. 108: 8026-8029.
Beyenbach, K. W., Pannabecker, T. L. and Nagel, W. (2000) Central role of the apical
membrane H+-ATPase in electrogenesis and epithelial transport in Malpighian
tubules. J. Exp. Biol. 203: 1459-1468.
Beyenbach, K. W. (2003) Transport mechanisms of diuresis in Malpighian tubules of
insects. J. Exp. Biol. 206: 3845-3856.
Beyenbach, K. W., Skaer, H. and Dow, J. A. T. (2010) The developmental, molecular,
and transport biology of Malpighian tubules. Annu. Rev. Entomol. 55: 3351-3374.
Beyenbach, K. W. and Piermarini, P. M. (2011) Transcellular and paracellular pathways
of transepithelial fluid secretion in Malpighian (renal) tubules of the yellow fever
mosquito Aedes aegypti. Acta Physiologica. 202: 387-407.
Beyenbach, K. W. (2012) A dynamic paracellular pathway serves diuresis in mosquito
Malpighian (renal) tubules. Ann. N. Y. Acad. Sci. 1258: 166–176.
MSc Thesis – EK Pacey; McMaster University – Department of Biology
62
Billker, O., Miller, A. J. and Sinden, R. E. (2000) Determination of mosquito bloodmeal
pH in situ by ion-selective microelectrode measurement: implications for the
regulation of malarial gametogenesis. Parasitology. 120: 547-551.
Boudko, D. Y., Moroz, L. L., Linser, P. J., Trimarchi, J. R., Smith, P. J. and Harvey, W.
R. (2001a) In situ analysis of pH gradients in mosquito larvae using non-invasive,
self-referencing, pH-sensitive microelectrodes. J. Exp. Biol. 204: 691-699.
Boudko, D. Y., Moroz, L. L., Harvey, W. R. and Linser, P. J. (2001b) Alkalinization by
chloride/bicarbonate pathway in larval mosquito midgut. Proc. Natl. Acad. Sci. U. S.
A. 98: 15354-15359.
Briegel, H. and Lea, A. O. (1975) Relationship between protein and proteolytic
activity in the midgut of mosquitoes. J. Insect Physiol. 21: 1597–1604.
Briegel, H. (1985) Mosquito reproduction: incomplete utilization of the blood meal
protein for oogenesis. J. Insect Physiol. 31: 15–21.
Caroci, A. S. and Noriega, F. G. (2003) Free amino acids are important for the retention
of protein and non-protein meals by the midgut of Aedes aegypti females. J. Insect
Physiol. 49: 839-844.
Clark, T. M., Koch, A. and Moffett, D. F. (1999) The anterior and posterior 'stomach'
regions of larval Aedes aegypti midgut: regional specialization of ion transport and
stimulation by 5-hydroxytryptamine. J. Exp. Biol. 202: 247-252.
Coast, G. M. (2012) Intracellular Na+, K
+ and Cl
− activities in Acheta domesticus
Malpighian tubules and the response to a diuretic kinin neuropeptide. J. Exp.
Biol. 215: 2774-2785.
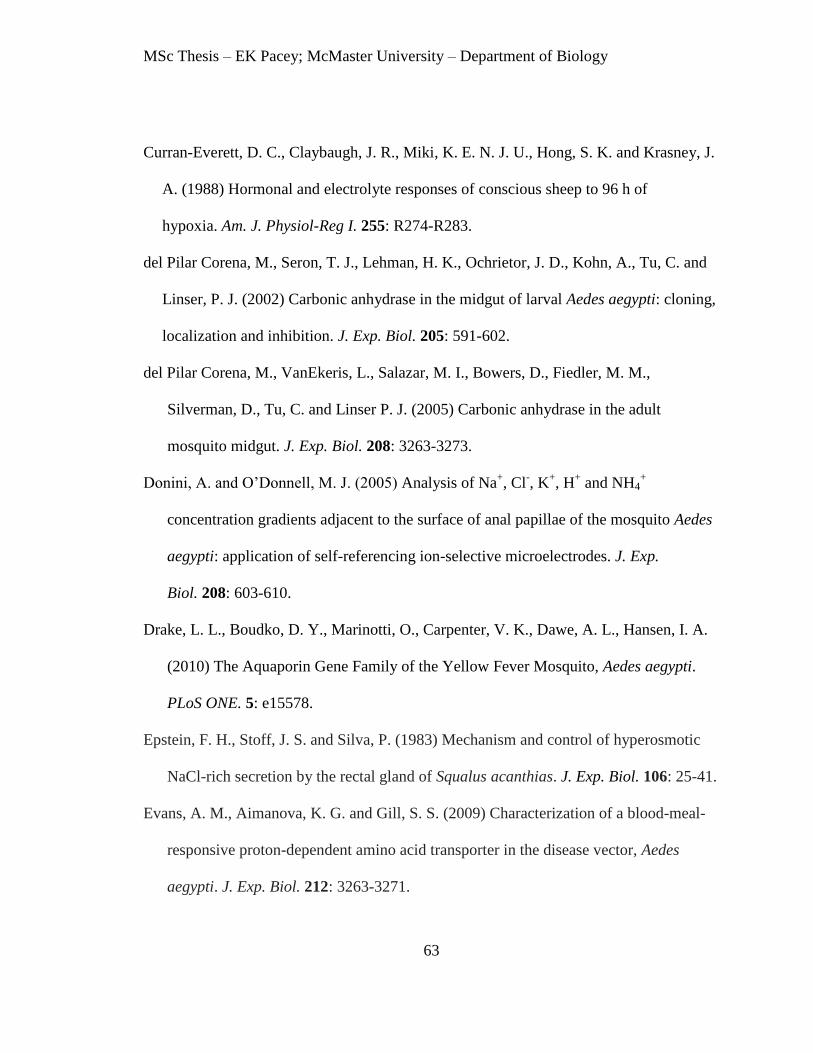
MSc Thesis – EK Pacey; McMaster University – Department of Biology
63
Curran-Everett, D. C., Claybaugh, J. R., Miki, K. E. N. J. U., Hong, S. K. and Krasney, J.
A. (1988) Hormonal and electrolyte responses of conscious sheep to 96 h of
hypoxia. Am. J. Physiol-Reg I. 255: R274-R283.
del Pilar Corena, M., Seron, T. J., Lehman, H. K., Ochrietor, J. D., Kohn, A., Tu, C. and
Linser, P. J. (2002) Carbonic anhydrase in the midgut of larval Aedes aegypti: cloning,
localization and inhibition. J. Exp. Biol. 205: 591-602.
del Pilar Corena, M., VanEkeris, L., Salazar, M. I., Bowers, D., Fiedler, M. M.,
Silverman, D., Tu, C. and Linser P. J. (2005) Carbonic anhydrase in the adult
mosquito midgut. J. Exp. Biol. 208: 3263-3273.
Donini, A. and O’Donnell, M. J. (2005) Analysis of Na+, Cl
-, K
+, H
+ and NH4
+
concentration gradients adjacent to the surface of anal papillae of the mosquito Aedes
aegypti: application of self-referencing ion-selective microelectrodes. J. Exp.
Biol. 208: 603-610.
Drake, L. L., Boudko, D. Y., Marinotti, O., Carpenter, V. K., Dawe, A. L., Hansen, I. A.
(2010) The Aquaporin Gene Family of the Yellow Fever Mosquito, Aedes aegypti.
PLoS ONE. 5: e15578.
Epstein, F. H., Stoff, J. S. and Silva, P. (1983) Mechanism and control of hyperosmotic
NaCl-rich secretion by the rectal gland of Squalus acanthias. J. Exp. Biol. 106: 25-41.
Evans, A. M., Aimanova, K. G. and Gill, S. S. (2009) Characterization of a blood-meal-
responsive proton-dependent amino acid transporter in the disease vector, Aedes
aegypti. J. Exp. Biol. 212: 3263-3271.

MSc Thesis – EK Pacey; McMaster University – Department of Biology
64
Farmer, J., Maddrell, S. H. P., and Spring, J. H. (1981) Absorption of fluid by the midgut
of Rhodnius. J. Exp. Biol. 94: 301-316.
Graça-Souza, A. V., Maya-Monteiro, C., Paiva-Silva, G. O., Braz, G. R., Paes, M. C.,
Sorgine, M. H., Oliveira, M. F. and Oliveira, P. L. (2006) Adaptations against heme
toxicity in blood-feeding arthropods. Insect Biochem. Mol. Biol. 36: 322-335.
Halberg, K. A. and Møbjerg, N. (2012) First evidence of epithelial transport in
tardigrades: a comparative investigation of organic anion transport. J. Exp. Biol. 215:
497-507.
Haley, C. and O’Donnell, M. J. (1997) K+ reabsorption by the lower Malpighian tubule
of Rhodnius prolixus: Inhibition by Ba2+
and blockers of H+/K
+-ATPases. J. Exp.
Biol. 200: 139-147.
Haley, C. A., Fletcher, M., and O'Donnell, M. J. (1997) KCl reabsorption by the lower
Malpighian tubule of Rhodnius prolixus: inhibition by Cl-channel blockers and
acetazolamide. J. Insect Physiol. 43: 657-665.
Harvey, W. R. (2009) Voltage coupling of primary H+ V-ATPases to secondary Na
+-or
K+-dependent transporters. J. Exp. Biol. 212: 1620-1629.
Ianowski, J. P. and O'Donnell, M. J. (2004) Basolateral ion transport mechanisms during
fluid secretion by Drosophila Malpighian tubules: Na+ recycling, Na
+: K
+: 2Cl
–
cotransport and Cl–
conductance. J. Exp. Biol. 207: 2599-2609.
Isoe, J. and Scaraffia, P. Y. (2013) Urea Synthesis and Excretion in Aedes aegypti
Mosquitoes are Regulated by a Unique Cross-Talk Mechanism. PLoS ONE. 8:
e65393.
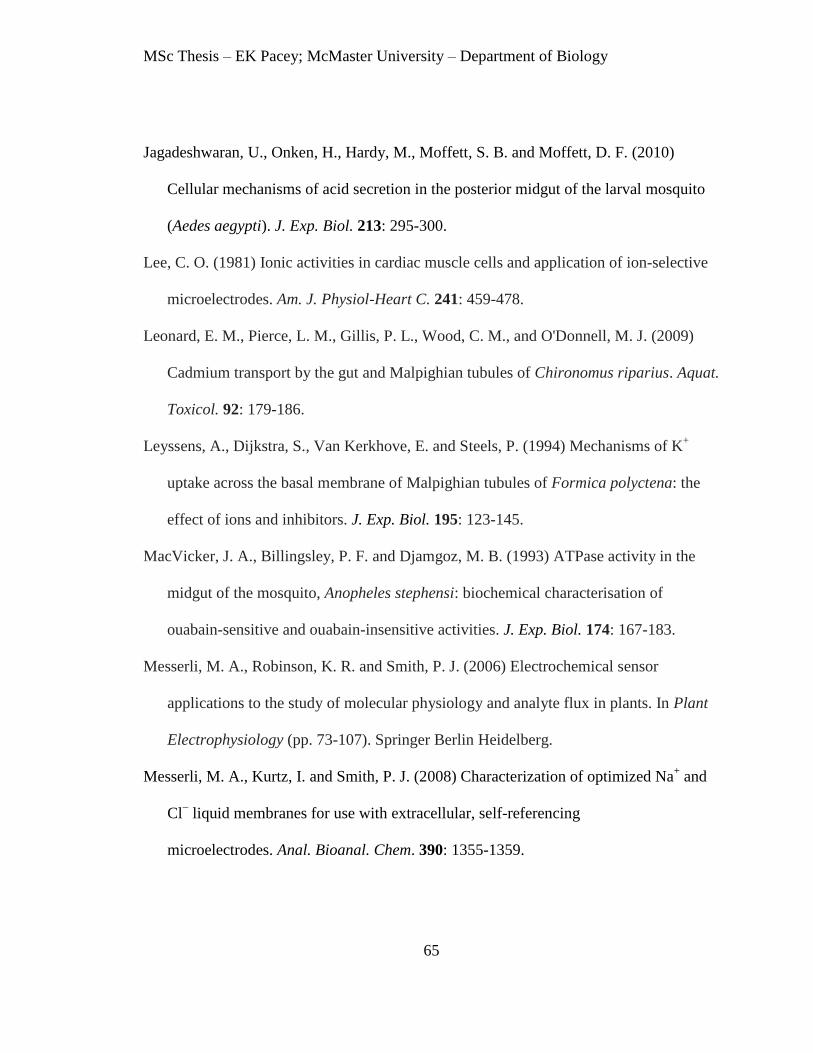
MSc Thesis – EK Pacey; McMaster University – Department of Biology
65
Jagadeshwaran, U., Onken, H., Hardy, M., Moffett, S. B. and Moffett, D. F. (2010)
Cellular mechanisms of acid secretion in the posterior midgut of the larval mosquito
(Aedes aegypti). J. Exp. Biol. 213: 295-300.
Lee, C. O. (1981) Ionic activities in cardiac muscle cells and application of ion-selective
microelectrodes. Am. J. Physiol-Heart C. 241: 459-478.
Leonard, E. M., Pierce, L. M., Gillis, P. L., Wood, C. M., and O'Donnell, M. J. (2009)
Cadmium transport by the gut and Malpighian tubules of Chironomus riparius. Aquat.
Toxicol. 92: 179-186.
Leyssens, A., Dijkstra, S., Van Kerkhove, E. and Steels, P. (1994) Mechanisms of K+
uptake across the basal membrane of Malpighian tubules of Formica polyctena: the
effect of ions and inhibitors. J. Exp. Biol. 195: 123-145.
MacVicker, J. A., Billingsley, P. F. and Djamgoz, M. B. (1993) ATPase activity in the
midgut of the mosquito, Anopheles stephensi: biochemical characterisation of
ouabain-sensitive and ouabain-insensitive activities. J. Exp. Biol. 174: 167-183.
Messerli, M. A., Robinson, K. R. and Smith, P. J. (2006) Electrochemical sensor
applications to the study of molecular physiology and analyte flux in plants. In Plant
Electrophysiology (pp. 73-107). Springer Berlin Heidelberg.
Messerli, M. A., Kurtz, I. and Smith, P. J. (2008) Characterization of optimized Na+ and
Cl− liquid membranes for use with extracellular, self-referencing
microelectrodes. Anal. Bioanal. Chem. 390: 1355-1359.

MSc Thesis – EK Pacey; McMaster University – Department of Biology
66
Naikkhwah, W. and O’Donnell, M. J. (2012) Phenotypic plasticity in response to dietary
salt stress: Na+ and K
+ transport by the gut of Drosophila melanogaster larvae. J. Exp.
Biol. 215: 461-470.
Noriega, F. G. and Wells, M. A. (1999) A molecular view of trypsin synthesis in the
midgut of Aedes aegypti. J. Insect Physiol. 45: 613-620.
O’Donnell, M. (2008) Insect excretory mechanisms. Adv. Insect physiol. 35: 1-122.
Pascoa. V., Oliveira, P. L., Dansa-Petretski, M., Silva, J. R., Alvarenga, P. H., Jacobs-
Lorena, M. and Lemos, F. J. (2002) Aedes aegypti peritrophic matrix and its
interaction with heme during blood digestion. Insect Biochem. Mol. Biol. 32: 517-523.
Patrick, M. L., Aimanova, K., Sanders, H. R. and Gill, S. S. (2006) P-type Na+/K
+-
ATPase and V-type H+-ATPase expression patterns in the osmoregulatory organs of
larval and adult mosquito Aedes aegypti. J. Exp. Biol. 209: 4638-4651.
Pullikuth, A. K., Aimanova, K., Kang'ethe, W., Sanders, H. R. and Gill, S. S. (2006)
Molecular characterization of sodium/proton exchanger 3 (NHE3) from the yellow
fever vector, Aedes aegypti. J. Exp. Biol. 209: 3529-3544.
Rheault, M. R. and O’Donnell, M. J. (2001) Analysis of epithelial K+ transport in
Malpighian tubules of Drosophila melanogaster: evidence for spatial and temporal
heterogeneity. J. Exp. Biol. 204: 2289-2299.
Sanders, H. R., Evans, A. M., Ross, L.S. and Gill, S. S. (2003) Blood meal induces global
changes in midgut gene expression in the disease vector, Aedes aegypti. Insect
Biochem. Mol. Biol. 33: 1105-1122.
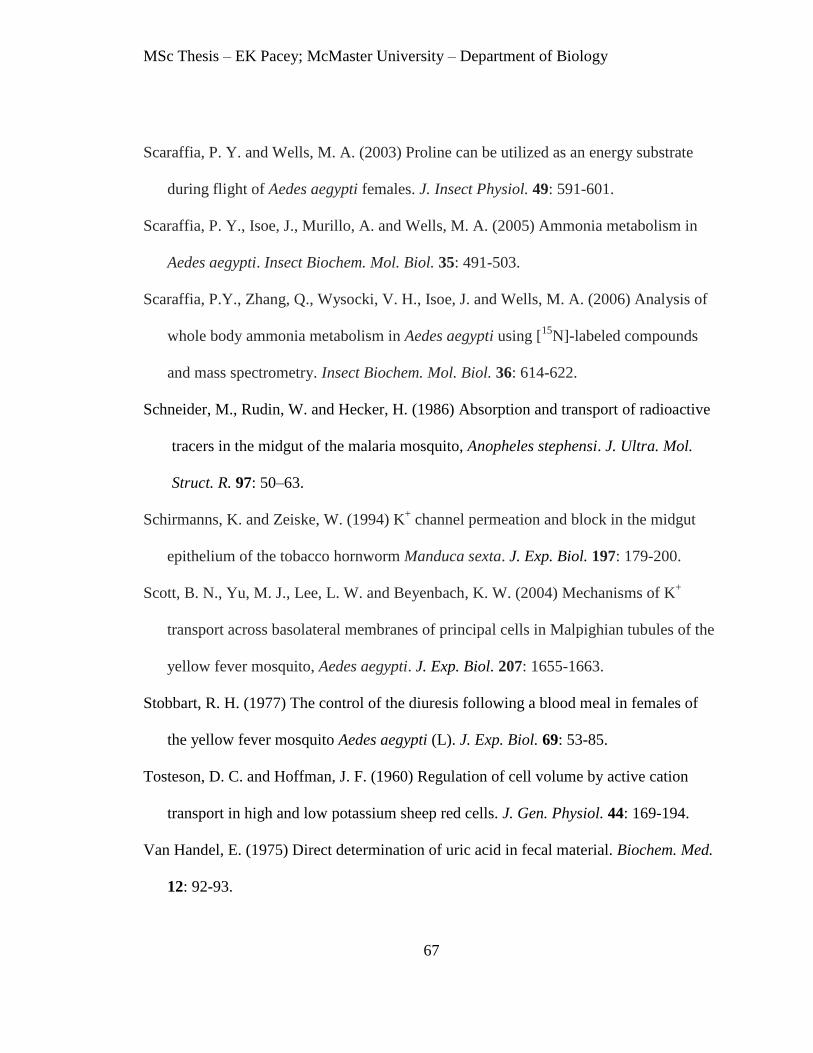
MSc Thesis – EK Pacey; McMaster University – Department of Biology
67
Scaraffia, P. Y. and Wells, M. A. (2003) Proline can be utilized as an energy substrate
during flight of Aedes aegypti females. J. Insect Physiol. 49: 591-601.
Scaraffia, P. Y., Isoe, J., Murillo, A. and Wells, M. A. (2005) Ammonia metabolism in
Aedes aegypti. Insect Biochem. Mol. Biol. 35: 491-503.
Scaraffia, P.Y., Zhang, Q., Wysocki, V. H., Isoe, J. and Wells, M. A. (2006) Analysis of
whole body ammonia metabolism in Aedes aegypti using [15
N]-labeled compounds
and mass spectrometry. Insect Biochem. Mol. Biol. 36: 614-622.
Schneider, M., Rudin, W. and Hecker, H. (1986) Absorption and transport of radioactive
tracers in the midgut of the malaria mosquito, Anopheles stephensi. J. Ultra. Mol.
Struct. R. 97: 50–63.
Schirmanns, K. and Zeiske, W. (1994) K+ channel permeation and block in the midgut
epithelium of the tobacco hornworm Manduca sexta. J. Exp. Biol. 197: 179-200.
Scott, B. N., Yu, M. J., Lee, L. W. and Beyenbach, K. W. (2004) Mechanisms of K+
transport across basolateral membranes of principal cells in Malpighian tubules of the
yellow fever mosquito, Aedes aegypti. J. Exp. Biol. 207: 1655-1663.
Stobbart, R. H. (1977) The control of the diuresis following a blood meal in females of
the yellow fever mosquito Aedes aegypti (L). J. Exp. Biol. 69: 53-85.
Tosteson, D. C. and Hoffman, J. F. (1960) Regulation of cell volume by active cation
transport in high and low potassium sheep red cells. J. Gen. Physiol. 44: 169-194.
Van Handel, E. (1975) Direct determination of uric acid in fecal material. Biochem. Med.
12: 92-93.

MSc Thesis – EK Pacey; McMaster University – Department of Biology
68
Villalon, J. M., Ghosh, A. and Jacobs-Lorena, M. (2003) The peritrophic matrix limits the
rate of digestion in adult Anopheles stephensi and Aedes aegypti mosquitoes. J. Insect
Physiol. 49: 891-895.
Williams, J. C., Hagedorn, H. H. and Beyenbach, K. W. (1983) Dynamic changes in flow
rate and composition of urine during the post-bloodmeal diuresis in Aedes aegypti
(L.). J. Comp. Physiol. B. 153: 257-265.
Zhou, G., Flowers, M., Friedrich, K., Horton, J., Pennington J. E. and Wells, M. A.
(2004) Metabolic fate of [14
C]-labeled meal protein amino acids in Aedes aegypti
mosquitoes. J. Insect Physiol. 50: 337–349.