Embed Size (px)
Citation preview
Transport of chemicals in normal and S. aureus-infected murine mammary epithelial HC11 cells Erika Jansson
Master Thesis
Institutionen för Livsmedelsvetenskap Publikation nr 306 Swedish University of Agricultural Sciences Uppsala 2011 Department of Food Science
Master thesis, SLU, NL-faculty, Dept.of Food Science
Självständigt arbete 30 högskolepoäng
Title:
Transport of chemicals in normal and S. aureus-infected murine mammary epithelial HC11 cells Titel: Transport av kemikalier i normala och S. aureus infekterade mammarepitelceller, HC11 celler, från mus Key words: milk, HC11 cell line, BCRP, albendazole sulfoxide, genistein, subclinical mastitis
Author: Erika Jansson Supervisor: Agneta Oskarsson, & Jonas Tallkvist, SLU, Dept. of Biomedical Sciences and Veterinary Public Health (BVF) Examiner: Anders Andrén, Department of Food Science, SLU Course code: EX0425 Type of student level: Advanced 2E Course title: Independent project/Master’s thesis in Food Science, 30 hp Credits: 30 hp
Online publication: http://stud.epsilon.slu.se Place of publication: Uppsala Year of publication: 2011
Abstract Milk is the most important nutrition source for breast-fed infants and an important food item for high-milk consumers. However, a wide variety of chemicals can be transported into milk, which can be of great concern from a food safety perspective. The active transport protein, breast cancer resistance protein (BCRP), is highly upregulated in lactating mammary gland in mouse, cow and human. BCRP belongs to the superfamily of ABC transporters and export a wide variety of chemicals from the cells. Udder inflammation (mastitis) is a common bacterial infection among dairy cows. In subclinical mastitis, the cow has no visible illness and delivers milk, but the milk is of poor quality and the milk yield is reduced.
In this project, an in vitro cell model has been optimised and used for studies of active transport of chemicals in normal murine mammary epithelial HC11 cells. Determination of transport has been performed by radioactivity measurements and liquid chromatography-masspectrometry. Tritium labelled mitoxantrone was used as a model substance for BCRP transport. The effects on gene expression of BCRP and the milk protein β-casein of differentiation of cells and after Staphylococcus aureus infections have been examined by real time RT-PCR as well as mitoxantrone transport in infected cells.
Only a minor part of the total mitoxantrone transport in the HC11 cell line was mediated by BCRP. Neither albendazole sulfoxide, an anti-parasitic drug widely used in human and veterinary medicine, nor genistein, a phytoestrogen from soya beans and red clover, are substrates and/or inhibitors of BCRP in this cell line under the experimental conditions used. The S. aureus infection decreased synthesis of β-casein, but did not affect BCRP, thereby, the HC11 cell line has a potential to be used as an in vitro model of mastitis. In addition, mitoxantrone transport was unaffected by infection.
Since the HC11 cell line derives from a normal mammary gland, it is expected to express BCRP levels likely to be found in in vivo, and thereby an interesting model for in vitro studies of chemicals secretion into milk. However, the cell line has to be characterized more and the methods standardised before usage. Key words: milk, HC11 cell line, BCRP, albendazole sulfoxide, genistein, subclinical mastitis
INDEX
1. INTRODUCTION ............................................................................................................................................. 3
1.1 MILK AND THE MAMMARY GLAND ................................................................................................................ 3 1.2 BCRP – A TRANSPORT PROTEIN IN THE MAMMARY GLAND ........................................................................... 4 1.3 BCRP PHYSIOLOGICAL ROLE IN THE MAMMARY GLAND IS UNKNOWN .......................................................... 5 1.4 CHEMICALS TRANSPORTED BY BCRP ........................................................................................................... 5
1.4.1 Mitoxantrone and Ko143 ...................................................................................................................... 6 1.4.2 Albendazole sulfoxide ........................................................................................................................... 6 1.4.3 Genistein ............................................................................................................................................... 6
1.5 A CELL MODEL TO STUDY SECRETION OF BCRP SUBSTRATE ......................................................................... 7 1.6 BOVINE MASTITIS .......................................................................................................................................... 7
2. AIMS .................................................................................................................................................................. 8
3. MATERIAL AND METHODS ........................................................................................................................ 9
3.1 HC11 CELL CULTURING................................................................................................................................. 9 3.2 SEEDING AND DIFFERENTIATION ................................................................................................................... 9 3.3 EVALUATION OF EXPERIMENTAL MEDIUM ..................................................................................................... 9 3.4 CHEMICALS AND SOLUBILITY ...................................................................................................................... 10 3.5 CELL MEMBRANE DAMAGE ASSAY .............................................................................................................. 10 3.6 EVALUATION OF DMSO CONCENTRATION .................................................................................................. 11 3.7 TRANSPORT ASSAY WITH
3H-MITOXANTRONE ............................................................................................. 11 3.7.1 Accumulation assay with 3H-mitoxantrone ......................................................................................... 11 3.7.2 Secretion assay with 3H-mitoxantrone ................................................................................................ 11
3.8 TRANSPORT ASSAY WITH ALBENDAZOLE SULFOXIDE, FOLLOWED BY HPLC-MS/MS ANALYSIS ................ 12 3.8.1 Secretion assay in combination with HPLC-MS/MS analysis ............................................................ 12 3.8.2. Sample preparation prior to HPLC-MS/MS analysis ........................................................................ 12 3.8.3 HPLC-MS/MS analysis ....................................................................................................................... 12
3.9 PROTEIN DETERMINATION WITH THE BCA METHOD .................................................................................... 12 3.10 BCRP GENE EXPRESSION IN STAPHYLOCOCCUS AUREUS ............................................................................ 12 3.11 INFECTION WITH S. AUREUS ....................................................................................................................... 13
3.11.1 Preparation of the bacterial strain ................................................................................................... 13 3.11.2 Infection assay .................................................................................................................................. 13 3.11.3 Accumulation assay with 3H-mitoxantrone ....................................................................................... 13
3.12 RNA ISOLATION AND QUANTIFICATION .................................................................................................... 14 3.12.1 Isolation of total RNA ....................................................................................................................... 14 3.12.2 Quantification of total RNA .............................................................................................................. 14 3.12.3 Quantification of BCRP and β-casein gene expression .................................................................... 14
3.13 STATISTICAL ANALYSIS ............................................................................................................................. 15
4. RESULTS ........................................................................................................................................................ 16
4.1 EXPERIMENTAL MEDIUM ............................................................................................................................. 16 4.2 CHEMICALS AND SOLUBILITY ...................................................................................................................... 17 4.3 CELL MEMBRANE DAMAGE ASSAY .............................................................................................................. 18 4.4 EVALUATION OF DMSO CONCENTRATION .................................................................................................. 18 4.5 TRANSPORT ASSAY ...................................................................................................................................... 19
4.5.1 Accumulation assay with 3H-mitoxantrone ......................................................................................... 19 4.5.2 Secretion assay with 3H-mitoxantrone ................................................................................................ 21
4.6 TRANSPORT ASSAY WITH ALBENDAZOLE SULFOXIDE FOLLOWED BY HPLC-MS/MS ANALYSIS ................. 21 4.7 BCRP GENE EXPRESSION IN STAPHYLOCOCCUS AUREUS .............................................................................. 22 4.8 INFECTION WITH S. AUREUS ......................................................................................................................... 22
5. DISCUSSION .................................................................................................................................................. 24
6. CONCLUSION ............................................................................................................................................... 27
7. ACKNOWLEDGEMENTS ............................................................................................................................ 27
8. REFERENCES ................................................................................................................................................ 28
3
1. Introduction
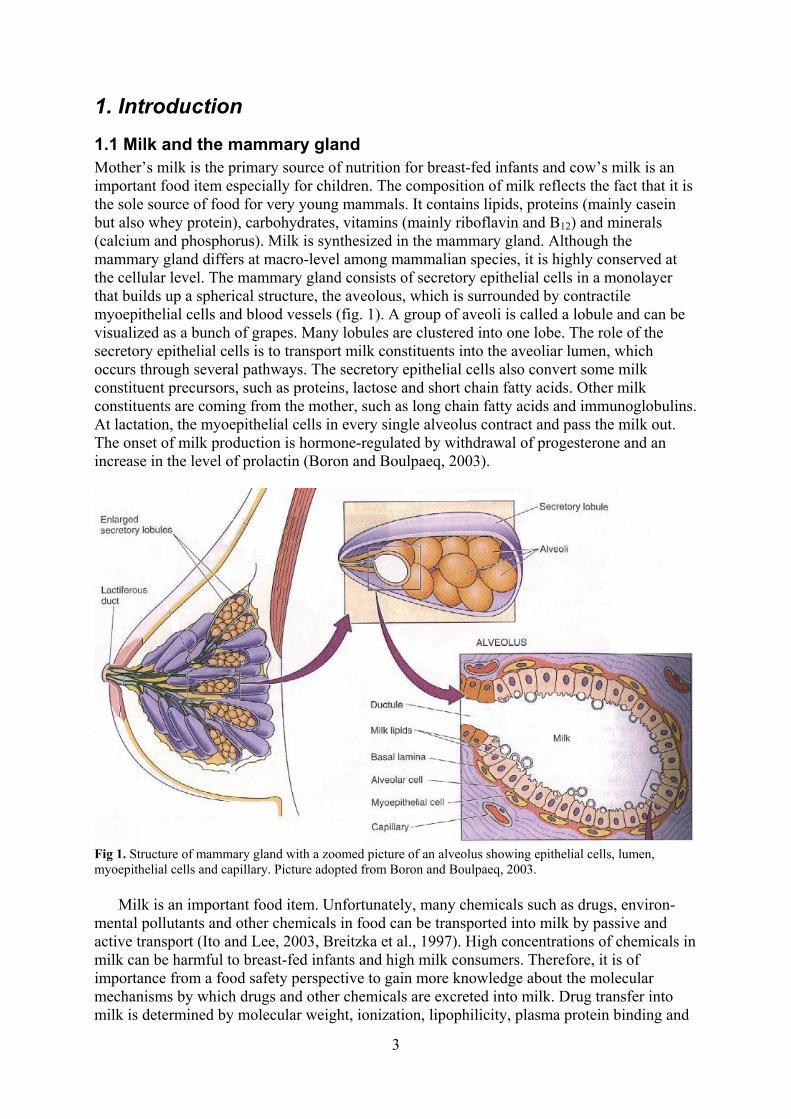
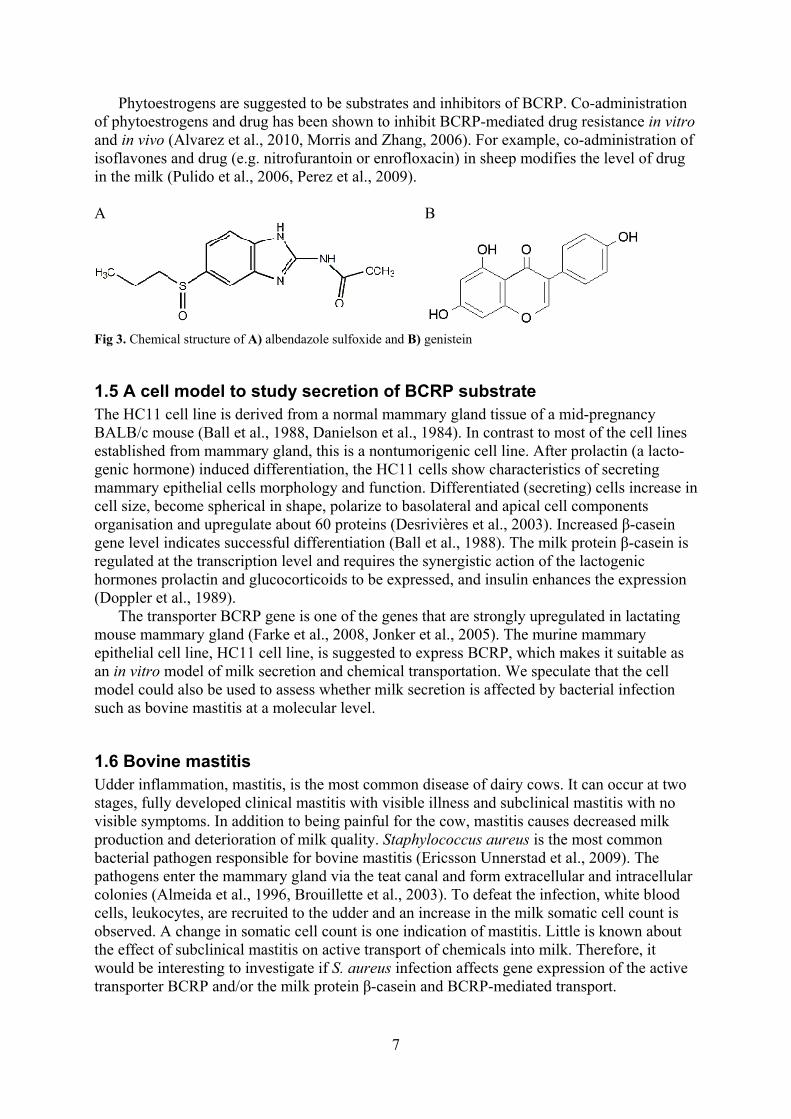
1.1 Milk and the mammary gland Mother’s milk is the primary source of nutrition for breast-fed infants and cow’s milk is an important food item especially for children. The composition of milk reflects the fact that it is the sole source of food for very young mammals. It contains lipids, proteins (mainly casein but also whey protein), carbohydrates, vitamins (mainly riboflavin and B12) and minerals (calcium and phosphorus). Milk is synthesized in the mammary gland. Although the mammary gland differs at macro-level among mammalian species, it is highly conserved at the cellular level. The mammary gland consists of secretory epithelial cells in a monolayer that builds up a spherical structure, the aveolous, which is surrounded by contractile myoepithelial cells and blood vessels (fig. 1). A group of aveoli is called a lobule and can be visualized as a bunch of grapes. Many lobules are clustered into one lobe. The role of the secretory epithelial cells is to transport milk constituents into the aveoliar lumen, which occurs through several pathways. The secretory epithelial cells also convert some milk constituent precursors, such as proteins, lactose and short chain fatty acids. Other milk constituents are coming from the mother, such as long chain fatty acids and immunoglobulins. At lactation, the myoepithelial cells in every single alveolus contract and pass the milk out. The onset of milk production is hormone-regulated by withdrawal of progesterone and an increase in the level of prolactin (Boron and Boulpaeq, 2003).
Fig 1. Structure of mammary gland with a zoomed picture of an alveolus showing epithelial cells, lumen, myoepithelial cells and capillary. Picture adopted from Boron and Boulpaeq, 2003.
Milk is an important food item. Unfortunately, many chemicals such as drugs, environ-mental pollutants and other chemicals in food can be transported into milk by passive and active transport (Ito and Lee, 2003, Breitzka et al., 1997). High concentrations of chemicals in milk can be harmful to breast-fed infants and high milk consumers. Therefore, it is of importance from a food safety perspective to gain more knowledge about the molecular mechanisms by which drugs and other chemicals are excreted into milk. Drug transfer into milk is determined by molecular weight, ionization, lipophilicity, plasma protein binding and
4
pharmacokinetics in the mother (Ito and Lee, 2003, Breitzka et al., 1997). An uncharged low molecular weight substance with high lipophilicity and low plasma protein binding are more likely to be excreted than other molecules. These characteristics are mainly determinants for passive diffusion. In addition to passive diffusion, there is active transport. Active transport is more prone to cause high chemical levels in the milk since it is not driven by concentration gradient over the plasma membrane. Drug transfer into milk is commonly described by measuring milk-to-plasma ratio (M/P) of substances. A high ratio indicates that active transport is the main mechanism for secretion. Even though this knowledge is widely accepted, little is known about the molecular mechanisms by which drugs and other chemicals are actively transported into milk. However, one active transporter in the mammary gland is the breast cancer resistance protein (BCRP), a member of the ABC transporters’ superfamily.
1.2 BCRP – a transport protein in the mammary gland ATP binding cassette transporters (ABC transporters) is a superfamily of transmembrane proteins. The active transporters export substrates out of the cells by the energy derived from ATP hydrolysis (Farke et al., 2008, Robey et al., 2009). They are expressed in several tissues and have a protective role in the body by exporting potential toxic substances out of cells. However, ABC transporters expressed in tumour cells mediate multi-drug resistance by efflux of anticancer drugs from the cells (Robey et al., 2009). Therefore, a great number of researchers have studied substances that can inhibit this efflux by being co-administrated with the anticancer agent, and thus restore chemosensitivity.
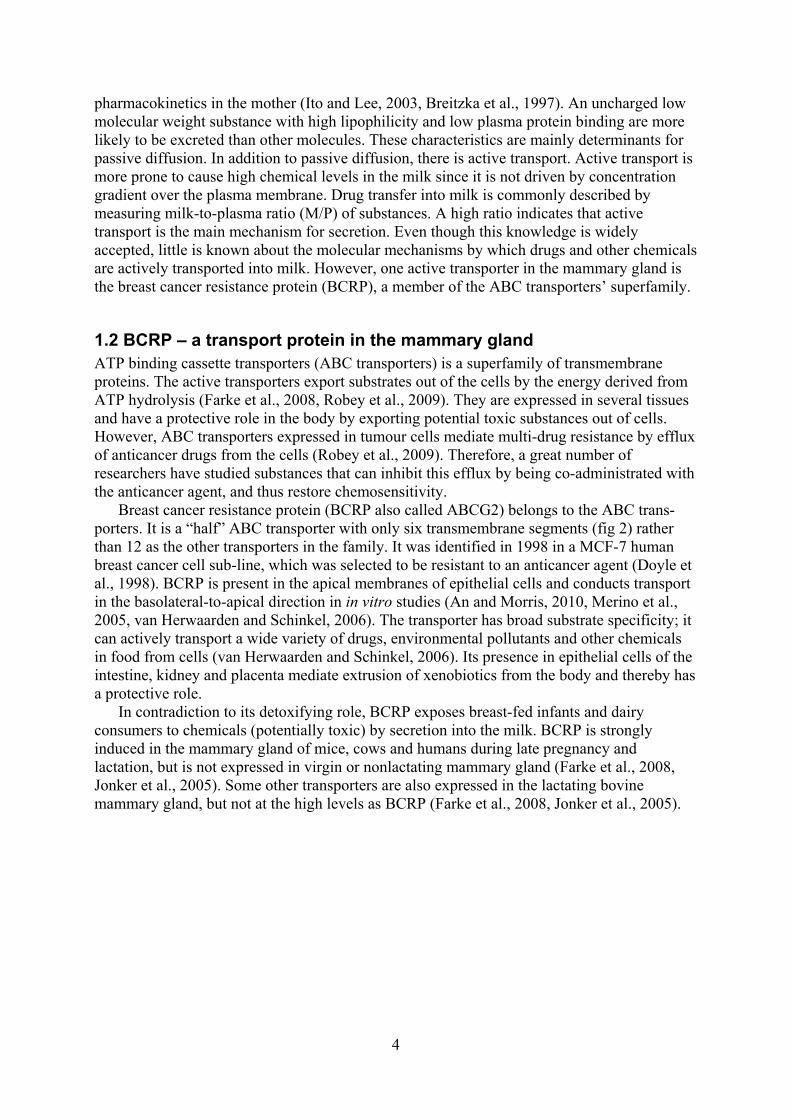
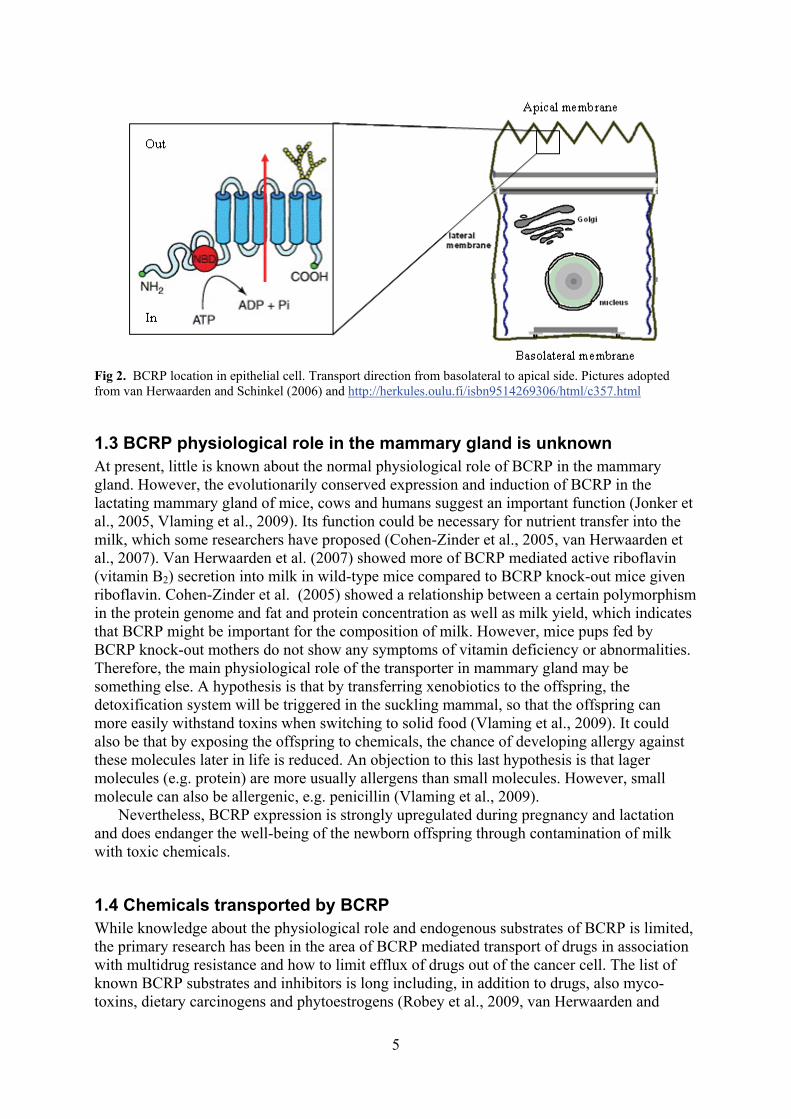
Breast cancer resistance protein (BCRP also called ABCG2) belongs to the ABC trans-porters. It is a “half” ABC transporter with only six transmembrane segments (fig 2) rather than 12 as the other transporters in the family. It was identified in 1998 in a MCF-7 human breast cancer cell sub-line, which was selected to be resistant to an anticancer agent (Doyle et al., 1998). BCRP is present in the apical membranes of epithelial cells and conducts transport in the basolateral-to-apical direction in in vitro studies (An and Morris, 2010, Merino et al., 2005, van Herwaarden and Schinkel, 2006). The transporter has broad substrate specificity; it can actively transport a wide variety of drugs, environmental pollutants and other chemicals in food from cells (van Herwaarden and Schinkel, 2006). Its presence in epithelial cells of the intestine, kidney and placenta mediate extrusion of xenobiotics from the body and thereby has a protective role.
In contradiction to its detoxifying role, BCRP exposes breast-fed infants and dairy consumers to chemicals (potentially toxic) by secretion into the milk. BCRP is strongly induced in the mammary gland of mice, cows and humans during late pregnancy and lactation, but is not expressed in virgin or nonlactating mammary gland (Farke et al., 2008, Jonker et al., 2005). Some other transporters are also expressed in the lactating bovine mammary gland, but not at the high levels as BCRP (Farke et al., 2008, Jonker et al., 2005).
5
Fig 2. BCRP location in epithelial cell. Transport direction from basolateral to apical side. Pictures adopted from van Herwaarden and Schinkel (2006) and http://herkules.oulu.fi/isbn9514269306/html/c357.html
1.3 BCRP physiological role in the mammary gland is unknown At present, little is known about the normal physiological role of BCRP in the mammary gland. However, the evolutionarily conserved expression and induction of BCRP in the lactating mammary gland of mice, cows and humans suggest an important function (Jonker et al., 2005, Vlaming et al., 2009). Its function could be necessary for nutrient transfer into the milk, which some researchers have proposed (Cohen-Zinder et al., 2005, van Herwaarden et al., 2007). Van Herwaarden et al. (2007) showed more of BCRP mediated active riboflavin (vitamin B2) secretion into milk in wild-type mice compared to BCRP knock-out mice given riboflavin. Cohen-Zinder et al. (2005) showed a relationship between a certain polymorphism in the protein genome and fat and protein concentration as well as milk yield, which indicates that BCRP might be important for the composition of milk. However, mice pups fed by BCRP knock-out mothers do not show any symptoms of vitamin deficiency or abnormalities. Therefore, the main physiological role of the transporter in mammary gland may be something else. A hypothesis is that by transferring xenobiotics to the offspring, the detoxification system will be triggered in the suckling mammal, so that the offspring can more easily withstand toxins when switching to solid food (Vlaming et al., 2009). It could also be that by exposing the offspring to chemicals, the chance of developing allergy against these molecules later in life is reduced. An objection to this last hypothesis is that lager molecules (e.g. protein) are more usually allergens than small molecules. However, small molecule can also be allergenic, e.g. penicillin (Vlaming et al., 2009).
Nevertheless, BCRP expression is strongly upregulated during pregnancy and lactation and does endanger the well-being of the newborn offspring through contamination of milk with toxic chemicals.
1.4 Chemicals transported by BCRP While knowledge about the physiological role and endogenous substrates of BCRP is limited, the primary research has been in the area of BCRP mediated transport of drugs in association with multidrug resistance and how to limit efflux of drugs out of the cancer cell. The list of known BCRP substrates and inhibitors is long including, in addition to drugs, also myco-toxins, dietary carcinogens and phytoestrogens (Robey et al., 2009, van Herwaarden and
6
Schinkel, 2006). At least in in vitro and in vivo models, the location of BCRP in the body seems to be important whether a chemical is a BCRP-substrate or not (Robey et al., 2009). So known substrates (for examples folic acids, dehydroepiandrosterone-sulfate, vitamin B12) in one part of the body do not have to be actively secreted into milk (van Herwaarden et al., 2007).
1.4.1 Mitoxantrone and Ko143
One of these well-studied anticancer drugs is mitoxantrone, which often is used as a model substrate for BCRP transport. BCRP was discovered in human breast carcinoma cells when they showed resistance to mitoxantrone (Doyle et al., 1998). For studies of specific BCRP transport, mitoxantrone can be used in combination with Ko143 (Allen et al., 2002), a specific BCRP blocker, as a positive control of the model system.
1.4.2 Albendazole sulfoxide
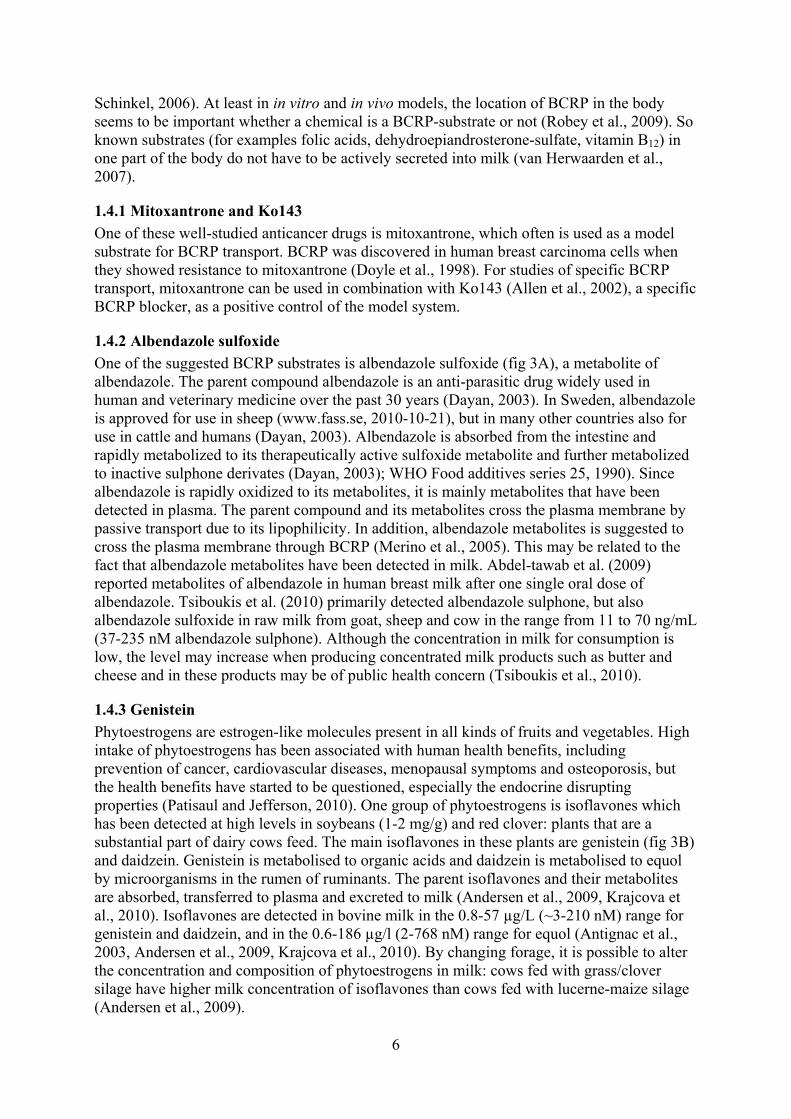
One of the suggested BCRP substrates is albendazole sulfoxide (fig 3A), a metabolite of albendazole. The parent compound albendazole is an anti-parasitic drug widely used in human and veterinary medicine over the past 30 years (Dayan, 2003). In Sweden, albendazole is approved for use in sheep (www.fass.se, 2010-10-21), but in many other countries also for use in cattle and humans (Dayan, 2003). Albendazole is absorbed from the intestine and rapidly metabolized to its therapeutically active sulfoxide metabolite and further metabolized to inactive sulphone derivates (Dayan, 2003); WHO Food additives series 25, 1990). Since albendazole is rapidly oxidized to its metabolites, it is mainly metabolites that have been detected in plasma. The parent compound and its metabolites cross the plasma membrane by passive transport due to its lipophilicity. In addition, albendazole metabolites is suggested to cross the plasma membrane through BCRP (Merino et al., 2005). This may be related to the fact that albendazole metabolites have been detected in milk. Abdel-tawab et al. (2009) reported metabolites of albendazole in human breast milk after one single oral dose of albendazole. Tsiboukis et al. (2010) primarily detected albendazole sulphone, but also albendazole sulfoxide in raw milk from goat, sheep and cow in the range from 11 to 70 ng/mL (37-235 nM albendazole sulphone). Although the concentration in milk for consumption is low, the level may increase when producing concentrated milk products such as butter and cheese and in these products may be of public health concern (Tsiboukis et al., 2010).
1.4.3 Genistein
Phytoestrogens are estrogen-like molecules present in all kinds of fruits and vegetables. High intake of phytoestrogens has been associated with human health benefits, including prevention of cancer, cardiovascular diseases, menopausal symptoms and osteoporosis, but the health benefits have started to be questioned, especially the endocrine disrupting properties (Patisaul and Jefferson, 2010). One group of phytoestrogens is isoflavones which has been detected at high levels in soybeans (1-2 mg/g) and red clover: plants that are a substantial part of dairy cows feed. The main isoflavones in these plants are genistein (fig 3B) and daidzein. Genistein is metabolised to organic acids and daidzein is metabolised to equol by microorganisms in the rumen of ruminants. The parent isoflavones and their metabolites are absorbed, transferred to plasma and excreted to milk (Andersen et al., 2009, Krajcova et al., 2010). Isoflavones are detected in bovine milk in the 0.8-57 µg/L (~3-210 nM) range for genistein and daidzein, and in the 0.6-186 µg/l (2-768 nM) range for equol (Antignac et al., 2003, Andersen et al., 2009, Krajcova et al., 2010). By changing forage, it is possible to alter the concentration and composition of phytoestrogens in milk: cows fed with grass/clover silage have higher milk concentration of isoflavones than cows fed with lucerne-maize silage (Andersen et al., 2009).
7
Phytoestrogens are suggested to be substrates and inhibitors of BCRP. Co-administration of phytoestrogens and drug has been shown to inhibit BCRP-mediated drug resistance in vitro and in vivo (Alvarez et al., 2010, Morris and Zhang, 2006). For example, co-administration of isoflavones and drug (e.g. nitrofurantoin or enrofloxacin) in sheep modifies the level of drug in the milk (Pulido et al., 2006, Perez et al., 2009). A
B
Fig 3. Chemical structure of A) albendazole sulfoxide and B) genistein
1.5 A cell model to study secretion of BCRP substrate The HC11 cell line is derived from a normal mammary gland tissue of a mid-pregnancy BALB/c mouse (Ball et al., 1988, Danielson et al., 1984). In contrast to most of the cell lines established from mammary gland, this is a nontumorigenic cell line. After prolactin (a lacto-genic hormone) induced differentiation, the HC11 cells show characteristics of secreting mammary epithelial cells morphology and function. Differentiated (secreting) cells increase in cell size, become spherical in shape, polarize to basolateral and apical cell components organisation and upregulate about 60 proteins (Desrivières et al., 2003). Increased β-casein gene level indicates successful differentiation (Ball et al., 1988). The milk protein β-casein is regulated at the transcription level and requires the synergistic action of the lactogenic hormones prolactin and glucocorticoids to be expressed, and insulin enhances the expression (Doppler et al., 1989).
The transporter BCRP gene is one of the genes that are strongly upregulated in lactating mouse mammary gland (Farke et al., 2008, Jonker et al., 2005). The murine mammary epithelial cell line, HC11 cell line, is suggested to express BCRP, which makes it suitable as an in vitro model of milk secretion and chemical transportation. We speculate that the cell model could also be used to assess whether milk secretion is affected by bacterial infection such as bovine mastitis at a molecular level.
1.6 Bovine mastitis Udder inflammation, mastitis, is the most common disease of dairy cows. It can occur at two stages, fully developed clinical mastitis with visible illness and subclinical mastitis with no visible symptoms. In addition to being painful for the cow, mastitis causes decreased milk production and deterioration of milk quality. Staphylococcus aureus is the most common bacterial pathogen responsible for bovine mastitis (Ericsson Unnerstad et al., 2009). The pathogens enter the mammary gland via the teat canal and form extracellular and intracellular colonies (Almeida et al., 1996, Brouillette et al., 2003). To defeat the infection, white blood cells, leukocytes, are recruited to the udder and an increase in the milk somatic cell count is observed. A change in somatic cell count is one indication of mastitis. Little is known about the effect of subclinical mastitis on active transport of chemicals into milk. Therefore, it would be interesting to investigate if S. aureus infection affects gene expression of the active transporter BCRP and/or the milk protein β-casein and BCRP-mediated transport.
8
2. Aims The aims of this project were:
to optimise the murine mammary epithelial cell line (HC11) model for active transport into milk of drugs and phytoestrogens
to apply the HC11 cell model to assess whether transport of albendazole sulfoxide and genistein is mediated by BCRP
to examine if Staphylococcus aureus infection alters gene expressions of BCRP and β-casein in secreting HC11 cells
to study transport of mitoxantrone in S. aureus-infected cells
9
3. Material and Methods
3.1 HC11 cell culturing Murine mammary epithelial cell line HC11 was used for BCRP mediated transport experiments and S. aureus infection. The cells were cultured in sterile Roswell Park Memorial Institute (RPMI) 1640 medium (containing L-Glutamine and 25 mM HEPES) supplemented with 50 mg/L gentamycin (Gibco, Invitrogen, Carlsbad, CA, USA), 7.5% sodium bicarbonate, 5 mg/L insulin, 10 µg/L epidermal growth factor (Sigma-Aldrich, St Louis, MO, USA) and 10% heat inactivated fetal bovine serum (Gibco, Invitrogen, Carlsbad, CA, USA), pH 7.3-7.4 at 37 ºC in the presence of 5% CO2. Culture medium was changed every second to third day. When the cells had reached 80-90% confluence, they were passaged by aspirating the culture medium and washing the cells in sterile phosphate buffered saline (PBS) solution (Medicago, Uppsala, Sweden) (15 mL/75 cm2). PBS was removed and 3 mL/75 cm2 Cell Dissociation Solution (without enzyme) (Gibco, Invitrogen, Carlsbad, CA, USA) was added followed by 10-20 minutes incubation at 37 ºC. After detachment of cells, they were carefully resuspended in culture medium and spinned down at 450 G for 5 minutes at 4 ºC in a GS-GR centrifuge (Beckman Coulter, Fullerton, USA). The supernatant was removed and the pellet was carefully resuspended in culture medium to a concentration of 0.5 × 10⁶ cells per mL prior to be seeded in cell culture plates for experiments, or to be transferred into new culture flasks for proliferation.
3.2 Seeding and differentiation When different cell culture plates (with different numbers of wells per plate) (Costar®, Corning, NY, USA) were used, the ratio of seeded cells per volume and surface were maintained, as followed: 6-well plate: area 9.5 cm2/well, 1.5 × 10⁶ cells per well, 3 mL medium 12-well plate: area 3.8 cm2/well, 6 × 10⁵ cells per well, 1.2 mL medium 24-well plate: area 1.9 cm2/well, 3 × 10⁵ cells per well, 0.6 mL medium 96-well plate: area 0.32 cm2/well, 5 × 10⁴ cells per well, 0.10 mL medium In the wells, HC11 cells were grown in culture medium 48 h post-confluency. Thereafter, the cells were incubated in differentiation medium for 72 h before transport experiments or S. aureus infection. The cells were differentiated into a milk protein synthesizing and secretory phenotype in serum- and epidermal growth factor-free culture medium, but with 1 µg/mL prolactin and 1 µM hydrocortisone (Sigma-Aldrich, St Louis, MO, USA) (differentiation medium).
Culturing and differentiation of the HC11 cells was carried out in a humidified environ-ment at 37 ºC containing 95% air and 5% CO2.
3.3 Evaluation of experimental medium All experiments had to be carried out in a medium with no negative effects on the cells. Differentiated cells were incubated in three different medium for 2 hours at 37 ºC followed by microscopic examination. The medium was PBS, Hank’s Balanced Salt Solution with CaCl2 and MgCl2 (HBSS) containing 10 mM N-(2-hydroxyethyl) piperazine-N’-(2-ethanesulfonic) acid (HEPES) (Gibco, Invitrogen, Carlsbad, CA, USA) and HC11 basal medium, which was serum- and epidermal growth factor-free culture medium. All medium were pH adjusted to 7.3-7.4. Each medium was supplied with dimethyl sulfoxide to a final concentration of 0.5%
10
and with 70% EtOH to a final concentration of 0.1% so that the conditions were the same as in the transport experiments (see section 3.7). For comparison, medium without DMSO and 70% EtOH as well as untreated differentiated cells were examined.
3.4 Chemicals and solubility Chemicals suggested to be BCRP-substrates were used: albendazole sulfoxide (Dr Ehrenstorfer GmbH, Augsburg, Germany), an anti-parasitic drug, and genistein (Gibco, Invitrogen, Carlsbad, CA, USA), a soybean isoflavone. Ko143 (Sigma-Aldrich, St Louis, MO, USA) was used as specific BCRP-inhibitor. The chemicals were dissolved in dimethyl sulfoxide (DMSO) (Sigma, St Louis, MO, USA). Mitoxantrone (Sigma-Aldrich, St Louis, MO, USA), a known BCRP substrate, was dissolved in 70% EtOH.
Despite the chemicals’ solubility in DMSO and EtOH, chemicals might precipitate after dilution in experimental medium and thereby not be accessible for BCRP transport in the experiments. Therefore, a precipitation test was carried out in 96-well plate for albendazole sulfoxide/genistein/Ko143-mitoxantrone mixture in either HBSS with 10 mM HEPES or HC11 basal medium at chemicals concentrations 175 µM, 100 µM, 50 µM, 25 µM (genistein was not tested at the highest concentration) with 1 µM mitoxantrone. Ko143 was tested at 10 µM. The final concentration of DMSO was 0.5%. The mixtures were incubated for 2-3 h followed by microscope examination.
3.5 Cell membrane damage assay Since BCRP is a transmembrane transporter, intact cell membrane is crucial for the function of BCRP. Leakage of the intracellular enzyme lactate dehydrogenase (LDH) into the medium was used for detection of membrane damage of the differentiated cells. The enzyme LDH catalyses the reversible reaction:
pyruvate + NADH + H+ ↔ lactate + NAD+ + H2 . NADH excite light at 340 nm. In the assay, the decrease in absorbance over time was proportional to the LDH level in the medium and thereby the level of membrane damage.
After two hours chemical exposure of the differentiated cells, samples were taken for cell membrane damage assay. The assay took place in a 96-well plate. A volume of 195 µL NADH-solution (9.3 mL Tris-HCl buffer 0.2 mM mixed with 0.35 mL NADH 6.6 mM) was added to each well. Samples in duplicate (30 µL) were added and the plate was incubated at room temperature for 20 minutes followed by incubation at 25 ºC for 5 minutes. Na-pyruvate solution (15 µL, 30 mM/well) was added and absorbance was measured at 340 nm in five repeated measurements in a Victor2 1420 multilabel counter (Perkin Elmer, Wellesley, USA). Lysed cells were used as positive control and medium from untreated cells were used as negative control of the method. LDH in Units/mL was calculated per well as following:
LDH (U/mL) = ΔAbs per minute / (0.003 × 0.1 × lightpath (cm)).
Data was expressed as relative to control. If needed, the LDH was corrected for total protein content (see section 3.9).
11
3.6 Evaluation of DMSO concentration The DMSO concentration may affect the function of BCRP. Mitoxantrone transport in 0%, 0.1%, 0.25% and 0.5% DMSO was investigated according to method described in section 3.7.1.
3.7 Transport assay with 3H-mitoxantrone In vitro transport of 3H-mitoxantrone in the presence of chemicals (albendazole sulfoxide or genistein) was carried out in 6-, 12- or 24-well plates at 37 ºC in triplicate. 3H-labelled mitoxantrone, ~24000 DPM/mL (specific radioactivity 12.7 Ci/mmol) was used as a tracer (Moravek Biochemicals, Brea, CA, USA) in a 1 µM mitoxantrone mixture. As a control of BCRP transport, the BCRP substrate mitoxantrone (1 µM) was used. As positive control of specific BCRP transport, the inhibitor Ko143 at 2 or 10 µM, was used. Medium added onto the cells were preheated to 37 ºC. When 6-well plates were used, the cells were incubated in 3 mL medium/well and washed with 6 mL/well. When 12-well plates were used, the cells were incubated in 1.2 mL medium/well and washed with 2.4 mL/well. When 24-well plates were used, the cells were incubated in 0.6 mL medium/well and washed with 1.2 mL/well.
3.7.1 Accumulation assay with 3H-mitoxantrone
The differentiation medium was aspired from the differentiated cells and the cells were washed with HC11 basal medium. The cells were pre-incubated with chemicals diluted in HC11 basal medium (without mitoxantrone) for 1 hour at 37 ºC. After the pre-incubation, the medium were aspired and mitoxantrone mixed with chemicals diluted in HC11 basal medium was added onto the cells followed by 1 h incubation at 37 ºC. All cellular reactions were stopped by placing the plate on ice. An aliquot, 100 µL/well, was taken to LDH assay (see section 3.5) and 1 mL/well was taken to radioactivity measurement in the secrete. Remaining medium in the wells was aspired and the cells were washed with ice-cold HC11 basal medium and lysed by adding 1 mL ice-cold MilliQ-H2O and pipetting up and down. An aliquot of 200 µL of the lysate was taken for protein determination (see section 3.9) and 800 µL was taken for radioactivity measurement. The aliquots for radioactivity measurements was diluted in10 mL scintillation liquid Ultima Gold (Chemical Instruments AB, Lidingö, Sweden), vortexed and analyzed in a 1900 CA Tri-Carb® Liquid Scintillation Analyzer (Packard Instruments, Perkin Elmer, Wellesley, USA). The radioactive sample was kept in darkness. Radioactivity was measured for 3 minutes per sample and expressed as DPM (disintegration per minute). The data was corrected for protein content and accumulation of mitoxantrone in the cells co-exposed to albendazole sulfoxide or genistein was expressed as percentage of the control. In the liquid scintillator, HC11 basal medium was used as blank sample.
3.7.2 Secretion assay with 3H-mitoxantrone
The differentiation medium was aspired from the differentiated cells and the cells were washed with experimental medium: HBSS or HC11 basal medium (see section 3.3). The cells were loaded with mitoxantrone for 1 hour at 37 ºC. Thereafter, the cells were washed with experimental medium and exposed to chemicals diluted in experimental medium (without mitoxantrone) for 1 hour at 37 ºC. The plate was placed on ice and treated as described in section 3.7.1. The mitoxantrone transport in the cells co-exposed to albendazole sulfoxide or genistein was expressed as percentage of the control.
12
3.8 Transport assay with albendazole sulfoxide, followed by HPLC-MS/MS analysis
3.8.1 Secretion assay in combination with HPLC-MS/MS analysis
In vitro transport of albendazole sulfoxide was carried out in 24-well plates at 37 ºC in triplicate. The differentiation medium was aspired from the differentiated cells and the cells were washed with 1.2 mL HC11 basal medium. The cells were loaded with 0.6 mL albendazole sulfoxide (0.5, 2.5, 5, 25 and 100 µM) for 1 hour at 37 ºC. Thereafter, the cells were washed with 1.2 mL HC11 basal medium and exposed to 0.6 mL 10 µM Ko143 or pure HC11 basal medium for 1 hour at 37 ºC. All cellular reactions were stopped by placing the plate on ice. An aliquot, 100 µL/well, was taken to LDH assay (see section 3.5) and 0.5 mL was taken to HPLC-MS/MS analysis of albendazole sulfoxide in the secrete. The cells were washed with ice-cold HC11 basal medium and lysed by adding 1 mL ice-cold MilliQ-H2O and pipetting up and down. An aliquot of 200 µL of the lysate was taken to protein determination (see section 3.9)
3.8.2. Sample preparation prior to HPLC-MS/MS analysis
The samples were diluted in buffered Milli-Q H2O pH 5, and 100 µL internal standard solution, 5 ng/mL methanol, was added to 5.0 mL sample. The samples were mixed and filtrated through 0.2 µm syringe filters and collected in 6 mL clear screw-cap vials (Agilent Technologies) and analysed by HPLC-MS/MS. Internal standard was a mixture of four pesticides as described in Jansson and Kreuger (2010).
3.8.3 HPLC-MS/MS analysis
HPLC-MS-MS analysis was performed on a 1200SL HPLC system (Agilent Technologies, Santa Clara, CA, USA) coupled to an Agilent G6410A triple-quadrupole mass spectrometer operating in positive ionisation mode (ES(+)). The system was controlled by MassHunter software. The HPLC parameters were set and analyses performed according to Jansson and Kreuger (2010). A standard curve was prepared in seven steps in the range from 2 ng/L to 1000 ng/L.
3.9 Protein determination with the BCA method To adjust the results from transport assay, protein concentration was determinate in the cell lysate. A standard curve was prepared of protein standard serum albumin (BSA) (Sigma-Aldrich, St Louis, MO, USA), in MilliQ-H2O in five concentrations from 0.0625 mg/mL to 1 mg/mL. To a volume of 100 µL lysate sample (in duplicate) or standard (in duplicate), 100 µL reagent (bicinchoninic acid solution and copper(II) sulphate solution, 49:1, v:v) (Sigma-Aldrich, St Louis, MO, USA) was added in a 96-well plate. The plate was incubated for 30 minutes at 37ºC, followed by measurement of absorbance at 570 nm. Protein concentrations in the samples were calculated from the standard curve, where absorbance was plotted against protein concentration.
3.10 BCRP gene expression in Staphylococcus aureus S. aureus, strain Aldo 270.2, which was isolated from a cow in a population with clinical mastitis, was used in this study. The bacteria was cultured in 10 mL Nutrient broth (SVA, Sweden) for 6 hours at 37 ºC. The bacteria concentration was determined by serially diluting (100-fold, seven steps) the bacterial culture, plating 1 µL of each dilution on blood agar plates
13
and incubating the plates over night at 37 ºC. Colonies were counted and colony-forming units per millilitre (CFU/mL) was calculated.
The bacterial culture (approximately 3 ×10⁹ CFU/mL) was spinned down, the supernatant discarded and the pellet lysed in 2 mL RA1 buffer with 1% β-mercaptoethanol. Total RNA was isolated and quantified (in quadruplicate) as described in 3.12.1 and 3.12.2 and BCRP gene expression was amplified and quantified (in quadruplicate) using murine BCRP primers as described in 3.12.3. An amount of 30 ng isolated RNA was taken to BCRP gene amplification and quantification.
3.11 Infection with S. aureus
3.11.1 Preparation of the bacterial strain
The S. aureus strain Aldo 270.2 was used for bacterial infection of the HC11 cells. Prior to the infection, bacteria were thawed and grown on bovine blood agar with esculin over night at 37 ºC. Bacteria (1 µL, corresponding to approximately 109 CFU) were resuspended in gentamycin-free HC11 basal medium and diluted to a concentration of ~106 CFU/mL, the infection solution. The bacteria concentration was determined by serially diluting (10-fold, five steps) the suspension, plating 1 µL of each dilution on blood agar plates and incubating the plates over night at 37 ºC. Colonies were counted and CFU/mL was calculated.
3.11.2 Infection assay
HC11 cells grown in 6-well plates were used. Two samples (infected and uninfected) were for gene expression analyses and three samples (infected and uninfected) were for determination of level of intracellular bacterial infection. Two samples undifferentiated and uninfected were for gene expression analyses.
Approximate 20 hours prior to the infection, the differentiation medium was changed to differentiation medium without gentamycin to prevent killing the bacteria. The differentiation medium without gentamycin was aspired and 3 mL gentamycin-free HC11 basal medium (uninfected) or 3 mL infection solution (infected) was added to the samples followed by 2 hours incubation at 37 ºC in 5% CO2. The medium was aspired and the cells washed two times with HBSS (5 mL/time) and then incubated in 3 mL HC11 basal medium containing 100 µg/mL gentamycin for 5 hours at 37 ºC in 5% CO2. An aliquot (200µL) of the medium was taken to LDH assay (see section 3.5). The rest of the medium was aspired and the cells were washed two times with HBSS (5 mL/time). Samples (infected and uninfected) for gene expression analyses were lysed with 300 µL RA1 buffer containing 1% β-mercaptoethanol, vortexed and directly transferred to -20 ºC prior to RNA isolation and quantification as described in section 3.12. The samples (infected and uninfected) for determination of protein content and intracellular bacterial infection were lysed with 1 mL ice-cold MilliQ-H2O and collected by using a Pasteur pipette. Total protein content was determined with the BCA method described in section 3.9. CFU/mL in cell lysate was determined by serially diluting (10-fold, five steps) the lysate in gentamycin-free HC11 basal medium and plating on blood agar, and incubating overnight at 37 ºC. As positive control of bacterial growth in cell lysate, 1 µL of infection solution was added to 100 µL cell lysate from uninfected cells, plated on blood agar, and incubated overnight.
3.11.3 Accumulation assay with 3H-mitoxantrone
Directly after infection with S. aureus (as described in section 3.11.2), accumulation assay with 3H-mitoxantrone was performed with uninfected cells and infected cells treated with 1
14
µM mitoxantrone with or without 10 µM Ko143 in 0.1% DMSO as described in section 3.7.1. Triplicate samples were used.
3.12 RNA isolation and quantification
3.12.1 Isolation of total RNA
Total RNA was isolated from lysed sample with NucleoSpin® RNA II kit (Macherey-Nagel, Düren, Germany) according to protocol. Briefly, cells were lysed with RA1 buffer supple-mented with 1% β-mercaptoethanol and thereafter nucleotides were precipitated by adding 70% EtOH. Lysate was loaded on the column filter and centrifuge. By adding membrane desalting buffer and centrifuge, salts was removed which facilitate DNA digestion. DNA was enzymatic digested for 15 minutes at room temperature followed by three washing steps. Finally, pure RNA was eluted by adding RNase free water (60 µL) to the column and centrifuge.
3.12.2 Quantification of total RNA
Total amount of isolated RNA was fluorometrically determined by Quant-iT™ RiboGreen® RNA assay (Molecular Probes, Invitrogen, Eugene, USA) according to protocol. RNA sample was diluted in MilliQ water and loaded in triplicate on a 96-well plate, 100 µL per well. 16S and 23S ribosomal RNA standards were prepared in TE-buffer in five concentrations (0, 20, 100, 500 and 1000 ng/mL) and loaded in duplicates on the 96-well plate, 100 µL per well. Fluorescence reagent were diluted in TE buffer and 100 µL was added to each well (0.5 µL fluorescence reagent per well) and fluorescence was measured in a Victor2 1420 multilabel counter (Perkin Elmer, Wellesley, USA). Total RNA concentration was calculated from the standard curve. In the standard curve, fluorescence was plotted against RNA concentration.
3.12.3 Quantification of BCRP and β-casein gene expression
BCRP and β-casein genes were amplified and quantified by real time reverse transcription-polymerase chain reaction (real time RT-PCR) in a Rotor-Gene 3000 (Corbett life science, Sydney, Australia). SYBR®Green was used as fluorescence dye to quantify gene conc-entrations after each amplification cycle. A final melt curve analysis in the end of the PCR program was performed to verify correct gene amplification.
To each PCR reaction, 12.5 µL 2× Mastermix (QuantiTect SYBR®Green (Qiagen, Hilden, Germany)), 2 µL murine forward primer 5 µM (final concentration 0.4 µM), 2 µL murine reverse primer 5 µM (final concentration 0.4 µM), 0.25 µL enzyme mix (QuantiTect RT), isolated RNA sample (template) and water to appropriate RNA concentration in 8.25 µL, were mixed. The RNA concentrations (300 ng) were the same in all samples. Non-template control and positive control were included in every PCR run. For BCRP and β-casein gene expression, forward and reverse primers were of murine origin and purchased from CyberGene AB (Huddinge, Sweden). For primer sequences see table 1. The PCR reactions were prepared on ice. The PCR program was: 30 min at 50 ºC, 15 min at 95 ºC, 45 repeated cycling (60 sec at 94 ºC, 60 sec at 55 ºC, 45 sec at 68 ºC), 7 min at 68 ºC and final melt curve analysis 50-99 ºC. Relative gene expression was determined by the threshold cycle CT (the PCR cycle in which gene amount was the same in all samples) and analysed using the 2-ΔCt method according to Livak and Schmittgen (2001). ΔCT = CT of sample - mean CT of control.
15
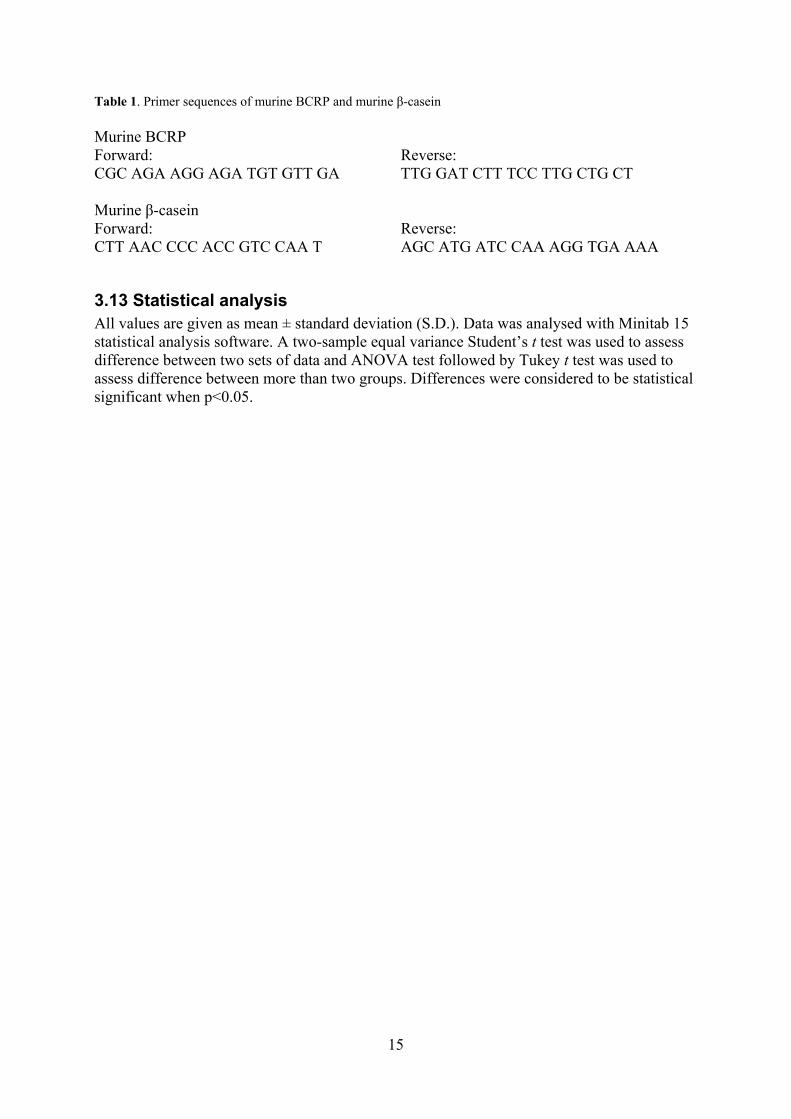
Table 1. Primer sequences of murine BCRP and murine β-casein Murine BCRP Forward: Reverse: CGC AGA AGG AGA TGT GTT GA TTG GAT CTT TCC TTG CTG CT Murine β-casein Forward: Reverse: CTT AAC CCC ACC GTC CAA T AGC ATG ATC CAA AGG TGA AAA
3.13 Statistical analysis All values are given as mean ± standard deviation (S.D.). Data was analysed with Minitab 15 statistical analysis software. A two-sample equal variance Student’s t test was used to assess difference between two sets of data and ANOVA test followed by Tukey t test was used to assess difference between more than two groups. Differences were considered to be statistical significant when p<0.05.
16
4. Results
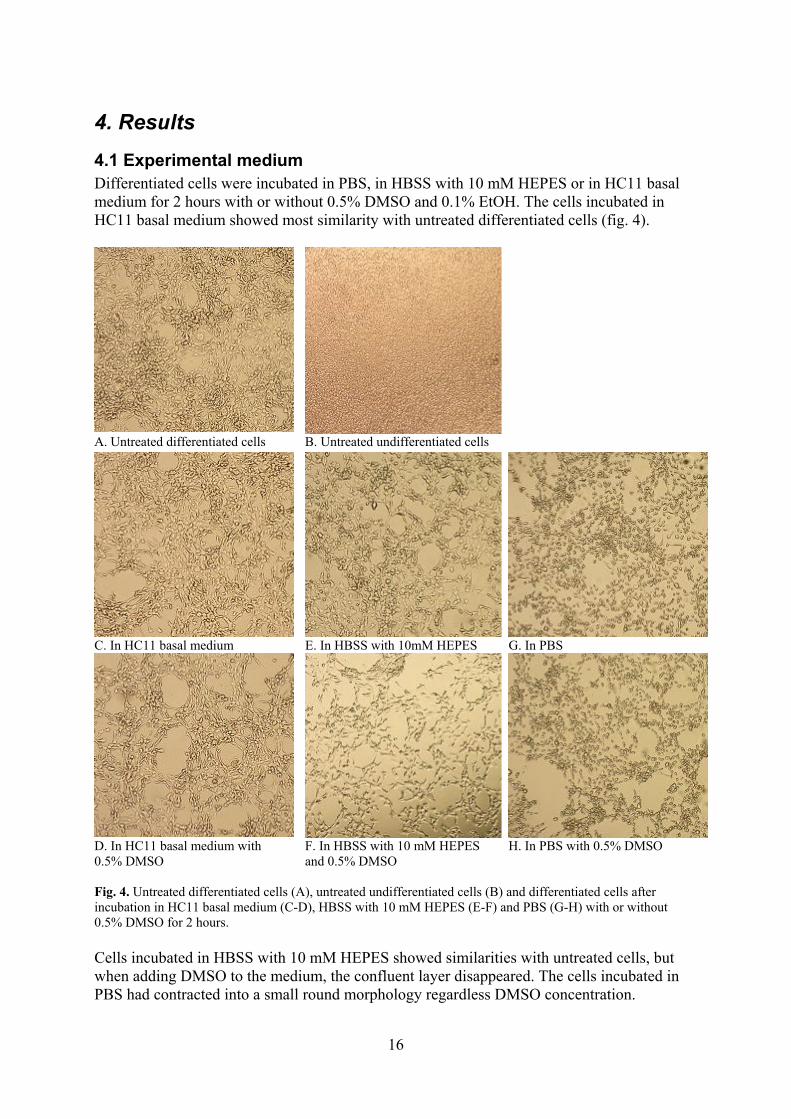
4.1 Experimental medium Differentiated cells were incubated in PBS, in HBSS with 10 mM HEPES or in HC11 basal medium for 2 hours with or without 0.5% DMSO and 0.1% EtOH. The cells incubated in HC11 basal medium showed most similarity with untreated differentiated cells (fig. 4).
A. Untreated differentiated cells B. Untreated undifferentiated cells
C. In HC11 basal medium E. In HBSS with 10mM HEPES G. In PBS
D. In HC11 basal medium with 0.5% DMSO
F. In HBSS with 10 mM HEPES and 0.5% DMSO
H. In PBS with 0.5% DMSO
Fig. 4. Untreated differentiated cells (A), untreated undifferentiated cells (B) and differentiated cells after incubation in HC11 basal medium (C-D), HBSS with 10 mM HEPES (E-F) and PBS (G-H) with or without 0.5% DMSO for 2 hours. Cells incubated in HBSS with 10 mM HEPES showed similarities with untreated cells, but when adding DMSO to the medium, the confluent layer disappeared. The cells incubated in PBS had contracted into a small round morphology regardless DMSO concentration.
17
However, LDH analysis showed no membrane damage irrespectively of medium (table 2). Notify the confluent monolayer in undifferentiated cells (fig. 4B).
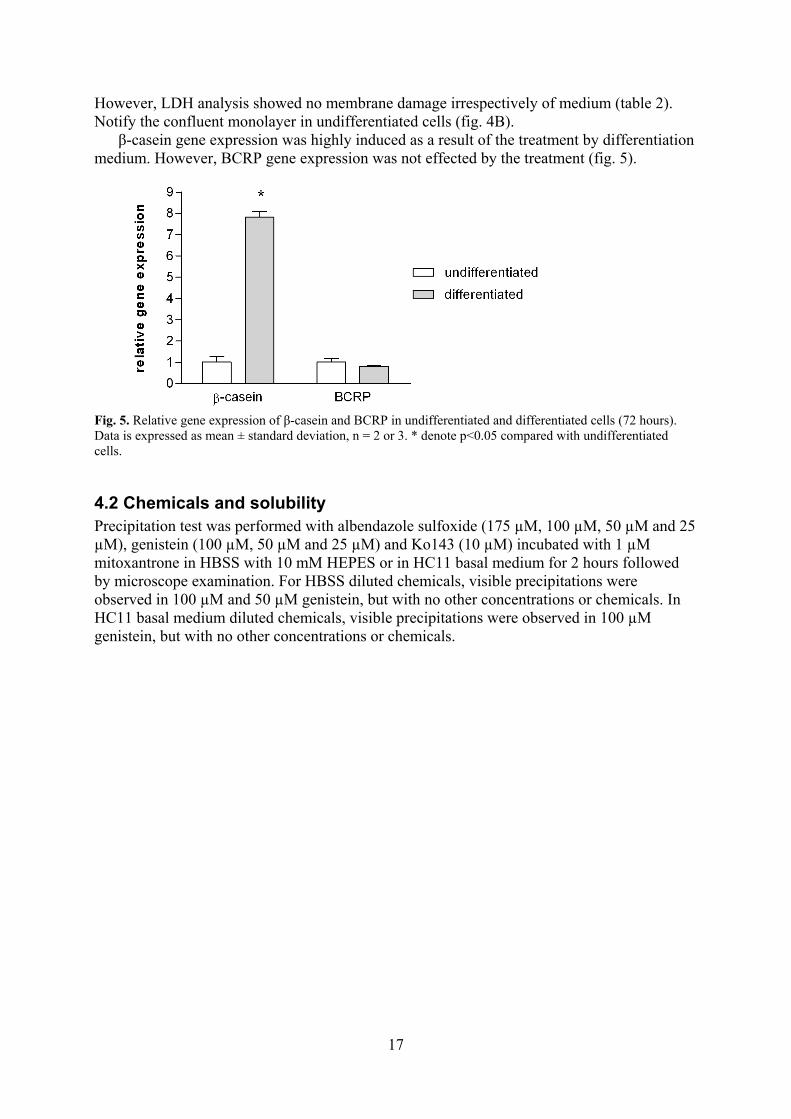
β-casein gene expression was highly induced as a result of the treatment by differentiation medium. However, BCRP gene expression was not effected by the treatment (fig. 5).
Fig. 5. Relative gene expression of β-casein and BCRP in undifferentiated and differentiated cells (72 hours). Data is expressed as mean ± standard deviation, n = 2 or 3. * denote p<0.05 compared with undifferentiated cells.
4.2 Chemicals and solubility Precipitation test was performed with albendazole sulfoxide (175 µM, 100 µM, 50 µM and 25 µM), genistein (100 µM, 50 µM and 25 µM) and Ko143 (10 µM) incubated with 1 µM mitoxantrone in HBSS with 10 mM HEPES or in HC11 basal medium for 2 hours followed by microscope examination. For HBSS diluted chemicals, visible precipitations were observed in 100 µM and 50 µM genistein, but with no other concentrations or chemicals. In HC11 basal medium diluted chemicals, visible precipitations were observed in 100 µM genistein, but with no other concentrations or chemicals.
18
4.3 Cell membrane damage assay Detection of LDH leakage as a measurement of cell membrane damage was used to assess cell toxicity. The LDH values from cells incubated in different medium with or without chemicals are shown in table 2. Despite no detection of membrane leakage, microscopic examination of the cells revealed morphological changes in the cell monolayers compared to untreated cells (compare fig. 4 with table 2). Table 2. LDH analyses of medium after cell incubation in 12-wells plates in different medium for 2 hours. n = 2 Cell incubation medium LDH (U/mL), average ± S.D.HC11 basal medium (0% DMSO) 26.6 ± 9.5 HC11 basal medium with 0.5% DMSO 26.9 ± 6.8 HC11 basal medium with 2 µM Ko143$ 20.0 ± 6.5 HC11 basal medium with 175 µM ABSOX$ 27.0 ± 5.6 HBSS with 10 mM HEPES (0% DMSO) 16.2 ± 1.1 HBSS with 10 mM HEPES and 0.5% DMSO 12.8 ± 6.4 HBSS with 10 mM HEPES and 2 µM Ko143$ 22.5 ± 0.3 HBSS with 10 mM HEPES and 175 µM ABSOX$ 115.0 ± 25.0 PBS (0% DMSO) 16.7 ± 1.5 PBS with 0.5% DMSO 15.0 ± 2.0 PBS with 2 µM Ko143$ 27.5 ± 1.4 PBS with 175 µM ABSOX$ 22.6 ± 1.0 Untreated cells (n = 11) 18.5 ± 5.7 Cell lysate (n = 10) 168.4 ± 25.4 ABSOX = albendazole sulfoxide S.D. = standard deviation $ in 0.5% DMSO
Based on morphology examination and membrane leakages analyses, HC11 basal medium was chosen as experimental medium.
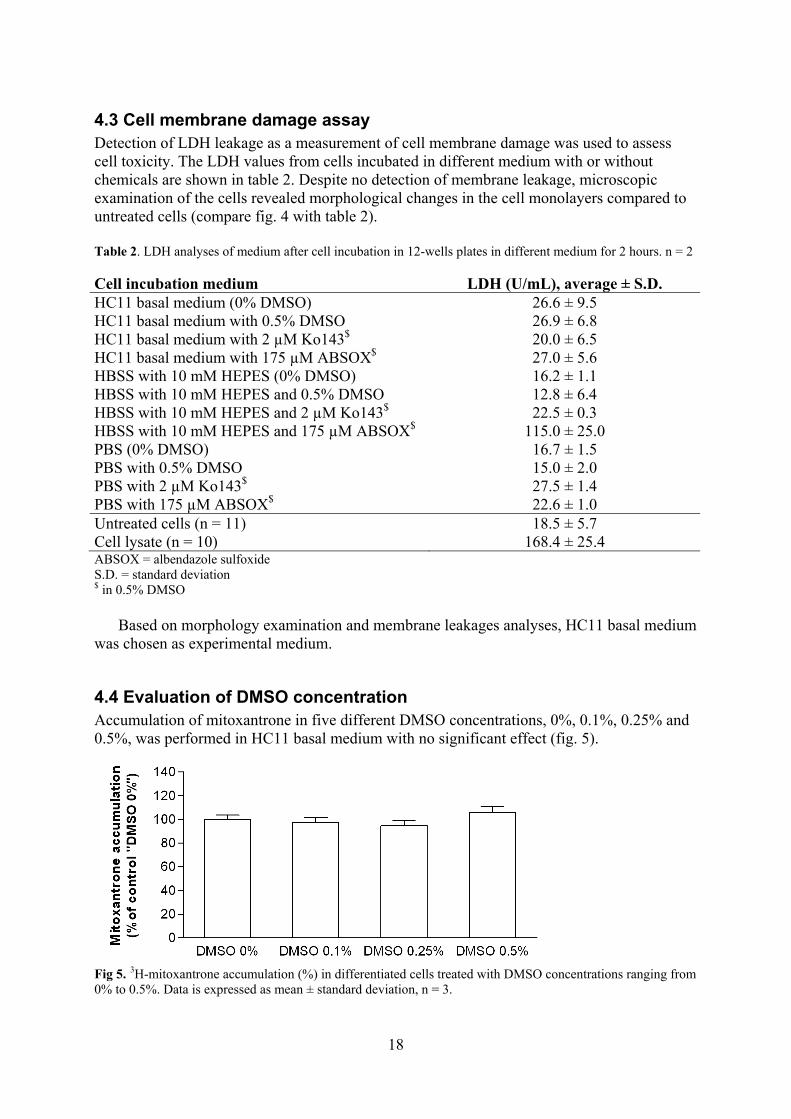
4.4 Evaluation of DMSO concentration Accumulation of mitoxantrone in five different DMSO concentrations, 0%, 0.1%, 0.25% and 0.5%, was performed in HC11 basal medium with no significant effect (fig. 5).
Fig 5. 3H-mitoxantrone accumulation (%) in differentiated cells treated with DMSO concentrations ranging from 0% to 0.5%. Data is expressed as mean ± standard deviation, n = 3.
19
4.5 Transport assay
4.5.1 Accumulation assay with 3H-mitoxantrone
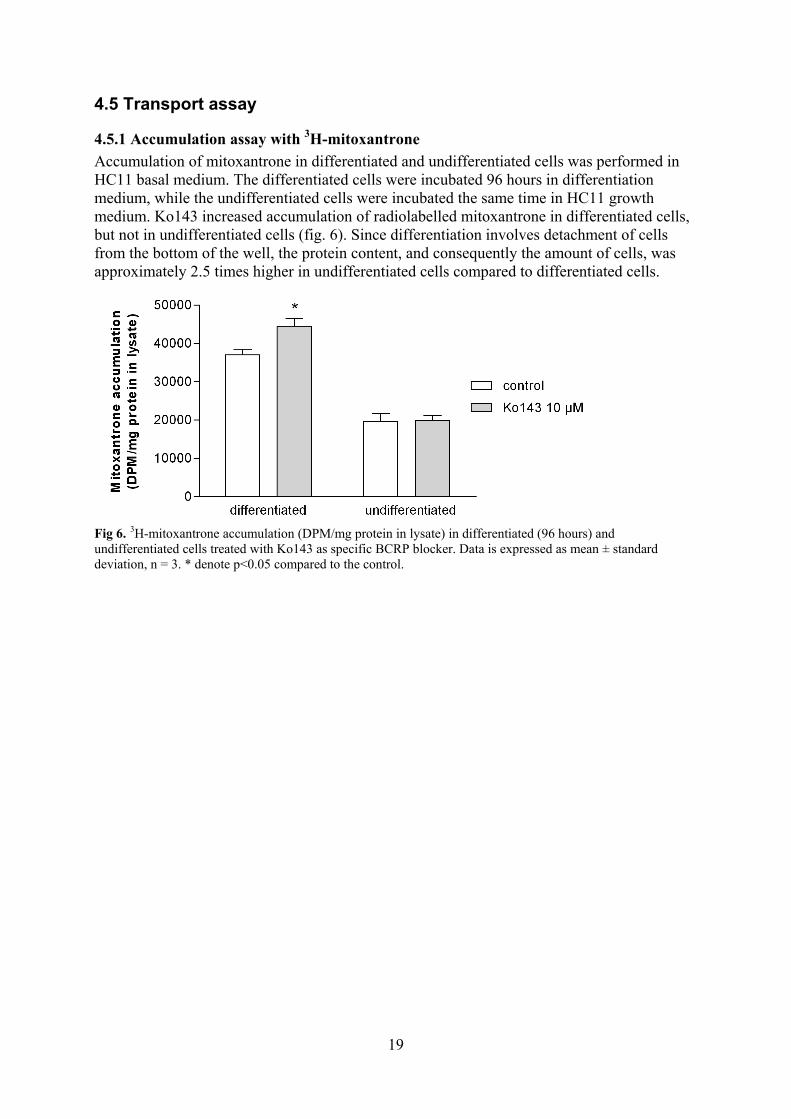
Accumulation of mitoxantrone in differentiated and undifferentiated cells was performed in HC11 basal medium. The differentiated cells were incubated 96 hours in differentiation medium, while the undifferentiated cells were incubated the same time in HC11 growth medium. Ko143 increased accumulation of radiolabelled mitoxantrone in differentiated cells, but not in undifferentiated cells (fig. 6). Since differentiation involves detachment of cells from the bottom of the well, the protein content, and consequently the amount of cells, was approximately 2.5 times higher in undifferentiated cells compared to differentiated cells.
Fig 6. 3H-mitoxantrone accumulation (DPM/mg protein in lysate) in differentiated (96 hours) and undifferentiated cells treated with Ko143 as specific BCRP blocker. Data is expressed as mean ± standard deviation, n = 3. * denote p<0.05 compared to the control.
20
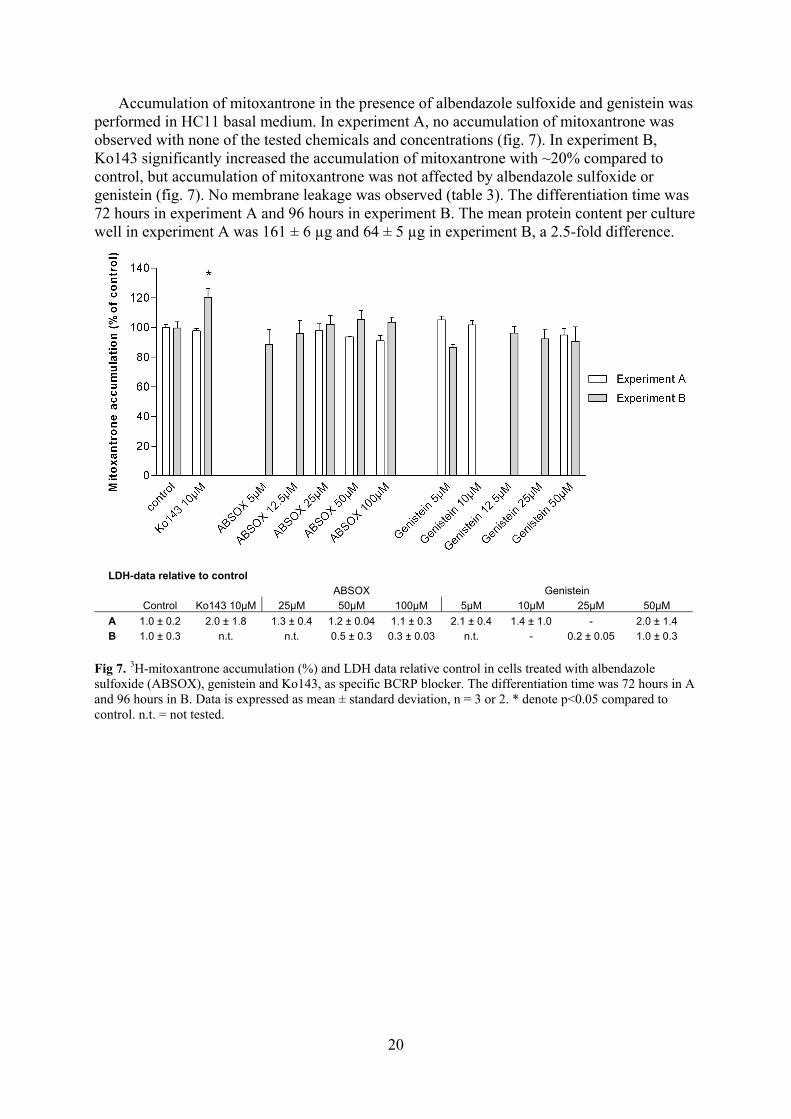
Accumulation of mitoxantrone in the presence of albendazole sulfoxide and genistein was performed in HC11 basal medium. In experiment A, no accumulation of mitoxantrone was observed with none of the tested chemicals and concentrations (fig. 7). In experiment B, Ko143 significantly increased the accumulation of mitoxantrone with ~20% compared to control, but accumulation of mitoxantrone was not affected by albendazole sulfoxide or genistein (fig. 7). No membrane leakage was observed (table 3). The differentiation time was 72 hours in experiment A and 96 hours in experiment B. The mean protein content per culture well in experiment A was 161 ± 6 µg and 64 ± 5 µg in experiment B, a 2.5-fold difference.
LDH-data relative to control
ABSOX Genistein
Control Ko143 10µM 25µM 50µM 100µM 5µM 10µM 25µM 50µM
A 1.0 ± 0.2 2.0 ± 1.8 1.3 ± 0.4 1.2 ± 0.04 1.1 ± 0.3 2.1 ± 0.4 1.4 ± 1.0 - 2.0 ± 1.4
B 1.0 ± 0.3 n.t. n.t. 0.5 ± 0.3 0.3 ± 0.03 n.t. - 0.2 ± 0.05 1.0 ± 0.3
Fig 7. 3H-mitoxantrone accumulation (%) and LDH data relative control in cells treated with albendazole sulfoxide (ABSOX), genistein and Ko143, as specific BCRP blocker. The differentiation time was 72 hours in A and 96 hours in B. Data is expressed as mean ± standard deviation, n = 3 or 2. * denote p<0.05 compared to control. n.t. = not tested.
21
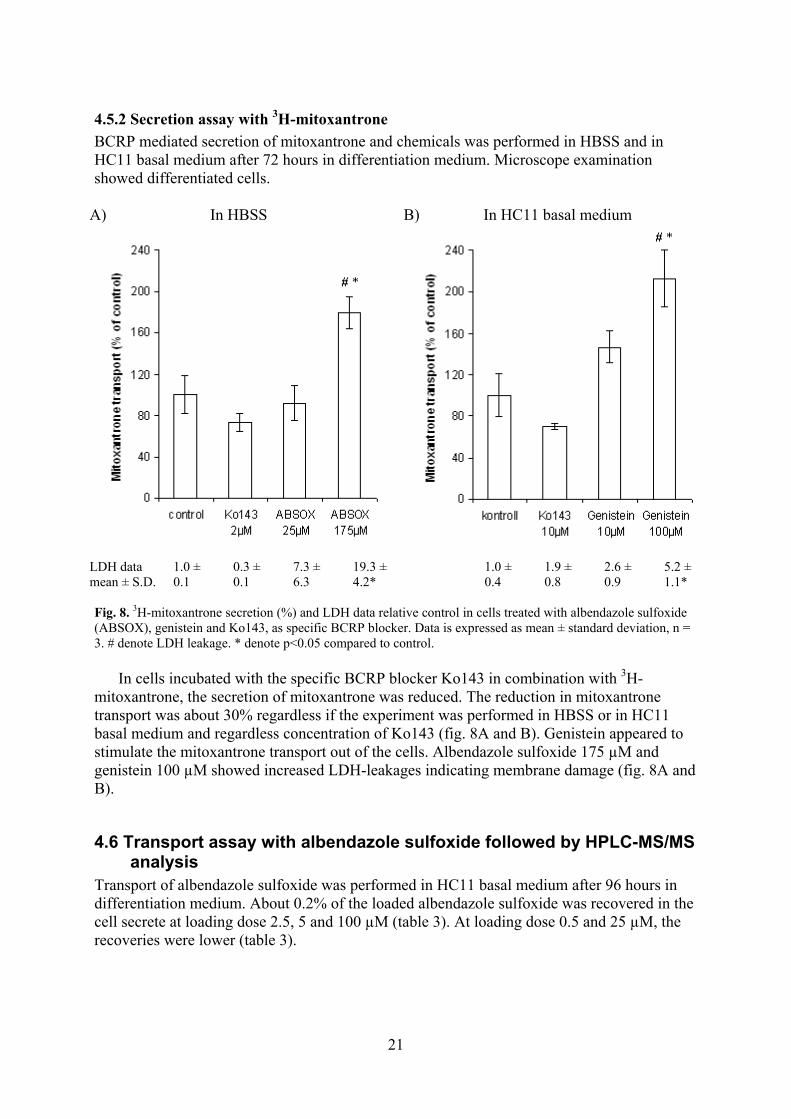
4.5.2 Secretion assay with 3H-mitoxantrone
BCRP mediated secretion of mitoxantrone and chemicals was performed in HBSS and in HC11 basal medium after 72 hours in differentiation medium. Microscope examination showed differentiated cells.
A) In HBSS B) In HC11 basal medium
LDH data mean ± S.D.
1.0 ± 0.1
0.3 ± 0.1
7.3 ± 6.3
19.3 ± 4.2*
1.0 ± 0.4
1.9 ± 0.8
2.6 ± 0.9
5.2 ± 1.1*
Fig. 8. 3H-mitoxantrone secretion (%) and LDH data relative control in cells treated with albendazole sulfoxide (ABSOX), genistein and Ko143, as specific BCRP blocker. Data is expressed as mean ± standard deviation, n = 3. # denote LDH leakage. * denote p<0.05 compared to control.
In cells incubated with the specific BCRP blocker Ko143 in combination with 3H-mitoxantrone, the secretion of mitoxantrone was reduced. The reduction in mitoxantrone transport was about 30% regardless if the experiment was performed in HBSS or in HC11 basal medium and regardless concentration of Ko143 (fig. 8A and B). Genistein appeared to stimulate the mitoxantrone transport out of the cells. Albendazole sulfoxide 175 µM and genistein 100 µM showed increased LDH-leakages indicating membrane damage (fig. 8A and B).
4.6 Transport assay with albendazole sulfoxide followed by HPLC-MS/MS analysis
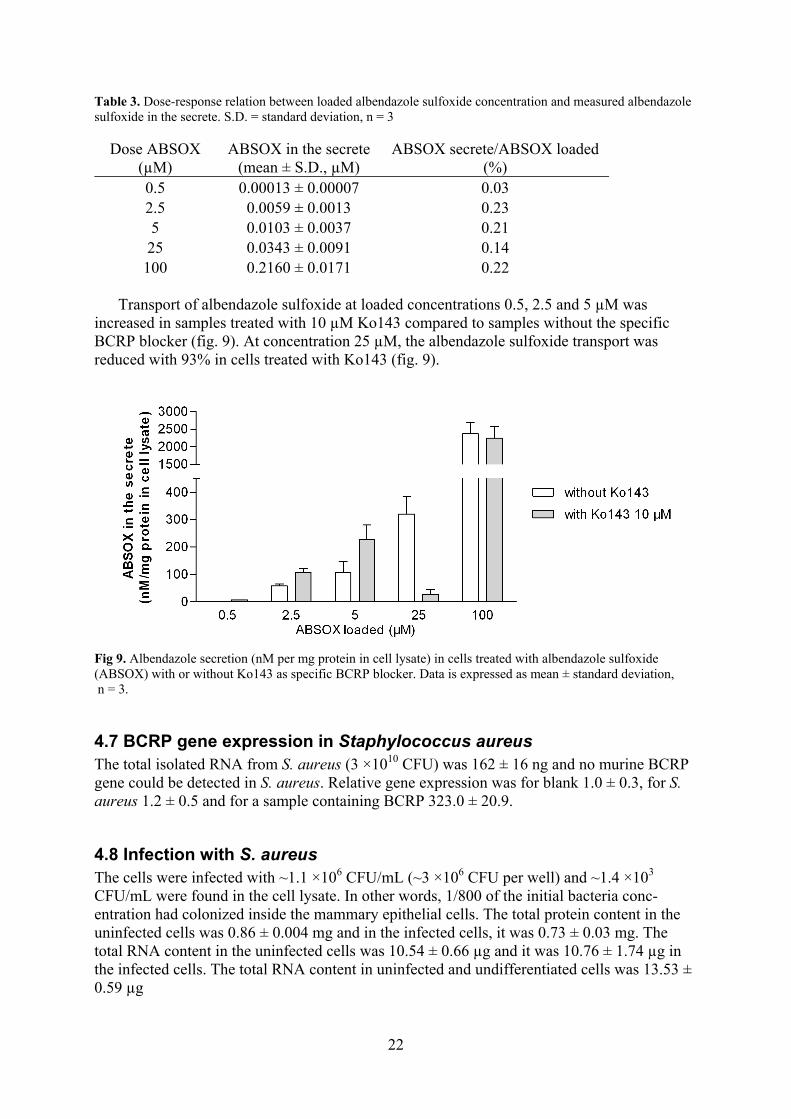
Transport of albendazole sulfoxide was performed in HC11 basal medium after 96 hours in differentiation medium. About 0.2% of the loaded albendazole sulfoxide was recovered in the cell secrete at loading dose 2.5, 5 and 100 µM (table 3). At loading dose 0.5 and 25 µM, the recoveries were lower (table 3).
22
Table 3. Dose-response relation between loaded albendazole sulfoxide concentration and measured albendazole sulfoxide in the secrete. S.D. = standard deviation, n = 3
Dose ABSOX (µM)
ABSOX in the secrete (mean ± S.D., µM)
ABSOX secrete/ABSOX loaded (%)
0.5 0.00013 ± 0.00007 0.03 2.5 0.0059 ± 0.0013 0.23 5 0.0103 ± 0.0037 0.21
25 0.0343 ± 0.0091 0.14 100 0.2160 ± 0.0171 0.22
Transport of albendazole sulfoxide at loaded concentrations 0.5, 2.5 and 5 µM was
increased in samples treated with 10 µM Ko143 compared to samples without the specific BCRP blocker (fig. 9). At concentration 25 µM, the albendazole sulfoxide transport was reduced with 93% in cells treated with Ko143 (fig. 9).
Fig 9. Albendazole secretion (nM per mg protein in cell lysate) in cells treated with albendazole sulfoxide (ABSOX) with or without Ko143 as specific BCRP blocker. Data is expressed as mean ± standard deviation, n = 3.
4.7 BCRP gene expression in Staphylococcus aureus The total isolated RNA from S. aureus (3 ×10¹⁰ CFU) was 162 ± 16 ng and no murine BCRP gene could be detected in S. aureus. Relative gene expression was for blank 1.0 ± 0.3, for S. aureus 1.2 ± 0.5 and for a sample containing BCRP 323.0 ± 20.9.
4.8 Infection with S. aureus The cells were infected with ~1.1 ×10⁶ CFU/mL (~3 ×10⁶ CFU per well) and ~1.4 ×10³ CFU/mL were found in the cell lysate. In other words, 1/800 of the initial bacteria conc-entration had colonized inside the mammary epithelial cells. The total protein content in the uninfected cells was 0.86 ± 0.004 mg and in the infected cells, it was 0.73 ± 0.03 mg. The total RNA content in the uninfected cells was 10.54 ± 0.66 µg and it was 10.76 ± 1.74 µg in the infected cells. The total RNA content in uninfected and undifferentiated cells was 13.53 ± 0.59 µg
23
A significantly lower β-casein gene expression in infected than in uninfected cells was observed. However, BCRP gene expression was not effected by the bacteria infection (fig. 10).
Fig 10. Relative gene expression of BCRP and β-casein in differentiated HC11 cells (72 hours) infected with S.aureus. Data is expressed as mean ± standard deviation, n = 3. * denote p<0.05 compared with uninfected cells.
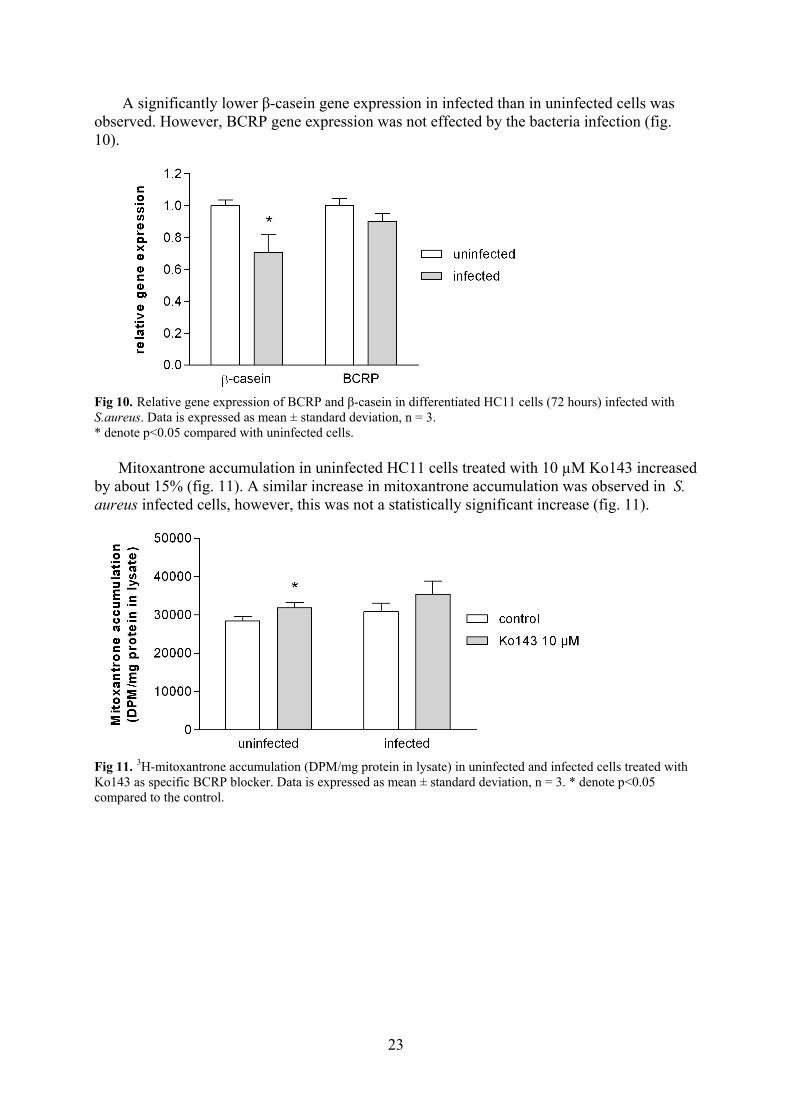
Mitoxantrone accumulation in uninfected HC11 cells treated with 10 µM Ko143 increased by about 15% (fig. 11). A similar increase in mitoxantrone accumulation was observed in S. aureus infected cells, however, this was not a statistically significant increase (fig. 11).
Fig 11. 3H-mitoxantrone accumulation (DPM/mg protein in lysate) in uninfected and infected cells treated with Ko143 as specific BCRP blocker. Data is expressed as mean ± standard deviation, n = 3. * denote p<0.05 compared to the control.
24
5. Discussion In these experiments, an in vitro cell model for secretion of chemicals into milk has been optimised and applied. The experimental conditions have been optimised concerning which experimental medium and DMSO concentration to use. Kelleher and Lönnerdal (2003), who also worked with the HC11 cell line, used HC11 basal medium (growth medium without serum and epidermal growth factor) and in this laboratory, Hank’s balance salt solution (HBSS) has been used previously (Nyström, 2006). Therefore, the effects on cell morphology and membrane damage were investigated with different media. Cells incubated in HC11 basal medium showed most similar morphology with cells not treated with any substances. However, based on the results obtained in the LDH measurements it seemed that HC11 basal medium gave more membrane damage compared to the other two examined media, but the quite large variance in the LDH data gave no statistically significant differences. As the HC11 cells appeared to be most unaffected by the basal medium it was chosen to be the best experimental medium for the cells.
The LDH leakages into the medium were used to detect membrane damage and to assess cell toxicity. Intact cell membrane is crucial to investigate transport by the membrane trans-porter BCRP. On the other hand, this test does not detect viability of the cells, a reason that visible morphology changes were not detectable in the LDH data. Consequently, it was of great importance to make microscopic observations in combination with tests of LDH leakages.
Since DMSO is known to perforate cell membranes, it is suspected that the DMSO concentration could influence the function of BCRP. However, in the conditions used in this project, DMSO concentration had no effect on mitoxantrone transport. Nevertheless, it was preferable to have as low DMSO concentration as possible.
5.1 Differentiation of HC11 cells and gene expression of β-casein and BCRP in normal cells The cells used in this project were derived from a normal mammary gland tissue in mouse. It is a cell line, which is expected to expresses BCRP levels to what can be found in mouse and/or other mammalian in vivo. In contrast to many cell line models used for studies of transport and function of BCRP, the HC11 cell line has no continuous over-expression of BCRP. Instead, it requires differentiation to express BCRP and is, therefore, more similar to mammary gland tissue in vivo where BCRP is upregulated, in cow, mouse and human, during lactation, and down regulated at a non-lactation state. Increased β-casein gene level indicates successful differentiation of the HC11 cells (Ball et al., 1988). We observed a more than seven-fold increased β-casein gene expression after differentiation. Even though, Nyström (2006) investigated the optimal time for maximum differentiation of the HC11 cells to be 72 hours, 96 hours was sometime required to get differentiated cells in my experiments. Differentiation was verified by microscopic examination, where alveolar-like structures in the cell monolayer indicated milk protein secretory phenotype. The total protein amount gave an indication of the status of HC11 cells. The protein content was reduced approximately 2.5 times upon differentiation due to detachment of cells from the bottom of the well when forming alveolar-like structures.
The central dogma of biology is that DNA is transcribed to RNA, which in its turn is translated into protein and modified to a functional protein. However, this is not a straight-forward event and many factors affect the outcome of a functional protein. Jonker et al. (2005) showed an upregulation of BCRP at protein level in lactating mouse mammary gland, but to my knowledge, no one has reported regulation of BCRP at gene level in mammary
25
gland. We could not observe any statistically significant change in gene expression of BCRP upon differentiation despite increased specific BCRP transport. An increased BCRP transport was in principle an indication of an upregulation of the protein level. Compared to β-casein, which is regulated at the transcriptional level, BCRP in HC11 cells seemed to be regulated at the post-transcriptional level. It would be interesting to measure BCRP protein level in the cells by western-blot or liquid chromatography to relate function to amount.
5.2 Transport of chemicals in HC11 cells Two different approaches for studying chemicals transport by BCRP have been used in this project: the accumulation assay and the secretion assay. The accumulation assay with radio-labelled mitoxantrone, has been used in our laboratory previously with satisfactory results. In this approach, cells are co-exposed to a chemical and radiolabelled mitoxantrone, and the accumulation of mitoxantrone inside the cells is related to the BCRP inhibitory potency of the chemical. The second approach, the secretion assay, is designed to mimic chemicals secretion into milk in vivo. It is a new approach in which BCRP substrates are measured in the secrete. As a first step in both approaches, cells take up chemicals through unknown mechanisms, which could both be passive transport due to concentration gradient and active transport by influx proteins. In a second step, mitoxantrone, albendazole sulfoxide or genistein is exported out to the medium. In all experiments, a specific BCRP blocker, Ko143, was used as positive control of the active transport.
As mentioned in section 5.1, differentiated cells are crucial for studies of BCRP specific transport in this cell line. Mitoxantrone transport was partly blocked by 10 µM Ko143 in differentiated cells, but not in undifferentiated cells. Interesting to observe was the doubling of mitoxantrone accumulation in differentiated cells compared to undifferentiated ones. In addition to upregulating BCRP, treatment of HC11 cells with lactogenic hormones could have induced influx protein and consequently increased accumulation of mitoxantrone in these cells.
The specific BCRP-blocker, Ko143, inhibited the mitoxantrone transport by 20-30% regardless if 2 µM or 10 µM was applied. This is quite low inhibition potency compared to results deriving from cell lines over-expressing BCRP (Pulido et al., 2006, Zhang et al., 2004). For examples, 1 µM Ko143 increased the accumulation of 5 µM mitoxantrone in a murine Bcrp1-transduced cell line with 18 times (Pulido et al., 2006) and 10 µM fumitremorgin C (an analogue to Ko143) increased the mitoxantrone accumulation (3 µM) with four times (Zhang et al., 2004). In the HC11 cells, it seemed that the active BCRP meditated transport was approximately one fourth of the total export of mitoxantrone. The remaining transport was probably passive diffusion and conducted through other active transporters.
Genistein and albendazole sulfoxide have been reported to be substrates and/or inhibitors of BCRP in in vitro cell lines over-expressing BCRP and in in vivo. Genistein is both a substrate and an inhibitor of BCRP at concentrations 1-100 µM (Imai et al., 2004, Pulido et al., 2006, Zhang et al., 2004). In these experiments, genistein seemed to stimulate transport of mitoxantrone at concentrations 5 and 10 µM, which was in contrast to observations in other cell lines. Moreover, genistein was not an inhibitor of mitoxantrone transport under the conditions used in the accumulation assay. In the case of albendazole sulfoxide, Merino et al. (2005) reported a moderate inhibition potency of mitoxantrone transport of 7% at albendazole sulfoxide concentration 375 µM and Muenster et al. (2008) could not report any inhibition with the albendazole sulfoxide concentrations tested. On the other hand, the both research groups observed a transport of albendazole sulfoxide by BCRP when the substrate was applied alone. Muenster et al. (2008) suggested separate substrate and inhibitor binding sites
26
in BCRP. Today, little is known about the mechanisms by which substrates and inhibitors interact with BCRP. In line with the above-mentioned results, none of the tested concentrations of albendazole sulfoxide in this project could significantly decrease the transport of mitoxantrone. A dose-response relationship was observed when albendazole sulfoxide itself was transported in the secretion assay; nevertheless, the transport observed was not BCRP-mediated, since Ko143 could not decrease it. The methodology has to be standardized more and more experiments are needed before any conclusions can be stated about the transport of albendazole sulfoxide and genistein in the HC11 cell line.
A BCRP blocker prevents BCRP mediated transport of more potent toxicology active chemicals into milk, which is of health benefit for high milk consumer, but harmful for the mother or the dairy cow. On the other hand, a BCRP blocker may also prevent transport of unknown endogenous substrates, which could effect the maturation, and well-being of the suckling offspring. For BCRP substrate, the food safety is depending on its toxicology activity.
5.3 Infection with S. aureus One of the aims of this project was to investigate whether Staphylococcus aureus infection affects gene expression of BCRP in HC11 cells. S. aureus has several ABC-transporters, which can cause resistance to antibacterial drugs by exporting the drug (Otto and Götz, 2001, Putman et al., 2000). Even though BCRP has not previously been reported to be expressed in S. aureus, it could be there. The same technique used to isolate total RNA and to amplify murine BCRP in HC11 cells was used to isolate RNA and amplify BCRP in S. aureus, however, no murine BCRP was detected.
S. aureus infection of HC11 cells was tested as a cell model of subclinical mastitis. Clinical mastitis causes milk yield losses and deterioration of milk, while subclinical mastitis is not that severe for the cow or the milk production. High gene expression of β-casein in HC11 cells is an indicator of viable cells with normal milk production. It was therefore interesting to observe a statistically significant downregulation of β-casein gene expression in HC11 cells upon S. aureus infection. The cells were probably slightly infected and in a state similar to a subclinical mastitis and in that condition, the gene expression of BCRP was not affected. In addition, accumulation of mitoxantrone was not affected by the infection. More experiments have to be performed before the HC11 cell line can be used as model of subclinical mastitis. As an alternative to study mastitis in vivo, which would involve suffering for the animal, an in vitro model of this disease condition would be of great ethical value.
5.4 Final remarks In contrast to many cell lines used to study transport by BCRP, the HC11 cell line expresses BCRP at levels likely to found in in vivo, which makes it an interesting model for in vitro studies of milk secretion of chemicals. Before the cell model can give reproducible results, the HC11 cell line have to be characterized more, for examples, in regards of BCRP in different-iated cells related to undifferentiated ones. The method has to be standardized more in regards of concentration of Ko143, transport methodology, etc. In the future, it would be interesting to apply the experimental design models on a bovine mammary epithelial cell line, since it is more applicable to consumption milk production. It would also be interesting to perform in vivo experiments of active transport of chemicals into milk.
27
6. Conclusion Only a minor part of the total mitoxantrone transport was mediated by BCRP in the HC11 cell line. Albendazole sulfoxide was exported out of the HC11 cells in a dose-response manner, but this transport was not mediated by BCRP, neither for albendazole sulfoxide nor for genistein. S. aureus infection affected gene expression of β-casein in the HC11 cells, therefore the cell model has a potency to be used as an in vitro model of mastitis. However, gene expression of BCRP was not affected by the infection and transport of mitoxantrone in S. aureus infected cells was similar to the transport in uninfected cells.
7. Acknowledgements I would like to thank my two supervisors at the department of Biomedical Sciences and Veterinary Public Health at SLU, Agneta Oskarsson and Jonas Tallkvist. I would also like to thank Karin Artursson at SVA for valuable help with the infection and Johan Patring at department of Aquatic Sciences and Assessment at SLU for help with the HPLC-MS analysis.
28
8. References Books BORON, W.F. & BOULPAEP, E.L. (2003). Medical physiology. A cellular and molecular
approach. Philadelphia: Saunders. Exam project NYSTRÖM, M. (2006). Development of a cell model for studies of the secretion of
xenobiotics into milk. Exam project. Uppsala: Swedish University of Agricultural Sciences.
Web pages FASS – Home page. [online] (2008-07-17). Available from: http://www.fass.se [2010-10-21]. Figure 2: Oulu University Library – Home page. [online]. 2002. Available from:
http://herkules.oulu.fi/isbn9514269306/html/c357.html [2010-12-13]. WHO Food additives series 25 - The 34th meeting of the Joint FAO/WHO Expert Committee
on Food Additives (JECFA), Geneva, 1990. [online]. Available from: http://www.inchem.org/documents/jecfa/jecmono/v25je02.htm [2010-10-15].
Papers ABDEL-TAWAB, A. M., BRADLEY, M., GHAZALY, E. A., HORTON, J. & EL-
SETOUHY, M. 2009. Albendazole and its metabolites in the breast milk of lactating women following a single oral dose of albendazole. Brit J Clin Pharmaco, 68, 737-742.
ALLEN, J. D., VAN LOEVEZIJN, A., LAKHAI, J. M., VAN DER VALK, M., VAN TELLINGEN, O., REID, G., SCHELLENS, J. H. M., KOOMEN, G. J. & SCHINKEL, A. H. 2002. Potent and specific inhibition of the breast cancer resistance protein multidrug transporter in vitro and in mouse intestine by a novel analogue of fumitremorgin C. Mol Cancer Ther, 1, 417-425.
ALMEIDA, R. A., MATTHEWS, K. R., CIFRIAN, E., GUIDRY, A. J. & OLIVER, S. P. 1996. Staphylococcus aureus invasion of bovine mammary epithelial cells. J Dairy Sci, 79, 1021-1026.
ALVAREZ, A. I., REAL, R., PÉREZ, M., MENDOZA, G., PRIETO, J. G. & MERINO, G. 2010. Modulation of the activity of ABC transporters (P-glycoprotein, MRP2, BCRP) by flavonoids and drug response. J Pharm Sci, 99, 598-617.
AN, G. & MORRIS, M. E. 2010. Effects of single and multiple flavonoids on BCRP-mediated accumulation, cytotoxicity and transport of mitoxantrone in vitro. Pharmaceut Res, 27, 1296-1308.
ANDERSEN, C., WEISBJERG, M. R., HANSEN-MOLLER, J. & SEJRSEN, K. 2009. Effect of forage on the content of phyto-oestrogens in bovine milk. Animal, 3, 617-622.
ANTIGNAC, J. P., CARIOU, R., LE BIZEC, B., CRAVEDI, J. P. & ANDRE, F. 2003. Identification of phytoestrogens in bovine milk using liquid chromatography/electrospray tandem mass spectrometry. Rapid Commun Mass Sp, 17, 1256-1264.
29
BALL, R. K., FRIIS, R. R., SCHOENENBERGER, C. A., DOPPLER, W. & GRONER, B. 1988. Prolactin regulation of beta-casein gene-expression and of a cytosolic 120-kd protein in a cloned mouse mammary epithelial-cell line. Embo J, 7, 2089-2095.
BREITZKA, R. L., SANDRITTER, T. L. & HATZOPOULOS, F. K. 1997. Principles of drug transfer into breast milk and drug disposition in the nursing infant. J Hum Lact, 13, 155-158.
BROUILLETTE, E., GRONDIN, G., SHKRETA, L., LACASSE, P. & TALBOT, B. G. 2003. In vivo and in vitro demonstration that Staphylococcus aureus is an intracellular pathogen in the presence or absence of fibronectin-binding proteins. Microb Pathogenesis, 35, 159-168.
COHEN-ZINDER, M., SEROUSSI, E., LARKIN, D. M., LOOR, J. J., WIND, A. E.-V. D., LEE, J.-H., DRACKLEY, J. K., BAND, M. R., HERNANDEZ, A. G., SHANI, M., LEWIN, H. A., WELLER, J. I. & RON, M. 2005. Identification of a missense mutation in the bovine ABCG2 gene with a major effect on the QTL on chromosome 6 affecting milk yield and composition in Holstein cattle. Genome Res, 15, 936-944.
DANIELSON, K. G., OBORN, C. J., DURBAN, E. M., BUTEL, J. S. & MEDINA, D. 1984. Epithelial mouse mammary cell line exhibiting normal morphogenesis in vivo and functional differentiation in vitro. P Natl Acad Sci USA, 81, 3756-3760.
DAYAN, A. D. 2003. Albendazole, mebendazole and praziquantel. Review of non-clinical toxicity and pharmacokinetics. Acta Trop, 86, 141-159.
DESRIVIÈRES, S., PRINZ, T., CASTRO-PALOMINO LARIA, N., MEYER, M., BOEHM, G., BAUER, U., SCHäFER, J. R., NEUMANN, T., SHEMANKO, C. & GRONER, B. 2003. Comparative proteomic analysis of proliferating and functionally differentiated mammary epithelial cells. Mol Cell Proteomics, 2, 1039-1054.
DOPPLER, W., GRONER, B. & BALL, R. K. 1989. Prolactin and glucocorticoid hormones synergistically induce expression of transfected rat beta-casein gene promoter constructs in a mammary epithelial-cell line. P Natl Acad Sci USA, 86, 104-108.
DOYLE, L. A., YANG, W., ABRUZZO, L. V., KROGMANN, T., GAO, Y., RISHI, A. K. & ROSS, D. D. 1998. A multidrug resistance transporter from human MCF-7 breast cancer cells. P Natl Acad Sci USA, 95, 15665-15670.
ERICSSON UNNERSTAD, H., LINDBERG, A., PERSSON WALLER, K., EKMAN, T., ARTURSSON, K., NILSSON-ÖST, M. & BENGTSSON, B. 2009. Microbial aetiology of acute clinical mastitis and agent-specific risk factors. Vet Microbiol, 137, 90-97.
FARKE, C., MEYER, H. H. D., BRUCKMAIER, R. M. & ALBRECHT, C. 2008. Differential expression of ABC transporters and their regulatory genes during lactation and dry period in bovine mammary tissue. J Dairy Res, 75, 406-414.
IMAI, Y., TSUKAHARA, S., ASADA, S. & SUGIMOTO, Y. 2004. Phytoestrogens/flavonoids reverse breast cancer resistance protein/ABCG2-mediated multidrug resistance. Cancer Res, 64, 4346-4352.
ITO, S. & LEE, A. 2003. Drug excretion into breast milk – Overview. Adv Drug Deliver Rev, 55, 617-627.
JANSSON, C. & KREUGER, J. 2010. Multiresidue analysis of 95 pesticides at low nanogram/liter levels in surface waters using online preconcentration and high performance liquid chromatography/tandem mass spectrometry. J AOAC Int, 93, 1732-1747.
JONKER, J. W., MERINO, G., MUSTERS, S., VAN HERWAARDEN, A. E., BOLSCHER, E., WAGENAAR, E., MESMAN, E., DALE, T. C. & SCHINKEL, A. H. 2005. The breast cancer resistance protein BCRP (ABCG2) concentrates drugs and carcinogenic xenotoxins into milk. Nat Med, 11, 127-129.
30
KELLEHER, S. L. & LONNERDAL, B. 2003. Zn transporter levels and localization change throughout lactation in rat mammary gland and are regulated by Zn in mammary cells. J Nutr, 133, 3378-3385.
KRAJCOVA, A., SCHULZOVA, V., LOJZA, J., KRIZOVA, L. & HAJSLOVA, J. 2010. Phytoestrogens in bovine plasma and milk – LC-MS/MS analysis. Czech J Food Sci, 28, 264-274.
LIVAK, K. J. & SCHMITTGEN, T. D. 2001. Analysis of relative gene expression data using real-time quantitative PCR and the 2(T)(-Delta Delta C) method. Methods, 25, 402-408.
MERINO, G., JONKER, J. W., WAGENAAR, E., PULIDO, M. M., MOLINA, A. J., ALVAREZ, A. I. & SCHINKEL, A. H. 2005. Transport of anthelmintic benzimidazole drugs by breast cancer resistance protein (BCRP/ABCG2). Drug Metab Dispos, 33, 614-618.
MORRIS, M. E. & ZHANG, S. 2006. Flavonoid-drug interactions: Effects of flavonoids on ABC transporters. Life Sci, 78, 2116-2130.
MUENSTER, U., GRIESHOP, B., ICKENROTH, K. & GNOTH, M. 2008. Characterization of substrates and inhibitors for the in vitro assessment of Bcrp mediated drug–drug interactions. Pharm Res, 25, 2320-2326.
OTTO, M. & GÖTZ, F. 2001. ABC transporters of staphylococci. Res Microbiol, 152, 351-356.
PATISAUL, H. B. & JEFFERSON, W. 2010. The pros and cons of phytoestrogens. Front Neuroendocrin, In Press, Corrected Proof.
PEREZ, M., REAL, R., MENDOZA, G., MERINO, G., PRIETO, J. G. & ALVAREZ, A. I. 2009. Milk secretion of nitrofurantoin, as a specific BCRP/ABCG2 substrate, in assaf sheep: modulation by isoflavones. J Vet Pharmcol Ther, 32, 498-502.
PULIDO, M. M., MOLINA, A. J., MERINO, G., MENDOZA, G., PRIETO, J. G. & ALVAREZ, A. I. 2006. Interaction of enrofloxacin with breast cancer resistance protein (BCRP/ABCG2): influence of flavonoids and role in milk secretion in sheep. J Vet Pharmacol Ther, 29, 279-287.
PUTMAN, M., VAN VEEN, H. W. & KONINGS, W. N. 2000. Molecular properties of bacterial multidrug transporters. Microbiol Mol Biol Rev, 64, 672-693.
ROBEY, R. W., TO, K. K. K., POLGAR, O., DOHSE, M., FETSCH, P., DEAN, M. & BATES, S. E. 2009. ABCG2: A perspective. Adv Drug Deliver Rev, 61, 3-13.
TSIBOUKIS, D., SAZAKLI, E., GORTZI, O., HADJICHRISTODOULOU, C., MATARA, C. & LEOTSINIDIS, M. 2010. Assessing quality of raw milk in southern Greece in the aspect of certain benzimidazole residues. Food Addit Contam B, 3, 73-79.
VAN HERWAARDEN, A. E. & SCHINKEL, A. H. 2006. The function of breast cancer resistance protein in epithelial barriers, stem cells and milk secretion of drugs and xenotoxins. Trends Pharmacol Sci, 27, 10-16.
VAN HERWAARDEN, A. E., WAGENAAR, E., MERINO, G., JONKER, J. W., ROSING, H., BEIJNEN, J. H. & SCHINKEL, A. H. 2007. Multidrug transporter ABCG2/breast cancer resistance protein secretes riboflavin (vitamin B2) into milk. Mol Cell Biol, 27, 1247-1253.
VLAMING, M. L. H., LAGAS, J. S. & SCHINKEL, A. H. 2009. Physiological and pharmacological roles of ABCG2 (BCRP): Recent findings in Abcg2 knockout mice. Adv Drug Deliver Rev, 61, 14-25.
ZHANG, S. Z., YANG, X. N. & MORRIS, M. E. 2004. Flavonoids are inhibitors of breast cancer resistance protein (ABCG2)-mediated transport. Mol Pharmacol, 65, 1208-1216.


I denna serie publiceras större enskilda arbeten (motsvarande 15-30 hp
vid Institutionen för Livsmedelsvetenskap, Sveriges lantbruksuniversitet.


![Identification of Precursor Chemicals · 2019-01-01 · Identification of Precursor Chemicals NACEN, RTI, KANPUR [INDIA] Page 4 UN Transport Pictogram GHS Pictogram Signal Word Warning](https://img.pdfslide.us/doc/110x75/5e92861ab13a4d00417030f5/identification-of-precursor-chemicals-2019-01-01-identification-of-precursor-chemicals.jpg)