Embed Size (px)
Citation preview
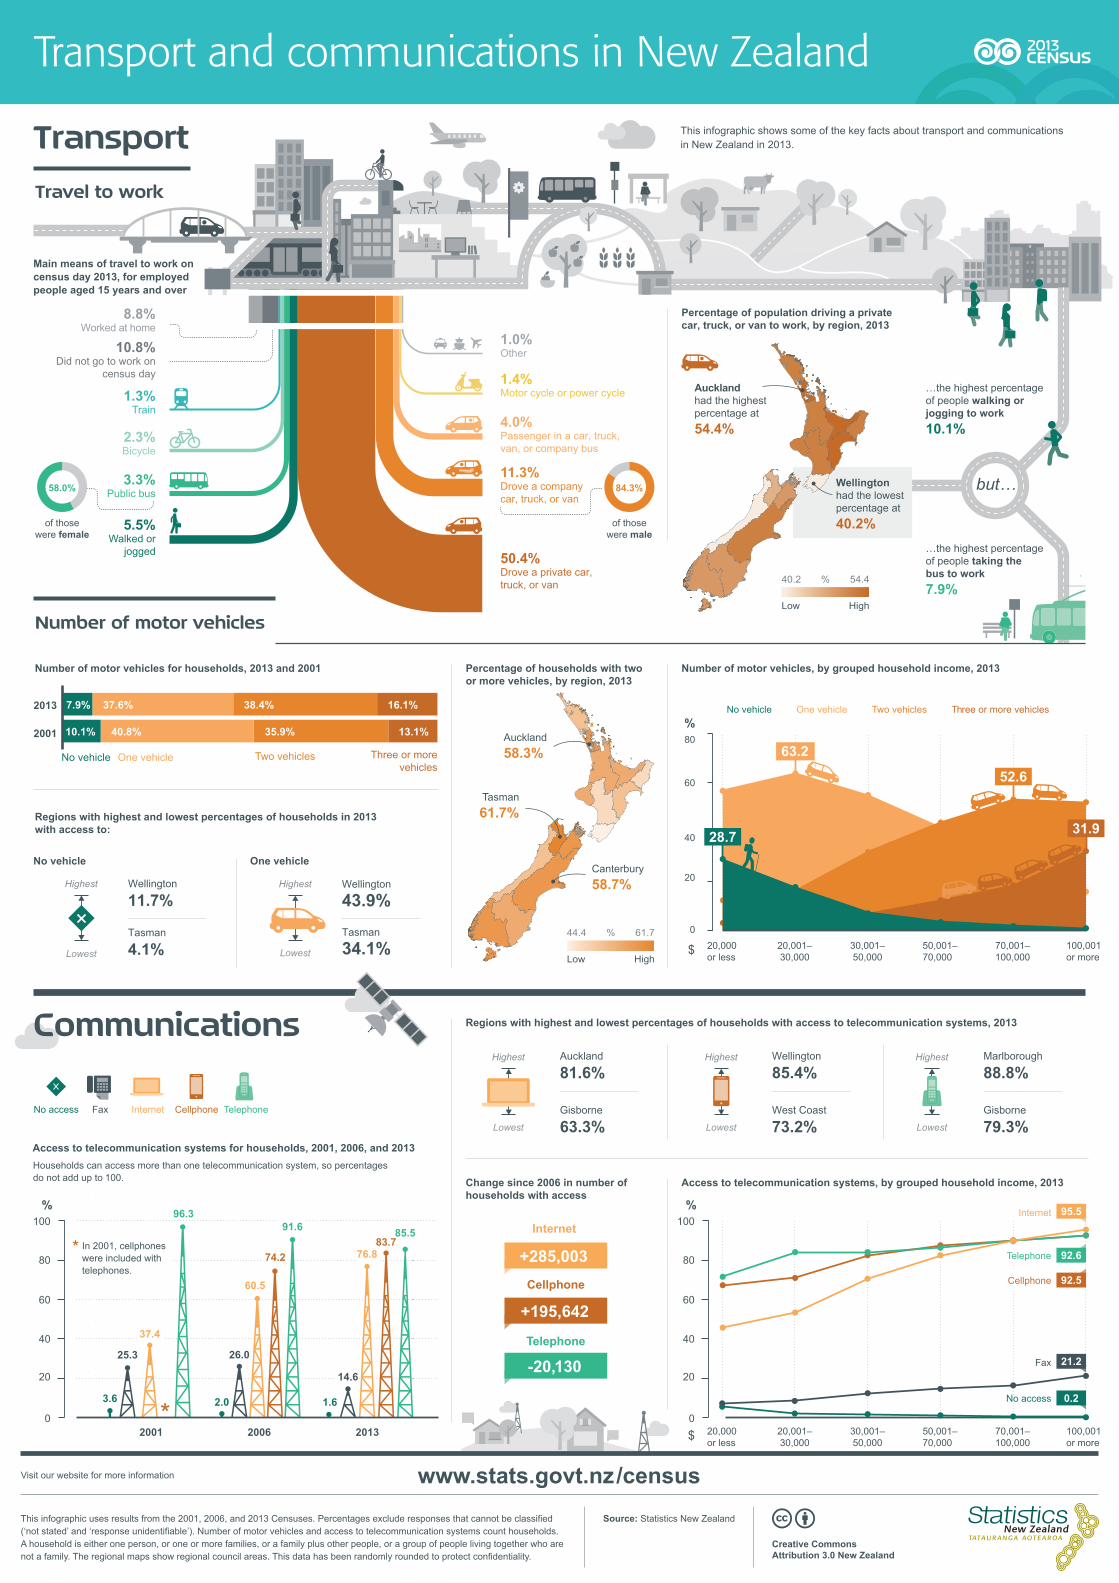
1.3%Train
2.3%Bicycle
3.3%Public bus
5.5%Walked or
jogged
11.3%Drove a company car, truck, or van
4.0%Passenger in a car, truck, van, or company bus
1.4%Motor cycle or power cycle
1.0%Other
8.8%Worked at home
10.8%Did not go to work on
census day
TransportTravel to work
Number of motor vehicles
This infographic shows some of the key facts about transport and communications in New Zealand in 2013.
of thosewere male
84.3%
2001
2013
No vehicle
7.9% 37.6% 16.1%
One vehicle Two vehicles Three or morevehicles
38.4%
10.1% 40.8% 13.1%35.9%
Number of motor vehicles for households, 2013 and 2001
Auckland58.3%
Tasman61.7%
Canterbury 58.7%
Percentage of households with two or more vehicles, by region, 2013
High Low
44.4 61.7%
Regions with highest and lowest percentages of households in 2013 with access to:
One vehicle
Wellington
43.9%Tasman
34.1%
Highest
Lowest
No vehicle
Wellington
11.7%
Tasman
4.1%
Highest
Lowest
0
20
40
60
80%
63.2
$ 20,000 or less
20,001–30,000
30,001–50,000
50,001–70,000
70,001–100,000
100,001 or more
$ 20,000 or less
20,001–30,000
30,001–50,000
50,001–70,000
70,001–100,000
100,001 or more
Number of motor vehicles, by grouped household income, 2013
Access to telecommunication systems, by grouped household income, 2013Change since 2006 in number of households with access
+195,642
+285,003
-20,130
Communications
3.6
37.4
74.2
26.025.3
96.391.6
2.0
2001 2006 2013
Access to telecommunication systems for households, 2001, 2006, and 2013Households can access more than one telecommunication system, so percentages do not add up to 100.
* In 2001, cellphones were included with telephones.
*
60.5
%
20
40
60
80
100
0
%
20
40
60
80
100
01.6
14.6
85.583.7
76.8
50.4%Drove a private car, truck, or van
Two vehiclesOne vehicle Three or more vehicles No vehicle
Main means of travel to work on census day 2013, for employed people aged 15 years and over
TelephoneCellphoneInternetNo access Fax
Wellington
85.4%
West Coast
73.2%
Regions with highest and lowest percentages of households with access to telecommunication systems, 2013
Auckland
81.6%
Gisborne
63.3%
Marlborough
88.8%
Gisborne
79.3%
Highest
Lowest
Highest
Lowest
Highest
Lowest
Cellphone
Internet
Telephone
28.7
52.6
31.9
92.6
92.5
95.5
21.2
0.2
Telephone
Cellphone
Internet
No access
Fax
58.0%
of thosewere female
…the highest percentage of people walking or jogging to work 10.1%
…the highest percentage of people taking the bus to work 7.9%
Percentage of population driving a private car, truck, or van to work, by region, 2013
Auckland had the highest percentage at 54.4%
High Low
40.2 54.4%
Wellington had the lowest percentage at 40.2%
but…
Transport and communications in New Zealand
This infographic uses results from the 2001, 2006, and 2013 Censuses. Percentages exclude responses that cannot be classified (‘not stated’ and ‘response unidentifiable’). Number of motor vehicles and access to telecommunication systems count households. A household is either one person, or one or more families, or a family plus other people, or a group of people living together who are not a family. The regional maps show regional council areas. This data has been randomly rounded to protect confidentiality.
Source: Statistics New Zealand
http://www.stats.govt.nz/census/2013-census.aspx
Creative Commons Attribution 3.0 New Zealand
Visit our website for more information