Embed Size (px)
Citation preview
Transport Data Availability for ASIF Analysis
in Asia
Sudhir Gota Technical Manager, Clean Air Initiative for Asian Cities (CAI-Asia)
International Expert Meeting (IEM)-UNECE Geneva
24 April 2012

2
0
10
20
30
40
50
60
70
19
86
19
87
19
88
19
89
19
90
19
91
19
92
19
93
19
94
19
95
19
96
19
97
19
98
19
99
20
00
20
01
20
02
20
03
20
04
20
05
20
06
20
07
20
08
20
09
CO2 Emission from Energy Consumption in Transport (Million tons)
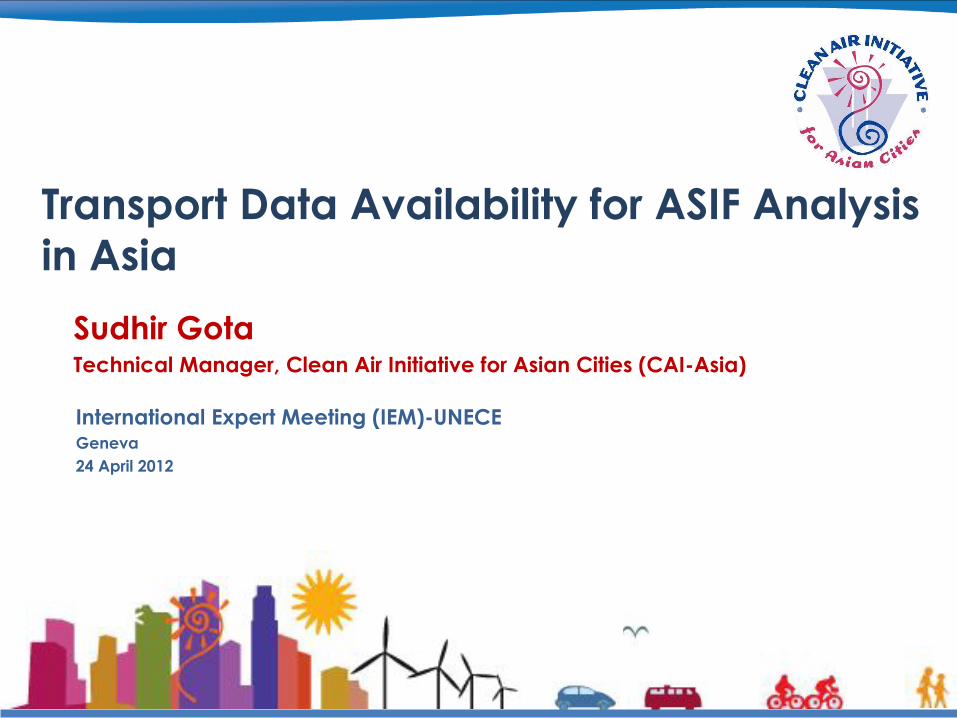
Can you guess which Asian developing country is this?
High growth in emissions?
3
0
50
100
150
200
250
300
350
400
450
19
89
19
90
19
91
19
92
19
93
19
94
19
95
19
96
19
97
19
98
19
99
20
00
20
01
20
02
20
03
20
04
20
05
20
06
20
07
20
08
20
09
Transport CO2 emissionsGDP/Capitavehiclesfuel price (gasoline)
Thailand - High growth in emissions?
The estimates for CO2 emissions using top down and bottom up varies from 48 to 80 Million tons in 2005 !!

Data and CO2 Quantifications Needed at
Multiple Analysis Scales
Project
Plan & Region
Nation
Need to take care to evaluate system-wide impacts, induced demand
Optimal scale to consider system impacts for metropolitan plans/programs
Often best for evaluating large networks and system policies
Source – Michael Replogle

Issues - Need-based Data Collection
CAI-Asia, 2010
On demand Adhoc Routinely collected

Issues - Lack of Coordination
Ministry Data
Transport
Motor vehicle registration
Licenses issued
Passenger and freight kilometers
Rail Length of railways
Passenger and freight kilometers
Public Works
Length of roads
Surface type and paved roads
Number and length of bridges
Road accidents
Energy
Fuel consumption by volume and by type of
fuel
Fuel pump price
Environment Emissions inventories
Economy/
Trade/ Customs
Economic growth – , etc.
Volume of trade; Vehicle imports
Finance Economic growth and infrastructure growth
Transport investment
Census Population Source: CAI Asia (2011)

Issues - Budget Limitations
CAI-Asia, 2010
GDP at current prices by economic sectorGDP at constant 1994 prices by economic sectorPopulation and population density by provinceAverage urban population by provinceAsphalted, stone paved, mixed stone, soil road (km)Volume of passengers traffic by type of transportVolume of passengers traffic by the road by provinceVolume of freight traffic by type of transportVolume of freight by type of transportVolume of freight by transport sectorInland waterways (km)Total length of bridges (m)Number of bridgesVehicle registration by vehicle type and by fuel typeOrigin-destination surveysVehicle kilometer travelled (VKT) per veh-fuel typeIn-use veh populationby veh type and fuel typeTraffic countOccupancyRidership.……...…...
By
De
ma
nd
a
nd
Ad
ho
cR
ou
tin
e D
ata
C
olle
cte
d
Inve
stm
ent
Needed for data planning
Bu
dg
et
Funding needs to be structural and not project driven or dependent on foreign assistance ( except capacity building)

Issues - Lack of Harmonized Methodologies,
definitions and Limited Data Sharing
Academic/ Private sector databases not shared with
government
CAI-Asia, 2010
Data with
consultant
Data with
consultantData with
consultant
Data with
consultant
Data with
consultant
Data with
consultant
Data with
consultant
Data with
consultant
Reported to Government
Agency (client)
Data to be
collected
Inconsistent government data
National level
Province-level
data
Other countries
City-level
data

Data Quality and Accessibility
9 9
Dept of Census & Statistics
Dept of Motor Traffic: Data Generator
New Registrations: Vehicle make, Color, Manufacture year, Model, Veh. No., Engine No., Tire size, Wheel base, Chassis No., Type of body, Gross veh. weight., Veh category, Ownership, Usage, Import license, Overall measurement, Purpose of use, Registration status, Driving side, Country of origin, Fuel used, Pay load, Cylinder capacity, Seating capacity, Veh type description by manufacturer
Divisional Secretariat: Data Generator
Example: Vehicle Registration Data Flow in Sri Lanka
For annual revenue license: Vehicle class, Fuel used, Vehicle weight, others Da
ta q
ua
lity
ch
eck
s
Da
ta a
vail
ab
ilit
y
Central Bank of SL
Vehicle class
Veh class, Fuel used Easily accessible to data users
Po
ten
tia
l err
ors
an
d u
nce
rta
inti
es
Ea
se o
f a
cce
ssib
ilit
y
CAI-Asia, 2010
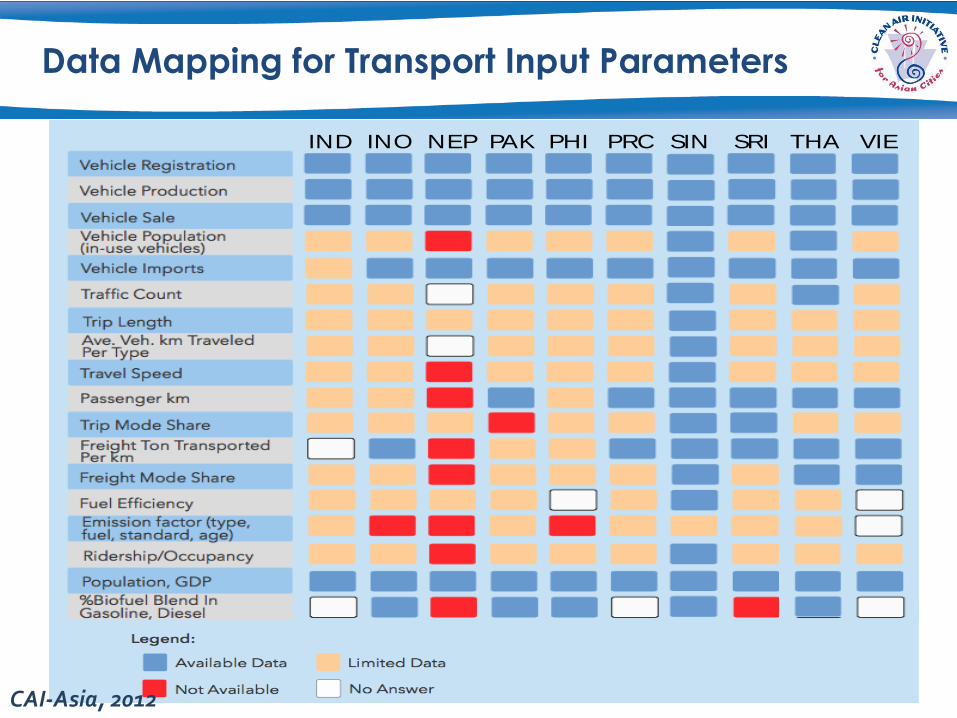
Data Mapping for Transport Input Parameters
IND INO NEP PAK PHI PRC SIN SRI THA VIE
CAI-Asia, 2012

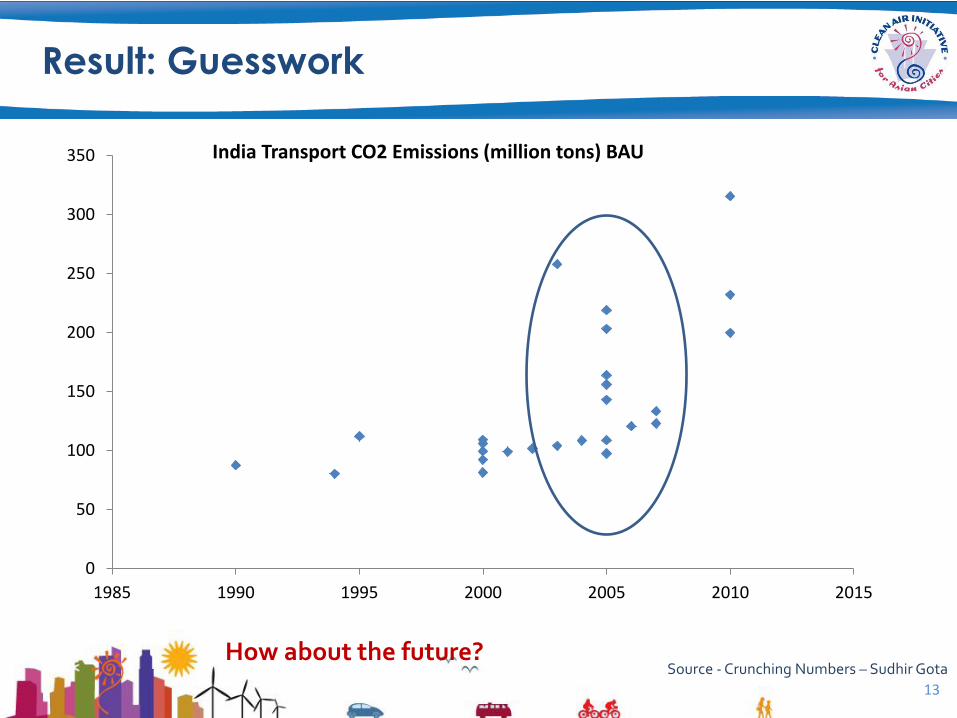
Result: Guesswork
India transport emissions baseline and forecast done by more than 20 reputed institutions and publications
11
0
500
1000
1500
2000
2500
1980 1990 2000 2010 2020 2030 2040 2050 2060
India Transport CO2 Emissions (million tons) BAU
Source - Crunching Numbers – Sudhir Gota

Result: Guesswork
India transport emissions baseline and forecast done by more than 20 reputed institutions and publications
12
0
500
1000
1500
2000
2500
1980 1990 2000 2010 2020 2030 2040 2050 2060
India Transport CO2 Emissions (million tons) BAU
Source - Crunching Numbers – Sudhir Gota
13
Result: Guesswork
0
50
100
150
200
250
300
350
1985 1990 1995 2000 2005 2010 2015
India Transport CO2 Emissions (million tons) BAU
How about the future? Source - Crunching Numbers – Sudhir Gota
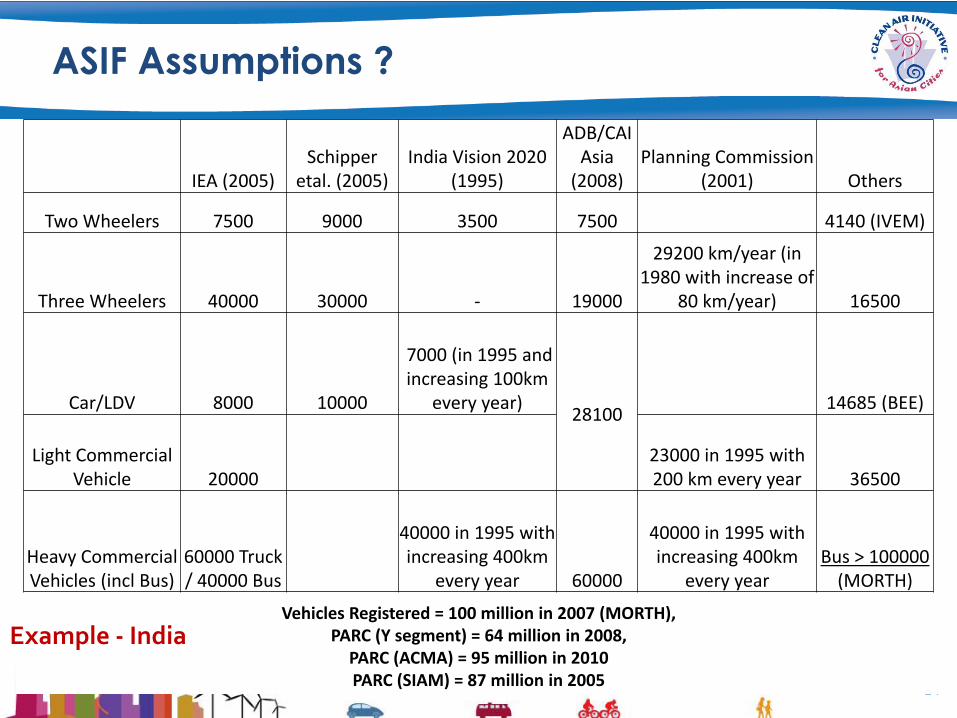
ASIF Assumptions ?
14
IEA (2005) Schipper
etal. (2005) India Vision 2020
(1995)
ADB/CAI Asia
(2008) Planning Commission
(2001) Others
Two Wheelers 7500 9000 3500 7500 4140 (IVEM)
Three Wheelers 40000 30000 - 19000
29200 km/year (in 1980 with increase of
80 km/year) 16500
Car/LDV 8000 10000
7000 (in 1995 and increasing 100km
every year)
28100 14685 (BEE)
Light Commercial Vehicle 20000
23000 in 1995 with 200 km every year 36500
Heavy Commercial Vehicles (incl Bus)
60000 Truck / 40000 Bus
40000 in 1995 with increasing 400km
every year 60000
40000 in 1995 with increasing 400km
every year Bus > 100000
(MORTH)
Vehicles Registered = 100 million in 2007 (MORTH), PARC (Y segment) = 64 million in 2008,
PARC (ACMA) = 95 million in 2010 PARC (SIAM) = 87 million in 2005
Example - India

Consumption of oil in transport - Annual Growth
Rates
15
-10
-5
0
5
10
15
Ho
ngK
on
g,C
hin
a
DP
Ro
fKo
rea
Mya
nm
ar
Ph
ilip
pin
es
Ch
ine
seTa
ipe
i
Pak
ista
n
Sri L
anka
Thai
lan
d
Mal
aysi
a
Sin
gap
ore
Bru
ne
iDar
uss
alam
Ind
on
esi
a
Ind
ia
Mo
ngo
lia
Asi
a
Ban
glad
esh
PR
Ch
ina
Ne
pal
Vie
tnam
1980 to 1990 1990 to 2000 2000 to 2009
Bottom-up data not available to validate this.
don’t show this to policy makers yet !! Source : IEA data

What is CAI Asia trying to do?
16
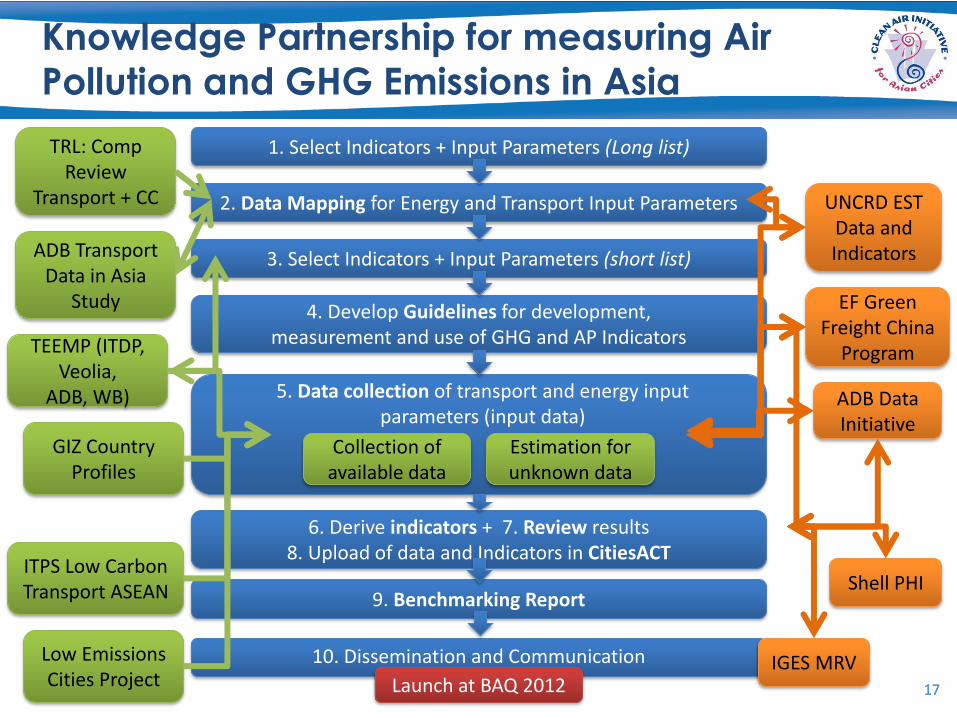
17
1. Select Indicators + Input Parameters (Long list)
2. Data Mapping for Energy and Transport Input Parameters
4. Develop Guidelines for development, measurement and use of GHG and AP Indicators
3. Select Indicators + Input Parameters (short list)
5. Data collection of transport and energy input parameters (input data)
Collection of available data
Estimation for unknown data
6. Derive indicators + 7. Review results 8. Upload of data and Indicators in CitiesACT
10. Dissemination and Communication
Launch at BAQ 2012
9. Benchmarking Report
17
ADB Transport Data in Asia
Study
UNCRD EST Data and Indicators
Low Emissions Cities Project
ADB Data Initiative
TEEMP (ITDP, Veolia,
ADB, WB)
IGES MRV
Shell PHI
TRL: Comp Review
Transport + CC
ITPS Low Carbon Transport ASEAN
GIZ Country Profiles
EF Green Freight China
Program
Knowledge Partnership for measuring Air
Pollution and GHG Emissions in Asia

Open Data: CitiesACT – www.citiesACT.org
18
CitiesACT is an online database that features data and information on Air Quality, Climate Change & Energy, and Transport.
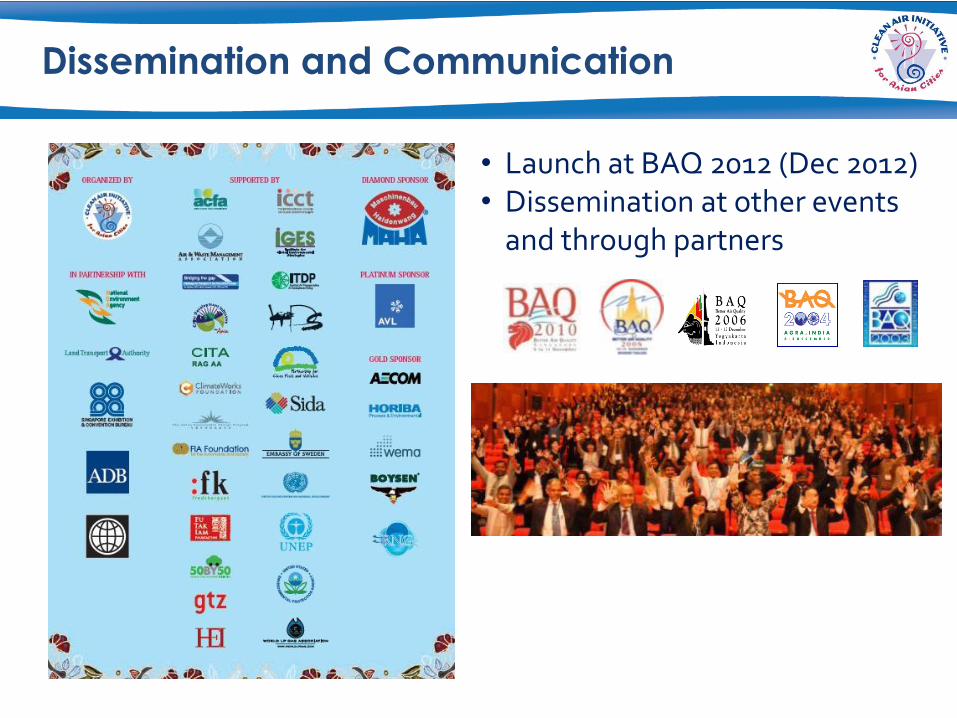
Dissemination and Communication
• Launch at BAQ 2012 (Dec 2012) • Dissemination at other events
and through partners
Thanks Lee
20

For more information
21
[email protected] Unit 3505 Robinsons-Equitable Tower
ADB Avenue, Pasig City Metro Manila 1605
Philippines
CAI-Asia Center
[email protected] 901A Reignwood Building,
No. 8 YongAnDongLi Jianguomenwai Avenue Beijing
China
CAI-Asia China Office
[email protected] Regus Elegance
Elegance Tower, Mathura Road, Jasola Vihar, New Delhi
India
CAI-Asia India Office
CAI-Asia Country Networks
China . India . Indonesia . Nepal . Pakistan . Philippines . Sri Lanka . Vietnam
CAI-Asia Center Members 231 CAI-Asia Partnership Members
• 45 Cities
• 19 Environment ministries
• 13 Other Government agencies
• 17 Development agencies and foundations
• 66 NGOs
• 37 Academic and research institutes
• 32 Private sector companies
Donors in 2011 Asian Development Bank ClimateWorks Foundation Energy Foundation
Fredskorpset Norway Fu Tak Iam Foundation German International
Cooperation (GIZ) Guangdong Government Institute for Global
Environmental Strategies (IGES) Institute for Transport Policy Studies
Institute for Transportation and Development Policy International Union for
Conservation of Nature Korea Transport Institute MAHA Philippine
Business for the Environment United Nations Centre for Regional
Development (UNCRD) United Nations Environment Program Partnership
for Clean Fuels and Vehicles (UNEP PCFV) Veolia World Bank
www.cleanairinitiative.org