Embed Size (px)
Citation preview
. . . . . . . . . . . . . . . . . . . . . . . . . . . . . . . . . . . . . . . . . . . . . . . . . . . . . . . . . . . . . . . . . . . . . . . . . .
. . . . . . . .
. . . . . . . . . . . . . . . . . . . . . . . . . . . . . . . . . . . . . . . . . . . . . . . . . . . . . . . . . . . . . . . . . . . . . . . . . .
. . . . . . . . . . . . . . . . . . . . . . . . . . . . . . . . . . . . . . . . . . . . . . . . . . . . . . . . . . . . . . . . . . . . . . . . . .
Transport Corporation of India2016 Investor Presentation
2
Cautionary Statement
Statements in this “Presentation” describing the Company’s objectives, estimates, expectations or predictions may
be “forward looking statements” within the meaning of applicable securities laws and regulations. Actual results
could differ materially from those expressed or implied. Important factors that could make a difference to the
Company’s operations include global and Indian demand supply conditions, cyclical demand and pricing in the
Company’s principal markets, changes in Government regulations, tax regimes, economic developments within India
and other factors. The Company assumes no responsibility to publicly amend, modify or revise any forward looking
statement, on the basis of any subsequent development, information or events, or otherwise.
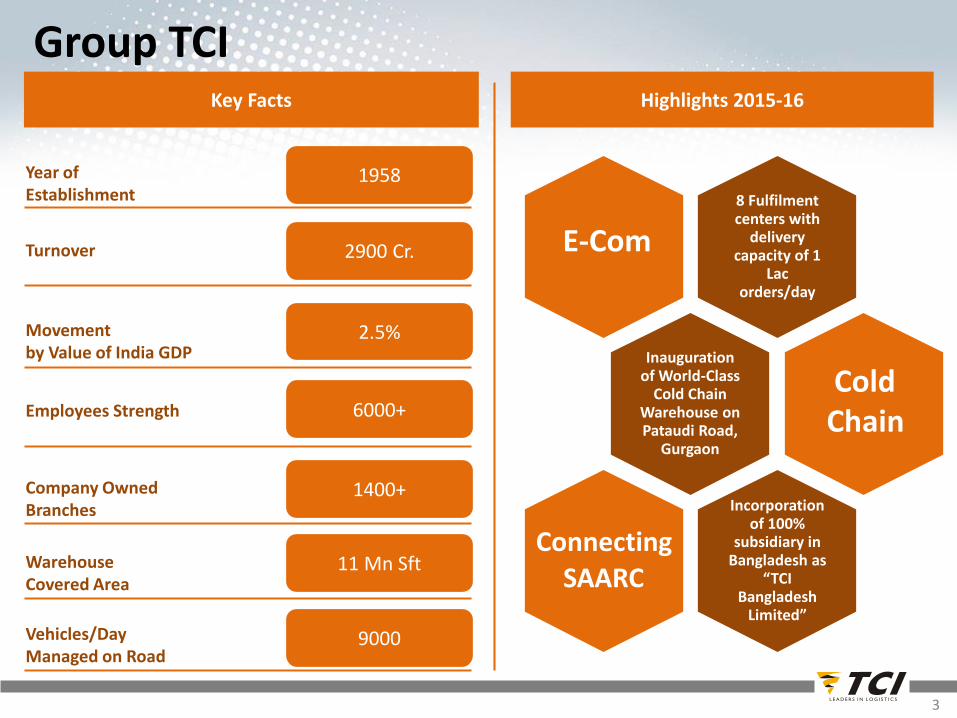
Group TCI
3
Key Facts
Year of Establishment
Turnover
Company Owned Branches
Warehouse Covered Area
Vehicles/DayManaged on Road
1958
2.5%
1400+
11 Mn Sft
9000
Movementby Value of India GDP
2900 Cr.
Employees Strength 6000+
Highlights 2015-16
8 Fulfilment centers with
delivery capacity of 1
Lac orders/day
Inauguration of World-Class
Cold Chain Warehouse on Pataudi Road,
Gurgaon
Incorporation of 100%
subsidiary in Bangladesh as
“TCI Bangladesh
Limited”
E-Com
Cold Chain
ConnectingSAARC
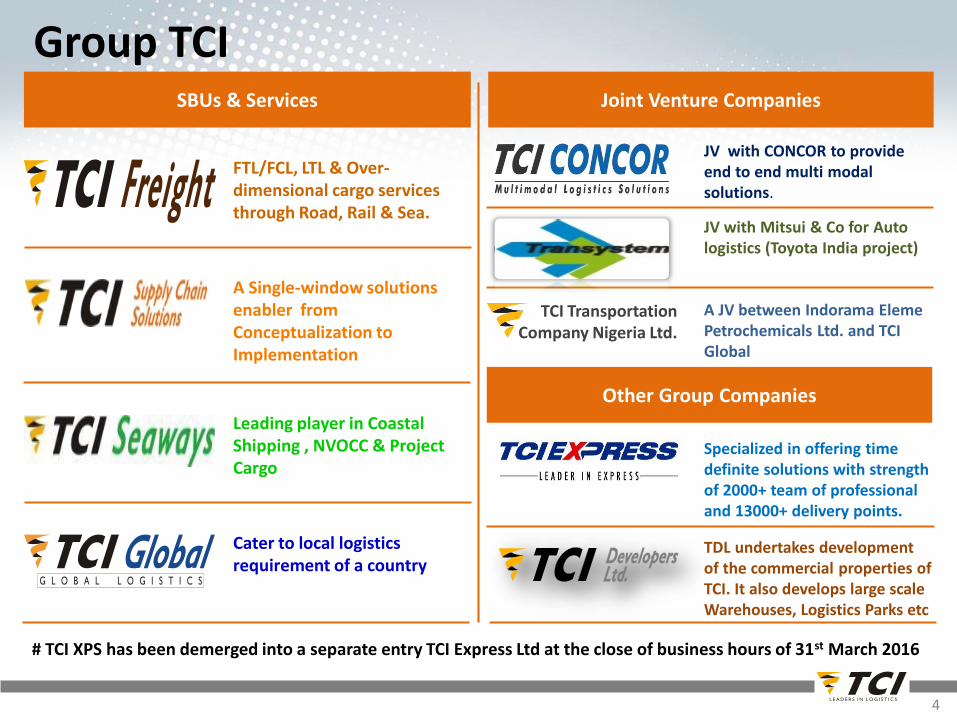
Group TCI
4
SBUs & Services
FTL/FCL, LTL & Over-dimensional cargo services through Road, Rail & Sea.
Leading player in Coastal Shipping , NVOCC & Project Cargo
A Single-window solutions enabler from Conceptualization to Implementation
Cater to local logistics requirement of a country
Joint Venture Companies
JV with CONCOR to provideend to end multi modal solutions.
JV with Mitsui & Co for Auto logistics (Toyota India project)
TCI Transportation Company Nigeria Ltd.
# TCI XPS has been demerged into a separate entry TCI Express Ltd at the close of business hours of 31st March 2016
A JV between Indorama ElemePetrochemicals Ltd. and TCI Global
Other Group Companies
TDL undertakes development of the commercial properties of TCI. It also develops large scale Warehouses, Logistics Parks etc
Specialized in offering time definite solutions with strength of 2000+ team of professional and 13000+ delivery points.
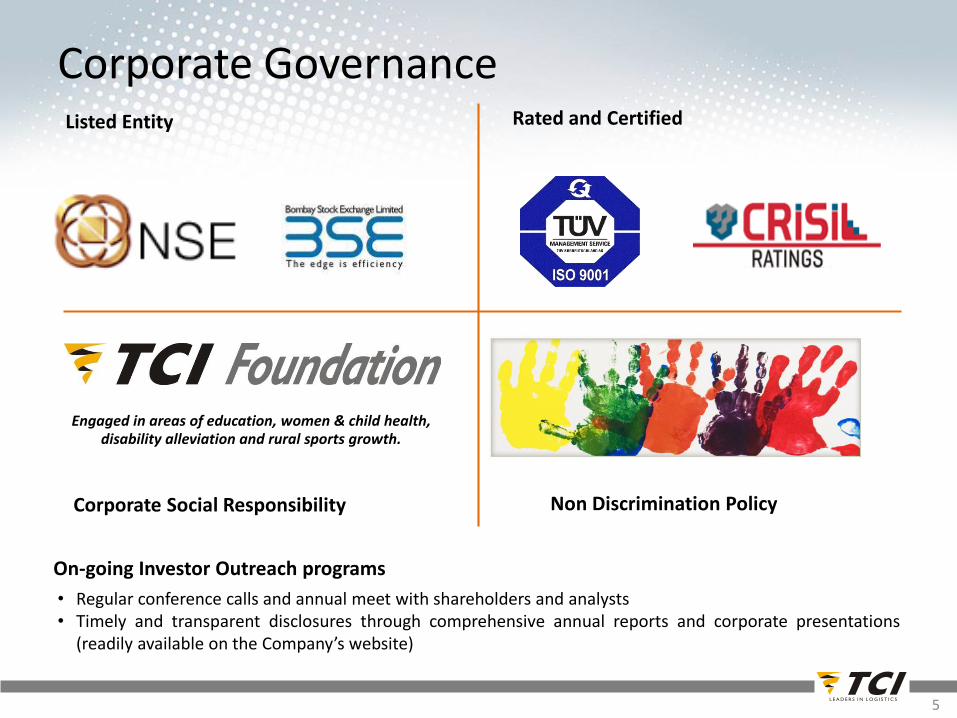
Listed Entity Rated and Certified
Corporate Social Responsibility
Engaged in areas of education, women & child health, disability alleviation and rural sports growth.
Non Discrimination Policy
• Regular conference calls and annual meet with shareholders and analysts• Timely and transparent disclosures through comprehensive annual reports and corporate presentations
(readily available on the Company’s website)
Corporate Governance
On-going Investor Outreach programs
5
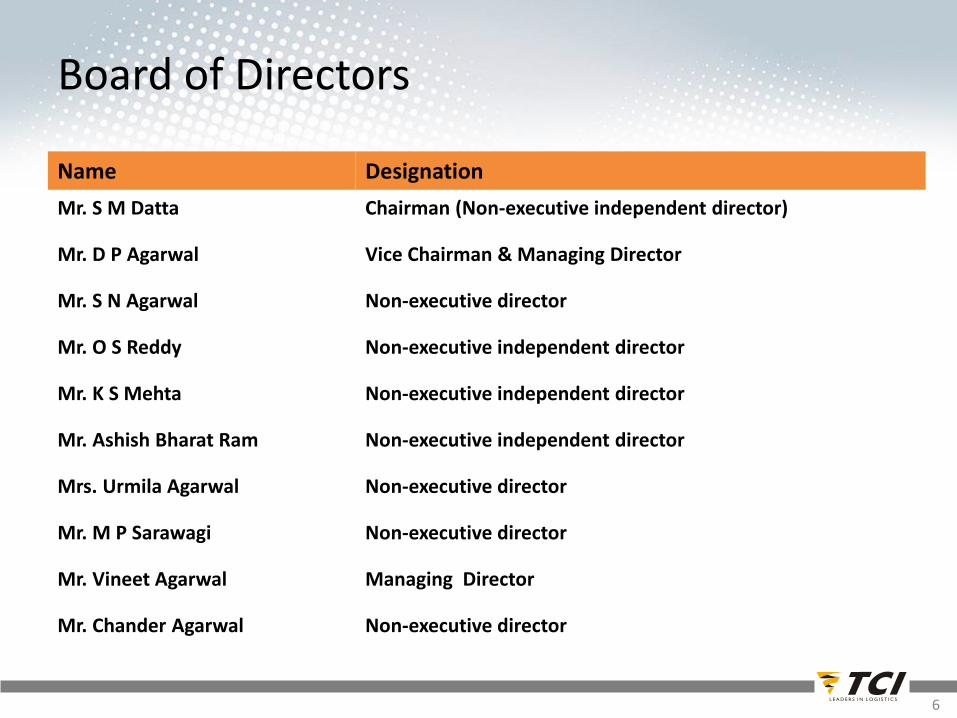
Name Designation
Mr. S M Datta Chairman (Non-executive independent director)
Mr. D P Agarwal Vice Chairman & Managing Director
Mr. S N Agarwal Non-executive director
Mr. O S Reddy Non-executive independent director
Mr. K S Mehta Non-executive independent director
Mr. Ashish Bharat Ram Non-executive independent director
Mrs. Urmila Agarwal Non-executive director
Mr. M P Sarawagi Non-executive director
Mr. Vineet Agarwal Managing Director
Mr. Chander Agarwal Non-executive director
Board of Directors
6
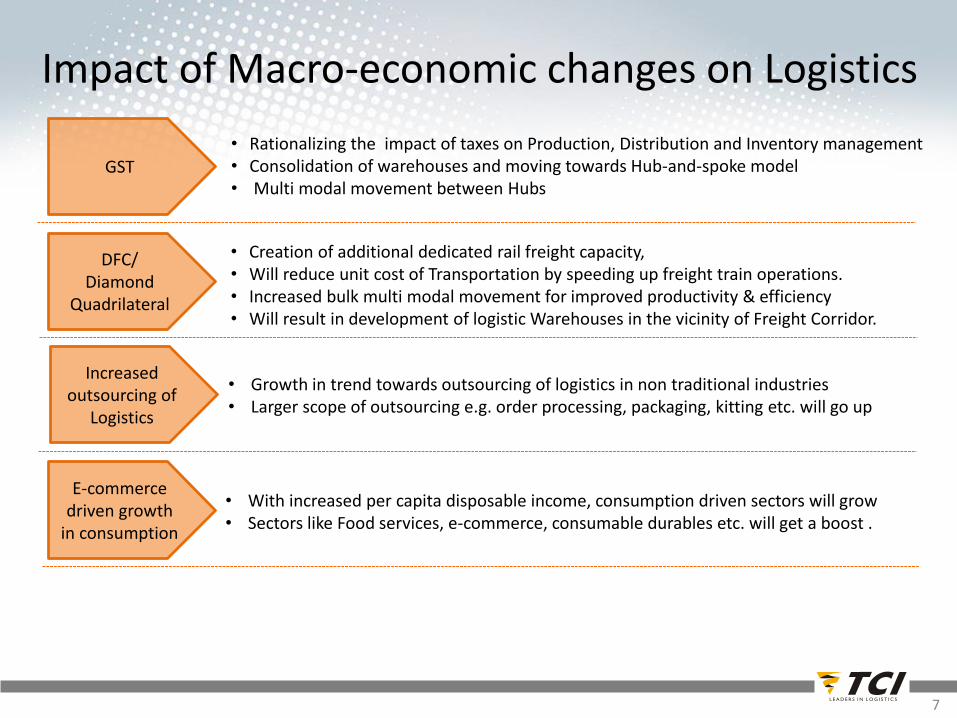
Impact of Macro-economic changes on Logistics
DFC/Diamond
Quadrilateral
• Creation of additional dedicated rail freight capacity, • Will reduce unit cost of Transportation by speeding up freight train operations.• Increased bulk multi modal movement for improved productivity & efficiency• Will result in development of logistic Warehouses in the vicinity of Freight Corridor.
GST • Rationalizing the impact of taxes on Production, Distribution and Inventory management • Consolidation of warehouses and moving towards Hub-and-spoke model• Multi modal movement between Hubs
• With increased per capita disposable income, consumption driven sectors will grow• Sectors like Food services, e-commerce, consumable durables etc. will get a boost .
E-commerce driven growth
in consumption
• Growth in trend towards outsourcing of logistics in non traditional industries • Larger scope of outsourcing e.g. order processing, packaging, kitting etc. will go up
Increased outsourcing of
Logistics
7
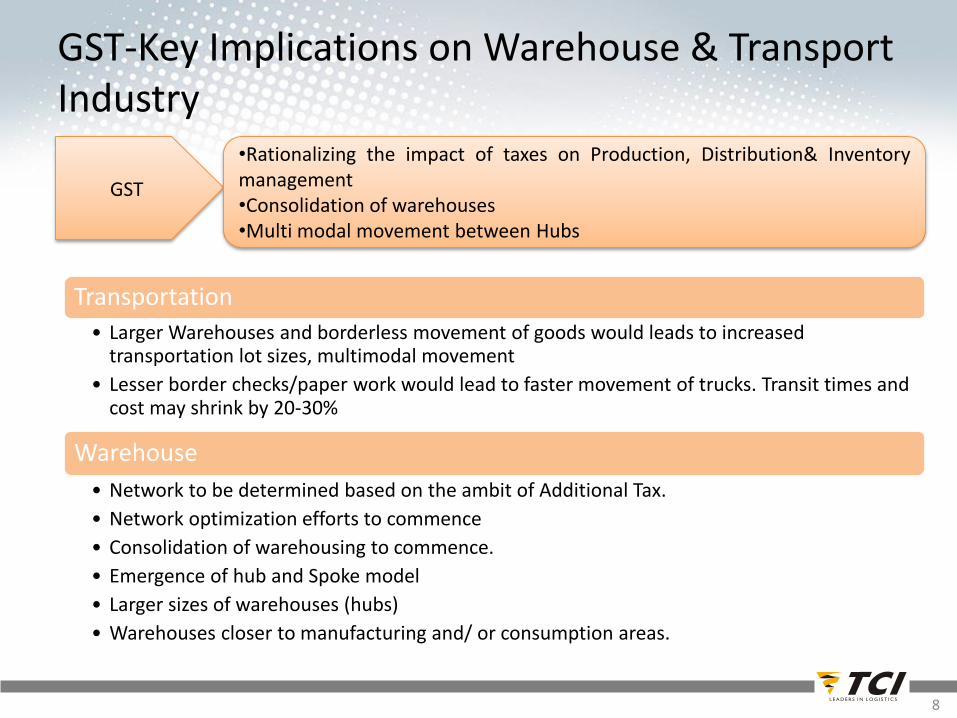
GST-Key Implications on Warehouse & Transport Industry
Transportation
• Larger Warehouses and borderless movement of goods would leads to increased transportation lot sizes, multimodal movement
• Lesser border checks/paper work would lead to faster movement of trucks. Transit times and cost may shrink by 20-30%
Warehouse
• Network to be determined based on the ambit of Additional Tax.
• Network optimization efforts to commence
• Consolidation of warehousing to commence.
• Emergence of hub and Spoke model
• Larger sizes of warehouses (hubs)
• Warehouses closer to manufacturing and/ or consumption areas.
GST
•Rationalizing the impact of taxes on Production, Distribution& Inventorymanagement•Consolidation of warehouses•Multi modal movement between Hubs
8
9
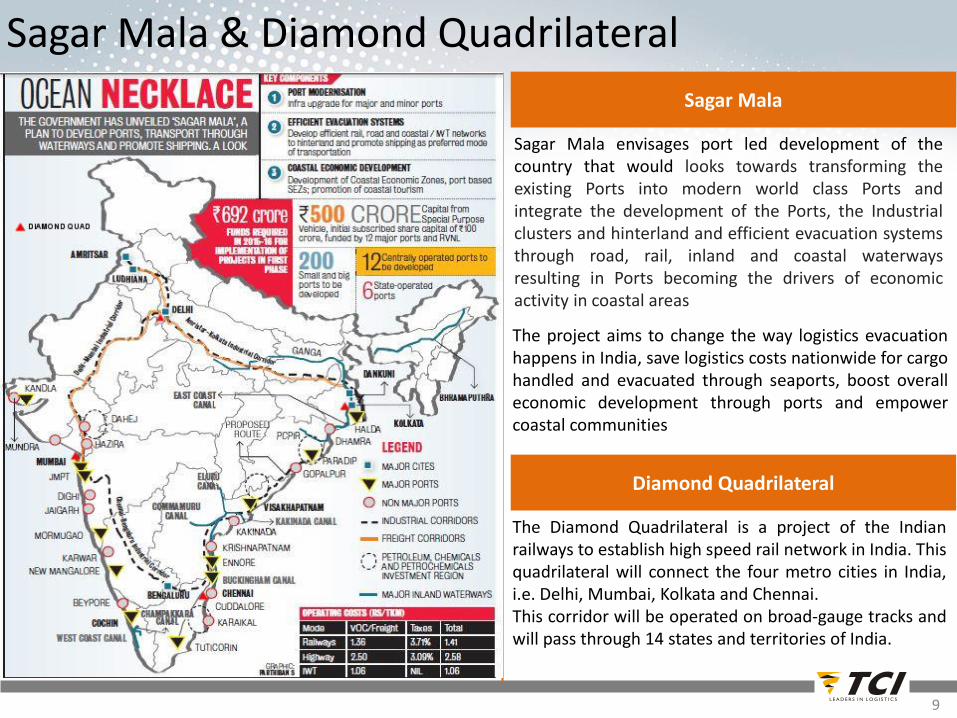
Sagar Mala & Diamond Quadrilateral
Sagar Mala
Diamond Quadrilateral
The Diamond Quadrilateral is a project of the Indianrailways to establish high speed rail network in India. Thisquadrilateral will connect the four metro cities in India,i.e. Delhi, Mumbai, Kolkata and Chennai.This corridor will be operated on broad-gauge tracks andwill pass through 14 states and territories of India.
Sagar Mala envisages port led development of thecountry that would looks towards transforming theexisting Ports into modern world class Ports andintegrate the development of the Ports, the Industrialclusters and hinterland and efficient evacuation systemsthrough road, rail, inland and coastal waterwaysresulting in Ports becoming the drivers of economicactivity in coastal areas
The project aims to change the way logistics evacuationhappens in India, save logistics costs nationwide for cargohandled and evacuated through seaports, boost overalleconomic development through ports and empowercoastal communities
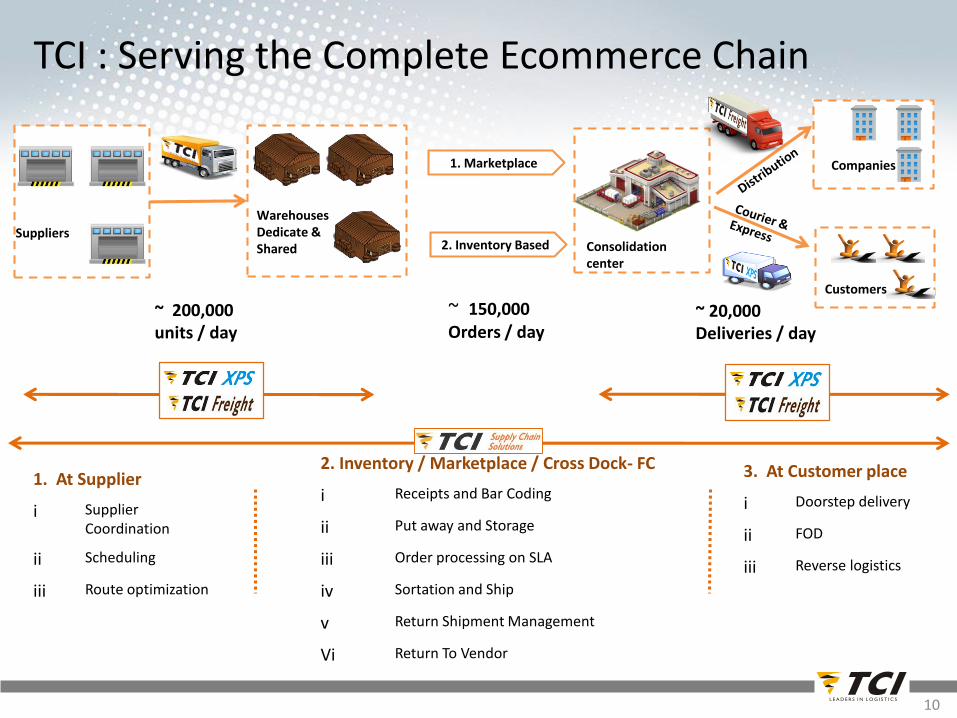
TCI : Serving the Complete Ecommerce Chain
Customers
Companies
Consolidation center
WarehousesDedicate & Shared
Suppliers
1. Marketplace
2. Inventory Based
1. At Supplier
i Supplier Coordination
ii Scheduling
iii Route optimization
2. Inventory / Marketplace / Cross Dock- FC
i Receipts and Bar Coding
ii Put away and Storage
iii Order processing on SLA
iv Sortation and Ship
v Return Shipment Management
Vi Return To Vendor
3. At Customer place
i Doorstep delivery
ii FOD
iii Reverse logistics
~ 200,000 units / day
~ 150,000Orders / day
~ 20,000 Deliveries / day
10
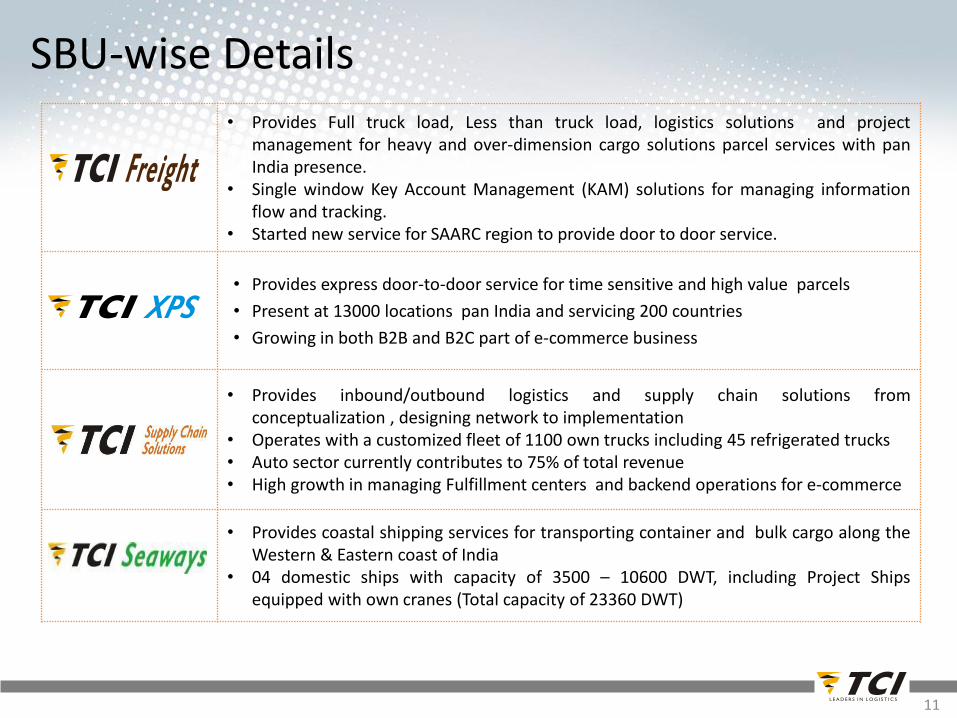
• Provides Full truck load, Less than truck load, logistics solutions and projectmanagement for heavy and over-dimension cargo solutions parcel services with panIndia presence.
• Single window Key Account Management (KAM) solutions for managing informationflow and tracking.
• Started new service for SAARC region to provide door to door service.
• Provides express door-to-door service for time sensitive and high value parcels
• Present at 13000 locations pan India and servicing 200 countries
• Growing in both B2B and B2C part of e-commerce business
• Provides inbound/outbound logistics and supply chain solutions fromconceptualization , designing network to implementation
• Operates with a customized fleet of 1100 own trucks including 45 refrigerated trucks• Auto sector currently contributes to 75% of total revenue• High growth in managing Fulfillment centers and backend operations for e-commerce
• Provides coastal shipping services for transporting container and bulk cargo along theWestern & Eastern coast of India
• 04 domestic ships with capacity of 3500 – 10600 DWT, including Project Shipsequipped with own cranes (Total capacity of 23360 DWT)
SBU-wise Details
11
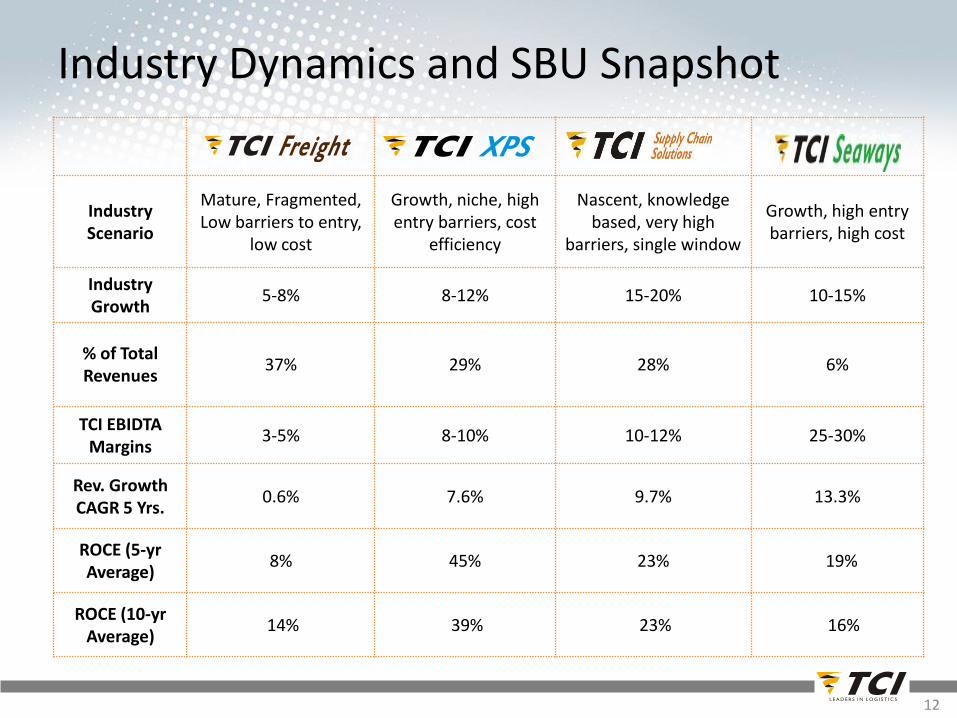
Industry Scenario
Mature, Fragmented, Low barriers to entry,
low cost
Growth, niche, high entry barriers, cost
efficiency
Nascent, knowledge based, very high
barriers, single window
Growth, high entry barriers, high cost
Industry Growth
5-8% 8-12% 15-20% 10-15%
% of Total Revenues
37% 29% 28% 6%
TCI EBIDTA Margins
3-5% 8-10% 10-12% 25-30%
Rev. Growth CAGR 5 Yrs.
0.6% 7.6% 9.7% 13.3%
ROCE (5-yr Average)
8% 45% 23% 19%
ROCE (10-yr Average)
14% 39% 23% 16%
Industry Dynamics and SBU Snapshot
12
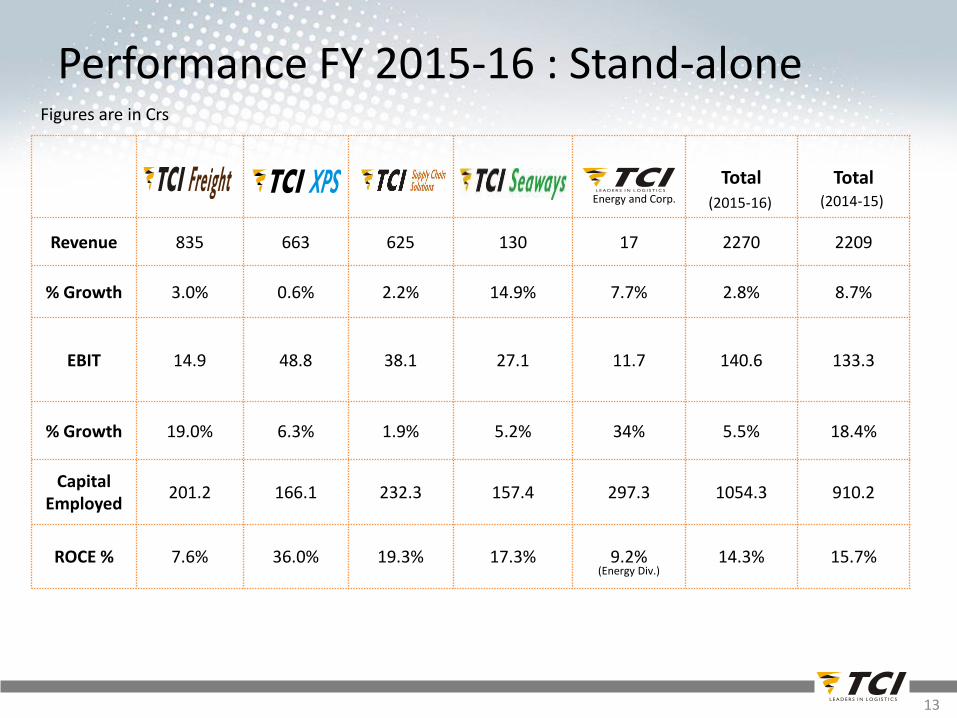
Total Total
Revenue 835 663 625 130 17 2270 2209
% Growth 3.0% 0.6% 2.2% 14.9% 7.7% 2.8% 8.7%
EBIT 14.9 48.8 38.1 27.1 11.7 140.6 133.3
% Growth 19.0% 6.3% 1.9% 5.2% 34% 5.5% 18.4%
Capital Employed
201.2 166.1 232.3 157.4 297.3 1054.3 910.2
ROCE % 7.6% 36.0% 19.3% 17.3% 9.2% 14.3% 15.7%
Performance FY 2015-16 : Stand-alone
13
Energy and Corp.
Figures are in Crs
(2015-16) (2014-15)
(Energy Div.)
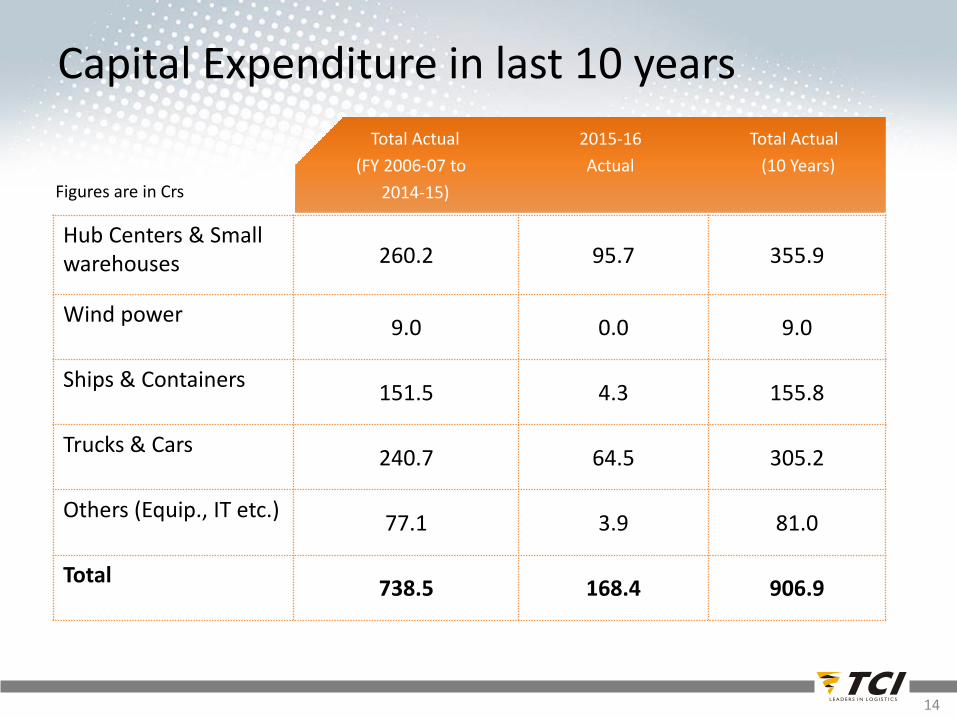
Capital Expenditure in last 10 years
14
Hub Centers & Small warehouses 260.2 95.7 355.9
Wind power9.0 0.0 9.0
Ships & Containers151.5 4.3 155.8
Trucks & Cars240.7 64.5 305.2
Others (Equip., IT etc.)77.1 3.9 81.0
Total738.5 168.4 906.9
Total Actual
(FY 2006-07 to
2014-15)
2015-16
Actual
Total Actual
(10 Years)
Figures are in Crs
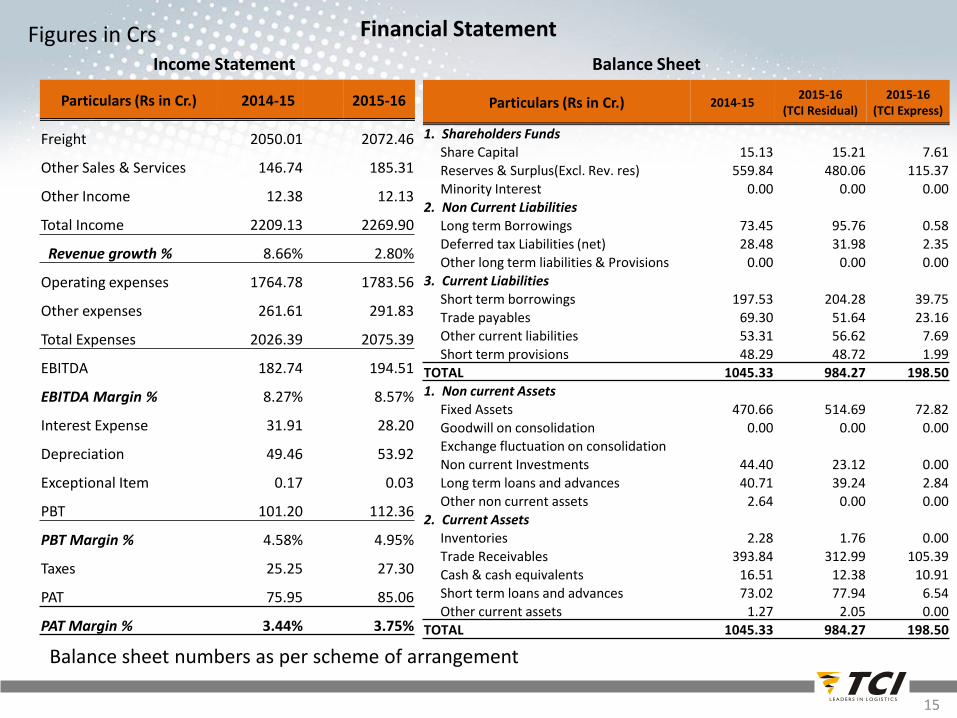
Income Statement
Financial Statement
Particulars (Rs in Cr.) 2014-15 2015-16
Freight 2050.01 2072.46
Other Sales & Services 146.74 185.31
Other Income 12.38 12.13
Total Income 2209.13 2269.90
Revenue growth % 8.66% 2.80%
Operating expenses 1764.78 1783.56
Other expenses 261.61 291.83
Total Expenses 2026.39 2075.39
EBITDA 182.74 194.51
EBITDA Margin % 8.27% 8.57%
Interest Expense 31.91 28.20
Depreciation 49.46 53.92
Exceptional Item 0.17 0.03
PBT 101.20 112.36
PBT Margin % 4.58% 4.95%
Taxes 25.25 27.30
PAT 75.95 85.06
PAT Margin % 3.44% 3.75%
Balance Sheet
15
Particulars (Rs in Cr.) 2014-152015-16
(TCI Residual)2015-16
(TCI Express)
1. Shareholders Funds
Share Capital 15.13 15.21 7.61
Reserves & Surplus(Excl. Rev. res) 559.84 480.06 115.37
Minority Interest 0.00 0.00 0.002. Non Current Liabilities
Long term Borrowings 73.45 95.76 0.58
Deferred tax Liabilities (net) 28.48 31.98 2.35
Other long term liabilities & Provisions 0.00 0.00 0.00
3. Current Liabilities
Short term borrowings 197.53 204.28 39.75
Trade payables 69.30 51.64 23.16Other current liabilities 53.31 56.62 7.69
Short term provisions 48.29 48.72 1.99
TOTAL 1045.33 984.27 198.50
1. Non current Assets
Fixed Assets 470.66 514.69 72.82
Goodwill on consolidation 0.00 0.00 0.00Exchange fluctuation on consolidationNon current Investments 44.40 23.12 0.00
Long term loans and advances 40.71 39.24 2.84
Other non current assets 2.64 0.00 0.002. Current Assets
Inventories 2.28 1.76 0.00
Trade Receivables 393.84 312.99 105.39Cash & cash equivalents 16.51 12.38 10.91
Short term loans and advances 73.02 77.94 6.54
Other current assets 1.27 2.05 0.00TOTAL 1045.33 984.27 198.50
Balance sheet numbers as per scheme of arrangement
Figures in Crs
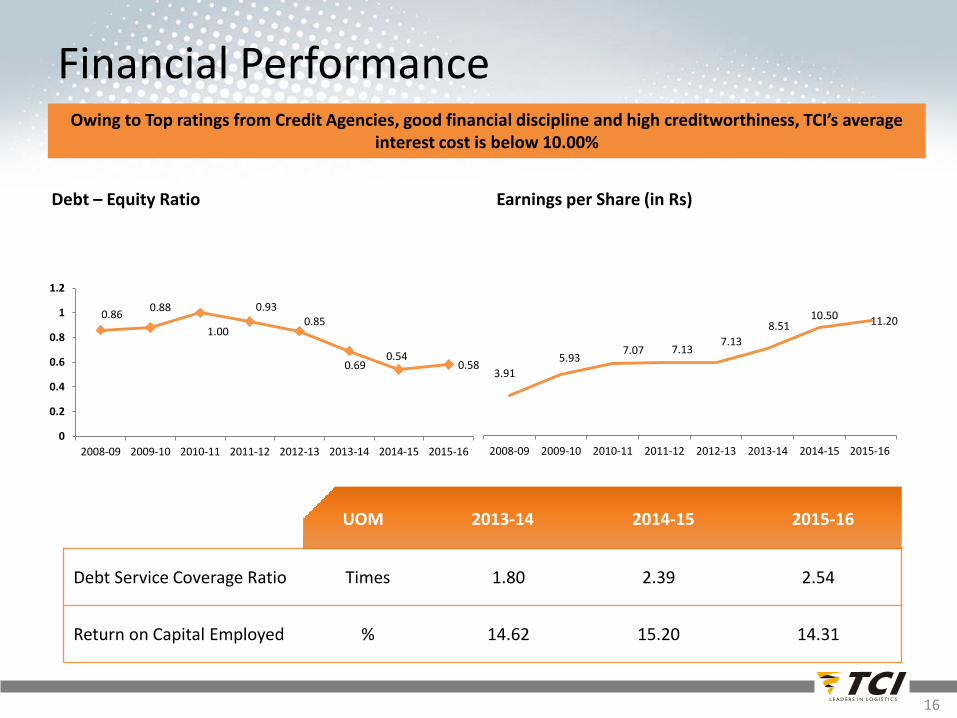
Owing to Top ratings from Credit Agencies, good financial discipline and high creditworthiness, TCI’s average interest cost is below 10.00%
Debt – Equity Ratio Earnings per Share (in Rs)
Financial Performance
Debt Service Coverage Ratio Times 1.80 2.39 2.54
Return on Capital Employed % 14.62 15.20 14.31
UOM 2013-14 2014-15 2015-16
16
3.91
5.937.07 7.13
7.13
8.5110.50 11.20
2008-09 2009-10 2010-11 2011-12 2012-13 2013-14 2014-15 2015-16
0.860.88
1.00
0.930.85
0.690.54
0.58
0
0.2
0.4
0.6
0.8
1
1.2
2008-09 2009-10 2010-11 2011-12 2012-13 2013-14 2014-15 2015-16
17
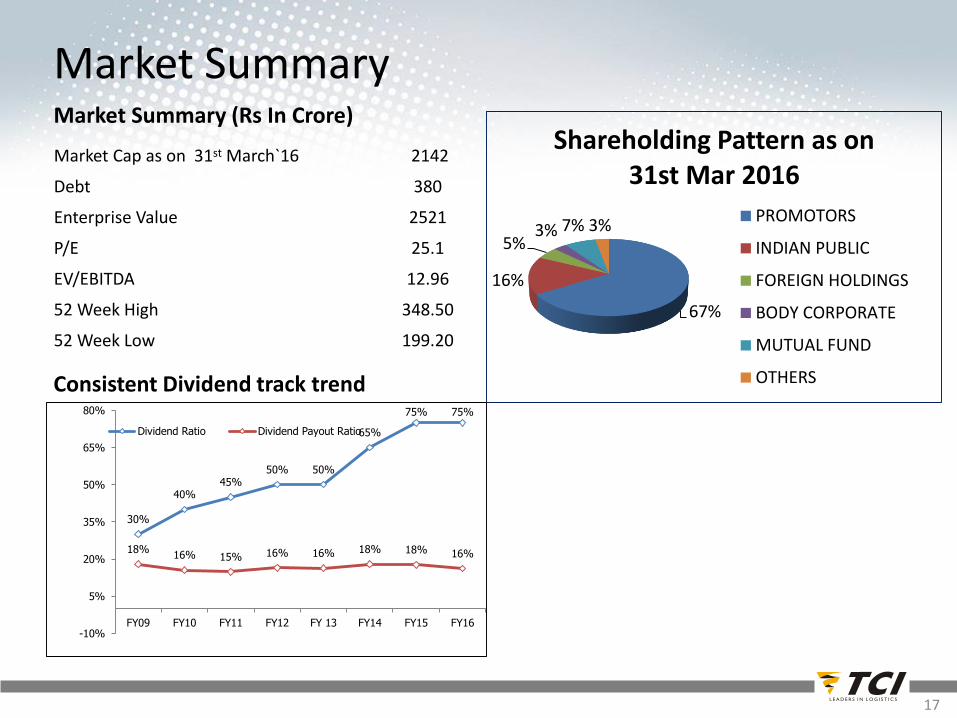
Market SummaryMarket Summary (Rs In Crore)
Market Cap as on 31st March`16 2142
Debt 380
Enterprise Value 2521
P/E 25.1
EV/EBITDA 12.96
52 Week High 348.50
52 Week Low 199.20
Consistent Dividend track trend
67%
16%
5%3% 7% 3%
Shareholding Pattern as on 31st Mar 2016
PROMOTORS
INDIAN PUBLIC
FOREIGN HOLDINGS
BODY CORPORATE
MUTUAL FUND
OTHERS
30%
40%45%
50% 50%
65%
75% 75%
18%16% 15% 16% 16% 18% 18% 16%
-10%
5%
20%
35%
50%
65%
80%
FY09 FY10 FY11 FY12 FY 13 FY14 FY15 FY16
Dividend Ratio Dividend Payout Ratio
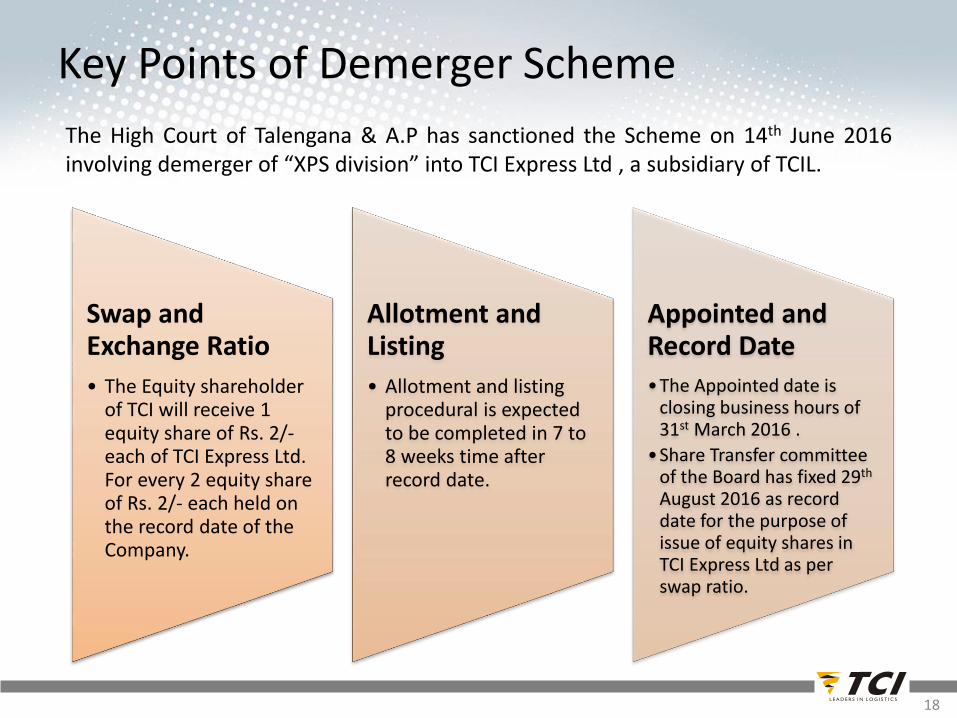
Key Points of Demerger Scheme
18
Swap and Exchange Ratio
• The Equity shareholder of TCI will receive 1 equity share of Rs. 2/-each of TCI Express Ltd. For every 2 equity share of Rs. 2/- each held on the record date of the Company.
Allotment and Listing
• Allotment and listing procedural is expected to be completed in 7 to 8 weeks time after record date.
Appointed and Record Date
•The Appointed date is closing business hours of 31st March 2016 .
•Share Transfer committee of the Board has fixed 29th
August 2016 as record date for the purpose of issue of equity shares in TCI Express Ltd as per swap ratio.
The High Court of Talengana & A.P has sanctioned the Scheme on 14th June 2016involving demerger of “XPS division” into TCI Express Ltd , a subsidiary of TCIL.
19
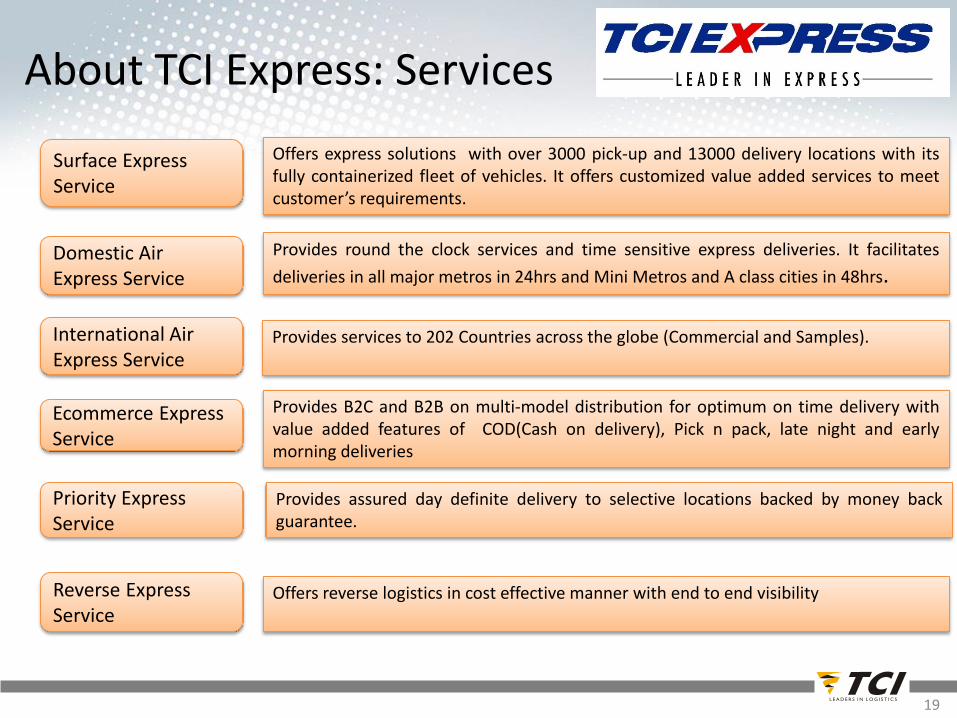
Surface Express Service
Domestic Air Express Service
International Air Express Service
Ecommerce Express Service
Reverse Express Service
Offers express solutions with over 3000 pick-up and 13000 delivery locations with itsfully containerized fleet of vehicles. It offers customized value added services to meetcustomer’s requirements.
Provides B2C and B2B on multi-model distribution for optimum on time delivery withvalue added features of COD(Cash on delivery), Pick n pack, late night and earlymorning deliveries
Provides round the clock services and time sensitive express deliveries. It facilitates
deliveries in all major metros in 24hrs and Mini Metros and A class cities in 48hrs.
Provides services to 202 Countries across the globe (Commercial and Samples).
Provides assured day definite delivery to selective locations backed by money backguarantee.
Offers reverse logistics in cost effective manner with end to end visibility
Priority Express Service
About TCI Express: Services
20
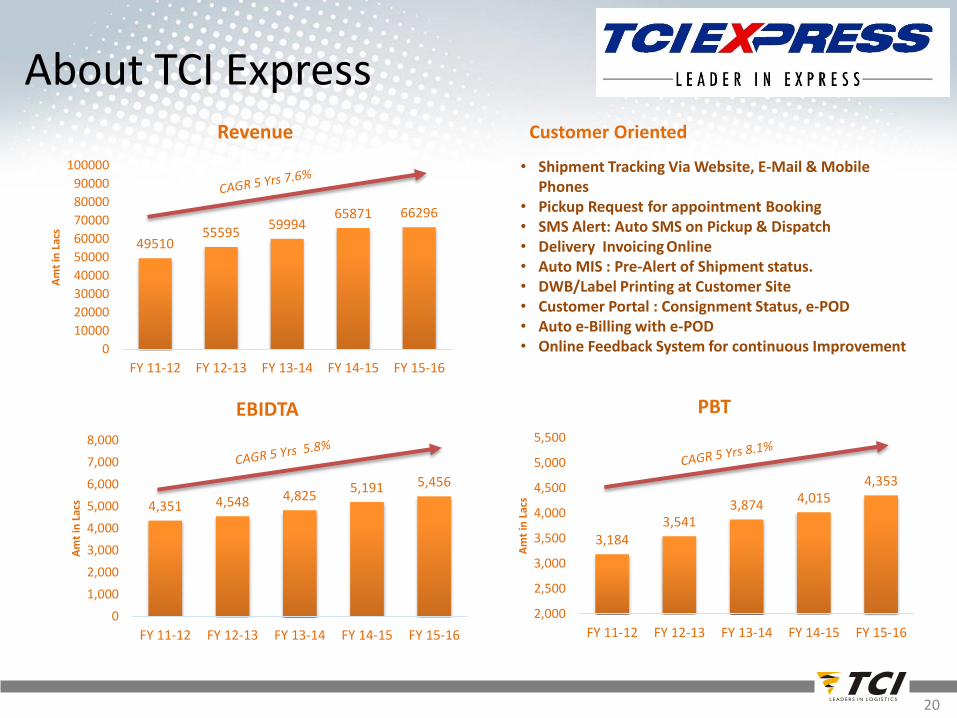
4951055595
5999465871 66296
0
10000
20000
30000
40000
50000
60000
70000
80000
90000
100000
FY 11-12 FY 12-13 FY 13-14 FY 14-15 FY 15-16
Am
t in
Lac
s
Revenue
About TCI Express
4,351 4,548 4,8255,191 5,456
0
1,000
2,000
3,000
4,000
5,000
6,000
7,000
8,000
FY 11-12 FY 12-13 FY 13-14 FY 14-15 FY 15-16
Am
t in
Lac
s
EBIDTA
3,1843,541
3,874 4,0154,353
2,000
2,500
3,000
3,500
4,000
4,500
5,000
5,500
FY 11-12 FY 12-13 FY 13-14 FY 14-15 FY 15-16
Am
t in
Lac
s
PBT
• Shipment Tracking Via Website, E-Mail & Mobile Phones
• Pickup Request for appointment Booking• SMS Alert: Auto SMS on Pickup & Dispatch• Delivery Invoicing Online• Auto MIS : Pre-Alert of Shipment status.• DWB/Label Printing at Customer Site • Customer Portal : Consignment Status, e-POD• Auto e-Billing with e-POD • Online Feedback System for continuous Improvement
Customer Oriented
21
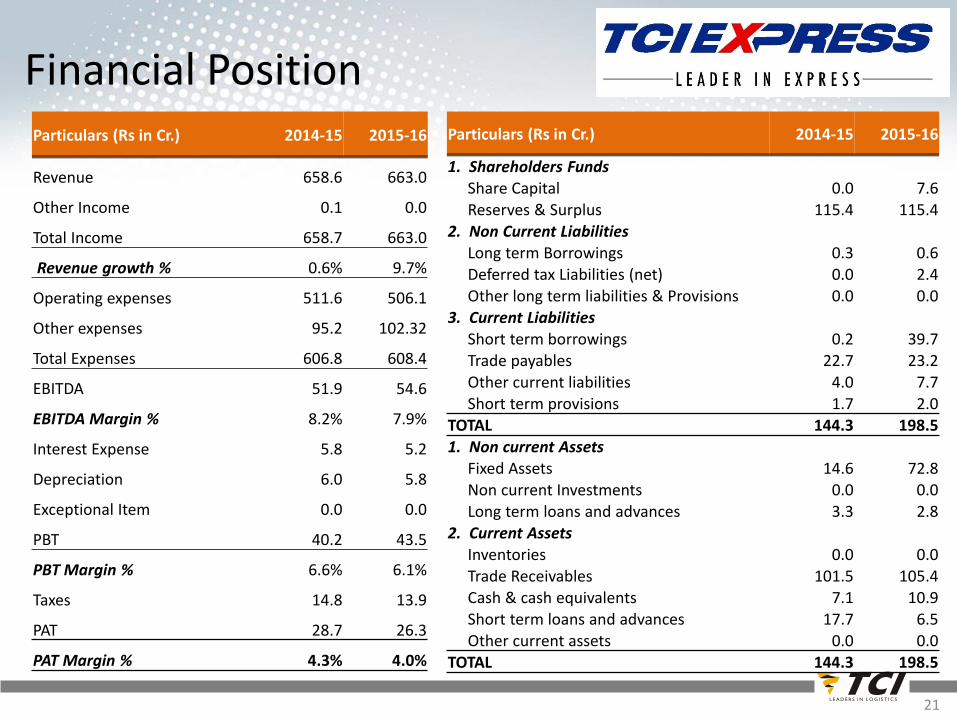
Financial Position Particulars (Rs in Cr.) 2014-15 2015-16
Revenue 658.6 663.0
Other Income 0.1 0.0
Total Income 658.7 663.0
Revenue growth % 0.6% 9.7%
Operating expenses 511.6 506.1
Other expenses 95.2 102.32
Total Expenses 606.8 608.4
EBITDA 51.9 54.6
EBITDA Margin % 8.2% 7.9%
Interest Expense 5.8 5.2
Depreciation 6.0 5.8
Exceptional Item 0.0 0.0
PBT 40.2 43.5
PBT Margin % 6.6% 6.1%
Taxes 14.8 13.9
PAT 28.7 26.3
PAT Margin % 4.3% 4.0%
Particulars (Rs in Cr.) 2014-15 2015-16
1. Shareholders Funds
Share Capital 0.0 7.6Reserves & Surplus 115.4 115.4
2. Non Current LiabilitiesLong term Borrowings 0.3 0.6
Deferred tax Liabilities (net) 0.0 2.4
Other long term liabilities & Provisions 0.0 0.03. Current Liabilities
Short term borrowings 0.2 39.7Trade payables 22.7 23.2Other current liabilities 4.0 7.7
Short term provisions 1.7 2.0
TOTAL 144.3 198.51. Non current Assets
Fixed Assets 14.6 72.8Non current Investments 0.0 0.0
Long term loans and advances 3.3 2.8
2. Current AssetsInventories 0.0 0.0
Trade Receivables 101.5 105.4Cash & cash equivalents 7.1 10.9
Short term loans and advances 17.7 6.5
Other current assets 0.0 0.0TOTAL 144.3 198.5
22
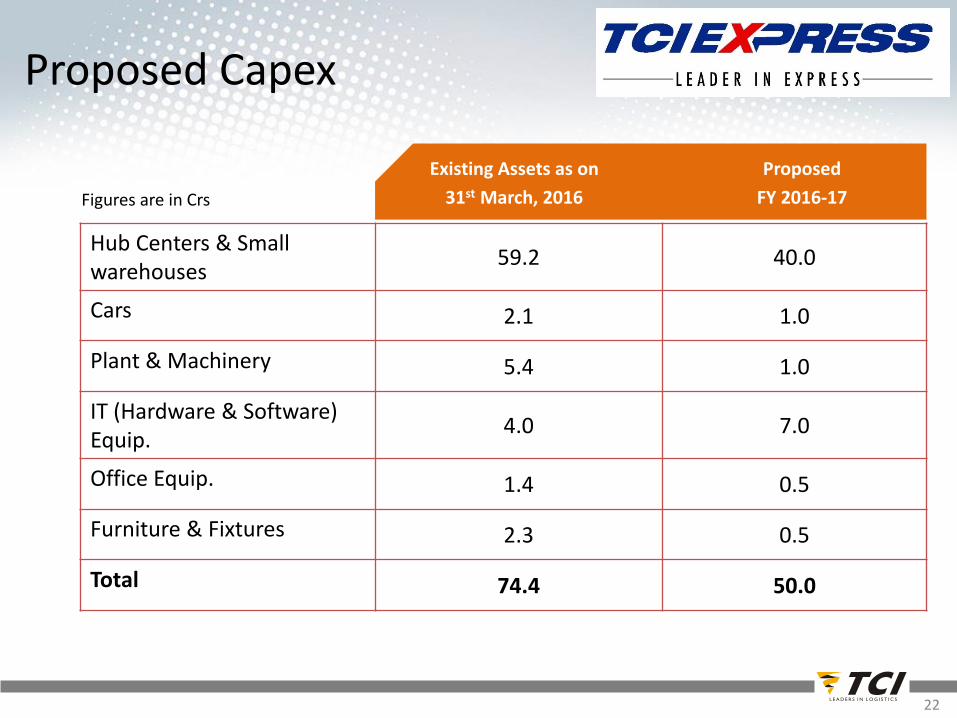
Existing Assets as on
31st March, 2016
Proposed
FY 2016-17
Existing Assets as on
31st March, 2016
Proposed
FY 2016-17
Hub Centers & Small warehouses
59.2 40.0
Cars 2.1 1.0
Plant & Machinery 5.4 1.0
IT (Hardware & Software) Equip.
4.0 7.0
Office Equip. 1.4 0.5
Furniture & Fixtures 2.3 0.5
Total 74.4 50.0
Proposed Capex
Figures are in Crs
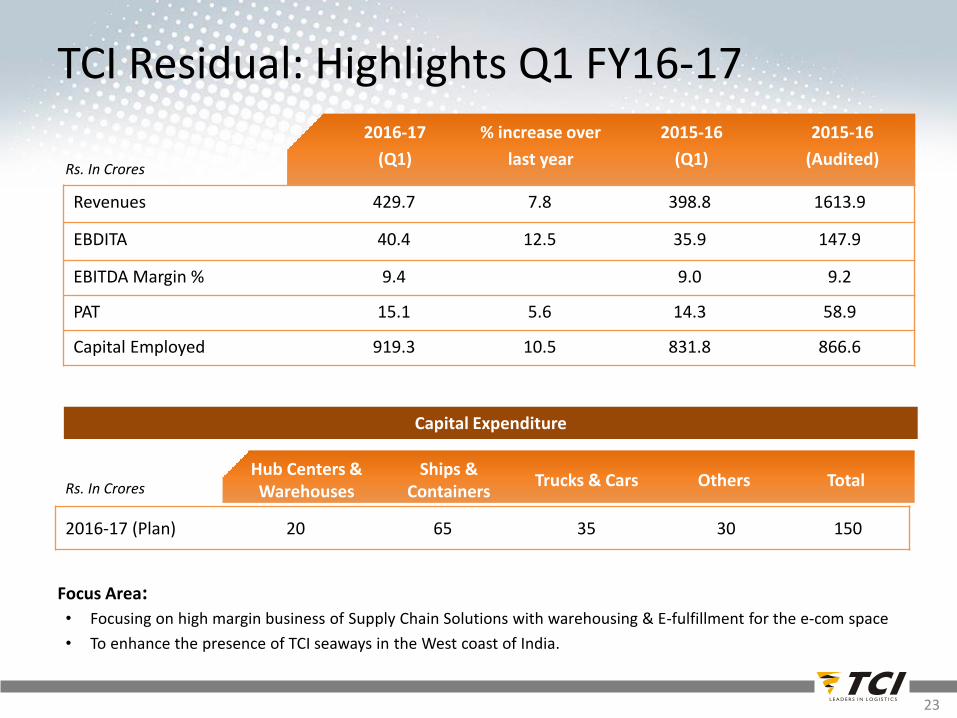
Revenues 429.7 7.8 398.8 1613.9
EBDITA 40.4 12.5 35.9 147.9
EBITDA Margin % 9.4 9.0 9.2
PAT 15.1 5.6 14.3 58.9
Capital Employed 919.3 10.5 831.8 866.6
2016-17
(Q1)
% increase over
last year
2015-16
(Q1)
2015-16
(Audited)
Capital Expenditure
2016-17 (Plan) 20 65 35 30 150
Hub Centers & Warehouses
Ships & Containers
Trucks & Cars Others Total
Focus Area:• Focusing on high margin business of Supply Chain Solutions with warehousing & E-fulfillment for the e-com space
• To enhance the presence of TCI seaways in the West coast of India.
Rs. In Crores
TCI Residual: Highlights Q1 FY16-17
23
Rs. In Crores
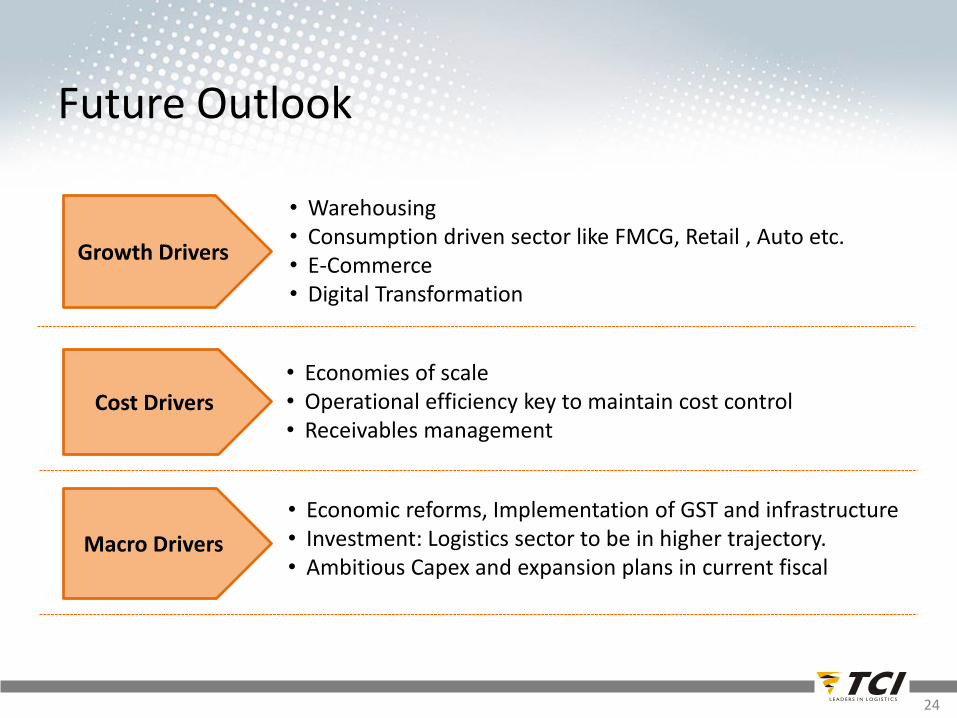
Growth Drivers
• Warehousing • Consumption driven sector like FMCG, Retail , Auto etc.• E-Commerce• Digital Transformation
Cost Drivers• Economies of scale• Operational efficiency key to maintain cost control• Receivables management
Macro Drivers
• Economic reforms, Implementation of GST and infrastructure• Investment: Logistics sector to be in higher trajectory.• Ambitious Capex and expansion plans in current fiscal
Future Outlook
24
25