Embed Size (px)
Citation preview

TRANSPARENT AND CRACK-FREE SILICA AEROGELS
A Thesis Submitted to the Graduate Faculty
of the North Dakota State University
of Agriculture and Applied Science
By
Kalyan Ram Athmuri
In Partial Fulfillment for the Degree of
MASTER OF SCIENCE
Major Department: Industrial and Manufacturing Engineering
December 2011
Fargo, North Dakota
North Dakota State University Graduate School Title
Transparent and Crack‐Free Silica Aerogels By
Kalyan Ram Athmuri
The Supervisory Committee certifies that this disquisition complies with North Dakota State University’s regulations and meets the accepted standards for the degree of
MASTER OF SCIENCE
SUPERVISORY COMMITTEE:
Dr. Val Marinov Chair
Dr. Angel Ugrinov
Dr. Jing Shi
Dr. Xinnan Wang
Approved:
04/12/2012 Dr. Om Prakash Yadav Date Department Chair
ii

iii
ABSTRACT
The process of making silica aerogels has been studied in detail over the past two decades
due to its usage in a wide range of low end applications such as thermal insulators, super‐
capacitors etc., as well as high end applications like particle physics, space explorations. These
applications call for control over the properties of aerogels, such as their transparency, density,
porosity, pore size, and integrity. However, despite all the past research, controlling properties of
aerogels is still not a fully developed science, a lot more research needs to be done.
The literature on silica aerogels does not cover the study of the relation between
transparency and cracks in aerogels – which can be a key factor in making aerogels for many
applications. Hence, optimization of the transparency and integrity of the aerogels in order to
obtain high transparency and low cracks was attempted in this thesis.

iv
TABLE OF CONTENTS
ABSTRACT .......................................................................................................................................... iii
LIST OF TABLES ..................................................................................................................................viii
LIST OF FIGURES ................................................................................................................................. ix
LIST OF APPENDIX TABLES ................................................................................................................... x
LIST OF APPENDIX FIGURES ................................................................................................................ xi
CHAPTER 1. LITERATURE REVIEW ....................................................................................................... 1
1.1 Introduction .............................................................................................................................. 1
1.1.1 What is an aerogel? ............................................................................................................ 1
1.1.2 Unique properties of aerogels ........................................................................................... 2
1.1.3 Application ......................................................................................................................... 2
1.2 Synthesis of aerogels ................................................................................................................. 6
1.2.1 Sol‐Gel chemistry ............................................................................................................... 6
1.2.2 Silica alcogel ....................................................................................................................... 6
1.2.3 Supercritical drying ............................................................................................................ 8
1.3 Objective ................................................................................................................................. 12
1.3.1 Problem statement .......................................................................................................... 12
1.3.2 Research objective ........................................................................................................... 12
1.3.3 Research tasks .................................................................................................................. 13
CHAPTER 2. TMOS BASED AEROGELS ............................................................................................... 14

v
2.1 Phase 1: Slow and quick diffusion ........................................................................................... 14
2.1.1 Aim of experiment ........................................................................................................... 14
2.1.2 Background ...................................................................................................................... 14
2.1.3 Design of experiment ....................................................................................................... 16
2.1.4 Experimental procedure................................................................................................... 17
2.1.5 Experimental results and discussion ................................................................................ 23
2.2 Phase 2: Optimization ............................................................................................................. 28
2.2.1 Aim of experiment ........................................................................................................... 28
2.2.2 Design of experiment ....................................................................................................... 28
2.2.3 Experimental procedure................................................................................................... 29
2.2.4 Experimental results and discussion ................................................................................ 29
2.3 Phase 3: Glycerol ..................................................................................................................... 31
2.3.1 Aim of experiment ........................................................................................................... 31
2.3.2 Design of experiments ..................................................................................................... 32
2.3.3 Experimental procedure................................................................................................... 32
2.3.4 Experimental results and discussion ................................................................................ 32
CHAPTER 3. TEOS BASED AEROGELS ................................................................................................. 34
3.1 Introduction ............................................................................................................................ 34
3.2 Using cubical mold .................................................................................................................. 34
3.2.1 Experimental procedure................................................................................................... 34

vi
3.2.2 Result and discussion ....................................................................................................... 35
3.3 Using Teflon® mold ................................................................................................................. 35
3.3.1 Experimental procedure................................................................................................... 35
3.3.2 Result and discussion ....................................................................................................... 35
3.4 Silbond® based aerogels ......................................................................................................... 35
3.4.1 Aim of experiment ........................................................................................................... 36
3.4.2 Design of experiment ....................................................................................................... 36
3.4.3 Experimental procedure................................................................................................... 37
3.4.4 Results and discussion ...................................................................................................... 37
CHAPTER 4. CONCLUSIONS ............................................................................................................... 39
4.1 TEOS based .............................................................................................................................. 39
4.1.1 Phase 1: Slow and quick diffusion .................................................................................... 40
4.1.2 Phase 2: Optimization ...................................................................................................... 41
4.1.3 Phase 3: Glycerol .............................................................................................................. 41
4.2 Future work ............................................................................................................................. 41
REFERENCES ...................................................................................................................................... 42
APPENDIX .......................................................................................................................................... 47
Equipment ..................................................................................................................................... 47
Autoclave ................................................................................................................................... 47
Design specification .................................................................................................................. 47

vii
Description of the autoclave ..................................................................................................... 48
Materials required ........................................................................................................................ 48
Molds for the gels ......................................................................................................................... 49
Requirement ............................................................................................................................. 49
Description of different molds designed ................................................................................... 49
Transparency characterization: Spectrophotometer .................................................................... 50
Gel making procedure ................................................................................................................... 50
Gel solution preparation ........................................................................................................... 50
Aging .......................................................................................................................................... 51
Ethanol exchange ...................................................................................................................... 52
Aerogel making ............................................................................................................................. 53
Autoclave purging ..................................................................................................................... 53
Gel loading ................................................................................................................................ 54
CO2 exchange ............................................................................................................................ 55
Supercritical drying ................................................................................................................... 57
Phase 1 Experiment data analysis ................................................................................................. 58
Phase 2 Experiment data analysis ................................................................................................. 59

viii
LIST OF TABLES
Table Page
1. Physical properties of silica serogels [4] ......................................................................................... 3
2. Molar ratios of starting solutions for good transparency and integrity of silica aerogels ............ 15
3. Molar ratio combinations of TMOS, Methanol, NH4OH, H2O used for the slow diffusion experiment ................................................................................................................................... 17
4. Molar ratio combinations of TMOS, Methanol, NH4OH, H2O used for the quick diffusion experiment ................................................................................................................................... 18
5. Pixcavator® settings ...................................................................................................................... 23
6. Transparency values for aerogels obtained by slow diffusion ...................................................... 24
7. Transparency values for aerogels obtained by quick diffusion ..................................................... 24
8. Crack values for slow diffusion ...................................................................................................... 25
9. Molar ratios of starting solutions for phase 2 experiments .......................................................... 28
10. Gel sample distribution in random order for the 2 batches ....................................................... 29
11. Transparency measurements for phase 2 experiment ............................................................... 30
12. Crack measurements for phase 2 experiment ............................................................................ 30
13. The molar ratios and sample numbers of sol‐gel solutions for phase 3 experiments ................ 32
14. Transparency measurements of aerogels obtained from phase 3 experiment .......................... 33
15. Volume of chemicals used to make each of the 18 gels for Silbond® based experiment .......... 36
16. Transparency and crack ratings for the aerogels obtained from the Silbond® based experiments ................................................................................................................................ 38

ix
LIST OF FIGURES Figure Page
1. Schematic structure of a silica aerogel [3] ...................................................................................... 2
2. Chemical reactions during alcogel formation [3] ............................................................................ 7
3. Representation of the contracting surface forces in pores during drying ................................... 9
4. Scheme of the pressure and temperature variation on the solvent phase diagram during a gel supercritical drying process. The shaded area represents the supercritical region (SCF), where C is the critical point; Tr represents the triple point, and 1 to 5 are random points in the phase diagram [4] ..................................................................................................................................... 10
5. UV‐VIS Spectrophotometer ........................................................................................................... 19
6. Inside view of UV‐VIS spectrophotometer .................................................................................... 19
7. Example of transmittance measurement obtained by UV‐VIS spectrophotometer ..................... 20
8. (a) Top view; (b) Side view; (c) Side view with 90 degree rotation ............................................... 21
9. Schematic diagram of the setup for taking pictures of aerogel samples ...................................... 22
10. (a) Image from the camera, (b) Image after cropping, (c) Image after converting to Black and White .......................................................................................................................................... 22
11. Analysis of a Black and White image of an aerogel sample by Pixcavator® ............................... 23
12. Interaction plot of methanol:TMOS and NH4OH:TMOS molar ratios for transparency values .. 26
13. Interaction plot of methanol:TMOS and NH4OH:TMOS molar ratios for Crack sizes ................. 26
14. Transmittance versus Glycerol:TMOS molar ratio ...................................................................... 33
x
LIST OF APPENDIX TABLES
Table Page
A1. Autoclave design requirements and solutions………………………………………………………………………..47
A2. UV‐2501PC Spectrophotometer specifications…………………………………………………………………….…50

xi
LIST OF APPENDIX FIGURES
Figure Page
A1. Autoclave……………………………………………………………………………………………………………………………….48

1
CHAPTER 1. LITERATURE REVIEW
1.1 Introduction
The process of making silica aerogels has been studied in detail over the past two decades
due to its usage in a wide range of low end applications such as thermal insulators, super‐
capacitors etc., as well as high end applications such particle physics, space explorations, etc.
(Refer Section 1.1.1 – Applications). And these applications call for control over the properties of
the aerogels, such as their transparency, density, porosity, pore size, and integrity.
The typical aerogel making process consists of the following steps: forming a solution (sol),
gelation (gel), aging, and drying. The gel making involves preparing a silica based gel using
precursors that act as the source of silica and polymerizing the precursor to form an intricate
nano‐scale network of silica molecules and agglomerates, whose voids are filled with a liquid
(could be water, solvents like ethanol, methanol, acetone, etc.), thus forming a gel. The gel drying
process involves supercritically drying the liquid in the gel. This is done because under normal
conditions, when the gel is dried, it shrinks due capillary pressure applied on its pores by the liquid
in the gels. This capillary pressure leads to mechanical damage of the gel as the tension can reach
up to 100‐200 MPa [1].
1.1.1 What is an aerogel?
Aerogels can be transparent, opaque, and colorless or have different colors such as red,
black etc. depending on the precursors and additives used to make it. The most common type of
aerogel is silica aerogel which is transparent and colorless, while another common type of aerogel
is carbon aerogel which is completely opaque and black. An aerogel has a porous structure similar
to a sponge, except the pores are in the range of 2‐100nm [2] in size and much more densely

pac
very
1.1
to a
rang
extr
hav
pro
1.1
The
the
ked resulting
y brittle.
.2 Unique p
Aerogels
any other type
ge of 2 to 100
remely large
ve very good t
perties of sili
.3 Applicati
Due to t
ese applicatio
aerogel bein
g in the aerog
Figur
roperties of
s are not natu
e of materials
0nm, with the
surface areas
thermal insul
ca aerogels is
on
heir unique p
ns of aerogel
g used.
els being extr
re 1. Schemat
f aerogels
urally occurrin
s. They have v
e pores being
s (as high as 1
ation propert
s given in Tab
properties, ae
s have been c
2
remely light w
tic structure o
ng materials a
very high por
g open. Becau
1000 m2/g) [2
ties due to ve
ble 1.
erogels have b
categorized a
weight (see F
of a silica aero
and have very
rosity (as high
use of such a
]. Some aero
ery low heat t
been used in
according to t
igure 1). Aero
ogel [3]
y unique prop
h as 99%), and
porous struct
gels like silica
transfer. The
a wide variet
the major typ
ogels are usua
perties comp
d pore sizes i
ture, they hav
a aerogels als
detailed phys
ty of applicati
pe of property
ally
ared
n the
ve
so
sical
ions.
y of

3
Table 1. Physical properties of silica serogels [4]
Property Value Comments Apparent density
0.003‐0.5 g/cm3 Most common density is 0.1g/cm3 (ρair = 0.001g/cm3)
Inner surface area
500‐1500 m2/g As determined by nitrogen adsorption/desorption A cubic centimeter of an aerogel has about the same surface area
as one soccer field) Solid
percentage in volume
0.13‐15 % Typically 5 % (95 % free space)
Mean pore diameter
20‐150 nm As determined by nitrogen adsorption/desorption (varies
with density) Primary particle diameter
2‐5 nm Determined by transmission electron microscopy
Index of refraction
1.007‐1.24 Very low for solid material (nair= 1.004)
Thermal tolerance
Up to 500 0 C Shrinkage begins slowly at 500 oC, increases with increasing temperature. Melting point is ~1200oC
Poisson’s ratio 0.2 Independent of density, similar to dense silica.
Determined using ultrasonic methods. Young’s modulus
0.1‐300 MPa Very small (<104) compared to dense silica
Tensile strength
16 kPa For density of 0.1 g/cm3
Fracture toughness
0.8 kPa.m1/2 For density of 0.1 g/cm3. Determined by 3‐point bending
Dielectric constant
1.1 For density of 0.1 g/cm3, very low for a solid material (kair=
1) Acoustic
impedance 104 Kg/m2.s Determined using ultrasonic methods al KHz frequency.
Sound velocity through the medium
20‐800m/s 100 m/s for density of 0.07 g/cm3, one of the lowest
velocities for a solid material
Optical property
Transmittance>90% (630nm)
Transparent‐blue haze
Thermal conductivity
0.02 W/mK (20oC) Very low thermal conductivity. 2 cm slab provides the
same insulation as 30 panes of glass
Aerogels have very high surface area due to their high porosity and open pore structure.
Which makes them ideal as catalysts in chemical reactions [5, 6, 7]. The high porosity and surface
area of aerogels has also lead to its application as filters [8] and desiccants [9].

4
Carbon aerogels are electrically conductive and have high surface area, which lead to their
application as energy storing devices known as ‘aerocapacitors’. These aerocapacitors have high‐
energy density and uses an electrochemical double‐layer capacitor made of carbon aerogels [10].
Such capacitors can release energy much faster than conventional batteries.
Carbon aerogels have also been used in capacitive deionization process, in which stacked carbon
aerogel electrodes are used to purify contaminated water by generating an electric field between
the carbon aerogel electrodes. This process is cost‐effective, since it uses only electricity and no
other additional chemicals to operate. [11]
The transparency of silica aerogels along with their extremely high thermal insulation has
made them very attractive for use in providing additional insulation in double walled windows
where the silica aerogels could be inserted between the two panes in the window [12, 13].
Silica aerogels can also be used to prepare very pure silica based glass by the process of
sintering [8].
Modern research (starting from 1980s) on silica aerogels was accelerated by the need for
silica aerogels in Cherenkov detectors. Cherenkov detectors are used in particle physics related
experiments where Cherenkov light passing through transparent materials is measured. The best
way to do this is called ‘threshold’ type Cherenkov detector which requires the transparent
material to have a very low refractive index (1.007 – 1.03). And silica aerogels were found to be
the best fit this purpose due to their low refractive indices.
Aerogels have been found to exhibit some of the lowest thermal conductivities among all
solids. This is because of the unique structure of the aerogel which forces the heat to travel
through a very narrow and labyrinth chain of the solid skeleton to reach the other side. Silica

5
aerogels have a thermal conductivity as low as 0.013W/m.K to 0.004W/m.K. This makes it very
attractive for a wide variety of insulation applications such as insulation in architecture,
refrigerators, vessels etc. [14, 15]
Aerogels also have very unusual acoustical and mechanical characteristics because of their
unique structure. The velocity of sound in an aerogel can be as low as 30m/s which are much
lower than the velocity of sound in air (343 m/s). Since aerogels have very low density as well as
very low sound velocity in the material, they have the lowest mechanical impedance of all solids
(mechanical impedance is a product of density and velocity of sound in the material). This low
value of mechanical impedance of aerogels is used in air‐coupled piezoelectric transducers, where
lower impedance results in better performance of the transducers [16, 17]. Aerogels are also used
for sound absorption [17].
Silica aerogels are very good electrical insulators and also have the lowest dielectric
constant for a solid material (dielectric constant k = 1.1), which makes it useful in electronics
where the signal propagation speed increases with the decrease in the dielectric constant of the
surrounding electrical insulation [18]. Silica aerogels can also be used as high voltage insulator in
bulk form [18]. Carbon aerogels can be used in batteries and super‐capacitors [10].
Aerogels have been used to capture micron sized space dust in Space Shuttle experiments
[19]. Aerogels were also used as insulators in the Mars Rover [20]

6
1.2 Synthesis of aerogels
1.2.1 SolGel chemistry
Synthesis of aerogel starts with forming a gel that has porous structure whose pores are
filled with liquid. When the liquid in the pores are replaced with air without altering the network
structure of the gel, an aerogel is obtained.
Nicola et al. [3] explains how the gel is formed from a ‘sol’. In a sol, particles of 1‐1000 nm
diameter are dispersed in a liquid. The gel is formed from a sol by hydrolysis and then
condensation of the particles on the sol. The resulting gel has a sponge‐like porous structure with
the polymerized particles forming a skeletal network and the pores formed by the skeletal
network filled with liquid.
1.2.2 Silica alcogel
The original process of making silica gels developed by S.S. Kistler in 1931 used to take
weeks to produce each sample of aerogel which was too long a period when research on aerogels
was rekindled decades later in 1962 by a French group working with S.J. Teichner. This lead to the
nervous breakdown of one of his students who was working with him on this project, as he was
worried that it would take years to finish his thesis at that rate. However, by the time he
recovered a new and much quicker method was developed that used Tetramethoxysilane (TMOS),
which was dissolved in methanol and hydrolyzed with water to form a silica gel [21].
The gels prepared to make silica aerogels, is most commonly derived from
tetraalkoxysilanes Si(OR)4 precursors [3] which are hydrolyzed (a reaction in which H2O molecule
splits into H+ cations and OH‐ anions and reacts with a different molecule by breaking it down, in
this case ‐ the reaction of Si‐OR with water to form Si‐OH and ROH) and then condensed ( a

7
reaction in which two molecules react with each other to form a single large molecule and smaller
residual molecule, which is usually H2O. e.g. the reaction of Si‐OH and Si‐OH to produce Si‐O‐Si
polymer and H2O) in a solution of water, alcohol and catalysts (acidic and/or basic). The chemical
reactions occurring during the gel formation are shown in Figure (2).
Figure 2. Chemical reactions during alcogel formation [3]
Teratramethoxysilane (TMOS) and tetraethoxysilane (TEOS) are two of the most common
precursors used for making silica aerogels. Wagh et al. [22] compared silica aerogels derived from
TMOS and TEOS and found that TMOS based silica aerogels had higher transmittance than TEOS
based aerogels. Also, TMOS based aerogels had narrower pore size distribution and larger pore
radii than TEOS based aerogels. Methytrimethoxysilane (MTMS) was used by Rao et al. [23] as a
co‐precursor along with TMOS to study the optical properties of the resulting hydrophobic silica
aerogels, and it was found that the transmittance of silica aerogels decreased with increase in
MTMS concentration with respect to TMOS. Xu et al. [24] used polyethoxydisiloxanes (PEDS) as
precursor to produce ultralow density silica aerogels.
Two‐step process is a slightly different process of gel preparation in which the precursor is
partially hydrolyzed and partially condensed in the first step with sub‐stoichiometric amount of
water and acidic catalyst. In the second step, the precursor is fully hydrolyzed with water and

8
basic catalyst [25]. Bhagat et al. [26] studied the effect of processing parameter on silica aerogels
produced by two‐step process and found that higher acid concentrations and lower basic
concentrations increased transparency of the aerogel, but also resulted in cracking of the aerogel.
Increase in ethanol/TEOS molar ratio also resulted in increased transparency of the aerogel.
Evaggelos et al. [27] studied effect of different types of Tetraalkyammonium fluoride
catalysts on the properties of silica aerogels. It was found that tetrabutyl and tetraoctyl
ammonium fluoride provides highest transparency of the silica aerogel.
It has been found that aging solutions and aging periods affect the properties of aerogels
by affecting the Oswald ripening of the silica structure in the gel [2]. Oswald ripening is a
phenomenon in which silica particles are transferred within the gel to be deposited on the necks
in the silica structure. Einarsrud et al. [28] studied the effect of aging conditions on the effect of
silica aerogel properties and found that, aging in water and water+ethanol solutions result in
increased stiffness, strength and permeability of aerogels, which in turn result in crack‐free
aerogels after supercritical drying.
1.2.3 Supercritical drying
Supercritical drying is one of the most common methods of producing aerogels from gels
by replacing the liquid in the pores of the gel with air. When the liquid in the pores of a gel is
evaporated under normal conditions, the capillary forces acting on the skeletal network of the gel
by the liquid leads to mechanical failure of the skeletal network (See Figure 3). In order to avoid
this failure, the capillary forces applied by the liquid would have to be eliminated. This can be
achieved by bringing the liquid in the gel to a supercritical state (see Figure 4) by increasing
temperature and pressure of the liquid (the temperature and pressure required to bring a liquid to
supercritical state depends on the type of liquid).

9
Figure 3. Representation of the contracting surface forces in pores during drying
Supercritical fluid is a phase which occurs when a liquid is compressed and heated above
its critical point (See Figure 4). At this state, the fluid displays properties of both a liquid as well as
gas. The supercritical fluid has solubility properties similar to that of a liquid while at the same
time it exhibits no capillary forces, just like a gas. Also, any type of supercritical fluid can be
dissolved in any other type of supercritical fluid; just any type of gas can mix with any other type
of gas.
The liquid in a gel (used for producing silica aerogels) mostly consist of water and alcohol.
The temperatures and pressures required to bring either water or alcohol (mostly ethanol or
methanol) are extremely high – supercritical condition for water is 374oC and 22063.22 Kpa (3200
psi), ethanol is 190.9oC and 6140.264 Kpa (890.57 psi), and methanol is 189.6oC and 8085.758 Kpa
(1172.74 psi). In the case of water the conditions required are too high, requiring very robust and
expensive autoclaves, whereas the conditions required to bring ethanol and methanol to
supercritical state simply makes it dangerous (In 1984, a 3000 liter autoclave at the laboratory of
Network
Pore Fluid
Pore

Airg
To a
the
Kpa
with
dan
Fig
a ge
C
liqu
che
liqu
glass using alc
avoid such da
gels could be
a (1071 psi), w
h this process
ngers involved
gure 4. Schem
el supercritica
C is the critica
While et
uid in the gel w
aper than me
uid CO2 inside
cohol based s
angerous and
e replaced wi
which is much
s of replacing
d in the super
me of the pres
al drying proc
al point; Tr rep
thanol and m
would first ha
ethanol) in an
the autoclav
supercritical d
expensive m
th liquid CO2
h safer and ch
g methanol in
rcritical dryin
ssure and tem
cess. The shad
presents the
ethanol are m
ave to be fully
n ethanol bat
ve
10
drying proces
methods of pe
whose super
heaper to ach
the aerogel w
g process.
mperature var
ded area repr
triple point, a
diagram [4]
miscible with
y replaced wi
h and then th
ss exploded ‐
rforming sup
rcritical condi
hieve [29]. Tew
with liquid CO
riation on the
resents the su
and 1 to 5 are
]
liquid CO2, w
th very pure
he ethanol in
destroying th
percritical dry
itions are 31.
wari et al. [30
O2 in order to
e solvent phas
upercritical re
e random poi
water is not [2
ethanol (etha
the gel can b
he entire facil
ing, the liquid
1oC and 7384
0] first came u
o drastically re
se diagram du
egion (SCF), w
nts in the pha
29]. Hence the
anol being
be replaced w
ity).
d in
4.285
up
educe
uring
where
ase
e
with

11
Rogacki et al. [1] studied the effect of diffusion rate of ethanol into liquid CO2 on cracking
of silica aerogel. In the experiment they performed the gel solution was prepared with
TEOS:H2O:EtOH:NH4OH molar ratio of 1:6:6:(5 X 10‐5), aged for 80 days and placed in an autoclave
with a volume of 60 ml. The gel size was 36 X 10 X 10 mm3. The starting temperatures were 20oC
and 25oC. Once the gel was placed in the autoclave, the excess ethanol was removed in the first 15
min. Then the slow draining of ethanol+liquid CO2/siphoning of liquid CO2 was done with varying
durations ranging between 15‐90 min. Then the system was heated up to 40oC for 15 min, which
brought the CO2 to supercritical state. Next the pressure in the autoclave was reduced to
atmospheric pressure over a period of 15 min.
Zoran et al. [31] studied the effect of diffusion rate of methanol into liquid CO2 on cracking
of silica aerogel. In the experiment they performed, the gel solution was prepared with
TMOS:H2O:MeOH:NH4OH molar ratio of 1:4:6:0.01, aged for 10 days and placed in an autoclave
with a volume of 100 ml. The gel size was diameter 14mm and 40mm height. The starting
temperatures were 20oC and 25oC. Once the gel was placed in the autoclave, the excess ethanol
was removed in the first 30 min. Then the slow draining of ethanol+liquid CO2/siphoning of liquid
CO2 was done with varying durations ranging between 30‐120 min. Then the system was heated
up to 40oC for 15 min, which brought the CO2 to supercritical state. Next the pressure in the
autoclave was reduced to atmospheric pressure over a period of 15 min.
The resulting aerogels consist of transparent zone and damaged zone. The damaged zone
is caused due to unsteady‐state diffusion of solvent (ethanol or methanol) and liquid CO2. The
unsteady state diffusion occurs when solvent and liquid CO2 mixture is below the binary critical
curve where they are not miscible and exist in two separate phases, which leads to capillary forces
inside the gel during the diffusion of solvent and liquid CO2.

12
When the diffusion rate is too high, some of the ethanol/methanol still remains inside the
aerogel and if its concentration is >5%, the mixture would not reach supercritical state when
heated to 40oC (which is required for 5% concentration [1, 31]. The place where the
ethanol/methanol concentration remains >5% forms the damaged zone.
The damaged zone depends on the distribution of concentration in the gel during the
diffusion of CO2. For simple geometries, the shape and size of the damaged zone can be predicted
as a function of diffusion time. The papers [31, 1] however do not precisely define what a
damaged zone is nor do they mention how they have been measured.
1.3 Objective
1.3.1 Problem statement
During initial attempts at making silica aerogels in order to gain some expertise, it was
noticed that almost all aerogels were cracked. It was also seen that the concentration of catalysts
and ethanol during the gel making (TEOS based) seemed to affect the cracking and transparency
of the aerogels (Refer to section 3.3). However there seems to be no literature available to relate
the level of cracking with molar ratios of starting chemical mixtures, which makes it impossible to
make an educated estimate of what combination of the starting chemicals needs to be used to
produce crack‐free aerogels with maximum possible transparency.
1.3.2 Research objective
In applications such as Cherenkov detectors the Cherenkov light passing through silica
aerogel is measured which requires the silica aerogel to be very transparent and at the same time
have no cracks either, so that the light passing through the aerogel is not disturbed and thus affect
their measurement. In space shuttle experiments the silica aerogels are used to capture space

13
dust because when the dust gets stuck in the aerogel, it leaves a trail behind it inside the aerogel
thus making it easy to locate the dust particles and remove them from the aerogel. Obviously the
aerogel would have to be very transparent in order to locate the dust particle and at the same
time it should also be crack‐free so that dust particles striking the aerogels don’t alter their
trajectory and depth of penetration. The literature on silica aerogels, however, does not cover the
study of the relation between transparency and cracks in aerogels. Hence, optimization of the
transparency and integrity of the aerogels in order to obtain high transparency and low cracks was
attempted.
1.3.3 Research tasks
The literature on production of silica aerogels has already shown clear relationship
between transparency of aerogels and the molar ratio of starting material. Initial attempts at
making silica aerogels had shown that the level of cracking in aerogels is also affected by the
molar ratio of starting materials. In order to find a relationship between transparency and
integrity of the aerogels, control of the transparency of aerogels by controlling the molar ratios of
the starting materials was attempted, and its effect on the cracks of the resulting aerogels was
observed. Thus the relationship between transparency and cracks in the aerogels were observed
as well.
It has been observed that diffusion rate of liquid in gel with liquid CO2 affects the level of
cracking in aerogels [1, 31]. One of the research tasks in this work is to see how the diffusion rate
affects cracking and transparency of the aerogels.

14
CHAPTER 2. TMOS BASED AEROGELS
2.1 Phase 1: Slow and quick diffusion
2.1.1 Aim of experiment
In this experiment, the study the effects of Methanol:TMOS ratio and NH4OH:TMOS ratio
on the transparency and integrity of the aerogels is done. Also the effect of diffusion rate of
ethanol inside the gel into liquid CO2 after the gels are placed in the autoclave is also verified.
2.1.2 Background
While there has been a lot of research done on how to control transparency, density,
porosity and pore size of silica aerogels, very little research could be found on the factors affecting
the formation crack‐free/monolithic silica aerogels with any useful quantitative data. The
information that has been gathered from literature survey about monolithic/crack‐free aerogels
suggest that diffusion rate of solvent in the gel into supercritical fluid can affect cracking of the
aerogel. This implies, when diffusion rate is very quick (all the solvent is drained out 15 min after
liquid CO2 has been siphoned into the autoclave over a period of another 15 min) the resulting
aerogels were found to be completely damaged, and when the diffusion rate of the solvent is slow
(all the solvent is drained out 15 min after liquid CO2 has been siphoned into the autoclave over a
period of another 90 min) the aerogel was found to be monolithic without any cracks [1]. Another
factor to be taken care of in order to obtain crack‐free aerogels is the autoclave pressure before
its heating for supercritical phase so that the liquid does not turn into vapor before achieving
supercritical state (if the autoclave pressure is too low, the liquid CO2 might directly turn into gas
before turning into supercritical state) [32]. It was also observed that narrower pore size
distribution reduces differential pressures during the extraction of solvent in supercritical phase
15
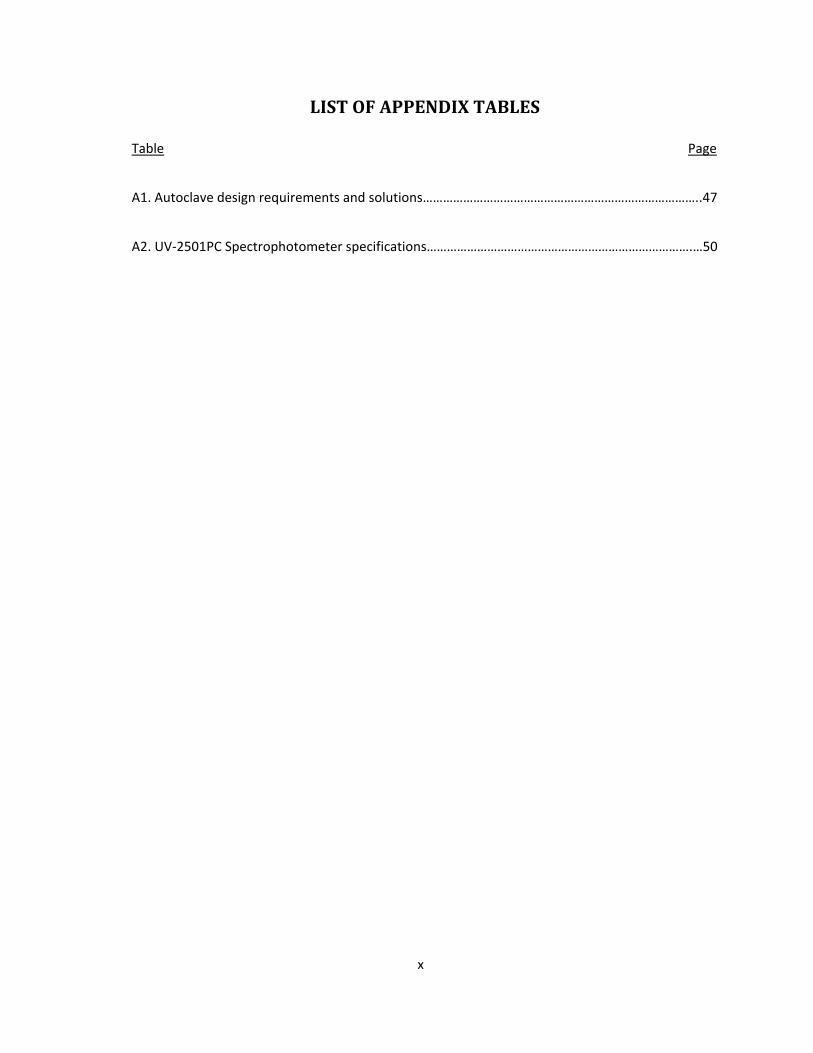
[33]. The permeability of the gel was also found to be a factor influencing the monolithicity of the
aerogel, as higher permeability leads to lesser cracking [34].
The best solvent for TMOS would be methanol, as it is miscible with both TMOS and H2O,
thus facilitating the reaction between TMOS and H2O [35].
The effect of molar ratio of TMOS:H2O:MeOH:NH4OH on the properties of silica aerogels
has been studied to some extent in the past, and it has been found that the molar ratios of
methanol:TMOS and NH4OH:TMOS affect the properties of the aerogel such as transparency,
density, integrity, porosity etc. [33]. But the exact relationship between the molar ratios and
integrity of the aerogels is still unclear, although it is can be said from our own experiments in the
past that NH4OH concentrations directly affect the transparency of the aerogel.
While the molar ratio of TMOS:H2O have been observed to be consistent at ‐ 1:4, the
molar ratios of methanol:TMOS and NH4OH:TMOS would have to be further investigated. The
molar ratio of TMOS:H2O:MeOH:NH4OH suggested by some sources for achieving good
transparency and integrity of the aerogels are shown in Table 2.
Table 2. Molar ratios of starting solutions for good transparency and integrity of silica aerogels
TMOS H2O MeOH NH4OH
1 4 8.75 0.058 [32]
1 3.3 7.3 0.01 [2]
There are two major types of catalysts that are used in the gel making process – acidic and
basic. These acidic and basic catalysts help hydrolysis of the precursor [33, 32]. Only the basic
catalyst which in case of TMOS precursor would be NH4OH was used. NH4OH was used because it
has been well established in the aerogel making process, thus providing a large database to

16
compare the results of the current experiments with (if necessary). While, the other types of
catalysts that have been used/studied have not yielded any significant improvement in the
strength or transparency of the silica aerogels [2, 36, 35].
In the present case it was decided to not pursue any research in effect of aging as past
experiments on aging solutions have provided insufficient evidence to suggest any relationship
between the aging solution and the transparency or integrity of the aerogels.
The aging solution was fixed to be methanol and the optimum aging period set at 48 hours
[2]. Further research might be done in the future on the effect of aging while studying the
permeability, porosity and pore size of the aerogels.
2.1.3 Design of experiment
The most important factors affecting the transparency and integrity of the aerogels that
were investigated upon are ‐ the molar ratios of methanol:TMOS and NH4OH:TMOS, and the
diffusion rate of the liquid in the gel and liquid CO2. Hence a set of experiments studying the
effects of these factors on the transparency and integrity of the aerogels were conducted.
It was decided to conduct an experiment in which 3 molar ratios of methanol:TMOS and 3
molar ratios of NH4OH:TMOS was used, which would require making 9 gels with all the
combinations of the molar ratios. Another set of 9 gels with the same combination of molar ratios
were made to check for consistencies in the gel making, and supercritically dry all 18 gels at once
with a slow rate of diffusion (removing the solvent in the autoclave gradually over a period of 6 –
10 hours) of the liquid in the gels. The same experiment was repeated again to check for
consistency in the drying process and reproducibility.

17
The precursor used was TMOS, molar ratio of TMOS:H2O was 1:4, aging solution was
methanol, and the aging time was 48hrs. Table 3 shows the molar ratio combinations of TMOS,
methanol, NH4OH and H2O used. (Refer to Section A5.2 in the Appendix for details of chemicals
used)
Table 3. Molar ratio combinations of TMOS, Methanol, NH4OH, H2O used for the slow diffusion experiment
Molar Ratios
Gel No. TMOS H20 Methanol NH4OH
1 1 4 8 0.005 2 1 4 12 0.005 3 1 4 16 0.005 4 1 4 8 0.025 5 1 4 12 0.025 6 1 4 16 0.025 7 1 4 8 0.05 8 1 4 12 0.05
9 1 4 16 0.05
Next, 4 sets of gels with 2 molar ratios (highest and lowest molar ratios used in the
previous set of experiments) of methanol:TMOS and NH4OH:TMOS were made. After placing them
in the autoclave, the liquid in the gels was quickly diffused into liquid CO2 (removing all the solvent
in the autoclave right at the beginning). This experiment is done to observe the effect of diffusion
rate on the monolithicity and transparency of the gels. Table 4 shows the molar ratio
combinations of TMOS, methanol, NH4OF and H2O used.
2.1.4 Experimental procedure
Silica alcogels were prepared by mixing TMOS, water, methanol and NH4OH (as discussed
in the Design of experiments section) in syringes such that a total of 5 ml of solution is formed.
Once the sol‐gel solidified into a gel, methanol was poured on top of the gel for aging. The aging

18
process was 72 hours long. After aging the gels were removed from their syringes and placed in
ethanol bath for complete replacement of liquid in the gels with pure ethanol. The ethanol bath
was replaced twice a day for 3 days, at the end which, the gels were placed in the autoclave. The
autoclave was then filled with ethanol until the ethanol level rose above the gels inside the
autoclave. The autoclave was then filled with liquid CO2 and then ethanol‐liquid CO2 exchange was
done. For quick diffusion, the buffer ethanol in the autoclave was immediately removed within 1.5
hours, whereas for the slow diffusion the buffer ethanol was removed over a period of 8 hrs. After
the removal of buffer ethanol, the liquid CO2 in the autoclave was replaced twice a day until no
more ethanol was recovered, and then two extra liquid CO2 exchanges were done (to ensure not
even a small amount of ethanol remains in the gels). Then supercritical drying of the gels was
done to obtain the aerogel samples.
Table 4. Molar ratio combinations of TMOS, Methanol, NH4OH, H2O used for the quick diffusion
experiment
Molar Ratios
Gel No. TMOS H20 Methanol NH4OH
1 1 4 8 0.005
2 1 4 16 0.005
3 1 4 8 0.05
4 1 4 16 0.05
The transparency of the gels were measured using a UV‐Visible light spectrophotometer
(see Figure 5 and 6) (UV‐2501PC, by Shimadzu). The specifications of the spectrophotometer used
are given in Table A2, in Appendix.

19
Figure 5. UV‐VIS Spectrophotometer
Figure 6. Inside view of UV‐VIS spectrophotometer
The integrity of the aerogels is measured by quantifying the cracks in the aerogels. This is
done by first taking pictures of the aerogels. Then Corel Photo‐Paint® software package is used to
convert the pictures to black and white – which highlights the cracks in the aerogels in black. Next,
Aerogel sample
Stand
20
software package known as Pixcavator® by Dr. Saveliev which is designed to analyze images and
extract meaningful information from it is used to measure the black pixels in the aerogels.
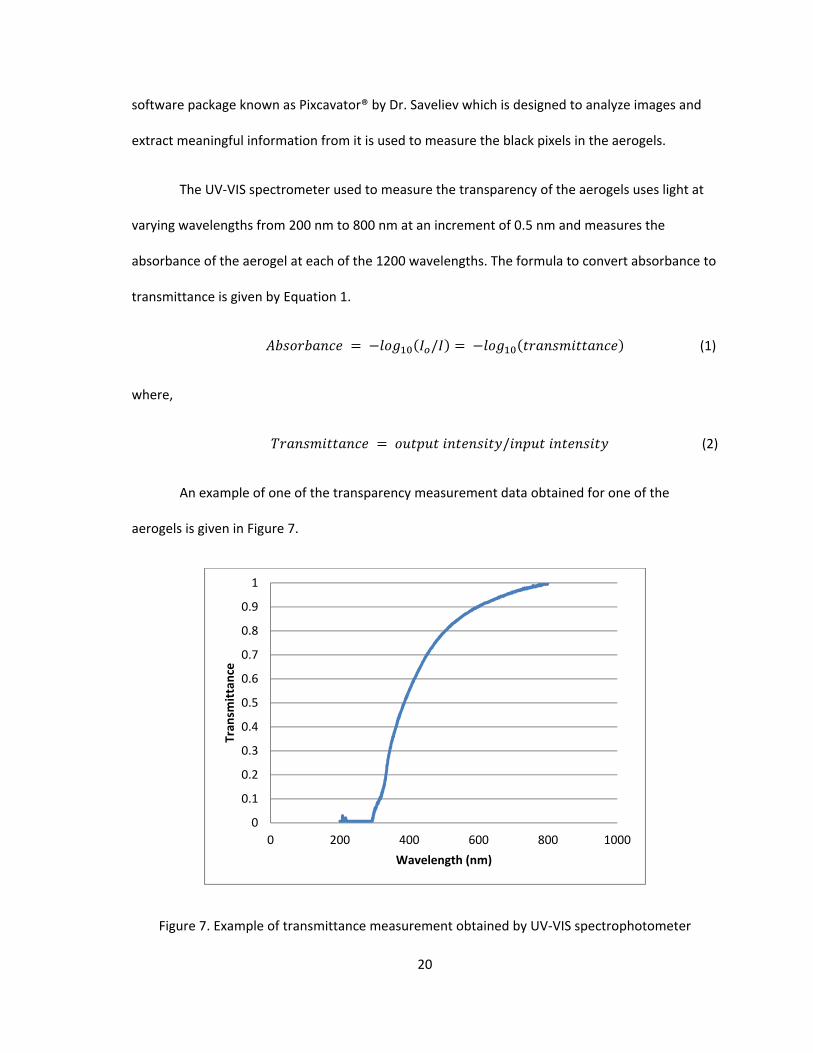
The UV‐VIS spectrometer used to measure the transparency of the aerogels uses light at
varying wavelengths from 200 nm to 800 nm at an increment of 0.5 nm and measures the
absorbance of the aerogel at each of the 1200 wavelengths. The formula to convert absorbance to
transmittance is given by Equation 1.
/ (1)
where,
/ (2)
An example of one of the transparency measurement data obtained for one of the
aerogels is given in Figure 7.
Figure 7. Example of transmittance measurement obtained by UV‐VIS spectrophotometer
0
0.1
0.2
0.3
0.4
0.5
0.6
0.7
0.8
0.9
1
0 200 400 600 800 1000
Tran
smittance
Wavelength (nm)

curv
ligh
sum
eac
from
The aver
ve of transmi
t) and dividin
mmation of (t
h wavelength
Average
In order
m 3 angles as
(a
Figu
The setu
rage transmit
ttance betwe
ng it by (750‐3
ransmittance
h at which the
e transmittan
to quantify t
shown in Fig
a)
ure 8. (a) Top
up for taking t
ttance (see Eq
een the wave
350). The inte
e at each wav
e transmittan
nce ∑tran
he cracks in a
gures 8 (a), (b
view; (b) Side
the pictures is
21
quation 3) is c
lengths of 35
egration for a
elength X 0.5
nce is measur
nsmittance at
aerogels, pict
) and (c)
(b)
e view; (c) Sid
s shown in Fig
calculated by
5nm to 750nm
area under the
5 nm). The 0.5
ed.
t each wavele
ures were tak
de view with
gure 9.
y integrating t
m (which is th
e curve is don
5nm is the int
length * 0.5 /
ken for each
90 degree rot
the area unde
he visible rang
ne by doing a
terval betwee
/ 750‐350
aerogel samp
(c)
tation
er the
ge of
a
en
(3)
ple
22
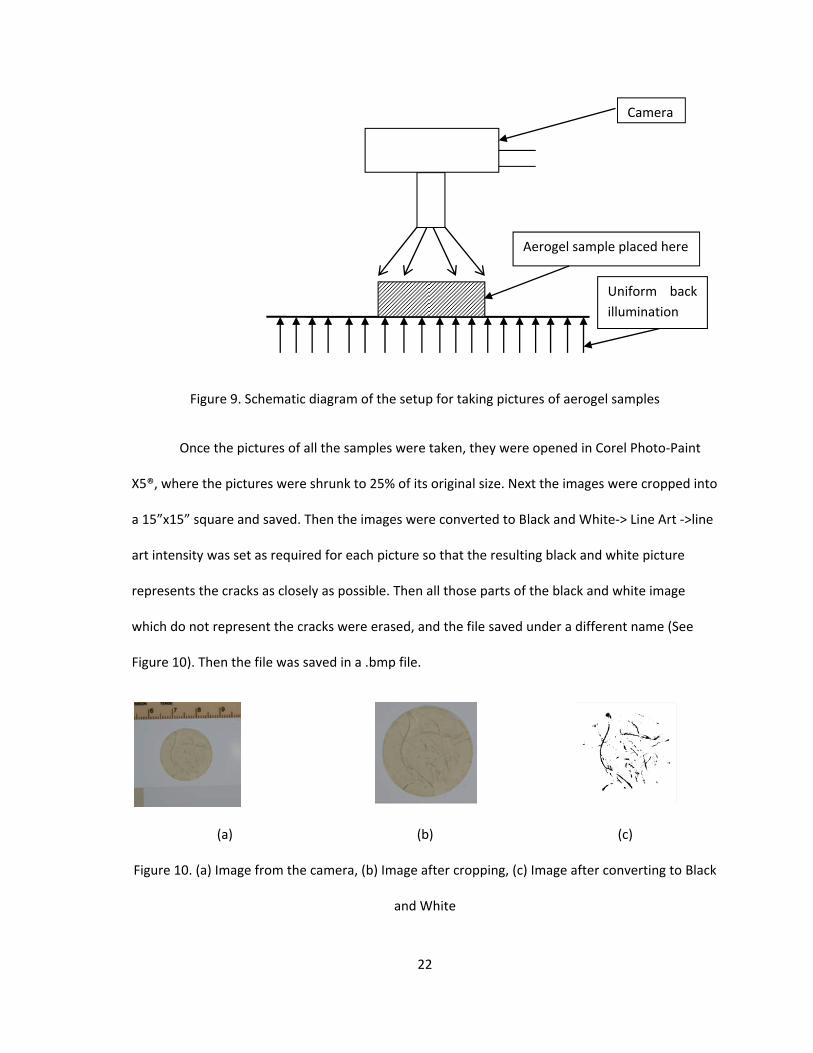
Figure 9. Schematic diagram of the setup for taking pictures of aerogel samples
Once the pictures of all the samples were taken, they were opened in Corel Photo‐Paint
X5®, where the pictures were shrunk to 25% of its original size. Next the images were cropped into
a 15”x15” square and saved. Then the images were converted to Black and White‐> Line Art ‐>line
art intensity was set as required for each picture so that the resulting black and white picture
represents the cracks as closely as possible. Then all those parts of the black and white image
which do not represent the cracks were erased, and the file saved under a different name (See
Figure 10). Then the file was saved in a .bmp file.
(a) (b) (c)
Figure 10. (a) Image from the camera, (b) Image after cropping, (c) Image after converting to Black
and White
Uniform back illumination
Aerogel sample placed here
Camera
23
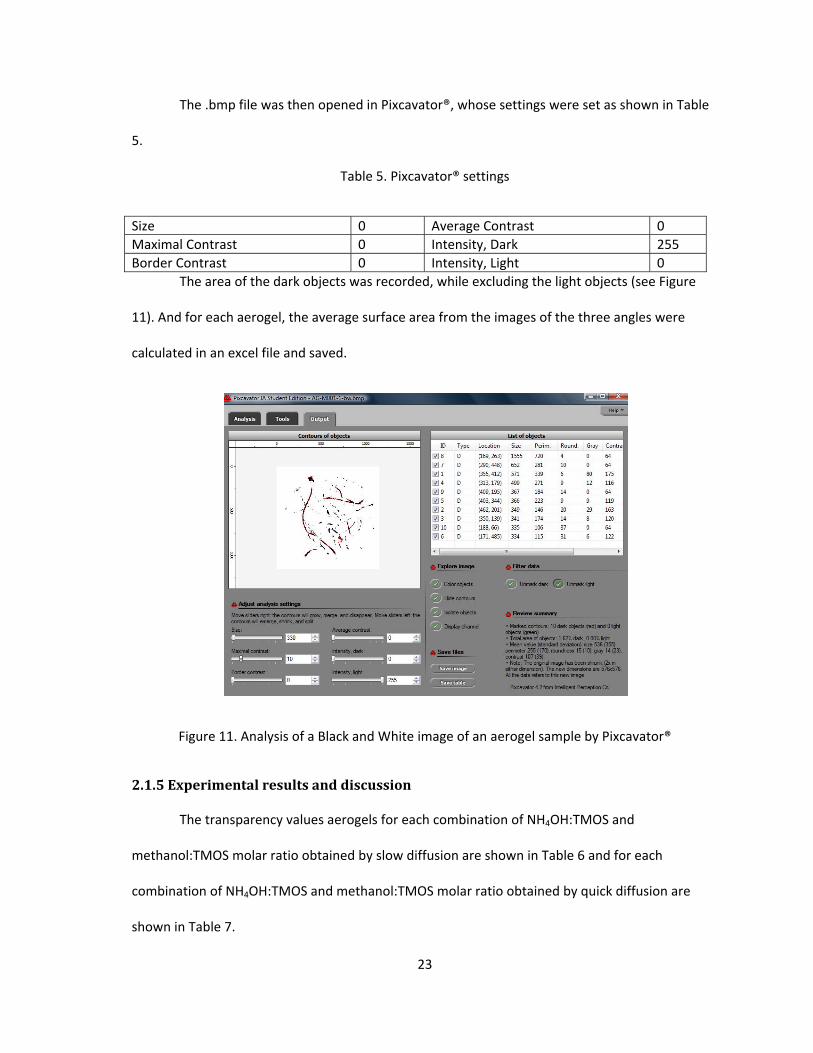
The .bmp file was then opened in Pixcavator®, whose settings were set as shown in Table
5.
Table 5. Pixcavator® settings
Size 0 Average Contrast 0 Maximal Contrast 0 Intensity, Dark 255 Border Contrast 0 Intensity, Light 0
The area of the dark objects was recorded, while excluding the light objects (see Figure
11). And for each aerogel, the average surface area from the images of the three angles were
calculated in an excel file and saved.
Figure 11. Analysis of a Black and White image of an aerogel sample by Pixcavator®
2.1.5 Experimental results and discussion
The transparency values aerogels for each combination of NH4OH:TMOS and
methanol:TMOS molar ratio obtained by slow diffusion are shown in Table 6 and for each
combination of NH4OH:TMOS and methanol:TMOS molar ratio obtained by quick diffusion are
shown in Table 7.

24
Table 6. Transparency values for aerogels obtained by slow diffusion
Molar Ratios Transmittance* Normalized over 350– 750 nm on the scale from 0 to 1
NH4OH:TMOS MeOH:TMOS Run 1 Run 2 Run 3 Average
0.005 8 319.3917 317.6231 314.6603 317.225 0.3965
0.005 12 292.3113 299.2922 308.0545 299.886 0.3749
0.005 16 261.1733 291.1731 285.763 279.3698 0.3492
0.025 8 357.4568 364.7199 365.0088 362.3952 0.4530
0.025 12 348.0946 344.3134 352.5252 348.3111 0.4354
0.025 16 324.7555 332.5778 334.1206 330.4846 0.4131
0.05 8 369.5774 369.9453 368.318 369.2802 0.4616
0.05 12 360.5553 358.962 361.4996 360.339 0.4504
0.05 16 347.5419 344.1985 339.3877 343.7094 0.4296
* ‘Transmittance’ value of an aerogel sample is calculated by integrating the transmittance value of the sample
measured at each wavelength of light from 350nm to 750nm as shown in Equation 3. The units for this kind of
transmittance measurement would be ‘nm’ (the transmittance is simply a ratio, hence it has no units)
Table 7. Transparency values for aerogels obtained by quick diffusion
Molar Ratio
Transmittance*
Normalized
over 350– 750 nm on the scale from 0 to 1 NH4OH:
TMOS MeOH:TMOS
Run 1 Run 2 Run 3 Run 4 Average
0.005 8 313.4705 329.3278 317.2092 318.535 319.6356 0.3995
0.005 16 295.6713 291.8336 301.7675 294.4932 295.9414 0.3699
0.05 8 365.0223 360.5706 360.5224 365.5727 362.922 0.4537
0.05 16 341.759 354.5269 347.6308 347.9722 0.4350
*‘Transmittance’ value of an aerogel sample is calculated by integrating the transmittance value of the sample
measured at each wavelength of light from 350nm to 750nm as shown in equation 3. The units for this kind of
transmittance measurement would be ‘nm’ (the transmittance is simply a ratio, hence it has no units)

25
The aerogels obtained by quick diffusion were observed to be extremely cracked as
compared to slow diffusion, which negates the necessity to analyze those cracks, as the purpose
of making the aerogels with quick diffusion was simply to verify whether there is any significant
difference between the cracks occurring in the quick diffusion‐aerogels and the slow diffusion‐
aerogels. The crack measurements for each aerogels obtained by slow diffusion are shown in
Table 8.
Table 8. Crack values for slow diffusion
Molar Ratio Crack Area*
NH4OH:TMOS MeOH:TMOS Image 1 Image 2 Image 3 Average
0.005 8 11244 15852 15121 14072.33 0.005 12 15896 17635 6475 13335.33 0.005 16 4991 4876 4824 4897 0.025 8 6299 21158 27853 18436.67 0.025 12 5407 3686 3181 4091.333 0.025 16 3890 3261 4343 3831.333 0.05 8 9805 11118 6116 9013 0.05 12 3328 7514 5492 5444.667 0.05 16 5822 2069 1750 3213.667 0.005 8 4086 2583 4297 3655.333 0.005 12 2064 4417 7777 4752.667 0.005 16 1677 2786 3368 2610.333 0.025 8 1455 4043 8907 4801.667 0.025 12 8009 5631 9508 7716 0.025 16 667 8618 1974 3753 0.05 8 2963 5504 2908 3791.667 0.05 12 4156 2960 6252 4456 0.05 16 8956 6710 1954 5873.333 0.005 8 4362 5132 10927 6807 0.005 12 3967 2165 3084 3072 0.005 16 2307 1986 589 1627.333 0.025 8 2239 13995 8955 8396.333 0.025 12 7845 5956 5918 6573 0.025 16 4880 32 4366 3092.667 0.05 8 17028 9324 8388 11580 0.05 12 7356 5792 3344 5497.333 0.05 16 5505 5873 3776 5051.333
* Crack area of each sample of aerogel is calculated by averaging the crack area measured from the
3 angles as shown in Figure 7 (a), (b) and (c). The crack measurement is done by counting the dark
pixels of the cracks in the sample on Pixcavator®

26
The interaction plot of methanol:TMOS and NH4OH:TMOS values for the transparency of
the aerogels is shown in Figure 12. The interaction plot of methanol:TMOS and NH4OH:TMOS
values for the cracks (the crack values of samples with same molar ratios were averaged) in
aerogels is shown in Figure 13.
Figure 12. Interaction plot of methanol:TMOS and NH4OH:TMOS molar ratios for transparency
values
Figure 13. Interaction plot of methanol:TMOS and NH4OH:TMOS molar ratios for Crack sizes

27
Figures 12 and 13 show that there is a clear pattern of relationship between transparency
v/s methanol:TMOS molar ratio and transparency v/s NH4OH:TMOS molar ratio. But there is little
interaction between NH4OH:TMOS and methanol:TMOS molar ratios of the aerogels. It can be
seen that transparency increases with increase in concentration of NH4OH, but it decreases with
increase in concentration of methanol. However, the relationship between cracks v/s
methanol:TMOS molar ratio and cracks v/s NH4OH:TMOS molar ratio is not as clear as it was with
transparency. Still it can be observed that, cracks seem to decrease with increase in concentration
of methanol, whereas the effect of NH4OH on cracks is not obvious. This conclusion is also
substantiated by ANOVA analysis done on the data in Minitab® (Refer Appendix). The ANOVA
analysis also reveals that there is significant interaction between methanol:TMOS and
NH4OH:TMOS molar ratios on the crack measurements in the aerogels.
The correlation between the transparency values and crack measurements for each
aerogel was calculated on Minitab® and the Pearson‐Correlation coefficient was found to be
0.199, which means that there is very little correlation between the transparency and integrity of
the aerogels.
One possible explanation for the lack of clarity in the effect of methanol:TMOS and
NH4OH:TMOS molar ratios on the crack values is the inherent limitation in accurately measuring
the cracks in each aerogel. Also cracking in aerogels occurs due to structural failure of the
extremely intricate and complex structure of the aerogels, which makes the effect of
methanol:TMOS and NH4OH:TMOS molar ratios on the intensity of cracking imprecise. Whereas
transparency of the aerogels is directly related to the initial chemistry of the solution used to
make the aerogels, which leads to very little deviations in the transparency of the aerogels.

28
Also there isn’t any significant difference between the transparency values of the aerogels
obtained by slow diffusion and the aerogels obtained by quick diffusion. This shows that the rate
of diffusion of ethanol from the gels into liquid CO2 does not affect the transparency of the
aerogels.
2.2 Phase 2: Optimization
2.2.1 Aim of experiment
In order to further optimize the transparency and integrity of aerogels using TMOS
precursor, another set of 15 aerogels are prepared to further optimize the transparency by more
closely studying the effect of NH4OH:TMOS and methanol:TMOS molar ratios.
2.2.2 Design of experiment
It was decided to make 15 aerogels with 3 replications, which means 5 aerogels of
different of NH4OH:TMOS and methanol:TMOS molar ratio combinations repeated 3 times. The
molar ratio combinations are shown in Table 9.
Table 9. Molar ratios of starting solutions for phase 2 experiments
Molar Ratio Sample Numbers* NH4OH:TMOS Methanol:TMOS Run 1 Run 2 Run 3 0.025 16 11 12 13 0.025 20 21 22 23 0.030 18 31 32 33 0.035 16 41 42 43 0.035 20 51 52 53
* The sample numbers is the numbers assigned for each sample of gel prepared – with the first digit of the sample
number representing the individual combination of NH4OH:TMOS and Methanol:TMOS molar ratios of the gels and the
second digit representing the replication of each of the combination of NH4OH:TMOS and Methanol:TMOS molar ratios
of the gels

29
It was also decided to randomize the order in which the 15 aerogels was divided into 2
batches during the gel making process. A random order of the gels to be prepared in each batch
was generated and is shown in Table 10.
Table 10. Gel sample distribution in random order for the 2 batches
1st batch 2nd batch 13 51* 53 23 33 11 31 41 32 43 21 22 12 42 52
* The sample numbers is the numbers assigned for each sample of gel prepared – with the first digit of the sample
number representing the individual combination of NH4OH:TMOS and Methanol:TMOS molar ratios of the gels and the
second digit representing the replication of each of the combination of NH4OH:TMOS and Methanol:TMOS molar ratios
of the gels
2.2.3 Experimental procedure
The sample preparation was done the same way as in Phase 1, except there is no quick
diffusion of buffer ethanol after the gels are placed in the autoclave.
The characterization of cracks and transparency of the aerogels is also exactly the same as
it was done in Phase 1.
2.2.4 Experimental results and discussion
The transparency values of aerogels for each combination of NH4OH:TMOS and
methanol:TMOS molar ratio are shown in Table 11.

30
Table 11. Transparency measurements for phase 2 experiment
Molar Ratio Transmittance* Normalized over 350– 750 nm on the scale from 0 to 1 NH4OH:TMOS MeOH:TMOS Run1 Run2 Run3 Average
0.025 16 N/A 312.18 310.81 311.495 0.3894 0.025 20 297.28 306.93 N/A 302.105 0.3776 0.03 18 322.34 323.32 321.09 322.25 0.4028 0.035 16 330.36 327.95 331.23 329.8467 0.4123 0.035 20 321.91 321.56 318.08 320.5167 0.4006
* ‘Transmittance’ value of an aerogel sample is calculated by integrating the transmittance value of the sample
measured at each wavelength of light from 350nm to 750nm.
The results from crack measurements for each aerogel are shown in Table 12.
Table 12. Crack measurements for phase 2 experiment
Molar Ratio Crack value*
NH4OH:TMOS MeOH:TMOS Run1 Run2 Run3 Average
0.025 16 N/A 3824.333 3093 3458.667
0.025 20 706 3153 N/A 1929.5
0.03 18 2377.333 4093 4226.667 3565.667
0.035 16 2614 6501 1563.667 3559.556
0.035 20 3669.667 2516.333 2564.667 2916.889 * Crack area of each sample of aerogel is calculated by averaging the crack area measured from the 3 angles as shown in
Figure 7 (a), (b) and (c). The crack measurement is done by counting the dark pixels of the cracks in the sample on
Pixcavator®
From the results derived from Minitab® (refer Appendix), a relationship between crack
values and methanol:TMOS and NH4OH:TMOS molar ratios was derived (Eq. 5), similarly a
relationship between transparency values and methanol:TMOS and NH4OH:TMOS molar ratios
was derived (Eq. 4). Also it should be noted that the R2 value for the ANOVA analysis on crack
values indicate that the model explains only 18.05% of the crack data. This means any further
analysis based on the model derive from such a data is not reliable.

31
0.4028 – 0.0058 0.0115 0.0078 0.000019 (4)
3565.67 – 542.96 272.07 599.514 222.625 (5)
Using Eq. 4 and 5, optimum values of methanol:TMOS and NH4OH:TMOS molar ratios
were derived using a mathematical solver – Gams®. For the optimization, transparency was given
a range between 0.3937 to 0.4185 and crack value was minimized. The resulting optimum solution
provided by Gams® was – transparency = 0.3937, MeOH:TMOS = 20, NH4OH:TMOS = 0.032, crack
= 2621.504.
2.3 Phase 3: Glycerol
2.3.1 Aim of experiment
Since the previous experiments on TMOS based aerogels have failed to eliminate cracking
in aerogels, it was decided to use glycerol as a drying control chemical additive (DCCA) which has
proved to be effective in preventing cracking of silica aerogels [37]. It has been found that using
small amounts of Glycerol (Glycerol:TMOS molar ratio = 0.025) has resulted in aerogels with lower
density, lesser shrinkage, transparency and monolithicity. Glycerol also resulted in narrower and
more uniform pore size distribution (PSD) [38], which is known to result in lesser cracking of
aerogels due to reduced differential pressures during solvent (liquid CO2) extraction in
supercritical phase [33].

32
2.3.2 Design of experiments
18 aerogels were made with TMOS:methanol:H2O:NH4OH molar ratio kept constant at 1 :
12 : 4 : 0.05 and 6 levels of glycerol:TMOS molar ratio varying from 0 to 0.001 with 3 replications
of the whole set (see Table 13 ).
Table 13. The molar ratios and sample numbers of sol‐gel solutions for phase 3 experiments
Molar Ratio Sample Numbers TMOS H2O MeOH Glycerol NH4OH Run 1 Run 2 Run 3
1 4 12 0 0.05 11 12 13 1 4 12 0.05 0.05 21 22 23 1 4 12 0.2 0.05 31 32 33 1 4 12 0.4 0.05 41 42 43 1 4 12 0.6 0.05 51 52 53 1 4 12 0.8 0.05 61 62 63
2.3.3 Experimental procedure
The sample preparation in this experiment is the same as in Phase 2, with the addition of
Glycerol in the sol‐gel preparation.
Only the transparency values of the aerogels were measured using a spectrophotometer
in the same way as it was done in Phase 1 and Phase 2 experiments, but not the cracks, because
most of the aerogels obtained had no cracks at all.
2.3.4 Experimental results and discussion
The aerogels that were produced had negligible cracks in 7 of the 18 made, while the rest
had no cracks at all. The transparency values for each of the 18 aerogels is shown in Table 14,
along with a graph representing the glycerol:TMOS molar ratio vs. transparency value (see Figure
14).

33
Table 14. Transparency measurements of aerogels obtained from phase 3 experiment
Molar Ratio Transmittance*
Glycerol:TMOS Run1 Run2 Run3 Average Normalized over 350– 750 nm on the scale from 0 to 1
0 359.2399 361.7681 361.7448 360.9176 0.4511 0.05 363.0626 364.7539 363.9961 363.9375 0.4549 0.2 358.1896 351.8159 339.9305 349.9787 0.4375 0.4 354.846 341.9036 342.4334 346.3943 0.4330 0.6 356.6857 336.3333 329.065 340.6947 0.4259
0.8 349.2127 326.0041 303.9639 326.3936 0.4080 * ‘Transmittance’ value of an aerogel sample is calculated by integrating the transmittance value of the sample
measured at each wavelength of light from 350nm to 750nm.
Figure 14. Transmittance versus Glycerol:TMOS molar ratio
The transmittance of the silica aerogels has increased initially and then continues
dropping (although not by much) with increase in the Glycerol:TMOS molar ratio. The shape of the
graph shown in Figure 14 is very similar to that observed by Kulkarni et al [38].
0.4000
0.4100
0.4200
0.4300
0.4400
0.4500
0.4600
0 0.2 0.4 0.6 0.8 1
Tran
smittance
Glycerol:TMOS Molar Ratio
34
CHAPTER 3. TEOS BASED AEROGELS
3.1 Introduction
TEOS was used as the precursor for making aerogels at the beginning, since it was much
cheaper than TMOS and it was not toxic either
3.2 Using cubical mold
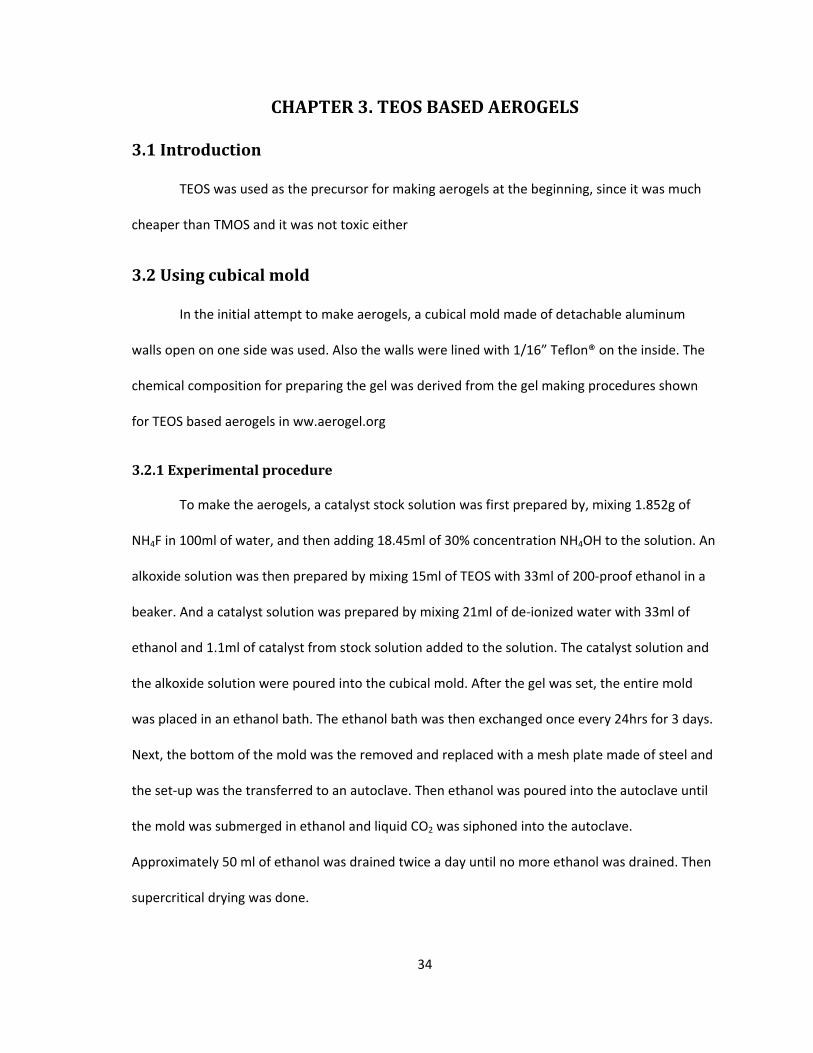
In the initial attempt to make aerogels, a cubical mold made of detachable aluminum
walls open on one side was used. Also the walls were lined with 1/16” Teflon® on the inside. The
chemical composition for preparing the gel was derived from the gel making procedures shown
for TEOS based aerogels in ww.aerogel.org
3.2.1 Experimental procedure
To make the aerogels, a catalyst stock solution was first prepared by, mixing 1.852g of
NH4F in 100ml of water, and then adding 18.45ml of 30% concentration NH4OH to the solution. An
alkoxide solution was then prepared by mixing 15ml of TEOS with 33ml of 200‐proof ethanol in a
beaker. And a catalyst solution was prepared by mixing 21ml of de‐ionized water with 33ml of
ethanol and 1.1ml of catalyst from stock solution added to the solution. The catalyst solution and
the alkoxide solution were poured into the cubical mold. After the gel was set, the entire mold
was placed in an ethanol bath. The ethanol bath was then exchanged once every 24hrs for 3 days.
Next, the bottom of the mold was the removed and replaced with a mesh plate made of steel and
the set‐up was the transferred to an autoclave. Then ethanol was poured into the autoclave until
the mold was submerged in ethanol and liquid CO2 was siphoned into the autoclave.
Approximately 50 ml of ethanol was drained twice a day until no more ethanol was drained. Then
supercritical drying was done.

35
3.2.2 Result and discussion
A white silica powder was derived, with no signs of any aerogel (cracked or otherwise)
3.3 Using Teflon® mold
In order to be able to remove the gel from the mold without damaging the gel, a Teflon®
mold was used. The Teflon® mold consisted of 2” inside diameter, 2” high Teflon® cylinder and a
2” diameter plunger.
3.3.1 Experimental procedure
The gel solution prepared the same way as was done in section 3.2.1, except all quantities
were decreased to 1/3rd and mixed in the Teflon® mold. After the gel was set, ethanol was poured
over the gel in the mold for aging. The gel was aged for 24hrs. After the aging, the gel was
removed by pushing the plunger from the bottom and then sliding the gel from over the plunger.
Next, the gel was placed in an ethanol bath and the bath was exchanged twice a day for 6 days.
Then the gel was placed in an autoclave after which all procedures were performed similar to
what has been mentioned in section 3.1.1.
3.3.2 Result and discussion
A translucent aerogel was obtained, which had a few large cracks through its body.
3.4 Silbond® based aerogels
Silbond H‐5® is a commercially available readymade gel precursor made of pre‐
polymerized TEOS. The gels prepared by such pre‐polymerized TEOS are known as ‘two‐step’ acid‐
base catalyzed gels(since the pre‐polymerized TEOS is made from ethanol, sub‐stoichiometric
amount of water and an acid catalyst, which is later dissolved in ethanol and water in basic

36
conditions) [39]. The usage of Silbond® was also found to result in smaller and narrower pore size
distribution.
3.4.1 Aim of experiment
This experiment is performed to study the effect of concentration of NH4OH, aging
solutions, polyethylene glycol (PEG) on the transparency, porosity, and integrity of the aerogels.
PEG was used because it is known to increase the strength of the solid structure of the aerogel
when added in small quantity in the initial solution used to make gels [40].
3.4.2 Design of experiment
The combinations of different levels used to make the 18 gels are shown in Table 15.
Table 15. Volume of chemicals used to make each of the 18 gels for Silbond® based experiment
Sample Number
Silbond H5® (ml)
EtOH (ml) H2O (ml)
NH4OH (ml)
PEG 5000 (mg)
Aging Solution/conditions
1 AG‐E006 1.25 1.25+0.875 1.875 0.003 0 Ethanol for 72 hrs 2 AG‐E007 1.25 1.25+0.875 1.875 0.003 0 20% H2O/Ethanol for 27 hrs 3 AG‐E008 1.25 1.25+0.875 1.875 0.003 0 20% H2O/Ethanol for 72 hrs 4 AG‐E009 1.25 1.25+0.875 1.875 0.013 0 Ethanol for 72 hrs 5 AG‐E010 1.25 1.25+0.875 1.875 0.013 0 20% H2O/Ethanol for 27 hrs 6 AG‐E011 1.25 1.25+0.875 1.875 0.013 0 20% H2O Ethanol for 72 hrs 7 AG‐E012 1.25 1.25+0.875 1.875 0.025 0 Ethanol for 72 hrs 8 AG‐E013 1.25 1.25+0.875 1.875 0.025 0 20% H2O /Ethanol for 27 hrs 9 AG‐E014 1.25 1.25+0.875 1.875 0.025 0 20% H2O /Ethanol for 72 hrs
10 AG‐E015 1.25 1.25+0.875 1.875 0.003 25 Ethanol for 72 hrs 11 AG‐E016 1.25 1.25+0.875 1.875 0.003 25 20% H2O /Ethanol for 27 hrs 12 AG‐E017 1.25 1.25+0.875 1.875 0.003 25 20% H2O /Ethanol for 72 hrs 13 AG‐E018 1.25 1.25+0.875 1.875 0.013 25 Ethanol for 72 hrs 14 AG‐E019 1.25 1.25+0.875 1.875 0.013 25 20% H2O /Ethanol for 27 hrs 15 AG‐E020 1.25 1.25+0.875 1.875 0.013 25 20% H2O /Ethanol for 72 hrs 16 AG‐E021 1.25 1.25+0.875 1.875 0.025 25 Ethanol for 72 hrs 17 AG‐E022 1.25 1.25+0.875 1.875 0.025 25 20% H2O /Ethanol for 27 hrs 18 AG‐E023 1.25 1.25+0.875 1.875 0.025 25 20% H2O /Ethanol for 72 hrs

37
3.4.3 Experimental procedure
The aerogels were prepared the same way as it was done in the TEOS based experiments,
except, the precursor used in this case was Silbond®.
The pore sizes were to be measured by equipment called Autosorb by Quantachrome
(Model – AS1 Win Version 1.55). The transparency and integrity of the aerogels were rated visually
on a scale of 1 to 5. For transparency 1 being completely opaque and 5 being completely
transparent and similarly for integrity, 1 being very cracked and 5 being no‐cracks. This type of
visual rating was done because the differences in the transparency and cracks of each of the 18
aerogels were very drastic. Also this was only a preliminary experiment to see the approximate
effects of aging period, aging solution, catalyst concentration and PEG, and hence a precise
measurement of transparency and cracking of the aerogels was not required. Whereas, in the
Phase 1, 2 and 3 experiments based on TMOS, the optimum values of transparency and cracks
were being predicted, which required precise measurements of the transparency and crack values
of each aerogel produced.
3.4.4 Results and discussion
The results from characterizing the 18 aerogel are shown in Table 16.
It was decided to not measure pore sizes as it was decided that transparency and integrity
of the aerogels need to be optimized first.

38
Table 16. Transparency and crack ratings for the aerogels obtained from the Silbond® based
experiments
Sample Number Density(Kg/m3) Transparency Cracks 1 AG‐E006 112.4415994 2 5 2 AG‐E007 121.5137343 1 4 3 AG‐E008 102.406076 3 3 4 AG‐E009 92.77496948 3 4 5 AG‐E010 87.73583418 4 2 6 AG‐E011 90.49633432 1 4 7 AG‐E012 76.38978195 5 4 8 AG‐E013 85.81123047 5 2 9 AG‐E014 78.3837627 5 2 10 AG‐E015 99.23615357 1 4 11 AG‐E016 93.14966948 4 5 12 AG‐E017 89.8111303 1 5 13 AG‐E018 90.90792558 4 4 14 AG‐E019 88.46869203 2 4 15 AG‐E020 80.27808299 4 3 16 AG‐E021 76.69414799 4 4 17 AG‐E022 87.47506654 5 3 18 AG‐E023 81.07405094 5 3

39
CHAPTER 4. CONCLUSIONS
Requirements for the design of autoclave needed to make silica aerogels were derived
based the needs of the current research and by studying the autoclave specifications from other
publications [1, 2, 33]. The autoclave was then successfully manufactured based on these
requirements.
4.1 TEOS based
In the first set of experiments that used a cubical mold, the ethanol exchange done on the
gels to remove water from the gels might not have worked because of the gel was being
surrounded by the mold on 5 sides, which led to crushing of the aerogel structure during
supercritical drying. This means the gels will have to be removed from the mold before ethanol
exchange could be done, in order to facilitate complete water/ethanol exchange in the gels by
providing more outer surface area for the exchange to take place. This could also lead to a better
ethanol/liquid CO2 exchange in the autoclave, in case the exchange was not being completed
when the gel was in the mold.
In the Teflon® based mold, the water from the gel was completely removed during
ethanol exchange because of the gel being completely exposed to the ethanol bath from all sides,
allowing easy diffusion of the water from the gel. This led to a solid aerogel being formed after
supercritical drying, without any of the white powder observed in the first experiment due to
residual water in the gel during supercritical drying. The few cracks that were observed in the
aerogel could be attributed to the quick diffusion of ethanol from the gel into liquid CO2 in the
autoclave and extreme rate of pressure reduction during removal of CO2 from the autoclave after
supercritical drying, leading to pressure differentials between the inner and outer parts of the
aerogel in both cases.

40
Finally when Silbond® was used, the data collected from the experiment showed that
NH4OH concentrations clearly affect the transparency of the aerogels. With increase in NH4OH
concentration, the transparency of the aerogel also increases. However, no clear patterns of the
effect of aging conditions or PEG could be seen on the transparency or the integrity of the
aerogels.
4.1.1 Phase 1: Slow and quick diffusion
While there was a clear pattern visible for the effect of methanol:TMOS and NH4OH:TMOS
molar ratios on the transparency of the aerogels, the effect of methanol and NH4OH:TMOS molar
ratios on the cracks produced in the aerogels is not very clear. The transparency of the aerogel
tends to increase with increase in NH4OH:TMOS molar ratio, while it tends to decrease with
increase in methanol molar ratio. The rate of increase of transparency value with increase in
NH4OH:TMOS molar ratio tends to decrease between 0.025 to 0.05 (molar ratio of NH4OH:TMOS).
While there does seem to be a general trend of decrease in cracking of the silica aerogels with
increase in methanol:TMOS molar ratio and an increase in the cracking of silica aerogels with
increase in NH4OH:TMOS molar ratio. However these patterns are not very accurate. These results
are a significant improvement compared to the monolithicity studies done by Rogacki et al [1] and
Zoran et al [31], which have been the best study done on cracking of silica aerogels so far. Also it
has been verified that the quick diffusion of ethanol from gels into liquid CO2 leads to increased
cracking as was observed by Rogacki et al [1] and Zoran et al [31], but does not affect
transparency of the aerogels.
It had been decided to conduct another set of aerogels to further optimize the
transparency and integrity of the aerogels made from TMOS.

41
4.1.2 Phase 2: Optimization
The molar ratios of methanol:TMOS and NH4OH:TMOS that gave optimum value of
transparency and cracks were 20 and 0.032 respectively. I.e. at a methanol:TMOS molar ratio = 20
and NH4OH:TMOS molar ratio = 0.032 an optimum transparency of 0.3937 and crack value of
2621.504 could be achieved. However, the model used to predict the crack values is not very
reliable; hence the optimum value is not reliable either.
4.1.3 Phase 3: Glycerol
During the supercritical drying of the samples, the decompression rate of CO2 was
decreased from the usual 138 Kpa (20 psi/min) to 69 Kpa (10 psi/min) (in an attempt to be extra
careful), which resulted in crack free aerogels in 11 of the 18 aerogel samples, which included the
ones that had no glycerol in them. This shows that although using a DCCA like glycerol might be
helpful in producing crack‐free aerogels, the same might be achieved by simply decreasing the
rate of pressure release in the autoclave. It can also be observed that glycerol concentration
affects the transparency of the aerogels slightly as was observed by Rao et al. [41].
4.2 Future work
In the last set of experiments conducted using TMOS precursor, it was found that most of
the aerogels had none or negligible cracks, however it is not clear whether it was the result of
decreased decompression rate of CO2, or because of the use of glycerol or both. Hence there is a
scope for further investigation to take place in order to determine how cracking of aerogels can be
completely eliminated. The future experiments could first study the exact effect of decreased rate
of CO2 on the aerogels without using glycerol.

42
REFERENCES
1. Diffusion of ethanol ‐ liquid CO2 in silica aerogel. G. Rogacki, P. Wawrzyniak.: Journal of Non‐
Crystalline Solids, 1995.
2. www.aerogel.org. [Online]
3. Nicola Husing, Ulrich Shubert. Aerogels.: Wiley‐VCH Verlag GmbH & Co., 2005.
4. Gerona, Magda Moner i. Silica Aerogels: Synthesis and Characterization. 2002.
5. Application of Alumina Aerogels as Catalysts. Hiroshi Hirashima, Chihiro Kojima and Hiroaki
Imai. Yokohama : Journal of Sol‐Gel Science and Technology, 1997, Vol. 8, pp. 843‐846.
6. Novel carbon aerogel‐supported catalysts for PEM fuel cell application. Smirnovaa, X. Dongb, H.
Harab, A. Vasilievc, N. Sammesa. : International Journal of Hydrogen Energy, 2005, Vol. 30, pp.
149 – 158.
7. Application of silica aerogel encapsulated lipases in the synthesis of biodiesel by
transesterification reactions. Olivier Orc¸aire, Paulette Buisson, Alain C. Pierre. : Journal of
Molecular Catalysis B: Enzymatic, 2006, Vol. 42, pp. 106‐113.
8. SiO2‐aerogels: Modifications and applications. Fricke, J. 1‐3, : Journal of Non‐Crystalline Solids,
1990, Vol. 121, pp. 188‐192.
9. Humidity sensors based on silica nanoparticle aerogel thin films. Chien‐Tsung Wanga, Chun‐
Lung Wua, I‐Cherng Chenb, Yi‐Hsiao Huangc. : Sensors and Actuators B, 2005, Vol. 107, pp. 402–
410.

43
10. The Aerocapacitor ‐ An Electrochemical Double‐Layer Energy‐Storage Device. S. T. Mayer, R.
W. Pekala, and J. L. Kaschmitter. 2, : Journal of the Electrochemical Society, 1993, Vol. 140, pp.
446‐451.
11. Capacitive deionization of NH4ClO4 solutions with carbon aerogel electrodes. J.C. Farmer, D.V.
Fix, G.V. Mack, R.W. Pekala, J.F. Poco. 10, : Journal Of Applied Electrochemistry, 1996, Vol. 26, pp.
1007‐1018.
12. Transparent silica aerogels for window insulation. Michael Rubin, Carl M. Lampert. 4, : Solar
Energy Materials, 1982, Vol. 7, pp. 393‐400 .
13. Development of windows based on highly insulating aerogel glazings. K.I. Jensen, J.M. Schultz ,
F.H. Kristiansen. : Journal of Non‐Crystalline Solids, 2004, Vol. 350, pp. 351‐357.
14. Applications for silica aerogel products. M. Schmidt, F. Schwertfeger. : Journal of Non‐
Crystalline Solids, 1998, Vol. 225, pp. 364–368.
15. Aerogel‐based thermal insulation. Douglas M. Smith, Alok Maskara, Ulrich Boes. : Journal of
Non‐Crystalline Solids, 1998, Vol. 225, pp. 254–259.
16. Acoustic Impedance Matching of Piezoelectric Transducers to the Air. Alvarez‐Arenas, Tom´as
E. G´omez. : Ieee transactions on ultrasonics, ferroelectrics, and frequency control, 2004, Vol. 51,
pp. 624‐633.
17. Acoustic properties and potential applications of silica aerogels. V. Gibiat a, O. Lefeuvre, T.
Woignier, j. Pelous, j. Phalippou. : Journal of Non‐Crystalline Solids, 1995, Vol. 186, pp. 244‐255.
18. Aerogels for Electronics. Hrubesh, L. W. Washington D.C. : s.n., 1994.

44
19. Silica aerogel captures cosmic dust intact. Tsou, Peter. : Journal of Non‐Crystalline Solids,
1995, Vol. 186, pp. 415‐427.
20. Aerogel: Space exploration applications. Jones, Steven M. : Journal of Sol‐Gel Science and
Technology, 2006, Vol. 40, pp. 351‐357.
21. Materials Chemistry and Physics. Physics, Materials Chemistry and. 8, : Journal of American
Ceramic Society, 1992, Vol. 75, pp. 2027‐2036.
22. Comparison of some physical properties of silica aerogel monoliths synthesized by different
precursors. P.B. Wagh, R. Begag, G.M. Pajonk, A. Venkateswara Rao, D. Haranath. : Materials
Chemistry and Physics, 1999, Vol. 57, pp. 214‐218.
23. Effect of methyltrimethoxysilane as a co‐precursor on the optical properties of silica aerogels.
A. Venkateswara Rao, G.M. Pajonk. : Journal of Non‐Crystalline Solids, 2001, Vol. 285, pp. 202‐
209.
24. Ultralow density silica aerogels prepared with PEDS. Xu Chao, Shen Jun, Zhou Bin. : Journal of
Non‐Crystalline Solids, 2009, Vol. 355, pp. 492‐495.
25. Transparent ultralow‐density silica aerogels prepared by a two‐step sol‐gel process. Hrubesh,
T.M. Tillotson and L.W. : Journal of Non‐Crystalline Solids, 1992, Vol. 145, pp. 44‐50.
26. Synthesis and physical properties of TEOS‐based silica aerogels prepared by two step (acid–
base) sol–gel process. A. Venkateswara Rao, Sharad D. Bhagat. : Solid State Sciences, 2004, Vol. 6,
pp. 945‐952.

45
27. Synthesis of transparent silica aerogels using tetraalkylammonium fluoride catalysts. Evaggelos
Economopoulos, Theophilos Ioannides. : Journal of sol‐gel science technology, 2009, Vol. 49, pp.
347‐354.
28. Strengthening of silica gels and aerogels by washing and aging processes. M.A Einarsrud, E.
Nilsen, A. Rigacci, G.M. Pajonk. : Journal of non‐crystalline Solids, 2001, Vol. 285, pp. 1‐7.
29. Drying of silica aerogel with supercritical carbon dioxide. M.J. van Bommel, A.B. de Haan. :
Journal of Non‐Crystalline Solids, 1995, Vol. 186, pp. 78‐82.
30. Ambient‐temperature supercritical drying of transparent silica aerogels. Param H. Tewari,
Arlon J. Hunt, Kevin D. Lofftus. 9‐10, : Materials Letters, 1985, Vol. 3, pp. 363‐367.
31. Diffusion of methanol–liquid CO2 and methanol–supercritical CO2 in silica aerogels. Zoran
Novak, Zeljko Knez. : Journal of Non‐Crystalline Solids, 1997, Vol. 221.
32. Dependence of monolithicity and physical properties of TMOS silica aerogels on gel aging and
drying conditions. G.M. Pajonk, A. Venkateswara Rao, B.M. Sawant, N.N. Parvathy. : Journal of
Non‐Crystalline Solids, 1997.
33. Effect of Sol‐Gel Processing Parameters on Optical Properties of TMOS Silica Aerogels. A.
Venkateswara Rao, G. M. Pajonk,D. Haranath,P. B. Wagh. 1, : Journal of Materials Synthesis and
Processing, 1998, Vol. 6.
34. Highly porous aerogels of very low permeability. J. Phalippou, T. Woignier, R. Sempéré, P.
Dieudonné. 1, : Materials Science, 2002, Vol. 20.
35. Synthesis, Characterisation and Applications of Silica Aerogels. Luc Van Ginneken, René E. Van
de Leest, Louis Willems, Kathy Elst, Herman Weyten.

46
36. Thermal and Temporal Aging of Two Step Acid‐Base Catalyzed Silica Gels in Water/Ethanol
Solutions. S. Hæreid, E. Nilsen, V. Ranum and M.A. Einarsrud. : Journal of Sol‐Gel Science and
Technology, 1997, Vol. 8.
37. Influence of DCCAs on Optical Transmittance and Porosity Properties of TMOS Silica Aerogels.
D. Haranath, A. Venkateswara Rao and P.B. Wagh. : Journal of Porous Materials, 1999, Vol. 6, pp.
55‐62.
38. Effect of glycerol additive on physical properties of hydrophobic silica aerogels. A.
Venkateswara Rao, Manish M. Kulkarni. : Materials Chemistry and Physics, 2002, Vol. 77, pp. 819‐
825.
39. Group, Lawrence Berkeley Laboratories: Microstructured Materials. Silica Aerogels.
40. Mechanical and acoustical properties as a function of PEG concentration in macroporous silica
gels. J. Martin, B. Hosticka, C. Lattimer, P.M. Norris. : Journal of Non‐Crystalline Solids, 2001, Vol.
285, pp. 222‐229.
41. Effect of glycerol additive on physical properties of hydrophobic silica aerogels. Rao, A.
Venkateswara. : Materials Chemistry and Physics, 2002, Vol. 77, pp. 819‐825.

47
APPENDIX
Equipment
Autoclave
The autoclave is mainly required for the supercritical drying of gels to form aerogels.
Before the supercritical drying, the gels also require the liquid (usually ethanol) in them to be
replaced with liquid CO2. Liquid CO2 exists in pressures > 4826.332 KPa (700 psi) at room
temperature, while the pressures during supercritical drying can go as high as 11376.35 KPa (1650
psi) and temperatures as high as 65oC.
Design specification
The design of the autoclave was done based on the requirements to be fulfilled by the
autoclave. The details of the design requirement and their solutions are shown in Table A1.
Table A1. Autoclave design requirements and solutions
Requirement Solution
The loading of the gels requires an easily accessible opening in the autoclave, which can later be sealed safely.
This requires the autoclave to have large enough space to load the gels and a simple non‐permanent mechanism to seal the autoclave
After the gels are placed in the autoclave, they have to be submerged in ethanol before liquid CO2 is siphoned into the autoclave, to avoid drastic diffusion of the ethanol in the gels into the liquid CO2.
This requires an opening near the top of the autoclave to pour the ethanol, and a window from which to observe the ethanol level to ensure the gels are properly covered
After the liquid CO2 is siphoned, the liquid mixture (liquid CO2 + ethanol) in the autoclave has to be exchanged with liquid CO2 by draining the liquid mixture from the bottom, while simultaneously siphoning liquid CO2 from top.
This requires an inlet valve connected to the top of the autoclave from which liquid CO2 can be siphoned in a controlled manner. Also a drain valve at the bottom of the autoclave is needed
For supercritical drying, the liquid CO2 has to be heated in a controlled manner until it reaches supercritical state.
To heat/cool the liquid CO2, the autoclave has to be heated/cooled evenly, while temperature inside the autoclave is measured and controlled
Next the CO2 has to be released from the top, while making sure the CO2 in the autoclave stays in supercritical state, to avoid any capillary pressures on the solid network of gel.
For the depressurization, a pressure release valve is required at the top ( of the autoclave

48
Description of the autoclave
Figure A1 shows the autoclave set up used to make aerogels
Figure A1. Autoclave
1. Autoclave Inside diameter = 4.5”, depth = 3”
2. Temperature control, with maximum temperature of 65oC, and minimum temperature of
5oC
3. Pressure control valve set to a maximum pressure of 11721.09 KPa (1700 psi)
4. Glass window for observation
5. Opening near the top to pour ethanol to cover the gels
6. Inlet valve to siphon CO2 into the autoclave
7. Pressure release valve near the top for depressurization
8. Pressure gauge for observing pressure
9. Drain valve at the bottom
Materials required
1. Tetramethoxysilane (TMOS) 99% purity – Sigma Aldrich
2. temp control
1. autoclaveliquid CO2 tank
pressure gauge
7. pressure release valve
9. drain valve
6. intake valve 5. Screw Opening

49
2. Tetraethoxysilane (TEOS) 99% purity– Sigma Aldrich
3. Ethanol 200 proof, Absolute, anhydrous – Pharmco‐AAPER
4. Methanol HPLC – Mallinckrodt Chemicals
5. Ammonium Hydroxide 28‐30% Conc. – VWR
6. Ammonium Flouride 96% purity – Alfa Aesar
7. Liquid Carbon dioxide, Bone dry – Airgas
8. De‐ionized water
Molds for the gels
Requirement
A mold is used to make gels in them and remove the gels without damaging the gels. Since
gels might stick to the walls of the mold, the inner sides of the mold walls need to be made of
Teflon®, so that the gels would not stick to them and break up.
Description of different molds designed
The cubical mold
The cubical mold is an aluminum cube that is open on one side. The walls of the mold are
detachable by unscrewing the screws used to assemble the cube. The inner sides of the mold walls
have a Teflon® layer so that the gels don’t stick to the walls when they are removed from the
cube.
Teflon® mold
The Teflon® mold has two main parts (made from Teflon®) – a cylinder 2” high, 2” internal
diameter and circular plunger with 2” diameter. During gel making, the plunger is inserted at the
bottom of the cylinder and when the gel needs to be removed, the plunger is pushed up from the
bottom until the gel rises out of the cylinder.

50
Syringe mold
The syringe mold has two main parts. The first part is a plastic cylinder derived from the
cutting the top part of a syringe of 1” diameter. The second part is a Teflon® plunger of 1”
diameter. It works similar to a Teflon® mold.
Transparency characterization: Spectrophotometer
The specifications for the spectrophotometer (UV‐2501PC, by Shimadzu) used to measure
the transparency are shown in Table A2.
Table A2. UV‐2501PC Spectrophotometer specifications
Property DetailsWavelength range 190 – 900 nmMonochromator system Double monochromator with a high‐performance
double‐blazed holographic grating in the aberration corrected Czerny‐Turner mounting.
Resolution 0.1 nmSpectral bandwidth 0.1, 0.2, 0.5, 1, 2 and 5nmWavelength repeatability ±0.1nm.Wavelength accuracy ±0.3nm.Wavelength scanning speed FAST, MEDIUM, SLOW and SUPER SLOW. Light source 50W halogen lamp (2,000 hours life) and D2 lamp
(500 hours life).Light source lamp switching Selectable between 282nm and 393nm. Stray light Less than 0.0003% at 220nm and 340nm. Power requirements 100V, 120V, 220V, 240V, switch‐selectable; 50/60Hz;
250 VA.Dimensions and weight Main spectrophotometer 570W X 660D X 275Hmm;
about 36kg.
Gel making procedure
Gel solution preparation
A gel needs to be prepared from which aerogels can be made. The following steps need to be
taken in order to create the best possible gels which in turn can give aerogels with consistent
properties:
1. Calculate the volumes of the chemicals to be mixed to form the gel

51
2. Clean the syringe‐mold and plungers to be used to prepare the gels using lint‐free wipes +
ethanol
3. Insert the plunger into the syringe‐mold all the way to the bottom and test for leakage
with ethanol
4. Prepare the catalyst stock solutions for each combination of molar ratios of
precursor:H2O:solvent: catalyst initially decided upon.
a. Note: The stock solution should contain half of the calculated volume of solvent
(ethanol, methanol etc.) + water + catalyst
5. First pour the required amount of solvent into the syringe‐mold (over the plunger) using a
pipette
6. Next add the required amount of precursor into the syringe‐mold
7. Then add the required amount of catalyst mixture (from the catalyst stock solution) into
the syringe mold
8. Immediately stir the mixture thoroughly without causing any splatter using the pipette
(with its tip), blow a few holes with the pipette for good mixture. Wipe out any tiny
bubbles that form along the walls of the syringe in the gel solution using the pipette tip
9. Wait for gelation. Check if gelation has occurred by slightly moving the syringe across the
table and observe if the surface of the gel solution is shaking or not. (Gelation can take
anywhere from 5 min to 9‐10 hrs depending on the molar ratio of catalyst and solvent
used)
Aging
Pouring the aging solution over the gel without damaging the gel is a bit tricky. The following
steps describe how to avoid damaging the gels while pouring the aging solution:
52
1. Once the gel solution has solidified, pick up the syringe‐mold; hold it under a light source
such that the light is reflected off the surface of the gel.
2. Then tap the side of the syringe‐mold wall with a finger nail to see how much the surface
wobbles.
3. Wait until the wobbling is as low as possible before pouring the aging solution over the
gel. Take care not to wait too long, or else the gel surface could get cracked. (To get an
idea of what is the level of wobbling to look for before pouring the aging solution, make a
test‐gel and keep checking its level of wobbling every 10 min all the way until it cracks –
the test‐gel solution for TMOS based gels can have a molar ratio combination of
TMOS:H2O:MeOH:NH4OH = 1:4:16:0.025)
4. Pour the aging solution along the inner wall of the syringe‐mold over the gel slowly using
the pipette, until the level of the aging solution is slightly below the top of the syringe
mold
Ethanol exchange
The following steps describe how ethanol exchange of the gels needs to be done:
1. Place the aluminum mesh base along with its handles in a container and pour 200‐proof
absolute anhydrous ethanol up to a height of 1.5”
2. Empty the aging solution inside the syringe mold into the chemical waste disposal bin
3. Hold the syringe‐mold over the ethanol bath and slowly push out the plunger from the
syringe‐mold using the marker with duct tape over it that matches the inside diameter of
the syringe.
4. Push the plunger until the top of the plunger slightly comes out of the top of the syringe
mold

53
5. Then slide the gel off the plunger and into the ethanol bath using a glass slide, while
making sure that the glass slide makes complete contact the full width of the gel.
6. Position the gels over the mesh base in the ethanol bath as required/planned
7. Carefully place the aluminum mesh cage over the gels samples without damaging them
8. Exchange the ethanol bath at least 6 times – twice a day
9. While exchanging the ethanol bath, carefully lift the entire set of( Al mesh base + gels +
cage) with the handles on either side of the mesh base and place them outside the bath
container
10. Dispose the ethanol bath in the container
11. Pour new bath of ethanol into the container (up to 1.5” height)
12. Make sure to not change the orientation of the aluminum mesh set up while placing it
back in the fresh ethanol bath
Aerogel making
Autoclave purging
Before the gels can be loaded into the autoclave, it has to be purged with ethanol + liquid CO2
in order to remove any impurities in the autoclave. The purging steps are as follows:
1. Put a new O‐ring on the lid of the autoclave
2. Seal the lid of the autoclave
3. Remove the screw from the opening near the top of the autoclave
4. Close the drain valve and open the pressure release valve
5. Pour 600 ml of ethanol into the autoclave through the opening at the top

54
6. Wrap Teflon® tape over the threading of the screw removed from the top of the autoclave
– make sure the direction of the wrapping is along the direction of friction force on the
threads while screwing it back into the opening
7. Screw the screw back into the opening tightly
8. Siphon liquid CO2 into the autoclave, until the level of the liquid mixture rises above the
top of the autoclave window
9. Wait for 10 min
10. Drain the liquid mixture
11. Repeat the purging cycle 2 more times
Gel loading
The following steps describe how gels need to be loaded into the autoclave and how to start
the CO2 exchange:
1. After the purging, remove the lid and spray silicone lubricant on the O‐ring of the lid
2. Remove the gels along with the aluminum mesh + cage from the ethanol bath
3. Remove the handles from the aluminum mesh base
4. Place the steel base (3” X 2” X 0.5” or 3” X 3” X 0.5” whichever is suitable) into the
autoclave
5. Place the gels along with the aluminum mesh + cage over the steel base in the autoclave
(Make note of the orientation in which the gels are placed)
6. Seal the lid of the autoclave
7. Remove the screw from the opening near the top of the autoclave
8. Close the drain valve and open the pressure release valve

55
9. Pour ethanol into the autoclave until the ethanol level rises above the aluminum cage
covering the gels (Make note of the volume of ethanol poured)
10. Wrap Teflon® tape over the threading of the screw removed from the top of the autoclave
– make sure the direction of the wrapping is along the direction of friction force on the
threads while screwing it back into the opening
11. Screw the screw back into the opening tightly
12. Very slowly siphon CO2 into the autoclave such that the pressure rise in the autoclave is <
103.42 KPa (15 psi)/min
13. Siphon liquid CO2 until the level of liquid mixture rises to the required level
14. The autoclave may be cooled to 15oC in order to facilitate siphoning of the liquid CO2, if
the siphoning doesn’t happen at room temperature. However it needs to avoided as, after
the siphoning is stopped, the level of liquid CO2 comes down a little over a period of 4 ‐6
hrs, and if it comes too low, the gels might not be covered by liquid anymore. In which
case more liquid CO2 might have to be siphoned every few hours
CO2 exchange
The following steps describe how the liquid mixture (liquid CO2 + ethanol) in the autoclave is
to be exchanged with liquid CO2 siphoned from the CO2 supply tank:
1. Open the drain valve (#9 in Fig. 1) so that the level of liquid in the autoclave starts
dropping slowly
2. Start siphoning liquid CO2 to keep the liquid level in the autoclave constant
3. Continue the exchanging for 20 min
4. Close the drain valve
5. Stop siphoning once the liquid level in the autoclave has reached the desired level

56
6. The CO2 exchange has to be done 2 times a day until no more ethanol is recovered from
the draining and then it has to be done 2 more times
Slow ethanol draining
The following steps describe how the buffer ethanol in the autoclave is to be drained for a
slow draining cycle, after the gels have been loaded into the autoclave (or whenever ethanol is
decided to be drained slowly) :
1. Wait for 30 min after CO2 siphoning is done
2. Open the drain valve slightly, until ethanol starts dripping drop by drop
3. Keep adjusting the drain valve every 5 – 10 min as the draining tends to slow down
4. Keep checking the liquid level inside the autoclave and whenever it reaches a little above
the top of the cage covering the gels, quickly open the inlet valve to siphon a sudden flow
of liquid CO2 into the autoclave, so that it causes turbulence in the liquid in the autoclave
and mixes the liquid CO2 and ethanol
5. The draining might take up to 8 – 10 hrs
Quick ethanol draining
The following steps describe how the buffer ethanol in the autoclave is to be drained for a
quick draining cycle, after the gels have been loaded into the autoclave (or whenever ethanol is
decided to be drained quickly):
1. Wait for 30 min after CO2 siphoning is done
2. Open the drain valve until there is a steady flow of ethanol coming out
3. Keep adjusting the drain valve every 5 – 10 min as the draining tends to slow down

57
4. Keep checking the liquid level inside the autoclave and whenever it reaches a little above
the top of the cage covering the gels, quickly open the inlet valve to siphon a sudden flow
of liquid CO2 into the autoclave, so that it causes turbulence in the liquid in the autoclave
and mixes the liquid CO2 and ethanol
5. The draining might take 1 – 2 hrs
Supercritical drying
The following steps need to be taken in order to perform supercritical drying of the gels to
form aerogels:
1. Set the temperature on the autoclave temperature control to 28oC (Keep the chiller ON)
2. Once the temperature reaches 28oC, wait for 20 min
3. Then set the temperature to 31oC
4. Once the temperature reaches 31oC, wait for 20 min
5. Then set the temperature to 34oC
6. Once the temperature reaches 34oC, wait for 20 min
7. Then set the temperature to 39oC (Turn the chiller on the temperature controller OFF)
8. Once the temperature reaches 39oC, wait for 20 min
9. If the pressure is > 9652.664 KPa (1400 psi), then depressurize until pressure reaches
8273.712 KPa (1200 psi) [if pressure >10342.14 KPa (1500 psi), depressurize by 2068.428
KPa (300 psi)]. The depressurizing rate should be < 68.95 KPa (10 psi)/min
10. Then set the temperature to 46oC
11. Once the temperature reaches 46oC, wait for 20 min
12. Depressurize until pressure = 8273.712 KPa (1200 psi)
13. Then set the temperature to 53oC

58
14. Once the temperature reaches 53oC, wait for 20 min
15. Depressurize until pressure = 7928.974 KPa (1150 psi)
16. Then set the temperature to 62oC
17. Once the temperature reaches 62oC, wait for 30 min
18. Start depressurizing completely, while making sure depressurization rate < 103.42 KPa (15
psi). And turn OFF the heating, by setting the temperature control to room temperature (
with the chiller OFF)
19. Once pressure reaches 4826.332KPa (700 psi) turn the chiller ON
20. Once depressurization is completed, remove the lid of the autoclave
21. Remove the aerogels from the autoclave and carefully place them in their respective
Ziploc (labeled) pouches
Phase 1 Experiment data analysis
ANOVA analysis of the data collected is shown below.
Two-way ANOVA: Transmittance versus Methanol:TMOS Molar Ratio, NH4OH:TMOS
Molar Ratio
Source DF SS MS F P
Methanol Molar Ratio 2 0.0095419 0.0047709 76.81 0.001
NH4OH Molar Ratio 2 0.0369784 0.0184892 297.67 0.000
Error 4 0.0002485 0.0000621
Total 8 0.0467688
S = 0.007881 R-Sq = 99.47% R-Sq(adj) = 98.94%

59
Two-way ANOVA: Crack versus Methanol Molar Ratio:TMOS, NH4OH:TMOS Molar
Ratio
Source DF SS MS F P
Methanol Molar Ratio 2 22704214 11352107 10.95 0.024
NH4OH Molar Ratio 2 767862 383931 0.37 0.712
Error 4 4148156 1037039
Total 8 27620232
S = 1018 R-Sq = 84.98% R-Sq(adj) = 69.96%
Phase 2 Experiment data analysis
A response surface regression analysis of the transparency and crack values of the
aerogels was performed on Minitab®, yielding the following results:
Response Surface Regression: transparency, crack versus MeOH:TMOS molar
ratio, NH4OH:TMOS molar ratio
The following terms cannot be estimated, and were removed.
NH4OH*NH4OH
Response Surface Regression: trans versus MeOH:TMOS molar ratio, NH4OH
:TMOS molar ratio
The analysis was done using coded units.
Estimated Regression Coefficients for transmittance
Term Coef SE Coef T P

60
Constant 322.250 1.6424 196.206 0.000
MeOH -4.680 0.9181 -5.097 0.001
NH4OH 9.191 0.9181 10.010 0.000
MeOH*MeOH -6.259 1.8816 -3.326 0.010
MeOH*NH4OH 0.015 0.9181 0.016 0.987
S = 2.84473 PRESS = 228.790
R-Sq = 94.32% R-Sq(pred) = 79.92% R-Sq(adj) = 91.48%
Analysis of Variance for transmittance
Source DF Seq SS Adj SS Adj MS F P
Regression 4 1074.78 1074.78 268.694 33.20 0.000
Linear 2 985.23 1021.19 510.594 63.09 0.000
Square 1 89.55 89.55 89.548 11.07 0.010
Interaction 1 0.00 0.00 0.002 0.00 0.987
Residual Error 8 64.74 64.74 8.093
Pure Error 8 64.74 64.74 8.093
Total 12 1139.52
Unusual Observations for transmittance
Obs StdOrder trans Fit SE Fit Residual St Resid
2 2 297.280 302.105 2.012 -4.825 -2.40 R
7 7 306.930 302.105 2.012 4.825 2.40 R
R denotes an observation with a large standardized residual.

61
Estimated Regression Coefficients for trans using data in uncoded units
Term Coef
Constant 322.250
MeOH -4.68000
NH4OH 9.19083
MeOH*MeOH -6.25917
MeOH*NH4OH 0.0150000
Response Surface Regression: crack versus MeOH:TMOS molar ratio ,
NH4OH:TMOS molar ratio
The analysis was done using coded units.
Estimated Regression Coefficients for crack
Term Coef SE Coef T P
Constant 3565.7 907.6 3.929 0.004
MeOH -543.0 507.4 -1.070 0.316
NH4OH 272.1 507.4 0.536 0.606
MeOH*MeOH -599.5 1039.8 -0.577 0.580
MeOH*NH4OH 221.6 507.4 0.437 0.674
S = 1572.00 PRESS = 50188451
R-Sq = 18.05% R-Sq(pred) = 0.00% R-Sq(adj) = 0.00%
Analysis of Variance for crack

62
Source DF Seq SS Adj SS Adj MS F P
Regression 4 4354184 4354184 1088546 0.44 0.777
Linear 2 3061131 3540725 1770363 0.72 0.517
Square 1 821524 821524 821524 0.33 0.580
Interaction 1 471529 471529 471529 0.19 0.674
Residual Error 8 19769389 19769389 2471174
Pure Error 8 19769389 19769389 2471174
Total 12 24123573
Unusual Observations for crack
Obs StdOrder crack Fit SE Fit Residual St Resid
9 9 6501.000 3559.556 907.593 2941.444 2.29 R
R denotes an observation with a large standardized residual.
Estimated Regression Coefficients for crack using data in uncoded units
Term Coef
Constant 3565.67
MeOH -542.958
NH4OH 272.069
MeOH*MeOH -599.514
MeOH*NH4OH 221.625


![Flexible acrylate-grafted silica aerogels for insulation purposes: … · 2017. 3. 30. · containing an organic reactive functional group, like vinyl or amine [8, 9, 14]. Liquid-phase](https://img.pdfslide.us/doc/110x75/606c8d10faa70a115716e4e8/flexible-acrylate-grafted-silica-aerogels-for-insulation-purposes-2017-3-30.jpg)