Embed Size (px)
Citation preview
Transparency, Risk Control & Return Enhancement
Klaus Paesler, CFA: Head, Currency & Overlay Strategy - EMEA
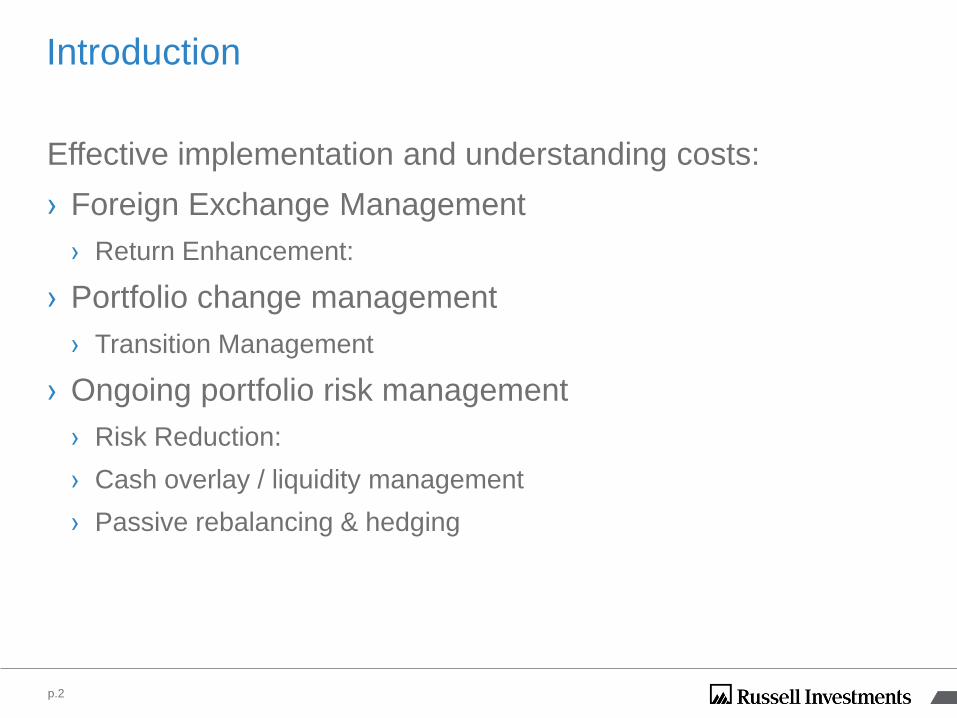
Introduction
Effective implementation and understanding costs:
› Foreign Exchange Management
› Return Enhancement:
› Portfolio change management
› Transition Management
› Ongoing portfolio risk management
› Risk Reduction:
› Cash overlay / liquidity management
› Passive rebalancing & hedging
p.2
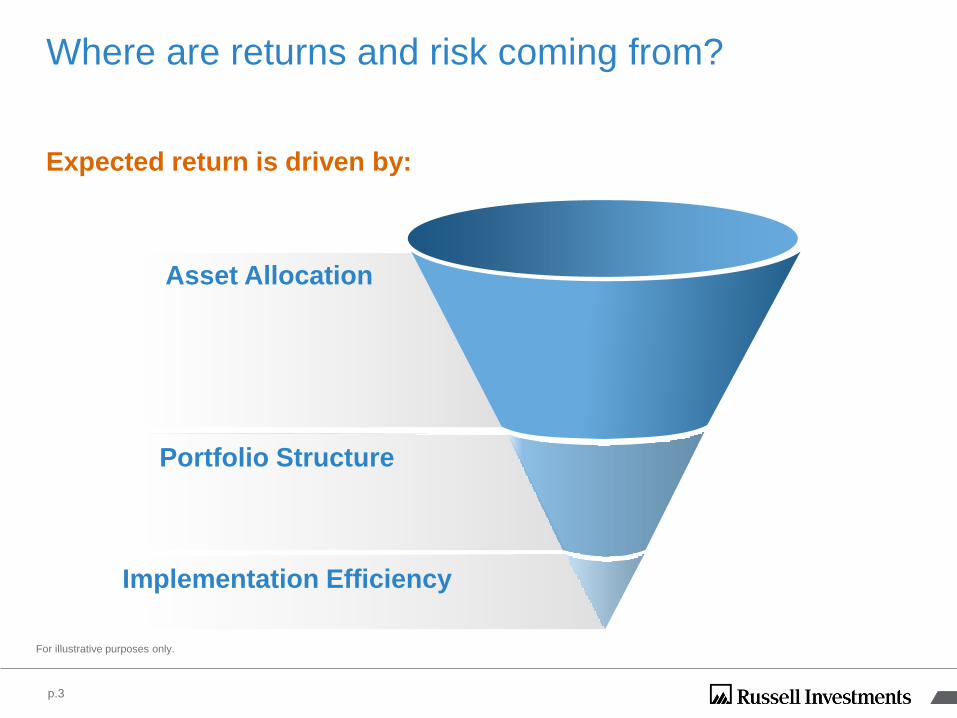
Expected return is driven by:
Implementation Efficiency
Portfolio Structure
Asset Allocation
Where are returns and risk coming from?
For illustrative purposes only.
p.3
For illustrative purposes only.
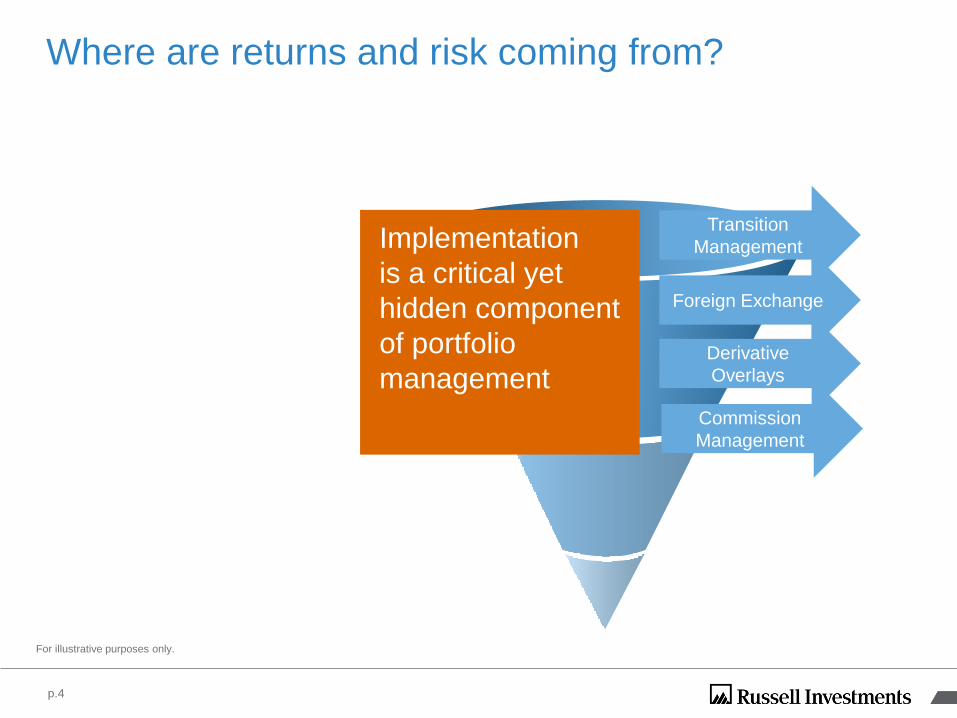
Implementation
is a critical yet
hidden component
of portfolio
management
Foreign Exchange
Transition
Management
p.4
Derivative
Overlays
Commission
Management
Where are returns and risk coming from?
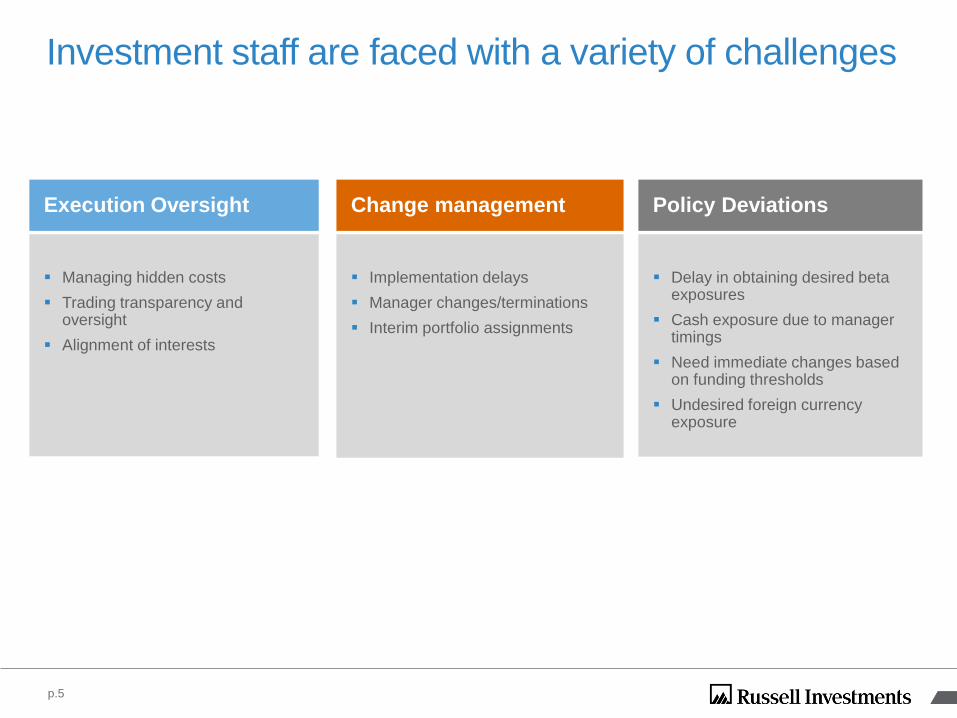
Investment staff are faced with a variety of challenges
Policy DeviationsChange management Execution Oversight
Delay in obtaining desired beta exposures
Cash exposure due to manager timings
Need immediate changes based on funding thresholds
Undesired foreign currency exposure
Implementation delays
Manager changes/terminations
Interim portfolio assignments
Managing hidden costs
Trading transparency and oversight
Alignment of interests
p.5
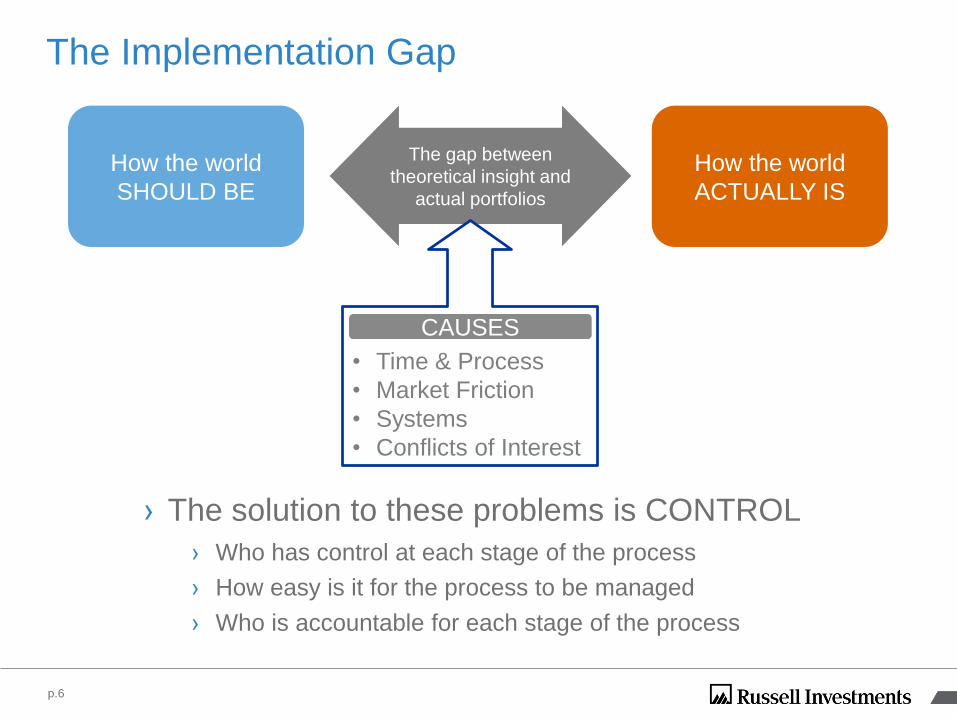
The Implementation Gap
› The solution to these problems is CONTROL
› Who has control at each stage of the process
› How easy is it for the process to be managed
› Who is accountable for each stage of the process
p.6
How the world
SHOULD BE
How the world
ACTUALLY IS
The gap between
theoretical insight and
actual portfolios
• Time & Process
• Market Friction
• Systems
• Conflicts of Interest
CAUSES
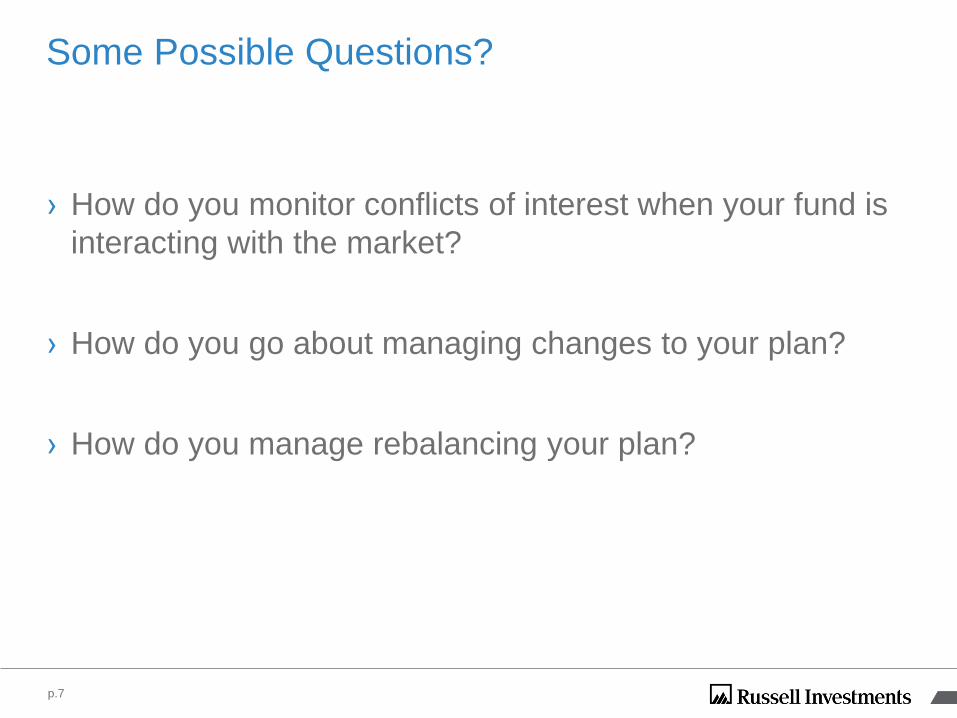
Some Possible Questions?
› How do you monitor conflicts of interest when your fund is
interacting with the market?
› How do you go about managing changes to your plan?
› How do you manage rebalancing your plan?
p.7
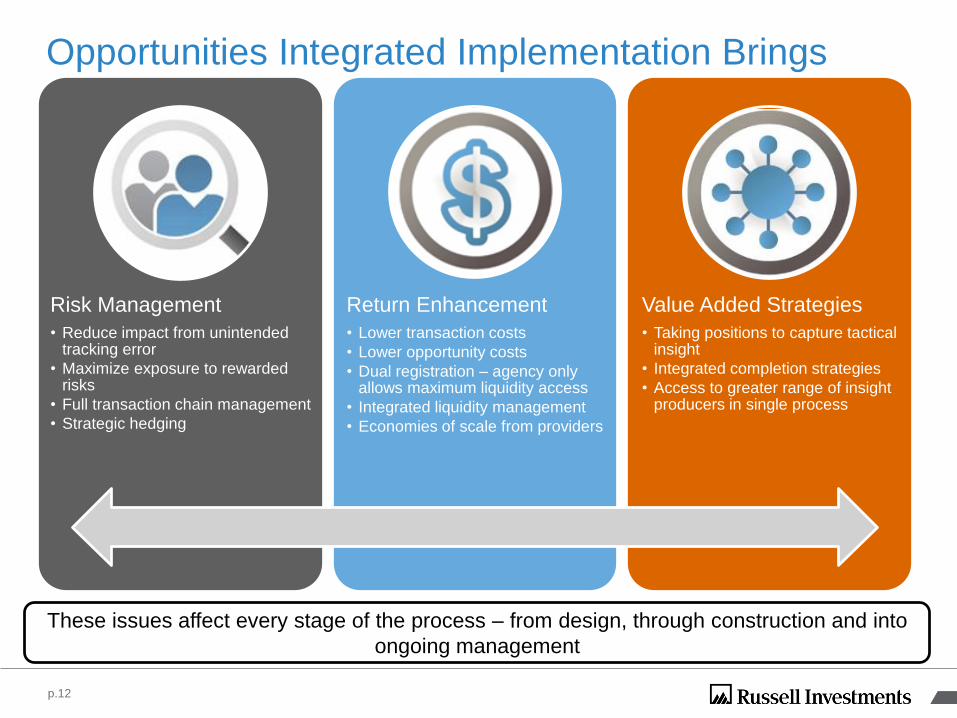
Opportunities Integrated Implementation Brings
Risk Management
• Reduce impact from unintended tracking error
• Maximize exposure to rewarded risks
• Full transaction chain management
• Strategic hedging
Return Enhancement
• Lower transaction costs
• Lower opportunity costs
• Dual registration – agency only allows maximum liquidity access
• Integrated liquidity management
• Economies of scale from providers
Value Added Strategies
• Taking positions to capture tactical insight
• Integrated completion strategies
• Access to greater range of insight producers in single process
These issues affect every stage of the process – from design, through construction and into
ongoing management
p.12
Foreign Exchange Execution
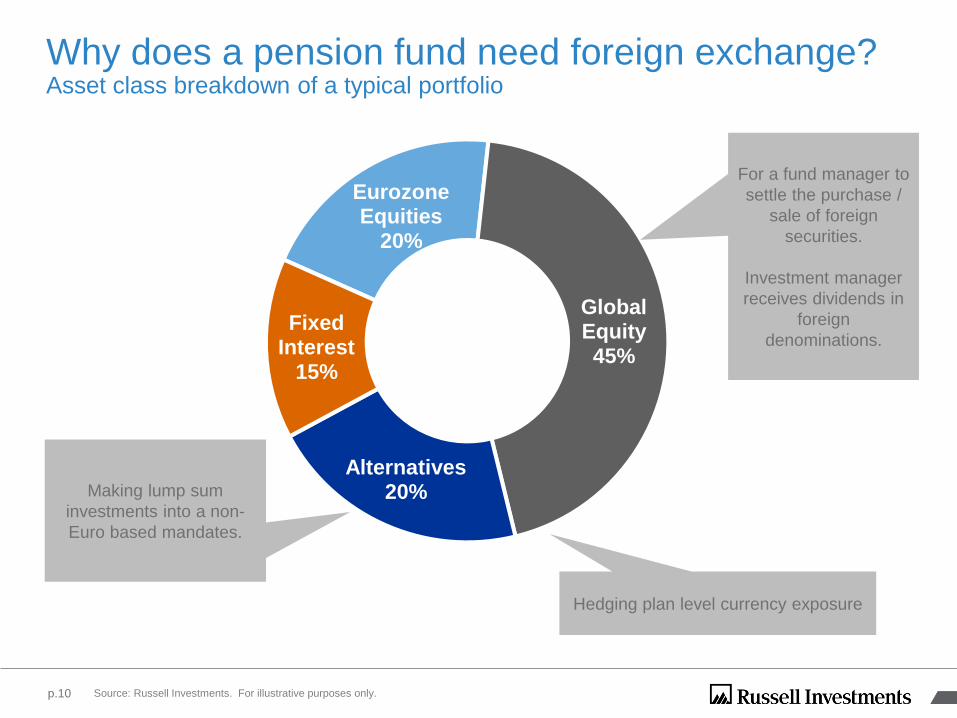
Eurozone Equities
20%
Global Equity45%
Alternatives20%
Fixed Interest
15%
Why does a pension fund need foreign exchange?Asset class breakdown of a typical portfolio
p.10 Source: Russell Investments. For illustrative purposes only.
Making lump sum
investments into a non-
Euro based mandates.
For a fund manager to
settle the purchase /
sale of foreign
securities.
Investment manager
receives dividends in
foreign
denominations.
Hedging plan level currency exposure
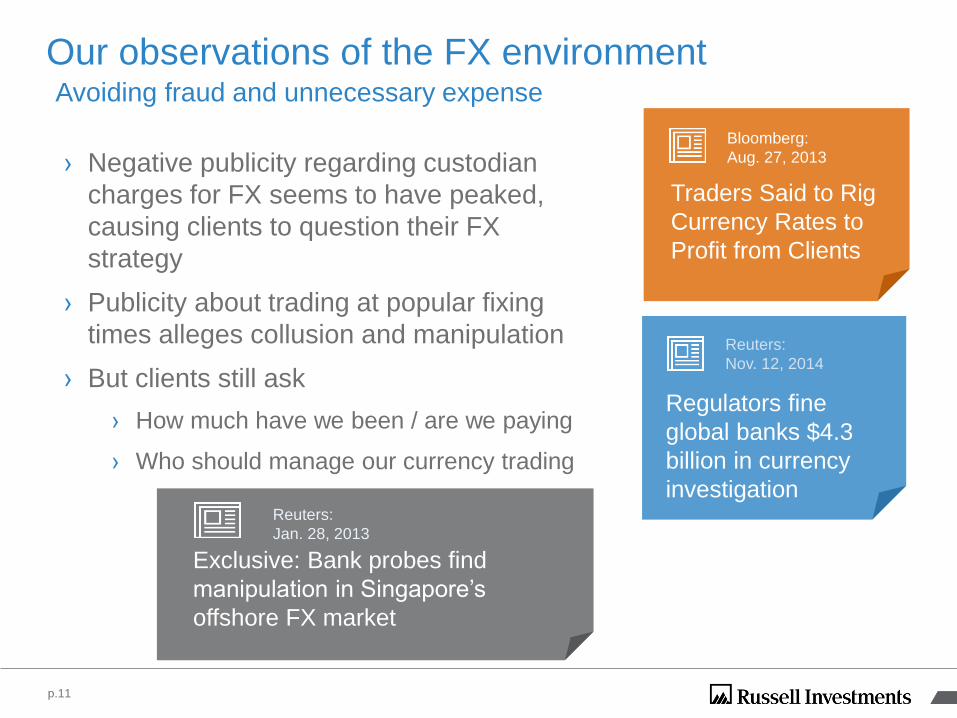
Our observations of the FX environmentAvoiding fraud and unnecessary expense
› Negative publicity regarding custodian
charges for FX seems to have peaked,
causing clients to question their FX
strategy
› Publicity about trading at popular fixing
times alleges collusion and manipulation
› But clients still ask
› How much have we been / are we paying
› Who should manage our currency trading
Exclusive: Bank probes find
manipulation in Singapore’s
offshore FX market
Reuters:
Jan. 28, 2013
Traders Said to Rig
Currency Rates to
Profit from Clients
Bloomberg:
Aug. 27, 2013
Regulators fine
global banks $4.3
billion in currency
investigation
Reuters:
Nov. 12, 2014
p.11
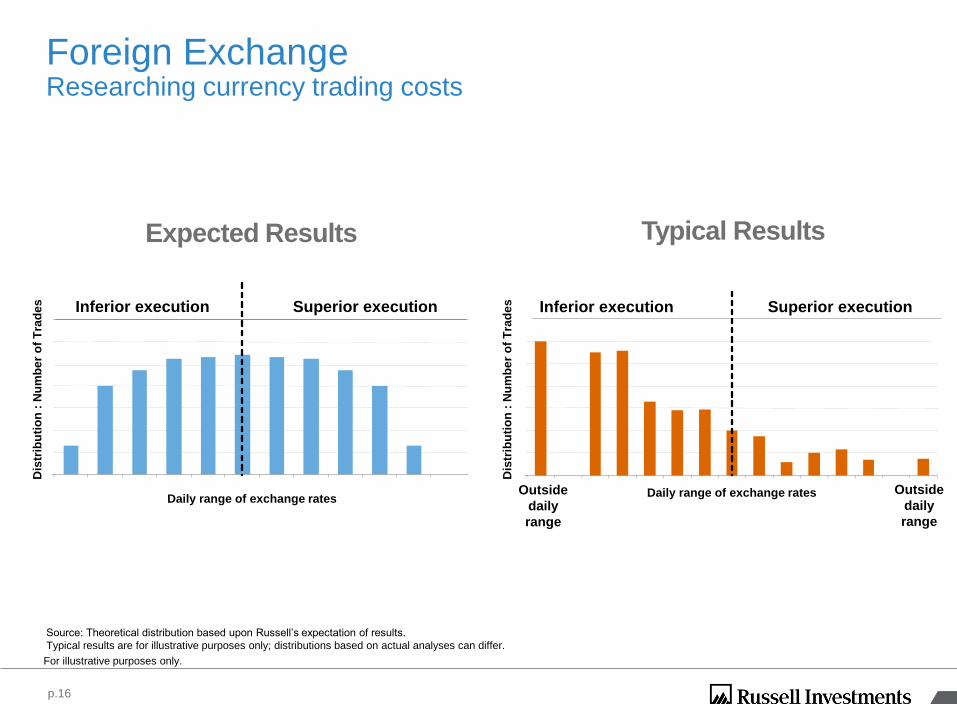
Foreign ExchangeResearching currency trading costs
Source: Theoretical distribution based upon Russell’s expectation of results.
Typical results are for illustrative purposes only; distributions based on actual analyses can differ.
Superior executionInferior execution
Daily range of exchange ratesOutside
daily
rangeD
istr
ibu
tio
n :
Nu
mb
er
of
Tra
de
s
Expected Results
Inferior execution Superior execution
Daily range of exchange rates
Dis
trib
uti
on
: N
um
be
r o
f T
rad
es
Outside
daily
range
For illustrative purposes only.
Typical Results
p.16
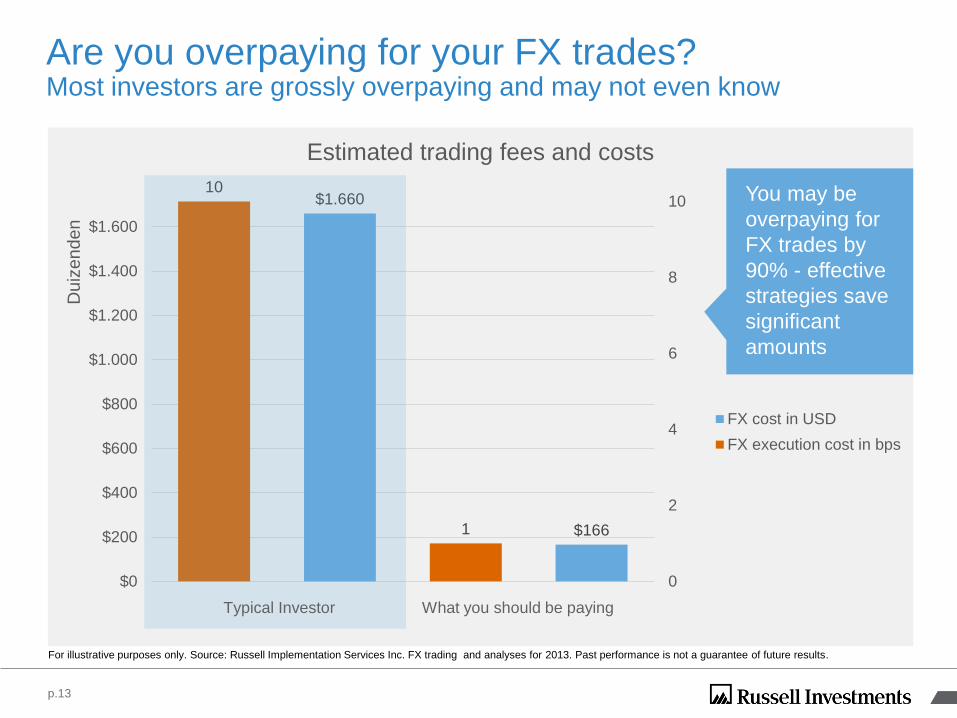
$1.660
$166
10
1
0
2
4
6
8
10
$0
$200
$400
$600
$800
$1.000
$1.200
$1.400
$1.600
Duiz
en
de
n
Estimated trading fees and costs
FX cost in USD
FX execution cost in bps
Typical Investor What you should be paying
Are you overpaying for your FX trades?Most investors are grossly overpaying and may not even know
You may be
overpaying for
FX trades by
90% - effective
strategies save
significant
amounts
p.13
For illustrative purposes only. Source: Russell Implementation Services Inc. FX trading and analyses for 2013. Past performance is not a guarantee of future results.
14
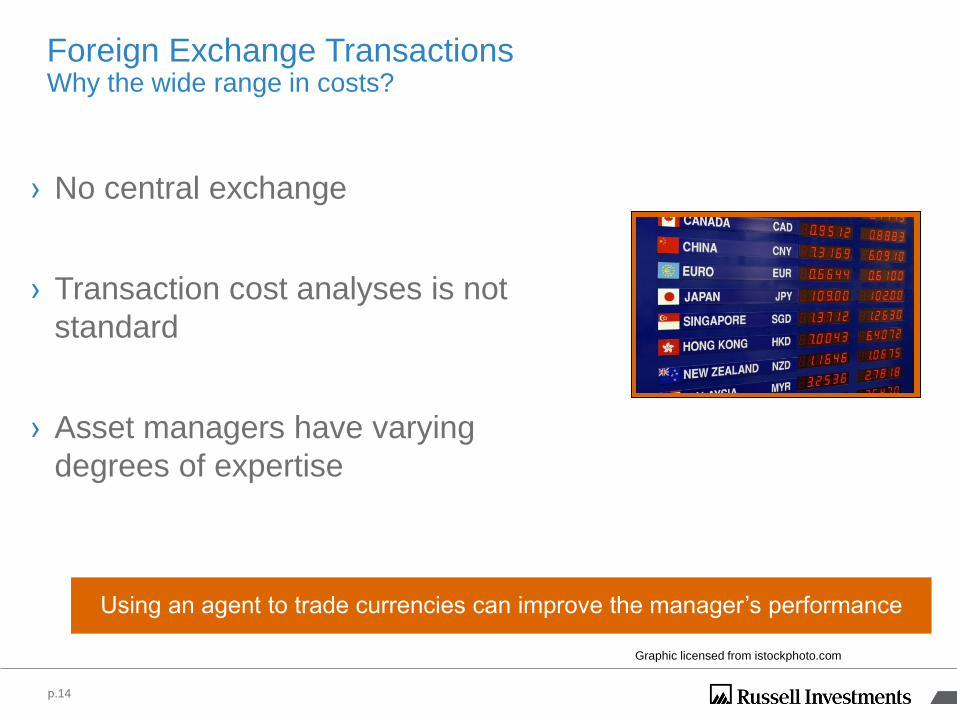
Foreign Exchange TransactionsWhy the wide range in costs?
› No central exchange
› Transaction cost analyses is not
standard
› Asset managers have varying
degrees of expertise
Graphic licensed from istockphoto.com
p.14
Using an agent to trade currencies can improve the manager’s performance
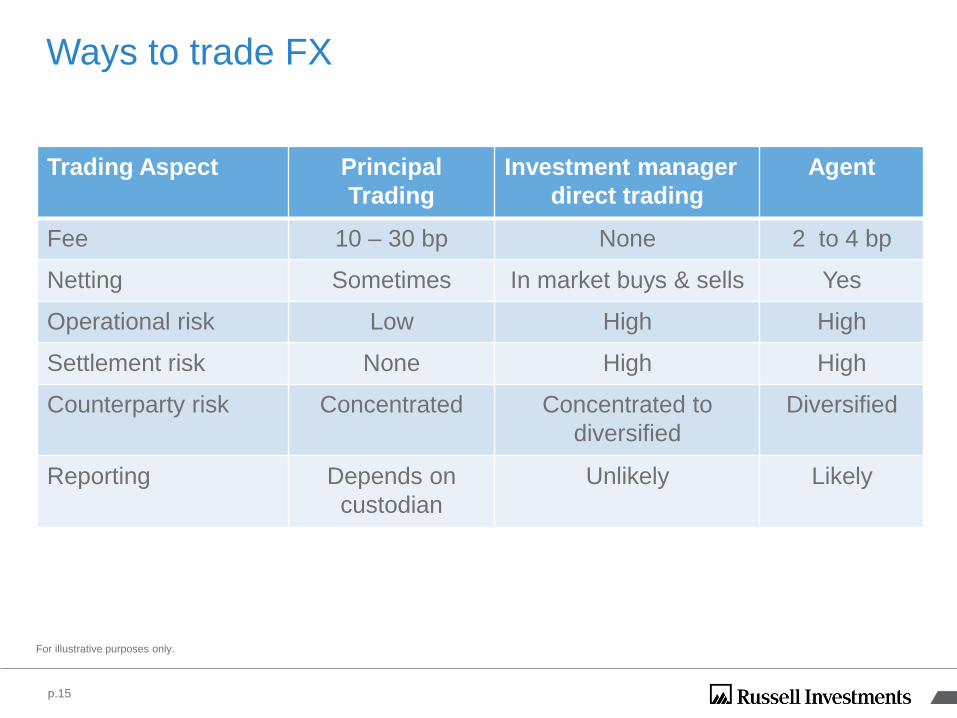
Ways to trade FX
Trading Aspect Principal
Trading
Investment manager
direct trading
Agent
Fee 10 – 30 bp None 2 to 4 bp
Netting Sometimes In market buys & sells Yes
Operational risk Low High High
Settlement risk None High High
Counterparty risk Concentrated Concentrated to
diversified
Diversified
Reporting Depends on
custodian
Unlikely Likely
p.15
For illustrative purposes only.
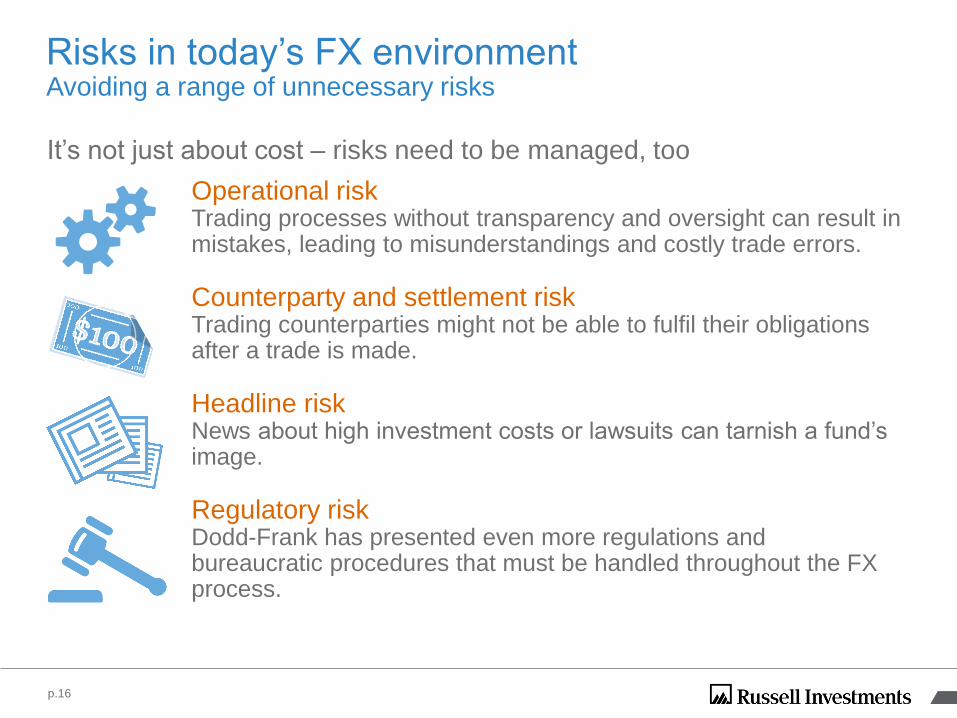
Risks in today’s FX environmentAvoiding a range of unnecessary risks
It’s not just about cost – risks need to be managed, too
Operational riskTrading processes without transparency and oversight can result in mistakes, leading to misunderstandings and costly trade errors.
Counterparty and settlement riskTrading counterparties might not be able to fulfil their obligations after a trade is made.
Headline riskNews about high investment costs or lawsuits can tarnish a fund’s image.
Regulatory riskDodd-Frank has presented even more regulations and bureaucratic procedures that must be handled throughout the FX process.
p.16
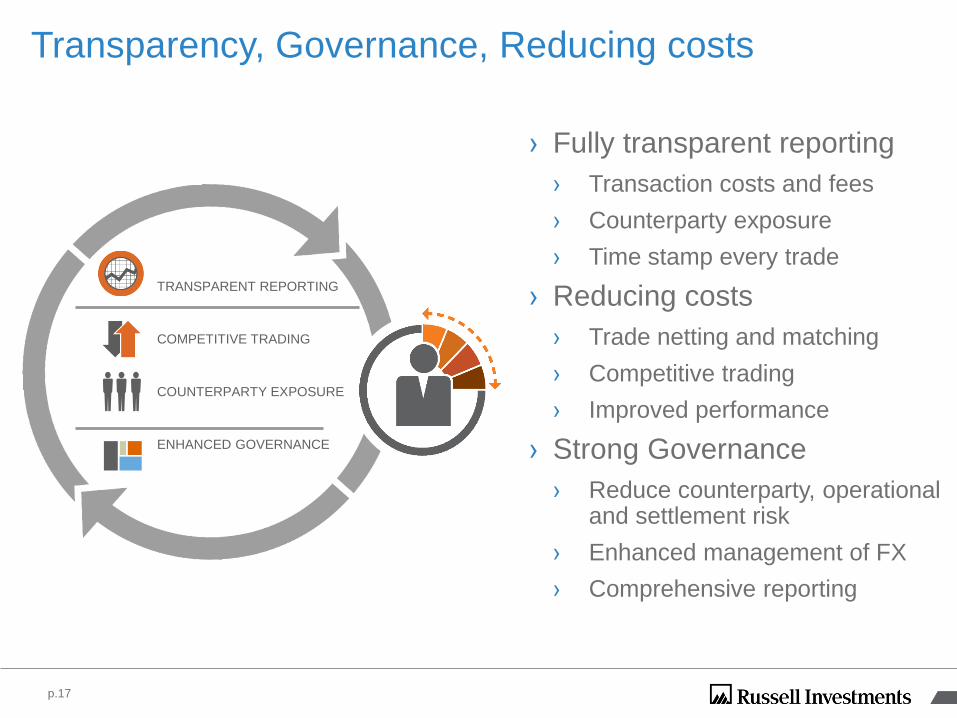
Transparency, Governance, Reducing costs
› Fully transparent reporting
› Transaction costs and fees
› Counterparty exposure
› Time stamp every trade
› Reducing costs
› Trade netting and matching
› Competitive trading
› Improved performance
› Strong Governance
› Reduce counterparty, operationaland settlement risk
› Enhanced management of FX
› Comprehensive reporting
TRANSPARENT REPORTING
COMPETITIVE TRADING
COUNTERPARTY EXPOSURE
ENHANCED GOVERNANCE
p.17
Portfolio Change Management
Measurement creates the incentive for a disciplined
approach to transitioning assets.
Measuring transition outcomes
Measurement = Accountability
› You must first have transparency to the performance impact in order to assign accountability – “what gets measured, gets managed”
› T standard implementation shortfall is the performance metric for transition management
› A transition manager should provide transparency and accountability,
p.19
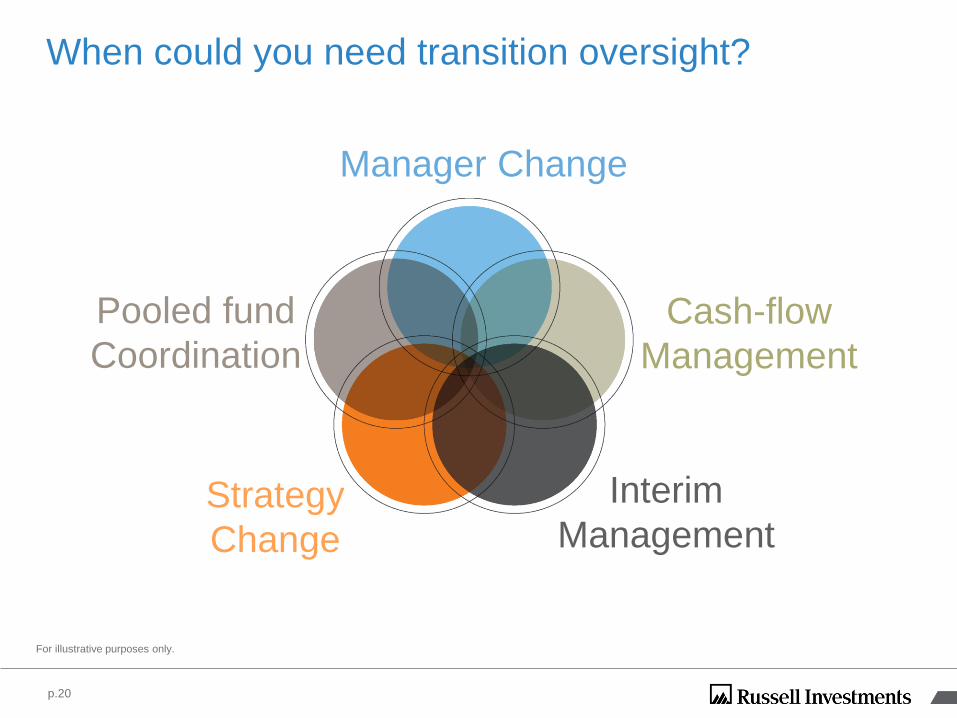
Manager Change
Pooled fund
Coordination
Cash-flow
Management
Interim
ManagementStrategy
Change
When could you need transition oversight?
p.20
For illustrative purposes only.
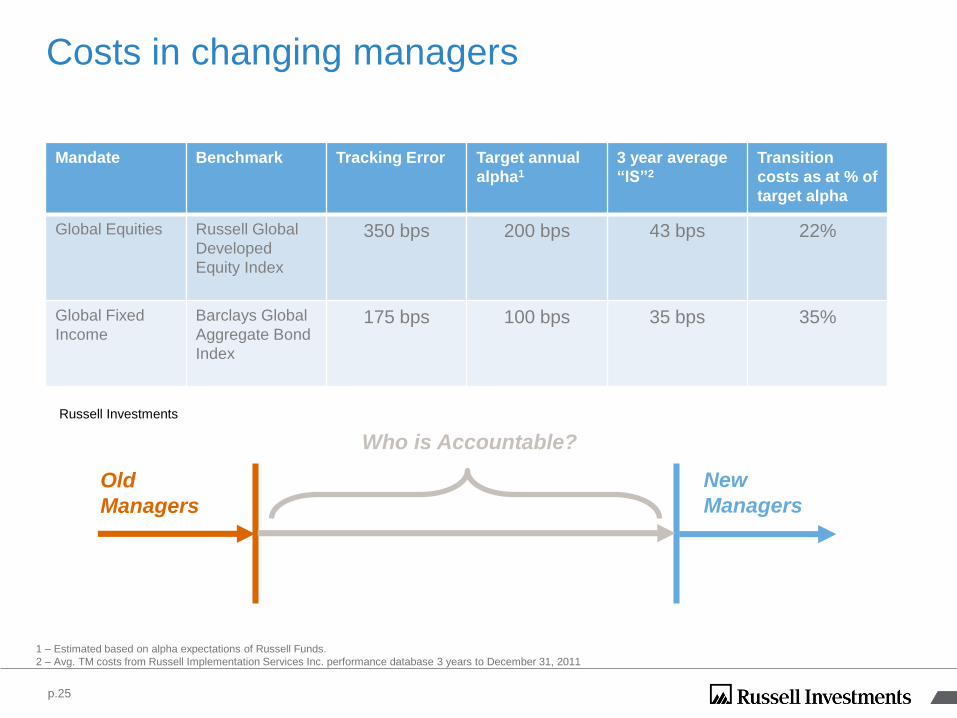
Costs in changing managers
1 – Estimated based on alpha expectations of Russell Funds.
2 – Avg. TM costs from Russell Implementation Services Inc. performance database 3 years to December 31, 2011
Mandate Benchmark Tracking Error Target annual
alpha1
3 year average
“IS”2
Transition
costs as at % of
target alpha
Global Equities Russell Global
Developed
Equity Index
350 bps 200 bps 43 bps 22%
Global Fixed
Income
Barclays Global
Aggregate Bond
Index
175 bps 100 bps 35 bps 35%
Old
Managers
New
Managers
Who is Accountable?
Russell Investments
p.25
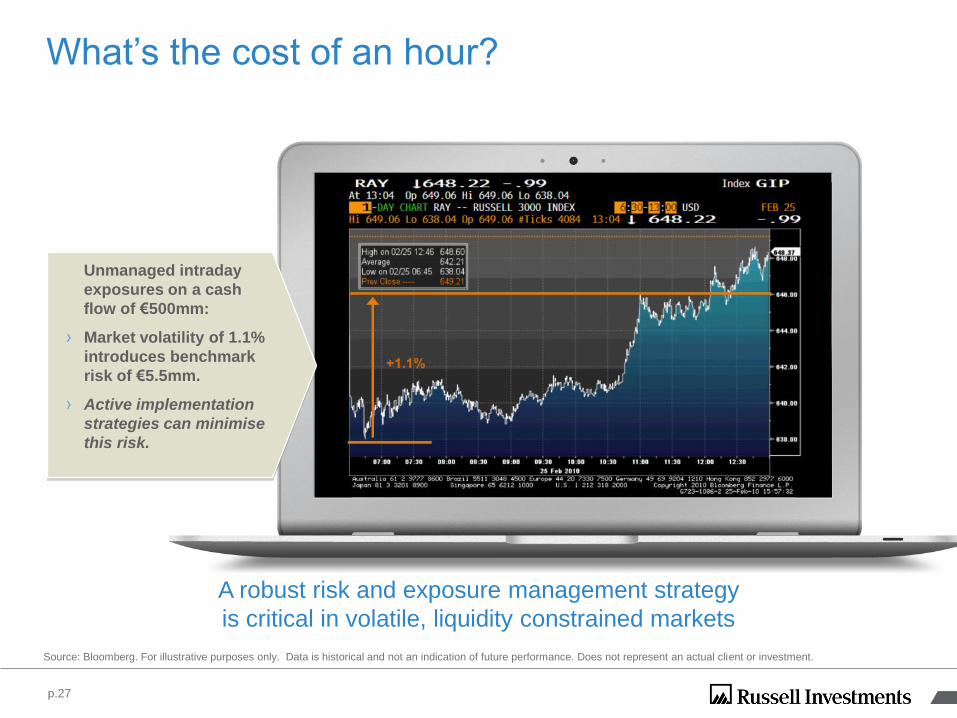
What’s the cost of an hour?
A robust risk and exposure management strategy
is critical in volatile, liquidity constrained markets
Unmanaged intraday
exposures on a cash
flow of €500mm:
› Market volatility of 1.1%
introduces benchmark
risk of €5.5mm.
› Active implementation
strategies can minimise
this risk.
Source: Bloomberg. For illustrative purposes only. Data is historical and not an indication of future performance. Does not represent an actual client or investment.
p.27
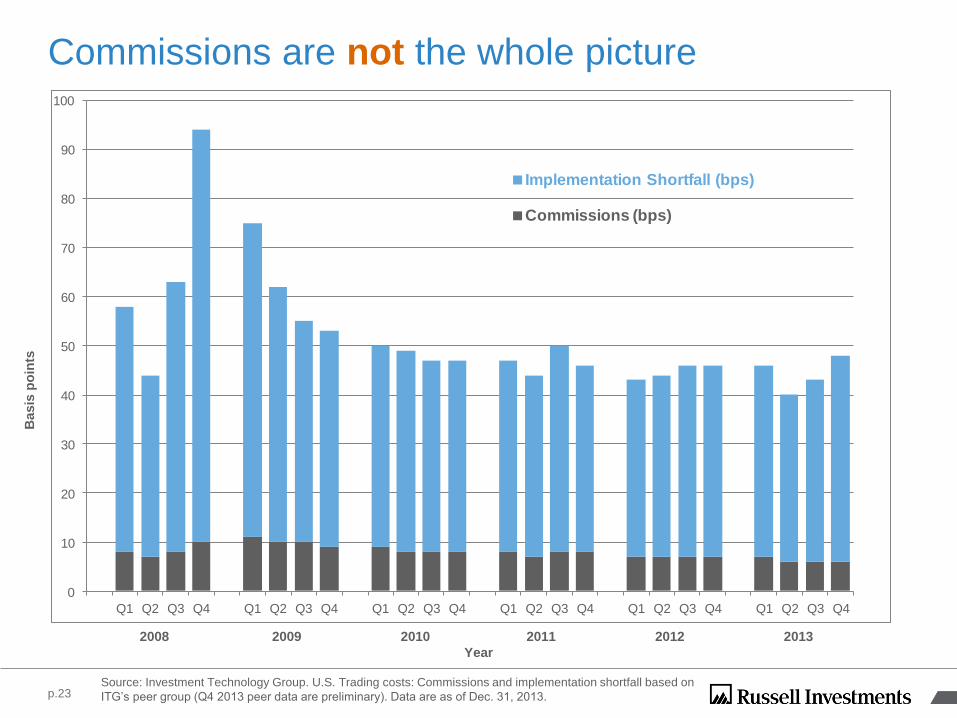
Commissions are not the whole picture
Source: Investment Technology Group. U.S. Trading costs: Commissions and implementation shortfall based on
ITG’s peer group (Q4 2013 peer data are preliminary). Data are as of Dec. 31, 2013.
0
10
20
30
40
50
60
70
80
90
100
Q1 Q2 Q3 Q4 Q1 Q2 Q3 Q4 Q1 Q2 Q3 Q4 Q1 Q2 Q3 Q4 Q1 Q2 Q3 Q4 Q1 Q2 Q3 Q4
Implementation Shortfall (bps)
Commissions (bps)
2008 2009 2010 2011 2012 2013
Year
Basis
po
ints
p.23

Bond transactions cost you more alpha than equities
*Source: Equities ($250mm portfolio) - ITG transactions cost model (Dec 31, 2013) Fixed income – Barclays LCS for US Credit TCX (Dec 31, 2013)
**Source: Russell Forecasts for Excess Return, Tracking Error, and Alpha-Beta Correlations - May2013
US Large CapDeveloped Intl.
EquityEmerging Market
EquityUS Credit
Round Trip Transaction Costs* 17 bps 43 bps 58 bps 32 bps
Expected Annual Excess Return** 115 bps 150 bps 175 bps 75 bps
Cost to Excess Return Ratio 0,15 0,29 0,33 0,43
-
0,2
0,4
0,6
0 bps
50 bps
100 bps
150 bps
200 bps
Cost to
excess r
etu
rn r
atio
Tra
nsaction c
osts
&
excess r
etu
rn
p.24
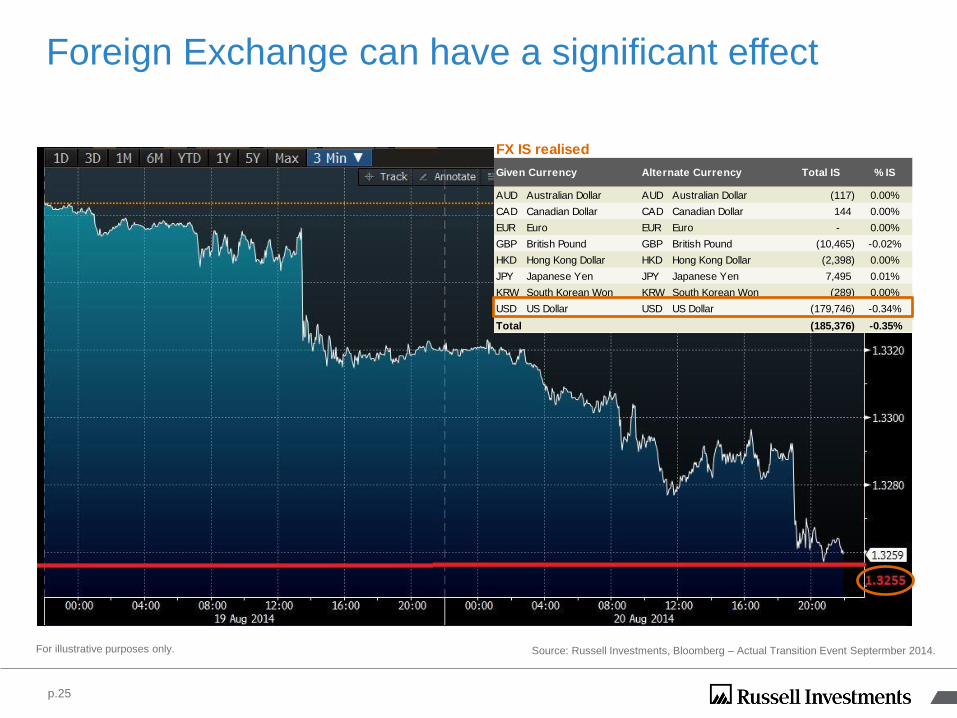
Foreign Exchange can have a significant effect
p.25
FX IS realised
Total IS % IS
AUD Australian Dollar AUD Australian Dollar (117) 0.00%
CAD Canadian Dollar CAD Canadian Dollar 144 0.00%
EUR Euro EUR Euro - 0.00%
GBP British Pound GBP British Pound (10,465) -0.02%
HKD Hong Kong Dollar HKD Hong Kong Dollar (2,398) 0.00%
JPY Japanese Yen JPY Japanese Yen 7,495 0.01%
KRW South Korean Won KRW South Korean Won (289) 0.00%
USD US Dollar USD US Dollar (179,746) -0.34%
Total (185,376) -0.35%
Alternate CurrencyGiven Currency
Source: Russell Investments, Bloomberg – Actual Transition Event Septermber 2014.For illustrative purposes only.
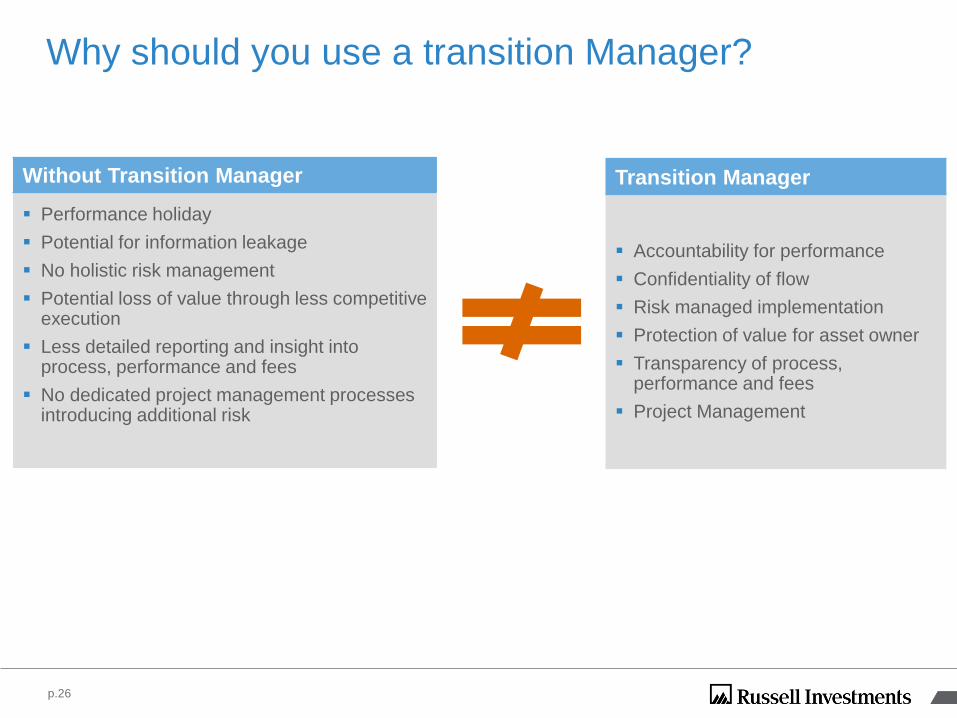
Why should you use a transition Manager?
Transition Manager
Accountability for performance
Confidentiality of flow
Risk managed implementation
Protection of value for asset owner
Transparency of process, performance and fees
Project Management
Without Transition Manager
Performance holiday
Potential for information leakage
No holistic risk management
Potential loss of value through less competitive execution
Less detailed reporting and insight into process, performance and fees
No dedicated project management processes introducing additional risk
p.26
Portfolio Risk Managment
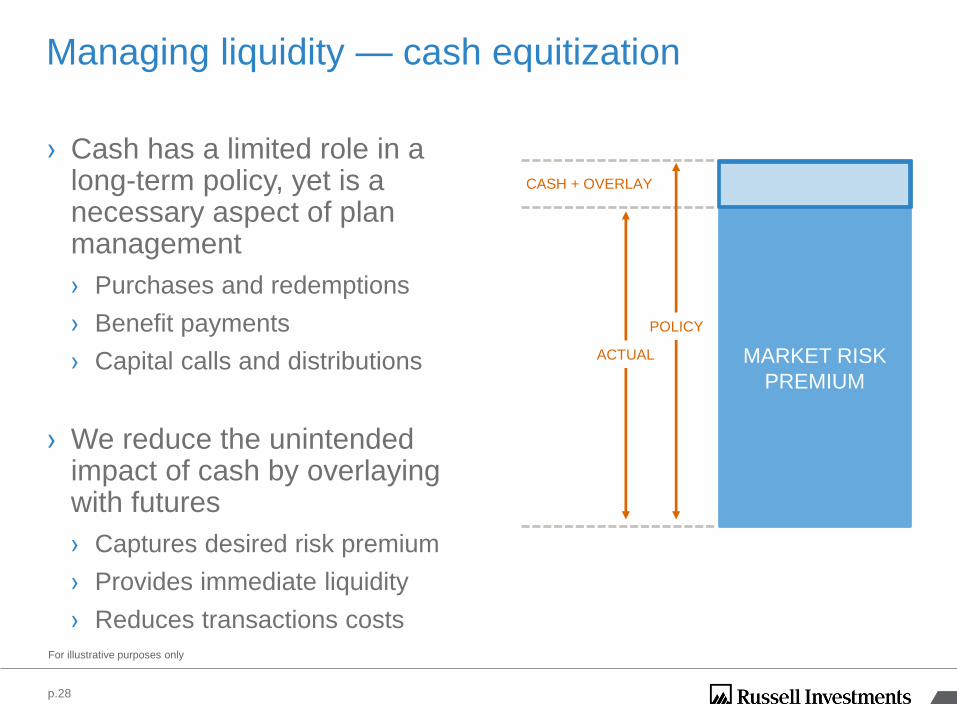
MARKET RISK
PREMIUM
Cash
Managing liquidity — cash equitization
p.28
For illustrative purposes only
ACTUAL
POLICY
CASH + OVERLAY
› Cash has a limited role in a long-term policy, yet is a necessary aspect of plan management
› Purchases and redemptions
› Benefit payments
› Capital calls and distributions
› We reduce the unintended impact of cash by overlaying with futures
› Captures desired risk premium
› Provides immediate liquidity
› Reduces transactions costs
-50
-40
-30
-20
-10
0
10
20
30
40
50
29
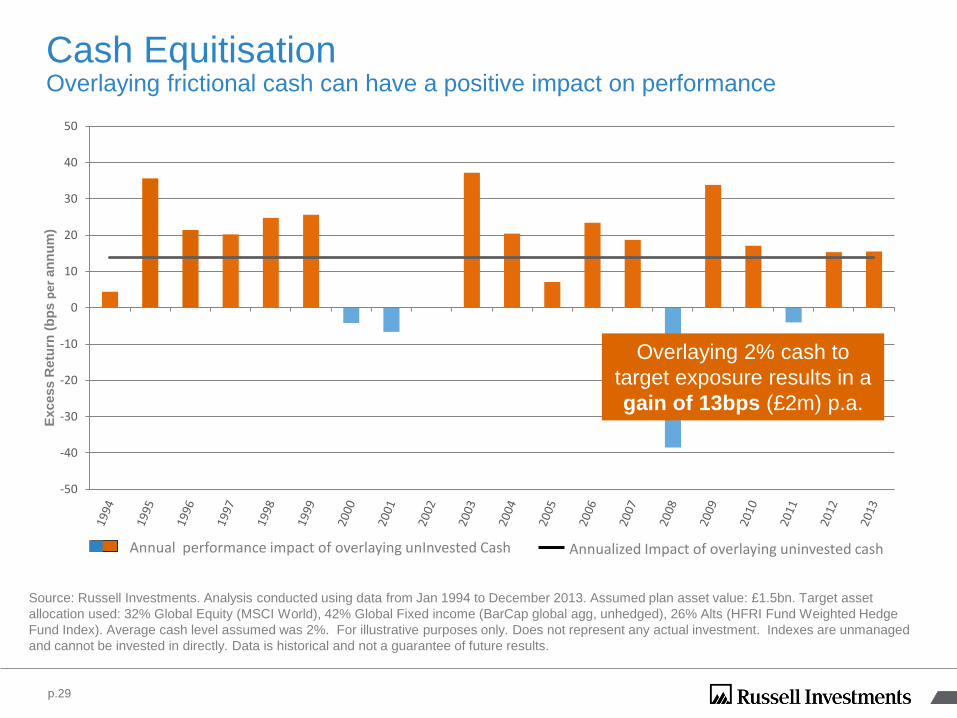
Cash EquitisationOverlaying frictional cash can have a positive impact on performance
Excess R
etu
rn (
bp
s p
er
an
nu
m)
Annualized Impact of overlaying uninvested cashAnnual performance impact of overlaying unInvested Cash
p.29
Overlaying 2% cash to
target exposure results in a
gain of 13bps (£2m) p.a.
Source: Russell Investments. Analysis conducted using data from Jan 1994 to December 2013. Assumed plan asset value: £1.5bn. Target asset
allocation used: 32% Global Equity (MSCI World), 42% Global Fixed income (BarCap global agg, unhedged), 26% Alts (HFRI Fund Weighted Hedge
Fund Index). Average cash level assumed was 2%. For illustrative purposes only. Does not represent any actual investment. Indexes are unmanaged
and cannot be invested in directly. Data is historical and not a guarantee of future results.
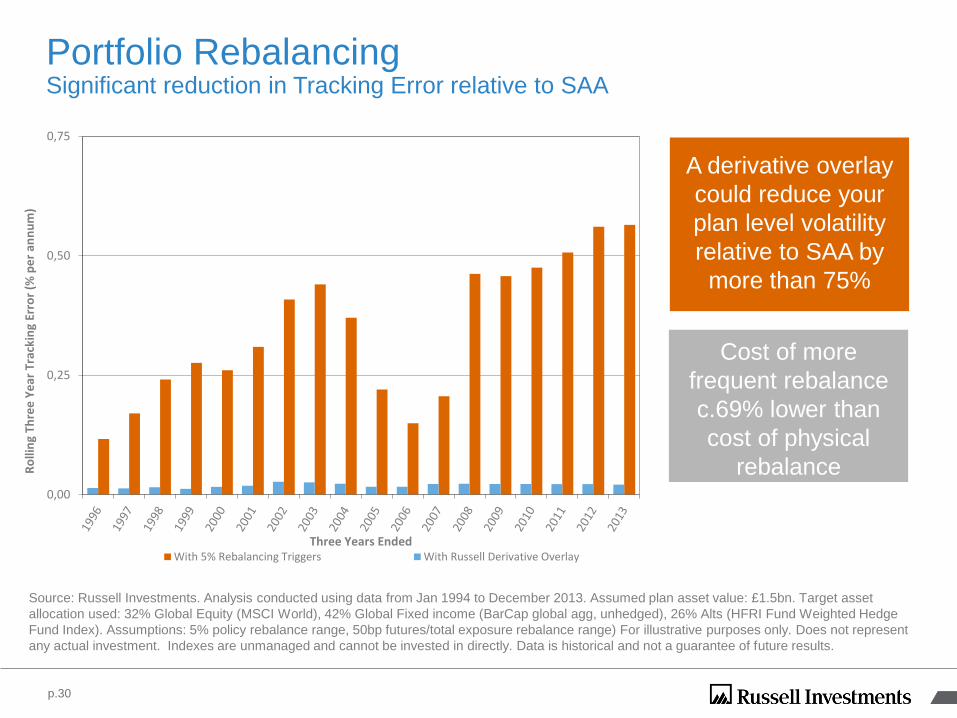
Portfolio RebalancingSignificant reduction in Tracking Error relative to SAA
p.30
A derivative overlay
could reduce your
plan level volatility
relative to SAA by
more than 75%
Cost of more
frequent rebalance
c.69% lower than
cost of physical
rebalance
Source: Russell Investments. Analysis conducted using data from Jan 1994 to December 2013. Assumed plan asset value: £1.5bn. Target asset
allocation used: 32% Global Equity (MSCI World), 42% Global Fixed income (BarCap global agg, unhedged), 26% Alts (HFRI Fund Weighted Hedge
Fund Index). Assumptions: 5% policy rebalance range, 50bp futures/total exposure rebalance range) For illustrative purposes only. Does not represent
any actual investment. Indexes are unmanaged and cannot be invested in directly. Data is historical and not a guarantee of future results.
0,00
0,25
0,50
0,75
Ro
llin
g Th
ree
Ye
ar T
rack
ing
Erro
r (%
pe
r an
nu
m)
Three Years EndedWith 5% Rebalancing Triggers With Russell Derivative Overlay
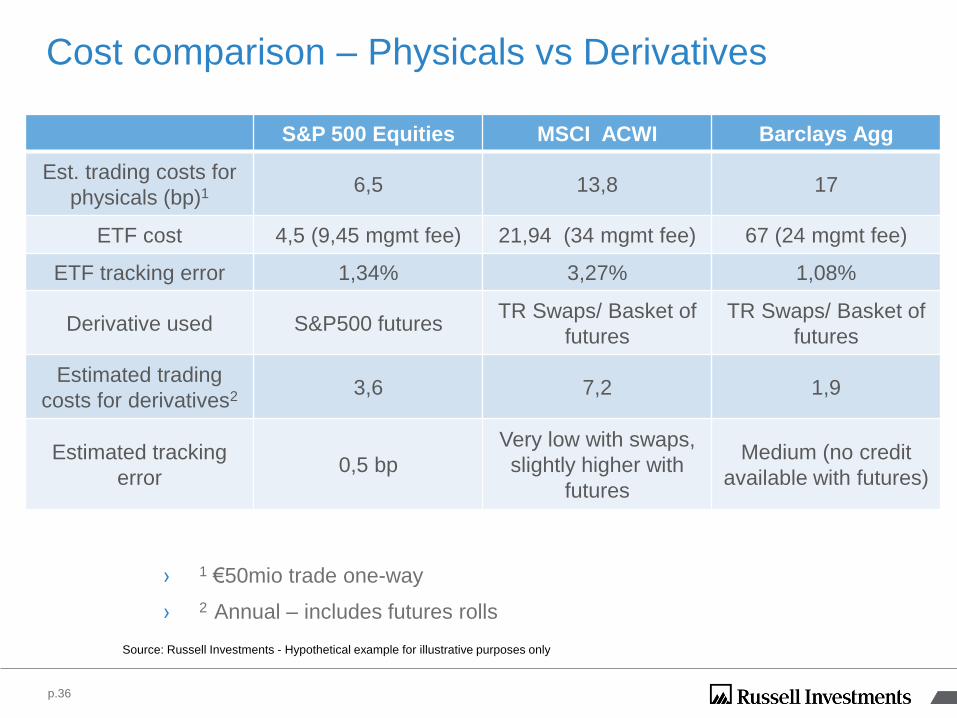
Cost comparison – Physicals vs Derivatives
S&P 500 Equities MSCI ACWI Barclays Agg
Est. trading costs for
physicals (bp)1 6,5 13,8 17
ETF cost 4,5 (9,45 mgmt fee) 21,94 (34 mgmt fee) 67 (24 mgmt fee)
ETF tracking error 1,34% 3,27% 1,08%
Derivative used S&P500 futuresTR Swaps/ Basket of
futures
TR Swaps/ Basket of
futures
Estimated trading
costs for derivatives2 3,6 7,2 1,9
Estimated tracking
error0,5 bp
Very low with swaps,
slightly higher with
futures
Medium (no credit
available with futures)
Source: Russell Investments - Hypothetical example for illustrative purposes only
› 1 €50mio trade one-way
› 2 Annual – includes futures rolls
p.36

33
Important Information
This material is not intended for distribution to retail clients. This material does not constitute an offer or invitation to anyone in any jurisdiction to invest in any Russell product or use any Russell services where such offer or invitation is not lawful, or in which the person making such offer or invitation is not qualified to do so, nor has it been prepared in connection with any such offer or invitation.
Unless otherwise specified, Russell Investments is the source of all data. All information contained in this material is current at the time of issue and, to the best of our knowledge, accurate. Any opinion expressed is that of Russell Investments, is not a statement of fact, is subject to change and, unless it relates to a specified investment, does not constitute the regulated activity of “advising on investments” for the purposes of the Financial Services and Markets Act 2000.
Copyright 2014 FactSet Research Systems Inc. All rights reserved.
Excess Returns:Each product is compared to the relevant Russell assigned benchmark and universe to determine product level excess returns for each quarter. All product level quarterly excess returns are compound excess returns. Product level quarterly excess returns are then averaged across all products to determine an average quarterly excess return. The average quarterly excess returns are then annualized to determine the [3/5/10] year annualized rolling excess returns. If the annualized average excess return is greater than zero, then the product is considered to have outperformed over that time period.
Note: Benchmarks are total return (they include the reinvestment of dividends) and cannot be invested in directly.
Representation: No client of Russell Investments has been able to achieve the represented performance due to the fact that the universes are comprehensive composites that cannot be invested in directly. The universes in Russell's research database that are used in this material cannot be purchased or held by any client. These manager products are available for our consulting clients and internal portfolio managers to use in the construction of portfolios for our fund and separate account clients. Past performance is not indicative of future performance.
The value of investments and the income from them can fall as well as rise and is not guaranteed. You may not get back the amount originally invested.
Any forecast, projection or target is indicative only and not guaranteed in any way. Any past performance figures are not necessarily a guide to future performance.
Any reference to returns linked to currencies may increase or decrease as a result of currency fluctuations. Any references to tax treatments depend on the circumstances of the individual client and may be subject to change in the future.
Issued by Russell Implementation Services Limited. Company No. 3049880. Registered in England and Wales with registered office at: Rex House, 10 Regent Street, London SW1Y 4PE. Telephone 020 7024 6000. Authorised and regulated by the Financial Services Authority, 25 The North Colonnade, Canary Wharf, London E14 5HS.
RISL-2014-11-20-0206
Copyright 2014 FactSet Research Systems Inc. All rights reserved.
33