Embed Size (px)
Citation preview
MIT Joint Program on the Science and Policy of Global Change combines cutting-edge scientific research with independent policy analysis to provide a solid foundation for the public and private decisions needed to mitigate and adapt to unavoidable global environmental changes. Being data-driven, the Joint Program uses extensive Earth system and economic data and models to produce quantitative analysis and predictions of the risks of climate change and the challenges of limiting human influence on the environment—essential knowledge for the international dialogue toward a global response to climate change.
To this end, the Joint Program brings together an interdisciplinary group from two established MIT research centers: the Center for Global Change Science (CGCS) and the Center for Energy and Environmental Policy Research (CEEPR). These two centers—along with collaborators from the Marine Biology Laboratory (MBL) at
Woods Hole and short- and long-term visitors—provide the united vision needed to solve global challenges.
At the heart of much of the program’s work lies MIT’s Integrated Global System Model. Through this integrated model, the program seeks to discover new interactions among natural and human climate system components; objectively assess uncertainty in economic and climate projections; critically and quantitatively analyze environmental management and policy proposals; understand complex connections among the many forces that will shape our future; and improve methods to model, monitor and verify greenhouse gas emissions and climatic impacts.
This reprint is intended to communicate research results and improve public understanding of global environment and energy challenges, thereby contributing to informed debate about climate change and the economic and social implications of policy alternatives.
—Ronald G. Prinn and John M. Reilly, Joint Program Co-Directors
MIT Joint Program on the Science and Policy of Global Change
Massachusetts Institute of Technology 77 Massachusetts Ave., E19-411 Cambridge MA 02139-4307 (USA)
T (617) 253-7492 F (617) 253-9845 [email protected] http://globalchange.mit.edu/
February 2017Report 308
Transparency in the Paris AgreementHenry D. Jacoby, Y.-H. Henry Chen and Brian P. Flannery

FeBruarY 2017
Transparency in the Paris AgreementHenry D. Jacoby1,2, Y.-H. Henry Chen1 and Brian P. Flannery3
Abstract: Establishing a credible and effective transparency system will be both crucial and challenging for the climate regime based on the pledge and review process established in the Paris Agreement. The Agreement provides for review of achievements under national pledges (Nationally Determined Contributions, or NDCs), but much of this information will become available only well after key steps in the launch of this latest attempt to control human influence on the climate. Still, in these early years, information and understanding of individual and collective performance, and of relative national burdens under the NDCs, will play an important role in the success or failure of the Agreement. However, because of the phasing of various steps in the 5-year cycles under the Agreement and the unavoidable delays of two or more years to produce and review government reports, the Climate Convention and other intergovernmental institutions are ill-suited to carry out timely analyses of progress. Consequently, in advance of formal procedures, academic and other non-governmental groups are going to provide analyses based on available data and their own methodologies. We explore this transparency challenge, using the MIT Economic Projection and Policy Analysis (EPPA) model, to construct sample analyses, and consider ways that efforts outside official channels can make an effective contribution to the success of the Agreement.
1 Joint Program on the Science and Policy of Global Change, Massacusetts Institute of Technology, Cambridge, MA, USA2 Corresponding Author (Email: [email protected])3 Resources for the Future, Washington, DC, USA
1. LAUNCHING A NEW CLIMATE REGIME ..............................................................................................................21.1 THe rOLe OF TraNSPareNCY .....................................................................................................................................21.2 THe TIMING OF INITIaL CYCLeS, rePOrTING GuIDeLINeS aND STOCKTaKeS .........................................31.3 uSING eCONOMIC MODeLS TO INFOrM THe TraNSPareNCY PrOCeSS ...................................................5
2. PROVIDING TRANSPARENCY ................................................................................................................................62.1 INDIVIDuaL PerFOrMaNCe ...........................................................................................................................................62.2 aGGreGaTe aCHIeVeMeNT ........................................................................................................................................... 72.3 COMParaBILITY aND reLaTIVe eFFOrT ..................................................................................................................8
3. ENHANCING THE TRANSPARENCY FRAMEWORK .......................................................................................11
4. REFERENCES ........................................................................................................................................................... 12
APPENDIX A. THE MIT EPPA MODEL .................................................................................................................... 14
APPENDIX B. NDCS AND POLICIES AND MEASURES ...................................................................................... 15B.1 FIrST NDCS ........................................................................................................................................................................15B.2 eXPeCTeD POLICIeS aND MeaSureS .....................................................................................................................15
B.2.1 electric Power ................................................................................................................................................16B.2.2 Transport ........................................................................................................................................................16
APPENDIX B REFERENCES ........................................................................................................................................17

1. Launching A New Climate RegimeTo be effective, the international process cannot afford to repeat the experience of the 1997 Kyoto Protocol, where many years were spent trying to implement its legal-ly-binding, limited national emission targets. Kyoto was essentially thrown aside in in 2009, when the 15th meeting of the Conference of Parties (COP 15) to the UNFCCC established a new, more universal approach, the Copen-hagen Accord, based on voluntary pledges and reviews of performance. It has taken another six years to agree on a formal, global realization of the new regime in the Paris Agreement, reached at COP 21 in 2015.1 Signifi-cant disagreements remain unresolved, e.g., concerning finance and how common but differentiated responsi-bilities (CBDR) will manifest, and key procedures and guidelines are still under negotiation. Moreover, it is argued that a regime based on pledge and review can-not in any case meet the challenging, long-term objec-tives of the Agreement (Barrett and Dannenberg, 2016; Nordhaus, 2016). It is, nonetheless, the system we now have—perhaps the best possible given the nature of the problem (Keohane and Victor, 2016)—so nations have every incentive to gain the maximum results from it. Ef-fectiveness in the early years in building the “rulebook” and procedures, and, even more, in achieving emissions reductions, will determine whether another long peri-od of years will be spent in frustration, trying to reduce global greenhouse gas emissions by this approach. Here we focus on one component of the Paris Agreement that will be important in determining its success: review of performance or what the Agreement calls “transparency” in the process to undertake, report on, review and renew national pledges.The Agreement covers many aspects of the global climate effort, including adaptation to a changing climate, capac-ity development in lower income countries, technology transfer, and diverse forms of financial aid. Its Article 4 (Mitigation) describes the process for voluntary emis-sions pledges, termed Nationally Determined Contribu-tions (NDCs). In the run-up to Paris, nations were asked to declare their Intended NDC (INDC), and, by the start of the meeting, over 190 nations had done so—bringing essentially the whole globe into a mitigation regime for the first time. Most of these INDCs are being submitted, unchanged, as the first NDCs. As they join, each nation declares its NDC of emissions reduction and other actions, extending
1 For the history of the path to Paris and its current provisions see Flannery (2015) and Bodansky (2016). The Paris Agreement is available at http://unfccc.int/files/essential_background/convention/application/pdf/english_paris_agreement.pdf. The accompanying decision text, elaborating steps to implementation, is athttp://unfccc.int/resource/docs/2015/cop21/eng/10a01.pdf.
through the period ten years ahead. This initial pledge is the first of a series, renewed in five-year cycles, wherein nations are expected to increase their mitigation effort with each cycle. Although negotiators anticipated that the Agreement would not take effect long before 2020, by October 2016 the required level of ratification, acceptance, approval or accession (55 nations, representing at least 55% of global greenhouse emissions) had been achieved, and the Agreement entered into force 4 November 2016. Most nations stated their INDCs in terms of a 2030 goal, though several (including the U.S.) chose target dates of 2025. In 2020 all Nations will submit or provide updated pledges for the second cycle, through 2030.Developed nations pledge economy-wide, absolute emis-sions reduction targets (similar to those in the Kyoto Protocol—though lacking the legal obligation to meet them). All have done so, though not all with the same base year or accompanying information. Developing na-tions are free to state their “contributions” in whatever form they feel to be appropriate, given their particular national circumstances. Their INDCs take many forms. Most state their contributions in terms of the Kyoto bas-ket of greenhouse gases, but some pledge reductions in CO2 only. Some pledge a reduction in emissions intensity (e.g., tons per dollar of GDP) below a base year, but a large number frame their INDCs as a reduction relative to a business-as-usual projection of national emissions. For example, China pledged that, in addition to meeting a CO2-only intensity target, its CO2 emissions will peak “around 2030”, but it has not specified the height of the peak. Finally, a number of parties pledge to undertake specific policy measures, not an overall national target. Flexibility to accommodate domestic conditions made agreement in Paris possible, but makes it challenging to construct a clear picture of the individual INDCs, antici-pate collective achievement across the entire portfolio of INDCs, or evaluate the relative effort of various parties.
1.1 The Role of Transparency“Transparency” is a procedural term used in the Paris text that absorbs tasks and controversies that in previous climate discussions fell under the heading of monitoring, reporting and verification, or MRV (Singh et al., 2016). All international agreements involve some system of MRV and, in a pledge and review regime as established in Paris, MRV provisions serve many important functions (Wiener, 2015). Two among these are most important for this discussion: revealing the performance of the in-dividual parties (i.e., through reports and reviews), and assessing the aggregate achievement of the pledges in re-ducing global emissions. The Paris Agreement contains provisions for both, but precisely how they will be imple-mented remains a matter of negotiation.
rePOrT 308 MIT JOINT PrOGraM ON THe SCIeNCe aND POLICY OF GLOBaL CHaNGe
2

The expectation is that the transparency processes in the Agreement will take effect in the period after 2020. The new procedures will build from and enhance existing procedures now in effect. For now, parties operate under reporting and review procedures established at COP 16 and COP 17 to monitor progress under the Copenhagen Accord. These consist of biennial national reports for Annex 1 parties (developed nations), with a review pro-cess of international assessment and review; and biennial update reports for most non-Annex 1 parties, with a re-view process of international consultation and analysis. Differing approaches, with less stringent requirements for developing nations, were necessary to reflect CBDR.The Agreement’s Article 13 establishes a transparency framework to track both action and support by parties, with flexibility to account for differing national capaci-ty. The objectives of the framework it establishes include the “clarity and tracking of progress towards achieving Parties’ individual nationally determined contributions under Article 4 [mitigation].” Free riding is a threat to such a voluntary regime, giving crucial importance to its “review” component. The effort nations put into meet-ing their first NDCs, and their willingness to take on additional reductions in subsequent cycles, will depend on credible information about whether others are doing what they pledged, and on perceptions of the fairness of the relative distribution of burdens. The negotiators worked hard to overcome long-standing conflicts over MRV2 to provide this information in as credible a form as possible. All but the least developed countries and small island states (who are given great-er flexibility) are to report biennially, and each nation’s report shall undergo a “technical expert review” and be subjected to a “facilitative multilateral consideration of progress.” The Ad Hoc Working Group on the Paris Agreement (APA) is to work out details of this review process, including development of the modalities, pro-cedures and guidelines (MPGs) for accounting of the NDCs, deciding the content and timing of the reports to be submitted by different categories of parties, and estab-lishing review procedures. Though not formally under the heading of “transparency,” Article 14 establishes another information process that will, in fact, be an essential element of the transparency regime. Beginning in 2023, and each five years thereaf-ter, the parties are to conduct a “global stocktake” where they assess their collective progress in achieving various provisions of the Agreement, especially progress towards long-term goals. The hope is that each stocktake will lead the parties to take on greater efforts in their follow-on
2 For a glimpse as some of the issues, see Niederberger and Kimble (2011) and Gupta et al. (2014).
NDCs. Because 2023 is so far in the future, the parties also agreed to convene a “facilitative dialog” among the parties in 2018, to “take stock” of the collective progress of all parties and to inform the preparation of future NDCs. Overall, the transparency process aims to demon-strate effective progress and provide understanding and support for more ambitious future pledges.
1.2 The Timing of Initial Cycles, Reporting Guidelines and Stocktakes
The rapid pace of events in the next decade creates a daunting challenge for the transparency objectives of the Paris Agreement. Figure 1 places the launch of the Paris Agreement, its pledge cycles and the stocktakes in the context of paths to alternative emissions futures. It shows a projection of emissions of the various green-house gases, in CO2 equivalents (CO2-e), in the absence of the mitigation effort pledged in the Agreement (this projection is inserted to provide baselines for discus-sion below of measures of national effort). Figure 1 also presents our estimate of the achievement expected from the NDCs pledged for 2025 and 2030, with a projection of contributions to 2040. Actual global emissions from 2030 forward likely will be lower than this estimate, as a result of increased effort in subsequent pledge cycles. They will, however, depend on as yet unknown future commitments that are the source of concern in this dis-cussion.3 Of course future emissions may also be affect-ed (positively or negatively) by unforeseen, indeed un-knowable developments beyond the purview of analysts or economic models (see Section 1.3 and the discussion of ex post analyses). Also plotted is a cartoon of the emissions path consis-tent with a longstanding goal of the climate negotiations, restated in Paris, of holding the global temperature in-crease to 2°C. There are many and varied estimates of the stringency of emissions reductions needed in the first few pledge cycles to put the world on such a path (e.g., EC-JRC, 2015; Climate Interactive, 2016; Climate Action Tracker, 2015; International Energy Agency, 2015; Jacoby and Chen, 2014, 2015; Le Treut et al., 2015; Chen et al., 2016a; UNEP, 2016). What matters for this discussion is that all of these projections presume that a very strong increase in mitigation will be achieved in the second and subsequent pledge cycles. Indeed, the fate of the new re-gime likely will be largely determined in this early peri-od—by pledges to be made in 2020 and 2025.
3 The emissions projections in the figure are made using the MIT Economic Projection and Policy Analysis (EPPA) model, which disaggregates the global economy into twelve of the larger economies and six aggregate regions. The EPPA model is described in Appendix A. The assumptions underlying our estimate of the expected NDC performance of the eighteen regions are provided in Appendix B.
MIT JOINT PrOGraM ON THe SCIeNCe aND POLICY OF GLOBaL CHaNGe rePOrT 308
3
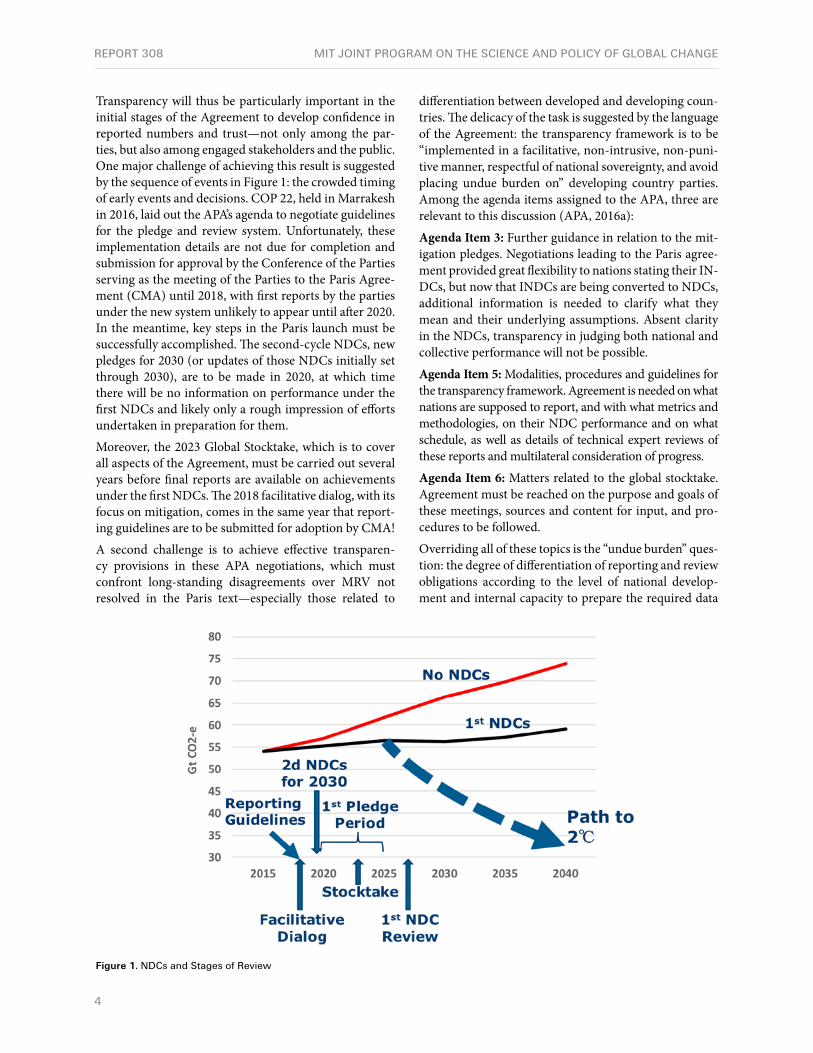
Transparency will thus be particularly important in the initial stages of the Agreement to develop confidence in reported numbers and trust—not only among the par-ties, but also among engaged stakeholders and the public. One major challenge of achieving this result is suggested by the sequence of events in Figure 1: the crowded timing of early events and decisions. COP 22, held in Marrakesh in 2016, laid out the APA’s agenda to negotiate guidelines for the pledge and review system. Unfortunately, these implementation details are not due for completion and submission for approval by the Conference of the Parties serving as the meeting of the Parties to the Paris Agree-ment (CMA) until 2018, with first reports by the parties under the new system unlikely to appear until after 2020. In the meantime, key steps in the Paris launch must be successfully accomplished. The second-cycle NDCs, new pledges for 2030 (or updates of those NDCs initially set through 2030), are to be made in 2020, at which time there will be no information on performance under the first NDCs and likely only a rough impression of efforts undertaken in preparation for them. Moreover, the 2023 Global Stocktake, which is to cover all aspects of the Agreement, must be carried out several years before final reports are available on achievements under the first NDCs. The 2018 facilitative dialog, with its focus on mitigation, comes in the same year that report-ing guidelines are to be submitted for adoption by CMA! A second challenge is to achieve effective transparen-cy provisions in these APA negotiations, which must confront long-standing disagreements over MRV not resolved in the Paris text—especially those related to
differentiation between developed and developing coun-tries. The delicacy of the task is suggested by the language of the Agreement: the transparency framework is to be “implemented in a facilitative, non-intrusive, non-puni-tive manner, respectful of national sovereignty, and avoid placing undue burden on” developing country parties. Among the agenda items assigned to the APA, three are relevant to this discussion (APA, 2016a):
Agenda Item 3: Further guidance in relation to the mit-igation pledges. Negotiations leading to the Paris agree-ment provided great flexibility to nations stating their IN-DCs, but now that INDCs are being converted to NDCs, additional information is needed to clarify what they mean and their underlying assumptions. Absent clarity in the NDCs, transparency in judging both national and collective performance will not be possible.
Agenda Item 5: Modalities, procedures and guidelines for the transparency framework. Agreement is needed on what nations are supposed to report, and with what metrics and methodologies, on their NDC performance and on what schedule, as well as details of technical expert reviews of these reports and multilateral consideration of progress.
Agenda Item 6: Matters related to the global stocktake. Agreement must be reached on the purpose and goals of these meetings, sources and content for input, and pro-cedures to be followed.
Overriding all of these topics is the “undue burden” ques-tion: the degree of differentiation of reporting and review obligations according to the level of national develop-ment and internal capacity to prepare the required data
Figure 1. NDCs and Stages of review
rePOrT 308 MIT JOINT PrOGraM ON THe SCIeNCe aND POLICY OF GLOBaL CHaNGe
4

and analysis.4 Also, although one focus in this discussion is on national and collective emissions mitigation, an-other—of major importance to developing countries—concerns national contributions to adaptation (the APA’s Agenda Item 4) and to finance, technology transfer and development of capacity.Agreements reached in the APA negotiations will have a substantial effect on the credibility of the pledge-and-re-view system and thus on the viability of the Paris Agree-ment, and we explore them further in Section 2. However, even with APA success in agreeing to the desired MRV, procedures built into the Agreement, plus the lags in re-port preparation, mean that in the critical early years of the Agreement insufficient information will be available for timely review of the NDCs of individual parties, and of global progress toward long-term goals. The resulting demand for transparency will then be filled, for better or worse, by analyses carried out largely by groups outside the bodies of the Climate Convention and other inter-governmental organizations—mainly non-governmental analysts in NGOs, academia, business, etc. In Section 3 we explore ways that these efforts can be effective in supporting development of the Agreement, especially its transparency processes.
1.3 Using Economic Models to Inform the Transparency Process
While a variety of approaches can be applied to support the transparency regime, quantitative analyses using cli-mate and economic models to simulate outcomes will be essential to assess NDCs with respect to emissions reductions (both national and global), compare national efforts, and track progress toward long-term goals. Inte-grated Assessment Models (IAMs), such as the MIT In-tegrated Global System Model—and within it the EPPA model used in this study—provide a capability to eval-uate interactions involving multiple sectors, regions, technologies and policies. Results from such studies by multiple IAM groups have long been an essential feature of assessments by national and international bodies, no-tably IPCC Working Group 3 (IPCC, 2014). Typical IAM studies of developments over several de-cades proceed by simulating: 1) hypothetical reference or base cases with only existing policies, and 2) various policy interventions designed to mitigate emissions. Be-cause economic feedbacks and interactions—among do-mestic sectors, along supply and value chains and across borders—are ubiquitous, assessment not only of global,
4 To aid nations lacking the institutional and technical capability to prepare inventories and track progress the Paris Agreement establishes a Capacity-Building Initiative for Transparency (CBIT), to be imple-mented by the Global Environment Facility. See http://www.thegef.org/topics/capacity-building-initiative-transparency-cbit
but also of domestic outcomes requires consideration of the full portfolio of NDCs. Quantitative analysis is nec-essary to understand not only emissions outcomes but also economic, social and environmental implications of national NDCs. Clearly, IAMs are essential to provide ex ante simulations of anticipated domestic and collective results from initial NDCs. As well, going forward, they can provide insights to help improve transparency processes—illuminating prog-ress and trends, and aiding in ex post analyses of outcomes. For example, these potential contributions include:Understanding national (I)NDCs: To simulate perfor-mance, analysts must translate national (I)NDCs into quantitative specifications required for model simula-tions. For example, even for the reference case, this may include assumptions for population change, productivity gains, GDP and the cost and performance of future tech-nologies. The intervention case requires detail regarding policies to achieve objectives. In many cases this requires analysts to supply information not available in the (I)NDC itself. A summary of key gaps and their relevance to as-sessment could be an invaluable input (now and going forward) to improve the transparency process over time.Presenting ex ante projections: Although INDCs come in many varieties, once they have been translated into quantitative parameters that allow model simulation, re-sults over time can be exhibited in common formats for a wide range of properties. This helps to clarify emissions implications and the comparability of national pledges—for example, they can be displayed using a range of com-mon base years and provide results for multiple metrics.Accounting for economy-wide and cross border inter-actions: IAMs allow quantitative evaluation of interac-tions that may enhance or interfere with presumed out-comes based on analysis of single sectors or individual nations. These effects include not only direct impacts but also those that alter the terms of trade. As described in Section 3, these effects can be significant for both mitiga-tion outcomes and domestic economic impacts. Insights into progress and trends and ex post reviews: Going forward, it will be important to track progress in meeting current NDCs to inform future pledges. IAM simulations can evaluate progress using a variety of met-rics—both those that form the basis for specific national pledges and others that provide additional insight regard-ing comparability of effort. Moreover, reality may play out in ways that differ considerably from the assump-tions that underlay earlier NDCs. For example, emis-sions may be materially higher or lower than pledged as a result of unforeseen and unforeseeable circumstances such as changes in government, recessions, natural di-sasters (e.g., tsunamis), and technological advances (e.g.,
MIT JOINT PrOGraM ON THe SCIeNCe aND POLICY OF GLOBaL CHaNGe rePOrT 308
5

fracked oil and gas). IAM analyses can help to inform negotiators and engaged stakeholders sorting out the va-lidity of eariler assumptions, the effectiveness of policies, and the consequences of unanticipated developments. Such analyses will be important in forming judgments about the ambition and feasibility of future pledges. From these perspectives, analyses using quantitative models can be useful not only to provide data for use within the transparency process, but also to indicate the types of upfront accompanying information, reports and metrics that could be used to improve the entire process going forward.
2. Providing TransparencyThree components of transparency are needed to support the mitigation goals of the Paris Agreement: credibility (reliably describing national performance in mitigation and support), effectiveness (in achieving national and ag-gregate global emissions outcomes), and fairness (regard-ing relative efforts). Each has its own problems of data, definition and analysis that are unlikely to be resolved in time to support transparency provisions of the Agreement in its crucial early years, illustrated in Figure 1. Indeed, rather than a process alternating between pledging and reviewing outcomes, during the startup phase of the Paris Agreement the sequence is pledge (2015 through 2025 or 2030), pledge (2020 through 2030), pledge (2025 through 2035), report outcomes (through 2025, in perhaps 2027) and then review (2027 or later). The transparency system for the most part must be based on reports and reviews of progress and trends relative to pledges (rather than out-comes) and progress toward long-term goals.
2.1 Individual PerformanceIn Framework Convention jargon, the task of APA Agen-da Item 3 is clarification of the “features” of the NDCs. For the developed nations, who pledge economy-wide reduc-tions below the level in a base year, the contribution and metrics of performance are clear. But pledges and metrics for NDCs involving a reduction below a business-as-usual (BAU) projection, a decrease in emissions intensity, or a sectoral outcome, frequently leave much to be desired—or, in the case of an analyst or input to a model, much to be assumed. For example, some NDCs based on a reduction below BAU do not include a clearly defined basis for emis-sions forecasts or the assumptions behind it. Similarly, in-tensity pledges usually do not specify the future GDP level to which the intensity target will apply. Thus, negotiation within the APA will attempt to define the elements of a clear pledge and an adequate report, e.g., including start-ing points and future reference values that underlie the proposed NDC. For reductions below BAU emissions, in-clusion of a clearly defined emissions forecast seems an es-
sential requirement of the reporting guidelines. The GDP projection underlying an intensity pledge is more contro-versial. Nations making this pledge prefer the flexibility to adjust their contribution to uncertain future growth. Also, they perhaps fear that the projection will be used to con-vert the NDC into an implicit pledge to an absolute emis-sions goal, like those expected of the developed nations. Without these underlying assumptions and projections, of course, the estimation of quantitative emissions is left to the analyst (of which more later).Then there is the issue of the guidelines for information to track progress with the NDCs (APA Agenda Item 5). Inventories of greenhouse gas emissions and sinks will build on decades of experience with previous UNFCCC reports and methodologies developed by the Intergov-ernmental Panel on Climate Change (IPCC), but ad-ditional information desired to “track progress” on the NDCs is yet to be determined. There are proposals for the guidelines to include metrics for progress on policies and measures being applied and how they are consistent with the NDC, and perhaps with other features of a low-emis-sions development strategy (e.g., APA, 2016b). On this point the negotiations will confront the requirement that the procedure must be “non-intrusive” and “respective of national sovereignty”—familiar aspects of controversy over the ongoing requirement for CBDR in MRV.In the absence of reliable and timely national reports and reviews under the Paris Agreement, outside groups are developing frameworks for study and documentation of institutional development and policy formation (e.g., Ba-rua et al., 2014). Much of this effort is intended to inform and guide domestic mitigation actions, however, and proposed frameworks are too complicated for inclusion in studies of aggregate achievement or comparisons of effort at the national level. For example, they often distin-guish policy instruments by greenhouse gas, economic sector, and national institutional structure & history, and cover multiple stages of formulation: public consulta-tion, legislation, licensing and permitting, financing and implementation, and expected effects. These efforts can nonetheless contribute to projections of individual effort and likely emissions results and thereby contribute to larger transparency challenge. Also to be determined in negotiations under APA Agen-da Item 5 is the timing of the first report under the new guidelines. Since the first pledge period begins in 2020 and runs to 2025, one might expect the first date for an interim report to be no earlier than 2022. Experience with previous reports under the Framework Convention shows that, because of the normal lags in preparing in-ventories (and other required items, likely to be agreed) these reports cannot be expected until many months after the close of the report year, perhaps some time in
rePOrT 308 MIT JOINT PrOGraM ON THe SCIeNCe aND POLICY OF GLOBaL CHaNGe
6

2023 or 2024 for a first report target of 2020. Moreover, national reports on performance over the full course of the first NDC period would not be available, also indi-cated in Figure 1, until well over a year after its close in 2025.5 For the preponderance of pledges stated in terms of a 2030 goal, of course, the information on ultimate performance under the NDC will come even later.
2.2 Aggregate AchievementThe willingness of nations to take on burdens under the Paris pledge and review system will depend not only on information about individual performance but also on confidence that the effort is producing global results in line with achieving long-term goals. As the Agreement enters into the years of the first NDC the national inven-tories will provide some indication of the trajectory of national emissions. Unfortunately, as noted above, im-portant steps in regime implementation must be taken before this component of the transparency framework will be available to guide the construction of a global pic-ture. One such event is the 2018 facilitative dialog. It is to consider collective progress on emissions mitigation in the light of the Agreement’s temperature goals and to inform preparation of the next cycle of NDCs. Vari-ous sources of mitigation information will be available to the dialog. The IPCC is undertaking a Special Report describing emissions pathways to limit warming to 1.5°C and anticipated impacts. Other intergovernmental ef-forts, like the annual Gap Report prepared by the UN Environmental Program (UNEP, 2016) will include a summary of emissions projections under the first-cycle NDCs. As with past reports by these organizations, how-ever, these studies will be based mainly on analysis pub-lished by non-government groups. Also, many studies focus primarily on emissions outcomes without provid-ing insight into economic and social consequences that will be essential to judging comparability of effort. Unfortunately, as noted above there are significant ques-tions about how to interpret many of the NDCs for inclu-sion in forecasting models—issues that may be clarified in negotiations by the APA under its Agenda Item 3, but in any event not before 2018. When these differences in inter-pretation and baseline projections are input to forecasting models of differing structure and parameter assumptions, the result is a wide range of estimates of national and ag-gregate achievement under the initial NDCs (e.g., UNEP, 2016; Levin and Fransen, 2015). Several aspects of these analyses contribute to variation in results, for example: Base year data. Carefully prepared, commonly accepted, historical data is available on fossil and industrial CO2
5 These lags do not consider the additional time required for the other two stages in the transparency framework: technical expert review and facilitative, multilateral consideration of progress.
emissions. There is greater uncertainty about human emis-sions of methane and the other non-CO2 greenhouse gases, but differences in assumptions likely yield only a small dif-ference among studies in total CO2-equivalent emissions. The main problem is land-use emissions of CO2, where es-timates differ substantially (IPCC, 2014, Chapter 11). Economic and Emissions Baselines and Unbounded Pledg-es. Estimates of emissions of nations pledging a reduc-tion below a projected emissions path, or in emissions intensity, differ in their assumptions about population, economic growth, and associated energy use and green-house emissions. In the later years—for national NDCs, and especially for consideration of progress to long-term goals—projections will also be sensitive to differing as-sumptions regarding costs and performance of available technologies. Until the reporting guidelines require more information on the assumptions underlying the NDCs, these essential details will remain uncertain. In addition, many pledges do not set a clear bound on emissions. Contingent Pledges and Assumed Performance. For many developing countries, the NDC is conditioned, often in an unclear way, on the provision of financial assistance, with limited confidence that it will be forthcoming—this uncertainty exacerbated by the lack of clarity, or com-plete absence of information, on financial commitments in the NDCs of developed nations. Also, for some coun-tries the expected performance must be conditioned on uncertain domestic circumstances (e.g., the overall set of climate policies of the new US administrations).6 In general, estimates by government agencies and interna-tional groups (e.g., the UN Environment Program and International Energy Agency) are constrained to take the NDCs at face value, even if the NDC is lacking in specific policies to achieve the pledge.Macroeconomic and Trade Effects. Analysis of most pledges—other than those of developed countries—are based on projections of national emissions (for pledges of reduction below BAU) or GDP (for pledges of cuts in intensity). Results differ depending on whether these projections account for the economic effects of a nation’s own NDC and those of other parties. Emissions out-comes cannot be established based on pledges or policies that deal with only a part of the economy. Economic in-teractions among domestic sectors and between nations are ubiquitous. Consequently, going forward, national and global outcomes will require taking account of the full domestic and international response to the entire portfolio of NDCs, as well as other likely developments (e.g., with respect to availability and performance of fu-ture technologies). As illustrated in Section 2.3, the effects
6 Several judgments of this type underlie the NDC estimates in Appendix B.
MIT JOINT PROGRaM ON THe SCIeNCe aND POLICY OF GLOBaL CHaNGe RePORT 308
7
through trade of the actions of others can have a substan-tial effect on a nation’s economy. For most nations, these influences lead to a reduction in economic activity below the assumed BAU level, but in some cases, trade effects dominate and economic activity increases. Most analy-ses of aggregate achievement under the Paris pledges are based on partial equilibrium studies, nation by nation, and ignore the macroeconomic effects. Others, however, may attempt to account for them, for example, in project-ing emissions reduction under an intensity target, which could lead to inconsistency among the study definitions. Transparency in studies of the expected aggregate per-formance of the NDCs, and of pledge cycles to come, will be increased if parties to the Agreement establish clear requirements for the information and assumptions that should be contained in national NDCs. Even with greater clarity in the NDCs themselves, however, users trying to understand the NDCs and their effect on glob-al emissions will be aided if groups performing analyses can agree on assumptions about these inputs where rea-sonable, and provide clear standards for documentation when common assumptions may lead to the loss of valu-able information. Furthermore, as suggested in Section 1.3, results from IAM studies and other analyses can provide important insight to negotiators and others on relevant guidelines for accompanying information to de-scribe NDCs, and on metrics to measure progress.
2.3 Comparability and Relative EffortMeasures of national effort and comparability of effort among nations are not part of the transparency framework established in Article 13 of the Paris Agreement. Nonethe-less, these will be critical to inform national decisions re-garding their willingness to take current NDCs seriously, especially those of key nations, and to pursue additional effort in subsequent cycles. APA Agenda Item 6, which concerns negotiation of plans for the Global Stocktakes (to begin in 2023), does not include consideration of mea-sures of relative effort. Non-state actors are, however, de-vising indicators to inform the deliberations, e.g., Carbon Action Tracker (2016) is assigning grades for the ambi-tion of different parities. Even closer at hand is the 2018 facilitative dialog, plans for which are not yet among the APA agenda items. Because of apparent sensitivities, the presidencies of COP 22 and COP 23 have been tasked to undertake consultation on the way forward, with results to be presented for consideration at COP 23 in 2017. In the interim, studies by unofficial non-governmental analysis groups, likely showing a variety of pictures of effort levels, will undoubtedly influence that discussion as well. Aldy and Pizer (2015) lay out desired features of met-rics of national effort that will serve the dual function of revealing a nation’s effort and providing a basis for
international comparison: they should be comprehen-sive (covering a nation’s overall effort), measurable and replicable, and universally applicable to all countries. No one measure meets all these criteria; clearly a portfolio of measures will be needed. Even beyond the difficulties created by poor definition of the NDCs puzzles arise in constructing these analyses. Applying the MIT EPPA model, we illustrate these difficulties and highlight the likely disagreements in interpretation of the numbers.7
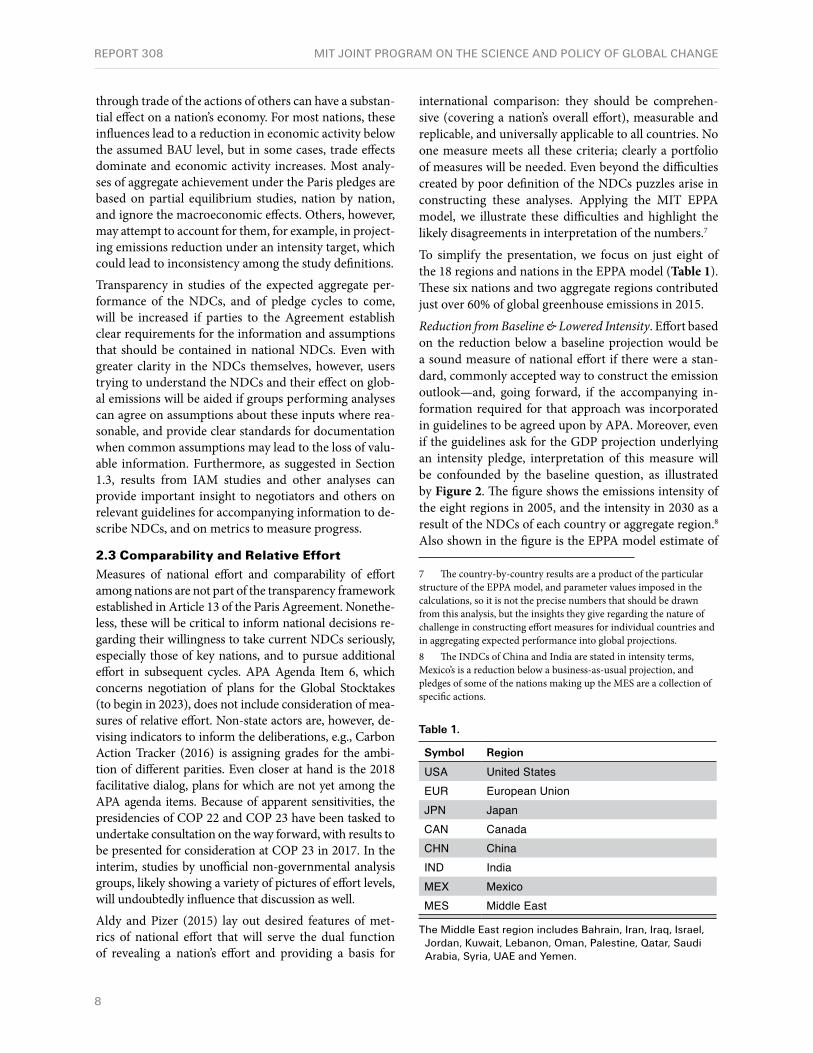
To simplify the presentation, we focus on just eight of the 18 regions and nations in the EPPA model (Table 1). These six nations and two aggregate regions contributed just over 60% of global greenhouse emissions in 2015.
Reduction from Baseline & Lowered Intensity. Effort based on the reduction below a baseline projection would be a sound measure of national effort if there were a stan-dard, commonly accepted way to construct the emission outlook—and, going forward, if the accompanying in-formation required for that approach was incorporated in guidelines to be agreed upon by APA. Moreover, even if the guidelines ask for the GDP projection underlying an intensity pledge, interpretation of this measure will be confounded by the baseline question, as illustrated by Figure 2. The figure shows the emissions intensity of the eight regions in 2005, and the intensity in 2030 as a result of the NDCs of each country or aggregate region.8 Also shown in the figure is the EPPA model estimate of
7 The country-by-country results are a product of the particular structure of the EPPA model, and parameter values imposed in the calculations, so it is not the precise numbers that should be drawn from this analysis, but the insights they give regarding the nature of challenge in constructing effort measures for individual countries and in aggregating expected performance into global projections.8 The INDCs of China and India are stated in intensity terms, Mexico’s is a reduction below a business-as-usual projection, and pledges of some of the nations making up the MES are a collection of specific actions.
Table 1.
Symbol Region
USA United StatesEUR European UnionJPN JapanCAN CanadaCHN ChinaIND IndiaMEX MexicoMES Middle East
The Middle east region includes Bahrain, Iran, Iraq, Israel, Jordan, Kuwait, Lebanon, Oman, Palestine, Qatar, Saudi arabia, Syria, uae and Yemen.
rePOrT 308 MIT JOINT PrOGraM ON THe SCIeNCe aND POLICY OF GLOBaL CHaNGe
8

the emissions intensity of each region under the baseline (No NDCs) projection in Figure 1. Emissions intensity is falling even with no mitigation effort because of the continuation of a long-established pattern of greater effi-ciency of energy and emissions use with time, technolo-gy change and economic growth.This natural pattern of intensity change, even without cli-mate policy, raises the question of what level of intensity improvement is appropriate as a measure of individual effort for international comparisons. Is it the achieved (or projected) level, or the change net of achievement that would have come in any case? The latter number seems more relevant, but in any case a clear comparison requires modeling assumptions about baseline econom-ic growth and other characteristics of the economy (e.g., rates of technology change and efficiency improvement) that are consistent across regions.Emissions Price and Welfare Cost. A logical measure of a nation’s mitigation effort is the economic burden im-posed on its citizens, stated as GDP loss or a reduction in some more direct measure of welfare such as equivalent
variation (a measure of willingness to pay to avoid the change) or reduction in personal consumption. In most examples of such estimates an economic model is used to compute the welfare loss assuming the pledged reduc-tion is achieved by applying a national price on emissions (e.g., Aldy et al., 2016). Figure 3 shows the result of such a calculation using the EPPA model. The left-hand panel presents the emissions price in 2030, and the right-hand panel show the associated welfare loss, measured as the percentage reduction in consumption. (Note that, for clarity, MEX and MES with higher costs are plotted at a different scale. Also, Japan’s cost is effectively zero.)
The first thing to notice is that emissions price is not a good measure of conventional notions of economic bur-den. Countries have very different economic structures, and sensitivity of domestic energy prices to the emissions price. Also evident are the effects of international trade on the relative percentage welfare burdens of the NDCs. The U.S., with a relatively high price, experiences near zero welfare loss; India with in effect a zero price sees a welfare benefit; and the MES sees the highest welfare
Figure 2. emissions Intensity, 2005 and 2030, with and without NDCs
Figure 3. CO2-e Price & Welfare Loss to Achieve NDCs, 2030
MIT JOINT PrOGraM ON THe SCIeNCe aND POLICY OF GLOBaL CHaNGe rePOrT 308
9

loss of all. These seemingly odd outcomes are the result of the effect of a global mitigation effort on prices and trade volumes of many goods but, most importantly, of fossil fuels. Insight into the welfare result in Figure 3 can be gained by just noticing which regions are importers of oil, gas and coal and which are exporters.This trade effect can be further illustrated by following experiment: what would be the welfare cost if a country were acting alone, meeting its NDC while the rest of the regions did nothing? Figure 4 shows such an example for 2030 using the United States (a net energy importer), Mexico (with substantial energy exports) and the Mid-dle East (where energy exports are a dominant portion of GDP). Acting alone, the U.S. would experience a loss of roughly ½%, MEX about 1½% and MES ¾%. When the rest of the nations take action, the U.S. benefits from the effect on its terms of trade, for a welfare gain of about ¼%, while the nations of the Middle East get hammered. The welfare loss in Mexico rises to over 2%, and in the Middle East to almost 5%. These results raise a caution and a question. First, care should be taken with partial equilibrium estimates of the cost of NDCs under the Paris Agreement—that is, those based on individual country studies that necessarily ig-nore trade effects. For some countries they do not cor-rectly estimate the cost.9 And second, which is the correct cost-based measure of mitigation effort, the partial equi-librium measure or the actual impact within the global trade system? At the very least, studies of relative effort should be transparent as to which measure is being used.Price Instrument vs. Policies and Measures. An econom-ic model study that assumes a price-based implementa-tion of the NDCs does not accurately represent welfare cost for most countries. A uniform national price is an analysis-facilitating fiction for economic model studies that does not reflect the actions most nations are actu-ally taking to reduce greenhouse emissions. Almost all are seeking to meet their NDC reductions with various combinations of policies and measures (PAMs). We il-lustrate the difference between the two approaches with our estimate of policies and measures being adopted by the eight regions and nations shown above. Many are imposing restrictions on coal construction and retiring existing plants, imposing wind and solar mandates on electric utilities, tightening mileage standards on per-sonal automobiles, and imposing emissions limits on trucks and other commercial transport. We also observe that they are implementing efficiency standards on var-
9 Universal analysis of this phenomenon is necessarily limited by the fact that general equilibrium economic models that can explore trade effects are limited in their level of regional disaggregation, so the trade impacts on many countries can only be investigated by their position in a group, as with the Middle East in Figure 4.
ious products and industrial processes. To illustrate the welfare effects of PAMs vs a universal emissions price we impose just the policies and measures being applied in electric generation and transport (details are provided in Appendix B). Assuming these policies and measures are put into place, Figure 5 shows the resulting national welfare cost for 2030, compared with the cost under a uniform emissions price, repeated from Figure 4.10
Not surprisingly, the estimated level of effort is higher with the less-efficient policies and measures, as are being imple-mented in most nations. However, detailed information on country PAMs is not available, and some parties may not have even yet chosen them. Other PAMs descriptions will yield somewhat different results. There is a long history of studies showing examples of the much higher cost of meet-ing a target this way rather than by a uniform price (e.g., Goldberg, 1998; Rausch and Karplus, 2014). Increased cost will remain, even with better PAMs information.
Though the policies and measures actually being ap-plied are the correct basis for constructing this measure of national effort, many of the economic models ap-plied to analysis of the cost of mitigation lack the inter-nal structure to represent even a rough approximation of actual PAMs, and no current model is able to study them in their great variation and detail. Also, there is an economist’s argument that the effort measure should not reward a nation for pursuing the wrong policy.11 So
10 Another question, not dealt with here, is whether either measure of climate-related burden should be corrected for non-climate co-ben-efits. For example, air pollution control alone can provide a substantial justification for China’s NDC (Karplus, 2015; Li et al., 2016).11 Indeed, one constructive function of studies assuming a uniform national emissions price, if compared with analysis of actual policies, is to show how great a welfare gain is to be had with an efficient miti-gation policy.
Figure 4. Trade effects on Welfare, 2030
rePOrT 308 MIT JOINT PrOGraM ON THe SCIeNCe aND POLICY OF GLOBaL CHaNGe
10

analysis using both policy assumptions—uniform prices and PAMs—will be found in studies of effort implied by the NDCs. At the very least, transparency should require clear documentation of the procedures followed.
3. Enhancing the Transparency Framework
The preceding discussion suggests ways that analyses of the NDCs by groups besides formal national and inter-governmental organizations will be important to inform transparency, particularly in the early years of the Paris Agreement. These groups are likely to continue to pro-duce and publish analyses of individual and aggregate achievement, and estimates of various measures of the county effort. Regrettably, there are likely to be confusing differences among studies for reasons suggested above: differing projections of BAU emissions and GDP projec-tions, different assumptions about contingent pledges and assumed performance, alternative concepts of effort or welfare cost, and calculations applying different types of economic models.12 Unfortunately, these differences are generally not well documented, and there currently is no organization that can impose order on the studies where it is appropriate, and document the differences where it is not.13 This lack of coherence and documentation limits the transparency that would aid the Paris launch.
12 Differences in model structure are another source of variation in estimates of mitigation cost. For example, models with less sectoral detail, or simpler representation of capital vintaging tend to show lower costs (Chen et al., 2016b)13 Indeed, the focus of many of these efforts is not on these first pledges, and the enhancement of transparency but on the emissions “gap” to be closed to remain consistent with a 2°C temperature goal (e.g., Rogelj et al., 2016). In some cases, these provide information only on emissions, with little or no information on economic and so-cial consequences that will be needed to judge comparability of effort.
It is unlikely that national and intergovernmental or-ganizations in the climate domain can adequately meet this institutional need, and certainly not in time to be relevant to the quick pace of events shown in Figure 1. The Intergovernmental Panel on Climate Change (IPCC) has played a central role in setting formal guidelines for emissions inventories under the UNFCCC. An extension of this work into the wider transparency domain is a possible route to coherence, and likely essential to advise and provide guidelines for the formal process. The IPCC would face several barriers with a topic like this, how-ever. Largely limited to summarizing the peer-reviewed literature, the IPCC is not organized to recommend solu-tions to the types of technical economic questions out-lined above. Even if it were, the timing is wrong as the IPCC’s process involves long lags in initial organization, deadlines for consideration of literature, and extensive review procedures. Additionally, IPCC is already over-loaded with studies to be launched (and some complet-ed) in the next decade.14
Alternatively, a variety of non-governmental organiza-tions and institutions could provide useful analyses that contribute to, inform and improve the overall transparen-cy process. Though our focus here is on the Paris Agree-ment, there is a wide range of governmental organizations involved in the climate issue (Keohane and Victor, 2010). It has been observed that a wide range of functions, in-cluding governance functions, are being performed by informal, non-governmental institutions. Most of these
14 In addition to the special report on the impacts of 1.5°C warming the IPCC is charged with two others: one on Climate Change, Desert-ification, Land Degradation, Sustainable Land Management, Food Security and Greenhouse Gas Fluxes in the Terrestrial Biosphere, another on Climate Change and Oceans and the Biosphere—all to be accomplished while producing the 6th Assessment Report, which is due ahead of the 2023 Stocktake.
Figure 5. Welfare Cost of NDCs: Price vs. Policies and Measures (PaMs), 2030
MIT JOINT PrOGraM ON THe SCIeNCe aND POLICY OF GLOBaL CHaNGe rePOrT 308
11

perform regulatory functions—what Abbott et al. (2016) call private transnational regulatory organizations, or what Green (2010) terms private entrepreneurial author-ity. These entities propagate standards for measurement and reporting and verification that have come to be ac-cepted by private, non-profit and governmental enti-ties—a useful example being the standards prepared by the World Resources Institute and the World Business Council for Sustainable Development for measuring and reporting greenhouse emissions15, or those developed and improved over time by a number of sectoral groups.
It is possible that existing or new private organizations will step up to recommend standards of practice for ex ante studies of the NDCs, for analyses of progress and trends in performance of actual NDCs, for comparison of relative effort, and overall aggregate accomplishments. Several existing organizations have the capacity and in-ternational reach to take on the task. For example, as cit-ed above, a number of NGOs are active in the domain of measurement, reporting, and verification with expe-rience in collection, reporting and review of domestic institutional and policy developments.16 However, many lack the internal modeling expertise—such as has charac-terized groups like the Stanford Energy Modeling Forum in managing studies by diverse, international, economic modeling groups (e.g., Clarke et al., 2009) or working groups of the Integrated Assessment Modeling Consor-tium17—to organize such an effort. To improve analyses of the Paris results these resources need to interact and, where appropriate, recommend common approaches for
15 http://www.ghgprotocol.org16 Examples include the International Standards Organization and its ISO 16064, the World Resources Institute (Singh and Vieweg, 2015) and IDDRI (Deprez et al., 2015).17 http://www.globalchange.edu/iamc
their own analyses. And, while one should not assume that it is even possible to design an ideal transparency system or economic model of it, such informal, unoffi-cial approaches and providers can help point the way to continuous ongoing improvement in the formal process under the Paris Agreement.
The success of a system of pledge-and-review will be strongly influenced by the credibility of the transparency process. Later in the cycle of NDC updates ex post re-ports will provide a clear basis to judge actual progress. As can be seen in the crowded set of events in Figure 1, however, time is short to evolve a widely accepted set of standards to help impose some order on the ex ante studies, and analyses of early progress and trends, that will inform the initial stages of the Paris launch. These studies and analyses will be from many sources. To the extent they are inconsistent and confusing, or colored by advocacy, it will be useful to clarify differences that result from varying assumptions and methods, and whether they are appropriate. This will help to assure credibility to support domestic decisions about current effort and more ambitious future pledges.
Acknowledgments We gratefully acknowledge the financial support for this work provided by the MIT Joint Program on the Science and Policy of Global Change through a consortium of industrial and foundation sponsors and Federal awards, including the U.S. Department of Energy, Office of Science under DE-FG02-94ER61937 and the U.S. Environmental Protection Agency under XA-83600001-1. For a complete list of sponsors and the U.S. government funding sources, please visit http://globalchange.mit.edu/sponsors/all.
We owe thanks for comments on earlier drafts to Michael Davidson, Denny Ellerman, Billy Pizer, Richard Richels and David Victor, and to discussants at a Climate Change Workshop of the Social Science Research Council’s Anxieties of Democracy Program. They bear no responsibility for the ultimate version of our argument.
4. ReferencesAbbott, K, J. Green and R. Keohane, 2016. Organizational Ecology
and Institutional Change in Global Governance, International Organization 70(2): 247–277.
Aldy, J. and W. Pizer, 2016. Alternative Metrics for Comparing Domestic Climate Change Mitigation Efforts and Emerging International Climate Policy Architecture, Review of Environmental Economics and Policy 10-1: 3–24.
Aldy, J., W. Pizer, M. Massimo, L. Reis, K. Akimoto, G. Blanford, C. Carraro, L. Clarke, J. Edmonds, G. Iyer, H., McLeon, R. Richels, S. Rose and F. Sano, 2016. Economic tools to promote transparency and comparability in the Paris Agreement, Nature Climate Change, 6, 1000–1004. (doi:10.101038/NCLIMATE2937)
APA [Ad Hoc Working Group on the Paris Agreement], 2016a. Items 3 to 8 of the Agenda: Draft conclusions proposed by the Co-Chairs, Framework Convention on Climate Change, FCCC/APA/2016/L.4.
APA [Ad Hoc Working Group on the Paris Agreement], 2016b. Parties’ views regarding modalities, procedures and guidelines for the transparency framework for action and support referred to in Article 13 of the Paris Agreement, FCCC/APA/2016/INF.3.
Barrett, S. and A. Dannenberg, 2016. An experimental investigation into ‘pledge and review’ in climate negotiations, Climatic Change 138: 339–351.
Barua, P., T. Fransen and D. Wood, 2014. Policy Implementation Tracking Framework, World Resources Institute Working Paper. (http://www.wri.org/sites/default/files/climate_tracking_framework_working.pdf)
Bodansky, D., 2016. The Paris Climate Change Agreement: A New Hope? American Journal of International Law, 110(2): 288–319.
Carbon Action Tracker, 2016. Tracking (I)NDCs: Assessment of mitigation contributions to the Paris Agreement. (http://climateactiontracker.org/indcs.html)
rePOrT 308 MIT JOINT PrOGraM ON THe SCIeNCe aND POLICY OF GLOBaL CHaNGe
12

Chen, Y.-H., Q. Ejaz, X. Gao, J. Huang, J. Morris, E. Monier, S. Patsev, J. Reilly, A. Schlosser, J. Scott and A. Sokolov, 2016a. Food, Water, Energy and Climate Outlook: Perspectives From 2016, MIT Joint Program on the Science and Policy of Global Change. (http://globalchange.mit.edu/Outlook2016)
Chen, Y.-H., M. Babiker, S. Paltsev and J. Reilly, 2016b. Costs of Climate Mitigation Policies, MIT Joint Program on the Science and Policy of Global Change Report 292, March.
Clarke, L., J. Edmonds, V. Krey, R. Richels, S. Rose and M. Tavoni, 2009. International climate policy architectures: Overview of the EMF 22 International Scenarios, Energy Economics 31: 564–581
Climate Action Tracker, 2015. Tracking INDCs. (http://climateactiontracker.org/indcs.html)
Climate Interactive, 2016. Tools for a Thriving Future. (https://www.climateinteractive.org/)
Deprez. A., M. Colombier and T. Spencer, 2015. Transparency and the Paris Agreement: driving ambitious action in the new climate regime, Institut du development durable e des relations internationals (Sciences Po), May. (http://www.iddri.org/Publications/Collections/Idees-pour-le-debat/WP0315.pdf)
EC-JRC (European Commission Joint Research Center), 2015. Analysis of scenarios integrating the INDCs (EC JRC IPTS/J1), October. (http://www.indcforum.org/wp-content/uploads/2015/10/Analysis-of-scenarios-integrating-the-INDCs_201510_JRC97845.pdf)
European Union, 2016. Modalities, procedures and guidelines for the transparency framework for action and support referred to in Article 13 of the Paris Agreement, Submission by the Slovak Republic and the European Commission on Behalf of the European Union and Its Member States, to the Ad Hoc Working Group on the Paris Agreement, FCCC/APA/2016/INF.3/AD.1.
Flannery, B., 2015. The State of Climate Negotiations, in C. Barrett, C. Carraro and J. de Melo (eds.) Towards a Workable and Effective Climate Regime. (http://voxeu.org/sites/default/files/file/flannery.pdf)
Goldberg, P., 1998. The effects of the corporate average fuel economy standards in the US, The Journal of Industrial Economics 46(1): 1–33.
Green, J., 2010. Private Standards in the Climate Regime: The Greenhouse Gas Protocol, Business and Politics 12(3): 1–37.
Gupta, A., M. Vijge, E. Turnhout and T. Pistorius, 2014. Making REDD+ Transparent: The Politics of Measuring, Reporting, and Verification Systems, in A. Gupta and M. Mason (eds.), Transparency in Global Environmental Governance: Critical Perspectives, MIT Press, Cambridge, MA.
International Energy Agency, 2015. Energy and Climate Change: World Energy Outlook Special Briefing for COP21. (https://www.iea.org/media/news/WEO_INDC_Paper_Final_WEB.PDF)
IPCC, 2014. Climate Change 2014: Mitigation of Climate Change, Working Group III: Mitigation of Climate Change.
Jacoby, H. and Y.-H. Chen, 2014. Expectations for a New Climate Agreement, MIT Joint Program on the Science and Policy of Global Change Report 264, August.
Jacoby, H. and Y.-H. Chen, 2015. Launching a New Climate Regime, MIT Joint Program on the Science and Policy of Global Change Report 286, November.
Karplus, V., 2015. Double Impact: Why China Needs Coordinated Air Quality and Climate Strategies. Paulson Papers on Energy and Environment (http://globalchange.mit.edu/files/document/MITJPSPGC_Reprint_15-1.pdf)
Keohane, R., and D. Victor, 2010. The Regime Complex for Climate Change, Harvard Project on International Climate Agreements, Discussion Paper 10–33.
Keohane, R. and D. Victor, 2016. Cooperation and discord in global climate policy, Nature Climate Change, on line 9 May. (doi:10.101038/NCLIMATE2937).
Le Treut, H. et al., 2015. Groupe Interdisciplinaire sur les Contributions Nationales: Working Paper – Preliminary Version, IPSL Climate Modelling Center, Scientific Note No. 32, November. (http://cmc.ipsl.fr/images/publications/scientific_notes/GICN_working_paper2.pdf)
Levin, K. and T. Fransen, 2015. Why Are INDC Studies Reaching Different Temperature Estimates? World Resources Institute (http://www.wri.org/print/43483).
Li, C.-T., M. Li, D. Zhang, K. Mulvaney, N. Selin and V. Karplus, 2016. Air Quality Co-Benefits of Climate Policy in China, PNAS, submitted.
Niederberger, A. and M. Kimble, 2011. MRV under the UN climate regime: paper tiger or catalyst of continual improvement?, Greenhouse Gas Measurment and Management 1:47–54. (http://dx.doi.org/10.3763/ghgmm.2010.0009)
Nordhaus, W., 2016. Projections and Uncertainties about Climate Change in an Era of Minimial Climate Policies, Cowles Foundation Discussion Paper No. 2057. (https://papers.ssrn.com/sol3/papers.cfm?abstract_id=2881947)
Rausch, S., and V. Karplus, 2014. Markets versus Regulation: The Efficiency and Distributinal Impacts of U.S. Climate Policy Proposals, The Energy Journal 35(S11): 199–227.
Rogelj, J., M. den Elzen, N. Höhne, T. Fransen, H. Fekete, H. Winkler, R. Schaeffer, F. Sha, K. Riahi and M. Meinshausen, 2016. Paris Agreement climate proposals need a boost to keep warming well below 2°C, Nature 354: 631–639.
Singh, N., J. Finnegan and K. Levin, 2016. MRV 101: Understanding Measurement, Reporting, and Verification of Climate Change Mitigation, World Resources Institute Working Paper, August. (http://www.wri.org/publication/mrv-101-understanding-measurement-reporting-and-verification-climate-change-mitigation)
Singh, N, and M. Vieweg, 2015. Monitoring Implementation and Effects of GHG Mitigation Policies: Steps to Develop Performance Indicators, World Resources Institute Working Paper, December. (http://www.wri.org/sites/default/files/Monitoring_Implementation_and_Effects_of_GHG_Mitigation_Policies.pdf)
UNEP (United Nations Environment Program), 2016.The Emissions Gap Report 2016 : A UNEP Synthesis Report, ISBN: 978-92-807-3491-5.
Weiner, J., 2015. Towards an effective system of monitoring, reporting, and verification, in Barrett, Carraro and de Melo (eds), Toward a Workable and Effective Climate Regime, a VoxEU.org eBook, CEPR Press, London.
MIT JOINT PROGRaM ON THe SCIeNCe aND POLICY OF GLOBaL CHaNGe RePORT 308
13

APPENDIX A. The MIT EPPA ModelThe MIT Economic Projection and Policy Analysis (EPPA) model is a multi-region, multi-sector recur-sive–dynamic computable general equilibrium (CGE) model of the world economy (Chen et al., 2016). The recursive formulation means that production, consump-tion, savings and investment are determined by current prices. The model is comprised of eighteen nations and multination regions shown in Table A1, and it includes the effects of international trade among the regions in both energy and non-energy goods and services.
EPPA is built on the Global Trade Analysis Project (GTAP) data set of world economic activity, augmented by data on greenhouse gases, aerosols and other relevant emissions, and details of selected economic sectors. The
model is used to project economic variables (e.g., gross domestic product, energy use, sectoral output, consump-tion), and emissions of greenhouse gases (CO2, CH4, N2O, HFCs, PFCs and SF6) and other air pollutants (CO, VOC, NOx, SO2, NH3, black carbon and organic carbon) from the supply and combustion of carbon-based fuels, industrial processes, waste handling and agricultural activities.
As summarized in Table A2, the model identifies a set of energy and non-energy sectors that produce goods and services and their inter-sector trade, and the sectors that consume final goods and services (not shown). Technol-ogy options in energy production and conversion are represented in detail, as also shown in the table.
Table A1. The eighteen ePPa regions.
Developed Other G20 Aggregations
ANZ Australia-New Zealand BRA Brazil AFR Africa
CAN Canada CHN China ASI East Asia
EUR E.U.+ IND India ROE E. Europe & Central Asia
JPN Japan IDZ Indonesia LAM Latin America
USA United States MEX Mexico MES Middle East
RUS Russia REA Rest of Asia
KOR South Korea
Table A2. Sectors and energy Technologies in the ePPa Model.
Sectors Technology Options
Agriculture - Crops First Generation BiofuelsAgriculture - Livestock Second Generation BiofuelsAgriculture - Forestry Oil ShaleFood Products Synthetic Gas from CoalCoal HydrogenCrude Oil Advanced NuclearRefined Oil IGCC with CCSNatural Gas NGCCElectricity NGCC with CCSEnergy-Intensive Industries WindOther Industries Bio-electricityOwnership of Dwellings Wind with Bio-electricityServices Wind with Gas-fired PowerCommercial Transport Solar Generation
Personal transportation is broken out within household final demand and the model considers vintages of internal combus-tion engine (ICe) vehicles and the change in efficiency standards over time. The one low-emission alternative to the ICe is an electric vehicle.
rePOrT 308 MIT JOINT PrOGraM ON THe SCIeNCe aND POLICY OF GLOBaL CHaNGe
14

APPENDIX B. NDCs and Policies and Measures
B.1 First NDCsThe 2030 emissions underlying the projection of the first NDCs (see Figure 1) are based on INDCs submitted to the Framework Convention website (UNFCCC, 2016) and summarized in Table B1. Adjustment of national and regional emissions from the No-NDC projection be-gin in many countries in 2020, and behavior under the first NDCs is extended to 2040. The first NDC projec-
tion does include additional contributions to emissions reduction that may be pledged in subsequent rounds of the Paris Agreement’s 5-year cycles.
B.2 Expected Policies and MeasuresMany countries are applying emissions prices to some regions or sectors as part of their mitigation effort, but none applies a uniform emissions price across all sources
Table B1. INDCs and assumed Performance in 2030
Region
INDC1
CO2-e 2005 Mt or t/$1000 Other Features
Expected CO2-e2Type/Base Reduction by year
USA ABS 2005 26–28% by 2025 6220 25%3
EUR ABS 1990 40% by 2030 5370 (1990) 27% renewables in electricity by 2040 40%
CAN ABS 2005 30% by 2030 789 Mainly land use & forestry with 18% reduction in industrial 25%
JPN ABS 2005 25% by 2030 1260 2.5% LUCF. Nuclear = 20–22% of electric, solar/wind = 9%, also biomass. Assumes ITMOs. Target = 1.04b ton CO2-e
20%4
ANZ ABS 2005 26–28% by 2030 596 20%5
BRA ABS 2005 37% by 2025 2.19 45% of primary energy renewable by 2030; LUCF down 41% 2005–12 35%
CHN CO2 INT 2005 60–65% by 2030 2.55 INDC is CO2 only, discount to account for other gases.
CO2 peak by 2030, Non-fossil 20% of primary energy 55%
KOR BAU 37% by 2030 NA PAMs on renewables and autos (no detail) 25%
IND INT 2005 30–36% by 2030 2.29 2.5-3.0b tons CO2 from forests. 40% non-fossil electric. Assumes un-specified financial assistance 30%
IDZ BAU 29% by 2030 NA Role of LUCF (63% of current emissions) not clear. Industrial emissions increase 30%
MEX BAU 25% by 2030 NA 22% of CO2, 51% of BC, Intensity reduction of 40% 2013–2030 25%
RUS ABS 1990 25–30% by 2030 3530 Reduction subject to “maximum accounting” from forests 32%
ASI BAU NA Malaysia 45% INT, Philippines 70% BAU, Thailand 20% BAU, Singapore ABS 36%. 10%
AFR BAU NA Nigeria 45% BAU, South Africa 20-80% increase (ABS), limited information on other regions. 5%
MES BAU NA Saudi & Kuwait actions only, Iran 15% BAU, UAE non-GHG actions 10%
LAM BAU NA Argentina 15% BAU, Chile 35% INT, Peru 20% BAU, Colombia 20% BAU 10%
REA BAU NABangladesh 5% BAU, Pakistan reduction after unspecified peak, Sri Lanka 7% BAU, Myanmar & Nepal miscellaneous actions
10%
ROE BAU NA Azerbaijan 13% BAU, Kazakhstan 15% 1990, Turkey 21% BAU, Ukraine 40% BAU 10%
1 Sources include uNFCCC (2016) and CaT (2016).
2 Percentage applies to the particular target in column 2.
3 Based on assessments by Greenblatt and Wei (2016), Larsen et al. (2016) and Vine (2016).
4 Discounts ITMOs and nuclear expectations.
5 expectation discounted by political reversals in australia.
MIT JOINT PrOGraM ON THe SCIeNCe aND POLICY OF GLOBaL CHaNGe rePOrT 308
15

as assumed in the estimate of welfare cost in Figure 4. Examples of the partial use of a price instrument include the U.S., where emission prices cover some sources in California and the RGGI states; the EU, where the ETS convers electric power and certain industry sources; and Canada, where some provinces have applied emissions taxes. However, even where emissions prices are being implemented, these countries also continue to apply reg-ulatory and subsidy policies, driving up the overall wel-fare cost of the mitigation effort. To get a preliminary estimate of the true cost of NDCs in this circumstance we assume an emissions price remains in effect, but impose the expected policies and measures (PAMs)—many of which have marginal costs higher than the emissions price that will meet the NDC without them. The focus is on measures in the largest emitting sectors: electric power and transportation. The PAMs satisfy some of each national pledge, but the overall NDC reduction is left in place as a constraint, to insure that the original pledge is always met, which yields an implied residual national emissions price (now much reduced). Estimation of the full welfare cost of the current predom-inance of PAMs in emissions mitigation would impose the prices actually in place country by country, and (as is actually the case in most places) impose other measures one on top of another until the full targeted reduction is met. This procedure, which is beyond our current mod-eling capability, would yield a higher welfare burden than the simpler calculation applied here.
B.2.1 Electric Power
The electric power sector is the largest single source of greenhouse gas emissions globally, as well as in most in-dividual countries. Many forms of policy and different control measures are applied to this industry, but the most significant in terms of emissions reduction and cost are driving out coal and promoting renewables.
Coal-Fired Generation. Many nations are imposing pol-icies that include the closing of existing coal-fired gen-eration. Using a data set that includes all coal-fired units (Platts, 2016) for USA, CAN, EUR, JPN and MEX, it is assumed that no new units will be added after 2015 in these countries, and that existing capacity will be retired at age 60. The resulting reduction 2025 to 2030 is shown in Table B2; results indicate the advanced age of the coal fleet, particularly in the USA and EUR. China pledges to cap coal use “around” 2030. No PAMs directed at coal use in electric generation are assumed in IND and MES.Renewable Energy Policies. Many countries are promot-ing solar and wind generation, by renewable energy mandates and various forms of subsidy, and many parties state these measures in their INDCs. Renewable sources of generation that are receiving policy attention include hydroelectric sources, biofuels and tidal and wave power, but the main focus is on solar and wind. We apply infor-mation about these plans as submitted to the Conven-tion website (UNFCCC, 2016), and summaries by others (Chatterton and Du Reitz, 2015), to estimate the scale of these policies and measures for the eight subject re-gions. Their contribution to total generation is plotted in Figure B1. The projection takes account only of expected installations to 2030 on the assumption that any further wind and solar expansion would be achieved only under an enhanced effort in the second and subsequent NDCs.
B.2.2 Transport
Light-Duty Vehicles. PAMs in the light duty vehicle sector are generally applied in the form of efficiency standards for new vehicle sales. Assumed PAMs, stated as a re-duction (in gasoline-equivalent terms) in l/km from the 2015 level, are shown in Figure B1. The estimates draw on summaries by ICCT (2015a, 2015b) and assume 75% passenger cars and 25% light trucks (SUVs). Based on analysis by Heywood and MacKensie (2015) national ef-ficiency targets for 2022 and 2025 are assumed to be met
Table B2. PaMs applied to Coal-Fired electricity
Country or Region
Capacity Reduction in 2030 (% of 2015)
Other Features
USA 40CAN 25
EUR 35JPN 10CHN NA Cap 2035 & 2040 at
the 2030 levelIND NA No coal constraintMEX 30MES NA No coal constraint
Figure B1. Minimum Levels of Wind and Solar Generation
rePOrT 308 MIT JOINT PrOGraM ON THe SCIeNCe aND POLICY OF GLOBaL CHaNGe
16

only by 2030, to account for the difference between mea-surement procedures for new vehicles and on-the-road performance. No further tightening of these standards after 2030, though additional improvement may accom-pany the second and subsequent NDCs.Commercial Transport. Most countries impose efficiency standards on heavy-duty trucks, and on other sectors of commercial transport. Trucks dominate energy use and emissions in commercial transport, representing toughly ⅔ of the total. Here, the U.S. truck standards are used
as the basis for PAMs in this sector (ICCT, 2016). Both Phase 1 and Phase 2 standards are imposed in USA, CAN, EUR, JPN and CHN, but only the Phase 1 stan-dards are assumed to be applied in IND, MEX and MES (ICCT, 2016).It is assumed that reduction measures are taken as well in the ⅓ represented by air, rail and shipping, but that the reduction is only one-half of that achieved in trucking. The PAM is applied as a constraint on energy input to commercial transport (essentially refined oil).
Appendix B ReferencesCAT [Carbon Action Tracker], 2016. Climate Analytics, Ecofys & the
NewClimate Institute. http://climateactiontracker.org/Chatterton, R. and A. Du Reitz, 2015. Renewable Targets that
Bite? Comparing renewable energy targets with BNEF’s New Energy Outlook, Bloomberg New Energy Finance. https://data.bloomberglp.com/bnef/sites/4/2015/11/BNEF_RN_Renewables-targets-vs-NEO_2015-07-20_v3.pdf
Chen, Y.-H., S. Paltsev, J. Reilly, J. Morris and M. Babiker, 2015. The MIT EPPA6 Model: Economic Growth, Energy Use and Food Consumption. MIT Joint Program on the Science and Policy of Global Change Report 278, March.
Greenblatt, J., and M. Wei, 2016. Assessment of the climate commitments and additional mitigation policies of the United States, Nature Climate Change, on line 26 September.
Heywood. J and D. MacKensie (eds.), 2015. On the Road toward 2050: Potential for Substantial Reductions in Light-Duty Vehicle Energy Use and Greenhouse Emissions, Massachusetts Institute of Technology, Sloan Automotive Energy Laboratory, November. http://web.mit.edu/sloan-auto-lab/research/beforeh2/files/On-the-Road-toward-2050.pdf
ICCT [The International Council on Clean Transportation], 2015a. The State of Clean Transportation Policy: Light-Duty Vehicle Efficiency. http://www.theicct.org/sctp-ldv-e
ICCT [The International Council on Clean Transportation], 2015b. The State of Clean Transportation Policy: Heavy-Duty Vehicle Efficiency Standards. http://www.theicct.org/sctp-hdv-e
ICCT [The International Council on Clean Transportation], 2016. United States Efficiency and Greenhouse Gas Emissions Regulations for Model Year 2018–2027: Heavy-Duty Vehicles, Engines, and Trailers. http://www.theicct.org/sites/default/files/publications/US%20HDV%20Phase%202%20FRM_policy-update_08252016_vF.pdf
Karplus, V., P. Kishimoto and S. Paltsev, 2015. The Global Energy, CO2 Emissions, and Economic Impact of Vehicle Fuel Economy Standards, Journal of Transport Economics and Policy 49(4): 517–538.
Larsen, J., K. Larsen, W. Herndon and S. Monahan, 2016. Taking Stock: Progress Toward Meeting US Climate Goals. the Rhodium Group. http://bit.ly/2d3yJvj
Platts, 2016. UDI World Electric Power Plants Data Base (WEPP), Platts UDI Products Group, a division of McGraw Hill Financial.
Vine, D., 2016. US can reach its Paris Agreement goal. Center for Climate and Energy Solutions, 26 March. http://go.climate.com/2cWSZhs
UNFCCC, 2016. INDCs as communicated by parties. (http://www4.unfccc.int/Submissions/INDC/Submission Pages/submissions.aspx)
Figure B2. efficiency Standards for Light Duty Vehicles to Meet the First NDCs
Figure B3. reduction of energy use in Commercial Transport
MIT JOINT PrOGraM ON THe SCIeNCe aND POLICY OF GLOBaL CHaNGe rePOrT 308
17

Joint Program Report Series - Recent ArticlesFor limited quantities, Joint Program Reports are available free of charge. Contact the Joint Program Office to order.
Complete list: http://globalchange.mit.edu/publications
MIT Joint Program on the Science and Policy of Global Change
Massachusetts Institute of Technology 77 Massachusetts Ave., E19-411 Cambridge MA 02139-4307 (USA)
T (617) 253-7492 F (617) 253-9845 [email protected] http://globalchange.mit.edu/
308. Transparency in the Paris Agreement. Jacoby et al., Feb 2017
307. Economic Projection with Non-homothetic Preferences: The Performance and Application of a CDE Demand System. Chen, Dec 2016
306. A Drought Indicator based on Ecosystem Responses to Water Availability: The Normalized Ecosystem Drought Index. Chang et al., Nov 2016
305. Is Current Irrigation Sustainable in the United States? An Integrated Assessment of Climate Change Impact on Water Resources and Irrigated Crop Yields. Blanc et al., Nov 2016
304. The Impact of Oil Prices on Bioenergy, Emissions and Land Use. Winchester & Ledvina, Oct 2016
303. Scaling Compliance with Coverage? Firm-level Performance in China’s Industrial Energy Conservation Program. Karplus et al., Oct 2016
302. 21st Century Changes in U.S. Heavy Precipitation Frequency Based on Resolved Atmospheric Patterns. Gao et al., Oct 2016
301. Combining Price and Quantity Controls under Partitioned Environmental Regulation. Abrell & Rausch, Jul 2016
300. The Impact of Water Scarcity on Food, Bioenergy and Deforestation. Winchester et al., Jul 2016
299. The Impact of Coordinated Policies on Air Pollution Emissions from Road Transportation in China. Kishimoto et al., Jun 2016
298. Modeling Regional Carbon Dioxide Flux over California using the WRF-ACASA Coupled Model. Xu et al., Jun 2016
297. Electricity Investments under Technology Cost Uncertainty and Stochastic Technological Learning. Morris et al., May 2016
296. Statistical Emulators of Maize, Rice, Soybean and Wheat Yields from Global Gridded Crop Models. Blanc, May 2016
295. Are Land-use Emissions Scalable with Increasing Corn Ethanol Mandates in the United States? Ejaz et al., Apr 2016
294. The Future of Natural Gas in China: Effects of Pricing Reform and Climate Policy. Zhang & Paltsev, Mar 2016
293. Uncertainty in Future Agro-Climate Projections in the United States and Benefits of Greenhouse Gas Mitigation. Monier et al., Mar 2016
292. Costs of Climate Mitigation Policies. Chen et al., Mar 2016
291. Scenarios of Global Change: Integrated Assessment of Climate Impacts. Paltsev et al., Feb 2016
290. Modeling Uncertainty in Climate Change: A Multi-Model Comparison. Gillingham et al., Dec 2015
289. The Impact of Climate Policy on Carbon Capture and Storage Deployment in China. Zhang et al., Dec 2015
288. The Influence of Gas-to-Liquids and Natural Gas Production Technology Penetration on the Crude Oil-Natural Gas Price Relationship. Ramberg et al., Dec 2015
287. Impact of Canopy Representations on Regional Modeling of Evapotranspiration using the WRF-ACASA Coupled Model. Xu et al., Dec 2015
286. Launching a New Climate Regime. Jacoby & Chen, Nov 2015
285. US Major Crops’ Uncertain Climate Change Risks and Greenhouse Gas Mitigation Benefits. Sue Wing et al., Oct 2015
284. Capturing Natural Resource Dynamics in Top-Down Energy-Economic Equilibrium Models. Zhang et al., Oct 2015
283. Global population growth, technology, and Malthusian constraints: A quantitative growth theoretic perspective. Lanz et al., Oct 2015
282. Natural Gas Pricing Reform in China: Getting Closer to a Market System? Paltsev & Zhang, Jul 2015
281. Impacts of CO2 Mandates for New Cars in the European Union. Paltsev et al., May 2015
280. Water Body Temperature Model for Assessing Climate Change Impacts on Thermal Cooling. Strzepek et al., May 2015
279. Emulating maize yields from global gridded crop models using statistical estimates. Blanc & Sultan, Mar 2015
278. The MIT EPPA6 Model: Economic Growth, Energy Use, and Food Consumption. Chen et al., Mar 2015
277. Renewables Intermittency: Operational Limits and Implications for Long-Term Energy System Models. Delarue & Morris, Mar 2015
276. Specifying Parameters in Computable General Equilibrium Models using Optimal Fingerprint Detection Methods. Koesler, Feb 2015
275. The Impact of Advanced Biofuels on Aviation Emissions and Operations in the U.S. Winchester et al., Feb 2015
274. Modeling regional transportation demand in China and the impacts of a national carbon constraint. Kishimoto et al., Jan 2015
273. The Contribution of Biomass to Emissions Mitigation under a Global Climate Policy. Winchester & Reilly, Jan 2015
272. Advanced Technologies in Energy-Economy Models for Climate Change Assessment. Morris et al., Dec 2014