Embed Size (px)
Citation preview

THE JOURNAL OF COMPARATIVE NEUROLOGY 370~501-523 (1996)
Transneuronal Pathways to the Vestibulocerebellum
GALEN D. KAUFMAN, MICHAEL J. MUSTARI, RICHARD R. MISELIS, AND ADRIAN A. PERACHIO
Department of Otolaryngology (G.D.K., M.J.M., A.A.P.), Department of Anatomy and Neuroscience (M.J.M., A.A.P.), and Department of Physiology and Biophysics (A.A.P.),
University of Texas Medical Branch, Galveston, Texas 77555-1063; and Department of Animal Biology, School of Veterinary Medicine,
University of Pennsylvania, Philadelphia, Pennsylvania 19104 (R.R.M.)
ABSTRACT The a-herpes virus (pseudorabies, PRV) was used to observe central nervous system (CNS)
pathways associated with the vestibulocerebellar system. Retrograde transneuronal migration of a-herpes virions from specific lobules of the gerbil and rat vestibulo-cerebellar cortex was detected immunohistochemically. Using a time series analysis, progression of infection along polyneuronal cerebellar afferent pathways was examined. Pressure injections of > 20 nanoliters of a lo8 plaque forming units (pfu) per ml solution of virus were sufficient to initiate an infectious locus which resulted in labeled neurons in the inferior olivary subnuclei, vestibular nuclei, and their afferent cell groups in a progressive temporal fashion and in growing complexity with increasing incubation time. We show that climbing fibers and some other cerebellar afferent fibers transported the virus retrogradely from the cerebellum within 24 hours. One to three days after cerebellar infection discrete cell groups were labeled and appropriate laterality within crossed projections was preserved. Subsequent nuclei labeled with PRV after infection of the flocculusiparaflocculus, or nodulus/uvula, included the following: vestibular (e.g., z) and inferior olivary nuclei (e.g., dorsal cap), accessory oculomotor (e.g., Darkschewitsch n.) and accessory optic related nuclei, (e.g., the nucleus of the optic tract, and the medial terminal nucleus); noradrenergic, raphe, and reticular cell groups (e.g., locus coeruleus, dorsal raphe, raphe pontis, and the lateral reticular tract); other vestibulocerebellum sites, the periaqueductal gray, substantia nigra, hippocampus, thalamus and hypothalamus, amygdala, septa1 nuclei, and the frontal, cingulate, entorhinal, perirhinal, and insular cortices. However, there were differences in the resulting labeling between infection in either region. Double-labeling experiments revealed that vestibular efferent neurons are located adjacent to, but are not included among, flocculus-projecting supragenual neurons. PRV transport from the vestibular labyrinth and cervical muscles also resulted in CNS infections. Virus propagation in situ provides specific connectivity information based on the functional transport across synapses. The findings support and extend anatomical data regarding vestibulo-olivo-cerebellar pathways. o 1996 Wiley-Liss, Inc.
Indexing terms: alpha-herpes, vestibular, inferior olive, climbing fiber, accessory optic
An anatomical tracing technique that follows multisynap- tic pathways through the central nervous system (CNS) is a powerful tool to define a network of neurons involved in particular functions. The use of the neurotropic a-herpes pseudorabies virus (PRV) has been shown to satisfy most of the requirements for such a technique. The natural hosts for the wild-type strain of the virus are pigs and rats, however most other mammals, except for primates and humans, are susceptible to non-transmissible infections that are usually lethal (Jones and Hunt, 1983). The clinical disease is known as “pseudorabies” because of the resulting
clinical signs in animals, but is not related to the rabies (rhabdoviridae) virus. Rabies, however, has also recently been used for transneuronal tracing studies (Ugolini, 1995).
Brain infections initiated in the eye of the rat have been shown to travel anterogradely from the retina to the lateral geniculate and the superior colliculus, but if the virus is
Accepted February 29,1996 Address reprint requests to Adrian A. Perachio, Department of Otolaryn-
gology, University of Texas Medical Branch, Galveston, TX 77555-1063. E-mail: [email protected]
O 1996 WILEY-LISS. INC.

502 G.D. KAUFMAN ET AL.
Abbreviations
Modified from Poxinos and Watson, second edition. 3v 8n ac AH AP
Arc B BLA BSTMA
As
CA1-3 Ce CeC CeM c g CG CGa CGD CGDL CGLV CL CM CNS Cp D DG Dk DMH
DPGi DpMe DR DTN DVN E-W Ent EP F FF floc G GABA GAD GP m1 Hb HDB I icp I11 IL IM IMLF IMLFG
(INC) In INC
Ins INV I 0 IOA IOB IOBe IOC IODM IOK IOM IOPr IP IPD IV IX K-F La
DPG
(IMLFG)
third ventricle vestibulocochlear nerve anterior commissure anterior hypothalamic area area postrema cerebral aqueduct (111) arcuate hypothalamic n. basal n. of Meynert basolateral amygdaloid n., anterior part bed nucleus of the stria terminalis, medial division, anterior
fields of hippocampus central amygdaloid n. central cervical n. central cervical n., medial division cingulate cortex central gray he . PAG) alpha division, PAG dorsal periaqueductal gray dorsolateral perjaqueductal gray lateroventral periaqueductal gray centrolateral thalamic n. centromedial thalamic n. central nervous system cerebral peduncle dentate cerebellar n. dentate gyms Darkschewitsch n. dorsomedial hypothalamus deep gray layer of the superior colliculus dorsal para-gigantocellular reticular n. deep mesencephalic reticular n. dorsal raphe dorsal terminal n. Descending(inferior) vestibular n. Edinger-Westphal n. entorhinal cortex entopeduncular n. fastigial cerebeller n. n. of the fields of Fore1 flocculus gelatinosus thalamic n. gamma amino butyric acid glutamic acid decarboxylase globus pallidus genu of the facial n.
Part
habenular n. n. of the horizontal limb of the diagonal band interpositus cerebellar n. inferior cerebellar peduncle oculomotor n. immunolabeling intramuscular interstitial n. of the mlf
interstitial n. of the mlf, greater part intercalated n. of the medulla
interstitial n. of Cajal insular cortex interstitial n. of the vestibular nerve inferior olivary n. A subnucleus B subnucleus beta subnucleus C subnucleus dorsomedial cell column dorsal cap of Kooy M subnucleus principal subnucleus intraperitoneal interpeduncular n. fourth ventricle uvula Kolliker-Fuse n. lateral amygdaloid n.
LA LC LH Li LPB LPGi LPO LRt LSD LSI LSV LTN LV LVN MA3 MA0 mcP Me mlf MnPO MPO MS MTN MVeV MVN NOT NRTP
PAG Pf PH Pir Pk PLCO PMR PnO Po PPTg PR PrH PRV PVA PVP R Re RF RMg Ro Rob RPa RPn RtTg
sc SGCA SI SN so SVN VDB vlo VLTg VOC VPL VPM VTA
VTRZ X
xscp Y
ZI
(RtTg)
(NRTP)
SP5
X
Z
lateroanterior hypothalamic n. locus coeruleusLDTg laterodorsal tegmental n. lateral hypothalamus linear nucleus lateral parabrachial n. lateral paragigantocellular n. lateral preoptic hypothalamus lateral reticular tract anterior part lateral septal n., dorsal part lateral septal n., intermediate part lateral septal n., ventral part lateral terminal nucleus lateral ventricle lateral vestibular n. (Deiter’s) medial accessory oculomotor n. medial accessory olive middle cerebellar peduncle medial amygdaloid n. medial longitudinal fasciculus median preoptic n. medial preoptic hypothalamus medial septal n. medial terminal n. ventromedial MVN Medial vestibular n. n. of the optic tract
n. reticularis tegmentum pontis periaqueductal gray (i.e., CG) paraflocculus posterior hypothalamus piriform cortex Purkinje cell(s) posterolateral cortical amygdaloid n. (C2) paramedian raphe n. Pontine n. pars oralis posterior thalamic nuclear group pedunculopontine tegmental n. perirhinal cortex prepositus hypoglossi pseudorabies virus paraventricular thalamic n., anterior part paraventricular thalmic n., posterior part red nucleus reunions thalamic n. rhinal fissure raphe magnus n. Roller’s n. raphe obscuris n. raphe pallidus n. raphe pontis n.
reticulotegmental n. of the pons superior colliculus supragenual VII cerebellar afFerents substantia innominata substantia nigra superior olivary n. spinal trigeminal n. superior vestibular n. n. of the vertical limb of the diagonal band ventrolateral outgrowth ventrolateral tegmental n. vestibulo-olivo-cerebellar ventral posterolateral thalamic n. ventral posteromedial thalamic n. ventral tegmental area ventral tegmental nucleus (Gudden) ventrolateral tegmental relay zone nodulus x vestibular n. superior cerebellar peduncle decussation y vestibular n. z vestibular n. zona incerta
NEURONAL PATHWAYS TO THE VESTIBULOCEREBELLUM 503
introduced within the central nervous system, it primarily follows retrograde synaptic routes (Whealy et al., 1993). Verification of pathway projections can be resolved by combining careful temporal studies and conventional single step tracers (Standish and Enquist, 1994). Electron micro- scopic studies reveal the intracellular compartmentaliza- tion of the virions as they traverse between synaptically- connected neurons (Card et al., 1993). Late-infected neurons are encapsulated by non-shedding microglia and astrocytes which serves to restrict non-specific spread of the virion in brain tissue (Card et al., 1993; Rinaman et al., 1993). Although it is possible that some non-specific viral spread- ing occurs, especially at sites of late-stage infections, we propose the transneuronal labeling revealed here is consis- tent with and is most parsimoniously explained by trans- port within specific pathways and is not likely to have resulted from non-specific transport. Nevertheless, when possible, confirmatory labeling of new anatomical connec- tions should be obtained with other established single-step tracers, although this technique cannot establish the exis- tence of a synaptic contact.
Several studies have now demonstrated the utility of PRV tracing using direct infection of peripherally inner- vated organs, for example the kidney (Schramm et al., 1993), stomach, esophagus, and tongue (Card et al., 1990), heart (Standish et al., 19941, eye (Card et al., 19911, trachea (Haxhiu et al., 1993), sympathetic (Strack et al., 19891, and parasympathetic ganglia (Jansen et al., 1992; Spencer et al., 1990). Although PRV has not been used to date in direct central infections, rcccnt rcports have described the efficacy of another viral agent. Hoover and Strick (1993) have utilized cortical injections of the herpes simplex virion (HSV- 1) to map basal ganglia and cerebellar nuclei connec- tivity in primates (see also Middleton and Strick, 1994). Here we report the successful application of the PRV technique in rats and gerbils by using pressure microinjec- tions into the cerebellum for transneuronal retrograde tracing of central pathways.
Attenuated strains of the a-herpes virus have been developed whose transport properties differ in different populations of neurons. For example, the wild-type strain Becker infects all known retino-recipient areas of the brain after intravitreal injection, while the attenuated Bartha strain infects only a portion of these sites, and at a slower rate than the Becker strain (Card et al., 1991). The Bartha strain is missing a portion of the wild-type genome which codes for several glycoproteins. These surface proteins presumably play a role in viral uptake, recognition, and/or transport (Whealy et al., 1993).
It is known that the vestibular system has diverse interaction with other sensory structures. Visual (Paige and Sargent, 1991; Mustari et al., 1994; Soodak and Simpson, 1988), proprioceptive (Armstrong et al., 19731, autonomic (Manzoni et al., 1989; Licata et al., 19931, limbic (Cowie and Holstege, 1992; Holstege and Cowie, 1990), and cerebral cortical (Akbarian et al., 1994; Tuohimaa et al., 1983) function all interact with the vestibular system. Some of the connections between these systems and the vestibular system are not well characterized. For example, tecto-olivary and tecto-limbic projections have been de- scribed (Giolli et al., 1985; Spence and Saint-Cyr, 19881, but there is little direct evidence for a limbic or cerebral cortical input to the vestibular-olivo-cerebellar (VOC) triad. Direct inputs to specific vestibular-related inferior olivary (10) subnuclei have been investigated (Bernard, 1987; Barmack
et al., 1993b; DeZeeuw et al., 1994a), but information about multisynaptic connectivity depended on imprecise assump- tions gathered from single step tracing experiments. Defin- ing the functional and anatomical inputs to these struc- tures will improve our understanding of normal and adaptive mechanisms associated with vestibular pathologies and novel environments (Kaufman et al., 1992a,b; Kaufman and Perachio, 1994; Miles and Lisberger, 1981).
The purpose of this study was to use PRV to induce a progression of neuronal infection, originating from inocula- tion sites in the vestibulocerebellum, to demonstrate poly- synaptic inputs to the VOC triad. The retrograde transport of PRV from different regions of the vestibulocerebellum reveals the multiplicity of inputs into the VOC triad and the neural connections that immediately influence it. We specifi- cally focused on two cortical areas: the flocculusiparafloccu- lus, and the nodulus/uvula. Both of these areas have been extensively studied with regard to vestibular-related physi- ology. The results of this study are necessarily broad, covering the entire brain. It is beyond the scope of this paper to discuss the detailed morphology of each area identified from PRV tracing. Rather, our intent is to identify groups of neurons involved in multisynaptic connec- tions to the VOC system, and present this information in one document.
MATERIALS AND METHODS Sixty-four animals comprising fifty-seven Mongolian ger-
bils (Meriones unguiculatus) weighing between 60 and 100 g, and seven Long-Evans pigmented rats (Rnttus n.oruegicus, 200-300 g), were utilized for this report. Preliminary ex- periments were conducted in the rat to verify our ability to reproduce earlier research and begin to explore the central injection sites. Subsequent gerbil experiments revealed that the infectivity rates and the CNS labeling patterns between the two species were indistinguishable. For the majority of trials, the attenuated Bartha strain was used. This viral strain has been serially passaged to remove a portion of the genome encoding several virulence-associ- ated surface glycoproteins m e a l y et al., 1993). Standard biosafety level I1 protocols were observed.
All surgical procedures employed stereotaxic methods and were performed under general anesthesia consisting of a mixture of Nembutalm (pentobarbital sodium, 40 mg/kg I.P.) and ketamine (20 mg/kg I.M.). For stereotaxic surgery involving floccular and parafloccular injections, the middle ear bulla was opened post-auricularly; a small hole was drilled through the rostroventral wall of the bulla overlying the paraflocculus, and a 30 p.m tip micropipette containing chilled virus solution was advanced into the cerebellum at the appropriate depth and angle ( - 45" pitch and yaw). For uvula and nodulus injections, a caudal approach through the dorsal extension of the foramen magnum was made to allow penetration of the micropipette. Labyrinth injections were made into the root of the utricular and horizontal ampullary nerves, attempting to preserve the integrity of the endolymph. Following injection, the site was rinsed with saline, packed with gelfoam, and closed with suture. Animals were returned to an isolation cage in the labora- tory to recover from the surgery. Post injection survival times were chosen to follow a progression of synaptically related nuclei. These time points were generally well in advance of the appearance of severe symptoms. However, if an animal began to show severe viral symptoms (lacrima-

504
tion, pruritus, dyspnea, and hyper-reflexia) before the intended time point, it was sacrificed immediately.
In order to deliver small volumes of virus for more precise tracing, pressure injections were made using viral solution- filled glass micropipettes broken to a tip diameter of 10 to 30 pm. We estimated the volume delivered by directly visualizing meniscus movement (1 mm = 0.53 p1) under magnification during the application of pressure pulses (Picospritzer, General Value Corp.) to the virus solution in the microelectrode. Pulses were generally in the range of 20 ms in duration at a level of 20 pounds per square inch (psi). These conditions produced our larger injections (200-500 nl). For smaller injections (20-100 nl), a micropipette with a 10 pm tip was cannulated over a 33 gauge stainless steel tube and connected to polyethylene tubing where 1 mm of meniscus movement equated to 40 nl of virus solution. In one animal, we attempted to use ionophoresis of the virus solution from a 25 pm tip microelectrode at both polarities and various current intensities at several sites in the cerebellum, but no infection was subsequently detected. The animals were killed by first anesthetizing each animal with 1 ml Urethane (500 mg/ml) or chloral hydrate (17.5%) IP, followed by transcardiac perfusion with 50 ml of heparinized saline and approximately 250 ml of 4% per- iodate lysine paraformaldahyde (PLP) fixative. The brains were removed and allowed to stand at 4°C for 4 hours in fixative, followed by immersion in 20% sucrose in phosphate- buffered saline until the tissue sank. Tissue sections were cut on a cryotome at -16°C at a thickness of 40 pm.
Visualization of transported virus was accomplished with a previously published immunohistochemistry procedure (Card et al., 1990) and antibodies kindly provided by Dr. L. W. Enquist at DuPontm. Briefly, previously characterized polyclonal rabbit antibody raised against whole virus was used in combination with a standard Vector Elitem alkaline phosphatase detection kit, with a nickel intensified diamino- benzidene and hydrogen peroxide reaction providing the stained chromagen.
For the control studies, horseradish peroxidase (HRP, Sigmaa 8% in Tris buffer) was ionophoretically applied using positive (anodal) currents of 5-10 pA for 10 minutes in glass micropipettes with tip diameters of 20-50 pm. Standard procedures were used to produce the colorimetric reaction using cobalt intensified diaminobenzidene and glucose oxidase as the electron donor. Fluorescent rhoda- mine microspheres (0.03 pm Fluorospheresm, Lumafluorm) were pressure injected through similar pipettes and visual- ized using the appropriate filters with a mercury lamp source.
G.D. KAUFMAN ET AL.
RESULTS The results are divided into timed trials from the injec-
tion of PRV into two regions of the vestibulocerebellar lobules. In most cases, due to the volume of the injection, the original infectious locus comprised two adjacent sites, for example, the flocculus and ventral paraflocculus, or the uvula (IX) and nodulus (X). Some of the injections were confined to a single lobule. The results are further de- scribed as stages representing the temporal progression of virions from the cerebellum. In our experience, from cen- tral cerebellar cortical injections, these stages correspond roughly to the primary, secondary, and tertiary linked neurons projecting to the injection site. For convenience,
the stages will be arbitrarily defined as: Stage 1 Stage 2 Stage 3
0 - 36 hours incubation time > 36 - 60 hours incubation time > 60 hours incubation time
A general summary of injections in both areas will be presented, beginning with early time points, and pointing out differences between specific trials. Representative cases will be illustrated with line drawings showing the location of virus-laden neurons. We also confirmed routes of infec- tion during stage 1 with studies using single neuron tracers. In addition, we present data from a series of injections in other areas (neck muscle, eye vitreous, cere- bral cortex, and vestibular labyrinth) which were used to examine additional characteristics of virus transport, and to study the VOC triad from different sources. However, the most reliable and consistent immunolabeling (IL) resulted from the cerebellar injections. Neurons were considered labeled if the soma, or soma and dendritic tree, displayed the brownish-blue reaction product of the DAB/nickel ammonium sulfate reaction, or possessed punctate dark dots significantly above background. The experiments de- scribed below incorporate the attenuated Bartha virus strain in gerbils unless otherwise noted. Labeling in a bilateral nucleus should be assumed to be bilateral, unless otherwise noted.
Flocculus and paraflocculus (n = 11) Stage 1 (0-36 hours). A typical pattern observed in
animals killed at least 24 hours post-injection was illus- trated by one animal sacrificed at 30 hours following an injection into the left flocculus and ventral paraflocculus. Virus-infected neurons were labeled in the following areas: moderate numbers of cells contralaterally in the dorsal cap, ventrolateral outgrowth (IOK and vlo), ventral medial accessory (IOM), and ventrolateral principal (IOPr) subnu- clei of the inferior olivary nucleus (10); and scattered to single cells, weighted ipsilaterally, in the x, y, (but not z), medial, ventromedial, and superior vestibular nuclei (x, y, MVN, MveV, SVN) and prepositus hypoglossus (PrH). The supragenual n. (SGCA) had several cells labeled bilaterally, as did the abducens n. (VI). Additional sparse labeling occurred in Rollers n. (Ro), the raphe magnus and pallidus (RMg, RPa), the dorsal paragigantocellular reticular n. (DPGi), spinal trigeminal n. (Sp5), area postrema (AP), and the interstitial nucleus of the vestibular nerve (INV). Several cells were observed in the dorsal raphe (DR), the ipsilateral Darkschewitsch n. (Dk), the lateroventral central gray (CGLV), and primarily medial regions of the basilar pontine nuclei and the nucleus reticularis tegmentum pontis (NRTP). This labeling largely reproduces single-step retrograde tracers such as HRP and fluorescent micro- spheres (see the Controls results section and Fig. 7).
Labeling from an injection confined to only the ventral paraflocculus after 32 hours occurred in the contralateral ventral IOM, with a few cells also observed in the ipsilateral CGLV and LC, and bilaterally in the MVN.
Differences in the floccular injec- tion location and volume subsequently resulted in different brainstem IL patterns. In this group, labeled neurons were found in other cerebellar cortical areas. Two gerbils in this stage had virus injections confined largely to the floccular lobe. In one case there was a small injection at the ventral tip of the flocculus. In this animal, only the contralateral IOM, (Fig. 1B) and one SGCA neuron were labeled after a 52.5 hour incubation. In another case (50.5 hours), virtu-
Stage 2 (36-60 hrs).

NEURONAL PATHWAYS TO THE VESTIBULOCEREBELLUM 505
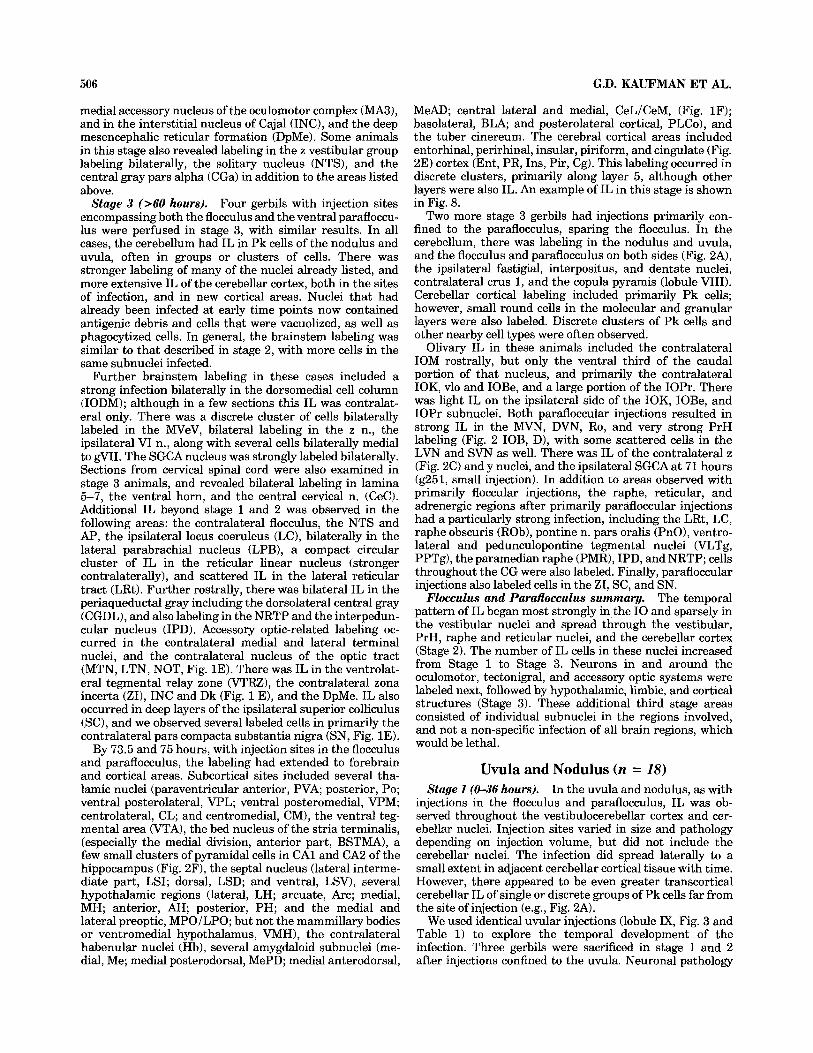
Fig. 1. PRV immunolabeling following flocculus injections in the gerbil. PRV micrographs depict immunodetection of the Bartha strain of virus. A: Contralateral IOK and vlo labeling 50.5 hours post-injec- tion. B: Contralateral ventral IOM at 52.5 hours. C: Ipsilateral vestibular supragenual cell group (SG) and PrH at 63.5 hours. D: Injection site
in one animal 50.5 hours following the injection into the flocculus. E: Labeling in the nucleus of the optic tract, Darkschewitsch nucleus, and the substantia nigra at 71 hours. F: Central medial (CeM) amygdaloid and basal n. of Meynert (B) labeling near the optic nerve (11) after 75 hours. Scale bars = E, 500 pm; all others: 100 pm.
ally the entire flocculus was injected, and the paraflocculus was clear of virus IL except for one Purkinje (Pk) cell (Fig. 1D). There was abundant IL of isolated Pk cells in the nodulus and uvula, the adjacent paraflocculus, and occasion- ally in the contralateral flocculus and paraflocculus. The nodulus had discrete clusters of labeled Pk cells and other cell types in the granular and molecular layers. There was heavy I0 labeling, spreading, in addition to those areas mentioned above (IOK and vlo, Fig. lA), contralaterally in
the beta subnucleus (IOBe) and the B and C subnuclei of the medial accessory olive (IOB, IOC). In the vestibular nuclei, labeled cells were found bilaterally in the MVN and the x group, and ipsilaterally in the y group. The SGCA dorsal to the genu of the VII nerve (gVII) also showed moderate bilateral labeling (Fig. 1C). Additional labeling observed beyond that described at stage 1 included cerebel- lar nuclei (i.e. fastigial, interpositus, and dentate nuclei) and oculomotor-related areas in the contralateral Dk, the
506 G.D. KAUFMAN ET AL.
medial accessory nucleus of the oculomotor complex (MA3), and in the interstitial nucleus of Cajal (INC), and the deep mesencephalic reticular formation (DpMe). Some animals in this stage also revealed labeling in the z vestibular group labeling bilaterally, the solitary nucleus (NTS), and the central gray pars alpha (CGa) in addition to the areas listed above.
Four gerbils with injection sites encompassing both the flocculus and the ventral parafloccu- lus were perfused in stage 3, with similar results. In all cases, the cerebellum had IL in Pk cells of the nodulus and uvula, often in groups or clusters of cells. There was stronger labeling of many of the nuclei already listed, and more extensive IL of the cerebellar cortex, both in the sites of infection, and in new cortical areas. Nuclei that had already been infected at early time points now contained antigenic debris and cells that were vacuolized, as well as phagocytized cells. In general, the brainstem labeling was similar to that described in stage 2, with more cells in the same subnuclei infected.
Further brainstem labeling in these cases included a strong infection bilaterally in the dorsomedial cell column (IODM); although in a few sections this IL was contralat- eral only. There was a discrete cluster of cells bilaterally labeled in the MVeV, bilateral labeling in the z n., the ipsilateral VI n., along with several cells bilaterally medial to gVII. The SGCA nucleus was strongly labeled bilaterally. Sections from cervical spinal cord were also examined in stage 3 animals, and revealed bilateral labeling in lamina 5-7, the ventral horn, and the central cervical n. (CeC). Additional IL beyond stage 1 and 2 was observed in the following areas: the contralateral flocculus, the NTS and AP, the ipsilateral locus coeruleus (LC), bilaterally in the lateral parabrachial nucleus (LPB), a compact circular cluster of IL in the reticular linear nucleus (stronger contralaterally), and scattered IL in the lateral reticular tract (LRt). Further rostrally, there was bilateral IL in the periaqueductal gray including the dorsolateral central gray (CGDL), and also labeling in the NRTP and the interpedun- cular nucleus (IPD). Accessory optic-related labeling oc- curred in the contralateral medial and lateral terminal nuclei, and the contralateral nucleus of the optic tract (MTN, LTN, NOT, Fig. 1E). There was IL in the ventrolat- eral tegmental relay zone (VTRZ), the contralateral zona incerta (ZI), INC and Dk (Fig. 1 E), and the DpMe. IL also occurred in deep layers of the ipsilateral superior colliculus (SC), and we observed several labeled cells in primarily the contralateral pars compacta substantia nigra (SN, Fig. 1E).
By 73.5 and 75 hours, with injection sites in the flocculus and paraflocculus, the labeling had extended to forebrain and cortical areas. Subcortical sites included several tha- lamic nuclei (paraventricular anterior, PVA posterior, Po; ventral posterolateral, VPL; ventral posteromedial, VPM; centrolateral, CL; and centromedial, CM), the ventral teg- mental area (VTA), the bed nucleus of the stria terminalis, (especially the medial division, anterior part, BSTMA), a few small clusters of pyramidal cells in CA1 and CA2 of the hippocampus (Fig. 2F), the septa1 nucleus (lateral interme- diate part, LSI; dorsal, LSD; and ventral, LSV), several hypothalamic regions (lateral, LH; arcuate, Arc; medial, MH; anterior, AH; posterior, PH; and the medial and lateral preoptic, MPO/LPO; but not the mammillary bodies or ventromedial hypothalamus, VMH), the contralateral habenular nuclei (Hb), several amygdaloid subnuclei (me- dial, Me; medial posterodorsal, MePD; medial anterodorsal,
Stage 3 (>60 hours).
MeAD; central lateral and medial, CeL/CeM, (Fig. 1F); basolateral, BLA, and posterolateral cortical, PLCo), and the tuber cinereum. The cerebral cortical areas included entorhinal, perirhinal, insular, piriform, and cingulate (Fig. 2E) cortex (Ent, PR, Ins, Pir, Cg). This labeling occurred in discrete clusters, primarily along layer 5, although other layers were also IL. An example of IL in this stage is shown in Fig. 8.
Two more stage 3 gerbils had injections primarily con- fined to the paraflocculus, sparing the flocculus. In the cerebellum, there was labeling in the nodulus and uvula, and the flocculus and paraflocculus on both sides (Fig. 2A), the ipsilateral fastigial, interpositus, and dentate nuclei, contralateral crus 1, and the copula pyramis (lobule VIII). Cerebellar cortical labeling included primarily Pk cells; however, small round cells in the molecular and granular layers were also labeled. Discrete clusters of Pk cells and other nearby cell types were often observed.
Olivary IL in these animals included the contralateral IOM rostrally, but only the ventral third of the caudal portion of that nucleus, and primarily the contralateral IOK, vlo and IOBe, and a large portion of the IOPr. There was light IL on the ipsilateral side of the IOK, IOBe, and IOPr subnuclei. Both parafloccular injections resulted in strong IL in the MVN, DVN, Ro, and very strong PrH labeling (Fig. 2 IOB, D), with some scattered cells in the LVN and SVN as well. There was IL of the contralateral z (Fig. 2C) and y nuclei, and the ipsilateral SGCA at 71 hours (g251, small injection). In addition to areas observed with primarily floccular injections, the raphe, reticular, and adrenergic regions after primarily parafloccular injections had a particularly strong infection, including the LRt, LC, raphe obscuris (Rob), pontine n. pars oralis (PnO), ventro- lateral and pedunculopontine tegmental nuclei (VLTg, PPTg), the paramedian raphe (PMR), IPD, and NRTP; cells throughout the CG were also labeled. Finally, parafloccular injections also labeled cells in the ZI, SC, and SN.
The temporal pattern of IL began most strongly in the I 0 and sparsely in the vestibular nuclei and spread through the vestibular, PrH, raphe and reticular nuclei, and the cerebellar cortex (Stage 2). The number of IL cells in these nuclei increased from Stage 1 to Stage 3. Neurons in and around the oculomotor, tectonigral, and accessory optic systems were labeled next, followed by hypothalamic, limbic, and cortical structures (Stage 3). These additional third stage areas consisted of individual subnuclei in the regions involved, and not a non-specific infection of all brain regions, which would be lethal.
Flocculus and Paraflocculus summary.
Uvula and Nodulus (n = 18) Stage 1 (0-36 hours). In the uvula and nodulus, as with
injections in the flocculus and paraflocculus, IL was ob- served throughout the vestibulocerebellar cortex and cer- ebellar nuclei. Injection sites varied in size and pathology depending on injection volume, but did not include the cerebellar nuclei. The infection did spread laterally to a small extent in adjacent cerebellar cortical tissue with time. However, there appeared to be even greater transcortical cerebellar IL of single or discrete groups of Pk cells far from the site of injection (e.g., Fig. 2A).
We used identical uvular injections (lobule IX, Fig. 3 and Table 1) to explore the temporal development of the infection. Three gerbils were sacrificed in stage 1 and 2 after injections confined to the uvula. Neuronal pathology

NEURONAL PATHWAYS TO THE VESTIBULOCEREBELLUM 507
Fig. 2. Highlights of PRV IL following a parafloccular injection. A Labeling of Pk cells in the contralateral flocculus (82 hours), B: PrH labeling. C: Contralateral z nucleus labeling. D: Dense IL in the MVN
and PrH at 71 hours E: Cingulate cortex cluster at 75 hours. F: Label- ing in hippocampal CA1 pyramidal cells at 75 hours. Scale bars = D, 500 pm; all others: 100 pm.
varied depending on the nucleus and post injection survival time. I 0 regions that harbored the virus for longer periods had scattered homogenous IL and soma that were vacuolar in appearance (Fig. 3E). However, other regions, including cerebellar Pk cells and neurons in the vestibular nuclei, stained for the virus throughout their soma, and often displayed dendritic labeling.
Figure 3A-E depicts the temporal progression in coronal sections of the inferior olive at the level of the IOBe. Injection of 200 nl into one side of the uvula first labeled
several cells at 24 hours in the contralateral IOBe (Fig. 3A). The contralateral IOA, IOB, IOC also labeled for PRV beginning at about 24 hours. At time points of 30 and 36 hours (Fig. 3 B,C), more neurons in the same I 0 subnuclei were immunolabeled, and the IODM began to show labeling as well. In the vestibular nuclei, occasional single neurons showed IL in the MVN, DVN, and x, and also in the PrH, at 24 hours post-injection. However, no supragenual neurons were observed. By 30 and 36 hours, the number of cells in the vestibular nuclei increased slightly, and this IL was

508 G.D. KAUFMAN ET AL.
Fig. 3. Time progression of infection from the uvula to the inferior olive in the gerbil. A, IOB, and C show coronol cross sections at the level of the IOBe in gerbils infected with 200 nl of virus into the uvula, and then sacrificed at 24, 36, and 46 hours, respectively. D and E show
higher magnification views of olivary neurons infected at the 24 and 46 hour time points, respectively. Note the lytic nature of the cells in E. See Table 1 for cell counts. All scale bars = 100 km.
NEURONAL PATHWAYS TO THE VESTIBULOCEREBELLUM 509
TABLE 1. Time Progression and Groups
A. Immunolabeled cell counts of PRV infection progression in the I 0 and vestibular nuclei in three time points'
Labeled cell counts Incubation time (hr) CIOC cIOBe cMVN iMVN cDVN
Brainstem totals
24 36 46
9 1 23 27 55 46
1 1 0 288 3 2 2 628 7 4 13 > 3000
B. Distribution of animals used in this study, divided into species and stage, and including several control studies2
Primary PRV injection sites
Stage Paraflocculus Flocculus Uvula Nodulus Labyrinth Other Neck Vitreous
1 (0-36 hr) 2 (36-60 hr) 3 (> 60 hr)
1 1 3 2 1 4(3) ~
3 3 2 I : 3 6
VOC total, N = 29 PRV total, N = 42 HRPimicrosphere studies, N = 22
TOTAL, N = 64 ~~~
'Each animal received 200 nl of the same Ba strain and titer in an asymmetric region of the uvula. The number of neurons with IL for the PRV virus were counted for each suhnucleus listed (c = contralateral, i = ipsilateral) at the time points indicated. See Figure 3 for a micrograph adjunct to this data. Brainstem total refers to the total number of infected neurons observed in that animal (a predicted value based on counts from every other section) in the brainstem only (defined as from the cervical spinal cord to the oculomotor nucleus). 2The numbers inside the primary site box indicate the region where the majority of the injection occurred. However, note that flocculuslparaflocculus and nodulusluwla injections usually resulted in infectious loci in the adjacent region. The numbers in parentheses refer to the subset of animals in that group that were Long-Evans pigmented rats; the rest were gerbils. VOC = vestibulo-olivo-cerebellar.
slightly stronger contralaterally. Single SGCA neurons were observed bilaterally. Table 1A quantifies the temporal progression of labeled cells in several nuclei for animals sacrificed at the 24, 36, and 46 hour time points. In other regions, the only IL observed at 24 hours was two cells in the DR, and one in the PnO. At 30 and 36 hours incubation additional IL was observed in the ipsilateral y vestibular nucleus and the SVN, the contralateral LPB and LC, and a few cells lying medial to gVII near the SGCA group.
Two injections largely confined to the nodulus at 32 hours resulted in heavy IL in the IOB, vlo, and medial IOBe of the inferior olive, as well as scattered cells in the MVN, DVN, and PrH; the LC and the region just medial to it; the CGa, CGLV, DPGi, and DpMe. There were occasional single cells in the z nucleus. Both injection sites were slightly off of the midline, and consistent asymmetries were present in the labeling patterns observed. In these two cases, both the inferior olivary IL, and the majority of the rest of the IL was on the same side (contralateral to the paramidline injection).
Uvular injections after longer time points resulted in more extensive IL than that de- scribed in stage 1. Longer post injection survival times also resulted in new labeling patterns. For example: the IODM was strongly labeled after the 46 hour time point (Fig. 4B). In the vestibular nuclei IL cells were found in the SVN, LVN, the x, y, f, and MVeV clusters (stronger contralater- ally), and there was intense labeling of the contralateral z vestibular nucleus just dorsal to the NTS. The IL in the vestibular nuclei, especially the tightly packed x and z subdivisions (Mehler and Rubertone, 19851, sometimes gave the impression of a dense cluster of cells, with the majority of neurons labeled for a-herpes virus. This label- ing was stronger contralateral to the cerebellar injection site.
Accessory optic structures labeled a t this time point included the contralateral NOT, DTN, and MTN. In the oculomotor area, there was IL in the E-W nucleus, MA3, CGDL, the ipsilateral oculomotor nucleus (1111, and the contralateral Dk, INC, and DpMe nuclei. Other areas with IL included the fastigial and cuneate nuclei, the LC, LPB, AP, Rob, Ro, RPa, RMg, and RPn, all of which had a few
Stage 2 (36-60 hours).
scattered cells. The caudal portion of the ipsilateral CGLV, the CGa, and the interstitial MLF (IMLF) neurons also revealed IL. There were several IL cells in the ipsilateral SN pars compacta, the ZI, SC, and the IPD nucleus.
A small injection affecting both the uvula and nodulus revealed IL, after 61.5 hours, in the IOK, IOB, IOPr, IOC, IODM, the contralateral MVN, DVN, and Dk, and the ipsilateral I11 nucleus and prerubral field. At 73 hours after a nodulus injection, only minimal to moderate IL was found throughout the vestibular-related brainstem, including the contralateral IOBe, a group of cells dorsome- dial to the rubrospinal tract, Pk cells in the flocculus, and the NOT. Scattered cells in the polymorph layer of the hippocampal dentate gyrus were also labeled. In contrast, strong labeling of cell clusters in the contralateral Ent and Ins cortices were present. These clusters sometimes re- sembled radial bands of IL cells bridging cortical layers 2-5.
Paramidline nodular injections at 67 hours resulted in widespread IL: The inferior olivary distribution included bilateral, but contralaterally weighted labeling in the IOA, IOB, IOC, IOK, vlo, medial IOBe, and IODM. There was massive homogenous vestibular nuclei labeling, especially in the MVN, DVN, PrH and the f, x, y, and z nuclei, all of which was denser contralaterally. Lighter labeling occurred in the SVN and LVN. The heavy labeling defined a clear border between the vestibular nuclear complex and adja- cent nuclei like the NTS or reticular formation. Both animals had bilateral, but stronger ipsilateral SGCA label- ing. Cerebellar nuclei labeling was present, especially of the fastigial nucleus. Cerebellar cortical labeling appeared as stripes of reacted neurons extending through all three layers of the cortex. These stripes were scattered through- out the vermis, and the flocculus and ventral paraflocculus bilaterally. In other areas, there was heavy labeling through- out the raphe and reticular formations of the brain. Label- ing included the AP, NTS, the vagal motor n., Ro, DPGi, Rob, RMg, LRt, the abducens motor n., DR, NRTP, and the pontine nuclei. Further rostrally, labeling could be ob- served in the NOT, MTN, DTN, Hb, ZI, SN, Dk, IC, SC, IPD, CGLV, CGDL, and CGD. The hypothalamus was lightly to moderately labeled in several subnuclei (especially
Stage 3.

510 G.D. KAUFMAN ET AL.
Fig. 4. More examples of PRV IL following injections of virus into the nodulus/uvula of gerbils. A: IL in the z nucleus of one animal killed at 50 hours post-injection. Another animal sacrificed at 46 hours
LH and the dorsal subnuclei) and there were occasional cells in the pyramidal layers of the hippocampus. A few single amygdaloid or basal n. of Meynert cells were ob- served. Cerebral cortical involvement was limited to a few sparse patches or single IL cells in the Ent, Cg, Pir, Ins, and parietal cortices.
Behaviorally, these two animals displayed tremors, dsyp- nea, lethargy, and a head and body tilt prior to sacrifice. However, one had a right tilt while the other’s tilt was directed leftward, despite the similarity of their brainstem labeling symmetry (i.e., both had IL predominantly on the right side of the brain in the I 0 and other areas.
Two gerbils were sacrificed in stage 3 after uvular in- jections of the wild type Becker strain. Owing to the nature of the antibody for the Becker strain, infected areas had the appearance of a darker background tissue with lightly stained neuropils. Although immunolabeling was poor, we could observe IL in the contralateral IOBe and vlo, IODM, the NTS, MVN, DVN, Ro, reticular formation, contralat- era1 SC, and CG.
The temporal pattern of infection began in the I 0 and proceeded through the vestibular nuclei, oculomotor, accessory optic, and raphe nuclei, reticular areas, and the cerebral cortex. Exceptions from labeling after the floccular/parafloccular injections occurred in the first stage of I0 infection (see discussion), and in the subsequent forebrain labeling. For example, a t
Uvula and nodulus summary.
reveals IL in the B. IODM, and C. MVN (note the ventricular surface location of most of the cells). D: Posterolateral cortical (PLCo) amyg- dala labeling at 75 hours. Scale bars: All bars represent 100 pm.
similar time points in the vestibular nuclei region, the flocculus/paraflocculus injections labeled the PrH more strongly, but nodulus/uvula injections labeled the DVN more strongly. Nodulus/uvula injections labeled a polysyn- aptic pathway to the Ent, Pir, Cg, and Ins cortices, but did not label hypothalamic, septal, and midbrain structures to as great an extent as flocculus/paraflocculus injections.
Fig. 5. Control studies: Labeling following peripheral labyrinth in- jections: A Ipsilateral paraflocculus labeling from an utricular injection (see also Fig.7). Note the punctate IL of fiber cross-sections throughout the field. B: Glial stippling around the vessel near the efferent group (SGCA region) in an ineffective central infection following labyrinth injection. PRV IL following injection of 2 p1 of virus into the right neck musculature. The animal showed no symptoms and was killed 90.5 hours following the injection. C : A horizontal cervical spinal cord section showing asymmetric central cervical nucleus IL. D: Several neurons in the medial ipsilateral oculomotor nucleus labeled. Double labeling experiments and examples of different tracers for the SGCA and efferent vestibular populations. E: Horeseradish peroxidase (HRP)- filled efferent neurons from an ipsilateral labyrinth injection. F: The same area as in E showing retrogradely filled microspheres in SGCA neurons from injection into the flocculus. The populations in E and F are intermingled, but no double-labeled cells were observed. G HRP in SGCA neurons. H: Fluorescently labeled SGCA neurons. Compare the distribution of cells in G and H to PRV IL of the same area in Figure 1 C. Scale bars: C, 500 pm; E and F, 50 pm; all others: 100 km.
Figure 5

G.D. KAUFMAN ET AL. 512
However, there were still many overlapping labeling re- gions between the two major injection sites.
IL. The frontal and cingulate cortices (Cg) had discrete clusters of virus IL; wide regions of somatosensory, visual, and motor cortices also had scattered, moderate to heavy IL.
Controls Cervical muscles (neck) (n = 4). Unilateral neck muscle
Other cerebellar: Lobules ZV and V (n = 1). In one animal, a large ( - 10 p1) injection of Bartha virus into the midline of cerebellar lobules VI and V, dorsal to the preculminate fissure, resulted in IL at 33 hours bilaterally in the MA0 and IOBe subnuclei (but not the vlo or IOK), as well as scattered cells in the MVN, DVN, PrH, LC, and cuneate nuclei. Several vestibular SGCA neurons were also labeled bilaterally, as were scattered molecular and granu- lar layer cells of the nodulus and uvula. Tegmental regions (e.g., pedunculopontine and subpeduncular) also showed IL. Di- and telencephalic tissue were not observed in this animal.
We attempted to initiate an infection at the vestibular labyrinth using the Bartha strain in order to define the vestibulo-olivo-cerebellar axis from the periphery, and perhaps extend observations regard- ing second-order vestibular projections to other brain re- gions. Several techniques and labyrinth injection locations were explored, but the resulting brainstem infection was variable. In some cases, the vestibular efferent cell groups were the only neurons affected (Fig. 5A,B). Following longer post-injection survival times, labeled neurons were also observed in the MVN and PrH. However, this minimal IL did not occur until time points much longer than central inoculations (> 60 hours), and some animals showed no symptoms of disease. There was little evidence that primary afferent neurons were infected (see Discussion). At even longer time points (103, 120, 121, and 139 hours) we observed light IL in the uvula asymmetrically, the ipsilat- era1 LRt, LC, and cuneate nuclei, the cerebellar nuclei, AP, NRTP, Rob, RPa, RMg, and DPGi. Some of the animals also revealed IL in structures innervated by the cochlea (e.g., the dorsal cochlear nucleus, superior olivary nucleus, and the inferior colliculus). Two animals did show a signifi- cant head tilt towards the side of injection that developed 3 to 4 days after the application of the Bartha virus, but the subsequent brainstem IL was scarce. In these animals we observed glial stippling patterns in the region of vestibular efferent neurons (Fig. 5B), indicative of phagocytized viral antigen. There was an absence of infection further rostrally in the brainstem.
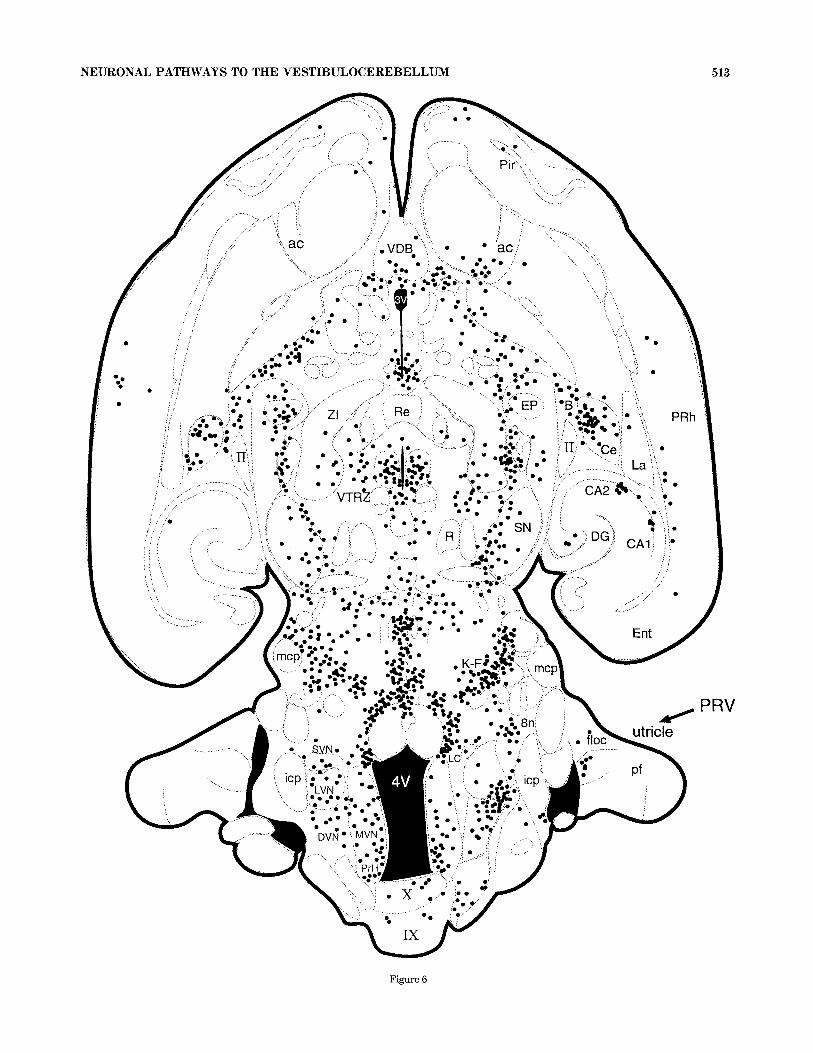
Conversely, in a single case an injection into the support- ing stroma underneath the left utricular neuroepithelium resulted in behavioral signs of infection and had extensive PRV labeling throughout the brain at 120 hours (Fig. 6). Prior to sacrifice the animal was unresponsive, with deep breathing, a wide-based stance in the rear legs, and porphy- rin tearing. The subsequent PRV IL included cervical spinal cord neurons in lamina 5-7 and the CeC. Brainstem labeling included the MVN, DVN, LVN, SVN, y, x, PrH, LRt, LPB, LC, CG, and AP. There was ipsilateral labeling in the z nucleus, and the spinal- and paratrigeminal nuclei. There were clusters of cells in the Pk layers of lobules 1-10
Vestibular labyrinth (n = 6).
injections were performed in order to assess vestibulocollic circuitry. Infection from this area resulted in no symptoms in both gerbils and rats using the Bartha strain, while the Becker strain resulted in severe symptoms approximately 50 hours after injection of 1-10 p,1 of virus solution into lateral neck muscles. Immunohistochemistry in both gerbil and rat, however, revealed that both viral strains infected neurons in the caudal I0 (MAO, IOM), the LRt, and the NTS. Evidence of asymmetric IL in central cervical nuclei was observed (Fig. 5C), and by 90.5 hours asymmetric labeling could be observed rostrally in the ipsilateral oculo- motor nucleus in a Bartha infected gerbil (Fig. 5D). Other sites included the x, LVN and SVN, the LC, LPB, CGDL, red nucleus, the contralateral NOT, SC, and SN. Several cerebral cortical areas (including visual, parietal, Ent, and Pir) were also labeled.
Retinal projections (n = 2). We repeated previous experiments injecting wild-type PRV into the vitreous of one eye. Our interest was in exploring retinal projections to the vestibular system. As reported by Whealy et al. (19931, by 50 hours after a 2 p1 injection through the sclera we observed patchy IL throughout the lateral geniculate and optic tectum, as well as area 17 (especially layer 4) of the visual cortex using the Becker strain. In addition, we observed IL in the contralateral NOT and MTN, and in the ipsilateral oculomotor and abducens nuclei, the VTRZ and the basilar pontine nuclei. Further caudally, IL could be observed in the LRt, the reticulospinal tract, the spinal trigeminal tract, the IOK, and vlo. These findings are consistent with known retino-recipient projection areas (Terubayashi and Fujisawa, 1984) and the accessory optic system of rodents (Giolli et al., 1985). One vitreal injection with the Bartha strain revealed IL in the ipsilateral LRt, trigeminal nucleus (see Discussion), IOK, IOB, IOBe, IOC, vlo, and bilaterally in the reticulospinal nucleus, RPa, AP, and NTS.
Conventional single step tracers: Retrograde transport from the flocculus and ventral paraflocculus (n = 22). We used single-step tracers in the flocculus and ventral parafloc- culus to confirm that the stage 1 virus IL corresponded to the first order of neurons connecting to the injection site. Refer to Figure 7 for a representative HRP experiment. Of special interest to us was the SGCA nucleus, since this region corresponds to the area where central vestibular efferent neuronal somas reside (Perachio and Kevetter, 1989). Large floccular and ventral parafloccular injections of HRP in ten gerbils or rhodamine-labeled fluorescent microspheres in twelve gerbils resulted in extensive bilat- eral labeling of the SGCA neurons (Fig. 5G,H). These cells are small to medium sized (average cross-sectional area = 42 kz) fusiform neurons organized in a dense cluster at the dorsal and dorsolateral edge of the genu of the facial nerve. A paired Student’s t-test for retrogradely labeled bilateral
of the cerebellum. However, no I0 or cochlear n. IL was observed. Further rostrally, IL was present in the DpMe region, the contralateral SN, several thalamic (G, Po, W L , VpM, and ML) and hypothalamic (LH, pv, Arc, and MnPO) subnuclei, the BSTMA, P P T ~ , substantia innominata, and the labeling was Observed in the VDB, Lsv, LsI, and LSD. hygdaloid IL occurred bilaterally in the Cel, CeM, and AA. There was extensive cerebral cortical
Fig. 6. A line drawing representing a thick horizontal section from an animal sacrificed at 120 hours following an injection of Bartha PRV into the utricle on one side. Bilateral PRV IL has spread thoughout the brain (see abbreviation table for reference). Each dot represents one to five labeled neuronal soma in a composite section approximately 200 pm thick.
NEURONAL PATHWAYS TO THE VESTIBULOCEREBELLUM 513
Figure 6

514 G.D. KAUFMAN ET AL.
Fig. 7. Line drawings representing six transverse sections from one animal with HRP injected into the flocculus and ventral paraflocculus. The dots show areas of labeled neurons which retrogradely transported the enzyme. Compare this distribution to that of stage 3 PRV IL from the same area in Figure 8. Gray areas represent shadowing for depth.
cell asymmetry in the SGCA from a unilateral injection into the flocculus revealed no significant differences (P = 0.28). Medial to gVII, a small number of cells were also labeled bilaterally within the borders of the abducens nucleus. In addition to this labeling, we observed cells bilaterally, in the PrH, Ro, linear n., and IMLF, in the pontine, NRTP, PMR, and reticulotegmental nuclei, and in the DR. Retrogradely labeled cells were also found bilaterally in the interstitial nucleus of the vestibular nerve root (INV). Bilateral label- ing, although stronger ipsilaterally, was observed in the MVN, DVN, LVN, SVN, and the y vestibular nucleus. We also routinely observed a dense cluster of cells labeled in the MVeV. In the contralateral 10, labeling was found in the IOK, vlo, and IOM subnuclei. In one animal a small HRP injection into the lateral tip of the flocculus, which labeled approximately 10 Pk cells and the surrounding paren- chyma, resulted in the retrograde ipsilateral labeling of a single SGCA neuron.
Since the labeled cells in the region dorsolateral to gVII appeared to occupy the same area as that containing the cell bodies of vestibular efferent neurons (Perachio and Kevetter, 1989; see next section), we conducted a series of double- labeling studies to examine whether the cerebellar projec- tion cells were also vestibular efferent neurons. HRP was
ionophoretically injected into several end organs of the vestibular labyrinth in animals that had also received microbead injection into the flocculus and ventral parafloc- culus 5 days previously. Although adjacent cells were labeled with either tracer, no double-labeling was found (Fig. 5E-G). It should be noted, however, that a disynaptic connection between the vestibular efferent neurons and the flocculus/ventral paraflocculus exists via the efferent projec- tion to the INV (Perachio and Kevetter, 1989, see Discus- sion).
DISCUSSION Methodological considerations
The PRV technique reveals cell groups previously demon- strated to carry vestibular information from the perspective of the entire system. The reproducing capability of the label gives a time-dependent and synaptically related view of specific pathways, and can reveal new projections and characteristics that are more difficult to assess and require multiple serial experiments using traditional tracing meth- ods. For early time points our results can be explained with retrograde labeling, and we found no evidence for non-

NEURONAL PATHWAYS TO THE VESTIBULOCEREBELLUM 515
Figure 7 (Continued.)
specific spread of virus to adjacent but functionally unre- lated cell groups. It is interesting that third stage labeling was similar between labyrinth and floccular injections. This also argues for the specificity of the label despite each injection area’s different organization. We conclude that the labeled cells in the later stages of infection represent a hierarchical system from which different sources of eye, labyrinth, and body related inputs eventually converge on the same neurons.
The drawbacks of using PRV as a multisynaptic tracer lies in the variability of neuronal uptake and transport among different strains of the virus and between different neurons and brain areas (Card et al., 1991; Rinaman et al., 1993). There is disagreement regarding the extent of spurious, or non-specific, labeling using the a-herpes vi- ruses in general. Ugolini (1995) suggests that the rabies virus, which will not infect glia and has delayed symptomol- ogy, gives a better portrayal of actual projections- although this study reports the same distribution in the hypoglossal system between HSV 1 and rabies. Whether the potential benefits of the rabies technique outweigh the concern of virulence remains to be seen. However, using well-defined PRV strains like Bartha, precise injection volumes and titers, and confirmation of the infection stages
with monosynaptic tracers, variability associated with the PRV method can be controlled.
Virus tracing is inherently exploratory in nature, and the precise connectivity of newly identified pathways must eventually be shown with single step tracers as well. Even traditional tracing methods can differ in labeled distribu- tion due to receptor, uptake, or transport differences. How- ever, our stage l PRV study of the flocculus, for example, basically reproduced identical HRP injections (Fig. 7). In spite of the uncertainty about the exclusivity of synaptic transmission by the virus, PRV and other virion tracing techniques (e.g., Hoover and Strick, 1993) offer significant advantages over sequential extracellular single-step tracer experiments. The inherent variability at an extracellular injection site (location and size) is a factor only at the original injection site in a virus study. In contrast, in a study using single-step tracers attempting to define serial inputs that variance is multiplied. Early stage virus IL at the first and second projection locations can be isolated precisely to con- nected neurons. That is, the fidelity of transneuronal transport is likely best at the first projection site (from the injection site), where virions could only have arrived within neuronal processes. This supports our contention that the first 2-3 stages of virus transport (before a generalized

516 G.D. KAUFMAN ET AL.
Fig. 8. Nine representative transverse sections from a 75 hour (stage 3) PRV incubation inititated in the flocculus and ventral para- flocculus. Dots represent 1-5 neuronal soma labeled for PRV depending
on density. Note the extensive midbrain and forebrain labeling in addition to that observed from HRP tracing in Figure 7. Gray areas represent shadowing for depth.
brain infection occurs) likely reflect an accurate portrayal of neuronal connectivity.
Other observations which support the transneuronal transport of PRV include the following: The initial trans- port from specific cerebellar lobules follows precisely the topography of climbing fiber projections from the inferior olive previously worked out with repeated single-step tracer studies. Also, there are numerous examples from our work (e.g. Fig 4A,B) where a specific subnucleus is inundated with virus, while cells of another subnucleus with different projections but only tens of microns away, are completely free of virus IL. Even long-term injection sites (e.g., Fig. 1D) did not indicate a non-specific lateral spread of virions. That is, between a stage 1 and stage 3 survival period the injection site for similar injectate volume appeared to involve approximately the same amount of virus IL. What was different in the longer incubations was labeling of cortical areas far removed (e.g., opposite hemisphere) from the site of injection, indicating that virions must have been transported to these other sites contained within connect- ing axons. Finally, ultrustructural studies show that late infected neurons are not spilling virus from the plasma membrane (Card et al., 1993) and even infected neurons with compromised plasma membrane sections are not
spilling virus extracellularly (Miselis, unpublished observa- tion).
Ionophoresis of the virus into cerebellar cortex did not produce an infection, suggesting that very small amounts of virus are insufficient, or that insufficient charge on the virus particles prevented the ejection of virions. The vari- able infection after a labyrinth injection also supports the notion that only certain routes or a minimum quantity of virus is necessary for an effective infection. This might depend on the density of innervation of a particular tissue, or the presence of specific viral receptors. The extent of virus diffusion into the cortical tissue, and the types of immune cells available to combat the infection (general state of health, etc.) are also likely to play a role. For example, a very small injection into the tip of the flocculus resulted in only a few labeled cells centrally, even at 52.5 hours. Lethal central infections can occur between 50 and 100 hours of incubation depending on the site of infection and titer of the innoculum, and animals sacrificed shortly before death exhibited a generalized brain infection that was not useful for analysis due to the ubiquity of the IL.
Twenty nanoliters of a los plaque forming unit (pfu)/ml solution of virus equates to approximately 16,000 pfus. The precise ratio of virion number to pfus is unknown. How-

NEURONAL PATHWAYS TO THE VESTIBULOCEREBELLUM 517
Figure 8 (Continued on next page.)
ever, the demonstration of infection from a focal deposition of 20 nl is a unique qualitative assessment of the multiplic- ity of infection in vivo. Our studies demonstrate that the use of PRV provides a new tool for the study of polysynaptic connections in the vestibulocerebellar system.
projections were sparse and clustered, but widely located throughout the vestibulocerebellum. Such clustering is reminiscent of functional sagittally distributed microzones (Fuhrman et al., 1994). Parallel fibers might be responsible for this t.ype of migration; they connect Pk cell arbors across
Pathways of virus transport It has been clearly shown that PRV can move along
synaptic routes within the rodent CNS (Card et al., 1993). However, which fiber types transport the virus to other areas of the cerebellum and to the brainstem, and whether this transport is anterograde and/or retrograde depends on the system infected. The first labeled cells following a cerebellar cortical injection are I 0 neurons, indicating that climbing fibers are transporting the virus retrogradely. Sparse early labeling in areas such as the vestibular nuclei or DR indicates either that some virus is moved retro- gradely along mossy fibers, or conceivably that the virus can move anterogradely down Pk cell axons. The extensive labeling of cells throughout the vestibulocerebellum at early time points might serve as another source for IL, and represent another route to some of the brainstem nuclei given sufficient survival time. For example, the vestibular y nucleus was labeled in stage 2 after a uvular injection that also labeled floccular Pk cells. The intracerebellar cortical
great distances through the molecular layer. Punctate IL suggestive of such fibers was occasionally observed in cerebellar sections (Fig. 5A).
Clearly several possibilities for PRV transport from cerebellar cortex exist. IL of the ipsilateral cerebellar nuclei after a cortical injection suggests that either Pk cell axons transmitted the virus to the cerebellar nuclei antero- gradely, or that cerebellar nuclei mossy fibers moved the virus retrogradely. Alternatively, two stage retrograde trans- port might have occurred from cerebellar cortex to the vestibular nuclei and then to the cerebellar nuclei. A third alternative is that collateral climbing fibers originating from the injection site might first transport the virus back to an I 0 cell soma, and then move the virus anterogradely via a collateral climbing fiber branch of the same cell to the cerebellar nuclei. Further ultrastructural studies would be required to determine the actual transport possibilities.
The direction and route of PRV transport to areas labeled for virus during stages 2 or 3 is also not clear. For example, single step retrograde transport of fluorescent micro-

518 G.D. KAUFMAN ET AL.
Figure 8 (Continued.)
spheres injected into the flocculus labeled cells in the DR. If the IL of the DR resulted from transport that followed this retrograde path from the flocculus, it might then have infected adjacent oculomotor-related nuclei, e.g., 111, IV, Dk, and INC, via transneuronal transport. Alternatively, the virus could have traveled retrogradely along the projec- tion from Dk and INC to the I0 once those olivary cells were infected. Transport rate differences between retrograde and anterograde connections have been noted previously, with the former being much faster. In addition, studies suggest that in the visceral periphery, motor (efferent) nerves take up the virus preferentially (Card et al., 1990). However, retinal afferent fibers can clearly move the virus anterogradely (Card et al., 1991). The difference between climbing fiber and mossy fiber transport might only be a matter of degree. The reasons for selective transport or rate differences are unknown, but likely involve molecular recog- nition sites on climbing fiber arborizations, for example. Alternatively, axon diameter or intra-axonal viral transport mechanisms might play a role. What is striking is that, at longer time points, many of the same brain nuclei were labeled despite the different injection locations in the vestibulocerebellum. This suggests that, in time, the PRV selectively labeled a related functional system. We suggest
that the simplest explanation for the observed IL is only by retrograde transport from cerebellar cortex.
Vestibulo-olivo-cerebellar triad The vestibular nuclei, vestibulocerebellum (nodulus,
uvula, flocculus, paraflocculus, and other vermal lobules), and inferior olivary nuclei are known to send reciprocal inputs to each other, and thereby form a functional triad implicated in several models of motor learning (Ito, 1972; Lisberger, 1988; Lisberger et al., 1994). This triad can be briefly described as follows: Vestibular-related I 0 subnuclei send contralateral climbing fibers to the vestibulocerebel- lum and cerebellar nuclei, and receive GABAergic input from the vestibular and cerebellar nuclei. The vestibulocer- ebellum sends inhibitory Pk cell output to the cerebellar and vestibular nuclei. Finally, mossy fibers in the form of first and second order vestibular neurons send vestibular labyrinth signals to the vestibulocerebellum ipsilaterally. Unique roles for each of these areas are reflected in their single unit response to specific vestibular stimuli. The 10, for example, has been implicated as a timing device for coordinating motor movements through the cerebellum (Llinas and Yarom, 1986). Likewise, the cerebellum is

NEURONAL PATHWAYS TO THE VESTIBULOCEREBELLUM 519
thought to send corrective input to modifiable pathways in the vestibuloocular reflex (e.g., Lisberger, 1988; Lisberger et al., 1994). However, some investigators have concluded that the actual sites of motor learning (modifiable synapses) are distributed throughout this triad and other related areas. That is, modifiable units might be a general feature of the brain, and it is the connectivity and specific activity of individual neurons that form the input/output relation- ships for the systems in question (see Robinson, 1992).
The most reproducible and definable connection in this study was the olivocerebellar projection. The temporal progression of the infection following cerebellar injections begins with the I 0 and extends to subsequent sites over time. Because the I 0 is labeled before other sites, it would appear climbing fibers offer a more efficient transport path than mossy fibers. Another observation that supports this conclusion is that subsequent vestibular nuclei IL was strongest contralateral to a cerebellar injection. Therefore, since vestibular nuclei project ipsilaterally to the cerebel- lum and the 10, but I 0 neurons always project contralater- ally to the cerebellum, most of the strong contralateral vestibular labeling might represent stage 2 retrograde labeling primarily via I0 neurons. The extent of cell pathology at longer time points in the I 0 also suggests that I0 neurons were infected before vestibular neurons. How- ever, single neurons in the ipsilateral vestibular y, SG, MVN, DVN, DR, and cerebellar nuclei were IL at time points coincident with I 0 labeling after cerebellar cortical injections.
Climbing fiber laterality was preserved if the injection site was asymmetric. Injections closer to the midline in the nodulus and uvula resulted in some bilateral I 0 labeling. The laterality of IODM climbing fibers is still uncertain. It has been shown that the IODM projects mainly to the lateral portions of the uvula in the rat (CX zone, Buisseret- delmas et al., 1993); midline injections of virus might miss the IODMs climbing fiber termination, or be slower to infect this subnucleus. The PRV IL in the IODM was strongest and most consistent from the uvula, while some of the injections in the nodulus and flocculus resulted in less IL in this subnucleus. The IODM displayed IL after some of the floccular injections, however after discrete injections, e.g., 100 nl in the dorsolateral flocculus, the IODM did not contain label, even at 71 hours. The IODM typically labels bilaterally from a unilateral injection. How- ever, in some sections from one animal, the IODM was labeled only contralaterally. Since Fos expression data show that both sides of the IODM receive unilateral vestibular- related inputs (e.g., from centripetal acceleration after hemilabyrinthectomy with only one labyrinth intact, Kauf- man et al., 19931, the asymmetric IODM IL might be indication of local I 0 viral spread rather than a unilateral climbing fiber projection to the cerebellum.
Our olivocerebellar findings are consistent with tradi- tional anterograde and retrograde tracing studies in the rhesus monkey flocculus (Langer et al., 1985a,b), the rat flocculus and paraflocculus (Ruigrok et al., 1992), the mouse uvula (Eisenman et al., 19831, and the rabbit nodulus (Takeda and Maekawa, 1989). Takeda and Maekawa did not find evidence for an IODM-flocculus projection. However, they also documented branching climbing fibers originating from the vestibular-related I 0 that sent collat- erals to the flocculus and uvula, or flocculus and nodulus. Vestibulo-olivary projections have only recently been ex- plored in detail. It is known that the MVN and PrH project
both GABAergic and non-GABAergic neurons to the IOK, and that the PrH projects sparsely to the IODM (DeZeeuw et al., 1993). Recent work in the rabbit (Dezeeuw and Ruigrok, 1994) shows that the rostra1 IOK and vlo receive a GABAergic input from the contralateral ventral dentate and y nucleus. Contrary to the rest of the 10, lesions of the cerebellar nuclei failed to decrease glutamic acid decarboxyl- ase (GAD) immunostaining in the IODM, MAO, IOBe, and ventral IOM (Fredette et al., 19921, suggesting that the source of GABAergic inputs to these portions of the I 0 come from other, presumably vestibular-related, regions. Indeed, a GAElAergic projection to the IOBe from PrH, MVN, and DVN has been described (Barmack et al., 1993a).
MVN neurons that labeled at early time points after vestibulocerebellum injections were often found scattered near the ventricular surface of the nucleus (Fig. 4C). This is a similar distribution of neurons compared to those which labeled for the early response gene protein Fos following hemilabyrinthectomy (Kaufman et al., 1992a) or electrical stimulation to the labyrinth (Kaufman and Perachio, 1994). This group of cells might project to the I 0 and could be among the neurons that recruit Fos and other genetic control elements (immediate early genes) to mediate adap- tation to vestibular stimuli. We also occasionally observed a round cluster of cells in the MVeV that consistently had viral IL and also showed retrograde labeling from the flocculus/paraflocculus using HRP or microspheres (Fig. 7).
Other brainstem nuclei of interest We observed both retrograde HRP transport, and PRV IL
in the densely clustered linear nucleus of the reticular formation after flocculus injections. This serotonergic group is known to receive projections from rat DR (Vertes and Kocsis, 1994) and gerbil cuneate nuclei (Lan et al., 19941, and projects to the guinea pig dorsal cochlear n. (Thompson et al., 1994), and the rat thalamus and basal forebrain (Losier and Semba, 1993). The LC and LPB nuclei also routinely labeled for PRV in our trials. Labeling in these sites likely represents retrograde transport due to the ubiquity of CNS innervation by these aminergic systems.
The IL of cells throughout the columns of the CG, especially the dorsolateral division, is further support that periaqueductal neurons connect to vestibular-related sys- tems. For the CGDL, an anatomical connection to the PrH (Holstege and Cowie, 1990) and the demonstration of a labyrinth-dependent Fos increase following hypergravity (Kaufman et al., 1992a) have been shown previously.
Labyrinth and vestibular efferent neurons Only one out of six attempts at transport of PRV from the
peripheral vestibular labyrinth resulted in a fulminating central infection in the gerbil. In that case, however, IL occurred throughout the brain (Fig. 6). Although a-herpes viral genomes have been detected using in situ hybridiza- tion in the neuroepithelium and primary afferent nerves of infected mice (Falser et al., 1986), our experience with the pseudorabies virus suggests that this route of infection is highly dependent on location and titer of the injection in the labyrinth, and infect efferent fibers more readily than afferent fibers. A very few vestibular afferent neurons did apparently transport PRV as detected by IL in Scarpa’s ganglion somata, but not until longer time points (> 60 hours). The herpes simplex virus (HSV1) when applied to the eighth cranial nerve also apparently does not readily result in transneuronal labeling (Blessing et al., 1994).

520 G.D. KAUFMAN ET AL.
The neuron group found dorsolaterally to gVII consisting of cerebellar afferent fibers coincides generally with the supragenual group (SG) of previous studies, and is also referred to as a perihypoglossal nucleus (Brodal, 1983). Our PRV data showed bilateral IL in this area after flocculusl paraflocculus injections, and bilateral but stronger ipsilat- era1 IL after paramidline nodulus/uvula injections. We performed extensive anatomical work seeking to show double labeling of these neurons from the cerebellum and labyrinth. After multiple attempts, we must conclude that two, independent cell populations reside in this location together, one projecting to the vestibular labyrinth, and the other to the cerebellar flocculus, paraflocculus, nodulus, uvula, and lobules 4 and 5. In general, the labyrinth-project- ing cells appear to lie more laterally to the flocculus-pro- jecting cells, however, both cell groups occupy overlapping areas. Whether these two cell populations connect function- ally with each other is a point of conjecture: the implica- tions of such a connection would be an important observa- tion with regard to proposed adaptation and habituation strategies. The vestibular efferent neurons project to a cell group (INV, Perachio and Kevetter, 1989), all of whose neurons project to the flocculus and ventral paraflocculus, which in turn project to target neurons in the vestibular nuclei. This trisynaptic connection suggests a potential role for vestibular efferent modification of the VOR during active head movements (Tomlinson and Bahra, 1986; PBlis- son et al., 1988).
The z group The intense IL of the z vestibular nucleus following
labyrinth, vestibulocerebellar, and particularly floccular and parafloccular injections, is a novel observation. The z nucleus is known to project to the uvula (Brodal and Brodal, 1985; Walbergand Dietrichs, 19881, and thalamus (Kotchab- hakdi et al., 1980), and one report mentions a projection from the flocculus (Blanks et al., 1983). The viral path to z from the cerebellum is unclear, but the lack of significant z IL after single stage tracers or at early viral time points (e.g., 30 hours) suggests that it might be disynaptic. The prevalence of contralateral z labeling in several animals suggests that the virus might have been transported there retrogradely via I0 neurons (see pathways). The z nucleus also lies adjacent to the AP and NTS; several animals showed IL in each of these structures following virus injection into the cerebellum. It is possible that t h e z vestibular nucleus is part of a pathway that transmits vestibular information to visceral and chemoreceptive sys- tems which in turn are responsible for the emetic reflex (Takeda et al., 1993). Although a direct connection between z and the AP has not been described, artificial stimulation of the vestibular primary afferent nerve does influence AP neurons (Melis et al., 1986). Our findings support the notion of a connection between the VOC system and visceral or autonomic brainstem control areas. Stage 2 and 3 animals did exhibit light to moderate IL in several other cell groups: LC and lateral parabrachial nuclei, raphe, and reticular groups, linear n., NTS, and AP. The functional utility of these connections in vasomotor control during different postural situations has been demonstrated (Yates et al., 1993).
Accessory optic system Transneuronal retrograde IL of the accessory optic sys-
tem nuclei is consistent with previous work showing their
input to VOC nuclei. Many of these cell groups have previously been shown to project to the 10, and could therefore be second stage targets for viral infection. For example, the MTN projects ipsilaterally to the I 0 (Spence and Saint-Cyr, 1988), as does the oculomotor-related Dk n. (Swenson and Castro, 1983). The NOT also has strong efferent connections with the ipsilateral IOK (Terubayashi and Fujisawa, 1984; Mustari et al., 1994). To illustrate the complexity of the potential routes of infection to these cells, the MTN also projects to the ipsilateral NOT, DTN, DpMe, as well as to the VTRZ, SVN, LVN, Dk, INC, CGLV, and pontine nuclei (Giolli et al., 1985). The NRTP is another likely junction point for the virus after flocculus and other cerebellar injections (Torigoe et al., 1986a,b). This nucleus receives projections from the NOT (Terubayashi and Fu- jisawa, 1984; Mustari et al., 1994) and several cerebral cortical areas (Kosinski et al., 1988) and in turn projects to the flocculus, Dk, INC, VTRZ, MTN, PrH, MVN, SVN, LVN, SC, and the fields of Fore1 (Watanabe et al., 1993). At incubation times of - 50 hours, the Dk nucleus had signifi- cant IL, while cells in the accessory optic system still were not labeled. Dk and INC exhibited viral IL before accessory optic system structures, which might be due solely to distance of transport, or could be a factor of the number of synapses separating the cells from the injection site. As previously mentioned, these findings might indicate a direct cerebellar-Dk projection (Dezeeuw and Ruigrok, 1994), or transneuronal infection from the DR, which we have shown to project monosynaptically to the flocculus and parafloc- culus.
The results of the vitreal injections correspond with former studies delineating retinal projections to the brain, and reproduce an earlier study using PRV (Card et al., 1991). However, our observation of labeling in the LRt, reticulospinal, and spinal trigeminal nuclei following vit- real injections suggests trigeminal involvement possibly from the sclera and cornea during the injection.
Forebrain polysynaptic inputs to the VOC The stage 3 results show that many forebrain structures
contribute inputs to the VOC triad. We observed labeling in specific cerebral cortical areas, thalamic and hypothalamic regions, the septal, amygdaloid, and cingulate components of the limbic system, the hippocampus, and the substantia nigra. Both vestibulocerebellar and labyrinth initiated infec- tions resulted in many of the same forebrain structures being labeled. Many of the these same structures also revealed a decrease in 2-deoxyglucose uptake during a rat dyskinesia model (Cadet et al., 1989); another indication of their systemic relation. The distribution of certain tegmen- tal n. afferent fibers (e.g., VTg) also have remarkably similar patterns (Irle et al., 19841, suggesting a possible PRV route via tegmental neurons.
The substantia nigra labeling in stage 3 of our cerebellar injections demonstrates a novel link between the substantia nigra and the VOC triad. The SN is known to project disynapti- cally to the frontal eye fields of the primate via the thalamus (Lynch et al., 1994), to the deep layers of the superior colliculus (Giolli et al., 1985), the inferior colliculus (Olazabal and Moore, 1989), the contralateral I 0 (Spence and Saint-Cyr, 1988), the rat LDTg (Cornwall et al., 1990), and pontine nuclei. Pars compacta projects ipsilaterally to the medial medullary reticu- lar formation in the cat (possibly DPGi, Schneider et al., 1985).
Several recent studies show that hippocampal neurons receive vestibular information, and can integrate this infor-

NEURONAL PATHWAYS TO THE VESTIBULOCEREBELLUM 521
mation with other sensory cues towards a cell specific map of spatial position (O’Mara et al., 1994; Sharp et al., 1995). Our observation of beginning CAI and CA2 layer labeling in stage 3 from VOC injections supports this connection. The source of hippocampal infection cannot be elucidated from these experiments, but retrograde pathways might include the septum and/or the hypothalamus, both labeled for PRV in stage 3.
Vestibular connections with some of the hypothalamic subnuclei had PRV IL (Arc, LH, AH, paraventricular, and preoptic) have been previously suggested (Azzena et al., 1993). The functional release of hypothalamic neurotrans- mitter after vestibular nerve stimulation has been demon- strated (Horii et al., 1993). Another possible retrograde route for cerebellar virus infection to the hypothalamus is via the NRTP (Torigoe et al., 1986a,b). These hypothalamic subnuclei likely influence and receive vestibular information.
Some of the longer time points resulted in PRV IL throughout most of the structures associated with the limbic system. Many limbic nuclei have roles in body motion, and might serve as the contextual structure for motion sickness susceptibility. For example, the amygdala is responsible for arginine vasopressin-induced motor ef- fects (Willcox et al., 1992). The cingulate cortex has connec- tions with insular cortex (Augustine, 1985), the latter known to receive vestibular input (Akbarian et al., 1992). Our data reveal a robust connectivity between the limbic system and the cerebellum, which likely represents the cerebellar role in a wide variety of conditioned responses (e.g., eye blink, McCormick et al., 1985; and taste aversion, Fox et al., 1990).
Cerebral cortical areas labeled with PRV in these studies support functional roles associated with body motion. In human, the superior temporal gyrus has been shown to respond to caloric vestibular stimulation (Friberg et al., 1985); cortical areas possibly analogous to this gyrus in this report had PRV IL. The peri-oculomotor nuclei have recip- rocal connections with the frontal lobe (Leichnetz et al., 1987); both exhibited IL in our long-term PRV experi- ments. Various somatosensory and motor cortical areas modify vestibular neuron responses (Azzena et al., 1983) or respond to vestibular stimuli (Odkvist et al., 1975; Zarzecki et al., 1983), for example, the anterior suprasylvian g y m s of the left hemisphere of cats (Mergner et al., 1985). These areas also labeled for PRV after labyrinth or cerebellar injections. The labeling was generally strongest in layer 5, but also occurred in clusters involving other layers. More study will be needed to accurately map cortical inputs to the VOC triad. Preliminary experiments indicate that, in addi- tion to cerebellar injections, cerebral cortical injections of PRV is also effective in initiating transneuronal infections. For example, an insular cortex injection resulted in wide- spread adrenergic, thalamic, limbic, and cortical labeling (unpublished observations). Further study of the cingulate, frontal, piriform, insular, entorhinal, and motor cortices is warranted.
CONCLUSION We have demonstrated that use of the a-herpes virus can
be a specific transneuronal marker for infections initiated in the cerebellum in the rat and gerbil. Small pressure injections of virus ( - 16,000 pfu) are sufficient to initiate infection. The results support several earlier single-stage anatomical studies, and present the opportunity to observe the entire vestibulo-olivo-cerebellar network in growing
complexity with an increase in incubation time. Injection of other regions of the cerebellar or cerebral cortex should yield new information using this technique. The findings agree with an emerging concept of the vestibular system as an assemblage interdigitating with a wide spectrum of other sensory systems in the brainstem. The data show the presence of a strong vestibulocerebellar projection from the z vestibular nucleus. We also show evidence for a nigral- tectal-I0 link and extend evidence for oculomotor-related and accessory optic system projections to the VOC axis. Our findings suggest that the raphe, reticular, and periaqueduc- tal gray regions of the brainstem are also closely connected to the VOC. In addition, the data support intracerebellar commissural projections between floccular and parafloccu- lar lobes and the nodulus and uvula. Multisynaptic inputs to the VOC also include the entorhinal, insular and cingu- late cortices, septum, hippocampus, and hypothalamus. Finally, the pattern of connections observed using PRV, while not likely a complete representation of inputs and outputs to the injection site, reveals functional clues regard- ing these systems based on that specificity. As more is known about the molecular events controlling synaptic virion transfer, such information will help to categorize neuronal function.
ACKNOWLEDGMENTS We are greatly appreciative of the advice provided by Dr.
L. W. Enquist. We also thank Heather McMullen for hcr technical assistance. This work is supported in part by NASA NAG 2-26, NIH DC-00385, and DC-00111.
LITERATURE CITED Akbarian, S., O.J. Grusser, and W.O. Guldin (1992) Thalamic connections of
the vestibular cortical fields in the squirrel monkey (Saimiri sciureus). J. Comp. Neurol. 326:423441.
Akbarian, S., O.J. Grusser, and W.O. Guldin (1994) Corticofugal connections between the cerebral cortex and brainstem vestibular nuclei in the Macaque monkey. J. Comp. Neurol. 339:421437.
Armstrong, D.M., B. Cogdell, and R.J. Harvey (1973) Firing patterns of Purkinje cells in the cat cerebellum for different maintained positions of the limbs. Brain Res. 50:452456.
Augustine, J.R. (1985) The insular lobe in primates including humans. Neurol. Res. 72-10.
Azzena, G.B., 0. Mameli, and E. Tolu (1983) Convergence of central and peripheral signals on vestibular cells. Acta Oto Laryngologica 95257- 262.
Azzena, G.B., F. Melis, M.A. Caria, G.P. Teatini, and G. Bozzo (1993) Vestibular projections to hypothalamic supraoptic and paraventricular nuclei. Archives Italiennes de Biologie 131: 127-136.
Barmack, N.H., M. Fagerson, and P. Errico (1993a) Cholinergic projection to the dorsal cap of the inferior olive of the rat, rabbit, and monkey. J. Comp. Neurol. 328:263-281.
Barmack, N.H., M. Fagerson, B.J. Fredette, E. Mugnaini, and H. Shojaku (1993b) Activity of neurons in the beta-nucleus of the inferior olive of the rabbit evoked by natural vestibular stimulation. Exp. Brain Res. 94203- 215.
Bernard, J.F. (1987) Topographical organization of olivocerebellar and corticonuclear connections in the rat: An WGA-HRP study. I. Lobules IX, X, and the flocculus. J. Comp. Neurol. 263:241-258.
Blanks, R.H., W. Precht, and Y. Torigoe (1983) Afferent projections to the cerebellar flocculus in the pigmented rat demonstrated by retrograde transport of horseradish peroxidase. Exp. Brain Res. 52293-306.
Blessing, W.W., Z.Q. Ding, Y.-W. Li, and Z.J. Gieroba (1994) Transneuronal labeling of the CNS neurons with herpes simplex virus. Prog. Neurobiol. 44:37-53.
Brodal, A., and P. Brodal(1985) Observations on the secondary vestibulocer- ebellar projections in the macaque monkey. Exp. Brain Res. 58:62-74.
522
Buisseretdelmas, C., N. Yatim, P. Buisseret, and P. Angaut (1993) The x-zone and CX-subzone of the cerebellum in the rat. Neurosci. Res. 16195-207.
Cadet, J.L., P.A. Della, and E. London (1989) Involvement of nigrotecto- reticulospinal pathways in the iminodipropionitrile (IDPN) model of spasmodic dyskinesias: A 2-deoxy-D-[l-14Clglucose study in the rat. Brain Res. 484:57-64.
Card, J.P., L. Rinaman, R.B. Lynn, B.H. Lee, R.P. Meade, R.R. Miselis, and L.W. Enquist (1993) Pseudorabies virus infection of the rat central nervous system: Ultrastructural characterization of viral replication, transport, and pathogenesis. J. Neurosci. 132515-2539.
Card, J.P., L. Rinaman, J.S. Schwaber, R.R. Miselis, M.E. Whealy, A.K. Robbins, and L.W. Enquist (1990) Neurotropic properties of pseudora- bies virus: Uptake and transneuronal passage in the rat central nervous system. J. Neurosci. 10:1974-1994.
Card, J.P., M.E. Whealy,A.K. Robbins, R.Y. Moore, andL.W. Enquist (1991) Two alpha-herpesvirus strains are transported differentially in the rodent visual system. Neuron 6:957-969.
Cornwall, J., J.D. Cooper, and O.T. Phillipson (1990) Afferent and efferent connections of the laterodorsal termental nucleus in the rat. Brain Res. Bull. 25:271-284.
Cowie, R.J., and G. Holstege (1992) Dorsal mesencephalic projections to pons, medulla, and spinal Cord in the ca t Limbic and non-limbic components. J. Comp. Neurol. 319:53&559.
Dezeeuw, C.I., N.M. Gerrits, J. Voogd, C.S. Leonard, and J.I. Simpson (1994) The rostral dorsal cap and ventrolateral outgrowth of the rabbit inferior olive receive a GABAergic input from dorsal group Y and the ventral dentate nucleus. J. Comp. Neurol. 341:420-432.
Dezeeuw, C.I., and T. Ruigrok (1994) Olivary projecting neurons in the nucleus of Darkschewitsch in the cat receive excitatory monosynaptic input from the cerebellar nuclei. Brain Res. 653:345-350.
DeZeeuw, C.I., P. Wentzel, and E. Mugnaini (1993) Fine structure of the dorsal cap of the inferior olive and its GABAergic and non-GABAergic input from the nucleus prepositus h.ypoglossi in rat and rabbit. J. Comp. Neurol. 32763-82.
Eisenman, L.M., D.D. Sieger, and G.J. Blatt (1983) The olivocerebellar projection to the nodulus in the mouse. J. Comp. Neurol. 221 :53-59.
Falser, N., I. Bandtlow, M. Haus, and H. Wolf (1986) Detection of pseudora- bies virus DNA in the inner ear of intranasally infected BALBic mice with nucleic acid hybridization in situ. J. Virol. 57335339,
Fox, R.A., M. Corcoran, and K.R. Brizzee (1990) Conditioned taste aversion and motion sickness in cats and squirrel monkeys. Can. J. Phys. Pharmacol. 68:269-278.Fredette, B.J., J.C. Adams, and E. Mugnaini (1992) GABAergic neurons in the mammalian inferior olive and ventral medulla detected by glutamate decarboxylase immunocytochemistry. J. Comp. Neurol. 321:501-514.
Fredette, B.J., and E. Mugnaini (1991) The GABAergic cerebello-olivary projection in the rat. Anat Embryol. 184:225-243.
Friberg, L., T.S. Olsen, P.E. Roland, O.B. Paulson, and N.A. Lassen (1985) Focal increase of blood flow in the cerebral cortex of man during vestibular stimulation. Brain 108:609-623.
Fuhrman, Y., M.A. Thomson, G. Piat, J. Mariani, and N. Delhayebouchaud (1994) Enlargement of olivo-cerebellar microzones in the agranular cerebellum of adult rats. Brain Res. 638:277-284.
Giolli, R.A., R.H. Blanks, Y. Torigoe, and D.D. Williams (1985) Projections of medial terminal accessory optic nucleus, ventral tegmental nuclei, and substantia nigra of rabbit and rat as studied by retrograde axonal transport of horseradish peroxidase. J. Comp. Neurol. 23299-116.
Haxhiu, M.A., A.S. Jansen, N.S. Cherniack, and A.D. Loewy (1993) CNS innervation of airway-related parasympathetic preganglionic neurons: A transneuronal labeling study using pseudorabies virus. Brain Res. 61 8: 115-134.
Holstege, G., and R.J. Cowie (1990). Nucleus prepositus hypoglossi projects to the dorsolateral periaqueductal gray (PAG): A link between visuomo- tor and limbic systems. St. Louis, MO: Society for Neuroscience Ab- stracts. 16: Abst. 303.3.
Hoover, J.E., and P.L. Strick (1993) Multiple output channels in the basal ganglia. Science 259:819-821.
Horii, A,, N. Takeda, T. Matsunaga, A. Yamatodani, T. Mochizuki, K. Okakura-Mochizuki, and H. Wada (1993) Effect of unilateral vestibular stimulation on histamine release from the hypothalamus of rats in vivo. J. Neurophysiol. 70:1822-1826.
Irle, E., M. Sarter, W.O. Guldin, and H.J. Markowitsch (1984) Afferent fibers to the ventral tegmental nucleus of Gudden in the mouse, rat, and cat. J.
G.D. KAUFMAN ET AL.
Ito, M. (1972) Neural design of the cerebellar motor control system. Brain Res. 4080-84.
Jansen, A.S., G.J. Ter Horst, T.C. Mettenleiter, and A.D. Loewy (1992) CNS cell groups projecting to the submandibular parasympathetic pregangli- onic neurons in the rat: A retrograde transneuronal viral cell body labeling study. Brain Res. 572253-260.
Jones, T.C., and R.D. Hunt (1983). Veterinary Pathology. 5th ED. Philadel- phia: Lea and Febiger.
Kaufman, G.D., J.H. Anderson, and A.J. Beitz (1992a) Brainstem Fos expression following unilateral labyrinthectomy in the rat. NeuroReport 3829-832.
Kaufman, G.D., J.H. Anderson, and A.J. Beitz (1992b) Fos-defined activity in rat brainstem following centripetal acceleration. J. Neurosci. 124489- 4500.
Kaufman, G.D., J.H. Anderson, and A.J. Beitz (1993) Otolith-brain stem connectivity: Evidence for differential neural activation by vestibular hair cells based on quantification of FOS expression in unilateral labyrinthectomized rats. J. Neurophysiol. 70: 117-127.
Kaufman, G.D., and A.A. Perachio (1994) Translabyrinth electrical stimula- tion for the induction of immediate early genes in the gerbil brainstem. Brain Res. 646:345-350.Kosinski, R., S. Azizi, and G. Mihailoff (1988) Convergence of cortico- and cuneopontine projections onto components of the pontocerebellar system in the r a t An anatomical and electrophysi- ological study. Exp. Brain Res. 71 :541-546.
Kotchabhakdi, N., E. Rinvik, F. Walberg, and K. Yingchareon (1980) The vestibulothalamic projections in the cat studied by retrograde axonal transport of horseradish peroxidase. Exp. Brain Res. 40:405418.
Lan, C.T., C.Y. Wen, G.F. Tseng, C.K. Tan, E.A. Ling, and J.Y. Shieh (1994) Efferent connections from the external cuneate nucleus to the medulla oblongata in the gerbil. Brain Res. 668:107-116.
Langer, T., A.F. Fuchs, C.A. Scudder, and M.C. Chubb (1985a) Afferent fibers to the flocculus of the cerebellum in the Rhesus Macaque as revealed by retrograde transport of horseradish peroxidase. J. Comp. Neurol.. 235:l-25.
Langer, T., A.F. Fuchs, C.A. Scudder, and M.C. Chubb (198513) Flocculus efferents in the Rhesus Macaque as revealed by autoradiography and horseradish peroxidase. J. Comp. Neurol. 23526-37.
Leichnetz, G.R., S.G.P. Hardy, and M.K. Carruth (1987) Frontal Projection to the Region of the Oculomotor Complex in the Rat: A Retrograde and Anterograde HRP Study. JCN 263:387-399.
Licata, F., G.L. Volsi, G. Maugeri, L. Ciranna, and F. Santangelo (1993) Effects of noradrenaline on the firing rate of vestibular neurons. Neuroscience 53: 149-158.
Lisberger, S.G. (1988) The neural basis for learning of simple motor skills. Science 242:72%735.
Lisberger, S.G., T.A. Pavelko, and D.M. Broussard (1994) Neural basis for motor learning in the vestibuloocular reflex of primates. I. Changes in the response of brain stem neurons. J. Neurophysiol. 72:92%953.
Llinas, R., and Y. Yarom (1986) Oscillatory properties of guinea-pig inferior olivary neurones and their pharmacological modulation: an in vitro study. J. Physiol. (Lond). 376163-182.
Losier, B.J., and K. Semba (1993) Dual projections of single cholinergic and aminergic brainstem neurons to the thalamus and basal forebrain in the rat. Brain Res. 604:41-52.
Lynch, J.C., J.E. Hoover, and P.L. Strick (1994) Input to the primate frontal eye field from the substantia nigra, superior colliculus, and dentate nucleus demonstrated by transneuronal transport. Exp. Brain Res. 100: 181-186.
Manzoni, D., 0. Pempeiano, C.D. Barnes, G. Stampacchia, and P. d’Ascanio (1989) Resonses of locus coeruleus neurons to convergent neck and vestibular inputs. Acta Otol. 468:129-135.
McCormick, D.A., J.E. Steinmetz, and R.F. Thompson (1985) Lesions of the inferior olivary complex cause extinction of the classically conditioned eyeblink response. Brain Res. 359:120-130.
Mehler, W.R., and J.A. Rubertone (1985) Anatomy of the vestibular nucleus complex. In G. Paxinos (eds): The Rat Nervous System, Volume 2: Hindbrain and Spinal Cord, 2. Australia: Academic Press, Ch. 9.
Melis, F., M. Caria, and G.B. Azzena (1986) Vestibular projection to the area postrema. Neurosci. Lett. Supplementum 26:%297.
Mergner, T., W. Becker, and L. Deecke (1985) Canal-neck interaction in vestibular neurons of the cat’s cerebral cortex. Exp. Brain Res. 61 :94- 108.
Middleton, F.A., and P.L. Strick (1994) Anatomical evidence for cerebellar and basal ganglia involvement in higher comitive function. Science . .
Comp. Neurol. %8:509-541. 266:458461.
NEURONAL PATHWAYS TO THE VESTIBULOCEREBELLUM 523
Miles, F.A., and S.G. Lisberger (1981) The “error” signals subserving adaptive gain control in the primate vestibulo-ocular reflex. Ann. NY Acad. Sci. 374:513-525.
Mustari, M.J., A.F. Fuchs, C.R.S. Kaneko, and F.R. Robinson (1994) Anatomical connections of the primate pretectal nucleus of the optic tract. J. Comp. Neurol. 349:lll-128.
Odkvist, L.M., S. Liedgreen, B. Larsby, and L. Jerlvall(1975) Vestibular and somatosensory inflow to the vestibular projection area in the post cruciate dimple region of the cat cerebral cortex. Exp. Brain Res. 22:185-196.
Olazabal, U.E., and J.K. Moore (1989) Nigrotectal projection to the inferior colliculus: horseradish peroxidase transport and tyrosine hydroxylase immunohistochemical studies in rats, cats, and bats. J. Comp. Neurol. 282:98-118.
O’Mara, S.M., E.T. Rolls, A. Berthoz, and R.P. Kesner (1994) Neurons responding to whole-body motion in the primate hippocampus. J. Neurosci. 14:6511-6523.
Paige, G.D., and E.W. Sargent (1991) Visually-induced adaptive plasticity in the human vestibulo-ocular reflex. Exp. Brain Res. 84:25-34.
Paxinos, G., and C. Watson (1986). The Rat Brain in Stereotaxic Coordi- nates, 2nd edition. Orlando: Academic Press.
Pelisson, D., C. Prablanc, and C. Urquizar (1988) Vestibuloocular reflex inhibition and gaze saccade control characteristics during eye-head orientation in humans. J. Neurophysiol. 59997-1013.
Perachio, A.A., and G.A. Kevetter (1989) Identification of vestibular efferent neurons in the gerbil Histocbemical and retrograde labeling. Exp. Brain Res. 78:315-326.
Rinaman, L., J.P. Card, and L.W. Enquist (1993) Spatiotemporal responses of astrocytes, ramified microglia, and brain macrophages to central neuronal infection with pseudorabies virus. J. Neurosci. 13:685-702.
Robinson, D.A. (1992) Implications of neural networks for how we think about brain function. Behav Brain Sci. 15644-655.
Ruigrok, T., R.J. Osse, and J. Voogd (1992) Organization of inferior olivary projections to the flocculus and ventral paraflocculus of the rat cerebel- lum. J. Comp. Neurol. 316:129-150.
Sehneider, J.S., C. Manetto, and T.I. Lidsky (1985) Substantia nigra projection to medullary reticular formation: Relevance to oculomotor and related motor functions in the cat. Neurosci. Lett. 62:l-6.
Schramm, L.P., A.M. Strack, K.B. Platt, and A.D. Loewy (1993) Peripheral and central pathways regulating the kidney: A study using pseudorabies virus. Brain Res. 616251-262.
Sharp, P.E., H.T. Blair, D. Etkin, and D.B. Tzanetos (1995) Influences of vestibular and visual motion information on the spatial firing patterns of bippocampal place cells. J. Neurosci. 15173-189.
Soodak, R.E., and J.I. Simpson (1988) The accessory optic system of rabbit. I. Basic visual response properties. J. Neurophysiol. 60:2037-2054.
Spence, S.J., and J.A. Saint-Cyr (1988) Comparative topography of projec- tions from the mesodiencephalic junction to the inferior olive, vestibular nuclei, and upper cervical cord in the cat. J. Comp. Neurol. 268:357-374.
Spencer, S.E., W.B. Sawyer, H. Wada, K.B. Platt, and A.D. Loewy (1990) I CNS projections to the pterygopalatine parasympathetic preganglionic
neurons in the rat: a retrograde transneuronal viral cell body labeling study. Brain Res. 534:149-169.
Standish, A,, and L.W. Enquist (1994) Technical comments: Viral tracing of innervation. Science 265 121-122.
.Standish, A,, L.W. Enquist, and J.S. Schwaber (1994) Innervation of the heart and its central medullary origin defined by viral tracing. Science 263:232-234.
Strack, A.M., W.B. Sawyer, J.H. Hughes, K.B. Platt, andA.D. Loewy (1989) A general pattern of CNS innervation of the sympathetic outflow demonstrated by transneuronal pseudorabies viral infections. Brain Res. 491: 156-162.
Swenson, R.S., and A.J. Castro (1983) The afferent connections of the inferior olivary complex in rats: An anterograde study using autoradio- graphic and axonal degeneration techniques. Neuroscience 8:259-275.
Takeda, N., M. Morita, S. Hasegawa, A. Horii, T. Kubo, and T. Matsunaga (1993) Neuropharmacology of motion sickness and emesis: A review. Acta Oto Laryngol., Supplementum 501 :lo-15
Takeda, T., and K. Maekawa (1989) Olivary branching projections to the flocculus, uvula and nodulus in the rabbit. 11. Retrograde double labeling study with fluorescent dyes. Exp. Brain Res. 76323-332.
Terubayashi, H., and H. Fujisawa (1984) The accessory optic system of rodents: A whole-mount HRP study. J. Comp. Neurol. 227285-295.
Thompson, A.M., K.R. Moore, and G.C. Thompson (1994) Distribution and origin of serotoninergic alTerents to guinea pig cochlear nucleus. J. Comp. Neurol. 351:104-116.
Tomlinson, R., and P. Bahra (1986) Combined eye-head gaze shifts in primates 2: Interactions between saccades and thevestibuloocular reflex. J. Neurophys. 561558-1570.
Torigoe, Y., R.H. Blanks, and W. Precht (1986a) Anatomical studies on the nucleus reticularis tegmenti pontis in the pigmented rat. I. Cytoarchitec- ture, topography, and cerebral cortical afferent fibers. J. Comp. Neurol. 243:71-87.
Torigoe, Y., R.H. Blanks, and W. Precht (1986b) Anatomical studies on the nucleus reticularis tegmenti pontis in the pigmented rat. 11. Subcortical afferent fibers demonstrated by the retrograde transport of horseradish peroxidase. J. Comp. Neurol. 243:88-105.
Tuohimaa, P., E. Aantaa, K. Toukoniitty, and P. Makela (1983) Studies of vestibular cortical areas with short-living 1502 isotopes. J. Oto-Rhino- Laryngol. Related Specialties 45315-321.
Ugolini, G. (1995) Specificity of rabies virus as a transneuronal tracer of motor networks: Transfer from hypoglossal motorneurons to connected second-order and higher order central nervous system cell groups. J. Comp. Ncurol. 356457 480.
Vertes, R.P., and B. Kocsis (1994) Projections of the dorsal raphe nucleus to the brainstem: PHA-L analysis in the rat. J. Comp. Neurol. 34O:ll-26.
Walberg, F., and E. Dietrichs (1988) The interconnection between the vestibular nuclei and the uvula: A study of reciprocity. Brain Res. 449:47-53.
Watanabe, S., I. Kato, S. Sato, and M. Norita (1993) Direct projection from the nucleus of the optic tract to the medial vestibular nucleus in the cat. Neurosci Res. 17325329.
Mealy, M.E., J.P. Card, A.K. Robbins, J.R. Dubin, H.J. Rziha, and L.W. Enquist (1993) Specific pseudorabies virus infection of the rat visual system requiRes: Both gI and gp63 glycoproteins. J. Virol. 6 7 3 7 8 6 3797.
Willcox, B.J., P. Poulin, W.L. Veale, and Q.J. Pittman (1992) Vasopressin- induced motor effects: localization of a sensitive site in the amygdala. Brain Res. 59658-64.
Yates, B.J., T. Goto, and P.S. Bolton (1993) Responses of neurons in the rostralventrolateral medulla of the cat to natural vestibular stimulation. Brain Res. 601 :255-264.
Zarzecki, P., P.S. Blum, D.A. Bakker, and D. Herman (1983) Convergence of sensory inputs upon projection neurons of somatosensory cortex: vestibu- lar, neck, head, and forelimb inputs. Exp. Brain Res. 50:408414.