Embed Size (px)
Citation preview
Transnational Corporation of Nigeria Plc
Unaudited Condensed Consolidated Financial Statements
For the Period Ended 30 Sept 2018
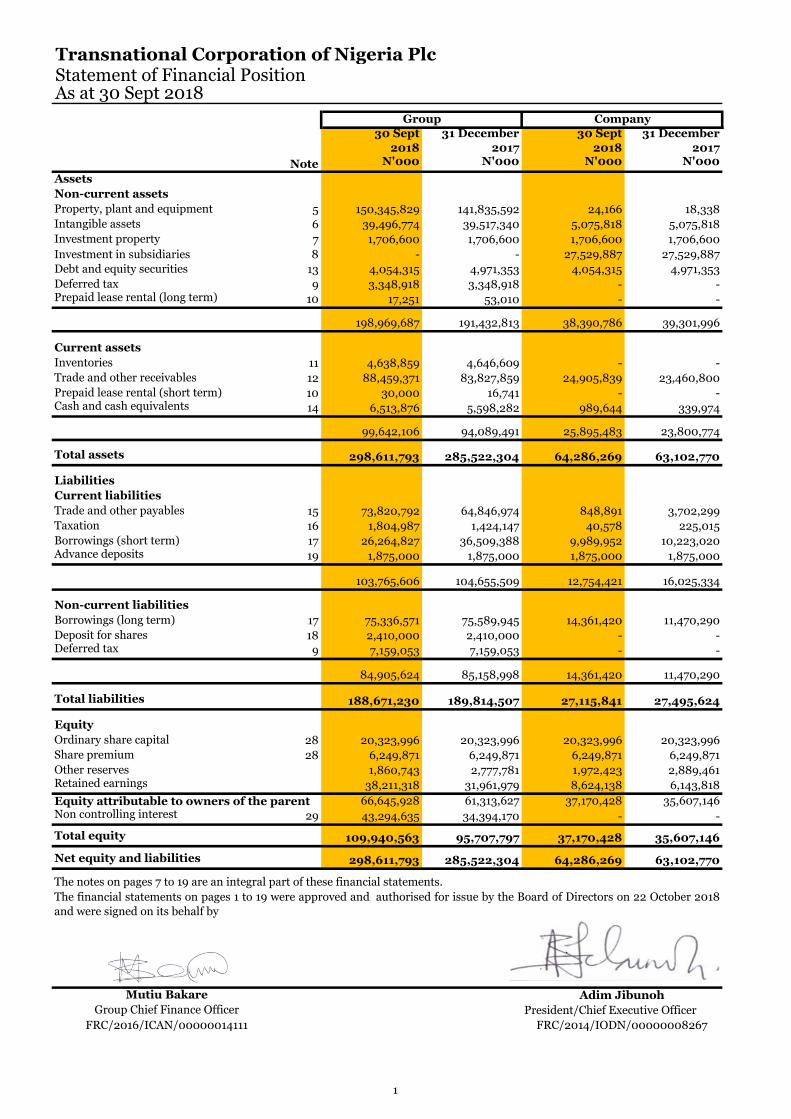
Transnational Corporation of Nigeria PlcStatement of Financial PositionAs at 30 Sept 2018
30 Sept
2018
31 December
2017
30 Sept
2018
31 December
2017
Note N'000 N'000 N'000 N'000
Assets
Non-current assets
Property, plant and equipment 5 150,345,829 141,835,592 24,166 18,338
Intangible assets 6 39,496,774 39,517,340 5,075,818 5,075,818
Investment property 7 1,706,600 1,706,600 1,706,600 1,706,600
Investment in subsidiaries 8 - - 27,529,887 27,529,887
Debt and equity securities 13 4,054,315 4,971,353 4,054,315 4,971,353
Deferred tax 9 3,348,918 3,348,918 - - Prepaid lease rental (long term) 10 17,251 53,010 - -
198,969,687 191,432,813 38,390,786 39,301,996
Current assets
Inventories 11 4,638,859 4,646,609 - -
Trade and other receivables 12 88,459,371 83,827,859 24,905,839 23,460,800
Prepaid lease rental (short term) 10 30,000 16,741 - - Cash and cash equivalents 14 6,513,876 5,598,282 989,644 339,974
99,642,106 94,089,491 25,895,483 23,800,774
Total assets 298,611,793 285,522,304 64,286,269 63,102,770
Liabilities
Current liabilities
Trade and other payables 15 73,820,792 64,846,974 848,891 3,702,299
Taxation 16 1,804,987 1,424,147 40,578 225,015
Borrowings (short term) 17 26,264,827 36,509,388 9,989,952 10,223,020 Advance deposits 19 1,875,000 1,875,000 1,875,000 1,875,000
103,765,606 104,655,509 12,754,421 16,025,334
Non-current liabilities
Borrowings (long term) 17 75,336,571 75,589,945 14,361,420 11,470,290
Deposit for shares 18 2,410,000 2,410,000 - - Deferred tax 9 7,159,053 7,159,053 - -
84,905,624 85,158,998 14,361,420 11,470,290
Total liabilities 188,671,230 189,814,507 27,115,841 27,495,624
Equity
Ordinary share capital 28 20,323,996 20,323,996 20,323,996 20,323,996
Share premium 28 6,249,871 6,249,871 6,249,871 6,249,871
Other reserves 1,860,743 2,777,781 1,972,423 2,889,461 Retained earnings 38,211,318 31,961,979 8,624,138 6,143,818
Equity attributable to owners of the parent 66,645,928 61,313,627 37,170,428 35,607,146 Non controlling interest 29 43,294,635 34,394,170 - -
Total equity 109,940,563 95,707,797 37,170,428 35,607,146
Net equity and liabilities 298,611,793 285,522,304 64,286,269 63,102,770
Mutiu Bakare
Group Chief Finance Officer
FRC/2016/ICAN/00000014111
Group Company
The notes on pages 7 to 19 are an integral part of these financial statements.
The financial statements on pages 1 to 19 were approved and authorised for issue by the Board of Directors on 22 October 2018
and were signed on its behalf by
Adim Jibunoh
President/Chief Executive Officer
FRC/2014/IODN/00000008267
1
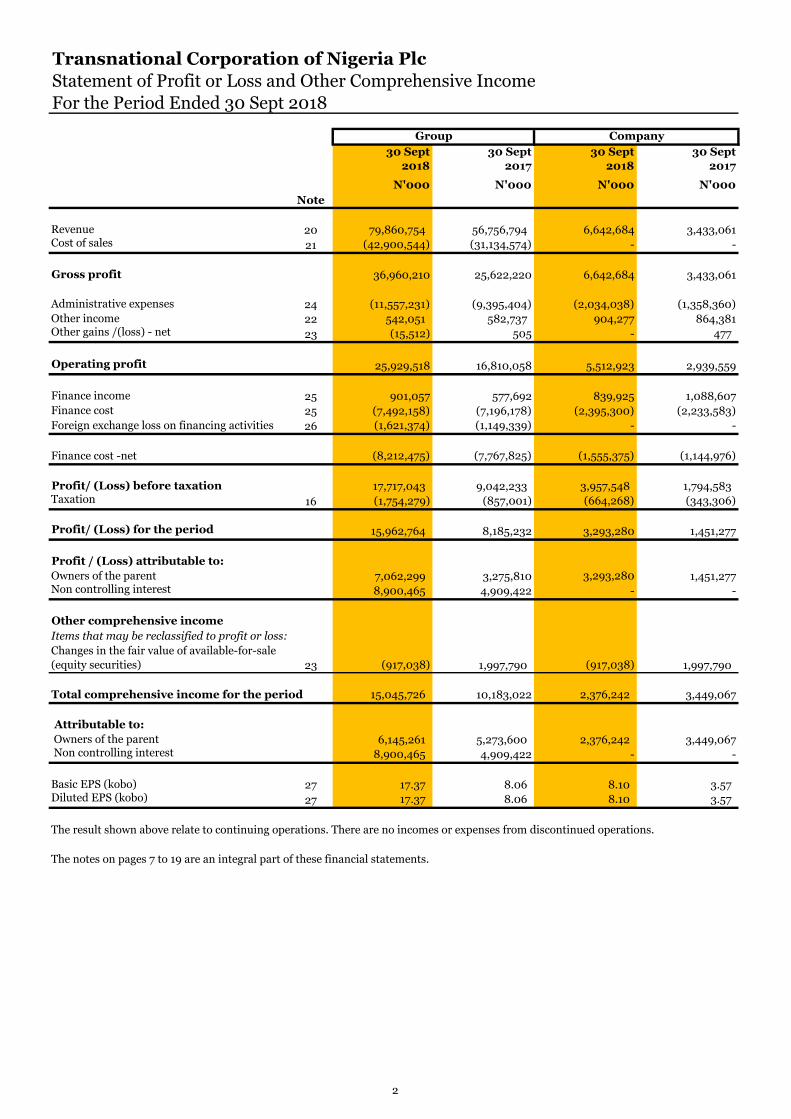
Transnational Corporation of Nigeria Plc
Statement of Profit or Loss and Other Comprehensive Income
For the Period Ended 30 Sept 2018
30 Sept
2018
30 Sept
2017
30 Sept
2018
30 Sept
2017
N'000 N'000 N'000 N'000
Note
Revenue 20 79,860,754 56,756,794 6,642,684 3,433,061 Cost of sales 21 (42,900,544) (31,134,574) - -
Gross profit 36,960,210 25,622,220 6,642,684 3,433,061
Administrative expenses 24 (11,557,231) (9,395,404) (2,034,038) (1,358,360)
Other income 22 542,051 582,737 904,277 864,381 Other gains /(loss) - net 23 (15,512) 505 - 477
Operating profit 25,929,518 16,810,058 5,512,923 2,939,559
Finance income 25 901,057 577,692 839,925 1,088,607
Finance cost 25 (7,492,158) (7,196,178) (2,395,300) (2,233,583)
Foreign exchange loss on financing activities 26 (1,621,374) (1,149,339) - -
Finance cost -net (8,212,475) (7,767,825) (1,555,375) (1,144,976)
Profit/ (Loss) before taxation 17,717,043 9,042,233 3,957,548 1,794,583 Taxation 16 (1,754,279) (857,001) (664,268) (343,306)
Profit/ (Loss) for the period 15,962,764 8,185,232 3,293,280 1,451,277
Profit / (Loss) attributable to:
Owners of the parent 7,062,299 3,275,810 3,293,280 1,451,277 Non controlling interest 8,900,465 4,909,422 - -
Other comprehensive income
Items that may be reclassified to profit or loss:
Changes in the fair value of available-for-sale
(equity securities) 23 (917,038) 1,997,790 (917,038) 1,997,790
Total comprehensive income for the period 15,045,726 10,183,022 2,376,242 3,449,067
Attributable to:
Owners of the parent 6,145,261 5,273,600 2,376,242 3,449,067 Non controlling interest 8,900,465 4,909,422 - -
Basic EPS (kobo) 27 17.37 8.06 8.10 3.57 Diluted EPS (kobo) 27 17.37 8.06 8.10 3.57
The result shown above relate to continuing operations. There are no incomes or expenses from discontinued operations.
The notes on pages 7 to 19 are an integral part of these financial statements.
Group Company
2
Transnational Corporation of Nigeria Plc
Statement of Profit or Loss and Other Comprehensive Income
For the Period Ended 30 Sept 2018
July - Sept
2018
July - Sept
2017
July - Sept
2018
July - Sept
2017
N'000 N'000 N'000 N'000
Note
Revenue 20 25,771,287 22,582,932 2,364,617 1,377,599 Cost of sales 21 (13,383,702) (11,835,742) - -
Gross profit 12,387,585 10,747,190 2,364,617 1,377,599
Administrative expenses 24 (3,940,073) (3,746,811) (680,254) (530,895)
Other income 22 137,482 276,772 261,961 268,833 Other gains /(loss) - net 23 (2,198) (4,155) - 477
Operating profit 8,582,796 7,272,996 1,946,324 1,116,014
Finance income 25 428,470 143,049 414,321 369,339
Finance cost 25 (2,478,711) (2,494,706) (803,658) (695,008)
Foreign exchange loss on financing activities 26 (759,582) (427,632) - -
Finance cost -net (2,809,823) (2,779,289) (389,337) (325,669)
Profit/ (Loss) before taxation 5,772,973 4,493,707 1,556,987 790,345 Taxation 16 (685,539) (488,475) (236,461) (137,760)
Profit/ (Loss) for the period 5,087,434 4,005,232 1,320,526 652,585
Profit / (Loss) attributable to:
Owners of the parent 2,345,950 1,686,099 1,320,526 652,585 Non controlling interest 2,741,484 2,319,133 - -
Other comprehensive income
Items that may be reclassified to profit or loss:
Changes in the fair value of available-for-sale
(equity securities) 23 (1,013,461) (57,987) (1,013,461) (57,987)
Total comprehensive income for the period 4,073,973 3,947,245 307,065 594,598
Attributable to:
Owners of the parent 1,332,489 1,628,112 307,065 594,598 Non controlling interest 2,741,484 2,319,133 - -
Basic EPS (kobo) 27 5.77 4.15 3.25 1.61 Diluted EPS (kobo) 27 5.77 4.15 3.25 1.61
The result shown above relate to continuing operations. There are no incomes or expenses from discontinued operations.
The notes on pages 7 to 19 are an integral part of these financial statements.
Group Company
3
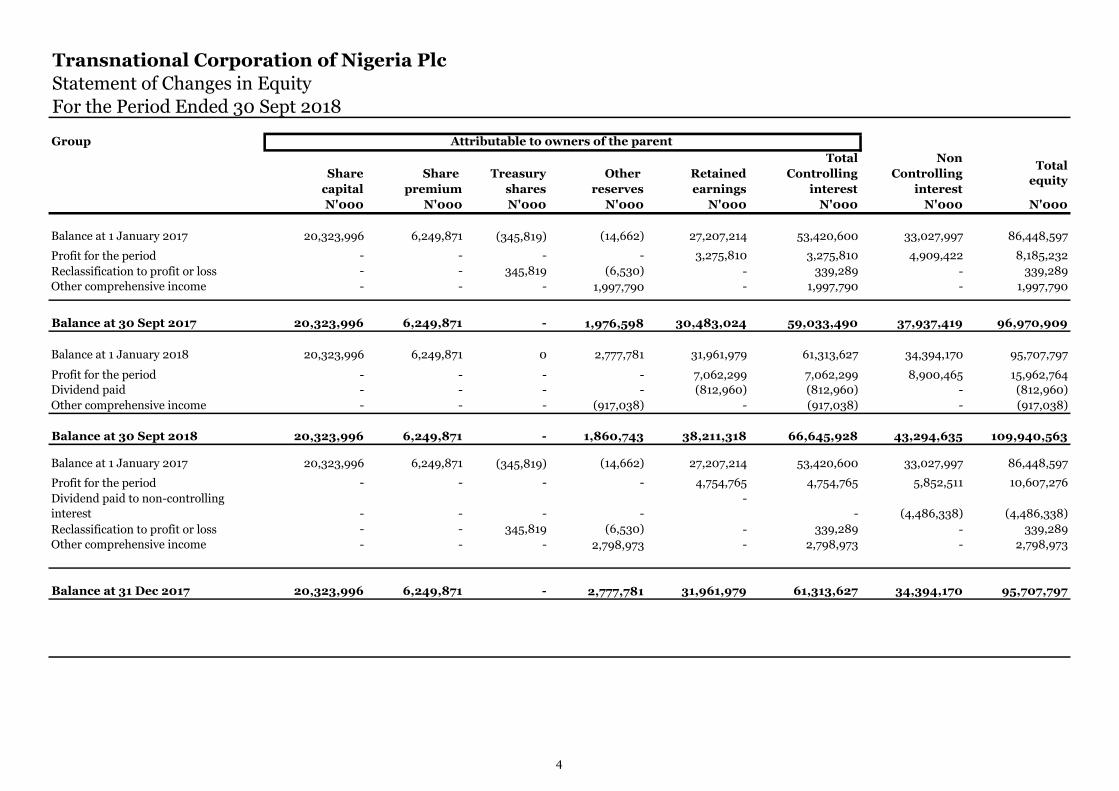
Transnational Corporation of Nigeria Plc
Statement of Changes in Equity
For the Period Ended 30 Sept 2018
Group
Total Non
Share Share Treasury Other Retained Controlling Controlling
capital premium shares reserves earnings interest interest
N'000 N'000 N'000 N'000 N'000 N'000 N'000 N'000
Balance at 1 January 2017 20,323,996 6,249,871 (345,819) (14,662) 27,207,214 53,420,600 33,027,997 86,448,597
Profit for the period - - - - 3,275,810 3,275,810 4,909,422 8,185,232
Reclassification to profit or loss - - 345,819 (6,530) - 339,289 - 339,289
Other comprehensive income - - - 1,997,790 - 1,997,790 - 1,997,790
Balance at 30 Sept 2017 20,323,996 6,249,871 - 1,976,598 30,483,024 59,033,490 37,937,419 96,970,909
Balance at 1 January 2018 20,323,996 6,249,871 0 2,777,781 31,961,979 61,313,627 34,394,170 95,707,797
Profit for the period - - - - 7,062,299 7,062,299 8,900,465 15,962,764
Dividend paid - - - - (812,960) (812,960) - (812,960)
Other comprehensive income - - - (917,038) - (917,038) - (917,038)
Balance at 30 Sept 2018 20,323,996 6,249,871 - 1,860,743 38,211,318 66,645,928 43,294,635 109,940,563 #REF!
Balance at 1 January 2017 20,323,996 6,249,871 (345,819) (14,662) 27,207,214 53,420,600 33,027,997 86,448,597
Profit for the period - - - - 4,754,765 4,754,765 5,852,511 10,607,276
Dividend paid to non-controlling
interest - - - -
-
- (4,486,338) (4,486,338)
Reclassification to profit or loss - - 345,819 (6,530) - 339,289 - 339,289
Other comprehensive income - - - 2,798,973 - 2,798,973 - 2,798,973
Balance at 31 Dec 2017 20,323,996 6,249,871 - 2,777,781 31,961,979 61,313,627 34,394,170 95,707,797
Share Share Treasury Other Retained Controlling
31 December 2016 capital premium shares reserves earnings interest interest
Balance at 31 December 2016 20,323,996 6,249,871 (345,819) (14,662) 27,207,214 53,420,600 33,027,997 86,448,597
Attributable to owners of the parent
Total
equity
4
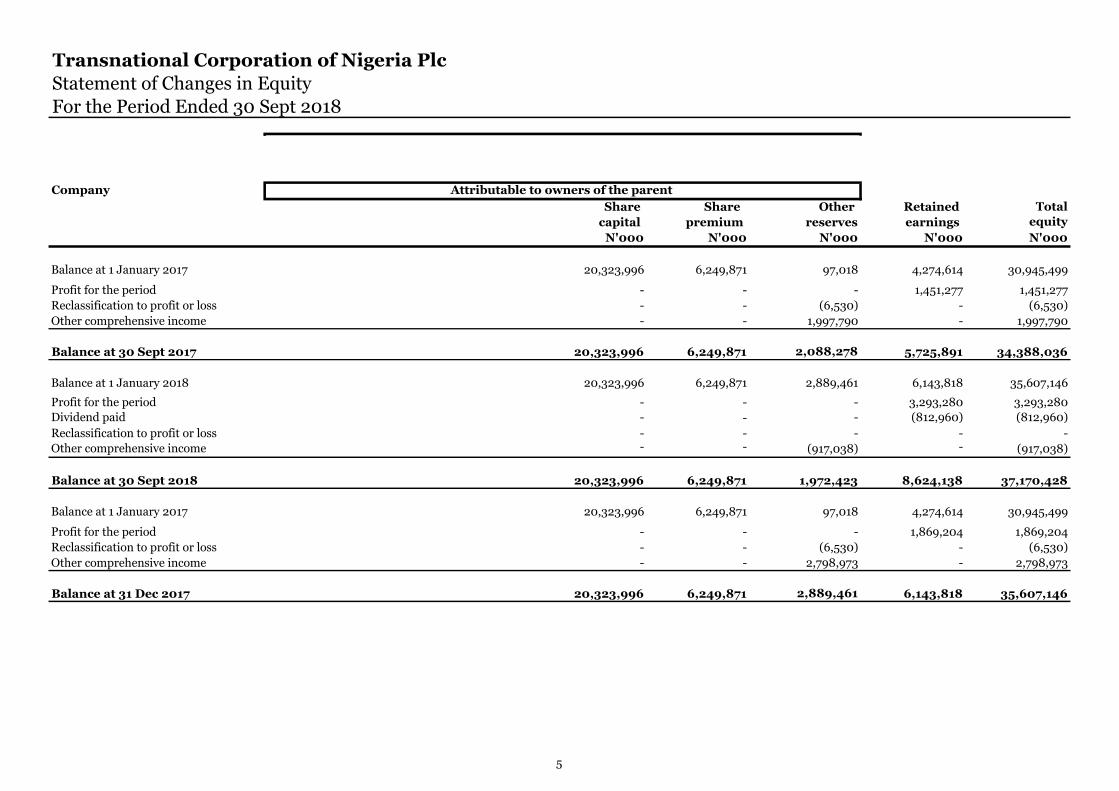
Transnational Corporation of Nigeria Plc
Statement of Changes in Equity
For the Period Ended 30 Sept 2018
Attributable to owners of the parent
Company
Share Share Other Retained
capital premium reserves earnings
N'000 N'000 N'000 N'000 N'000
Balance at 1 January 2017 20,323,996 6,249,871 97,018 4,274,614 30,945,499
Profit for the period - - - 1,451,277 1,451,277
Reclassification to profit or loss - - (6,530) - (6,530)
Other comprehensive income - - 1,997,790 - 1,997,790
Balance at 30 Sept 2017 20,323,996 6,249,871 2,088,278 5,725,891 34,388,036
Balance at 1 January 2018 20,323,996 6,249,871 2,889,461 6,143,818 35,607,146
Profit for the period - - - 3,293,280 3,293,280
Dividend paid - - - (812,960) (812,960)
Reclassification to profit or loss - - - - -
Other comprehensive income - - (917,038) - (917,038)
Balance at 30 Sept 2018 20,323,996 6,249,871 1,972,423 8,624,138 37,170,428
Balance at 1 January 2017 20,323,996 6,249,871 97,018 4,274,614 30,945,499
Profit for the period - - - 1,869,204 1,869,204
Reclassification to profit or loss - - (6,530) - (6,530)
Other comprehensive income - - 2,798,973 - 2,798,973
Balance at 31 Dec 2017 20,323,996 6,249,871 2,889,461 6,143,818 35,607,146
Attributable to owners of the parent
Total
equity
5
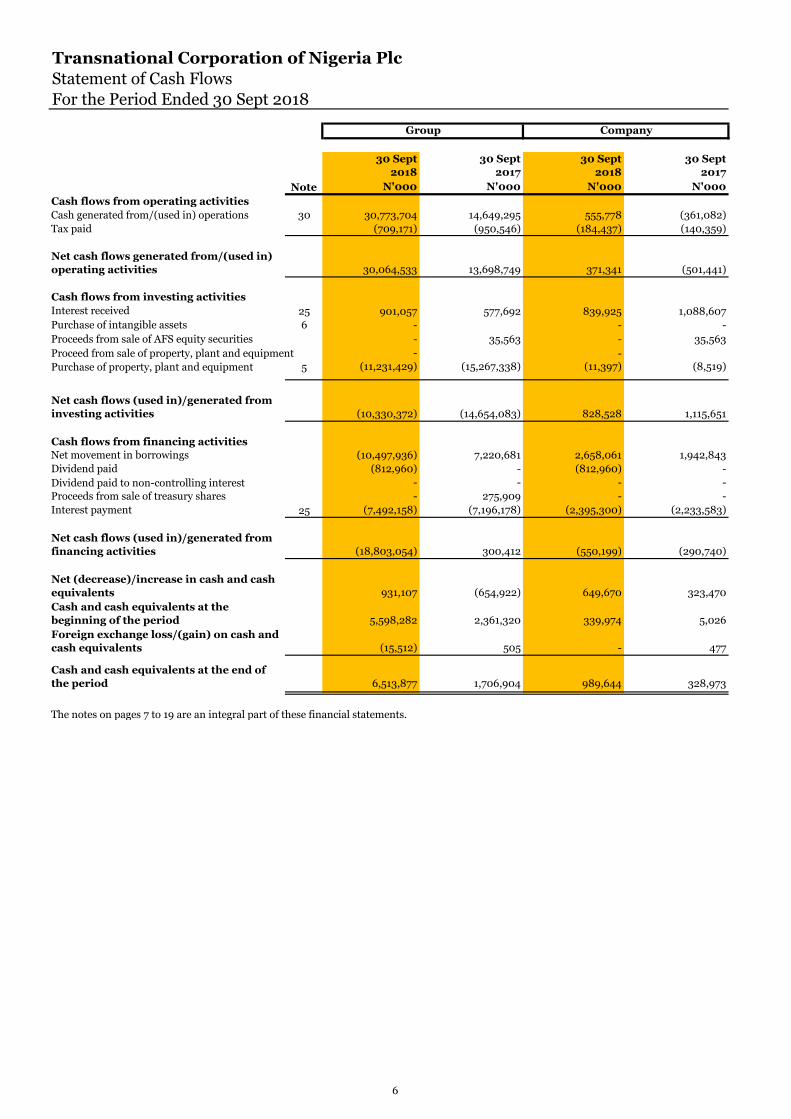
Transnational Corporation of Nigeria Plc
Statement of Cash Flows
For the Period Ended 30 Sept 2018
30 Sept
2018
30 Sept
2017
30 Sept
2018
30 Sept
2017
Note N'000 N'000 N'000 N'000
Cash flows from operating activities
Cash generated from/(used in) operations 30 30,773,704 14,649,295 555,778 (361,082)
Tax paid (709,171) (950,546) (184,437) (140,359)
Net cash flows generated from/(used in)
operating activities 30,064,533 13,698,749 371,341 (501,441)
Cash flows from investing activities
Interest received 25 901,057 577,692 839,925 1,088,607
Purchase of intangible assets 6 - - -
Proceeds from sale of AFS equity securities - 35,563 - 35,563
Proceed from sale of property, plant and equipment - -
Purchase of property, plant and equipment 5 (11,231,429) (15,267,338) (11,397) (8,519)
Net cash flows (used in)/generated from
investing activities (10,330,372) (14,654,083) 828,528 1,115,651
Cash flows from financing activities
Net movement in borrowings (10,497,936) 7,220,681 2,658,061 1,942,843
Dividend paid (812,960) - (812,960) -
Dividend paid to non-controlling interest - - - -
Proceeds from sale of treasury shares - 275,909 - -
Interest payment 25 (7,492,158) (7,196,178) (2,395,300) (2,233,583)
Net cash flows (used in)/generated from
financing activities (18,803,054) 300,412 (550,199) (290,740)
Net (decrease)/increase in cash and cash
equivalents 931,107 (654,922) 649,670 323,470
Cash and cash equivalents at the
beginning of the period 5,598,282 2,361,320 339,974 5,026
Foreign exchange loss/(gain) on cash and
cash equivalents (15,512) 505 - 477
Cash and cash equivalents at the end of
the period 6,513,877 1,706,904 989,644 328,973
The notes on pages 7 to 19 are an integral part of these financial statements.
Group Company
6
Transnational Corporation of Nigeria Plc
Notes to the Financial Statements
For the Period Ended 30 Sept 2018
1. General information
2. Summary of significant accounting policies
2.1 Basis of preparation
The preparation of financial statements, in conformity with generally accepted accounting principles under IFRS,
requires the directors to make estimates and assumptions that affect the reported amounts of assets and liabilities at the
date of the financial statements and the reported amounts of revenues and expenses during the reporting period.
Although these estimates are based on the directors' best knowledge of the amounts, events or actions, actual results
ultimately may differ from those estimates.
The financial statements have been prepared on a historical cost basis except for the fair value basis applied to certain
intangible assets, investment property and equity investments.
All values are rounded to the nearest thousand (N’000), except when otherwise indicated.
Transnational Corporation of Nigeria Plc, ("the Company" or "Transcorp"), was incorporated on 16 November, 2004 as a
private limited liability Company domiciled in Nigeria in accordance with the requirements of the Companies and Allied
Matters Act. Following a successful initial public offer (IPO), the Company was in December 2006, listed on the Nigerian
Stock Exchange. The shares of the Company have continued to be traded on the floor of the Exchange. The Company is
domiciled in Nigeria and the address of its registered office is 38 Glover Road, Ikoyi, Lagos, Nigeria.
The Company maintains controlling interests in the following companies. The Company, together with the subsidiaries
are known as the Transcorp Group, ("the Group")
- Capital Leisure and Hospitality Limited
- Transcorp Hotels Plc
- Transcorp Hotels Calabar Limited
- Transcorp Energy Limited
- Teragro Commodities Limited
- Transcorp Power Limited
- Transcorp Staff Share Ownership Trust Company Limited
- Transcorp Properties Limited
- Transcorp OPL 281 Limited
- Transcorp Telecomms Limited
- Transcorp Trading and Logistic Limited
- Transcorp Refining Company Limited
- Transcorp Hotels Ikoyi Limited
- Transcorp Hotels Port Harcourt Limited
The Company’s business is investment and operation of portfolio companies in the hospitality, power, agro-allied and oil
& gas sectors.
The condensed consolidated financial statements have been prepared in accordance with the Companies and Allied
Matters Act (CAMA), IAS 34 Interim Financial Reporting, International Financial Reporting Standards (IFRS) and
interpretations issued by the IFRS Interpretations Committee (IFRS IC) applicable to companies reporting under IFRS.
The financial statements have been prepared on a historical cost basis except for available-for-sale financial assets,
financial assets and liabilities and investment property – measured at fair value.
The preparation of financial statements in conformity with IFRS requires the use of certain critical accounting estimates.
It also requires management to exercise its judgment in the process of applying the Group’s accounting policies. The
areas involving a higher degree of judgment or complexity, or areas where assumptions and estimates are significant to
the consolidated financial statements are disclosed in note 3.
The condensed consolidated financial statements do not include all the information and disclosures required in the
annual financial statements, and should be read in conjunction with the Group’s annual financial statements as at 31
December 2017.
7
Transnational Corporation of Nigeria Plc
Notes to the Financial Statements
For the Period Ended 30 Sept 2018
3
Assets Level 1 Level 2 Level 3 Total
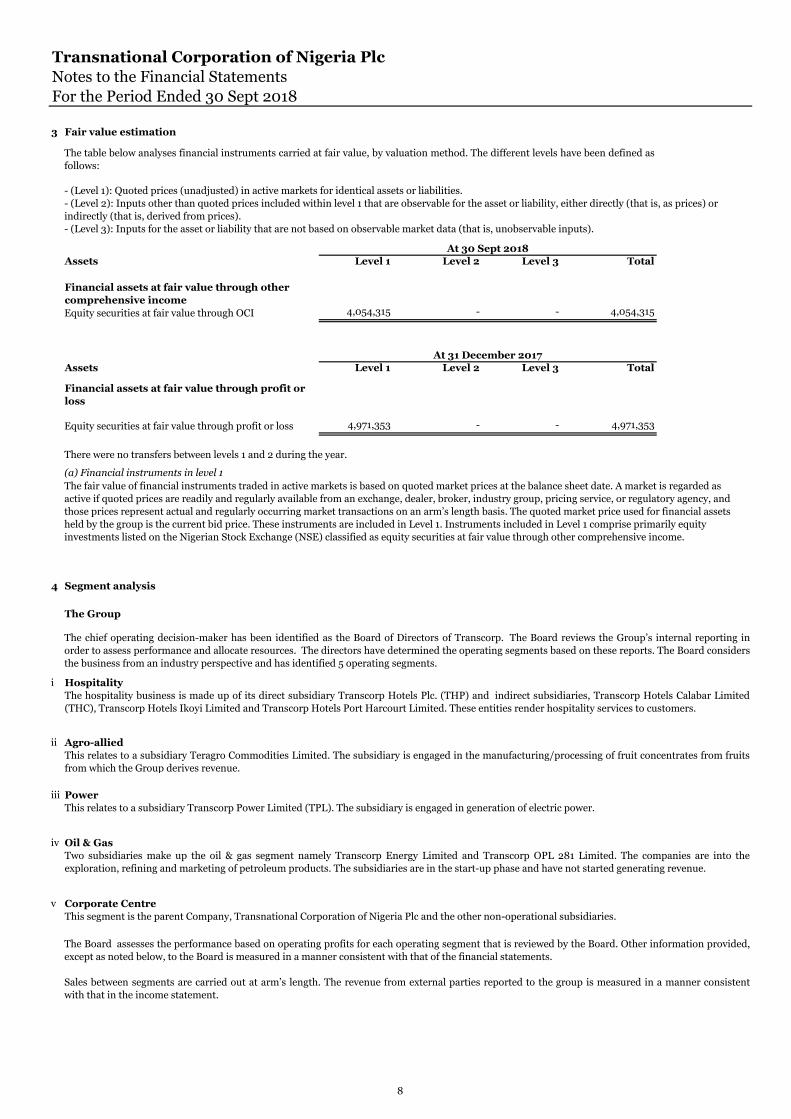
Equity securities at fair value through OCI 4,054,315 - - 4,054,315
Assets Level 1 Level 2 Level 3 Total
4,971,353 - - 4,971,353
There were no transfers between levels 1 and 2 during the year.
(a) Financial instruments in level 1
4 Segment analysis
The Group
i
ii
iii
iv
v
Fair value estimation
Corporate Centre
This segment is the parent Company, Transnational Corporation of Nigeria Plc and the other non-operational subsidiaries.
The chief operating decision-maker has been identified as the Board of Directors of Transcorp. The Board reviews the Group’s internal reporting in
order to assess performance and allocate resources. The directors have determined the operating segments based on these reports. The Board considers
the business from an industry perspective and has identified 5 operating segments.
Hospitality
The hospitality business is made up of its direct subsidiary Transcorp Hotels Plc. (THP) and indirect subsidiaries, Transcorp Hotels Calabar Limited
(THC), Transcorp Hotels Ikoyi Limited and Transcorp Hotels Port Harcourt Limited. These entities render hospitality services to customers.
Agro-allied
This relates to a subsidiary Teragro Commodities Limited. The subsidiary is engaged in the manufacturing/processing of fruit concentrates from fruits
from which the Group derives revenue.
Power
This relates to a subsidiary Transcorp Power Limited (TPL). The subsidiary is engaged in generation of electric power.
Oil & Gas
Two subsidiaries make up the oil & gas segment namely Transcorp Energy Limited and Transcorp OPL 281 Limited. The companies are into the
exploration, refining and marketing of petroleum products. The subsidiaries are in the start-up phase and have not started generating revenue.
The table below analyses financial instruments carried at fair value, by valuation method. The different levels have been defined as
follows:
At 30 Sept 2018
Financial assets at fair value through other
comprehensive income
- (Level 1): Quoted prices (unadjusted) in active markets for identical assets or liabilities.
- (Level 2): Inputs other than quoted prices included within level 1 that are observable for the asset or liability, either directly (that is, as prices) or
indirectly (that is, derived from prices).
- (Level 3): Inputs for the asset or liability that are not based on observable market data (that is, unobservable inputs).
At 31 December 2017
Financial assets at fair value through profit or
loss
Equity securities at fair value through profit or loss
The fair value of financial instruments traded in active markets is based on quoted market prices at the balance sheet date. A market is regarded as
active if quoted prices are readily and regularly available from an exchange, dealer, broker, industry group, pricing service, or regulatory agency, and
those prices represent actual and regularly occurring market transactions on an arm’s length basis. The quoted market price used for financial assets
held by the group is the current bid price. These instruments are included in Level 1. Instruments included in Level 1 comprise primarily equity
investments listed on the Nigerian Stock Exchange (NSE) classified as equity securities at fair value through other comprehensive income.
The Board assesses the performance based on operating profits for each operating segment that is reviewed by the Board. Other information provided,
except as noted below, to the Board is measured in a manner consistent with that of the financial statements.
Sales between segments are carried out at arm’s length. The revenue from external parties reported to the group is measured in a manner consistent
with that in the income statement.
8
Transnational Corporation of Nigeria Plc
Notes to the Financial Statements
For the Period Ended 30 Sept 2018
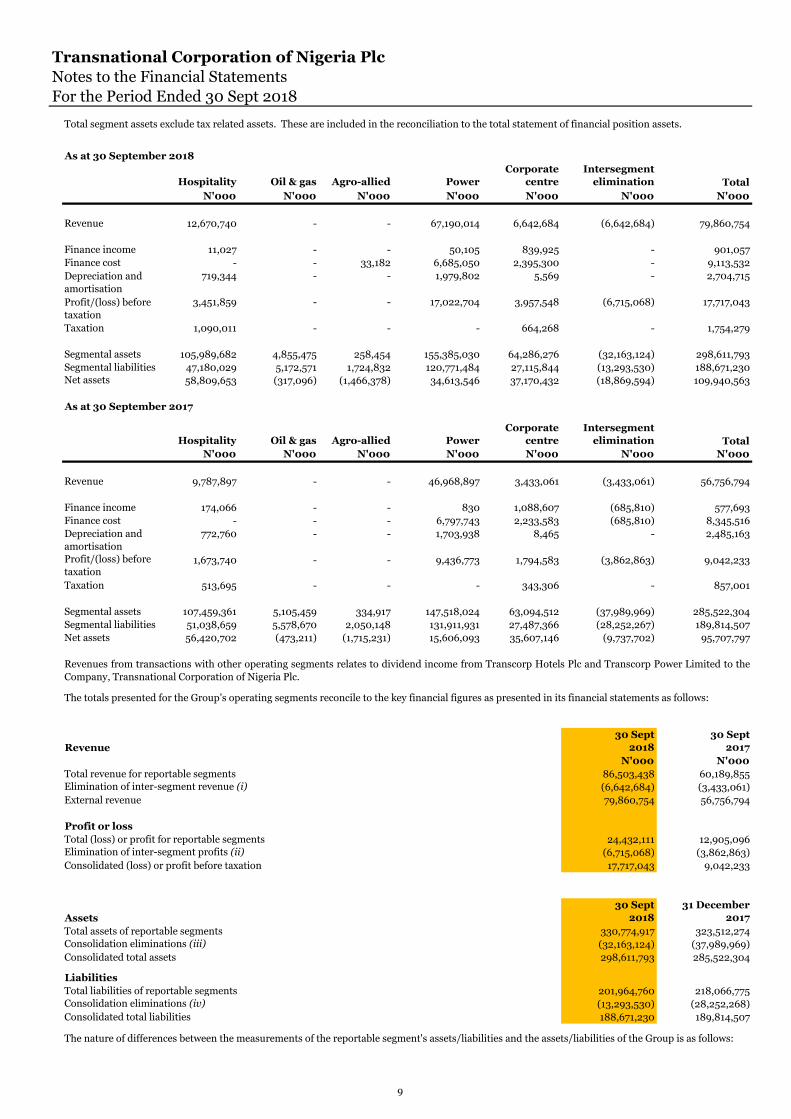
As at 30 September 2018
Hospitality Oil & gas Agro-allied Power
Corporate
centre
Intersegment
elimination Total
N'000 N'000 N'000 N'000 N'000 N'000 N'000
Revenue 12,670,740 - - 67,190,014 6,642,684 (6,642,684) 79,860,754
Finance income 11,027 - - 50,105 839,925 - 901,057
Finance cost - - 33,182 6,685,050 2,395,300 - 9,113,532
719,344 - - 1,979,802 5,569 - 2,704,715
3,451,859 - - 17,022,704 3,957,548 (6,715,068) 17,717,043
Taxation 1,090,011 - - - 664,268 - 1,754,279
Segmental assets 105,989,682 4,855,475 258,454 155,385,030 64,286,276 (32,163,124) 298,611,793
Segmental liabilities 47,180,029 5,172,571 1,724,832 120,771,484 27,115,844 (13,293,530) 188,671,230
Net assets 58,809,653 (317,096) (1,466,378) 34,613,546 37,170,432 (18,869,594) 109,940,563
As at 30 September 2017
Hospitality Oil & gas Agro-allied Power
Corporate
centre
Intersegment
elimination Total
N'000 N'000 N'000 N'000 N'000 N'000 N'000
Revenue 9,787,897 - - 46,968,897 3,433,061 (3,433,061) 56,756,794
Finance income 174,066 - - 830 1,088,607 (685,810) 577,693
Finance cost - - - 6,797,743 2,233,583 (685,810) 8,345,516
Depreciation and
amortisation
772,760 - - 1,703,938 8,465 - 2,485,163
Profit/(loss) before
taxation 1,673,740 - - 9,436,773 1,794,583 (3,862,863) 9,042,233
Taxation 513,695 - - - 343,306 - 857,001
Segmental assets 107,459,361 5,105,459 334,917 147,518,024 63,094,512 (37,989,969) 285,522,304
Segmental liabilities 51,038,659 5,578,670 2,050,148 131,911,931 27,487,366 (28,252,267) 189,814,507
Net assets 56,420,702 (473,211) (1,715,231) 15,606,093 35,607,146 (9,737,702) 95,707,797
Revenue
30 Sept
2018
30 Sept
2017
N'000 N'000
Total revenue for reportable segments 86,503,438 60,189,855
Elimination of inter-segment revenue (i) (6,642,684) (3,433,061)
External revenue 79,860,754 56,756,794
Profit or loss
Total (loss) or profit for reportable segments 24,432,111 12,905,096
Elimination of inter-segment profits (ii) (6,715,068) (3,862,863)
Consolidated (loss) or profit before taxation 17,717,043 9,042,233
Assets
30 Sept
2018
31 December
2017
Total assets of reportable segments 330,774,917 323,512,274
Consolidation eliminations (iii) (32,163,124) (37,989,969)
Consolidated total assets 298,611,793 285,522,304
Liabilities
Total liabilities of reportable segments 201,964,760 218,066,775
Consolidation eliminations (iv) (13,293,530) (28,252,268)
Consolidated total liabilities 188,671,230 189,814,507
The totals presented for the Group’s operating segments reconcile to the key financial figures as presented in its financial statements as follows:
The nature of differences between the measurements of the reportable segment's assets/liabilities and the assets/liabilities of the Group is as follows:
Total segment assets exclude tax related assets. These are included in the reconciliation to the total statement of financial position assets.
Depreciation and
amortisation
Profit/(loss) before
taxation
Revenues from transactions with other operating segments relates to dividend income from Transcorp Hotels Plc and Transcorp Power Limited to the
Company, Transnational Corporation of Nigeria Plc.
9
Transnational Corporation of Nigeria Plc
Notes to the Financial Statements
For the Period Ended 30 Sept 2018
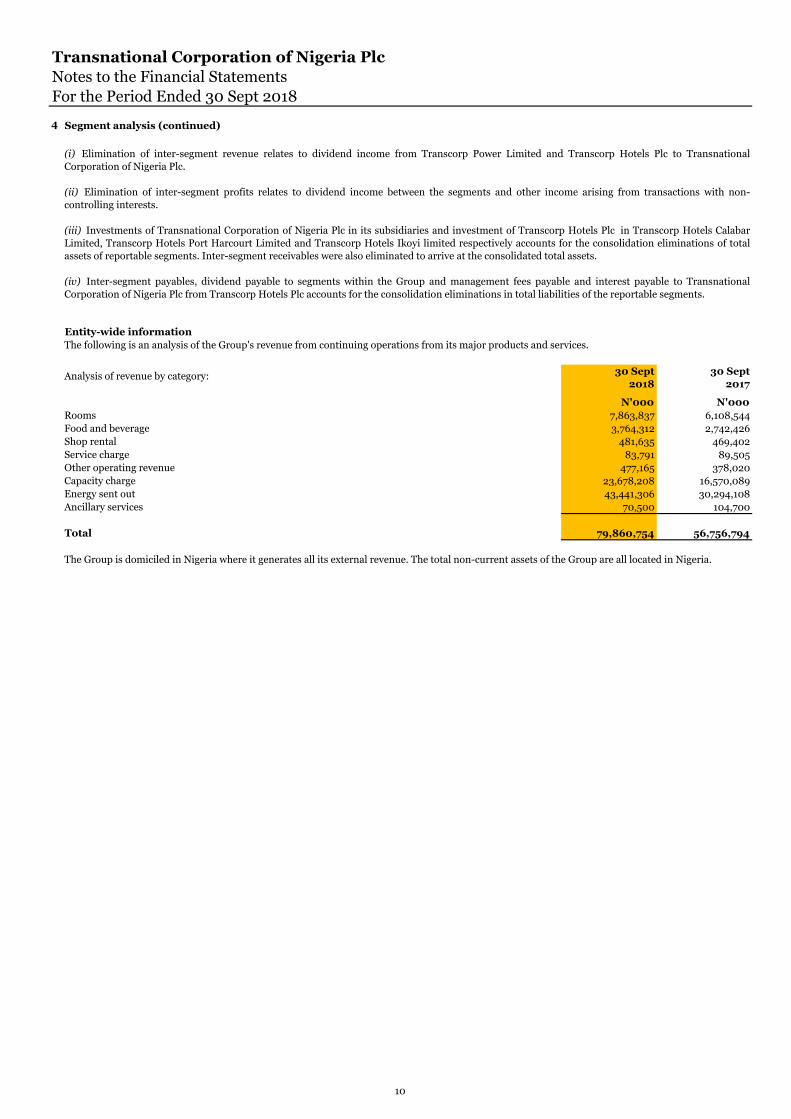
4 Segment analysis (continued)
Entity-wide information
The following is an analysis of the Group's revenue from continuing operations from its major products and services.
Analysis of revenue by category:
N'000 N'000
Rooms 7,863,837 6,108,544
Food and beverage 3,764,312 2,742,426
Shop rental 481,635 469,402
Service charge 83,791 89,505
Other operating revenue 477,165 378,020
Capacity charge 23,678,208 16,570,089
Energy sent out 43,441,306 30,294,108
Ancillary services 70,500 104,700
Total 79,860,754 56,756,794
(i) Elimination of inter-segment revenue relates to dividend income from Transcorp Power Limited and Transcorp Hotels Plc to Transnational
Corporation of Nigeria Plc.
(ii) Elimination of inter-segment profits relates to dividend income between the segments and other income arising from transactions with non-
controlling interests.
(iii) Investments of Transnational Corporation of Nigeria Plc in its subsidiaries and investment of Transcorp Hotels Plc in Transcorp Hotels Calabar
Limited, Transcorp Hotels Port Harcourt Limited and Transcorp Hotels Ikoyi limited respectively accounts for the consolidation eliminations of total
assets of reportable segments. Inter-segment receivables were also eliminated to arrive at the consolidated total assets.
(iv) Inter-segment payables, dividend payable to segments within the Group and management fees payable and interest payable to Transnational
Corporation of Nigeria Plc from Transcorp Hotels Plc accounts for the consolidation eliminations in total liabilities of the reportable segments.
The Group is domiciled in Nigeria where it generates all its external revenue. The total non-current assets of the Group are all located in Nigeria.
30 Sept
2018
30 Sept
2017
10
Transnational Corporation of Nigeria Plc
Notes to the Financial Statements
For the Period Ended 30 Sept 2018
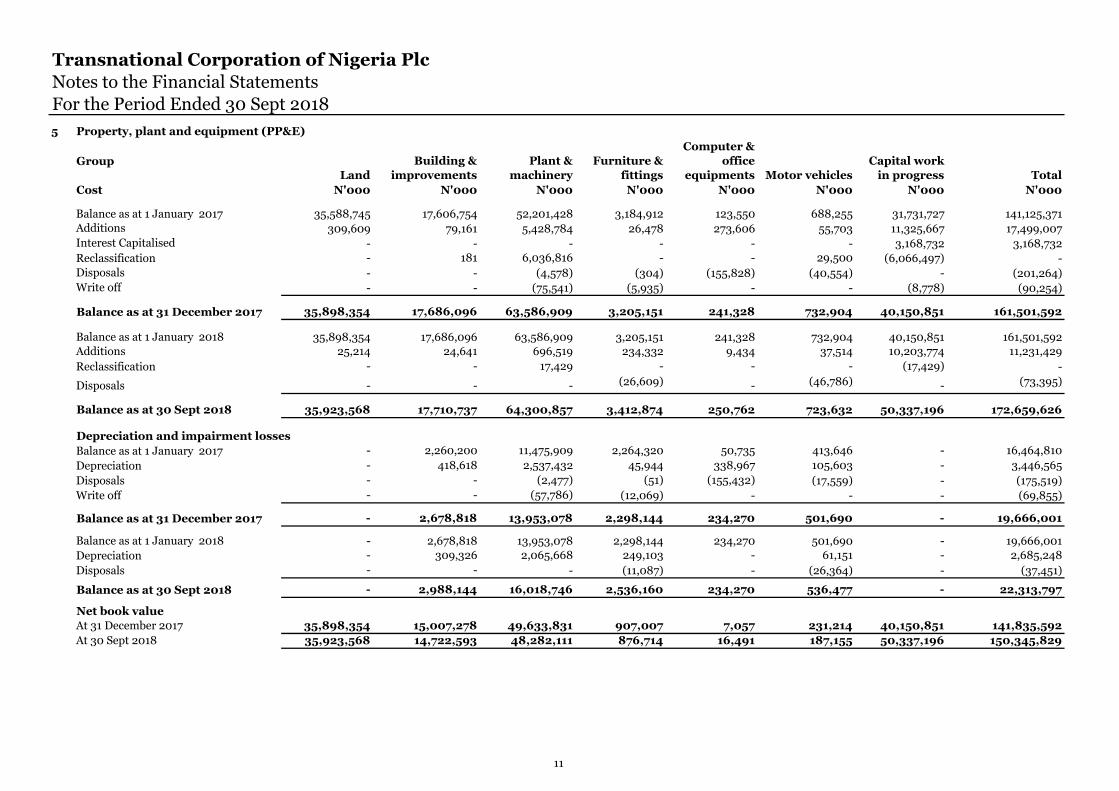
5 Property, plant and equipment (PP&E)
Group
Land
Building &
improvements
Plant &
machinery
Furniture &
fittings
Computer &
office
equipments Motor vehicles
Capital work
in progress Total
Cost N'000 N'000 N'000 N'000 N'000 N'000 N'000 N'000
Balance as at 1 January 2017 35,588,745 17,606,754 52,201,428 3,184,912 123,550 688,255 31,731,727 141,125,371
Additions 309,609 79,161 5,428,784 26,478 273,606 55,703 11,325,667 17,499,007
Interest Capitalised - - - - - - 3,168,732 3,168,732
Reclassification - 181 6,036,816 - - 29,500 (6,066,497) -
Disposals - - (4,578) (304) (155,828) (40,554) - (201,264)
Write off - - (75,541) (5,935) - - (8,778) (90,254)
Balance as at 31 December 2017 35,898,354 17,686,096 63,586,909 3,205,151 241,328 732,904 40,150,851 161,501,592
Balance as at 1 January 2018 35,898,354 17,686,096 63,586,909 3,205,151 241,328 732,904 40,150,851 161,501,592
Additions 25,214 24,641 696,519 234,332 9,434 37,514 10,203,774 11,231,429
Reclassification - - 17,429 - - - (17,429) -
Disposals - - - (26,609) - (46,786) - (73,395)
Balance as at 30 Sept 2018 35,923,568 17,710,737 64,300,857 3,412,874 250,762 723,632 50,337,196 172,659,626
Depreciation and impairment losses
Balance as at 1 January 2017 - 2,260,200 11,475,909 2,264,320 50,735 413,646 - 16,464,810
Depreciation - 418,618 2,537,432 45,944 338,967 105,603 - 3,446,565
Disposals - - (2,477) (51) (155,432) (17,559) - (175,519)
Write off - - (57,786) (12,069) - - - (69,855)
Balance as at 31 December 2017 - 2,678,818 13,953,078 2,298,144 234,270 501,690 - 19,666,001
Balance as at 1 January 2018 - 2,678,818 13,953,078 2,298,144 234,270 501,690 - 19,666,001
Depreciation - 309,326 2,065,668 249,103 - 61,151 - 2,685,248
Disposals - - - (11,087) - (26,364) - (37,451)
Balance as at 30 Sept 2018 - 2,988,144 16,018,746 2,536,160 234,270 536,477 - 22,313,797
Net book value
At 31 December 2017 35,898,354 15,007,278 49,633,831 907,007 7,057 231,214 40,150,851 141,835,592
At 30 Sept 2018 35,923,568 14,722,593 48,282,111 876,714 16,491 187,155 50,337,196 150,345,829
11
Transnational Corporation of Nigeria Plc
Notes to the Financial Statements
For the Period Ended 30 Sept 2018
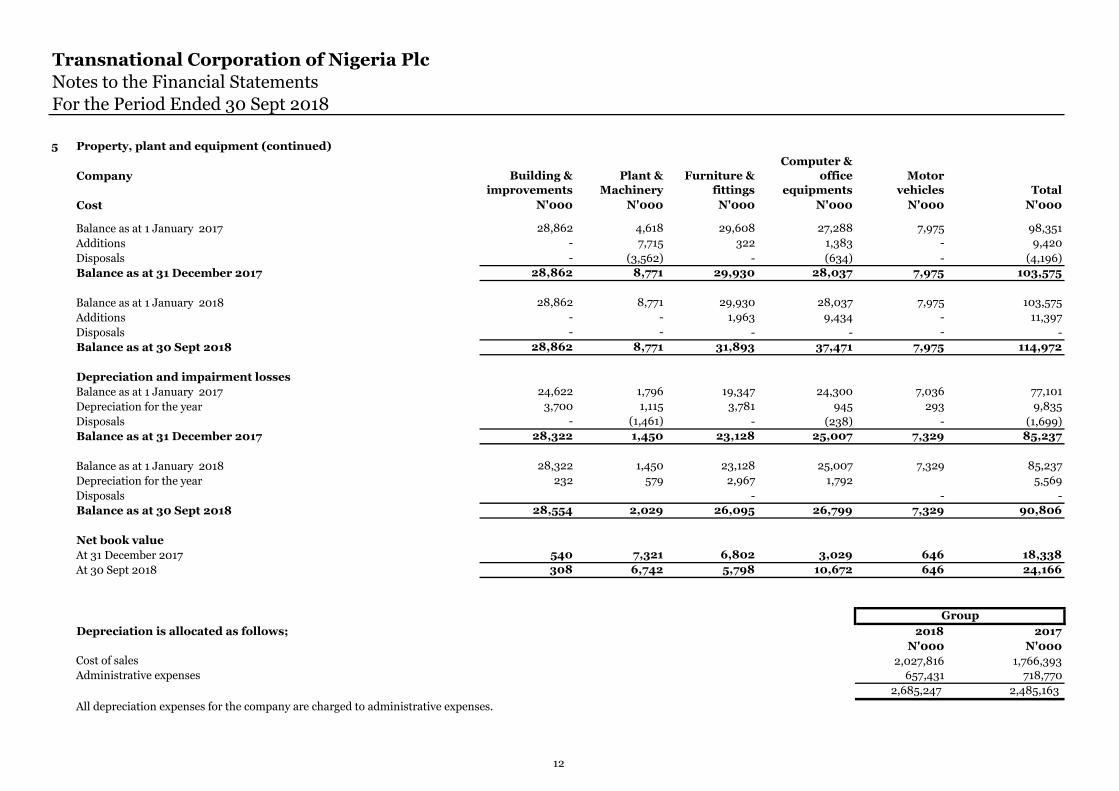
5 Property, plant and equipment (continued)
Company Building &
improvements
Plant &
Machinery
Furniture &
fittings
Computer &
office
equipments
Motor
vehicles Total
Cost N'000 N'000 N'000 N'000 N'000 N'000
Balance as at 1 January 2017 28,862 4,618 29,608 27,288 7,975 98,351
Additions - 7,715 322 1,383 - 9,420
Disposals - (3,562) - (634) - (4,196)
Balance as at 31 December 2017 28,862 8,771 29,930 28,037 7,975 103,575
Balance as at 1 January 2018 28,862 8,771 29,930 28,037 7,975 103,575
Additions - - 1,963 9,434 - 11,397
Disposals - - - - - -
Balance as at 30 Sept 2018 28,862 8,771 31,893 37,471 7,975 114,972
Depreciation and impairment losses
Balance as at 1 January 2017 24,622 1,796 19,347 24,300 7,036 77,101
Depreciation for the year 3,700 1,115 3,781 945 293 9,835
Disposals - (1,461) - (238) - (1,699)
Balance as at 31 December 2017 28,322 1,450 23,128 25,007 7,329 85,237
Balance as at 1 January 2018 28,322 1,450 23,128 25,007 7,329 85,237
Depreciation for the year 232 579 2,967 1,792 5,569
Disposals - - -
Balance as at 30 Sept 2018 28,554 2,029 26,095 26,799 7,329 90,806
Net book value
At 31 December 2017 540 7,321 6,802 3,029 646 18,338
At 30 Sept 2018 308 6,742 5,798 10,672 646 24,166
Depreciation is allocated as follows; 2018 2017
N'000 N'000
Cost of sales 2,027,816 1,766,393
Administrative expenses 657,431 718,770
2,685,247 2,485,163
All depreciation expenses for the company are charged to administrative expenses.
Group
12
Transnational Corporation of Nigeria Plc
Notes to the Financial Statements
For the Period Ended 30 Sept 2018
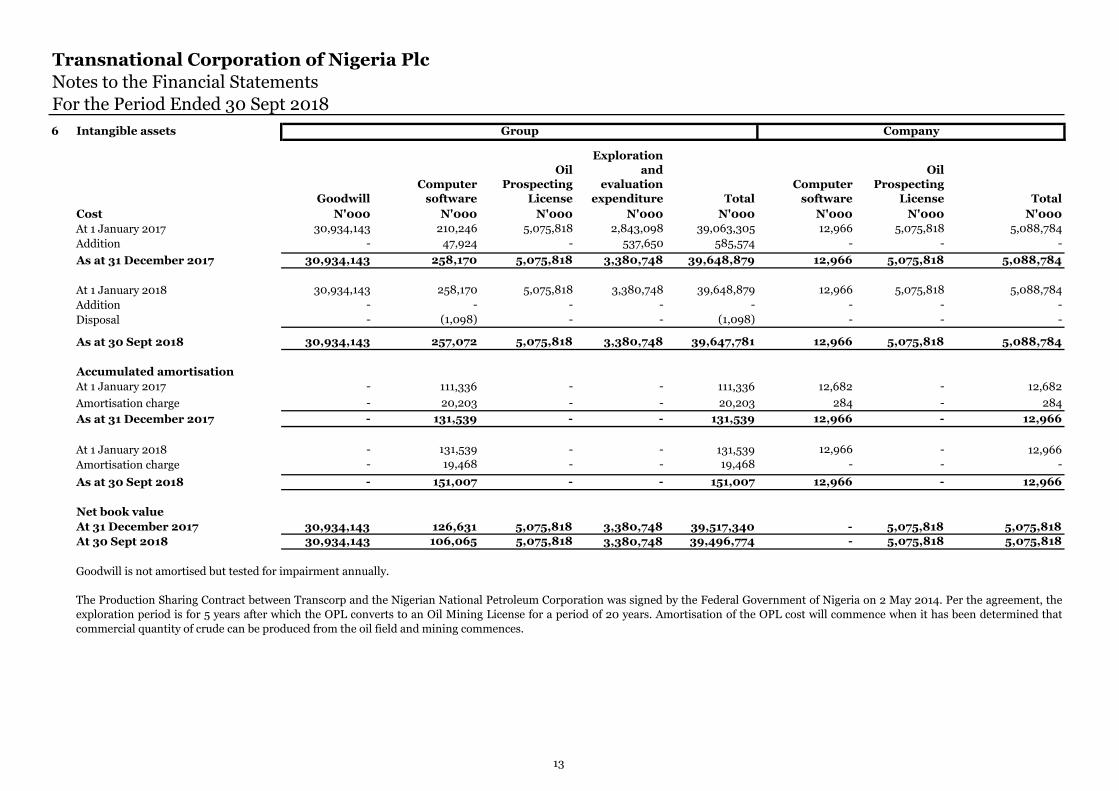
6 Intangible assets
Goodwill
Computer
software
Oil
Prospecting
License
Exploration
and
evaluation
expenditure Total
Computer
software
Oil
Prospecting
License Total
Cost N'000 N'000 N'000 N'000 N'000 N'000 N'000 N'000
At 1 January 2017 30,934,143 210,246 5,075,818 2,843,098 39,063,305 12,966 5,075,818 5,088,784
Addition - 47,924 - 537,650 585,574 - - -
As at 31 December 2017 30,934,143 258,170 5,075,818 3,380,748 39,648,879 12,966 5,075,818 5,088,784
At 1 January 2018 30,934,143 258,170 5,075,818 3,380,748 39,648,879 12,966 5,075,818 5,088,784
Addition - - - - - - - -
Disposal - (1,098) - - (1,098) - - -
As at 30 Sept 2018 30,934,143 257,072 5,075,818 3,380,748 39,647,781 12,966 5,075,818 5,088,784
Accumulated amortisation
At 1 January 2017 - 111,336 - - 111,336 12,682 - 12,682
Amortisation charge - 20,203 - - 20,203 284 - 284
As at 31 December 2017 - 131,539 - - 131,539 12,966 - 12,966
At 1 January 2018 - 131,539 - - 131,539 12,966 - 12,966
Amortisation charge - 19,468 - - 19,468 - - -
As at 30 Sept 2018 - 151,007 - - 151,007 12,966 - 12,966
Net book value
At 31 December 2017 30,934,143 126,631 5,075,818 3,380,748 39,517,340 - 5,075,818 5,075,818
At 30 Sept 2018 30,934,143 106,065 5,075,818 3,380,748 39,496,774 - 5,075,818 5,075,818
Group Company
Goodwill is not amortised but tested for impairment annually.
The Production Sharing Contract between Transcorp and the Nigerian National Petroleum Corporation was signed by the Federal Government of Nigeria on 2 May 2014. Per the agreement, the
exploration period is for 5 years after which the OPL converts to an Oil Mining License for a period of 20 years. Amortisation of the OPL cost will commence when it has been determined that
commercial quantity of crude can be produced from the oil field and mining commences.
13
Transnational Corporation of Nigeria Plc
Notes to the Financial Statements
For the Period Ended 30 Sept 2018
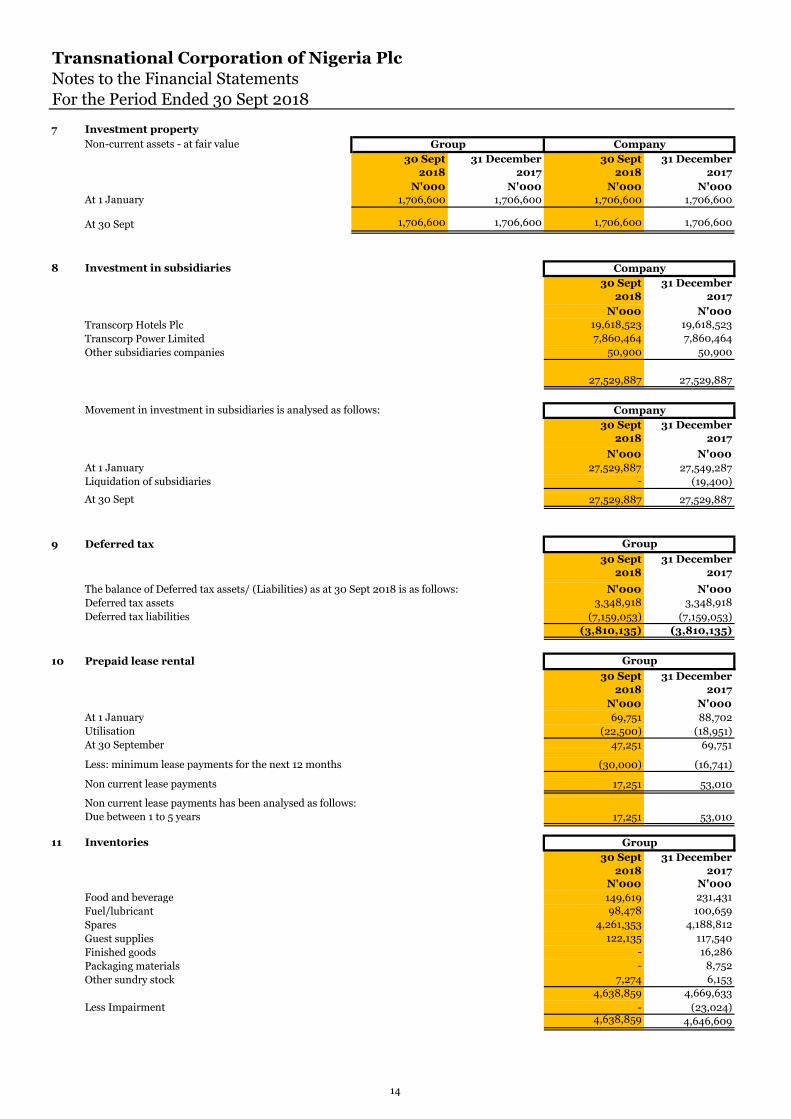
7 Investment property
Non-current assets - at fair value
30 Sept
2018
31 December
2017
30 Sept
2018
31 December
2017
N'000 N'000 N'000 N'000
At 1 January 1,706,600 1,706,600 1,706,600 1,706,600
At 30 Sept 1,706,600 1,706,600 1,706,600 1,706,600
8 Investment in subsidiaries
30 Sept
2018
31 December
2017
N'000 N'000
Transcorp Hotels Plc 19,618,523 19,618,523
Transcorp Power Limited 7,860,464 7,860,464
Other subsidiaries companies 50,900 50,900
27,529,887 27,529,887
Movement in investment in subsidiaries is analysed as follows:
30 Sept
2018
31 December
2017
N'000 N'000
At 1 January 27,529,887 27,549,287
Liquidation of subsidiaries - (19,400)
At 30 Sept 27,529,887 27,529,887
9 Deferred tax
30 Sept
2018
31 December
2017
The balance of Deferred tax assets/ (Liabilities) as at 30 Sept 2018 is as follows: N'000 N'000
Deferred tax assets 3,348,918 3,348,918
Deferred tax liabilities (7,159,053) (7,159,053)
(3,810,135) (3,810,135)
10 Prepaid lease rental
30 Sept
2018
31 December
2017
N'000 N'000
At 1 January 69,751 88,702
Utilisation (22,500) (18,951)
At 30 September 47,251 69,751
Less: minimum lease payments for the next 12 months (30,000) (16,741)
Non current lease payments 17,251 53,010
Non current lease payments has been analysed as follows:
Due between 1 to 5 years 17,251 53,010
11 Inventories
30 Sept
2018
31 December
2017N'000 N'000
Food and beverage 149,619 231,431
Fuel/lubricant 98,478 100,659
Spares 4,261,353 4,188,812
Guest supplies 122,135 117,540
Finished goods - 16,286
Packaging materials - 8,752
Other sundry stock 7,274 6,153
4,638,859 4,669,633
Less Impairment - (23,024)4,638,859 4,646,609
Company
Group Company
Group
Group
Group
Company
14
Transnational Corporation of Nigeria Plc
Notes to the Financial Statements
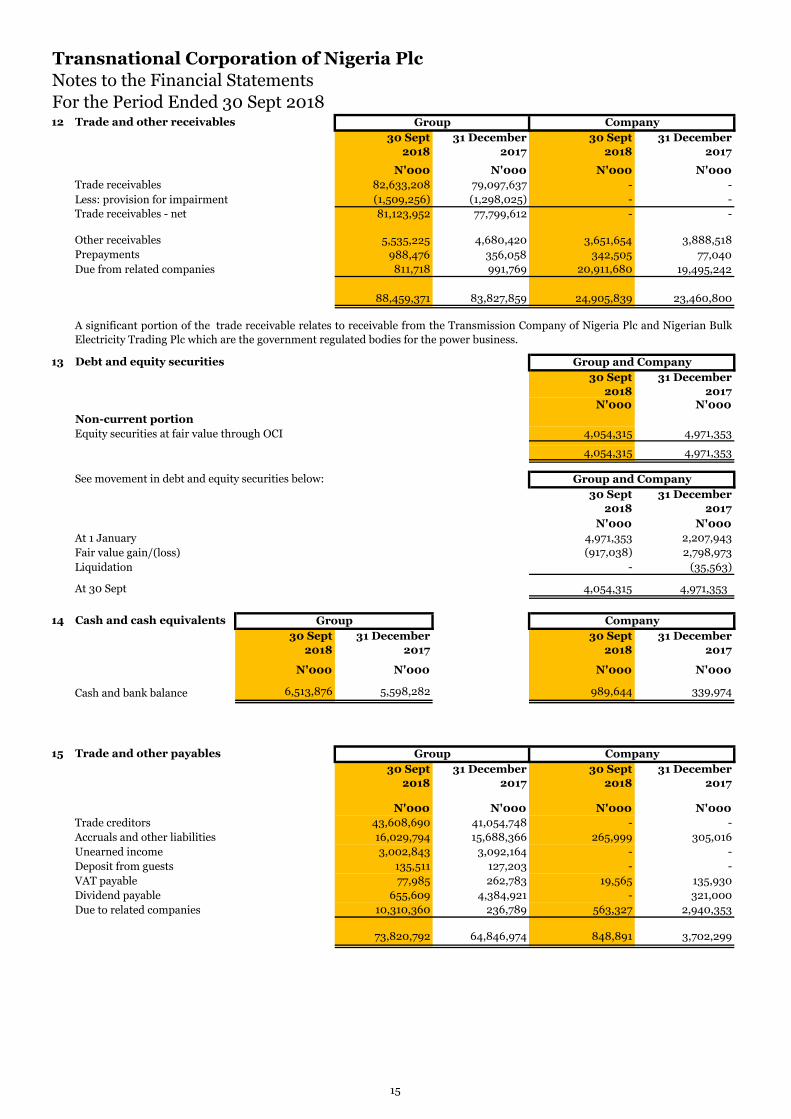
For the Period Ended 30 Sept 201812 Trade and other receivables
30 Sept
2018
31 December
2017
30 Sept
2018
31 December
2017
N'000 N'000 N'000 N'000
Trade receivables 82,633,208 79,097,637 - -
Less: provision for impairment (1,509,256) (1,298,025) - -
Trade receivables - net 81,123,952 77,799,612 - -
Other receivables 5,535,225 4,680,420 3,651,654 3,888,518
Prepayments 988,476 356,058 342,505 77,040
Due from related companies 811,718 991,769 20,911,680 19,495,242
88,459,371 83,827,859 24,905,839 23,460,800
13 Debt and equity securities
30 Sept
2018
31 December
2017N'000 N'000
Non-current portion
Equity securities at fair value through OCI 4,054,315 4,971,353
- - 4,054,315 4,971,353
See movement in debt and equity securities below:
30 Sept
2018
31 December
2017
N'000 N'000
At 1 January 4,971,353 2,207,943
Fair value gain/(loss) (917,038) 2,798,973
Liquidation - (35,563)
At 30 Sept 4,054,315 4,971,353
14 Cash and cash equivalents
30 Sept
2018
31 December
2017
30 Sept
2018
31 December
2017
N'000 N'000 N'000 N'000
Cash and bank balance 6,513,876 5,598,282 989,644 339,974
15 Trade and other payables
30 Sept
2018
31 December
2017
30 Sept
2018
31 December
2017
N'000 N'000 N'000 N'000
Trade creditors 43,608,690 41,054,748 - -
Accruals and other liabilities 16,029,794 15,688,366 265,999 305,016
Unearned income 3,002,843 3,092,164 - -
Deposit from guests 135,511 127,203 - -
VAT payable 77,985 262,783 19,565 135,930
Dividend payable 655,609 4,384,921 - 321,000
Due to related companies 10,310,360 236,789 563,327 2,940,353
73,820,792 64,846,974 848,891 3,702,299
Group Company
A significant portion of the trade receivable relates to receivable from the Transmission Company of Nigeria Plc and Nigerian Bulk
Electricity Trading Plc which are the government regulated bodies for the power business.
Group and Company
Group and Company
Group Company
Included in cash and bank balance for the Group is balance held at First Bank of Nigeria Plc of N210 million which is restricted due
to a current court lien placed on it since May 2012 as a result of an existing court case between Lagos State Government and defunct
Group Company
15
Transnational Corporation of Nigeria Plc
Notes to the Financial Statements
For the Period Ended 30 Sept 2018
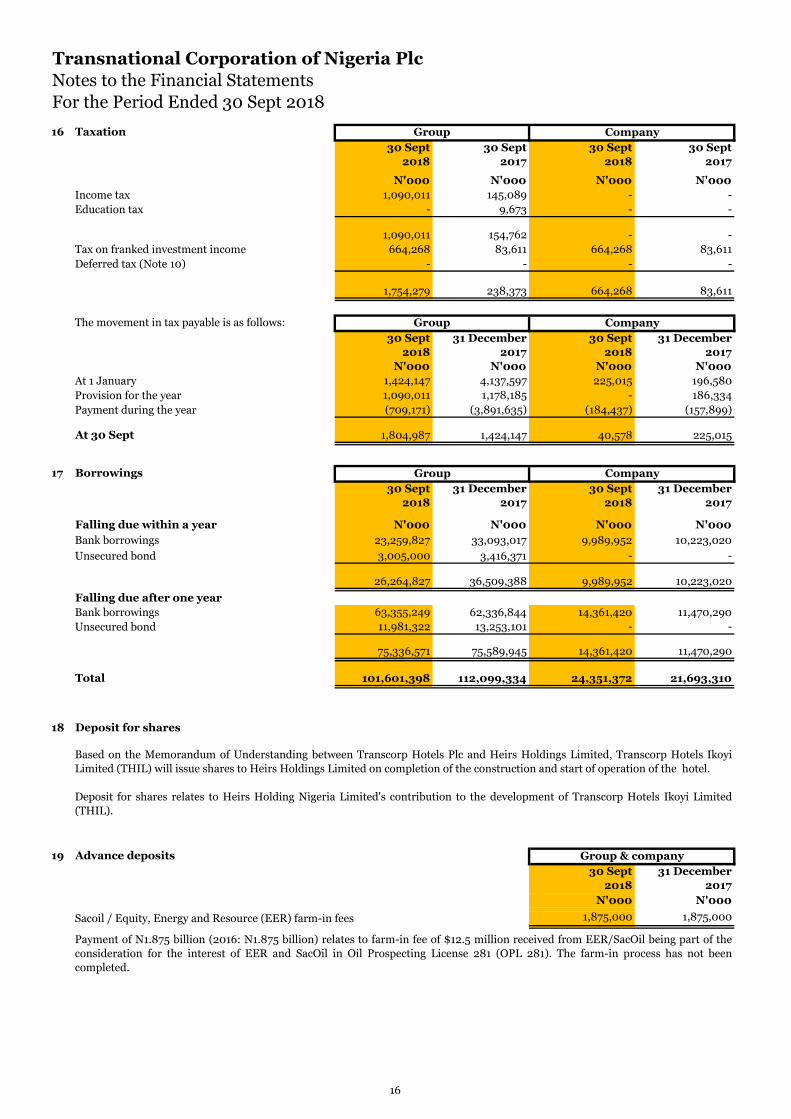
16 Taxation
30 Sept
2018
30 Sept
2017
30 Sept
2018
30 Sept
2017
N'000 N'000 N'000 N'000
Income tax 1,090,011 145,089 - -
Education tax - 9,673 - -
1,090,011 154,762 - -
Tax on franked investment income 664,268 83,611 664,268 83,611
Deferred tax (Note 10) - - - -
1,754,279 238,373 664,268 83,611
The movement in tax payable is as follows:
30 Sept
2018
31 December
2017
30 Sept
2018
31 December
2017
N'000 N'000 N'000 N'000
At 1 January 1,424,147 4,137,597 225,015 196,580
Provision for the year 1,090,011 1,178,185 - 186,334
Payment during the year (709,171) (3,891,635) (184,437) (157,899)
At 30 Sept 1,804,987 1,424,147 40,578 225,015
17 Borrowings
30 Sept
2018
31 December
2017
30 Sept
2018
31 December
2017
Falling due within a year N'000 N'000 N'000 N'000
Bank borrowings 23,259,827 33,093,017 9,989,952 10,223,020
Unsecured bond 3,005,000 3,416,371 - -
26,264,827 36,509,388 9,989,952 10,223,020
Falling due after one year
Bank borrowings 63,355,249 62,336,844 14,361,420 11,470,290
Unsecured bond 11,981,322 13,253,101 - -
75,336,571 75,589,945 14,361,420 11,470,290
Total 101,601,398 112,099,334 24,351,372 21,693,310
18 Deposit for shares
19 Advance deposits
30 Sept
2018
31 December
2017
N'000 N'000
Sacoil / Equity, Energy and Resource (EER) farm-in fees 1,875,000 1,875,000
Group Company
Group Company
Group Company
Based on the Memorandum of Understanding between Transcorp Hotels Plc and Heirs Holdings Limited, Transcorp Hotels Ikoyi
Limited (THIL) will issue shares to Heirs Holdings Limited on completion of the construction and start of operation of the hotel.
Deposit for shares relates to Heirs Holding Nigeria Limited's contribution to the development of Transcorp Hotels Ikoyi Limited
(THIL).
Payment of N1.875 billion (2016: N1.875 billion) relates to farm-in fee of $12.5 million received from EER/SacOil being part of the
consideration for the interest of EER and SacOil in Oil Prospecting License 281 (OPL 281). The farm-in process has not been
completed.
Group & company
16
Transnational Corporation of Nigeria Plc
Notes to the Financial Statements
For the Period Ended 30 Sept 2018
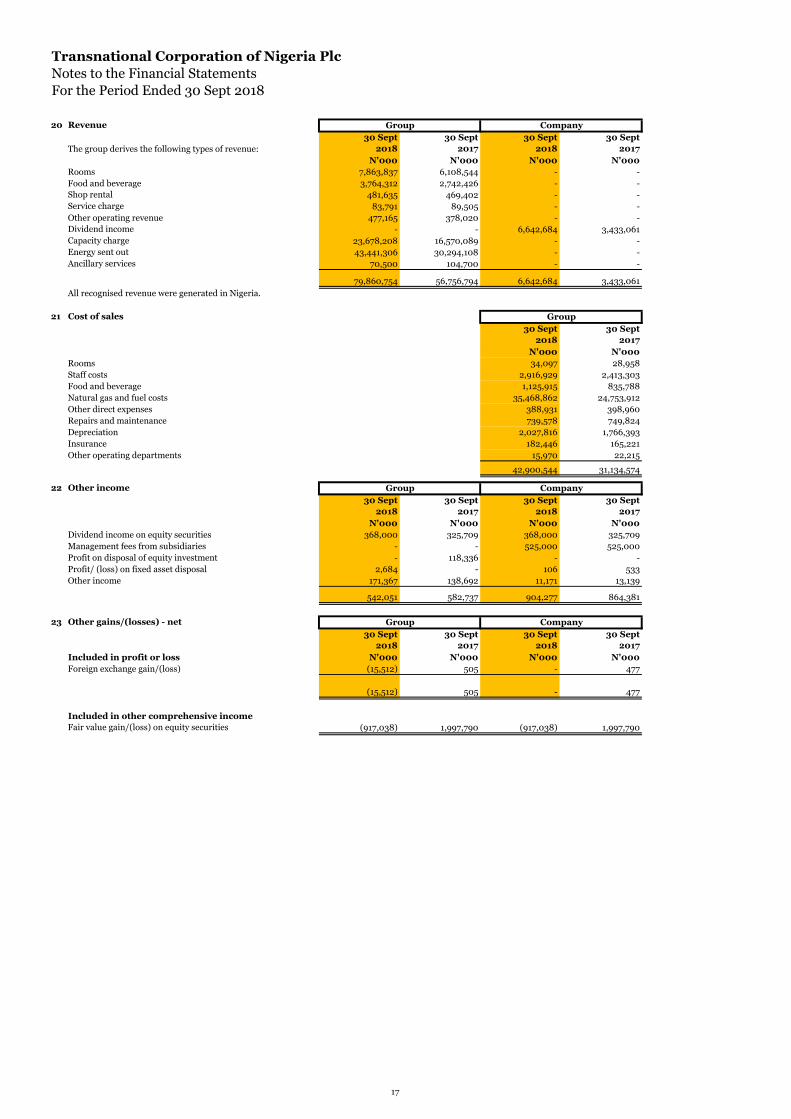
20 Revenue
The group derives the following types of revenue:
30 Sept
2018
30 Sept
2017
30 Sept
2018
30 Sept
2017
N'000 N'000 N'000 N'000
Rooms 7,863,837 6,108,544 - -
Food and beverage 3,764,312 2,742,426 - -
Shop rental 481,635 469,402 - -
Service charge 83,791 89,505 - -
Other operating revenue 477,165 378,020 - -
Dividend income - - 6,642,684 3,433,061
Capacity charge 23,678,208 16,570,089 - -
Energy sent out 43,441,306 30,294,108 - -
Ancillary services 70,500 104,700 - -
79,860,754 56,756,794 6,642,684 3,433,061
21 Cost of sales
30 Sept
2018
30 Sept
2017
N'000 N'000
Rooms 34,097 28,958
Staff costs 2,916,929 2,413,303
Food and beverage 1,125,915 835,788
Natural gas and fuel costs 35,468,862 24,753,912
Other direct expenses 388,931 398,960
Repairs and maintenance 739,578 749,824
Depreciation 2,027,816 1,766,393
Insurance 182,446 165,221
Other operating departments 15,970 22,215
42,900,544 31,134,574
22 Other income
30 Sept
2018
30 Sept
2017
30 Sept
2018
30 Sept
2017
N'000 N'000 N'000 N'000
Dividend income on equity securities 368,000 325,709 368,000 325,709
Management fees from subsidiaries - - 525,000 525,000
Profit on disposal of equity investment - 118,336 - -
Profit/ (loss) on fixed asset disposal 2,684 - 106 533
Other income 171,367 138,692 11,171 13,139
542,051 582,737 904,277 864,381
23 Other gains/(losses) - net
30 Sept
2018
30 Sept
2017
30 Sept
2018
30 Sept
2017
Included in profit or loss N'000 N'000 N'000 N'000
Foreign exchange gain/(loss) (15,512) 505 - 477
(15,512) 505 - 477
Included in other comprehensive income
Fair value gain/(loss) on equity securities (917,038) 1,997,790 (917,038) 1,997,790
Group Company
Group Company
All recognised revenue were generated in Nigeria.
Group
Group Company
17
Transnational Corporation of Nigeria Plc
Notes to the Financial Statements
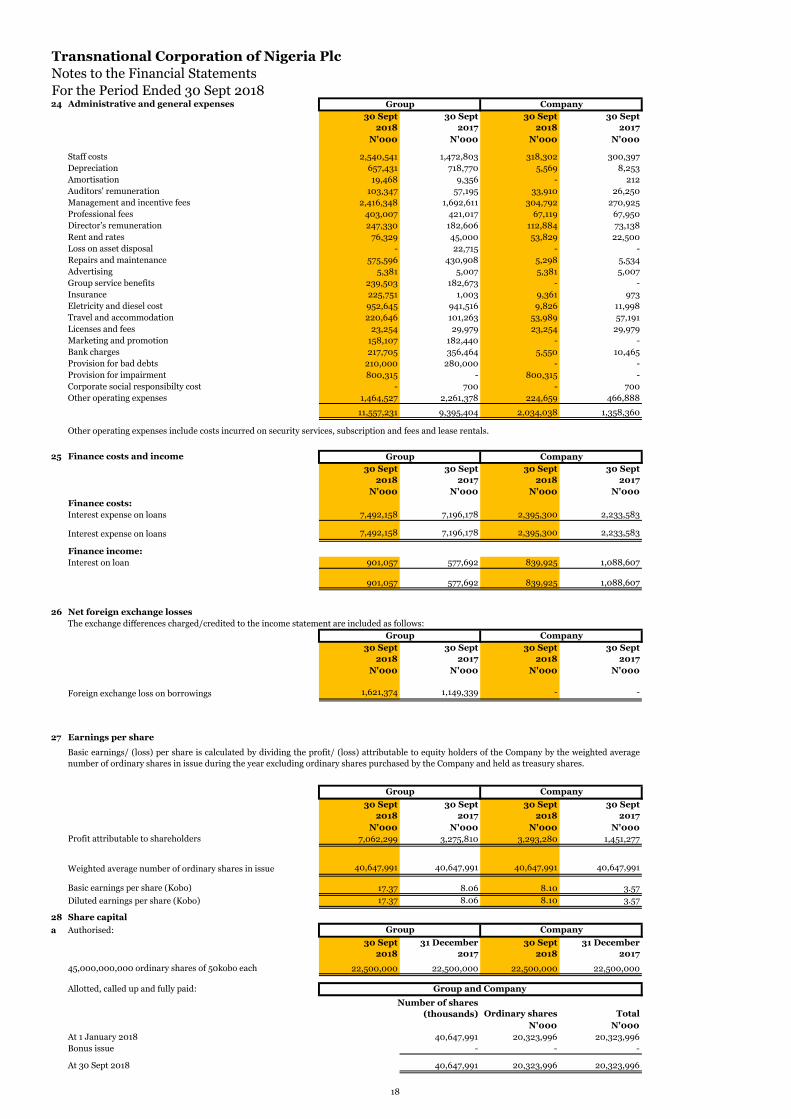
For the Period Ended 30 Sept 201824 Administrative and general expenses
30 Sept
2018
30 Sept
2017
30 Sept
2018
30 Sept
2017
N'000 N'000 N'000 N'000
Staff costs 2,540,541 1,472,803 318,302 300,397
Depreciation 657,431 718,770 5,569 8,253
Amortisation 19,468 9,356 - 212
Auditors' remuneration 103,347 57,195 33,910 26,250
Management and incentive fees 2,416,348 1,692,611 304,792 270,925
Professional fees 403,007 421,017 67,119 67,950
Director's remuneration 247,330 182,606 112,884 73,138
Rent and rates 76,329 45,000 53,829 22,500
Loss on asset disposal - 22,715 - -
Repairs and maintenance 575,596 430,908 5,298 5,534
Advertising 5,381 5,007 5,381 5,007
Group service benefits 239,503 182,673 - -
Insurance 225,751 1,003 9,361 973
Eletricity and diesel cost 952,645 941,516 9,826 11,998
Travel and accommodation 220,646 101,263 53,989 57,191
Licenses and fees 23,254 29,979 23,254 29,979
Marketing and promotion 158,107 182,440 - -
Bank charges 217,705 356,464 5,550 10,465
Provision for bad debts 210,000 280,000 - -
Provision for impairment 800,315 - 800,315 -
Corporate social responsibilty cost - 700 - 700
Other operating expenses 1,464,527 2,261,378 224,659 466,888
11,557,231 9,395,404 2,034,038 1,358,360
25 Finance costs and income
30 Sept
2018
30 Sept
2017
30 Sept
2018
30 Sept
2017
N'000 N'000 N'000 N'000
Finance costs:
Interest expense on loans 7,492,158 7,196,178 2,395,300 2,233,583
Interest expense on loans 7,492,158 7,196,178 2,395,300 2,233,583
Finance income:
Interest on loan 901,057 577,692 839,925 1,088,607
901,057 577,692 839,925 1,088,607
26 Net foreign exchange losses
30 Sept
2018
30 Sept
2017
30 Sept
2018
30 Sept
2017
N'000 N'000 N'000 N'000
Foreign exchange loss on borrowings 1,621,374 1,149,339 - -
27 Earnings per share
30 Sept
2018
30 Sept
2017
30 Sept
2018
30 Sept
2017
N'000 N'000 N'000 N'000
Profit attributable to shareholders 7,062,299 3,275,810 3,293,280 1,451,277
40,647,991 40,647,991 40,647,991 40,647,991
Basic earnings per share (Kobo) 17.37 8.06 8.10 3.57
Diluted earnings per share (Kobo) 17.37 8.06 8.10 3.57
28 Share capital
a Authorised:
30 Sept
2018
31 December
2017
30 Sept
2018
31 December
2017
45,000,000,000 ordinary shares of 50kobo each 22,500,000 22,500,000 22,500,000 22,500,000
Allotted, called up and fully paid:
Ordinary shares Total
N'000 N'000
At 1 January 2018 40,647,991 20,323,996 20,323,996
Bonus issue - - -
At 30 Sept 2018 40,647,991 20,323,996 20,323,996
Group Company
Other operating expenses include costs incurred on security services, subscription and fees and lease rentals.
Group Company
The movement in foreign exchange differences is as result of the decline in the value of the Nigerian Naira against the US Dollars by N108.5/$1
from N196/$1 in December 2015 to N304.5 in December 2016.
Basic earnings/ (loss) per share is calculated by dividing the profit/ (loss) attributable to equity holders of the Company by the weighted average
number of ordinary shares in issue during the year excluding ordinary shares purchased by the Company and held as treasury shares.
Group Company
Group Company
The exchange differences charged/credited to the income statement are included as follows:
Weighted average number of ordinary shares in issue
Group Company
Group and Company
Number of shares
(thousands)
18
Transnational Corporation of Nigeria Plc
Notes to the Financial Statements
For the Period Ended 30 Sept 2018
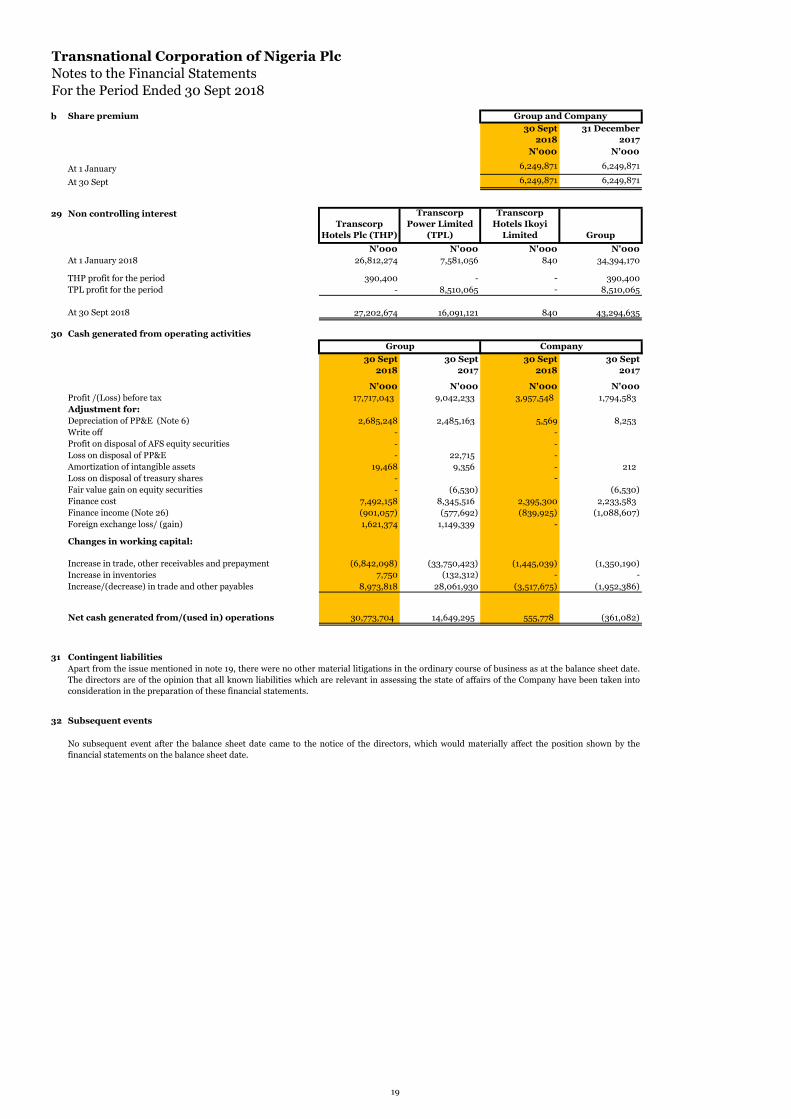
b Share premium
30 Sept
2018
31 December
2017
N'000 N'000
At 1 January 6,249,871 6,249,871
At 30 Sept 6,249,871 6,249,871
29 Non controlling interestTranscorp
Hotels Plc (THP)
Transcorp
Power Limited
(TPL)
Transcorp
Hotels Ikoyi
Limited Group
N'000 N'000 N'000 N'000
At 1 January 2018 26,812,274 7,581,056 840 34,394,170
THP profit for the period 390,400 - - 390,400
TPL profit for the period - 8,510,065 - 8,510,065
At 30 Sept 2018 27,202,674 16,091,121 840 43,294,635
30 Cash generated from operating activities
30 Sept
2018
30 Sept
2017
30 Sept
2018
30 Sept
2017
N'000 N'000 N'000 N'000
Profit /(Loss) before tax 17,717,043 9,042,233 3,957,548 1,794,583
Adjustment for:
Depreciation of PP&E (Note 6) 2,685,248 2,485,163 5,569 8,253
Write off - -
Profit on disposal of AFS equity securities - -
Loss on disposal of PP&E - 22,715 -
Amortization of intangible assets 19,468 9,356 - 212
Loss on disposal of treasury shares - -
Fair value gain on equity securities - (6,530) (6,530)
Finance cost 7,492,158 8,345,516 2,395,300 2,233,583
Finance income (Note 26) (901,057) (577,692) (839,925) (1,088,607)
Foreign exchange loss/ (gain) 1,621,374 1,149,339 -
Changes in working capital:
(6,842,098) (33,750,423) (1,445,039) (1,350,190)
Increase in inventories 7,750 (132,312) - -
Increase/(decrease) in trade and other payables 8,973,818 28,061,930 (3,517,675) (1,952,386)
30,773,704 14,649,295 555,778 (361,082)
31
32 Subsequent events
Group and Company
Group Company
Increase in trade, other receivables and prepayment
Apart from the issue mentioned in note 19, there were no other material litigations in the ordinary course of business as at the balance sheet date.
The directors are of the opinion that all known liabilities which are relevant in assessing the state of affairs of the Company have been taken into
consideration in the preparation of these financial statements.
Net cash generated from/(used in) operations
Contingent liabilities
No subsequent event after the balance sheet date came to the notice of the directors, which would materially affect the position shown by the
financial statements on the balance sheet date.
19


![Nestlé Nigeria - Cowryassetcowryasset.com/cowry_admin/reports_archives/reports[211].pdf · Nestle Nigeria Plc Posts Average FY 2018 Performance… Nestle Nigeria Plc (NESTLE _) recorded](https://img.pdfslide.us/doc/110x75/5e3411afeb10c4350f24992f/nestl-nigeria-211pdf-nestle-nigeria-plc-posts-average-fy-2018-performance.jpg)