Embed Size (px)
Citation preview
Transmission X-ray diffraction as a new toolfor diamond fluid inclusion studies
E. M. SMITH1,*, M. G. KOPYLOVA
1, L. DUBROVINSKY2, O. NAVON
3, J. RYDER4
AND E. L. TOMLINSON5
1 Department of Earth and Ocean Sciences, University of British Columbia, 6339 Stores Road, Vancouver, British
Columbia V6T1Z4, Canada2 Bayerisches Geoinstitut, Universitat Bayreuth, 95440 Bayreuth, Germany3 Institute of Earth Sciences, The Hebrew University of Jerusalem, 91904, Israel4 Dianor Resources Inc., 649 3rd Avenue, Val-d’Or, Quebec J9P 1S7, Canada5 Department of Earth Sciences, Royal Holloway University of London, Egham, Surrey TW20 0EX, UK
[Received 18 April 2011; Accepted 15 July 2011]
ABSTRACT
Transmission X-ray diffraction is demonstrated as a new tool for examining daughter minerals withinsub-micrometre-size fluid inclusions in fibrous diamond. In transmission geometry, the X-ray beampasses through the sample, interacting with a volume of material. Fibrous diamonds from Mbuji-Mayi,Democratic Republic of Congo; the Wawa area, Ontario, Canada; and the Panda kimberlite, EkatiMine, Northwest Territories and the Jericho kimberlite, Nunavut, Canada were analysed using X-raysfrom a high-brilliance lab source and a synchrotron source. Daughter minerals present include themica-group mineral celadonite, sylvite, halite, dolomite and other carbonates. This represents the firstpositive identification of halide minerals in fibrous diamond. Mineral inclusions such as forsteriticolivine and pyrope garnet were also found. Unexpectedly, daughter minerals were identified in only tenof the 38 diamonds analysed, despite their concentrations being greater than experimentally provendetection limits. The presence of significant amounts of amorphous or dissolved material appearsunlikely, but cannot be ruled out. Alternatively, the results may indicate a wide variety of relateddaughter minerals, such that most phases fall below the detection limits. Transmission X-ray diffractionshould be applied cautiously to the study of fibrous diamond, as it provides an incomplete account ofthe fluid-inclusion mineralogy.
KEYWORDS: fibrous diamond, fluid inclusion, X-ray diffraction, daughter mineral, synchrotron.
Introduction
THE millions of sub-micrometre-size mineral and
fluid inclusions that may be trapped in fibrous
diamond represent direct samples of the natural
diamond-forming environment and are crucial for
understanding diamond genesis. The composi-
tions of fluid inclusions in fibrous diamond
worldwide define two trends: (1) a range from
silicic (Si-, Al- and water-rich) to low-Mg
carbonatitic (Ca- and carbonate-rich) and (2) a
range from saline (K-, Cl- and water-rich) to high-
Mg carbonatitic (Ca-, Mg- and carbonate-rich)
(Izraeli et al., 2001; Klein-BenDavid et al., 2009;
Weiss et al., 2009). The fluid inclusions contain
daughter minerals including mica, carbonates,
chlorides, apatite and quartz (Navon et al., 1988;
Guthrie et al., 1991; Walmsley and Lang, 1992;
Klein-BenDavid et al., 2006; Kopylova et al.,
2010).
Electron microprobe (EPMA), transmission
electron microscopy (TEM) and infrared spectro-
scopy (FTIR) methods have been used effectively
in the study of fluid inclusions. Analyses by
EPMA and TEM reveal inclusion chemistry and
TEM electron diffraction can identify crystal* E-mail: [email protected]: 10.1180/minmag.2011.075.5.2657
Mineralogical Magazine, October 2011, Vol. 75(5), pp. 2657–2675
# 2011 The Mineralogical Society
structures, but these methods only analyse one
inclusion at a time out of millions. Infrared
spectroscopy gives a bulk analysis of vibrational
groups, but unique mineral identification is
difficult, partly due to the limited data for
complex carbonates and silicates at high pressure
(Navon, 1991).
We used a novel application of transmission-
geometry X-ray diffraction (XRD) to identify
daughter minerals in fibrous diamond fluid
inclusions. The abundance and variable orienta-
tion of daughter minerals in fibrous diamond
make them analogous to a powder spread out in a
volume. Therefore, the approach is similar to
powder XRD in transmission geometry (e.g.
Cullity and Stock, 2001). It is a quick and non-
destructive tool that gives an in situ bulk analysis
of inclusion mineralogy.
The aim of this study was to develop the XRD
methodology for fibrous diamond fluid inclusions.
We show that the detection limit for this
technique is reasonably low, but the patterns
from some minerals are missing, so that XRD
does not give a reliable representation of the
daughter mineral assemblage. The need for high-
brilliance X-rays also limits the application of this
technique. Nevertheless, XRD can accurately
detect some daughter minerals, making it a
potential complement to EPMA or FTIR methods.
Samples
Diamonds from four localities were studied. The
samples comprised: nineteen diamonds from
Mbuji-Mayi, Democratic Republic of Congo; ten
diamonds from Wawa, Ontario, Canada; eight
diamonds from the Panda kimberlite, Ekati mine,
Northwest Territories, Canada; and one diamond
from the Jericho kimberlite, Nunavut, Northwest
Territories, Canada (Fig. 1).
The Democratic Republic of Congo diamonds
(prefix MMZ) include fibrous cuboids and coated
octahedra, 3�8 mm on edge, with grey, grey-
green, grey-brown and yellow-grey colours. In
some cases the fibrous regions are concentrically
zoned, with multiple growth layers punctuated by
turbidity variations. All of the samples had been
laser cut to extract ~0.5 mm plate sections from
the centre. The cut surfaces were polished.
Previous EPMA, FTIR and Raman spectroscopy
on the samples showed that the silicic�low-Mg-
carbonatitic fluid inclusions within them
contained sheet silicates, carbonates and apatite
(Kopylova et al., 2010).
The Wawa samples (prefix W) include
1�2 mm grey and black fibrous cuboids, fibrous
dodecahedra, fibrous diamond coat and one non-
fibrous diamond with a high density of inclusions.
The non-fibrous sample (W8) has a granular
texture and irregular, rough surfaces. The Wawa
diamonds were recovered from a polymictic
metaconglomerate unit of the Michipicoten
Greenstone Belt, which is located in the southwest
part of the Superior craton.
The diamonds from the Panda kimberlite
(prefix Pan) at the Ekati mine include coated
octahedra with a grey coat colour, 1�4 mm on
edge. Sample fragments had been double-polished
to produce ~0.5 mm thick plates, and they had
been investigated by EPMA and FTIR
(Tomlinson et al., 2006) and by secondary ion
mass spectrometry (SIMS) and laser ablation
inductively coupled plasma mass spectrometry
LA-ICP-MS (Tomlinson et al., 2009) already.
The fluid inclusions are saline-rich and coexist
with peridotitic (7 samples) and eclogitic
(1 sample) mineral inclusions (Tomlinson et al.,
2006).
The single sample from the Jericho kimberlite
(J300339G) is a grey fibrous cuboid that is 1 mm
on edge.
Methods
Transmission-geometry XRD was used to investi-
gate the inclusions. An X-ray beam passes through
the sample and the diffraction pattern is recorded
by an area detector. An extensive XRD investiga-
tion of the samples was carried at the Bayerisches
Geoinstitut (BGI), Germany, followed by synchro-
tron XRD at the Advanced Photon Source (APS) at
Argonne National Laboratory in the USA.
Following XRD investigation, some of the
Wawa samples were examined with a scanning
electron microscope (SEM) coupled with energy-
dispersive X-ray spectrometry (EDS) to aid with
the interpretation of the XRD data.
Sample cleaning
The XRD technique used here is a bulk analysis
tool that is very sensitive to any surface
contaminants. To remove surface contaminants,
the samples were soaked in concentrated HF and
HNO3 (in a 3:1 mixture) at 50ºC for 24 h prior to
analysis at the BGI. However, the diffraction
patterns obtained at the BGI showed that some
samples retained traces of minerals and other
2658
E. M. SMITH ET AL.
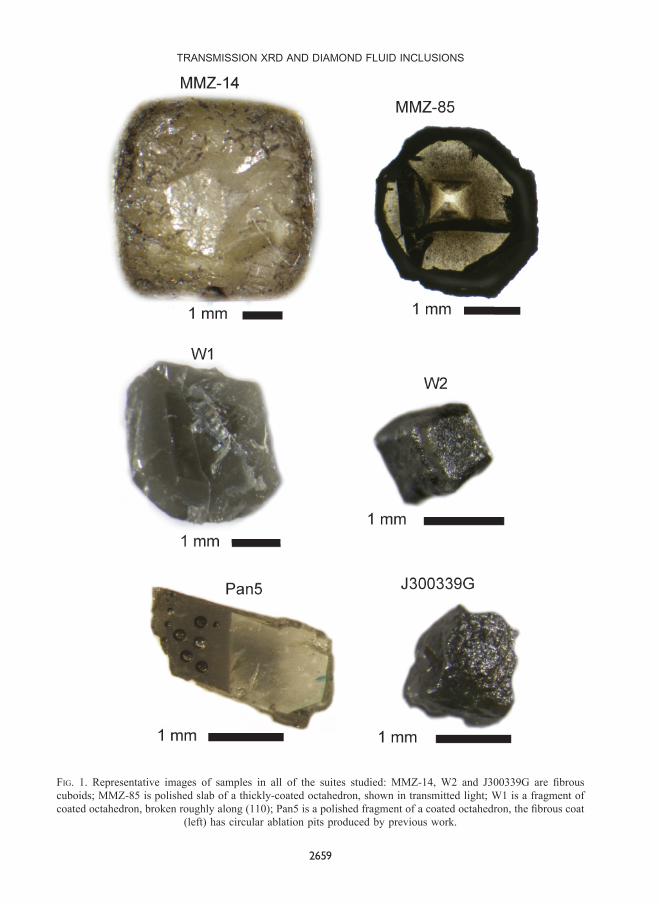
FIG. 1. Representative images of samples in all of the suites studied: MMZ-14, W2 and J300339G are fibrous
cuboids; MMZ-85 is polished slab of a thickly-coated octahedron, shown in transmitted light; W1 is a fragment of
coated octahedron, broken roughly along (110); Pan5 is a polished fragment of a coated octahedron, the fibrous coat
(left) has circular ablation pits produced by previous work.
TRANSMISSION XRD AND DIAMOND FLUID INCLUSIONS
2659
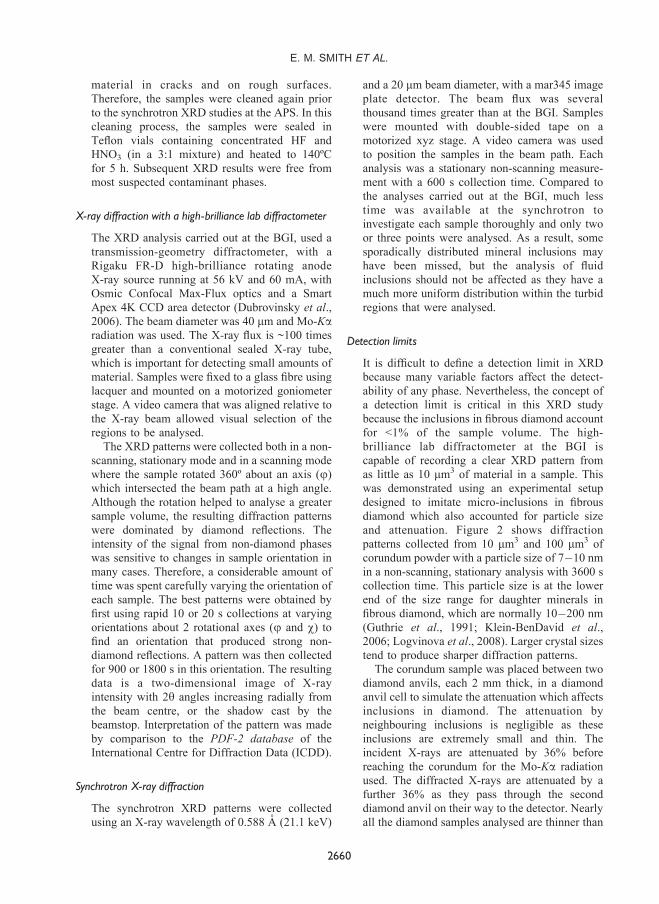
material in cracks and on rough surfaces.
Therefore, the samples were cleaned again prior
to the synchrotron XRD studies at the APS. In this
cleaning process, the samples were sealed in
Teflon vials containing concentrated HF and
HNO3 (in a 3:1 mixture) and heated to 140ºC
for 5 h. Subsequent XRD results were free from
most suspected contaminant phases.
X-ray diffraction with a high-brilliance lab diffractometer
The XRD analysis carried out at the BGI, used a
transmission-geometry diffractometer, with a
Rigaku FR-D high-brilliance rotating anode
X-ray source running at 56 kV and 60 mA, with
Osmic Confocal Max-Flux optics and a Smart
Apex 4K CCD area detector (Dubrovinsky et al.,
2006). The beam diameter was 40 mm and Mo-Karadiation was used. The X-ray flux is ~100 times
greater than a conventional sealed X-ray tube,
which is important for detecting small amounts of
material. Samples were fixed to a glass fibre using
lacquer and mounted on a motorized goniometer
stage. A video camera that was aligned relative to
the X-ray beam allowed visual selection of the
regions to be analysed.
The XRD patterns were collected both in a non-
scanning, stationary mode and in a scanning mode
where the sample rotated 360º about an axis (j)
which intersected the beam path at a high angle.
Although the rotation helped to analyse a greater
sample volume, the resulting diffraction patterns
were dominated by diamond reflections. The
intensity of the signal from non-diamond phases
was sensitive to changes in sample orientation in
many cases. Therefore, a considerable amount of
time was spent carefully varying the orientation of
each sample. The best patterns were obtained by
first using rapid 10 or 20 s collections at varying
orientations about 2 rotational axes (j and w) to
find an orientation that produced strong non-
diamond reflections. A pattern was then collected
for 900 or 1800 s in this orientation. The resulting
data is a two-dimensional image of X-ray
intensity with 2y angles increasing radially from
the beam centre, or the shadow cast by the
beamstop. Interpretation of the pattern was made
by comparison to the PDF-2 database of the
International Centre for Diffraction Data (ICDD).
Synchrotron X-ray diffraction
The synchrotron XRD patterns were collected
using an X-ray wavelength of 0.588 A (21.1 keV)
and a 20 mm beam diameter, with a mar345 image
plate detector. The beam flux was several
thousand times greater than at the BGI. Samples
were mounted with double-sided tape on a
motorized xyz stage. A video camera was used
to position the samples in the beam path. Each
analysis was a stationary non-scanning measure-
ment with a 600 s collection time. Compared to
the analyses carried out at the BGI, much less
time was available at the synchrotron to
investigate each sample thoroughly and only two
or three points were analysed. As a result, some
sporadically distributed mineral inclusions may
have been missed, but the analysis of fluid
inclusions should not be affected as they have a
much more uniform distribution within the turbid
regions that were analysed.
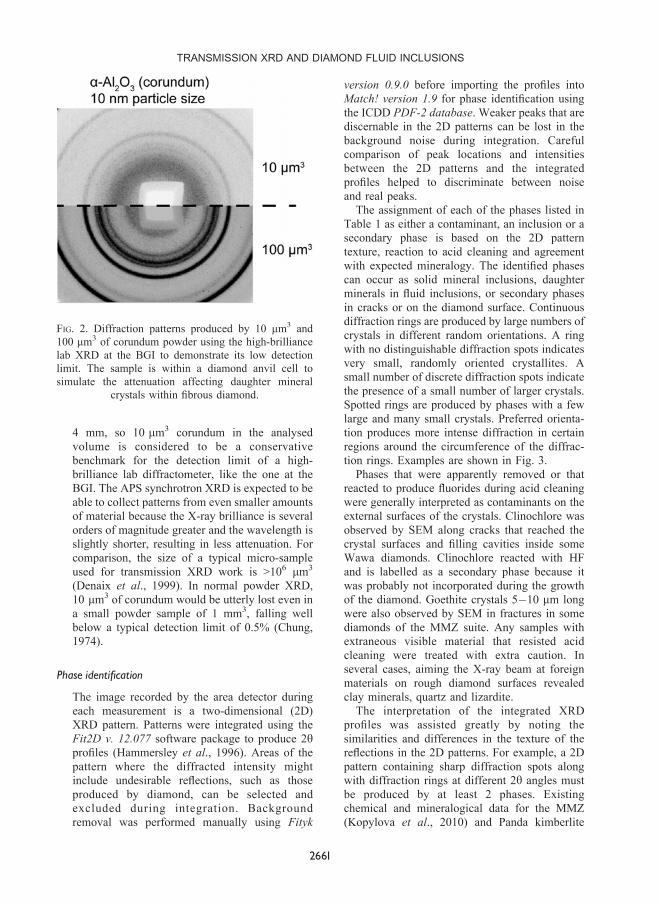
Detection limits
It is difficult to define a detection limit in XRD
because many variable factors affect the detect-
ability of any phase. Nevertheless, the concept of
a detection limit is critical in this XRD study
because the inclusions in fibrous diamond account
for <1% of the sample volume. The high-
brilliance lab diffractometer at the BGI is
capable of recording a clear XRD pattern from
as little as 10 mm3 of material in a sample. This
was demonstrated using an experimental setup
designed to imitate micro-inclusions in fibrous
diamond which also accounted for particle size
and attenuation. Figure 2 shows diffraction
patterns collected from 10 mm3 and 100 mm3 of
corundum powder with a particle size of 7�10 nm
in a non-scanning, stationary analysis with 3600 s
collection time. This particle size is at the lower
end of the size range for daughter minerals in
fibrous diamond, which are normally 10�200 nm
(Guthrie et al., 1991; Klein-BenDavid et al.,
2006; Logvinova et al., 2008). Larger crystal sizes
tend to produce sharper diffraction patterns.
The corundum sample was placed between two
diamond anvils, each 2 mm thick, in a diamond
anvil cell to simulate the attenuation which affects
inclusions in diamond. The attenuation by
neighbouring inclusions is negligible as these
inclusions are extremely small and thin. The
incident X-rays are attenuated by 36% before
reaching the corundum for the Mo-Ka radiation
used. The diffracted X-rays are attenuated by a
further 36% as they pass through the second
diamond anvil on their way to the detector. Nearly
all the diamond samples analysed are thinner than
2660
E. M. SMITH ET AL.
4 mm, so 10 mm3 corundum in the analysed
volume is considered to be a conservative
benchmark for the detection limit of a high-
brilliance lab diffractometer, like the one at the
BGI. The APS synchrotron XRD is expected to be
able to collect patterns from even smaller amounts
of material because the X-ray brilliance is several
orders of magnitude greater and the wavelength is
slightly shorter, resulting in less attenuation. For
comparison, the size of a typical micro-sample
used for transmission XRD work is >106 mm3
(Denaix et al., 1999). In normal powder XRD,
10 mm3 of corundum would be utterly lost even in
a small powder sample of 1 mm3, falling well
below a typical detection limit of 0.5% (Chung,
1974).
Phase identif|cation
The image recorded by the area detector during
each measurement is a two-dimensional (2D)
XRD pattern. Patterns were integrated using the
Fit2D v. 12.077 software package to produce 2yprofiles (Hammersley et al., 1996). Areas of the
pattern where the diffracted intensity might
include undesirable reflections, such as those
produced by diamond, can be selected and
excluded during integration. Background
removal was performed manually using Fityk
version 0.9.0 before importing the profiles into
Match! version 1.9 for phase identification using
the ICDD PDF-2 database. Weaker peaks that are
discernable in the 2D patterns can be lost in the
background noise during integration. Careful
comparison of peak locations and intensities
between the 2D patterns and the integrated
profiles helped to discriminate between noise
and real peaks.
The assignment of each of the phases listed in
Table 1 as either a contaminant, an inclusion or a
secondary phase is based on the 2D pattern
texture, reaction to acid cleaning and agreement
with expected mineralogy. The identified phases
can occur as solid mineral inclusions, daughter
minerals in fluid inclusions, or secondary phases
in cracks or on the diamond surface. Continuous
diffraction rings are produced by large numbers of
crystals in different random orientations. A ring
with no distinguishable diffraction spots indicates
very small, randomly oriented crystallites. A
small number of discrete diffraction spots indicate
the presence of a small number of larger crystals.
Spotted rings are produced by phases with a few
large and many small crystals. Preferred orienta-
tion produces more intense diffraction in certain
regions around the circumference of the diffrac-
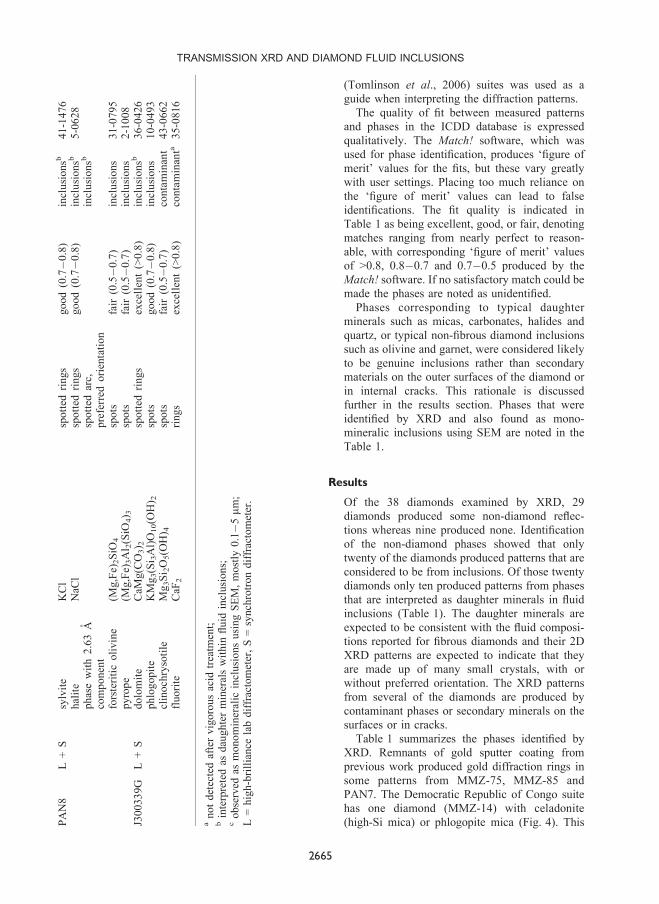
tion rings. Examples are shown in Fig. 3.
Phases that were apparently removed or that
reacted to produce fluorides during acid cleaning
were generally interpreted as contaminants on the
external surfaces of the crystals. Clinochlore was
observed by SEM along cracks that reached the
crystal surfaces and filling cavities inside some
Wawa diamonds. Clinochlore reacted with HF
and is labelled as a secondary phase because it
was probably not incorporated during the growth
of the diamond. Goethite crystals 5�10 mm long
were also observed by SEM in fractures in some
diamonds of the MMZ suite. Any samples with
extraneous visible material that resisted acid
cleaning were treated with extra caution. In
several cases, aiming the X-ray beam at foreign
materials on rough diamond surfaces revealed
clay minerals, quartz and lizardite.
The interpretation of the integrated XRD
profiles was assisted greatly by noting the
similarities and differences in the texture of the
reflections in the 2D patterns. For example, a 2D
pattern containing sharp diffraction spots along
with diffraction rings at different 2y angles must
be produced by at least 2 phases. Existing
chemical and mineralogical data for the MMZ
(Kopylova et al., 2010) and Panda kimberlite
FIG. 2. Diffraction patterns produced by 10 mm3 and
100 mm3 of corundum powder using the high-brilliance
lab XRD at the BGI to demonstrate its low detection
limit. The sample is within a diamond anvil cell to
simulate the attenuation affecting daughter mineral
crystals within fibrous diamond.
TRANSMISSION XRD AND DIAMOND FLUID INCLUSIONS
2661
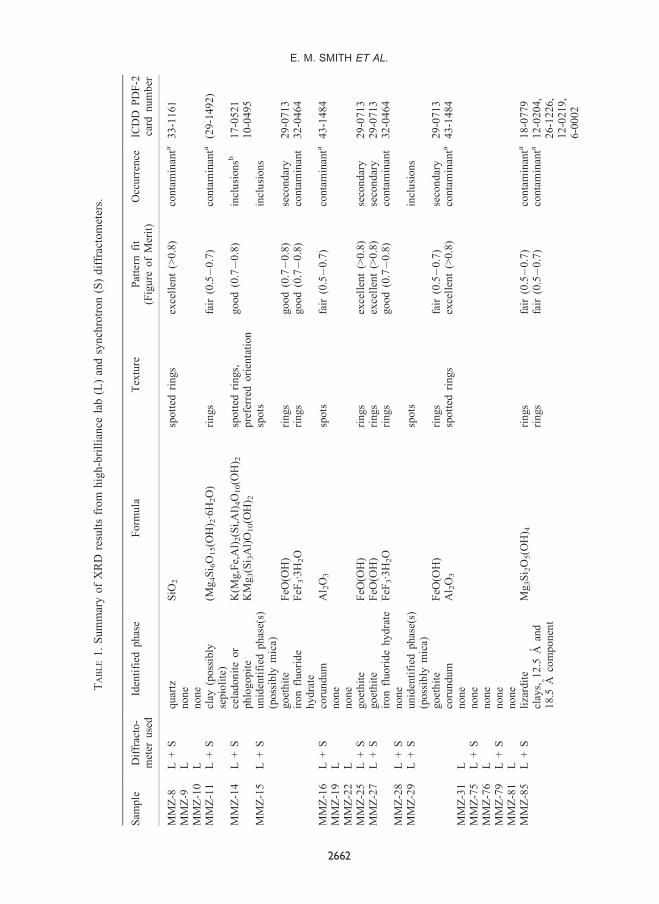
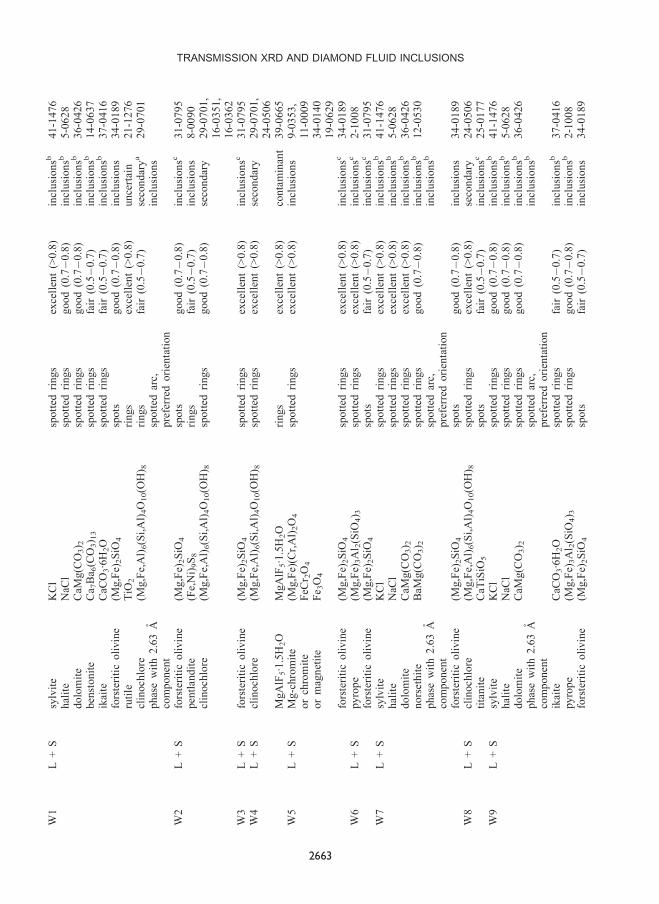
TA
BLE
1.Sum
mar
yofX
RD
resu
lts
from
hig
h-b
rillia
nce
lab
(L)an
dsy
nch
rotron
(S)diffrac
tom
eter
s.
Sam
ple
Diffr
acto
-m
eter
use
dId
entified
phas
eForm
ula
Tex
ture
Pat
tern
fit
(Fig
ure
of
Mer
it)
Occ
urr
ence
ICD
DPD
F-2
card
num
ber
MM
Z-8
L+
Squar
tzSiO
2sp
otted
rings
exce
llen
t(>
0.8
)co
nta
min
anta
33-1
161
MM
Z-9
Lnone
MM
Z-1
0L
none
MM
Z-1
1L
+S
clay
(poss
ibly
sepio
lite
)(M
g4Si 6
O15(O
H) 2
·6H
2O
)rings
fair
(0.5�
0.7
)co
nta
min
anta
(29-1
492)
MM
Z-1
4L
+S
cela
donite
or
phlo
gopite
K(M
g,F
e,A
l)2(S
i,A
l)4O
10(O
H) 2
KM
g3(S
i 3A
l)O
10(O
H) 2
spotted
rings,
pre
ferr
edorien
tation
good
(0.7�
0.8
)in
clusionsb
17-0
521
10-0
495
MM
Z-1
5L
+S
unid
entified
phas
e(s)
(poss
ibly
mic
a)
spots
incl
usions
goet
hite
FeO
(OH
)rings
good
(0.7�
0.8
)se
condar
y29-0
713
iron
fluoride
hydra
teFeF
3·3
H2O
rings
good
(0.7�
0.8
)co
nta
min
ant
32-0
464
MM
Z-1
6L
+S
coru
ndum
Al 2
O3
spots
fair
(0.5�
0.7
)co
nta
min
anta
43-1
484
MM
Z-1
9L
none
MM
Z-2
2L
none
MM
Z-2
5L
+S
goet
hite
FeO
(OH
)rings
exce
llen
t(>
0.8
)se
condar
y29-0
713
MM
Z-2
7L
+S
goet
hite
FeO
(OH
)rings
exce
llen
t(>
0.8
)se
condar
y29-0
713
iron
fluoride
hydra
teFeF
3·3
H2O
rings
good
(0.7�
0.8
)co
nta
min
ant
32-0
464
MM
Z-2
8L
+S
none
MM
Z-2
9L
+S
unid
entified
phas
e(s)
(poss
ibly
mic
a)
spots
incl
usions
goet
hite
FeO
(OH
)rings
fair
(0.5�
0.7
)se
condar
y29-0
713
coru
ndum
Al 2
O3
spotted
rings
exce
llen
t(>
0.8
)co
nta
min
anta
43-1
484
MM
Z-3
1L
none
MM
Z-7
5L
+S
none
MM
Z-7
6L
none
MM
Z-7
9L
+S
none
MM
Z-8
1L
none
MM
Z-8
5L
+S
liza
rdite
Mg
3Si 2
O5(O
H) 4
rings
fair
(0.5�
0.7
)co
nta
min
anta
18-0
779
clay
s,12.5
Aan
d18.5
Aco
mponen
trings
fair
(0.5�
0.7
)co
nta
min
anta
12-0
204,
26-1
226,
12-0
219,
6-0
002
2662
E. M. SMITH ET AL.
W1
L+
Ssy
lvite
KCl
spotted
rings
exce
llen
t(>
0.8
)in
clusionsb
41-1
476
hal
ite
NaC
lsp
otted
rings
good
(0.7�
0.8
)in
clusionsb
5-0
628
dolo
mite
CaM
g(C
O3) 2
spotted
rings
good
(0.7�
0.8
)in
clusionsb
36-0
426
ben
stonite
Ca 7
Ba 6
(CO
3) 1
3sp
otted
rings
fair
(0.5�
0.7
)in
clusionsb
14-0
637
ikai
teCaC
O3·6
H2O
spotted
rings
fair
(0.5�
0.7
)in
clusionsb
37-0
416
fors
teritic
olivin
e(M
g,F
e)2SiO
4sp
ots
good
(0.7�
0.8
)in
clusions
34-0
189
rutile
TiO
2rings
exce
llen
t(>
0.8
)unce
rtai
n21-1
276
clin
ochlo
re(M
g,F
e,A
l)6(S
i,A
l)4O
10(O
H) 8
rings
fair
(0.5�
0.7
)se
condar
ya
29-0
701
phas
ew
ith
2.6
3A
com
ponen
tsp
otted
arc,
pre
ferr
edorien
tation
incl
usions
W2
L+
Sfo
rste
ritic
olivin
e(M
g,F
e)2SiO
4sp
ots
good
(0.7�
0.8
)in
clusionsc
31-0
795
pen
tlandite
(Fe,
Ni)
9S
8rings
fair
(0.5�
0.7
)in
clusions
8-0
090
clin
ochlo
re(M
g,F
e,A
l)6(S
i,A
l)4O
10(O
H) 8
spotted
rings
good
(0.7�
0.8
)se
condar
y29-0
701,
16-0
351,
16-0
362
W3
L+
Sfo
rste
ritic
olivin
e(M
g,F
e)2SiO
4sp
otted
rings
exce
llen
t(>
0.8
)in
clusionsc
31-0
795
W4
L+
Scl
inochlo
re(M
g,F
e,A
l)6(S
i,A
l)4O
10(O
H) 8
spotted
rings
exce
llen
t(>
0.8
)se
condar
y29-0
701,
24-0
506
MgA
lF5·1
.5H
2O
MgA
lF5·1
.5H
2O
rings
exce
llen
t(>
0.8
)co
nta
min
ant
39-0
665
W5
L+
SM
g-c
hro
mite
or
chro
mite
or
mag
net
ite
(Mg,F
e)(C
r,A
l)2O
4
FeC
r 2O
4
Fe 3
O4
spotted
rings
exce
llen
t(>
0.8
)in
clusions
9-0
353,
11-0
009
34-0
140
19-0
629
fors
teritic
olivin
e(M
g,F
e)2SiO
4sp
otted
rings
exce
llen
t(>
0.8
)in
clusionsc
34-0
189
W6
L+
Spyro
pe
(Mg,F
e)3A
l 2(S
iO4) 3
spotted
rings
exce
llen
t(>
0.8
)in
clusionsc
2-1
008
fors
teritic
olivin
e(M
g,F
e)2SiO
4sp
ots
fair
(0.5�
0.7
)in
clusionsc
31-0
795
W7
L+
Ssy
lvite
KCl
spotted
rings
exce
llen
t(>
0.8
)in
clusionsb
41-1
476
hal
ite
NaC
lsp
otted
rings
exce
llen
t(>
0.8
)in
clusionsb
5-0
628
dolo
mite
CaM
g(C
O3) 2
spotted
rings
exce
llen
t(>
0.8
)in
clusionsb
36-0
426
nors
eth
ite
BaM
g(C
O3) 2
spotted
rings
good
(0.7�
0.8
)in
clusionsb
12-0
530
phas
ew
ith
2.6
3A
com
ponen
tsp
otted
arc,
pre
ferr
edorien
tation
incl
usionsb
fors
teritic
olivin
e(M
g,F
e)2SiO
4sp
ots
good
(0.7�
0.8
)in
clusions
34-0
189
W8
L+
Scl
inochlo
re(M
g,F
e,A
l)6(S
i,A
l)4O
10(O
H) 8
spotted
rings
exce
llen
t(>
0.8
)se
condar
y24-0
506
tita
nite
CaT
iSiO
5sp
ots
fair
(0.5�
0.7
)in
clusionsc
25-0
177
W9
L+
Ssy
lvite
KCl
spotted
rings
good
(0.7�
0.8
)in
clusionsb
41-1
476
hal
ite
NaC
lsp
otted
rings
good
(0.7�
0.8
)in
clusionsb
5-0
628
dolo
mite
CaM
g(C
O3) 2
spotted
rings
good
(0.7�
0.8
)in
clusionsb
36-0
426
phas
ew
ith
2.6
3A
com
ponen
tsp
otted
arc,
pre
ferr
edorien
tation
incl
usionsb
ikai
teCaC
O3·6
H2O
spotted
rings
fair
(0.5�
0.7
)in
clusionsb
37-0
416
pyro
pe
(Mg,F
e)3A
l 2(S
iO4) 3
spotted
rings
good
(0.7�
0.8
)in
clusionsb
2-1
008
fors
teritic
olivin
e(M
g,F
e)2SiO
4sp
ots
fair
(0.5�
0.7
)in
clusions
34-0
189
TRANSMISSION XRD AND DIAMOND FLUID INCLUSIONS
2663
Tab
le1
(contd
.)
Sam
ple
Diffr
acto
-m
eter
use
dId
entified
phas
eForm
ula
Tex
ture
Pat
tern
fit
(Fig
ure
of
Mer
it)
Occ
urren
ceIC
DD
PD
F-2
card
num
ber
W36
Scl
inoch
lore
(Mg,F
e,A
l)6(S
i,A
l)4O
10(O
H) 8
spotted
rings
exce
llen
t(>
0.8
)se
condar
y29-0
701,
24-0
506
PA
N1
L+
Snors
ethite
BaM
g(C
O3) 2
spots
good
(0.7�
0.8
)in
clusi
onsb
12-0
530
dolo
mite
CaM
g(C
O3) 2
spots
fair
(0.5�
0.7
)in
clusi
onsb
36-0
426
sylv
ite
KCl
spots
fair
(0.5�
0.7
)in
clusi
onsb
41-1
476
phas
ew
ith
2.6
3A
com
ponen
tsp
otted
arc,
pre
ferred
orienta
tion
incl
usi
onsb
fors
teritic
olivin
e(M
g,F
e)2SiO
4sp
ots
fair
(0.5�
0.7
)in
clusi
ons
31-0
795
sellaite
or
LiM
gFeF
6M
gF
2LiM
gFeF
6rings
good
(0.7�
0.8
)co
nta
min
anta
41-1
443
23-1
193
hec
torite
-15A
Na 0
.2(M
g,L
i)3Si 4
O10(O
H) 2
·4H
2O
rings
fair
(0.5�
0.7
)co
nta
min
anta
25-1
385
PA
N2
L+
Ssy
lvite
KCl
spotted
rings
exce
llen
t(>
0.8
)in
clusi
onsb
41-1
476
phas
ew
ith
2.6
3A
com
ponen
tsp
otted
arc,
pre
ferred
orienta
tion
incl
usi
onsb
eite
lite
Na 2
Mg(C
O3) 2
spots
fair
(0.5�
0.7
)in
clusi
onsb
24-1
227
bar
ium
chlo
ride
hydra
teBaC
l 2·H
2O
spots
fair
(0.5�
0.7
)in
clusi
onsb
39-1
305
fors
teritic
olivin
e(M
g,F
e)2SiO
4sp
ots
fair
(0.5�
0.7
)in
clusi
ons
34-0
189
PA
N3
L+
Sfo
rste
ritic
olivin
e(M
g,F
e)2SiO
4sp
otted
rings
exce
llen
t(>
0.8
)in
clusi
ons
34-0
189
PA
N4
L+
Som
phac
ite
(Na,
Ca)
(Al,M
g)S
i 2O
6sp
otted
rings
exce
llen
t(>
0.8
)in
clusi
ons
42-0
568,
17-0
522
PA
N5
L+
Ssy
lvite
KCl
spotted
rings
good
(0.7�
0.8
)in
clusi
onsb
41-1
476,
26-0
921
pyro
pe
(Mg,F
e)3A
l 2(S
iO4) 3
spotted
rings
exce
llen
t(>
0.8
)in
clusi
ons
2-1
008
PA
N6
L+
Sunid
entified
phas
e(s)
(poss
ibly
olivin
e,gar
net
,ca
rbonat
e)
spots
incl
usi
ons
PA
N7
L+
Ssy
lvite
KCl
spotted
rings
fair
(0.5�
0.7
)in
clusi
onsb
41-1
476
dolo
mite
CaM
g(C
O3) 2
spotted
rings
fair
(0.5�
0.7
)in
clusi
onsb
36-0
426
hal
ite
NaC
lsp
otted
rings
fair
(0.5�
0.7
)in
clusi
onsb
5-0
628
phas
ew
ith
2.6
3A
com
ponen
tsp
otted
arc,
pre
ferred
orienta
tion
incl
usi
onsb
fors
teritic
olivin
e(M
g,F
e)2SiO
4sp
ots
fair
(0.5�
0.7
)in
clusi
ons
31-0
795
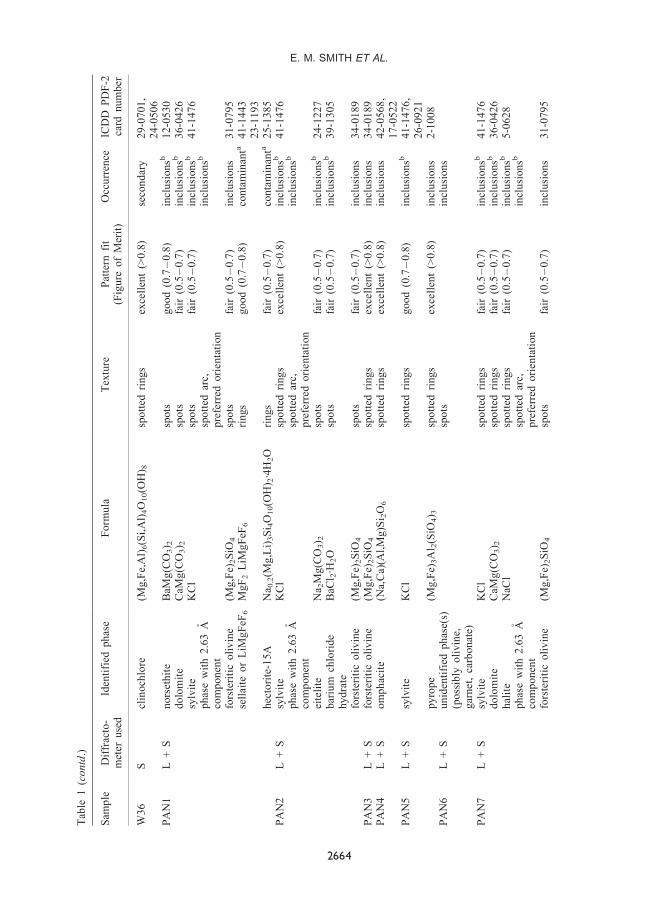
2664
E. M. SMITH ET AL.
(Tomlinson et al., 2006) suites was used as a
guide when interpreting the diffraction patterns.
The quality of fit between measured patterns
and phases in the ICDD database is expressed
qualitatively. The Match! software, which was
used for phase identification, produces ‘figure of
merit’ values for the fits, but these vary greatly
with user settings. Placing too much reliance on
the ‘figure of merit’ values can lead to false
identifications. The fit quality is indicated in
Table 1 as being excellent, good, or fair, denoting
matches ranging from nearly perfect to reason-
able, with corresponding ‘figure of merit’ values
of >0.8, 0.8�0.7 and 0.7�0.5 produced by the
Match! software. If no satisfactory match could be
made the phases are noted as unidentified.
Phases corresponding to typical daughter
minerals such as micas, carbonates, halides and
quartz, or typical non-fibrous diamond inclusions
such as olivine and garnet, were considered likely
to be genuine inclusions rather than secondary
materials on the outer surfaces of the diamond or
in internal cracks. This rationale is discussed
further in the results section. Phases that were
identified by XRD and also found as mono-
mineralic inclusions using SEM are noted in the
Table 1.
Results
Of the 38 diamonds examined by XRD, 29
diamonds produced some non-diamond reflec-
tions whereas nine produced none. Identification
of the non-diamond phases showed that only
twenty of the diamonds produced patterns that are
considered to be from inclusions. Of those twenty
diamonds only ten produced patterns from phases
that are interpreted as daughter minerals in fluid
inclusions (Table 1). The daughter minerals are
expected to be consistent with the fluid composi-
tions reported for fibrous diamonds and their 2D
XRD patterns are expected to indicate that they
are made up of many small crystals, with or
without preferred orientation. The XRD patterns
from several of the diamonds are produced by
contaminant phases or secondary minerals on the
surfaces or in cracks.
Table 1 summarizes the phases identified by
XRD. Remnants of gold sputter coating from
previous work produced gold diffraction rings in
some patterns from MMZ-75, MMZ-85 and
PAN7. The Democratic Republic of Congo suite
has one diamond (MMZ-14) with celadonite
(high-Si mica) or phlogopite mica (Fig. 4). ThisPA
N8
L+
Ssy
lvite
KCl
spotted
rings
good
(0.7�
0.8
)in
clusionsb
41-1
476
hal
ite
NaC
lsp
otted
rings
good
(0.7�
0.8
)in
clusionsb
5-0
628
phas
ew
ith
2.6
3A
com
ponen
tsp
otted
arc,
pre
ferr
edorien
tation
incl
usionsb
fors
teritic
olivin
e(M
g,F
e)2SiO
4sp
ots
fair
(0.5�
0.7
)in
clusions
31-0
795
pyro
pe
(Mg,F
e)3A
l 2(S
iO4) 3
spots
fair
(0.5�
0.7
)in
clusions
2-1
008
J300339G
L+
Sdolo
mite
CaM
g(C
O3) 2
spotted
rings
exce
llen
t(>
0.8
)in
clusionsb
36-0
426
phlo
gopite
KM
g3(S
i 3A
l)O
10(O
H) 2
spots
good
(0.7�
0.8
)in
clusions
10-0
493
clin
ochry
sotile
Mg
3Si 2
O5(O
H) 4
spots
fair
(0.5�
0.7
)co
nta
min
ant
43-0
662
fluorite
CaF
2rings
exce
llen
t(>
0.8
)co
nta
min
anta
35-0
816
anotdet
ecte
daf
ter
vig
oro
us
acid
trea
tmen
t;b
inte
rpre
ted
asdau
ghte
rm
iner
als
within
fluid
incl
usions;
cobse
rved
asm
onom
iner
alic
incl
usions
using
SEM
,m
ostly
0.1�
5mm
;L
=hig
h-b
rillia
nce
lab
diffrac
tom
eter
,S
=sy
nch
rotron
diffrac
tom
eter
.
TRANSMISSION XRD AND DIAMOND FLUID INCLUSIONS
2665
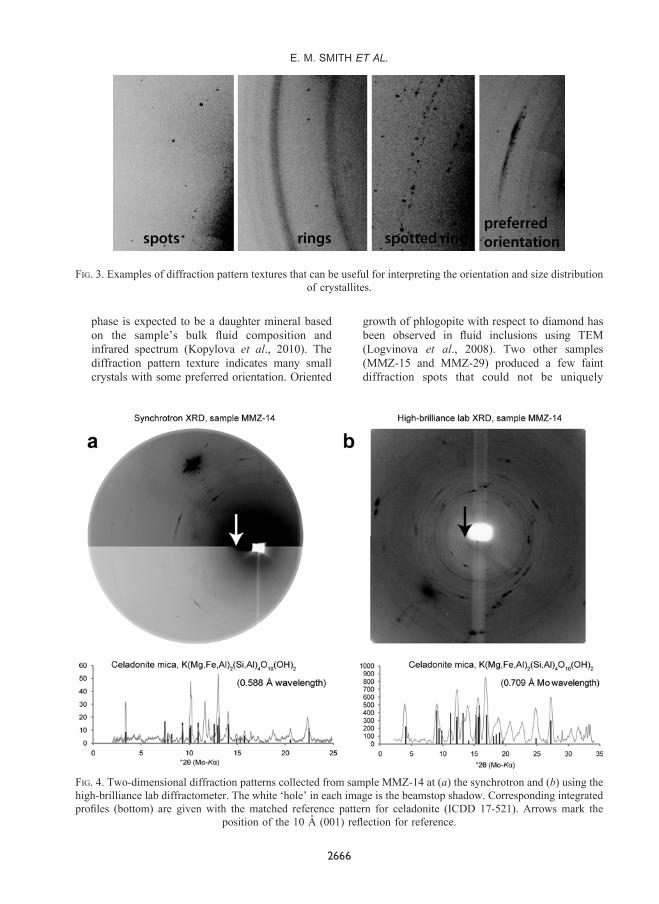
phase is expected to be a daughter mineral based
on the sample’s bulk fluid composition and
infrared spectrum (Kopylova et al., 2010). The
diffraction pattern texture indicates many small
crystals with some preferred orientation. Oriented
growth of phlogopite with respect to diamond has
been observed in fluid inclusions using TEM
(Logvinova et al., 2008). Two other samples
(MMZ-15 and MMZ-29) produced a few faint
diffraction spots that could not be uniquely
FIG. 3. Examples of diffraction pattern textures that can be useful for interpreting the orientation and size distribution
of crystallites.
FIG. 4. Two-dimensional diffraction patterns collected from sample MMZ-14 at (a) the synchrotron and (b) using the
high-brilliance lab diffractometer. The white ‘hole’ in each image is the beamstop shadow. Corresponding integrated
profiles (bottom) are given with the matched reference pattern for celadonite (ICDD 17-521). Arrows mark the
position of the 10 A (001) reflection for reference.
2666
E. M. SMITH ET AL.
identified, but which may originate from one or a
small number of phlogopite-like mica inclusions.
The corundum found in MMZ-16 and MMZ-29
is most likely to be a contaminant from the
polishing paste that was used to remove the
sputtered coatings used for EPMA. The corundum
pattern is similar in both samples and disappeared
completely following more thorough cleaning.
Corundum is rare and occurs only in eclogitic
diamonds; it would be unusual to find it in such
abundance in two separate samples.
Visual X-ray targeting allowed the dark brown
material on the surfaces of several MMZ
diamonds to be identified as goethite. The
goethite also extends into cracks, producing a
red colour. Iron fluoride hydrate was found in
association with goethite. This fluoride-bearing
phase is believed to have formed during acid
cleaning and attests to the presence of goethite as
a surficial, non-inclusion phase. All other phases
found in the MMZ suite are thought to be
secondary minerals because they were detected
only in certain areas of the rough, external
surfaces of the diamonds and they could not be
found following the more rigorous acid cleaning.
The Wawa diamond suite includes three
samples that gave diffraction patterns with
sylvite, halite and dolomite, as well as benstonite
(Ca7Ba6(CO3)13), norsethite (BaMg(CO3)2) and
ikaite (CaCO3·6H2O), a hydrous carbonate that is
unstable at low pressures (Shahar et al., 2005).
These phases are interpreted as daughter minerals
in fluid inclusions, indicating that at least some
Wawa fibrous diamonds contain saline�high-Mg-
carbonatitic-type fluid inclusions. Interestingly,
the three diamonds with detected daughter
minerals (W1, W7 and W9) are all fibrous
diamond coat material. The Wawa fibrous
cuboids and the single non-fibrous polycrystalline
diamond did not reveal daughter mineral patterns.
Eight of the ten Wawa diamonds, including
fibrous coats and cuboids, contain mineral
inclusions typical of non-fibrous diamond such
as forsteritic olivine, pyrope garnet, spinel and
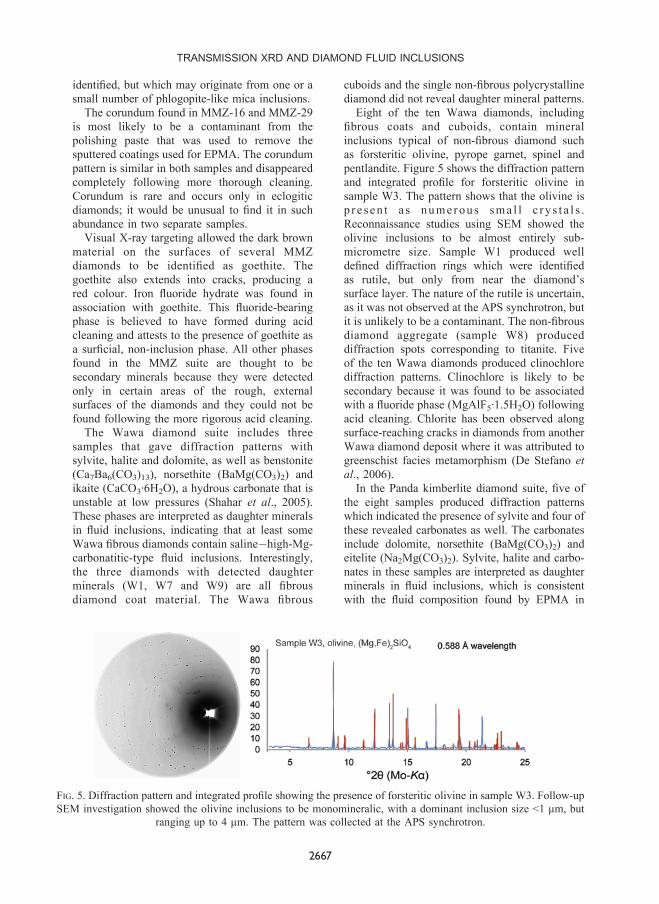
pentlandite. Figure 5 shows the diffraction pattern
and integrated profile for forsteritic olivine in
sample W3. The pattern shows that the olivine is
p r e s en t a s numerous sma l l c ry s t a l s .
Reconnaissance studies using SEM showed the
olivine inclusions to be almost entirely sub-
micrometre size. Sample W1 produced well
defined diffraction rings which were identified
as rutile, but only from near the diamond’s
surface layer. The nature of the rutile is uncertain,
as it was not observed at the APS synchrotron, but
it is unlikely to be a contaminant. The non-fibrous
diamond aggregate (sample W8) produced
diffraction spots corresponding to titanite. Five
of the ten Wawa diamonds produced clinochlore
diffraction patterns. Clinochlore is likely to be
secondary because it was found to be associated
with a fluoride phase (MgAlF5·1.5H2O) following
acid cleaning. Chlorite has been observed along
surface-reaching cracks in diamonds from another
Wawa diamond deposit where it was attributed to
greenschist facies metamorphism (De Stefano et
al., 2006).
In the Panda kimberlite diamond suite, five of
the eight samples produced diffraction patterns
which indicated the presence of sylvite and four of
these revealed carbonates as well. The carbonates
include dolomite, norsethite (BaMg(CO3)2) and
eitelite (Na2Mg(CO3)2). Sylvite, halite and carbo-
nates in these samples are interpreted as daughter
minerals in fluid inclusions, which is consistent
with the fluid composition found by EPMA in
FIG. 5. Diffraction pattern and integrated profile showing the presence of forsteritic olivine in sample W3. Follow-up
SEM investigation showed the olivine inclusions to be monomineralic, with a dominant inclusion size <1 mm, but
ranging up to 4 mm. The pattern was collected at the APS synchrotron.
TRANSMISSION XRD AND DIAMOND FLUID INCLUSIONS
2667
these samples (Tomlinson et al., 2006). In
common with the Wawa diamonds, the Panda
kimberlite samples produced diffraction spots for
minerals that are found in non-fibrous diamonds,
including forsteritic olivine, pyrope garnet and
omphacite. The diffraction spots from sample
PAN6 cannot be identified uniquely, but they may
be produced by olivine, garnet, or a carbonate.
These mineral inclusions were reported for these
Panda samples using FTIR and EPMA (Tomlinson
et al., 2006). However, several of the mineral
inclusions found by Tomlinson et al. (2006) were
not identified in the XRD patterns. For example,
neither clinopyroxene nor orthopyroxene were
found in the XRD patterns from samples PAN1,
PAN3, or PAN5.
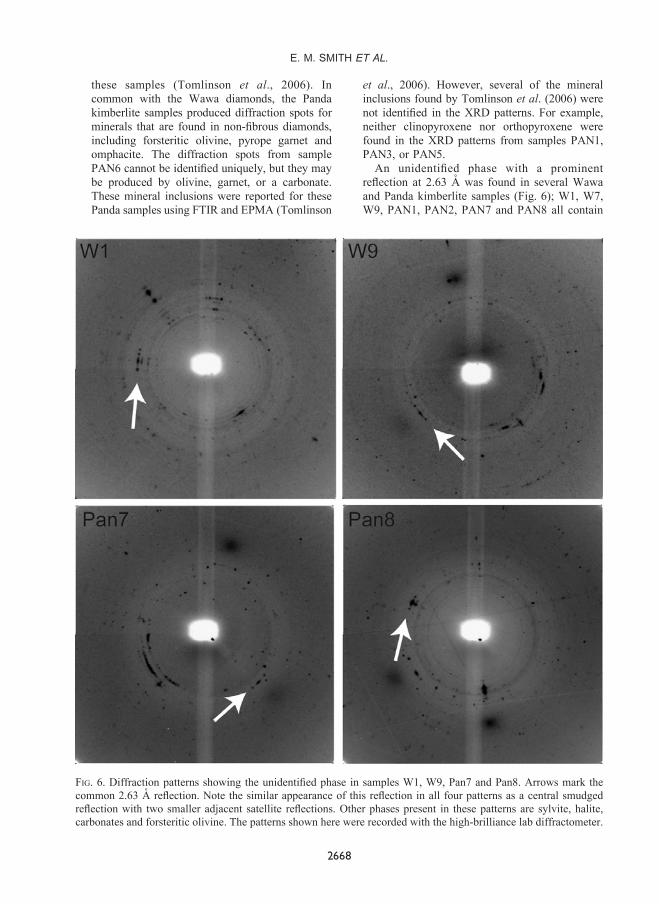
An unidentified phase with a prominent
reflection at 2.63 A was found in several Wawa
and Panda kimberlite samples (Fig. 6); W1, W7,
W9, PAN1, PAN2, PAN7 and PAN8 all contain
FIG. 6. Diffraction patterns showing the unidentified phase in samples W1, W9, Pan7 and Pan8. Arrows mark the
common 2.63 A reflection. Note the similar appearance of this reflection in all four patterns as a central smudged
reflection with two smaller adjacent satellite reflections. Other phases present in these patterns are sylvite, halite,
carbonates and forsteritic olivine. The patterns shown here were recorded with the high-brilliance lab diffractometer.
2668
E. M. SMITH ET AL.
this phase. The phase has a preferred orientation
with respect to the host diamond. All the samples
containing this 2.63 A phase also host chloride
and carbonate daughter minerals in fluid inclu-
sions, which suggest that the unidentified phase is
also a daughter mineral from the saline�high-
Mg-carbonatitic fluids. Although a reasonable
match could not be found, the unidentified phase
is suspected to be a carbonate, chloride, or
phosphate mineral.
The single Jericho sample (J300339G)
produced diffraction patterns for dolomite and
phlogopite when examined by XRD. Dolomite is
likely to be a daughter mineral in fluid inclusions.
Phlogopite may also be present as a daughter
mineral, but its pattern at the APS synchrotron
only showed several non-continuous diffraction
spots, rather than an arc or ring as would be
expected for abundant daughter crystals in fluid
inclusions. The Jericho sample also showed faint
diffraction rings for clinochrysotile, which is
suspected to be a contaminant, or possibly a
secondary mineral in cracks in the diamond.
Aside from the inclusions and other phases, the
diffraction patterns from the diamonds themselves
deserve mention. Most of the XRD patterns that
were collected without rotation, in random sample
orientations, contained either one (111) diamond
reflection or no diamond reflection at all. Patterns
collected with 360º sample rotation revealed a
symmetrical pattern of (111) and (220) diffraction
spots. These observations serve as a reminder that
fibrous diamond cuboids and fibrous diamond
coatings are not polycrystalline. Although fibrous
diamond has less crystal lattice perfection than
gem-quality diamond, the diamond ‘fibres’ share
a common crystallographic orientation and a
common nucleus, like the branches of a snow-
flake. Ballas is the truly polycrystalline variety of
fibrous diamond. As a matter of terminology,
‘monocrystalline diamond’ should not be used to
refer to non-fibrous, gem-quality diamond when
trying to distinguish it from fibrous diamond.
Discussion
Missing daughter mineral patternsThe XRD analysis was expected to reveal the
daughter mineralogy in all the fibrous diamond
samples. However, less than one third of the
fibrous diamonds that were examined produced
diffraction patterns for daughter minerals in fluid
inclusions, despite the fact that all the fibrous
diamond samples are turbid and clearly inclusion-
rich. Daughter mineral phases that were expected
on the basis of EPMA and FTIR studies include
phlogopite or celadonite-like high-Si mica,
Ca-Mg-Fe-Ba carbonates, apatite, quartz and
chlorides (Navon, 1991; Klein-BenDavid et al.,
2009; Kopylova et al., 2010). A crucial observa-
tion from TEM studies is that fluid inclusions in
fibrous diamond contain daughter crystals that are
capable of producing electron diffraction patterns
(Lang and Walmsley, 1983; Guthrie et al., 1991;
Klein-BenDavid et al., 2006).
On the basis of EPMA, FTIR and TEM studies,
the mineralogy of fluid inclusions in fibrous
diamond is dominated by phlogopite or high-Si
mica, Ca-Mg-Fe carbonates, apatite, K-Na chlor-
ides and quartz (Guthrie et al., 1991; Navon,
1991; Klein-BenDavid et al., 2006; Weiss et al.,
2010). The composition is fairly consistent from
one fluid inclusion to the next within single
diamonds, although some zonation has been
observed in EPMA (Klein-BenDavid et al.,
2004; Weiss et al., 2009; Kopylova et al.,
2010). Chemical variability between fluid inclu-
sions is also observed in TEM analyses, but it is
obscured by the loss of material from ruptured
inclusions (Klein-BenDavid et al., 2006).
We have three hypotheses to explain the poor
XRD response from daughter minerals: (1) the
abundance of daughter minerals is low and often
falls below the detection limit in XRD; (2) a
portion of the daughter mineral population is
actually amorphous or dissolved in residual fluid;
(3) the daughter mineral population comprises
many minerals with similar chemistry, such that
any one mineral is often not detectable in XRD.
These three explanations are discussed below.
Model 1: non-detectable daughter mineralsThe high-brilliance lab diffractometer can
detect the diffraction pattern from 10 mm3 of
corundum, with 7�10 nm particle size and
random orientation, within the analysed volume.
Aside from total volume and particle size, the
detectability of any phase is dependent on crystal
symmetry and average electron density. Minerals
that have highly symmetrical crystal structures
produce strong signals in XRD. Dense minerals
with closely spaced atoms or high average atomic
numbers have high overall electron density and
also tend to produce strong signals in XRD.
Crystal symmetry and electron density are
mineral-specific factors. Accordingly, the inten-
sity of the XRD pattern produced by 10 mm3 of
corundum will be different from the intensity
TRANSMISSION XRD AND DIAMOND FLUID INCLUSIONS
2669
produced by 10 mm3 of another mineral.
Empirical comparisons of XRD pattern intensity
can be used to account for this effect. Many ICDD
powder diffraction files contain published refer-
ence intensity ratios. The value, I/Ic, is a ratio of
the integrated profile intensity of any mineral (I)
compared to that of corundum (Ic) in a 50:50
mixture by mass. Despite the problems of
different minerals having different numbers of
peaks and peak positions, the intensity ratios
provide a straightforward approach to the
variation in XRD pattern intensity between
minerals. For our purposes, the I/Ic values
provide a good approximation for judging the
detection limits of other minerals based on the
detectability of 10 mm3 of corundum. Table 2 lists
I/Ic values for some minerals of relevance to the
fluid inclusions. The intensity of the pattern of
10 mm3 or about 40 pg of corundum collected
with the high-brilliance lab diffractometer (Fig. 2)
should be comparable to 40/(I/Ic) pg of another
mineral. For randomly oriented particles, this
mass accounts for the fact that only a fraction of
particles may be favourably oriented to diffract in
a stationary analysis. Diffraction from particles
with preferred orientation will vary somewhat
with sample orientation, although sample rotation
during XRD measurement did not improve our
results.
The calculated detectable masses for each
mineral can now be compared to the mineral
concentrations measured by FTIR for some of the
diamond samples. Table 3 shows the concentra-
tions of phlogopite and calcite using the
conversion factors developed by Weiss et al.
(2010) specifically for fibrous diamond. To
estimate the amount of each mineral intercepted
by the X-ray beam during XRD analysis,
concentrations were multiplied by the mass of
diamond analysed by the X-ray beam for the high-
brilliance lab diffractometer. A conservative
estimate of the volume analysed was calculated
using the beam diameter of 40 mm and the sample
thickness in its thinnest dimension. The ‘inter-
sected mass’, in picograms, is an estimate of the
amount of mineral in the volume analysed by the
X-ray beam with the high-brilliance lab diffract-
ometer, assuming a homogeneous inclusion
distribution. These amounts can be compared to
the values in Table 2. All the samples measured
contain enough phlogopite to exceed the 41 pg
‘detectable mass’, which is expected to produce
an XRD pattern with an intensity comparable to
that of 10 mm3 of corundum. Moreover, 11 of the
17 samples contain more than ten times the
detectable phlogopite mass. The XRD results
revealed celadonite or phlogopite mica in
MMZ-14, which has the third highest phlogopite
concentration according to FTIR and the third
highest calculated intersected mass of 1550 pg.
The phlogopite concentration is also reasonably
high in MMZ-29, which showed faint diffraction
spots from an unidentified phase that may be
phlogopite mica.
Calcite concentrations from FTIR are also
shown in Table 3. Some FTIR spectra did not
have clear carbonate peaks and the calcite entry
for those samples is blank. Eight of the 17
samples have enough calcite to meet or exceed
the 20 pg mass that is expected to be detectable
with the high-brilliance lab diffractometer. Two
samples contain more than ten times the
detectable mass of calcite. Compared to other
fibrous diamonds, the concentrations of phlogo-
TABLE 2. Reference intensity ratios of some daughter mineral phases with respect to corundum.
Mineral I/Ic Detectable mass, based on10 mm3 corundum (pg)
ICDD PDF-2card number for I/Ic
Corundum 40Calcite 2 20 5-0586Ankeritea 2.8 14 41-0586Phlogopite 0.97 41 34-0159Apatite 1.5 27 15-0876Quartz 3.6 11 33-1161Sylvite 3.9 10 4-0587
aAnkerite I/Ic value should be similar to dolomite. A dolomite value is not in the ICDD database.
2670
E. M. SMITH ET AL.
pite and calcite in the 17 MMZ samples are
generally low. Weiss et al. (2010) reported
concentrations in the range of 186�1188 ppm
for phlogopite/mica and 41�480 ppm for calcite
from 13 fibrous diamonds from six different
localities. This suggests that fibrous diamonds, in
general, should have daughter mineral concentra-
tions above the known detectable levels for the
high-brilliance lab XRD, at least for dominant
daughter minerals.
The estimated phlogopite and calcite contents
from FTIR suggest all 17 MMZ samples shown in
Table 3 should yield diffraction patterns for
phlogopite using a high-brilliance lab diffract-
ometer. Several of these samples should also yield
diffraction patterns for calcite. However, the
actual XRD results only had one sample
(MMZ-14) with a clear pattern for celadonite or
phlogopite mica. The results from the APS
synchrotron were similar to those from the high-
brilliance lab diffractometer, despite the signifi-
cantly lower expected detection limit.
The intensity of an XRD pattern also depends
on crystal perfection, orientation and attenuation
from surrounding phases. Crystal perfection and
orientation effects are less significant than
symmetry and electron density (Cullity and
Stock, 2001). Attenuation from diamond has
been more than accounted for by placing the
test 10 mm3 corundum sample in a diamond anvil
cell. Attenuation from fluid and other inclusions
surrounding each daughter mineral is insignificant
because the beam passes through very little of
these materials.
Peak broadening due to small crystallite size
introduces another potential limitation to
detecting daughter minerals. Peak broadening
varies inversely with crystallite size, increasing
rapidly below ~10 nm as the crystallite size
approaches the X-ray wavelength. Daughter
minerals imaged using TEM are normally
10�200 nm in size (Guthrie et al., 1991; Klein-
BenDavid et al., 2006; Logvinova et al., 2008)
and they should produce less broadening than the
7�10 nm particles in the corundum reference
sample. The XRD results could be taken as an
indication that a significant number of daughter
crystals fall at the lower end, or perhaps below,
the crystal size range observed in TEM.
Broadening is exaggerated by the thickness of
each sample when the thickness exceeds ~1% of
the sample-to-detector distance because the
variable distance between each crystallite and
the detector begins to have a significant effect.
For the high-brilliance diffractometer used, the
distance is only 50 mm, meaning the broadening
exhibited in Fig. 2 will roughly double for a 2 mm
thick sample. Thickness broadening is insignif-
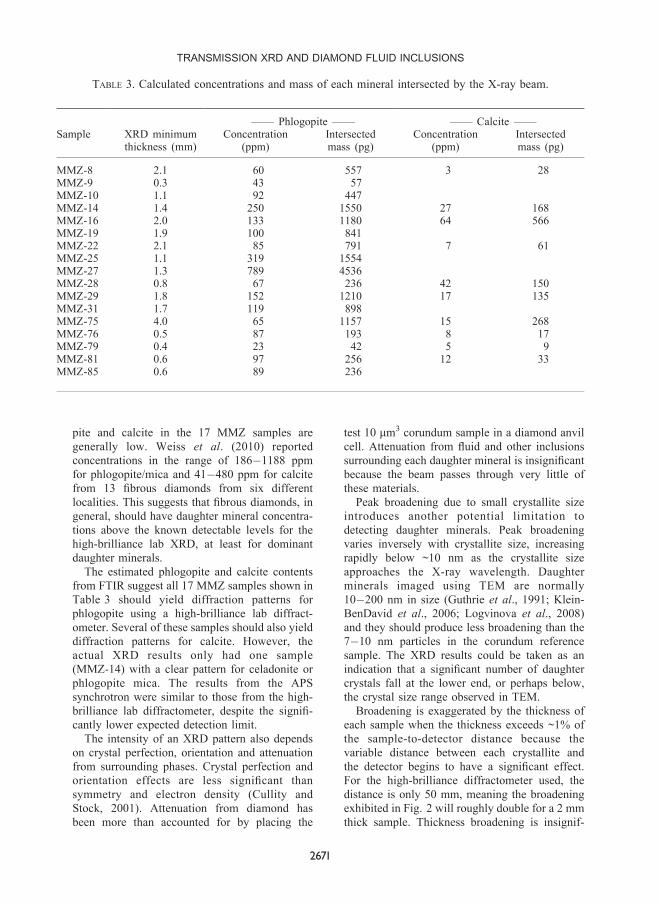
TABLE 3. Calculated concentrations and mass of each mineral intersected by the X-ray beam.
—— Phlogopite —— —— Calcite ——Sample XRD minimum
thickness (mm)Concentration
(ppm)Intersectedmass (pg)
Concentration(ppm)
Intersectedmass (pg)
MMZ-8 2.1 60 557 3 28MMZ-9 0.3 43 57MMZ-10 1.1 92 447MMZ-14 1.4 250 1550 27 168MMZ-16 2.0 133 1180 64 566MMZ-19 1.9 100 841MMZ-22 2.1 85 791 7 61MMZ-25 1.1 319 1554MMZ-27 1.3 789 4536MMZ-28 0.8 67 236 42 150MMZ-29 1.8 152 1210 17 135MMZ-31 1.7 119 898MMZ-75 4.0 65 1157 15 268MMZ-76 0.5 87 193 8 17MMZ-79 0.4 23 42 5 9MMZ-81 0.6 97 256 12 33MMZ-85 0.6 89 236
TRANSMISSION XRD AND DIAMOND FLUID INCLUSIONS
2671
icant at the 570 mm sample-to-detector distance
for the synchrotron XRD measurements. The
expression below includes the effects of broad-
ening due to crystallite size in the first term,
which is the Scherrer equation (Scherrer, 1918)
and sample thickness in the second term:
b ¼ Kle cos y
� �þ 2y� tan�1 d tan 2y
d þ t
� �� �ð1Þ
where b is the angular broadening, K is a shape
factor, l is the X-ray wavelength, e is the particle
size, y is the Bragg angle, d is the sample-to-
detector distance and t is the sample thickness
intersected by the beam. The crystallite shape
factor (K) is usually near 1 (Langford and Wilson,
1978) and has a smaller effect than the crystallite
size (e). Although thickness broadening is not
angular, it is expressed here as an angular
broadening so it may be added directly to the
Scherrer equation.
Another consideration which was taken into
account is the inclusion spacing compared to the
X-ray beam width. It is very unlikely that the
X-ray beam would pass through the sample
without intersecting fluid inclusions. Images of
fibrous diamond produced by TEM show a fluid
inclusion spacing on the order of ~5 mm (Klein-
BenDavid et al., 2006). The 40 mm diameter
X-ray beam produced by the high-brilliance lab
diffractometer would intersect ~104 inclusions in
a 1 mm path in such a diamond. The 20 mm X-ray
beam produced by the synchrotron would
intersect about 103 inclusions. Given the size of
the X-ray beams, the spacing of the fluid
inclusions and the sample dimensions, it is
likely that many inclusions were intersected by
the X-ray beam during each XRD analysis. Thus
the comparatively small volume analysed by
XRD should truly reflect the mineral concentra-
tions derived from the FTIR data.
The XRD detection limits are a serious
limitation and it is possible that some minor
daughter mineral phases such as apatite fall below
the detection limits. However, the detection limits
do not provide a clear-cut explanation for the
absence of XRD patterns from daughter minerals
for the samples examined. Even though it is
difficult to accurately define a detection limit for
the technique used, conservative estimates based
on XRD patterns from corundum and FTIR spectra
from 17 samples of the MMZ suite suggest that the
amount of phlogopite in all 17 samples should be
sufficient to produce diffraction patterns.
Model 2: Amorphous or dissolved materialA second explanation for the unexpectedly poor
detection of daughter minerals using XRD is that
some of the daughter phases are amorphous solids
or partly dissolved in residual fluid (Kopylova et
al., 2010). There are a few limited accounts of
amorphous solids in fibrous diamond. Quartz was
found coexisting with amorphous silica using
TEM analysis in a fluid inclusion in a fibrous
diamond coat (Guthrie et al., 1991). Analyses of
some turbid cuboid regions at the centre of
octahedral diamonds by TEM have identified
amorphous carbonate coexisting with crystalline
daughter minerals in fluid inclusions (Logvinova
et al., 2008). Glassy silicates have been reported
on the basis of FTIR and Raman studies of fibrous
cuboidal diamonds from Udachnaya (Zedgenizov
et al., 2004). Dissolution cavities have also been
found to contain varying amounts of amorphous
alumina, silica and carbonate (Klein-BenDavid et
al., 2007). Although these cavities are interpreted
to be distinct from fluid micro-inclusions, they
provide another example of amorphous solids in
fibrous diamond.
Studies of fibrous diamonds by TEM more
commonly reveal crystalline daughter minerals
inside fluid inclusions (Guthrie et al., 1991;
Walmsley and Lang, 1992; Klein-BenDavid et
al., 2006; Logvinova et al., 2008). These results
do not support the hypothesis that amorphous
solids are a major constituent of fibrous diamond
fluid inclusions. The possibility that the observed
crystals were produced inadvertently during
sample preparation via ion beam milling is
considered unlikely. Ion beam milling of the
sample foils produces a temperature increase of
less than a 10ºC at the ion beam site (Ishitani and
Yaguchi, 1996). Furthermore the pressure drop
caused by rupturing the fluid inclusions cannot be
responsible for triggering crystal growth because
intact inclusions contain crystalline daughter
minerals (Guthrie et al., 1991). If anything, the
beam energy would be more likely to cause
amorphization of existing crystals.
Aside from amorphous solids, the dissolved
mineral content in the residual fluid phase should
be considered. The fluid inclusions typically
contain 10�25% water, by mass (Weiss et al.,
2010). Mineral solubility in the water will be
elevated due to the high inclusion pressure and
salinity, but some simple calculations show the
dissolved load cannot be substantial. For example,
the molality of calcite in a H2O�NaCl system at
300 K and 1 GPa is well below 0.05 mol/kg
2672
E. M. SMITH ET AL.
(Newton and Manning, 2002; Duan and Li, 2008).
Translating this solubility to a fluid inclusion with
25% water means that the inclusion will contain
<<1% dissolved calcite. Therefore, it is likely that
only a minor component of most carbonates,
silicates and other daughter minerals could be
dissolved in the fluid phase at room temperature.
Overall, it appears unlikely that amorphous
solids and/or dissolved minerals could dominate
the daughter mineral population. Some mineral
peaks in infrared spectroscopy may be enhanced
by the combined contribution of crystals and
dissolved or amorphous material, giving the
impression that mineral concentrations are
higher than they really are. The poor XRD
response of daughter minerals may be partly,
but not entirely, explained by amorphous or
dissolved material.
Model 3: daughter mineral diversityAnother explanation for the poor general
detectability of daughter minerals by XRD may
be that the mineral population is made up of a
wide variety of minerals, rather than a few
dominant ones. As a result of this variety, each
mineral would be present in lower concentrations
and might not be detectable by XRD. Some
mineral concentrations calculated from FTIR
(Table 3) may not represent single minerals, but
may be due to overlaps in the spectral features
produced by related minerals. For example, a
diamond could contain many related carbonates
rather than calcite or dolomite alone.
Those daughter minerals that were detected by
XRD may come from growth regions with less
mineralogical variability. Several examples of
adjacent fluid micro-inclusions with different
daughter minerals have been shown in TEM
analyses (Klein-BenDavid et al., 2006; Logvinova
et al., 2008). Mineral variability may also be
exemplified in the Raman spectra for the MMZ
suite, which revealed peaks for possible apatite
and anapaite (Ca2Fe(PO4)2·4H2O) among the
phosphates; brucite, talc, serpentine and clino-
chlore among the hydrous magnesium-rich sheet
silicates; dolomite, calcite and kalicinite
(KHCO3) among the carbonates; biotite and
phlogopite among the micas; Mg-chromite,
ilmenite, magnetite and hematite among oxides;
as well as graphite, pyrope, forsterite, monticel-
lite, orthopyroxene, quartz, halite and bultfontei-
nite (Ca2(HSiO4)F·H2O) (Kopylova et al., 2010).
Another example of variability comes from two
Wawa samples (W1 and W9) that appear to
contain ikaite, a hydrous carbonate which is stable
only at high pressure (Shahar et al., 2005) along
with two anhydrous carbonates. Aside from
indicating mineralogical variability, these phases
may signify pressure variability amongst fluid
inclusions. The range in the size and shape of
fluid inclusions could elicit different elastic
strains in the diamond lattice, leading to a range
in inclusion pressures upon cooling from mantle
conditions. It should be noted that many of the
fluid inclusions have dislocations around them
(Klein-BenDavid et al., 2006; Logvinova et al.,
2008) that will affect the accommodation of stress
from the inclusion.
These observations support the idea that there
could be sufficient compositional and pressure
variability from inclusion to inclusion to produce
a range of different daughter minerals. Daughter
mineral diversity may be able to explain why
many samples produced no response on a high-
brilliance lab diffractometer. However, the results
from the APS synchrotron are harder to explain in
terms of mineral diversity. It would have to be
extreme, perhaps >100 different minerals, given
that the detection limit for the synchrotron
diffractometer is at least an order of magnitude
lower than the lab instrument.
Daughter mineral species
Sylvite and halite are confirmed for the first time
as prominent daughter minerals in fluid inclusions
in fibrous diamond. Chlorides are transparent in
the mid-IR range and they decompose rapidly in
the TEM (Klein-BenDavid et al., 2006) which
makes them difficult to identify. Previous
identifications of these halide minerals were
inconclusive, as they were based on fluid
inclusion chemistry (Klein-BenDavid et al.,
2006; Rondeau et al., 2007; Logvinova et al.,
2008; Kopylova et al., 2010) or non-unique
Raman peaks (Kopylova et al., 2010).
Sylvite and halite were found in the Wawa and
Panda kimberlite diamond suites. Fluid inclusions
in the Panda kimberlite suite have been shown to
have saline�high-Mg-carbonatitic-type composi-
tions (Tomlinson et al., 2006). The Wawa samples
with sylvite and halite were also found to have
chloride-rich micro-inclusions using SEM.
Another mineral of interest was also identified
in the Wawa sample suite. Two Wawa samples
produced XRD patterns that were a fair match to
the high-pressure mineral ikaite (CaCO3·6H2O).
This match is strengthened by the fact that the
TRANSMISSION XRD AND DIAMOND FLUID INCLUSIONS
2673
fluid inclusions are expected to be carbonate- and
water-rich and have high residual pressures
(Navon, 1991). Ikaite would be destroyed by the
loss of inclusion pressure during ion beam milling
for TEM analysis, leaving calcite or aragonite in
its place. Calcite formation is inhibited by Mg2+
and phosphate, but these ions have much less
effect on ikaite formation (Lippmann, 1959;
Dickens and Brown, 1970). The stability of
ikaite at room temperature requires an inclusion
pressure of at least 0.45 GPa (Shahar et al., 2005).
The actual pressure is probably higher. Quartz
peak shifts in infrared spectra indicate pressures
of 1.5�2.1 GPa in carbonatitic�silicic fluid
inclusions (Navon, 1991). Navon (1991) esti-
mated entrapment pressures of 4�7 GPa by
extrapolating along H2O�CO2 isochores to
upper mantle temperatures. Similar extrapolation,
starting with 0.45 GPa, means the fluid inclusions
in the Wawa diamonds were trapped at pressures
greater than 2.5 GPa.
Conclusions
We have demonstrated the use of transmission
XRD as a new tool for examining bulk daughter
mineralogy within fluid inclusions in fibrous
diamond as well as mineral micro-inclusions in
diamond. The low daughter mineral concentra-
tions within fibrous diamond require a high-
brilliance X-ray source. The detection limit for
such a diffractometer is <10 mm3 for corundum
powder in the analysed volume.
Identified daughter mineral phases include
celadonite or phlogopite-like mica, dolomite,
sylvite and halite as well as probable benstonite
(Ca7Ba6(CO3)13), norsethite (BaMg(CO3)2), eite-
lite (Na2Mg(CO3)2), ikaite (CaCO3·6H2O) and an
unidentified phase with a prominent reflection at
2.63 A. In addition to fluid inclusions, mineral
inclusions of forsteritic olivine, pyrope garnet,
pentlandite and other phases typical of non-
fibrous diamonds were identified.
Unexpectedly, only 10 out of the 38 diamonds
examined produced diffraction patterns with
daughter minerals. Low detection limits cannot
readily account for the poor response from major
daughter mineral phases. The presence of
significant amounts of amorphous or dissolved
material appears unlikely, but cannot be ruled out.
Presently, the preferred explanation is that there is
a wide variety of daughter minerals, thereby
lowering the concentration of any one mineral. It
is plausible that some samples contain sufficient
daughter mineral diversity such that no single
phase exceeds the detection limits for the XRD
techniques used. Overall, transmission X-ray
diffraction is capable of identifying common
daughter minerals, but tends to give an incom-
plete account of fluid inclusion mineralogy. It
may therefore be more valuable when accom-
panied by other techniques such as EPMA, TEM,
or FTIR.
Acknowledgements
We thank the Natural Sciences and Engineering
Research Council of Canada for support through a
grant to M. Kopylova. We also thank the German
Research Council for support through a DFG grant
to L. Dubrovinsky. Richard Wirth and an
anonymous reviewer are thanked for their many
helpful comments. Mati Raudsepp is acknowl-
edged for help with data interpretation and
background theory. Thanks are due to A.P.
Hammersley and ESRF for the use of the FIT2D
package. Data from the Advanced Photon Source
synchrotron was gathered at GSECARS 13 BMD,
with the help of Matt Newville and Steve Sutton.
Use of the Advanced Photon Source was supported
by the U. S. Department of Energy, Office of
Science, Office of Basic Energy Sciences, under
Contract No. DEAC0206CH11357.
References
Chung, F. (1974) Quantitative interpretation of X-ray
diffraction patterns of mixtures. I. Matrix-flushing
method for quantitative multicomponent analysis.
Journal of Applied Crystallography, 7, 519�525.
Cullity, B.D. and Stock, S.R. (2001) Elements of X-ray
Diffraction. Prentice Hall, Englewood Cliffs, New
Jersey, USA, 664 pp.
De Stefano, A., Lefebvre, N. and Kopylova, M. (2006)
Enigmatic diamonds in Archean calc-alkaline
lamprophyres of Wawa, southern Ontario, Canada.
Contributions to Mineralogy and Petrology, 151,
158�173.
Denaix, L., van Oort, F., Pernes, M. and Jongmans, A.G.
(1999) Transmission X-ray diffraction of undisturbed
soil microfabrics obtained by microdrilling in thin
sections. Clays and Clay Minerals, 47, 637�646.
Dickens, B. and Brown, W.E. (1970) Crystal structure of
calcium carbonate hexahydrate at ~�120º. Inorganic
Chemistry, 9, 480�486.
Duan, Z. and Li, D. (2008) Coupled phase and aqueous
species equilibrium of the H2O–CO2–NaCl–CaCO3
system from 0 to 250 ºC, 1 to 1000 bar with NaCl
concentrations up to saturation of halite. Geochimica
2674
E. M. SMITH ET AL.
et Cosmochimica Acta, 72, 5128�5145.
Dubrovinsky, L., Dubrovinskaia, N., Kantor, I., Nestola,
F. and Gatta, D. (2006) High-brilliance X-ray system
for high-pressure in-house research: applications for
studies of superhard materials. High Pressure
Research, 26, 137�143.
Guthrie, G.D.J., Veblenb, D.R., Navon, O. and
Rossman, G.R. (1991) Submicrometer fluid inclu-
sions in turbid-diamond coats. Earth and Planetary
Science Letters, 105, 1�12.
Hammersley, A., Svensson, S., Hanfland, M., Fitch, A.
and Hausermann, D. (1996) Two-dimensional
detector software: from real detector to idealised
image or two-theta scan. High Pressure Research,
14, 235�248.
Ishitani, T. and Yaguchi, T. (1996) Cross-sectional
sample preparation by focused ion beam: a review of
ion-sample interaction. Microscopy Research and
Technique, 35, 320�333.
Izraeli, E.S., Harris, J.W. and Navon, O. (2001) Brine
inclusions in diamonds: a new upper mantle fluid.
Earth and Planetary Science Letters, 187, 323�332.
Klein-BenDavid, O., Izraeli, E.S., Hauri, E. and Navon,
O. (2004) Mantle fluid evolution � a tale of one
diamond. Lithos, 77, 243�253.
Klein-BenDavid, O., Wirth, R. and Navon, O. (2006)
TEM imaging and analysis of microinclusions in
diamonds: a close look at diamond-growing fluids.
American Mineralogist, 91, 353�365.
Klein-BenDavid, O., Wirth, R. and Navon, O. (2007)
Micrometer-scale cavities in fibrous and cloudy
diamonds � a glance into diamond dissolution events.
Earth and Planetary Science Letters, 264, 89�103.
Klein-BenDavid, O., Logvinova, A.M., Schrauder, M.,
Spetius, Z.V., Weiss, Y., Hauri, E.H., Kaminsky,
F.V., Sobolev, N.V. and Navon, O. (2009) High-Mg
carbonatitic microinclusions in some Yakutian
diamonds � a new type of diamond-forming fluid.
Lithos, 112, 648�659.
Kopylova, M., Navon, O., Dubrovinsky, L. and
Khachatryan, G. (2010) Carbonatitic mineralogy of
natural diamond-forming fluids. Earth and Planetary
Science Letters, 291, 126�137.
Lang, A.R. and Walmsley, J.C. (1983) Apatite
inclusions in natural diamond coat. Physics and
Chemistry of Minerals, 9, 6�8.
Langford, J.I. and Wilson, A.J.C. (1978) Scherrer after
sixty years: A survey and some new results in the
determination of crystallite size. Journal of Applied
Crystallography, 11, 102�113.
Lippmann, F. (1959) Darstellung und kristallographische
daten von CaCO3·H2O. Die Naturwissenschaften, 19,
553�554.
Logvinova, A., Wirth, R., Fedorova, E. and Sobolev, N.
(2008) Nanometre-sized mineral and fluid inclusions
in cloudy Siberian diamonds: new insights on
diamond formation. European Journal of
Mineralogy, 20, 317�331.
Navon, O. (1991) High internal pressures in diamond
fluid inclusions determined by infrared absorption.
Nature, 353, 746�748.
Navon, O., Hutcheon, I.D., Rossman, G.R. and
Wasserburg, G.J. (1988) Mantle-derived fluids in
diamond micro-inclusions. Nature, 335, 784�789.
Newton, R.C. and Manning, C.E. (2002) Experimental
determination of calcite solubility in H2O-NaCl
solutions at deep crust/upper mantle pressures and
temperatures: implications for metasomatic pro-
cesses in shear zones. American Mineralogist, 87,
1401�1409.
Rondeau, B., Fritsch, E., Moore, M., Thomassot, E. and
Sirakian, J.F. (2007) On the growth of natural
octahedral diamond upon a fibrous core. Journal of
Crystal Growth, 304, 287�293.
Scherrer, P. (1918) Bestimmung der Grosse und der
inneren Struktur von Kolloidteilchen mittels
Rontgenstrahlen. Nachrichten von der Gesellschaft
der Wissenschaften zu Gottingen. Mathematisch-
physikalische Klasse, 2, 98�100.
Shahar, A., Bassett, W.A., Mao, H., Chou, I. and Mao,
W. (2005) The stability and Raman spectra of ikaite,
CaCO3·6H2O, at high pressure and temperature.
American Mineralogist, 90, 1835�1839.
Tomlinson, E.L., Jones, A.P. and Harris, J.W. (2006)
Co-existing fluid and silicate inclusions in mantle
diamond. Earth and Planetary Science Letters, 250,
581�595.
Tomlinson, E.L., Muller, W. and E.I.M.F. (2009) A
snapshot of mantle metasomatism: trace element
analysis of coexisting fluid (LA-ICP-MS) and
silicate (SIMS) inclusions in fibrous diamonds.
Earth and Planetary Science Letters, 279, 362�372.
Walmsley, J.C. and Lang, A.R. (1992) On sub-
micrometre inclusions in diamond coat: crystal-
lography and composition of ankerites and related
rhombohedral carbonates. Mineralogical Magazine,
56, 533�543.
Weiss, Y., Kessel, R., Griffin, W.L., Kiflawi, I., Klein-
BenDavid, O., Bell, D.R., Harris, J.W. and Navon,
O. (2009) A new model for the evolution of
diamond-forming fluids: evidence from microinclu-
sion-bearing diamonds from Kankan, Guinea. Lithos,
112, 660�674.
Weiss, Y., Kiflawi, I. and Navon, O. (2010) IR
spectroscopy: quantitative determination of the
mineralogy and bulk composition of fluid microinclu-
sions in diamonds. Chemical Geology, 275, 26�34.
Zedgenizov, D.A., Kagi, H., Shatsky, V.S. and Sobolev,
N.V. (2004) Carbonatitic melts in cuboid diamonds
from Udachnaya kimberlite pipe (Yakutia): evidence
from vibrational spectroscopy. Mineralogical
Magazine, 68, 61�73.
TRANSMISSION XRD AND DIAMOND FLUID INCLUSIONS
2675