Embed Size (px)
Citation preview

NREL is a national laboratory of the U.S. Department of Energy, Office of Energy Efficiency and Renewable Energy, operated by the Alliance for Sustainable Energy, LLC.
Transmission Planning in the Western Interconnection
David Hurlbut
BLM Transmission Training Webinar Series
Webinar 2
November 15, 2012

2
MAP Pending High Voltage Lines

NREL is a national laboratory of the U.S. Department of Energy, Office of Energy Efficiency and Renewable Energy, operated by the Alliance for Sustainable Energy, LLC.
Transmission Planning in the Western Interconnection
David Hurlbut
BLM Transmission Training Webinar Series
Webinar 2
November 15, 2012

4
Outline
• What are the different levels of transmission planning, who does them, and which are most relevant to siting on public lands?
• How does WECC’s regional planning work? • What is WECC looking at? • What are the challenges to moving from
planning to construction?
5
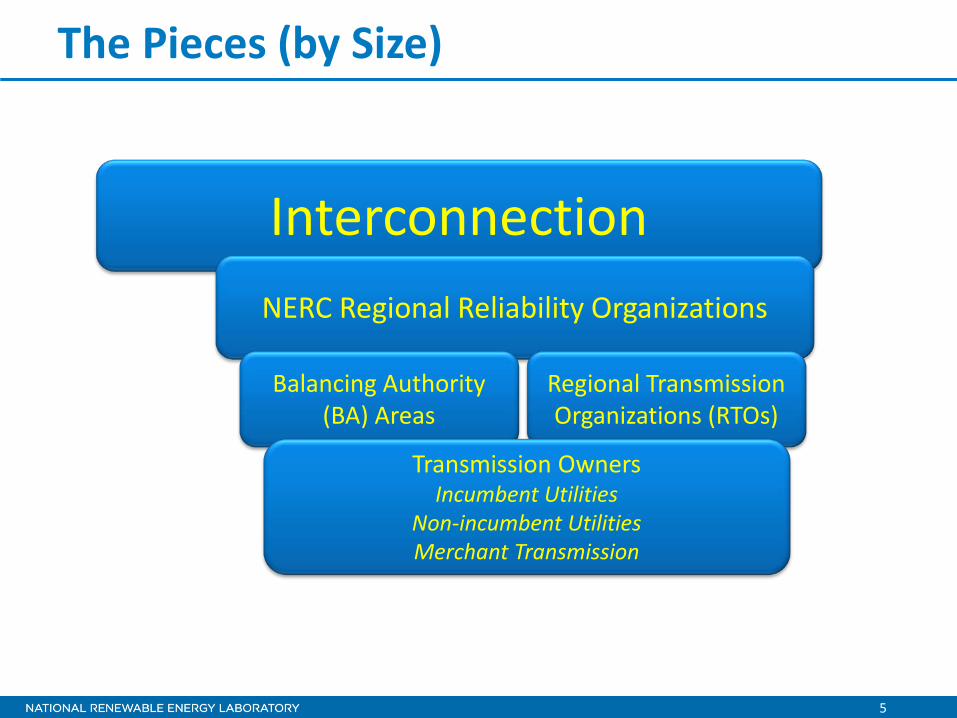
The Pieces (by Size)
Interconnection NERC Regional Reliability Organizations
Regional Transmission Organizations (RTOs)
Balancing Authority (BA) Areas
Transmission Owners Incumbent Utilities
Non-incumbent Utilities Merchant Transmission

6
FERC Order 890
• Transmission providers shall establish a coordinated, open and transparent planning process o Coordinate to ensure that the system is planned to
meet needs on a nondiscriminatory basis
• Planning principles o Coordination, openness, transparency, information
exchange, comparability, dispute resolution, regional participation, economic planning studies, and cost allocation for new projects
7
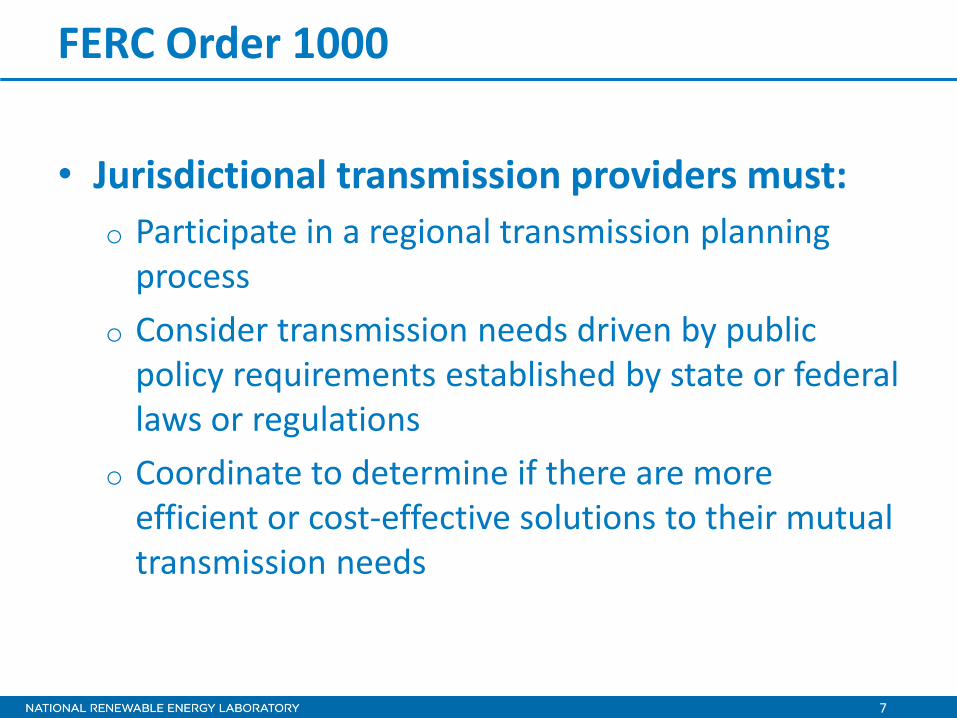
FERC Order 1000
• Jurisdictional transmission providers must: o Participate in a regional transmission planning
process o Consider transmission needs driven by public
policy requirements established by state or federal laws or regulations
o Coordinate to determine if there are more efficient or cost-effective solutions to their mutual transmission needs
8
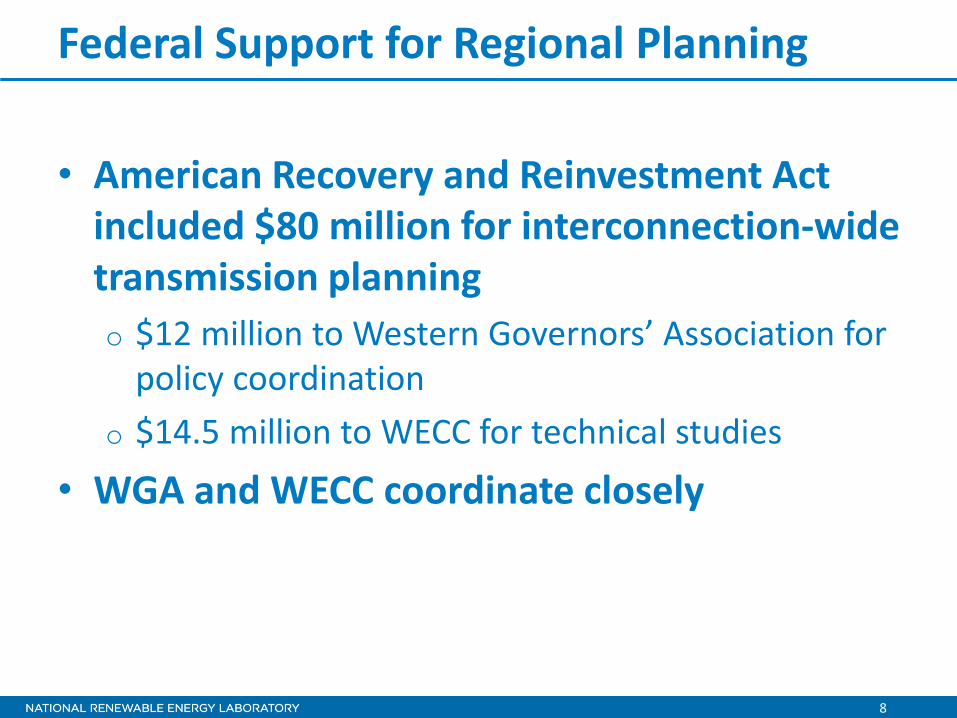
Federal Support for Regional Planning
• American Recovery and Reinvestment Act included $80 million for interconnection-wide transmission planning o $12 million to Western Governors’ Association for
policy coordination o $14.5 million to WECC for technical studies
• WGA and WECC coordinate closely

9
Two Types of Transmission Upgrades
• Reliability upgrades o Utilities coordinate through sub-regional planning
groups
• Economic upgrades to the bulk transmission system o WECC, and by regional groups (Northern Tier
Transmission Group, WestConnect)

10
Economic Upgrades
• Enable delivery of power at lower cost than is possible on the regional grid as it exists today
• Economic upgrades usually have reliability benefits as well
• Policy objectives: renewable energy • Planning ≠ construction
o Many lines are studied, only some actually happen o Those that happen need validation through study
11
Planning Questions
• How will load growth change utilization of the existing power system?
• Are there points on the system that will experience significant additional costs when they become stressed by additional load?
• Can the new cost points be fixed with a cost-effective line upgrade or expansion?

12
Planning Tool: Production Cost Modeling
• Optimization model o Simulates the conditions and operating constraints for
the entire system, then solves for the least-cost dispatch of existing generating fleet, usually over the course of a year
• Results allow comparison among different assumptions o Total cost of operating the system o Amount of power dispatched from each unit o Total emissions o Utilization and congestion on specific lines o Marginal cost of electric generation at specific points
13
Locational Marginal Pricing (LMPs)
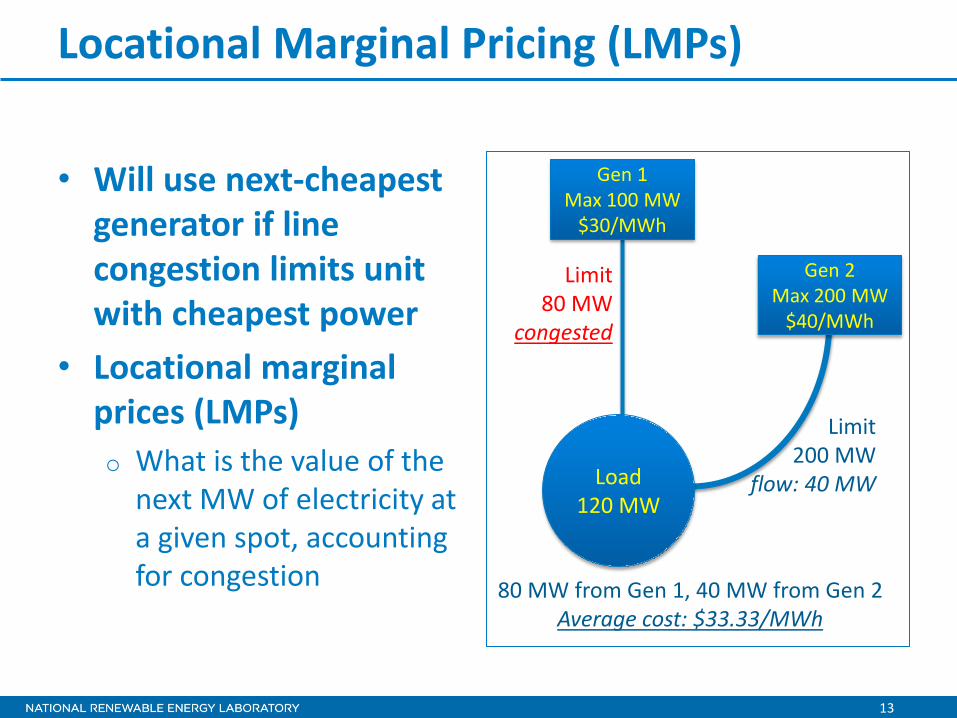
• Will use next-cheapest generator if line congestion limits unit with cheapest power
• Locational marginal prices (LMPs) o What is the value of the
next MW of electricity at a given spot, accounting for congestion
Gen 1 Max 100 MW
$30/MWh
Gen 2 Max 200 MW
$40/MWh
Load 120 MW
Limit 80 MW
congested
Limit 200 MW
flow: 40 MW
80 MW from Gen 1, 40 MW from Gen 2 Average cost: $33.33/MWh

14
Answers From Production Cost Modeling
• Do total costs go up or down when moving from one scenario to another?
• Do any lines become more congested, and how much additional cost does that create?
• Do some areas see more cost increase than others?
• Is there a change in the types of units used? (Such as switching between coal and natural gas)

15
What a Production Cost Model Doesn’t Do
• Does not add new generators or new transmission lines o Although it can say what it would be worth to do so
• Does not retire existing generation o Although it might not use a unit
• Does not capture capital cost o Assumes the utility/owner has done whatever it takes
to get the unit on line and keep it there o Only models variable operating cost (e.g. fuel, cost of
starting the unit) o Assumptions about fuel costs—especially natural
gas—are crucial to the outcome
16
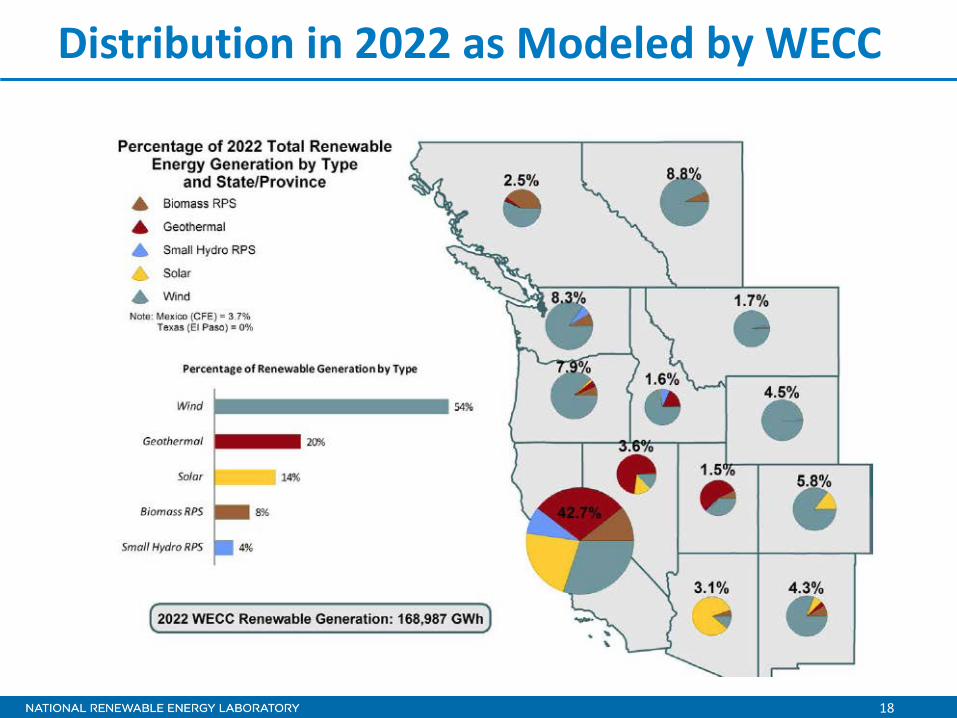
WECC’s Regional Planning for Renewables
• Base case: Model where renewables are economically most favorable today, using existing lines, current loading, and new lines under construction
• “Stress” the system by forcing another 6,000 MW of renewables in one state
17
18
Distribution in 2022 as Modeled by WECC
19
“Stress” Tests
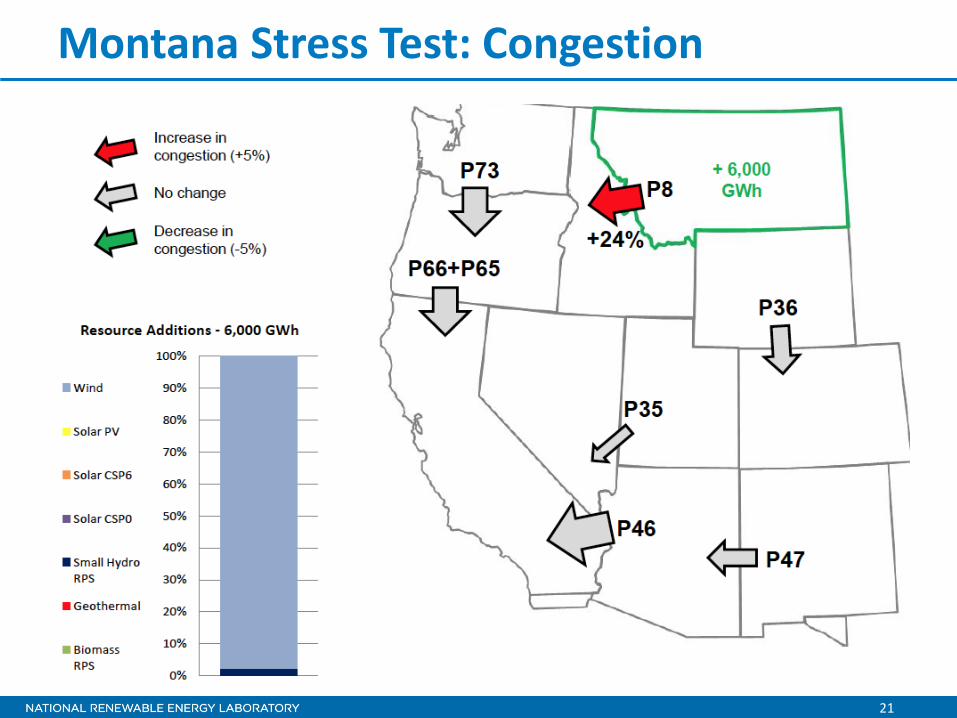
• Add 6,000 MW to the target state’s resource portfolio based on WGA Western Renewable Energy Zones o Does it create transmission congestion
somewhere on the system? o Does it change how other generation resources
are dispatched? o Does it cause curtailment, or does it cause
thermal resources to cycle excessively?
20
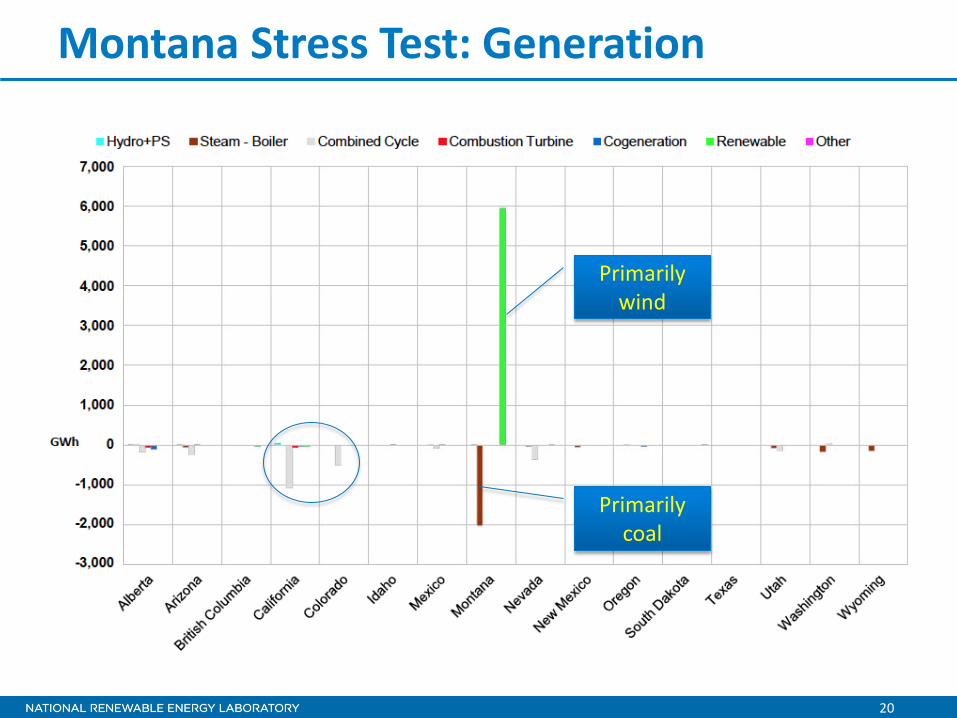
Montana Stress Test: Generation
Primarily wind
Primarily coal
21
Montana Stress Test: Congestion

22
New Planning Scenario: Drought
• Higher peak demand o Temperatures are higher, cooling systems run
more, electricity use increases
• Generation o Less power from hydro o More forced outages at coal, nuclear, natural gas
plants due to less water available for cooling
23
Drought Scenario Results
• Greater use of combined cycle natural gas units, due to loss of hydro
• Less use of coal and other steam units in Arizona, due to greater forced outages

Questions so far?
25
Operational Changes Under Study
• Changes to address the uncontrolled variability of wind and solar
• Paying for new transmission

26
Variability and Managing the Grid
• Variability has always been a factor in managing the grid o Electricity can’t be stored economically, so
generation must match the amount of electricity needed moment to moment
o Although daily load has general profiles, it can vary significantly moment to moment
o Utilities have always kept operating reserves on hand to address load variability
27
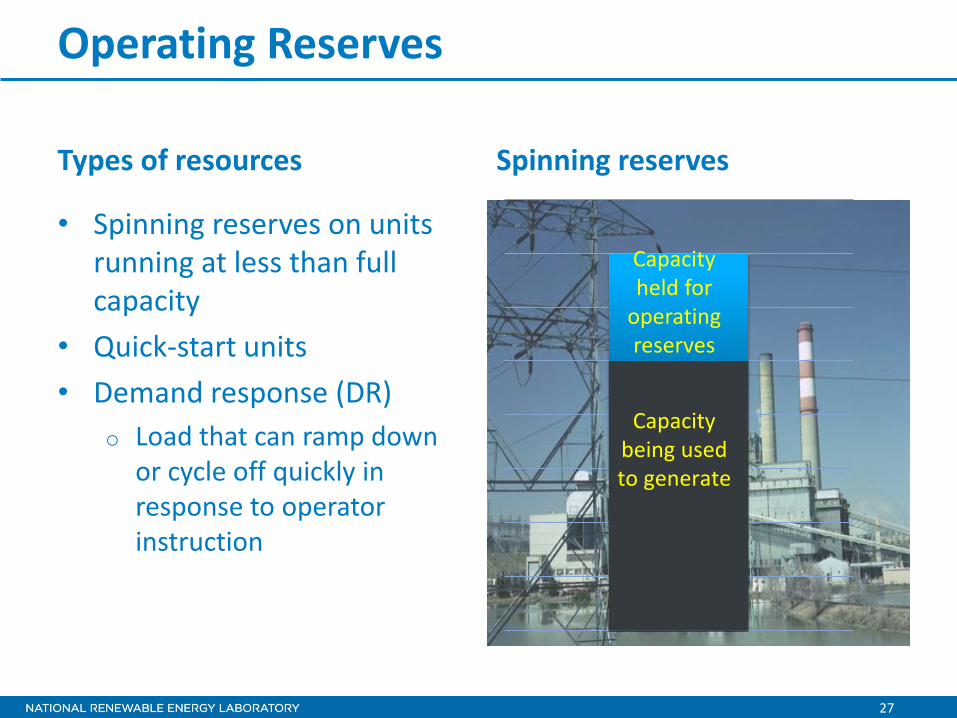
Operating Reserves
• Spinning reserves on units running at less than full capacity
• Quick-start units • Demand response (DR)
o Load that can ramp down or cycle off quickly in response to operator instruction
Capacity being used to generate
Types of resources Spinning reserves
Capacity held for
operating reserves

28
Seasonal Variability
Peak demand season
Spring shoulder Fall shoulder
Public Service of Colorado 2011 daily peak

29
Daily Variability
• Day-ahead schedule for starting, running generators
• How much base load capacity, how much intermediate capacity, how much peaking?
0
2,000
4,000
6,000
8,000
12:00 AM 6:00 AM 12:00 PM 6:00 PM 12:00 AM

30
Hourly Variability
• Load following o When actual load trends
higher than day-ahead forecast, deploy “up” reserves (run units slightly more)
o When actual load trends lower than day-ahead forecast, deploy “down” reserves (run units slightly less)
4,000
6,000
6:00 AM 9:00 AM 12:00 PM
“up” reserves
“down” reserves
Actual
Forecast

31
Intra-hour Variability
• Maintain system frequency
• Automatic generator control
5840
5870
32
Variability of Wind and Solar
• Wind and solar add to the variability already on the system
• Strategies for mitigating the additional variability o Manage with operating reserves already available o Forecasting o Geospatial diversity o Storage (but might not be most cost-effective
option)

33
Forecasting
• State-of-the-art forecasting for wind and solar can inform the day-ahead schedule
• If the forecast for net load fits actual net load better, hourly variability can be managed with existing reserves o net load = native load –
wind/solar generation • For purposes of day-ahead
scheduling, state-of-the-art forecasting is about as good as perfect forecasting 4,000
6,000
6:00 AM 9:00 AM 12:00 PM
With wind forecast
Without wind forecast
34
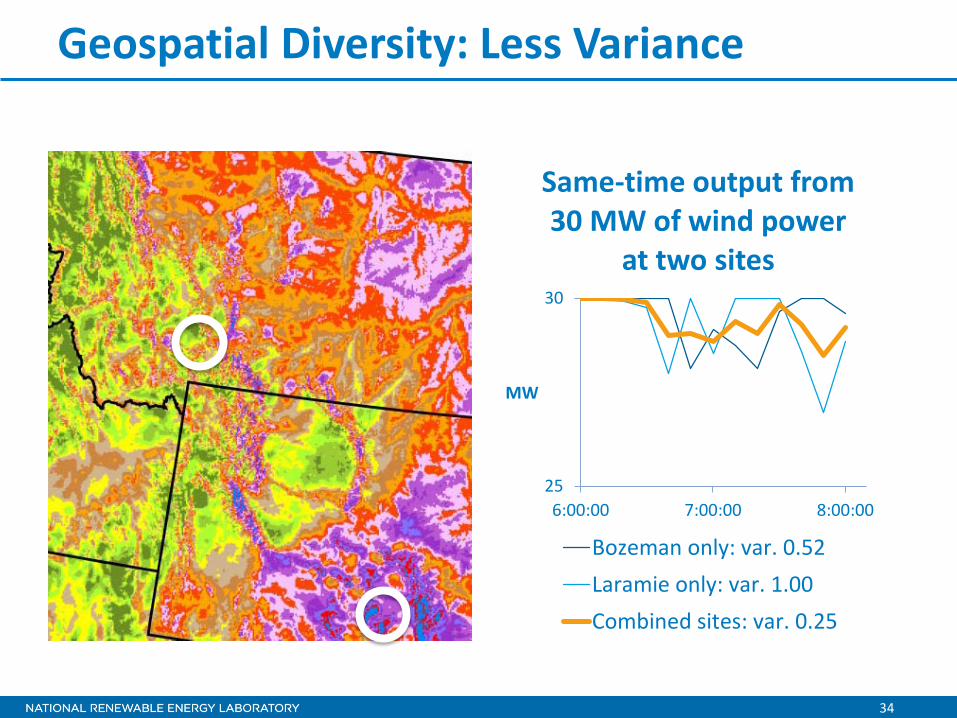
Geospatial Diversity: Less Variance
25
30
6:00:00 7:00:00 8:00:00
MW
Same-time output from 30 MW of wind power
at two sites
Bozeman only: var. 0.52Laramie only: var. 1.00Combined sites: var. 0.25
35
On the Table: Energy Imbalance Market
• Creating a formal market mechanism that will dispatch reserves by economic merit (those that impose the least cost to the system as a whole) across a large footprint
• Western EIM has been studied by WECC, WGA
• Will likely require regulatory endorsement from states; concerns about creating a “backdoor” regional transmission organization

36
How an EIM Would Work
• Coordinated market among participating BAs in which scheduling errors are netted out, and reserves are shared
• Benefits o Fewer reserves will be deployed to balance schedules, o The reserves deployed will cost less
• Challenges o New software, need to create central market operator o Perceived resemblance to an RTO o New way of operating for participating BAs o Economic benefits are not evenly distributed
37
Control Area Diversity, Reserve Sharing
• Similar in purpose to EIM, but without formalized market structure
• Has been tried in the Northwest with some success
38
The Upshot…
• Higher penetrations of renewable energy on the grid are feasible, but doing them efficiently might require new ways of operating
• Regional planning activities are examining major changes that could result in: o more energy from renewable sources with less capital
investment o a few strategically targeted large transmission projects,
rather than a proliferation of smaller ones • Reforms will likely result in greater weight afforded to
projects that go through the regional planning process, especially if the project is intended to serve regional markets rather than local load
39
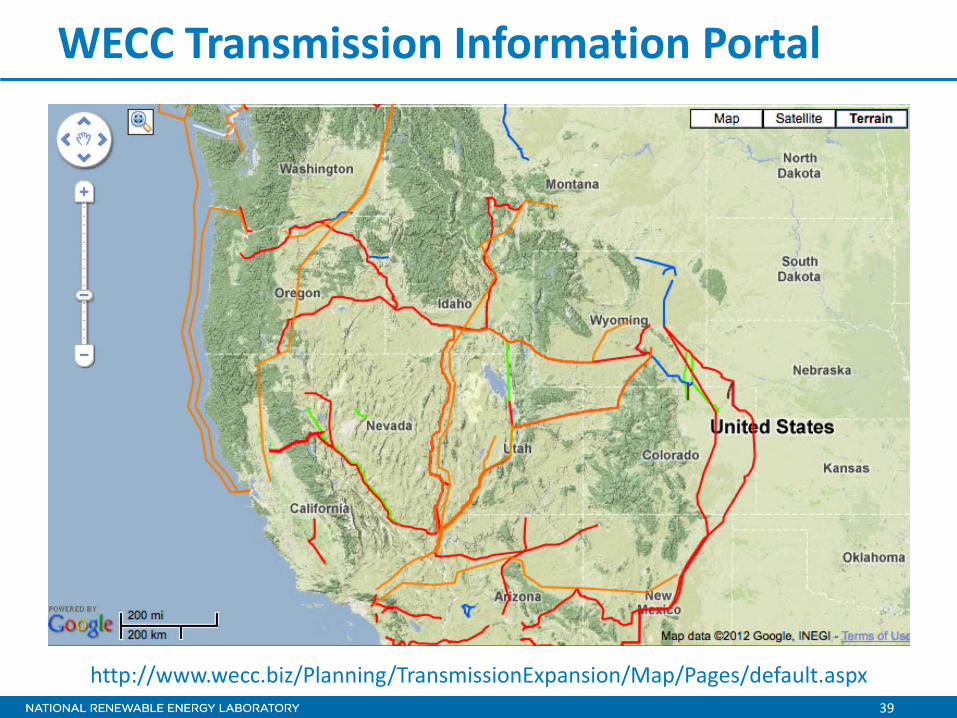
WECC Transmission Information Portal
http://www.wecc.biz/Planning/TransmissionExpansion/Map/Pages/default.aspx
Questions? David Hurlbut [email protected]

Kim Berns, Division Chief Division of Lands, Realty & Cadastral Survey
BLM – Washington Office [email protected]
202-912-7350
Lucas Lucero, Rights-of-Way Branch Chief BLM - Washington Office
[email protected] 202-912-7342
Beth Ransel, Linear ROW/Master Agreements
Program Lead BLM – Washington Office
[email protected] 202-912-7213


![Dust Control Handbook for Industrial Minerals Mining … · Countess Environmental [2006]. WRAP fugitive dust handbook. WGA Contract #:30204-111. Western Governors Association, Denver,](https://img.pdfslide.us/doc/110x75/5b8584fa7f8b9ae0498e660e/dust-control-handbook-for-industrial-minerals-mining-countess-environmental.jpg)