Embed Size (px)
Citation preview

1
Transmission networks: Report on the
performance of Transmission Owners during
the regulatory periods TPCR4 and TPCR4RO
2007-08 to 2012-13
Information
Reference: Contact: Bob Davey
Publication date: 21 March 2014 Team: Costs and Outputs Transmission
Tel: 020 7901 7307
Email: [email protected]
Target Audience: This document may be of particular interest to users of the transmission
networks, licensees, providers of finance and consumer groups.
Overview
We regulate Great Britain’s transmission owners (TOs) and the GB system operators to protect
existing and future energy consumers. We conduct price controls where the TOs earn revenues
from consumers in return for delivering certain outputs.
This report summarises the outputs, incentives, Regulatory Asset Value, revenue allowances and
company expenditure during Transmission Price Control Review 4 (TPCR4) and the subsequent
rollover year. TPCR4 covered the period from April 2007 to March 2012, with a rollover year from 1
April 2012 to 31 March 2013. This report, therefore, covers the performance of the companies in
the six years before the current price control, RIIO-T1, which started in April 2013.
In addition, the report outlines the performance of the system operator companies, which provide
balancing services to the entire gas and electricity systems.

2
Context
We regulate the monopoly and some of the competitive segments of the gas and electricity
markets. The competitive segment broadly encompasses the wholesale markets and the
supply of electricity and gas. The monopoly segment is the network that transports the gas
and electricity between the wholesale and supply markets. These are monopolies because
the high costs of building and maintaining the networks would make it inefficient and costly
for consumers to have multiple networks run by competing companies. The network is
made up of transmission owners, whose large pipes and cables connect the generators and
gas suppliers to the next element of the network, the distribution companies. These, in
turn, connect to the supply segment.
There is one gas TO and three electricity TOs:
National Grid Gas plc (NGGT)1, which owns the high pressure gas transportation system
across Britain
National Grid Electricity Transmission plc (NGET), which owns the high voltage electricity
network in England and Wales
SP Transmission Limited (SPTL), which owns the high voltage electricity network in the
south of Scotland
Scottish Hydro Electric Transmission plc (SHE Transmission), which owns the high
voltage electricity network in the north of Scotland.
In addition to their TO responsibilities, NGGT and NGET are the designated gas and
electricity System Operators (SOs). They therefore have responsibility for day-to-day
system operation, including balancing of the system and constraint management. The price
controls for NGGT and NGET include allowances for the internal SO costs for NGGT SO and
NGET SO, and some external costs for NGGT SO. All other external SO cost allowances are
determined via a separate process.2
The electricity transmission network consists of the high voltage electricity wires which
convey electricity from power stations to local distribution networks and large customers
directly connected to the transmission system. The gas transmission network consists of
high pressure long distance gas pipelines and compressors which transports gas from
offshore, storage and LNG facilities to local Gas Distribution Networks. They are owned and
operated by privately owned companies who have territorial monopolies. To protect the
interests of consumers, we regulate these companies using price controls.
1 National Grid Gas plc also covers other businesses, including its system operator business and its distribution
operations. The term ‘NGGT’ is used to distinguish the transmission network business. 2 We develop SO incentive schemes that are designed to encourage NGET and NGGT to manage the costs of operating each system effectively. The SO incentive schemes establish cost targets that NGET and NGGT are expected to achieve in performing their SO roles.

3
Associated documents
Transmission Annual Report 2010-11, 30 March 2012: https://www.ofgem.gov.uk/ofgem-
publications/54015/transmission-annual-report-2010-11-final.pdf
Transmission Price Control Review: Final Proposals, 4 December 2006, Ref: 206/06:
https://www.ofgem.gov.uk/ofgem-publications/56158/16342-20061201tpcr-final-proposalsinv71-
6-final.pdf
Transmission Price Control Review 4 (TPCR4) Rollover: Final Proposals, 28 November 2011, Ref
162/11: https://www.ofgem.gov.uk/ofgem-publications/53953/tpcr4rolloverfinalproposals.pdf
RIIO-T1: Final Proposals for National Grid Electricity Transmission and National Grid Gas – Overview,
17 December 2012, Ref 169/12: http://www.ofgem.gov.uk/Networks/Trans/PriceControls/RIIO-
T1/ConRes/Documents1/1_RIIOT1_FP_overview_dec12.pdf
RIIO-T1: Final Proposals for SP Transmission Ltd and Scottish Hydro Electric Transmission Ltd, 23
April 2012, Ref 58/12: https://www.ofgem.gov.uk/ofgem-publications/53746/sptshetlfp.pdf
Gas System Operator incentive schemes from 2013 Final Proposals, 17 December 2012, Ref 171/12:
https://www.ofgem.gov.uk/ofgem-publications/39922/gas-so-incentives-2013-final-proposals-
consultation.pdf
National Grid Gas System Operator Incentives from 1 April 2013, 31 January 2013:
https://www.ofgem.gov.uk/ofgem-publications/39913/gas-so-cover-letter.pdf
System Operator incentive schemes from 2013 Initial Proposals, 27 July 2012, Ref 106/12:
http://www.ofgem.gov.uk/Markets/WhlMkts/EffSystemOps/SystOpIncent/Documents1/IP%20SO%
202013.pdf
National Grid Electricity Transmission and National Grid Gas System Operator Incentives from 1
April 2007, 2 October 2006, Ref 179/06: https://www.ofgem.gov.uk/ofgem-
publications/40146/15613-17906.pdf
A glossary of terms for all the RIIO-T1 and GD1 documents is on our website:
http://www.ofgem.gov.uk/Networks/Trans/PriceControls/RIIO-
T1/ConRes/Documents1/T1decisiongloss.pdf

4
Contents
Executive summary 5
1. Introduction 9
2. Revenue and customer impact 11 Overview 11 Investment Project Allowance – electricity transmission 11 Investment Project Allowance – gas transmission 12 Pass-through adjustments 12 Incentive payment adjustments 13 Capital expenditure incentive revenue adjustments 13 Other adjustments 13 Return on regulatory equity (RoRE) 14
3. Outputs, incentives and innovation 16 Electricity-specific outputs and incentives 16
TO system performance and the reliability incentive 16 TO sulphur hexafluoride (SF6) emissions 17
Gas-specific outputs and incentives 19 Emissions 19 SO performance 19
Gas and electricity transmission innovation 20 Innovation Funding Initiative 20
Other gas and electricity incentive mechanisms 21 Capex Incentive Mechanism 21 SO performance 21
4. Expenditure 22 Overview 22 Electricity expenditure 24
1. National Grid Electricity Transmission (NGET) 24 2. Scottish Hydro Electric Transmission plc (SHE Transmission) 26 3. Scottish Power Transmission Ltd (SPTL) 27
Gas expenditure 29 4. National Grid Gas Transmission plc (NGGT) 29
NG System Operator 30
Index of Appendices 32
Appendix 1 – Regulatory Asset Value changes 33
Appendix 2 – Revenue 35
Appendix 3 – TIRG and TII 37 Transmission Investment for Renewable Generation (TIRG) 37 Transmission Investment Incentive (TII) 40
NGET 40 SHE Transmission 41 SPTL 42
Appendix 4 – Transmission Owner spend by year 43
Appendix 5 – System Operator performance 44 1. Electricity SO incentive performance 44 2. Gas SO incentive performance 45

5
Executive summary
The Transmission Price Control Review 4 (TPCR4) set the revenues the transmission
companies were able to recover from consumers over the period 1 April 2007 to 31 March
2012. TPCR4 was extended for an additional year from 1 April 2012 to 31 March 2013 to
enable the RIIO price control principles to be incorporated into the current transmission
price control (RIIO-T1).3
Over the course of the six years of TPCR4 and the rollover year, the TOs have between
them operated and maintained the network of 24,000 km of electricity transmission wires
and 7,600 km of gas transmission pipeline, improving the reliability of the networks,
reducing harmful environmental emissions and improving stakeholder engagement.
Outputs performance
Reliability
The overall reliability of the electricity transmission system has remained consistently high
over the six years and in 2012-13 was well over 99.99% for all three electricity TOs.
Additional electricity generation capacity
The price control recognised that the future supply and usage of electricity is changing.
Moving to a low carbon future drives the ongoing need for new sources of renewable
electricity generation which ultimately need to be connected to the grid. Various
mechanisms were introduced to facilitate this. Over the period the connected generation
capacity has risen by 25% to 95.6 GW. There are also many schemes in the course of
construction which, on completion, will connect additional generation capacity to the
system.
Customer satisfaction
Over the six year period we have observed increased stakeholder engagement and a
willingness of the TOs to engage fully. The TOs have worked well with us towards
developing a new framework in RIIO-T1 to measure and further improve their performance
in this area.
Environment
The price control arrangements have incentivised the TOs to reduce their environmental
footprint, in particular we have seen reductions in sulphur hexafluoride (SF6), carbon
dioxide, nitrogen oxide and nitrogen dioxide.
SF6 is a particularly potent greenhouse gas commonly used in high voltage switchgear.
National Grid Electricity Transmission (NGET) and SP Transmission Limited (SPTL), have
3 See associated documents for information on RIIO-T1

6
both made large reductions (NGET 41%, SPTL 49%) for which they were rewarded under
the incentive schemes in place for them. Scottish Hydro Electric Transmission plc (SHE
Transmission) were not targeted to reduce SF6 emissions in this period.
Revenue and customer impact
During TPCR4 and the rollover the estimated average annual network charge per household
increased from £13.96 to £21.24 for electricity transmission. For gas transmission, the
average annual charge per household increased from £12.28 to £16.22.
The main reason for these increases has been the unprecented growth in the network as it
expands to meet the challenge faced by the industry in the country’s target to reduce
carbon emissions.
TPCR4 was established in December 2006, at a time when forecast investment was
expected to increase by 100 per cent in comparison to the previous price control. The six
years saw considerable growth in the asset bases of the TOs, driven by the need to connect
new forms of generation to assist in the move to a more carbon neutral energy system for
Great Britain. This was required to be delivered whilst at the same time maintaining a safe,
secure and affordable system for existing and future consumers.
The total cost of achieving this was £11bn over the 6 years, some £0.7bn below the total
allowances over the period with the companies looking for more efficient ways to maintain,
operate and extend the networks. Under the capex incentive mechanism 75 per cent of the
£0.7bn saving has been passed onto consumers. The allowances included investment of
more than £9bn in new assets in Britain's gas and electricity transmission systems.
This report gives an explanation of the expenditure, revenue and outputs over these six
years of large scale investment. In particular, we note the following key points on
performance during TPCR4 and the rollover:
Across all TOs and SOs total expenditure (totex)4 was £11bn, of which £9bn was
invested in new assets during the six years. This resulted in growth in the TOs’
regulatory asset value (RAV)5. The average growth of which was 41 per cent over
the period, and the largest was an increase of 154 per cent for SHE Transmission.
The TO RAVs are expected to continue to grow substantially over the RIIO-T1 period.
Figures 1 and 2 illustrate the growth in RAV.
4 Operating expenditure (opex) plus capital expenditure (capex). 5 RAV is the total regulatory value of, in this case, the transmission assets.

7
Figures 1 and 2: Change in RAV (£m)
In terms of the main expenditure items:
The electricity TOs spent around £3.9bn on new assets, to connect new electricity
generation capacity to the network.
£1.4bn of this was funded through scheme specific allowances (TIRG or TII)6
Other connections capacity was funded through allowances set before the
start of TPCR4 and its rollover. Where TOs have been able to supply
connections for less than assumed the saving is shared with consumers.
NGET spent £574m less than its price control allowances in building new
connections. This 24 per cent saving reflected efficiency in delivery of the
required connections.
SPTL spent £203m less than its price control allowances. This 46 per cent
saving reflected planning delays and less growth than anticipated, but also
efficiency. Where delayed, these connections will need to be delivered in
RIIO-T1.
NGGT spent about £1.3bn on additional capacity.
National Grid Gas plc (NGGT) would have spent less than allowed, but spent
£300m more than expected on the major pipeline from Milford Haven. We will
be reviewing the efficiency of this project during 2014-15.
6 These schemes are explained in Appendix 3.
7.0
0.4
0.9
3.9
Opening RAV at 1 April 2007
NGET TO
SHE
SPTL
NGGT TO
9.8
1.1
1.4
5.2
Closing RAV plus Shadow RAV at 31 March 2013
NGET TO
SHE
SPTL
NGGT TO

8
The TOs spent around £3.3bn on maintaining the electricity and gas transmission
networks.
NGET spent 10 per cent less than we allowed (primarily by extending asset
lives). The volumes of replacement were lower than the company business
plan and our modelling, especially in first five years (between 30 per cent and
50 per cent lower in some cases).
SPTL initially deferred some maintenance activity and did not succeed in
making up the backlog. This resulted in expenditure 24 per cent less than
allowed, although with no discernible impact on the performance of the
assets.
SHE Transmission spent slightly more than allowances. However, it is not
clear where the benefits of this overspend can be seen in terms of improved
asset health.
NGGT spent broadly in line with allowances on maintaining their asset base.
In RIIO-T1 the development of network output measures (NOMs) will enable
us to track performance in this area and if necessary challenge
underinvestment or failing asset health. Where NOMs targets are not met
there will be financial implications for the RIIO-T2 price control.
Where TOs have spent less capex than allowed, a sharing mechanism enables them
to retain 25 per cent of the underspend, returning 75 per cent to consumers.
Forecasting by the TOs has been poor. For the rollover year the capex forecasts
were considerably overestimated with, for example, companies overstating load
forecasting by 43-54 per cent. We challenged these forecasts and revised allowances
down to set them at more realistic levels.
In RIIO-T1 TOs will publish company forecasts annually and we will comment on
their accuracy. This accuracy of forecasting will help inform our decisions for RIIO-
T2.
Figure 3: TPCR4 and rollover investment (capex) by company (£bn)
5.3
0.8
0.8
2.0
Investment (capex) during TPCR4+RO
NGET
SHE Transmission
SPTL
NGGT

9
1. Introduction
Chapter summary
Outlines the purpose and structure of the report. Provides additional context for the
transmission network, its regulation, and the price control mechanism.
Purpose of the report
1.1. This report gives stakeholders important information on the performance of the
transmission networks during Transmission Price Control Review 4 (TPCR4) and the
rollover year.
1.2. The key output areas include connections, the environment, and network reliability
and safety.
1.3. The report also reviews transmission owners’ (TOs’) important revenue and
expenditure across TPCR4 and the rollover year.
1.4. While TPCR4 was not an output focussed regime, we consider the performance
against those outputs that were identified.
1.5. Unless stated otherwise, all prices in this report are in 2012-13 terms.
Understanding this report
1.6. Here is some useful information to help understand this report:
One of our primary goals is to protect the interests of consumers. Our role is to
ensure the network companies earn only fair amounts of money to effectively run
their networks, and to allow them to build new assets when necessary. We scrutinise
all the business plans submitted by these companies to ensure their spending is
efficient and aligned with the interests of consumers
Our assessment approach depends on the nature of the costs. The main categories
are:
Capital expenditure (capex): this is spending on assets, such as cables and
pipes. This spending is further divided into load-related capex (LRE), and
non-load-related capex (NLRE). LRE is spending motivated by changes in the
use of the system (such as new wind farms needing to be connected to the
electricity transmission system). NLRE is spending on renewing the current
system
Operating expenditure (opex): this is spending on inspecting and maintaining
the assets. For example, staff to operate the network

10
In this report, for each of the TOs and system operators we look at the spending in
these areas to check whether it has been efficient and whether it delivered the
outputs consumers need. For example, we look at whether the system is more or
less reliable.
1.7. The Transmission Price Control Review 4 (TPCR4) and its rollover year were the
fourth price control of their kind. For April 2013 to March 2021 we are taking a new
approach to price controls, known as RIIO-T17. This changes how companies are funded to
better ensure that the interests of consumers are protected. RIIO aims to promote
smarter gas and electricity networks for a low carbon future and puts sustainability of
supply to customers at the heart of what network companies do. The network companies
now have to seek outside views from stakeholders when developing their long-term
business plans and must show how they have responded to stakeholder views.
1.8. To better inform stakeholders we have agreed with the TOs that they will publish an
annual report each September (initially). This will detail outputs and expenditure and
forecast performance. We will produce an annual RIIO-T1 report that gives our overview
of the sector’s performance. The new format will focus on TOs’ delivery of the primary and
secondary deliverable outputs.
1.9. This report discusses the performance of the four TOs and two SOs over TPCR4.
This ran from 2007-08 to 2011-12, and was extended by a rollover year to cover 2012-
138. This report covers the entire six-year period and draws conclusions on the TOs’
performance. It also outlines many of the areas we will be monitoring under RIIO-T1.
7 RIIO is a new performance based model for setting price controls. It stands for Revenue = Incentives + Innovation + Outputs.
8 Rollover Final Proposals
11
2. Revenue and customer impact
Chapter summary
This section of the report contains an analysis of the revenue collected by the electricity and
gas transmission networks and the impact this has on consumers’ bills. The latter part of
the chapter presents the return earned on regulatory equity during TPCR4 and the rollover
year.
Overview
2.1. Consumers pay for licensees to operate and maintain the transmission networks
through their gas and electricity bills. The gas transportation charges make up around 2 per
cent of an average customer’s gas bill. The electricity transmission charges make up around
4 per cent of an average customer’s electricity bill.
2.2. During TPCR4 and the Rollover the estimated average annual network charge per
household increased from £13.96 to £21.24 for electricity transmission. For gas
transmission, the average annual charge per household increased from £12.28 to £16.22.
2.3. We set an assumed ‘base’ level of revenue that TOs can collect at the price control
but certain mechanisms can allow this base level to change. Where a difference arises in
allowed revenues, it is passed on to the suppliers through adjusted charges. Suppliers, in
turn, pass the increase or decrease on to consumers through their bills.
2.4. Allowed revenue for 1 April 2007 to 31 March 2013 exceeded the base revenue
amount determined at the beginning of the price control by £687m, or 3 per cent.
Table 1 – TPCR4 and rollover base revenue vs allowed revenue
Maximum
allowed
transmission
revenue
£m
Transmission
Base Revenue
£m
Change in
base revenue
£m
Change in
base revenue
%
TOTAL for Electricity Transmission 15,497 15,064 433 3%
TOTAL for Gas Transmission 6,305 6,051 254 4%
TOTAL for TPCR4 and the Rollover 21,802 21,115 687 3%
2.5. The differences between base revenue and maximum allowed revenue can be
broadly categorised as additional investment project allowances, pass through costs, cost
adjustments and incentive revenue. The key reasons for the changes in base revenue
during TPCR4 and the rollover year are explained in the rest of this chapter. Appendix 2
breaks down these differences by licensee.
Investment Project Allowance – electricity transmission
2.6. Investment Project Allowances in transmission relate predominantly to
Transmission Investment for Renewable Generation (TIRG). This mechanism is explained
in Appendix 3.

12
2.7. For Scottish Hydro Electric Transmission plc (SHE Transmission) and Scottish Power
Transmission Ltd (SPTL), Investment Project Allowances were the main source of
additional revenue during TPCR4 and the rollover, as compared to base revenue
allowances set in final proposals. These differences accounted for more than 70 per cent of
additional revenue for both TOs.
2.8. With National Grid Electricity Transmission (NGET), the value of additional revenues
from Investment Project Allowances was similar to the other TOs. NGET received more
Incentive Payment Adjustments which accounts for the difference to base revenue (see
paragraph 2.15).
Investment Project Allowance – gas transmission
2.9. The negative Investment Project Allowance for gas transmission relates to Milford
Haven. During TPCR3 National Grid Gas (NGGT) sold gas transmission capacity at Milford
Haven, effective from October 2007. Incentive revenues for this project are paid to the
System operator (SO), whereas the capex was added to the shadow Regulatory Asset
Value attributable to the Transmission Owner (TO).9
2.10. At the start of TPCR4, we reviewed the Milford Haven funding and decided that the
accumulated shadow RAV should be transferred to the TO’s actual RAV. Revenues for the
TO were reduced to reflect the income being received by the SO during TPCR4. An annual
reduction of £9.5m was made to NGGT’s revenues to avoid duplicating annual returns on
RAV balances. This arrangement has been reviewed for RIIO-T1 and will cease when the
remaining SO incentive period payments come to an end.
Pass-through adjustments
2.11. Pass-through costs10 also contributed to differences between base revenue and
maximum allowed revenue. By nature, pass-through costs are costs which the licensee
has little control over.
2.12. Most of the pass-through costs for NGGT were in relation to the recharge of pension
deficit costs (£145m). These costs relate to pension costs of the National Transmission
System (NTS) and also employees of gas distribution networks before the sale of
independent networks in April 2005. Of the remaining pass-through costs, these largely
relate to the conveyance of liquefied petroleum gas to independent systems (£52m); and
additional security costs incurred during the price control (£58m).
2.13. In electricity transmission, pass-through costs were mainly due to actual network
rates being above forecasts at final proposals. Network rates refer to the tax rates
applicable to the valuation of network assets. These costs were higher than forecast for all
three licensees, but the increase was most significant for SPTL and SHE Transmission due
to the timing of the review in Scotland.
2.14. In 2010, the Scottish assessor proposed an initial revaluation. This resulted in an
increase of £5m to £10m in annual rates for SHE Transmission and SPTL for the remaining
two years of the TPCR4. These rates are expected to be lowered for subsequent years.
9 Refer to Appendix 1 for an explanation of shadow RAV. 10 Costs which are generally regarded as outside of TOs control and are therefore allowed as incurred.
13
Any rebates offered as part of this revision will be realised during the RIIO price control
and passed back to consumers.
Incentive payment adjustments
2.15. Incentive payment adjustments are changes to base revenue which encourage
efficient operation. The electricity incentives include:
Transmission Network Reliability Incentive: a mechanism which pays NGET to
minimise interruptions to the supply from its networks while ensuring that demand is
met. A similar incentive is available to NGGT for the gas transmission network. A
significant portion of the adjustment to allowed revenues is attributable to the
Transmission Network Reliability incentive.
Innovation Funding Incentive: a mechanism which pays transmission owners to
invest in appropriate research and development.
Sulphur Hexafluoride Incentive: a mechanism encouraging reductions in the
emission of sulphur hexafluoride gas (See Chapter 3). This gas is used as an
insulating and arc-extinction medium in electrical equipment.
Capital expenditure incentive revenue adjustments
2.16. At the start of TPCR4, to encourage the gas and electricity transmission licensees to
incur capex efficiently, we established a “capex incentive”. Under this, TOs were exposed
to 25 per cent of any capex underspend or over-spend as compared to their capex
baseline.
2.17. This adjustment was applied for all TOs during the rollover year. However, given
the magnitude of the adjustment for NGET (more than £200m), the revenue adjustment
was smoothed over several years. NGET was allowed £48m (2012-13 prices), or 20 per
cent, in the rollover year.
Other adjustments
2.18. There are other adjustments to base revenues, but they are smaller and are
essentially used to account for any one-off events. These adjustments included income
adjusting events (SHE Transmission and SPTL); differences in services (NGET); and net
under-recovery of allowances, which is also known as the “K factor” in the licence.

14
Return on regulatory equity (RoRE)
2.19. RoRE represents the percentage of returns earned by shareholders as a measure of
equity regulatory asset value (RAV)11.
2.20. The cost of equity for both TPCR4 and the rollover year was set at seven per cent.
This was in line with the long-run average total equity market returns observed at the
start of the price controls. It also reflected the assessed systematic and non-systematic
risks that the networks face under the terms of the price control.
2.21. We measure the TOs’ RoRE performance against the baseline equity return12 as
illustrated in Figure 4. The chart demonstrates that all TOs earned a return on their
notional regulatory equity in excess of the 7 per cent cost of equity assumed in the TPCR4
final proposals.
2.22. This document does not report on RoRE performance for SOs. This is because the
SOs do not hold material equity RAV balances on which to calculate returns.
Figure 4 – Return on Regulatory Equity for TPCR4 and the rollover
2.23. Other contributors to the additional return outperformance for TOs, were incentive
payments and the change in underlying interest rates compared to those assumed in
setting the price control. SHE Transmission generated the majority of their additional
returns from investments in large projects under the Transmission Investment Incentive
11 Equity RAV is derived in two steps. First, calculate the average of opening and closing RAV for each year. Then multiply this result by the equity portion of RAV (1 – gearing level assumed in the model). 12 Baseline equity return is based on the assumption that cost under performance or over performance is converted into returns to shareholders.
Total
including all
incentives
Baseline +
opex +
capex
Baseline +
capexBaseline Opex Capex Interest TII TIRG
Revenue
incentivesTax
NGET TO 9.2% 7.9% 8.5% 7.0% -0.6% 1.5% 0.5% 0.1% 0.1% 0.4% 0.2%
SHE 9.9% 7.2% 7.3% 7.0% 0.0% 0.3% 0.5% 0.9% 1.1% 0.2% 0.1%
SPTL 10.1% 8.4% 9.1% 7.0% -0.7% 2.1% 0.5% 0.0% 0.9% 0.1% 0.2%
NGGT TO 7.4% 6.7% 6.6% 7.0% 0.1% -0.4% 0.5% 0.0% 0.0% 0.1% 0.1%
4.0%
5.0%
6.0%
7.0%
8.0%
9.0%
10.0%
11.0%
NGET TO SHE SPTL NGGT TO
Ret
urn
on
Reg
ula
tory
Eq
uit
y
Baseline Baseline + capex Baseline + opex + capex Total including all incentives

15
(TII) and Transmission Investment for Renewable Generation (TIRG) schemes (1.9 per
cent). The TIRG mechanism allows a pre-tax return during construction and for the first
five years following completion. Beyond this incentive period the assets enter core RAV
and receive the standard (lower) return paid on the core RAV.
2.24. Capex was the main source of additional return outperformance for NGET and SPTL
(1.5% and 2.1% return respectively). This reflects capex performance discussed in
Chapter 4. In contrast, NGGT overspent capex allowances in each year of both price
controls, but underspent opex allowances.
2.25. It is important to note that the RoRE for NGGT does not show the full return. This is
because income from gas revenue drivers is reported in the SO, while the capex sits in the
TO. Thus in calculating RoRE for NGGT TO performance is understated.
2.26. There was little impact on RoRE of opex performance for most TOs. The exceptions
were NGET and SPTL, both of whom overspent the allowed opex in each year of TPCR4.
This is discussed in opex costs performance in Chapter 4.

16
3. Outputs, incentives and innovation
Chapter summary
Here we outline the outputs, incentives and innovation mechanisms under Transmission
Price Control Review 4 (TPCR4) and the rollover year. Incentive schemes across the
networks include the Innovation Funding Initiative, Capex Incentive and Reliability
Incentive. This section also covers the outputs and incentives specific to electricity or gas
transmission owners (TOs) or system operators (SOs).
This section should be understood in the context of the RPI-X regime13, in which the TOs
and SOs were primarily encouraged to increase efficiency and reduce costs. Operating
expenditure (Opex) allowances were set to include efficiency improvements of 3 per cent
per year. In our TPCR4 final proposals14 we recognised the need to work with the TOs
during the price control to identify suitable outputs to gauge performance against. These
output measures were developed during TPCR4 to inform clearer targets for the new RIIO-
T1 regime.
Electricity-specific outputs and incentives
TO system performance and the reliability incentive
3.1. There were two specific output targets in electricity: system performance or
reliability incentive as one output, and the targets for reductions in sulphur hexafluoride
(SF6) emissions.
3.2. The overall reliability of the transmission system has improved over the price
control. A total of 767 MWh of energy was unsupplied (0.00025 per cent of total demand)
for 2012-13 compared with 1,675MWh in 2007-08 (0.0005 per cent of total demand).
3.3. The system reliability target was defined differently between the companies; for
National Grid Electricity Transmission (NGET) it was based on a loss of energy (in MWh),
while for Scottish Power Transmission Ltd (SPTL) and Scottish Hydro Electric Transmission
plc (SHE Transmission) the basis was the number of loss of supply events. Under RIIO-T1,
system reliability will be measured using energy not supplied for all companies, akin to
that already used for NGET under TPCR4.
3.4. NGET has performed particularly well, with loss of MWh significantly lower than
target (Figure 5). SPTL has also beaten its target (Figure 7). SHE Transmission initially
performed well but saw an increasing trend of loss of supply events. This may partly
reflect the two recent colder winters where SHE Transmission’s overhead lines were more
exposed to those weather events.
13 RPI-X was the regulatory regime used for TPCR4 and other price controls before we introduced RIIO
in 2010. 14 Transmission Price Control Review: Final Proposals, 4 December 2006, Ref: 206/06.

17
0
2
4
6
8
10
12
14
2007-082008-092009-102010-112011-122012-13
No
of
inci
de
nts
SPTL Reliability Incentive
Actual Lower Target Higher Target
3.5. The band between the upper and lower targets was set to provide a ‘deadband’ in
which the TOs receive no incentive reward or penalty.
Figures 5 to 7: Reliability incentives
TO sulphur hexafluoride (SF6) emissions
3.6. SF6 is a potent greenhouse gas, with a global warming potential of 23,900 times
that of CO2 over a 100-year lifecycle. Its use has been banned in the EU in many
applications, including refrigeration. In the transmission network, however, it is still used
in high voltage switchgear where it enables useful options for more compact storage.
3.7. At the beginning of TPCR4 only CO2 was covered by the EU Emissions Trading
Scheme, meaning there was no financial incentive to reduce SF6.
3.8. TPCR4 introduced incentives for NGET to reduce SF6 emissions. For SPTL a target
was set from March 2008. The delayed implementation of SPTL’s target, and the lack of a
target for SHE Transmission, is due to the difficulties these TOs faced in separating SF6
emissions information between their transmission and associated distribution assets at the
time. However, there are now clear targets set for RIIO-T1.
3.9. Incentives to reduce SF6 leakage lead to good progress from NGET and SPTL. For
NGET the target reduced over the period from 3 per cent of the gas in use at the
0
50
100
150
200
250
300
2007-082008-092009-102010-112011-122012-13
MW
h
NGET Reliability Incentive
Actual Lower Target Higher Target
0
5
10
15
20
2007-08 2008-09 2009-10 2010-11 2011-12 2012-13
No
of
Inci
de
nts
SHE Transmission Reliability Incentive
Actual Lower Target Higher Target

18
beginning of TPCR4 to 1.75 per cent in the rollover year (Figure 8). For SPTL from 2 per
cent to 1.34 per cent (Figure 9). Both companies met their targets over this period.
Figures 8 and 9: NGET and SPTL SF6 performance
3.10. For SHE Transmission, SF6 only reduced in 2009-10 to 1.6% from 1.7% in the
previous 2 years. SF6 emissions then started to increase (Figure 10).
Figure 10: SHE Transmission SF6 performance
3.11. SHE Transmission explained that the increase in SF6 emissions was due to a small
proportion of circuit breakers that were older than average circuit breakers. It is a concern
that SHE Transmission had not identified and replaced these earlier. SHE Transmission
said that these particular assets started to perform poorly and they expect to remove
them from the system by 2013-14. In parallel, more modern equipment has also reduced
leakage. We will be following up this issue with SHE Transmission on receipt of their 2013-
14 regulatory performance submissions.
3.12. In RIIO-T1 we have provided an incentive regime that should encourage all TOs to
reduce SF6 even further against a baseline target. This reflects the ability for new
equipment put on the network to show lower leakage.
0.0%
0.5%
1.0%
1.5%
2.0%
2.5%
3.0%
2007-08 2008-09 2009-10 2010-11 2011-12 2012-13
% R
ed
uct
ion
SPTL SF6 Emissions Reduction Target
Actual Target
0.0%
0.5%
1.0%
1.5%
2.0%
2.5%
3.0%
3.5%
2007-08 2008-09 2009-10 2010-11 2011-12 2012-13
% R
ed
uct
ion
NGET SF6 Emissions Reduction Target
Actual Target
0.0%
0.5%
1.0%
1.5%
2.0%
2.5%
3.0%
2007-08 2008-09 2009-10 2010-11 2011-12 2012-13
% R
ed
uct
ion
SHE Transmission SF6 Emissions Reduction
Actual
19
Gas-specific outputs and incentives
Emissions
3.13. Carbon dioxide (CO2) is a greenhouse gas, known to contribute to climate change.
CO2 is released during the operation of compressor stations on the gas transmission
network. Reducing CO2 is an important way the energy industry, and network companies,
can address GB’s climate goals.
3.14. Nitrogen oxide (NO) and nitrogen dioxide (NO2), together known as NOX, are air
pollutants that cause acid rain. Acid rain has adverse effects on the environment,
particularly forest ecosystems.
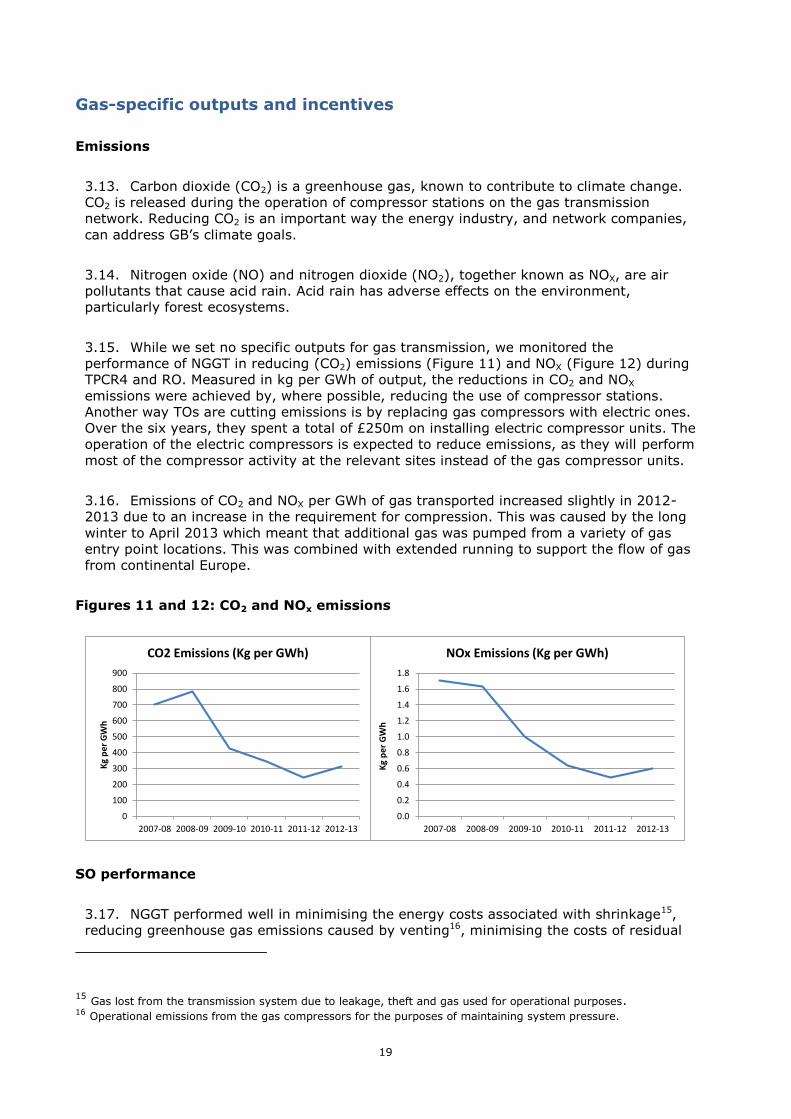
3.15. While we set no specific outputs for gas transmission, we monitored the
performance of NGGT in reducing (CO2) emissions (Figure 11) and NOX (Figure 12) during
TPCR4 and RO. Measured in kg per GWh of output, the reductions in CO2 and NOX
emissions were achieved by, where possible, reducing the use of compressor stations.
Another way TOs are cutting emissions is by replacing gas compressors with electric ones.
Over the six years, they spent a total of £250m on installing electric compressor units. The
operation of the electric compressors is expected to reduce emissions, as they will perform
most of the compressor activity at the relevant sites instead of the gas compressor units.
3.16. Emissions of CO2 and NOX per GWh of gas transported increased slightly in 2012-
2013 due to an increase in the requirement for compression. This was caused by the long
winter to April 2013 which meant that additional gas was pumped from a variety of gas
entry point locations. This was combined with extended running to support the flow of gas
from continental Europe.
Figures 11 and 12: CO2 and NOx emissions
SO performance
3.17. NGGT performed well in minimising the energy costs associated with shrinkage15,
reducing greenhouse gas emissions caused by venting16, minimising the costs of residual
15 Gas lost from the transmission system due to leakage, theft and gas used for operational purposes. 16 Operational emissions from the gas compressors for the purposes of maintaining system pressure.
0
100
200
300
400
500
600
700
800
900
2007-08 2008-09 2009-10 2010-11 2011-12 2012-13
Kg
pe
r G
Wh
CO2 Emissions (Kg per GWh)
0.0
0.2
0.4
0.6
0.8
1.0
1.2
1.4
1.6
1.8
2007-08 2008-09 2009-10 2010-11 2011-12 2012-13
Kg
pe
r G
Wh
NOx Emissions (Kg per GWh)

20
balancing, and improving website timeliness and availability. It had a mixed performance
with its operating margins and demand forecasting (Appendix 5).
Buyback incentives
3.18. In gas transmission NGGT is obliged to buyback capacity where they are unable to
meet contracted capacity requirements. This may happen when there are physical
constraints on the network at a particular point in time.
3.19. The TPCR4 package contained buyback incentives for NGGT to address new
obligated capacity and all other capacity. These schemes encouraged NGGT to minimise
the costs of buyback.
Gas and electricity transmission innovation
Innovation Funding Initiative
3.20. Under the Innovation Funding Initiative (IFI) companies were encouraged to
undertake research and development to improve network operations. These projects are
paid for by the licensee and undertaken by external parties (eg universities). In total, over
the TPCR4 and rollover period the four transmission companies invested £58m in such
schemes. Here are some examples of IFI projects:
improved transformer thermal monitoring
alternative tower construction
ageing critical valve research
alternatives to venting from the National Transmission System (Gas)
Figure 13: Total IFI Expenditure (£m) 2007-08 to 2012-13
0
10
20
30
40
50
NGET SHE T SPTL NGGT
IFI Expenditure (£m) Cumulative 2007-08 to 2012-13
IFI Expenditure Allowance

21
3.21. Figure 13 indicates that NGET, SHE Transmission and NGGT were more active in
their IFI spending, while SPTL spent less than 50 per cent of its allowance.
Other gas and electricity incentive mechanisms
Capex Incentive Mechanism
3.22. For both electricity and gas transmission a capex incentive mechanism shared
overspend and underspend with consumers. It had a 25 per cent sharing factor (ie TOs
kept 25 per cent of underspend and lost 25 per cent of any overspend). This encourages
TOs to deliver their capital investment more efficiently, to the benefit of both TOs and
consumers.
3.23. As detailed in Chapter 4, the TOs capex varied considerably over the period
resulting in payments of £240m to NGET, £1m to SHE Transmission, £13m to SPTL and
£6m to NGGT.
SO performance
3.24. The incentives on the SO are summarised in Appendix 5.

22
4. Expenditure
Chapter summary
We describe the cost performance of the companies by comparing expenditure with the
allowances. Expenditure is divided into several different areas: load and non-load related
(LRE/NLRE) capital expenditure (capex), and operating expenditure (opex). In some cases
the accuracy of company forecasts is also illustrated through comparisons between forecast
and actual expenditure.
We present the figures for the TOs followed by those for the SOs. For the TOs we show the
LRE and NLRE capex, and opex. We present this expenditure separately for TPCR4 and RO,
but for areas such as load related capex the two periods of the price control are merged
(because of the timing of spending and delivery of the schemes).
Overview
4.1. Figure 14 shows the opex and capex over the TPCR4 and rollover period for all TOs.
This summarises the allowances the TOs were given, and their actual spend. Capex is
further divided into load-related expenditure (LRE) and non-load related expenditure
(NLRE).17
4.2. Overall, the electricity TOs spent less than their allowances whereas NGGT spent
slightly more. This is primarily because of the continuing construction of the Milford Haven
pipeline, which cost much more than NGGT had originally planned.
Figure 14: Overall Expenditure (opex and capex) in TPCR4 and rollover (£m)
17 LRE is the installation of new assets to accommodate changes in the level or pattern of electricity or gas supply and demand. NLRE is the replacement or refurbishment of assets which are either at the
end of their useful life due to their age or condition, or need to be replaced on safety or environmental grounds.
0
1000
2000
3000
4000
5000
6000
7000
NGET SHE SPTL NGGT
Allowed
Actual

23
4.3. The table below compares the allowances and actual expenditure for each of the
network companies. Capex is shown aggregated as well as split into LRE and NLRE. Non
operational capex is categorised as opex.
Table 2: Comparison of expenditure against allowances
Allowance Actual
Difference
(%)
NGET (TO) Controllable Opex 1161.9 1318.0 13%
Capex: LRE 2379.8 1805.7 -24%
Capex: NLRE 2697.8 2425.8 -10%
Total capex 5077.6 4231.5 -17%
Non operational capex
(Opex) 89.1 105.6 19%
SHE Transmission Controllable Opex 48.9 50.4 3%
Capex: LRE 182.3 154.9 -15%
Capex: NLRE 86.6 97.6 13%
Total capex 268.9 252.5 -6%
Non operational capex
(Opex) 0.1 0.7 547%
SPTL Controllable Opex 129.5 154.3 19%
Capex: LRE 436.5 233.9 -46%
Capex: NLRE 435.3 332.8 -24%
Total capex 871.9 566.7 -35%
Non operational capex
(Opex) 4.6 7.0 53%
NGGT (TO) Controllable Opex 422.6 412.2 -3%
Capex: LRE 699.6 951.7 36%
Capex: NLRE 460.1 466.4 1%
Total capex 1159.7 1419.3 22%
Non operational capex
(Opex) 34.3 27.3 -20%
NGET SO Controllable Opex 371.8 402.5 8%
Total capex 84.8 127.4 50%
NGGT SO Controllable Opex 193.4 205.1 6%
Total capex 98.0 77.3 -21%
4.4. Any deviation in capital expenditure between allowances (for TOs or SOs), whether
underspends or overspends, is shared between consumers and TOs 25:75. There is also a
sharing ratio in opex for the SOs. This is 25:75 in electricity and 40:60 in gas.
4.5. The profiling of this expenditure over the six year period is shown in Appendix 4

24
Electricity expenditure
1. National Grid Electricity Transmission (NGET)
4.6. An overview of NGET’s capex during TPCR4 and the rollover is shown in Figures 15
and 16.
Figures 15 and 16 – NGET capex compared to allowances
Load related capex
4.7. This expenditure delivers new connection capacity on the transmission network.
During TPCR4 NGET was funded on the basis that it would produce an assumed level of
connection capacity. Variations in this level of capacity were funded through a ‘revenue
driver’ mechanism which reflected an increase (or potentially a decrease) in allowances as
new capacity was created. This mechanism therefore varies the revenues allowed under
the price control. Since additional funding is reflected only on output delivery, but projects
may spend over three to four years to deliver the increased output, we have to consider
the six years as one period (figure 17).
Figure 17 – NGET load related capex compared to allowances
4.8. Over the period NGET spent £1.8bn (excluding £244m of capex that had yet to
deliver outputs which we refer to as work in progress on load related capex. The volume of
connections was greater over the period than assumed in our final proposals (which the
revenue driver mechanism was devised to recognise). NGET spent £574m, or 24 per cent,
less than its allowance. This reflects efficiencies in creating these new connections, 75 per
cent of which is returned to consumers.
0
500
1000
1500
2000
2500
Load Non load
£m
NGET LR incentivised capex (TPCR4)
Allowance - Baseline Allowance - Revenue Drivers
Actual Allowance - Baseline
0
100
200
300
400
500
600
700
Load Non load
£m
NGET LR incentivised capex (rollover)
Forecast (revised) Allowance - Baseline
Allowance - Revenue Drivers Actual
0
500
1000
1500
2000
2500
Total
£m
NGET LR incentivised capex (TPCR4 and rollover)
Allowance - Baseline Allowance - Revenue Drivers Actual

25
4.9. An additional £610m of allowances were made available to NGET under the revenue
driver mechanism (shown with hatched shading).
Non load related capex
4.10. NGET spent £2.4bn over six years on non load related capex (this is capex to
maintain the capability of the existing network). It spent £272m (10 per cent) less than its
allowance. This was predominantly because NGET refined the approach to assessing which
assets were in need of replacement and chose to extend asset lives and refurbish assets
rather than replace them. One effect of this has been increased spending on maintenance.
This contributed to an overspend of opex allowances.
4.11. While we encourage the use of this kind of innovative approach it should not
increase the risk of system failure for consumers. We have seen no evidence of increased
asset deterioration for NGET, but we will monitor the approach closely under RIIO-T1 as
we further develop our Network Outputs Measures (NOMs).
4.12. Non load volumes were lower than NGET’s business plan submission and our
modelling had indicated, particularly in the first five years (between 30 per cent and 50
per cent lower in some cases). Following the introduction of NOMs in RIIO-T1 we will be
able to more effectively understand and challenge any cases of unexpected deterioration
in asset health.
Other capex expenditure
4.13. NGET spent £648m on schemes outside the baseline revenues set for TPCR4. These
schemes are Transmission Investment for Renewable Generation (TIRG) and Transmission
Investment Incentive (TII) and further details can be found in Appendix 3. Some of the
largest spends were the TIRG project Anglo-Scottish Interconnector (£140m) and £508m
on TII projects, particularly Anglo Scottish incremental, East Anglia and Western HVDC.
4.14. These projects will be assessed on completion in accordance with each scheme’s
framework to check on the efficiency of the delivery process.
Opex
4.15. For NGET, there was an opex overspend in all five years of TPCR4. Despite
efficiencies, there were significant additional costs, such as reorganisation of the business
(£39m), recruitment of apprentices (£34m), and higher maintenance (£22m).
4.16. It seems likely that the change in approach to network management, extending the
lives of assets rather than replacing them immediately, may have caused maintenance
costs to rise.
4.17. In the rollover year, the actual opex £16m was higher than the £234m allowed, but
it including £16m for reorganisation costs. The actual spend was 11 per cent below NGET’s
original forecast of £280m.

26
Figures 18 and 19: NGET opex compared to allowances
2. Scottish Hydro Electric Transmission plc (SHE Transmission)
Capex
4.18. There was a load related underspend of £27m (15 per cent) compared with
allowances. SHE Transmission has said these reflect efficiencies as well as some delays in
obtaining planning consents. The underspend of £8m (19 per cent) in the rollover was 52
per cent less than forecast, raising questions about the robustness of SHE Transmission’s
forecasting capability. We made significant reductions in our assessment of their forecast
for projects which we considered were not well advanced through the planning consent
process.
4.19. There was a non load related overspend of £11m (13 per cent).
4.20. SHE Transmission spent £523m on TIRG and TII schemes (see Appendix 3 for full
details). Significant schemes were the Sloy and Beauly Denny TIRG projects which have
incurred costs to date of £367m. SHE Transmission spent £156m on four TII projects in
the Beauly and Dounreay areas.
Figures 20 and 21 – SHE Transmission capex compared to allowances
0
200
400
600
800
1000
1200
1400
£m
NGET cash controllable opex (TPCR4)
Allowance Actual
0
50
100
150
200
250
300
£m
NGET cash controllable opex (rollover)
Forecast Allowance Actual
0
20
40
60
80
Load Non load
£m
SHE Transmission incentivised capex (rollover)
Forecast (revised) Allowance Actual
0
50
100
150
Load Non load
£m
SHE Transmission incentivised capex (TPCR4)
Allowance Actual

27
Opex
4.21. SHE Transmission’s opex was broadly in line with allowances during TPCR4, despite
having grown throughout the period (reflecting the growth in the overall business).
However, during the rollover spending was 32 per cent higher than forecast and
allowances. The £3m increase was entirely due to the exceptional weather in the winter of
2012-13.
4.22. The transmission business was reorganised during TPCR4, with many roles
transferred in from other group companies. Overall this led to a growth in opex costs. SHE
Transmission now employs 333 direct staff (compared to 73 people in 2008) but this also
partly reflects the growth of the SHE Transmission business as a whole.
Figures 22 and 23: SHE Transmission opex compared to allowances
3. Scottish Power Transmission Ltd (SPTL)
Capex
4.23. The load related capex was £203m (46 per cent) lower than the six year
allowances. While SPTL cites delays with developers gaining planning consents, the
generation capacity connected was slightly higher than had been assumed in setting
allowances.
4.24. While we understand that planning can cause delays, we are disappointed by the
quality of SPTL’s load forecasting, which has been poor even one year ahead. TOs will
publish forecasts during RIIO-T1, and we will be using evidence of accurate forecasting in
any fast track decision for RIIO-T2. We will also comment on the accuracy of these in
future annual reports and we expect to see this improve.
4.25. Over the period there was a £102m (24 per cent) underspend in non load capex.
SPTL deferred some maintenance projects in the early years of TPCR4 and failed to catch
up the backlog in expenditure compared to allowances. Whilst we have no evidence that
this has added to the probability of system assets failure we will continue to monitor the
asset data carefully. Following the introduction of NOMs in RIIO-T1 we will be able to more
effectively understand and challenge unexpected deterioration in asset health.
0
2
4
6
8
10
12
14
16
£m
SHE Transmission cash controllable opex (rollover)
Forecast Allowance Actual
0
10
20
30
40
£m
SHE Transmission cash controllable opex (TPCR4)
Allowance Actual

28
4.26. Where TOs spend less than their capex allowances the benefits of this efficiency are
shared with consumers; with TOs retaining 25% and the remainder benefitting consumers.
Figures 24 and 25 – SPTL Transmission capex compared to allowances
4.27. SPTL also spent £252m on TIRG and TII schemes (see Appendix 3 for full details).
Total expenditure on TIRG projects in the six years was £156m. The largest projects were
Beauly-Denny, Sloy, and the Strathaven-Harker Interconnector.
4.28. Total expenditure on TII projects in the six years was £96m. The major projects
were Western HVDC and the East-West Upgrade.
Opex
4.29. During TPCR4 there was a £19m (18 per cent) overspend compared with
allowances due to higher support costs. This purely reflects a greater level of capitalisation
of overheads (around £38m) than we had estimated in the allowance (and which we
therefore treat as opex). There was also a £9m (29 per cent) overspend in the rollover
(adjustment £15m).
Figures 26 and 27: SPTL opex compared to allowances
0
50
100
150
£m
SPTL cash controllable opex (TPCR4)
Allowance Actual
0
10
20
30
40
£m
SPTL cash controllable opex (rollover)
Forecast Allowance Actual
0
100
200
300
400
Load Non load
£m
SPTL incentivised capex (TPCR4)
Allowance Actual
0
20
40
60
80
100
Load Non load
£m
SPTL incentivised capex (rollover)
Forecast (revised) Allowance Actual

29
Gas expenditure
4. National Grid Gas Transmission plc (NGGT)
Load related capex
4.30. Despite a slow down in gas transmission connections activity there was an
overspend of £252m (36 per cent) in load related expenditure during TPCR4 and the
rollover. This was primarily because of additional costs in delivering the Milford Haven
project. To provide context, the Milford Haven project was expected to cost £1bn, but has
cost £1.3bn. Of this, £750m was incurred in the TPCR4 and rollover period, making up 80
per cent of all NGGT’s capex load in this time. We will review the efficiency of this project
in 2014-15.
4.31. The Milford Haven project is one of the largest schemes delivered by the TOs to
date. NGGT began it after recognising that additional capacity was needed to connect new
import terminals to the gas network.
4.32. Apart from the Milford Haven project, NGGT spent only £200m over the price
control period (60 per cent of its £340m allowance) on new connection activity. Apart from
activity falling, NGGT has identified efficiencies, with underspends in some projects.
4.33. As with the other TOs we have some concerns about the quality of NGGT’s
forecasting capability. For 2012-13 the load related capex spend was forecast at £77m,
with actual spending coming in at £23m and mostly related to Milford Haven.
Figures 28 and 29 – NGGT Transmission capex compared to allowances
Non load related capex
4.34. The non load related expenditure during the price control was similar to allowances.
Asset expenditure mostly occurred from the third year of TPCR4, leading to an underspend
(54 per cent in the first two years of TPCR4) early in the price control, and overspend later
(£33m (49 per cent) in the rollover).
4.35. Unfortunately we have seen limited NGGT engagement on emissions abatement.
Expenditure was less than anticipated, leading us to set measures to avoid similar
problems during RIIO-T1.
0
200
400
600
800
1000
Load Non load
£m
NGGT incentivised capex (TPCR4)
Allowance Actual
0
20
40
60
80
100
120
Load Non load
£m
NGGT incentivised capex (rollover)
Forecast (revised) Allowance Actual

30
Opex
4.36. There was an underspend of £24m (6 per cent) during TPCR4, including a £7m (20
per cent) underspend of non operational capex (mainly IT). While the underlying trend
continued into the RO, there was an overspend of £7m due to the cost of a reorganisation.
4.37. In the rollover opex was 13 per cent below NGGT’s forecast. While the forecast
included increases for work force growth and renewal, NGGT says it scaled these back due
to reduced allowances. We note, however, that NGGT indicated it would be cutting staff at
the start of RIIO-T1.
Figures 30 and 31: NGGT opex compared to allowances
NG System Operator
SO capex: NGET and NGGT
4.38. The capex of the SOs is almost entirely spent on IT systems to manage the flow of
gas and electricity through the TO networks.
4.39. During TPCR4, NGET overspent by £36m (68 per cent). It attributed this to the
need to replace critical systems to support increased wind generation, decarbonisation,
access reform and increased security risks. NGET did not foresee these when we set the
allowances. The £6m overspend during the rollover was due to higher costs of the
electricity balancing system.
0
20
40
60
80
100
£m
NGGT cash controllable opex (rollover)
Forecast Allowance Actual
0
100
200
300
400
500
£m
NGGT cash controllable opex (TPCR4)
Allowance Actual

31
4.40. NGGT spent £9m (14 per cent)18 less capex than allowed in TPCR4. There was also
an underspend in the rollover year of £11m (33 per cent below allowances and 51 per cent
below forecast).
Figures 32 and 33: SO capex compared to allowances
SO opex: NGET and NGGT
4.41. During TPCR4 NGET overspent on opex by 7 per cent due to additional costs of
recruiting control staff, and additional costs of bringing critical system support in house.19
There was a further overspend in the rollover year (£10m) which NGET said is due to
growth in resources for more EU and market driven work, Information System costs, and
exceptional reorganisation costs of £5m.
4.42. NGGT also overspent (8 per cent) during TPCR4 on opex due to higher costs in
attracting control room staff, and in the sourcing of critical systems. In the rollover year
NGGT spent as allowed despite incurring £4m of reorganisation costs.
Figures 34 and 35: SO opex compared to allowances
18 Excluding Xoserve costs, which are treated as pass-through costs 19 NGET Opex excludes £3.7m of EMR costs paid for by a DECC grant.
0
10
20
30
40
50
60
NGET NGGT
£m
SO internal capex (rollover)
Forecast Allowance Actual
0
20
40
60
80
100
NGET NGGT
£m
SO internal capex (TPCR4)
Allowance Actual
0
100
200
300
400
NGET NGGT
£m
SO internal controllable opex (TPCR4)
Allowance Actual
0
20
40
60
80
100
NGET NGGT
£m
SO internal controllable opex (rollover)
Forecast Allowance Actual

32
Index of Appendices
Appendix Name of Appendix Page Number
1 Appendix 1 – Regulatory Asset Value changes 33
2 Appendix 2 – Revenue 35
3 Appendix 3 – TIRG and TII 37
4 Appendix 4 – Transmission Owner spend by
year 43
5 Appendix 5 – System Operator (SO)
performance 44

33
Appendix 1 – Regulatory Asset Value changes
1.1. Regulatory Asset Value (RAV) is the value of capital investment in GB gas and
electricity networks. We allow licensees to obtain funding for both return and asset
depreciation each year based on the size of the RAV. The return allowance is designed to
encourage licensees to enter into the long-term financing arrangements needed for efficient
investment in the network. Similarly, the depreciation allowance provides licensees with the
funding required to maintain network assets throughout their useful lives.
1.2. Closing RAV is calculated as: Opening RAV + net additions - depreciation
1.3. We also recognise that in TPCR4 there were some schemes where the capex did not
immediately enter RAV. Until this capex enters the main RAV we refer to it as shadow RAV.
The shadow RAV at the end of the TPCR4 and rollover period consists of TIRG capital
investment and some gas entry and exit spend (under the TPCR3 and TPCR4 gas revenue
driver schemes).
1.4. The numbers quoted remain provisional pending final confirmation of the values. In
particular we will be reviewing the efficiency of the Milford Haven project (see para 4.29)
and the review of certain physical site security upgrade projects.
Change in RAV during TPCR4 and the rollover
1.5. RAV balances have substantially increased for all of the Transmission Owners (TOs) in
the years from 1 April 2007 and 31 March 2013.
Table 1: Movements in TO RAV: 1 April 2007 and 31 March 201320
1.6. As a result of the move to a low carbon economy there has been unprecedented
investment in the TO electricity networks. Over the TPCR4 and Rollover period, RAV and
Shadow RAV balances held by Electricity TOs increased by 45 per cent. This reflects
increases to RAV balances to National Grid Electricity Transmission (NGET) of 39 per cent;
Scottish Hydro Electric Transmission plc (SHE Transmission) of 154 per cent; and 43 per
cent for Scottish Power Transmission Ltd (SPTL). In this same period, RAV balances
(including Shadow RAV) in gas transmission increased by 33 per cent.
20 The movement in RAV includes ‘legacy’ adjustments made in RIIO-T1 price control as part of the first annual iteration of the Price Control Financial Models, which took place on 29 November 2013.
NGET 7,028 5,860 -3,234 9,654 113 N/A 9,767 39%
SHE Transmission 401 444 -160 686 334 N/A 1,020 154%
SPTL 947 723 -482 1,188 163 N/A 1,351 43%
NGGT 3,868 1,625 -854 4,639 N/A 518 5,157 33%
Movement in RAV Shadow RAV information Increase in
RAV plus
Shadow RAV
%
£m
[2012-13] TIRG yet to
transfer into
RAV
Gas
revenue
driver
Closing RAV
plus Shadow
RAV at 31
March 2013
Opening RAV
at 1 April
2007
Net
additions
(after
disposals)
Depreci-
ation
Closing
RAV at 31
March
2013

34
1.7. Major capital infrastructure projects for the gas and electricity transmission networks
have been planned for the RIIO-T1 price control. As such, the trend of substantial increases
in RAV values is expected to continue until after the end of the decade.
1.8. The RAV balances for the two SOs also showed marked increases during TPCR4 and the
rollover year. By their nature these assets (generally IT related) will have a shorter useful
life and we therefore allow depreciation over shorter periods than for the main TO RAVs.
Table 2: Change in SO RAV during TPCR and the rollover
£m
[2012-13]
£m
[2012-13]
Net additions (after disposals) 124 83
Depreciation (40) (24)
Closing RAV at 31 March 2013 84 60
NGET SO NGGT SO

35
Appendix 2 – Revenue
Table 1: Comparison of maximum allowed revenue to base revenue
Electricity Transmission Entity
Maximum allowed
revenue
£m (2012/13 prices)
Base Revenue
£m (2012/13 prices)
Change in base
revenue
£m (2012/13 prices)
NGET TO 8,280.6 8,051.9 228.7
SHE Transmission 487.7 409.8 77.8
SPTL 1,316.1 1,189.7 126.4
NGET SO 5,412.4 5,412.4 -
Gas Transmission Entity
Maximum allowed
revenue
£m (2012/13 prices)
Base Revenue
£m (2012/13 prices)
Change in base
revenue
£m (2012/13 prices)
NGGT TO 3,875.2 3,621.2 254.0
NGGT SO 2,429.9 2,429.9 -
TPCR4 and RO
TPCR4 and RO

36
Figure 1: Disaggregation of changes in base revenue for all four TOs
74
112 5
48 (10) 229
0
50
100
150
200
250
300
Investment ProjectAllowances
Incentive Payment Pass through Capex IncentiveRev Adj
Differences inservices
Total change inrevenue from Final
Proposals
NGET - change in revenue during TPCR4 and the Rollover Year
604
10 (2)6 78
0
10
20
30
40
50
60
70
80
90
Investment ProjectAllowances
Incentive Payment Pass through Capex IncentiveRev Adj
Income adjustingevent
Total change inrevenue from Final
Proposals
SHE Transmission - change in revenue during TPCR4 and the Rollover Year
888
217 3 126
0
20
40
60
80
100
120
140
Investment ProjectAllowances
Incentive Payment Pass through Capex IncentiveRev Adj
Income adjustingevent
Total change inrevenue from Final
Proposals
SPTL - change in revenue during TPCR4 and the Rollover Year
(74) 26
28616 254
-100
-50
0
50
100
150
200
250
300
Investment ProjectAllowances
Incentive Payment Pass through Net under-recovery ofallowances
Total change inrevenue from Final
Proposals
NGGT - change in revenue during TPCR4 and the Rollover Year

37
Appendix 3 – TIRG and TII
Transmission Investment for Renewable Generation (TIRG)
1.9. At the time of the 1999 (for SHE Transmission and SPTL) and 2000 (for NGET) price
controls, there was considerable uncertainty regarding the likely level and pattern of
emerging renewable generation, which meant it was not practical to include allowances for
transmission investment. Following the start of the price controls, there was an increase in
demand for transmission capacity by renewable generators.
1.10. We put the TIRG mechanism in place in 2004 to provide the Transmission Owners
(TOs) with revenue allowances to connect renewable generation that was not forecast at
the time the relevant transmission price controls were set. It includes explicit expenditure
allowances and output obligations for specific projects for each of the TOs. Given the
uncertainty around the design and cost of these projects, we provided flexibility in the
mechanism for us to consider amending the revenue allowances up or down under defined
circumstances. These include:
TIRG income adjusting event (IAE) - an event or circumstance that has occurred or
is expected to occur which has materially increased or decreased the forecast
preconstruction and contingency costs for the relevant years. The TO must notify us
and provide supporting evidence where it considers that an IAE has occurred.
TIRG asset value adjusting event (AVAE) - where a relevant amendment to the
scope of construction work is expected to cause additional costs or savings to be
incurred. In order to vary their ex ante revenue allowances during the construction
period through an AVAE, the TO is required to give notice of such an event to us as
soon as is reasonably practicable after it has occurred and in any event prior to the
TIRG relevant year when construction of the project commences.
1.11. During TPCR4, four TIRG projects were underway:
Beauly Denny, a project jointly delivered by Scottish Hydro Electric Transmission plc
(SHE Transmission) and SP Transmission Limited (SPTL);
Sloy, a joint project between SHE Transmission and SPTL;
The Anglo Scottish Interconnector, a joint project between SPTL and National Grid
Electricity Transmission plc; and
South West Scotland, a project to be delivered by SPTL which was not started during
TPCR4.
1.12. The Beauly Denny upgrade of the existing 132kV transmission line to 400kV
between Beauly in the north of Scotland and Denny in central Scotland is the largest
project covered by the TIRG mechanism. SHE Transmission will be responsible for
delivering the majority of the project, while SPTL will construct the final 22km, which lie in
its transmission area. The project will be completed during RIIO-T1.

38
1.13. The Sloy project was constructed jointly between SHE Transmission and SPTL and
was intended to increase the transmission capacity in West Scotland. Both companies
completed construction in 2009-10, but the project was not commissioned until 2011-12,
due to the transformers that were supplied by SHE Transmission’s manufacturer being
damaged in transit from Europe.
1.14. The England-Scotland interconnector works were designed to increase the capability
of the boundary between England and Scotland by upgrading both of the west and east
coast circuits. The project required works in both NGET and SPTL’s transmission areas
with each party responsible for the works in its area. Both companies completed
construction in 2010-11.
1.15. The South West Scotland project being delivered by SPTL focuses on constructing
power lines and an interconnector as part of developing the infrastructure for wind
developments in south west Scotland. Construction work has not yet commenced.
1.16. Project costs and outputs are summarised below. Actual expenditure does not
necessarily match allowances due to the timing of particular projects. The TIRG licence
condition includes a five year incentive period to reward TOs for delivering projects
efficiently. Following the five years, any cost savings are shared with consumers.

39
Table 1: TIRG projects
Scheme TO Outputs expected to be
delivered
Funding under the Licence (£m)
Delivery date
Outputs delivered
Actual Capex to
31 March 2013 (£m)
Beauly-Denny
SPTL
22km of new overhead lines (OHL) (of the 220km total)
New double busbar substation at Denny North
72.5 Ongoing TBA 32.8
SHE Transmi
ssion
Replace existing 132kV double circuit overhead line with a new OHL of 200km (one circuit at 400kV and the other at 275kV)
321.5 Ongoing TBA 352.9
England – Scotland interconnection
SPTL Increase capability of the England – Scotland interconnection from 2200MW to 2800MW.
West Coast: upgrading the existing 275kV circuit between the Strathaven and Harker substations to 400kV
East Coast: Upgrading the 400kV OHL system between Eccles and Stella West substations
106.6 2010-11 Yes 85.2
NGET 139.5 2010-11 Yes 140.0
Sloy
SHE Transmi
ssion
New substation at Inverarnan 9.5 2011-12 Yes 14.5
SPTL
Diverting one 275kV OHL into a new substation
Creating two new circuits (Inverarnan-Dalmally and Inverarnan-Windyhill)
18.3 2009-10 Yes 18.4
B5 Boundary SPTL Clydes Mill, Easterhouse and Windyhill substation upgrades
13.8 2011-12 Yes 13.2
South West Scotland
SPTL Construct 80km OHL from Kilmarnock South to Kendoon
52.1 Ongoing TBA 6.5

40
Transmission Investment Incentive (TII)
1.17. We introduced TII in April 2010 to provide project-specific interim funding for
investment projects that did not have funding under TPCR4. The TOs received funding for
efficient pre-construction costs for all identified projects and construction costs for
projects where work was planned to commence before 2010-11. We also established a
process in the TOs’ licences to annually review TII funding requests for works planned to
begin the following year. The TII framework was intended to operate until TPCR4 ended
on 31 March 2012.
1.18. On 4 October 2010, we announced the new RIIO (Revenue = Incentives +
Innovation + Outputs) model for network regulation. To implement this model at the next
price control, we decided to delay the start of the new price control by one year. A one-
year TPCR4 rollover was implemented to cover the gap between the expiry of TPCR4 on
31 March 2012 and the start of the new price control (RIIO-T1) on 1 April 2013. The TII
framework was extended for one year to remain aligned with the TPCR4 price control
period.
1.19. Project costs and outputs are summarised by company below. Actual expenditure
does not necessarily match allowances due to the timing of particular projects. On project
completion, where there is an under or overspend against allowances there is a sharing
factor to protect consumers.
NGET
Table 2: Construction Works
Project Outputs expected to be delivered Delivery
Date
Total
allowance
(£m)
Actual
Capex
(£m)
Anglo
Scottish
Incremental
Increase in network capacity across the B6 boundary of 400MW
Pre-fault winter rating of 2800MVA on the Harker-Hutton-Quernmore Tee circuit
2013-14 82.1 57.0
East Anglia
Pre-fault winter ratings of 2580MVA and a post-fault winter ratings of 3070MVA on the Walpole-Norwich and Norwich-Bramford 400kV circuits
New Bramford 400kV substation
2016-17 197.2 152.4
North Wales Pre-fault winter rating of 2800MVA on
Trawfynydd to Treuddyn Tee circuit 2014-15 27.2 10.2
Western
HVDC link
New substation at Connah’s Quay to fully replace the existing substation at Deeside
2017-18 217.7 211.7

Report on the performance of Transmission Operators in TPCR4 and TPCR4RO
2007-8 to 2012-13
41
Table 3: Pre-construction Works21
Project Funding
(£m)
Actual
Expenditure
(£m)
Ironbridge 400kV circuit and the Central Wales substation 5.7 9.6
Eastern HVDC link 3.7 3.7
Substation works and optioneering report to determine
whether a Humber-Walpole HVDC link or 400kV overhead line
is preferred
14.3 0.9
Hackney-Waltham Cross project 5.6 26.3
New line and substation in the south west 8.7 36.3
Wylfa-Pembroke HVDC link 1.1 0.1
SHE Transmission
Table 4: Construction Works
Project Outputs expected to be delivered Delivery
Date
Total
allowance
(£m)
Actual
Capex
(£m)
Knocknagael 275/132kV substation built to 400kV
specification 2011-12 45.8 43.1
Beauly-
Blackhillock-
Kintore
Beauly-Blackhillock and Blackhillock-Kintore lines reconductored with 2x208mm2 GTACSR GAP sub-conductors
2014-15 36.7 35.5
Beauly-
Dounreay
Second 725kV conductor installed and two quad boosters installed on the 132kV circuits
Reinforcement at Dounreay substation
2012-13 80.3 67.0
Beauly-
Mossford New 132kV switching station
End of
2013 12.5 7.8
Table 5: Pre-construction Works22
Project Funding
(£m)
Actual
Expenditure
(£m)
Eastern HVDC link 4.3 2.4
21 Outputs for these projects will be agreed under RIIO-T1 22 Outputs for these projects will be agreed under RIIO-T1

Report on the performance of Transmission Operators in TPCR4 and TPCR4RO
2007-8 to 2012-13
42
SPTL
Table 6: Construction Works
Project Outputs expected to be delivered Delivery
Date
Total
allowance
(£m)
Actual
Capex
(£m)
SPTL-NGET
interconnection
Two new terminal towers of L12 specification at Eccles
reduce impedance of Strathhaven-Harker and Eccles-Stella West lines by approximately 35%
2015 34.7 1.4
Western HVDC
link Hunterston East 400kV substation 2015 66.2 83.9
East-West
upgrade
Uprate the Strathaven-Wishaw-Kaimes-Smeaton 275kV circuits to 400kV operation
Install second cable per phase on Torness-Eccles No.1 and 2 400kV circuits
2015 18.1 9.7
Table 7: Pre-construction Works23
Project Funding
(£m)
Actual
Expenditure
(£m)
Hunterston-Kintyre link 0.6 0.5
23 Outputs for these projects will be agreed under RIIO-T1

43
Appendix 4 – Transmission Owner spend by year
Table 1: Annual TO capital (load and non load related) and operating expenditure (£m) during TPCR4 and rollover.
2007-08 2008-09 2009-10 2010-11 2011-12 2012-13 TPCR4+rollover
NGET Load related 309.7 339.6 473.2 332.2 140.6 210.4 1805.7
Non load related 383.8 326.5 387.8 392.8 474.6 460.3 2425.8
Opex 234.9 258.3 231.9 223.1 225.8 249.5 1423.6
Total 928.4 924.4 1092.9 948.1 840.9 920.3 5655.1
SHE Transmission Load related 22.7 31.9 20.0 22.0 22.2 36.0 154.9
Non load related 16.1 18.5 14.7 11.7 13.4 23.1 97.6
Opex 6.6 6.8 7.0 7.3 8.3 15.2 51.2
Total 45.5 57.2 41.7 41.0 43.9 74.3 303.6
SPTL Load related 25.5 41.7 32.2 29.7 65.5 39.4 233.9
Non load related 62.1 68.0 35.9 51.0 49.6 66.2 332.8
Opex 23.6 22.4 21.3 23.6 32.9 37.4 161.3
Total 111.2 132.1 89.4 104.3 148.0 143.0 728.0
NGGT Load related 619.8 205.4 46.7 34.5 22.0 23.3 951.7
Non load related 43.2 59.9 93.0 85.5 86.6 98.1 466.4
Opex 73.7 75.6 73.2 61.0 75.9 80.1 439.4
Total 736.7 340.9 212.9 181.0 184.6 201.5 1857.5

44
Appendix 5 – System Operator performance
1. Electricity SO incentive performance
1.20. National Grid Electricity Transmission plc (NGET) is the GB system operator (SO)
responsible for balancing the electricity system on a continuous basis.
1.21. Ofgem sets NGET’s SO incentives outside of the TPCR4 (or RIIO-T1) price control
mechanism, owing largely to the differences in timing and uncertainty of costs which
make it more efficient to regulate on shorter timescales.
1.22. Ofgem has been setting SO incentives using a target formulated under the New
Electricity Trading Arrangements (NETA) since 2001. These schemes have lasted one or
two years and incentivise NGET to operate efficiently through setting a target for its
balancing actions. NGET then retains a percentage of any under or overspend against this
target with the remainder being passed on to consumers.
1.23. Until 2010-11 the incentive scheme was set annually, with the target set before the
scheme commenced. Since 2011 the incentive schemes have been based on the
combination of forecast and actual data inputs on a two year period where the target is
estimated by the pre-agreed models.
Figure 1: Out-turn costs against target costs since 2005-624
1.24. Figure 1 above shows actual expenditure against target costs up to the current
scheme period. The SO receives an incentive payment when their costs are less than the
24 The cost data presented here is in real prices as at the time that the payment to/from NGET was calculated.

Report on the performance of Transmission Operators in TPCR4 and TPCR4RO
2007-8 to 2012-13
45
target (subject to a cap) and the SO is not fully funded for the costs it incurs greater than
the target (subject to a floor on the costs not funded).
1.25. Market developments in recent years have increased the complexity of identifying a
scheme target. A rapidly changing generation mix with a growing role for renewable
generation has increased the volatility and uncertainty regarding balancing actions, and
has particularly impacted on constraint costs. As a result, significant divergence between
scheme target and actual costs has been observed since 2008 with NGET hitting the
scheme cap or floor in each scheme year.
2. Gas SO incentive performance
1.26. National Grid Gas Plc is the gas System Operator (SO) for GB. It is responsible for
the economic and efficient management of the gas transmission system. Whereas with the
electricity incentives there is one cost-based incentive designed to motivate NGET to keep
down the costs of managing the overall system, the gas incentive package is comprised of
a small number of separate behavioural incentives.
1.27. A new incentive package was introduced from 1 April 2013. This is an eight-year
scheme, designed to align with RIIO, and sets longer term defined-output behavioural
incentives which are aligned with the incentive packages of the Transmission Owners
under the RIIO-T1 framework. The new package maintains relevant aspects of previous
incentives as well as introducing some new components. The current incentives are as
follows:
Demand Forecasting
Residual Balancing
Shrinkage
Greenhouse Gas Emissions
Maintenance
Unaccounted for Gas (UAG)
Operating Margins
1.28. The first five of these are financial, with NGGT SO rewarded or penalised for over or
underperformance against a target.
1.29. UAG and Operating Margins are reputation-based incentives without financial
implications, due to being license requirements.

Report on the performance of Transmission Operators in TPCR4 and TPCR4RO
2007-8 to 2012-13
46
Figure 2: Summary of the performance of NGGT SO from 2005-6 to 2012-1325
1.30. In the last eight years, NGGT SO has outperformed the incentives each year,
receiving incentive payments ranging from less than £2m in 2012-13 to over £9m in
2008-09.
25 Website timeliness is no longer an incentive. Maintenance is a new incentive.
-4
-2
0
2
4
6
8
10
12
Ince
nti
ve P
aym
en
ts (£
m)
Shrinkage Residual balancing
Demand forecasting Website timeliness and availability
Green house gas emissions (venting) Operating margins
Net Incentive Payments