Embed Size (px)
Citation preview
1
ENERGY POLICY RESEARCH SEMINAR JFK School of GovernmentCambridge, December 15, 2008
Transmission issues in cross-bordertrading of electricityInternal compensation chargesin the EU
Ignacio J. Pérez-ArriagaCEEPR, MITIIT, Comillas University (Madrid, Spain)
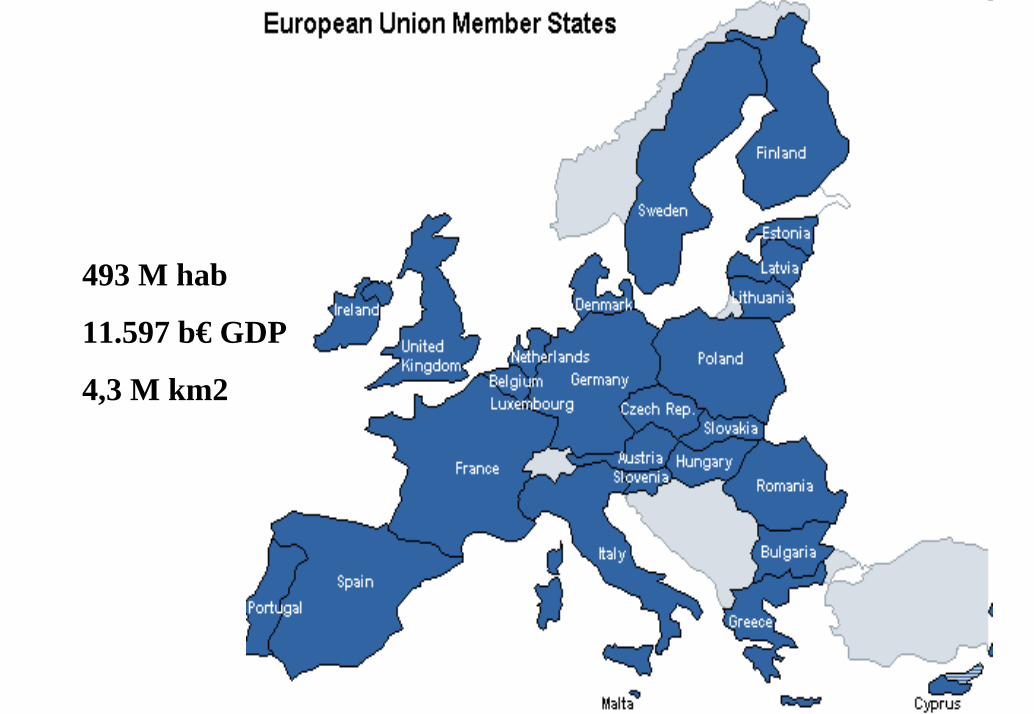
493 M hab
11.597 b€ GDP
4,3 M km2
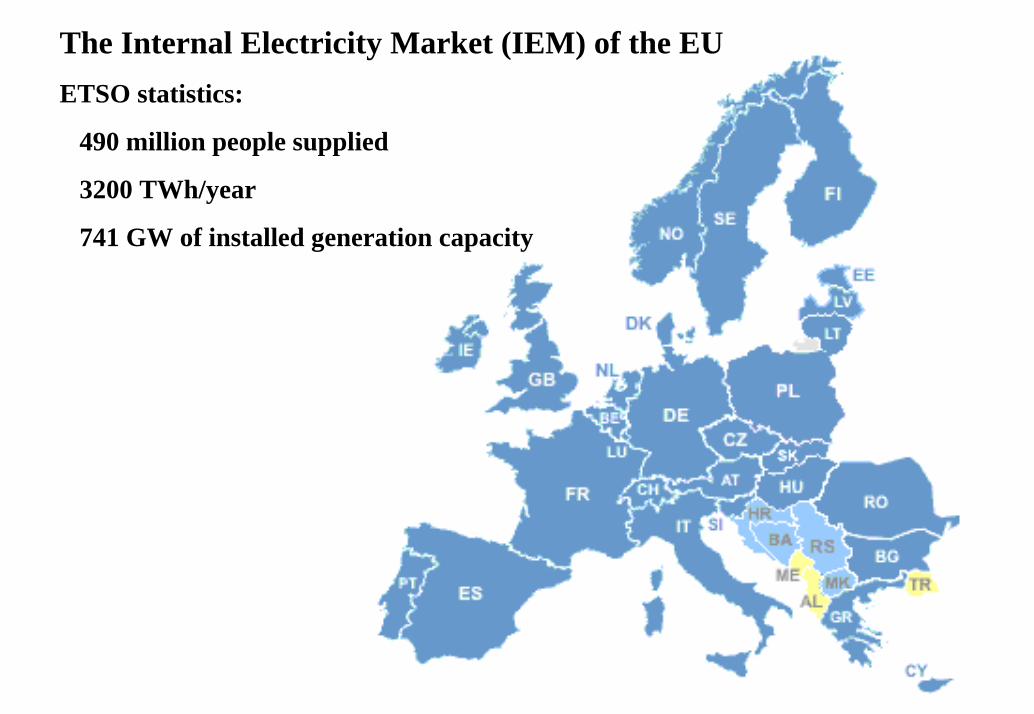
The Internal Electricity Market (IEM) of the EUETSO statistics:
490 million people supplied
3200 TWh/year
741 GW of installed generation capacity
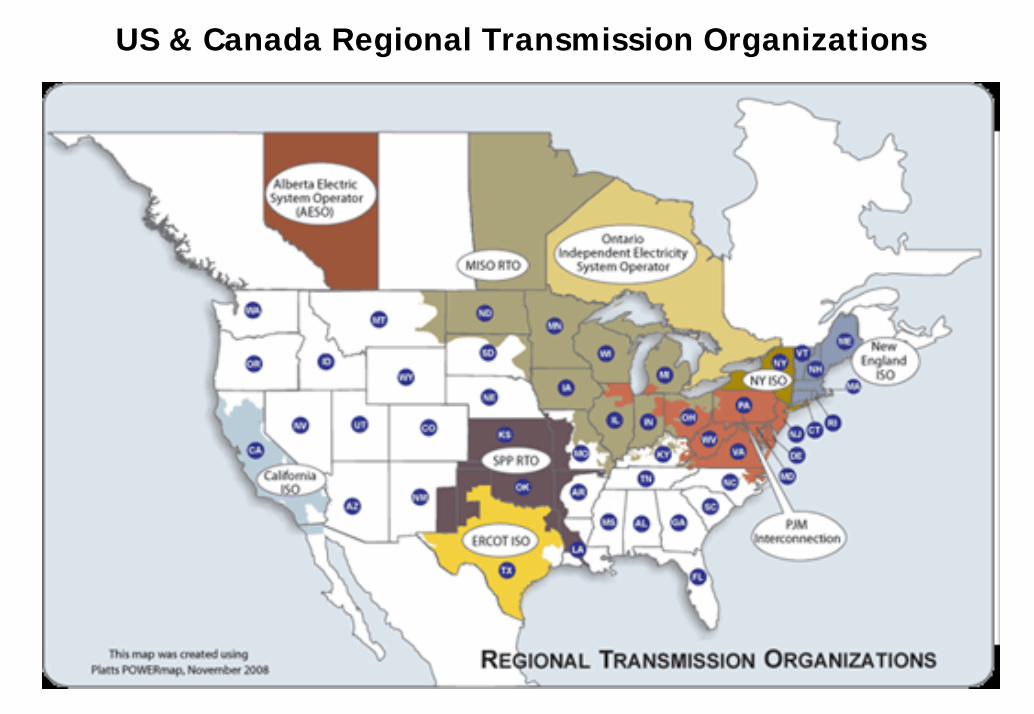
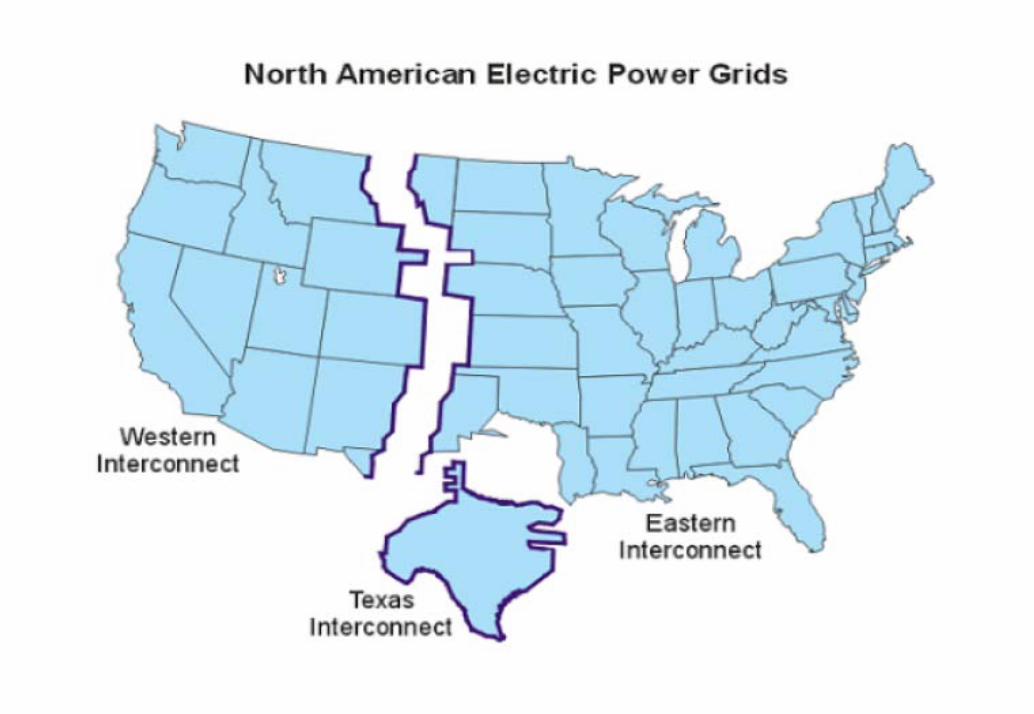
US & Canada Regional Transmission Organizations
5
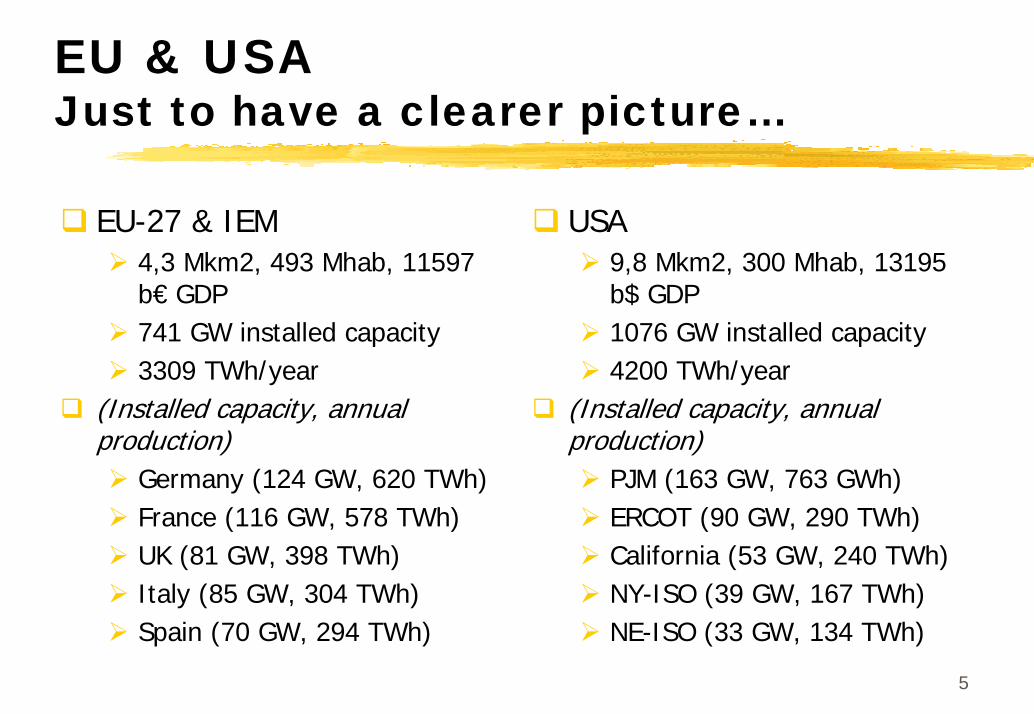
EU & USAJust to have a clearer picture…
EU-27 & IEM4,3 Mkm2, 493 Mhab, 11597 b€ GDP741 GW installed capacity3309 TWh/year
(Installed capacity, annualproduction)
Germany (124 GW, 620 TWh)France (116 GW, 578 TWh)UK (81 GW, 398 TWh)Italy (85 GW, 304 TWh)Spain (70 GW, 294 TWh)
USA9,8 Mkm2, 300 Mhab, 13195 b$ GDP1076 GW installed capacity4200 TWh/year
(Installed capacity, annualproduction)
PJM (163 GW, 763 GWh)ERCOT (90 GW, 290 TWh)California (53 GW, 240 TWh)NY-ISO (39 GW, 167 TWh)NE-ISO (33 GW, 134 TWh)
6
Cross-border trade in the IEM of the EUObjectives & challenges
The objectiveAn operating Internal Electricity Market (IEM) where electric energy is delivered at the lowest cost that is compatible with a satisfactory quality of supply & environmental sustainability
The challengeHow to implement it, taking the current situation as the starting point
7
The challenge for transmission regulation
Producers & consumers in the Internal Electricity Market (IEM) of the EU have the right to buy & sell electricity freely, but ...
How much to charge for the use of the network?
Who pays for network losses?
What to do if the network is congested?
Who upgrades the network when needed?
8
Our case exampleInter-TSO payments
Let us choose this specific problem in transmission regulation & pull out of this thread
Theory of transmission regulation
The EU IEM global approach
EU regulatory institutions
The current solution
Other related problems. What is next?
Inter-TSO payments:What’s the problem?
10
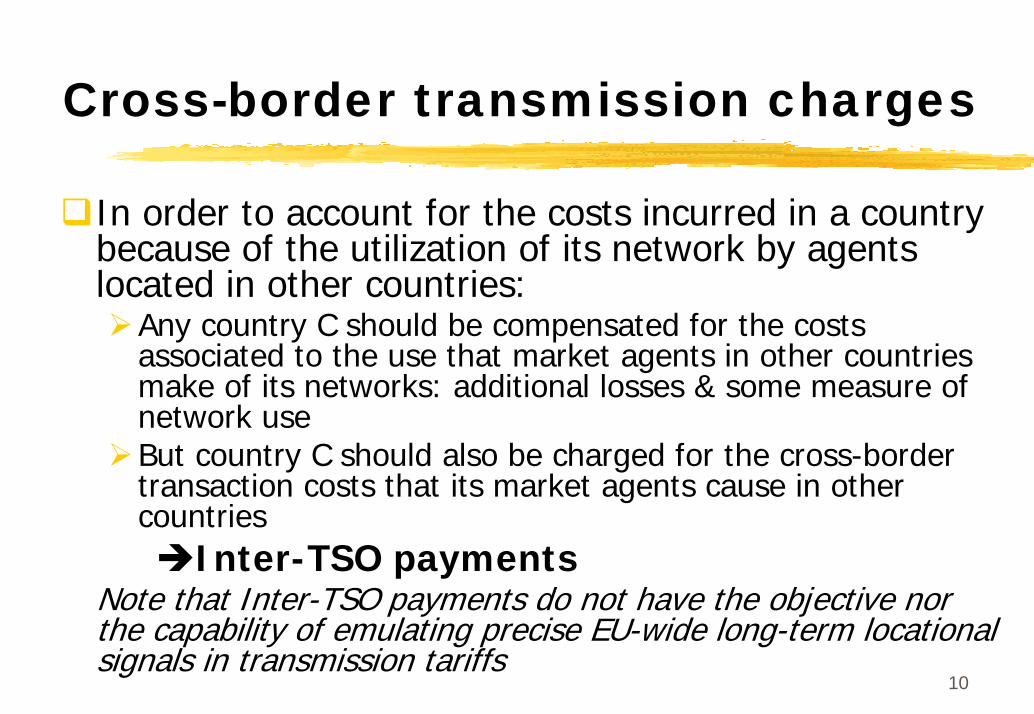
Cross-border transmission charges
In order to account for the costs incurred in a country because of the utilization of its network by agents located in other countries:
Any country C should be compensated for the costs associated to the use that market agents in other countries make of its networks: additional losses & some measure of network useBut country C should also be charged for the cross-border transaction costs that its market agents cause in other countries
Inter-TSO paymentsNote that Inter-TSO payments do not have the objective nor the capability of emulating precise EU-wide long-term locational signals in transmission tariffs

The initial approach (by the TSOs in mid 90s) wasinspired by the US “wheeling” mentality…
Utility 1 Utility 2 Utility 3A
Retail Customers
B
W
W
D
E
F
W
WIndicates strict wheeling transacctions
Distribution Systems
C C
W
H
G
Non-Utility Generators
and ImportsA - Sales to retail customers B - Sales to distribution system C - Coordination sales between two utilities D - Wheeling of power between two utilities through a third E - Wheeling of power to retail customer F - Wheeling of power to distribution G - Utility purchase of power from non-utility generators and imports H - Wheeling of power from non-utility generators and imports I - Wheeling from NUG to distribution J - Wheeling fron NUG to retail customer
W
W
J
I
Retail Customers
W
J1
2
2
Distribution Systems
I 1
… and it led to tariffpancaking & no cross-border trade
The EU Internal Electricity Market
(IEM)
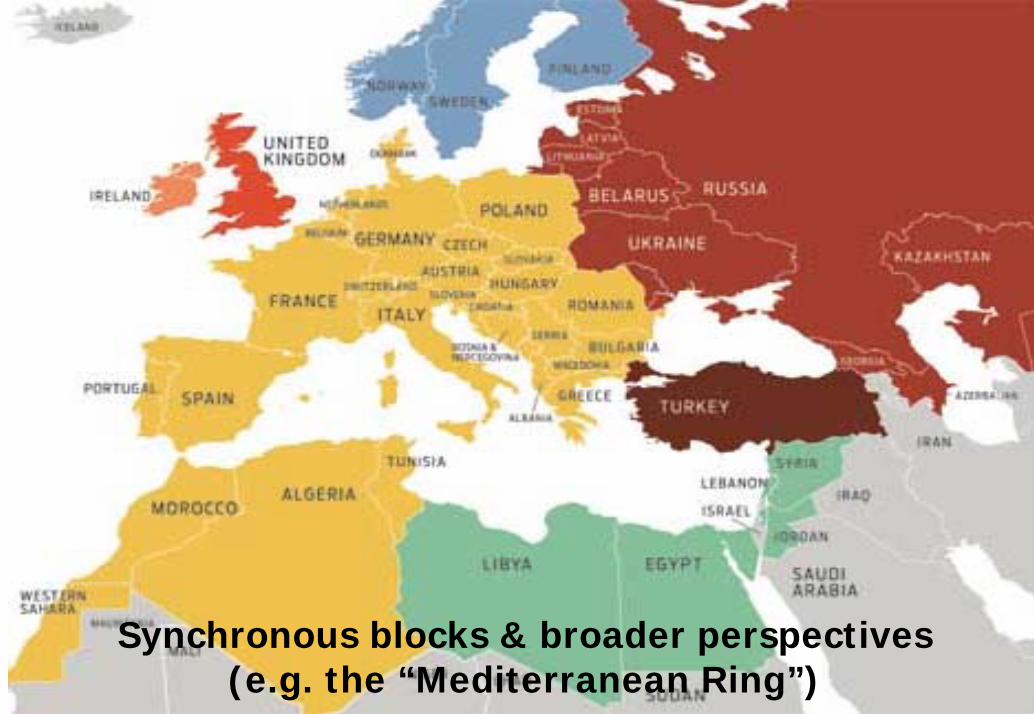
Synchronous blocks & broader perspectives(e.g. the “Mediterranean Ring”)

15
Major challenges
Transmission complexitymeshed networks
flow patterns, commercial transactions & the laws of physics
Lack of sufficient network infrastructure network constraints / bottlenecks
Lack of harmonization of transmission tariffs & regulation
Inadequate regulatory institutions to make decisions on issues of medium size caliber
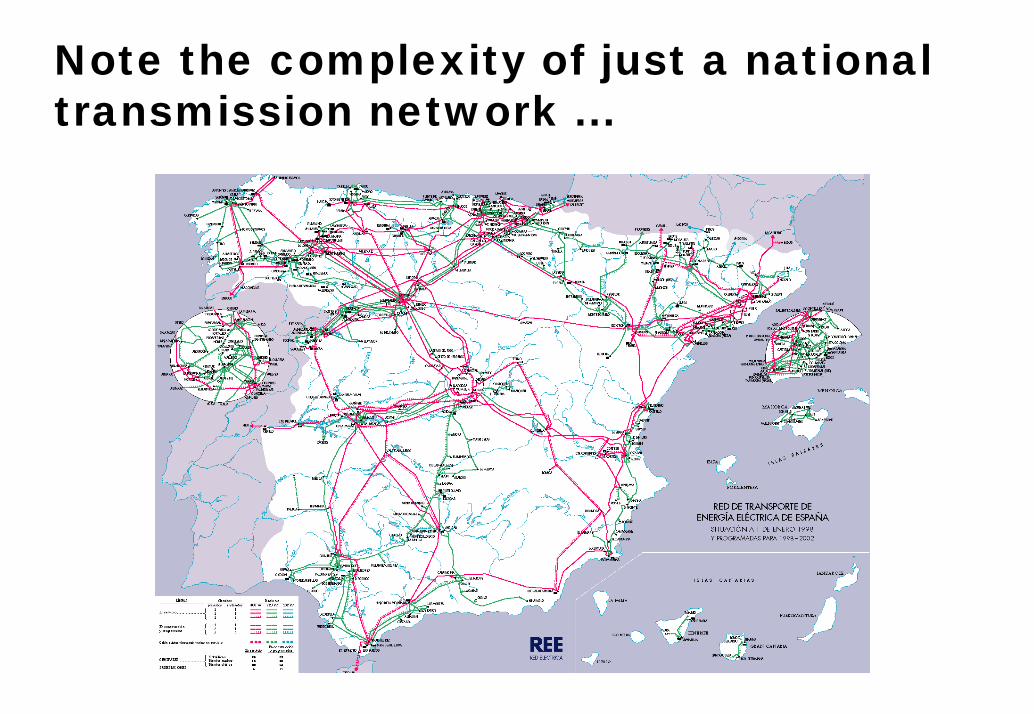
Note the complexity of just a national transmission network ...
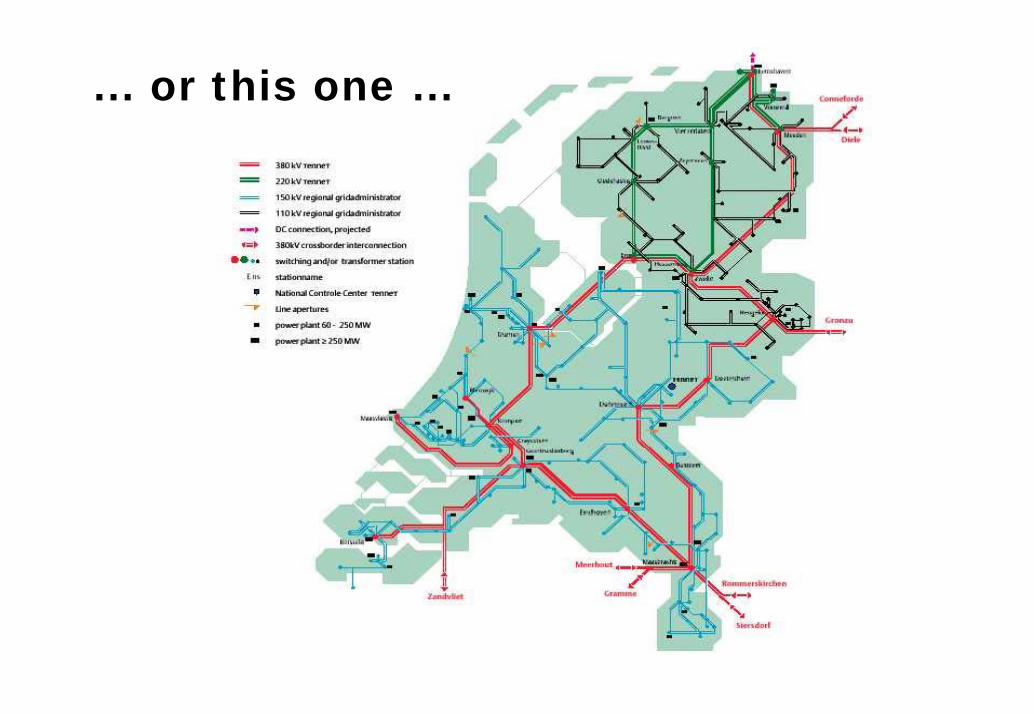
... or this one ...
F
BNL D
CHA
I
YU
GREP
10022
22
29
7
14 46
100
100
9
18
53
9
L
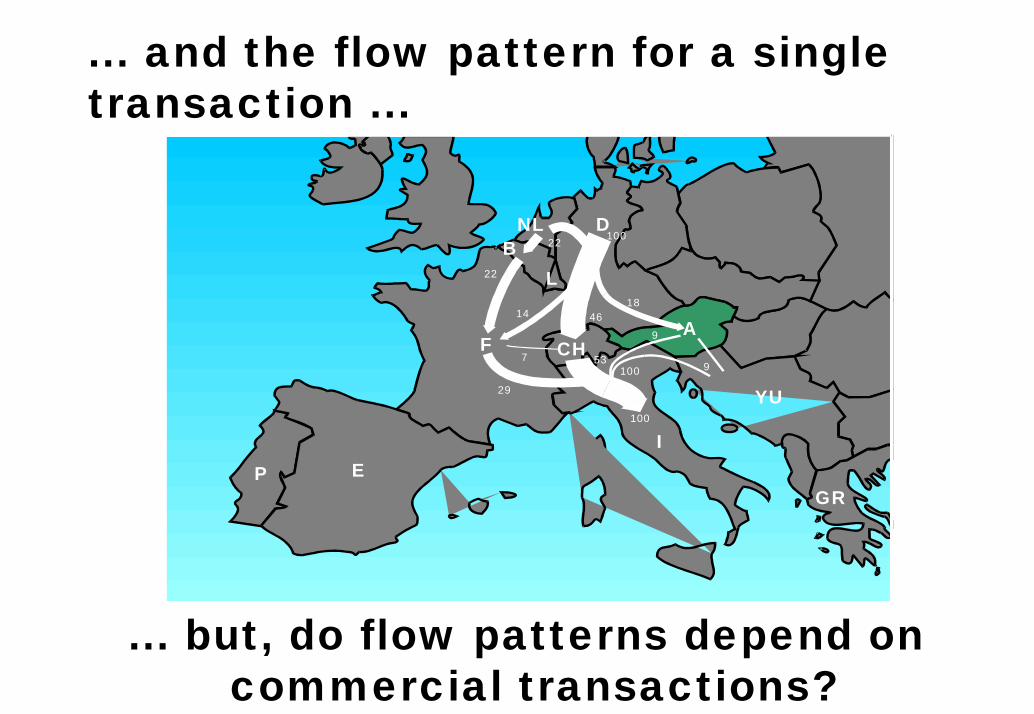
... and the flow pattern for a single transaction ...
... but, do flow patterns depend on commercial transactions?
19
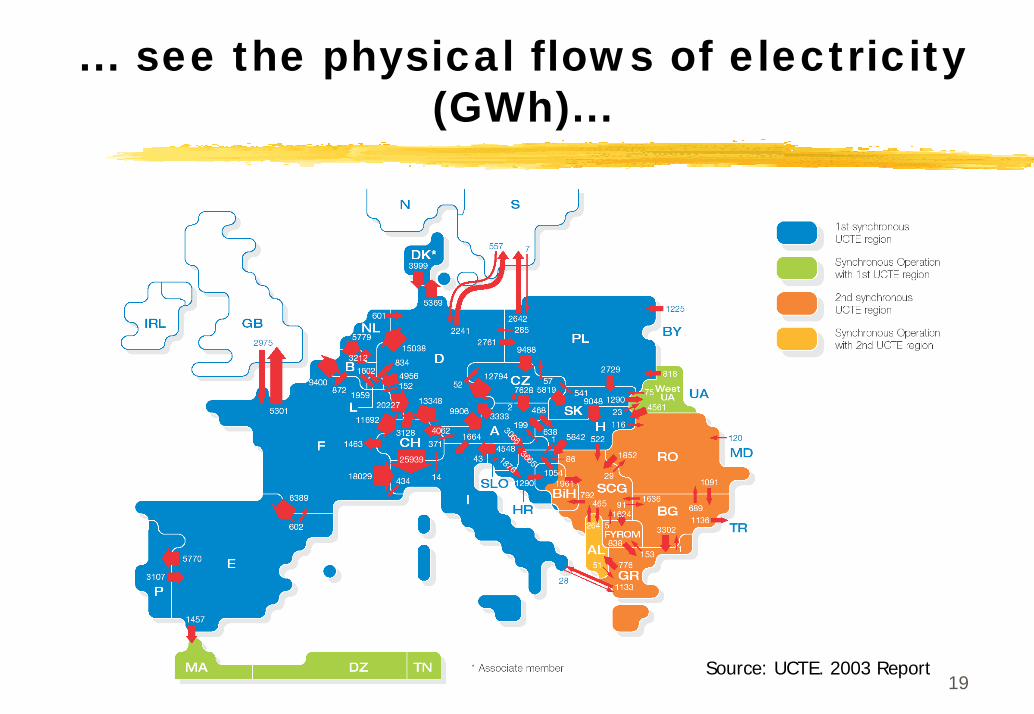
... see the physical flows of electricity (GWh)...
Source: UCTE. 2003 Report
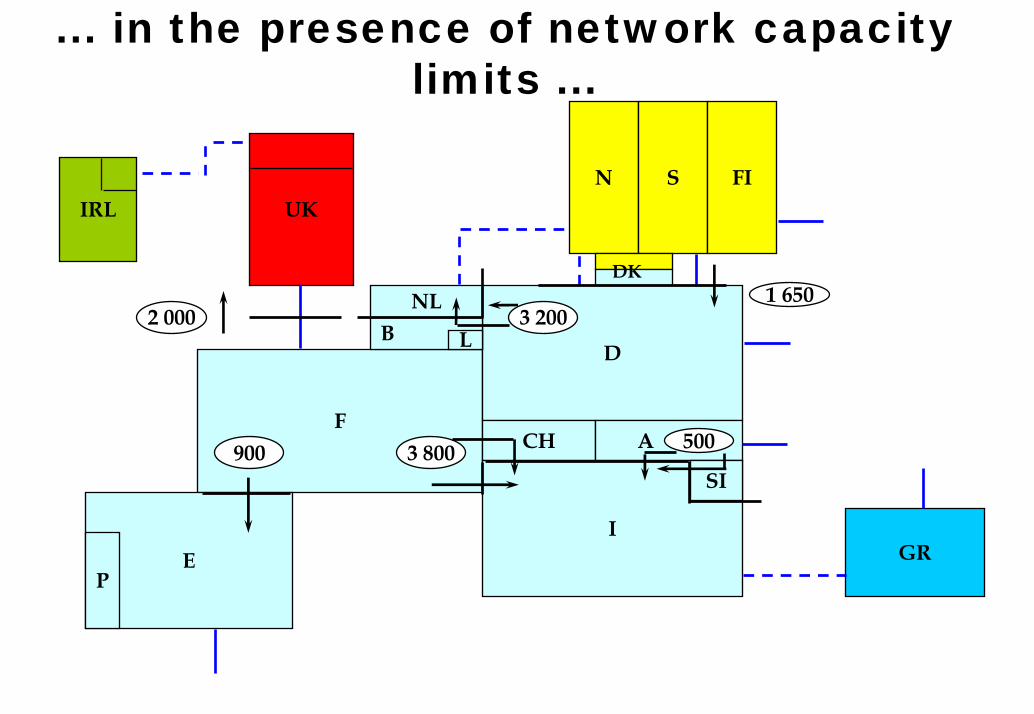
IRL UKN S FI
F
DB
NL
L
CH A
I
SI
EP
GR
DK
2 000
5003 800900
3 2001 650
... in the presence of network capacity limits ...
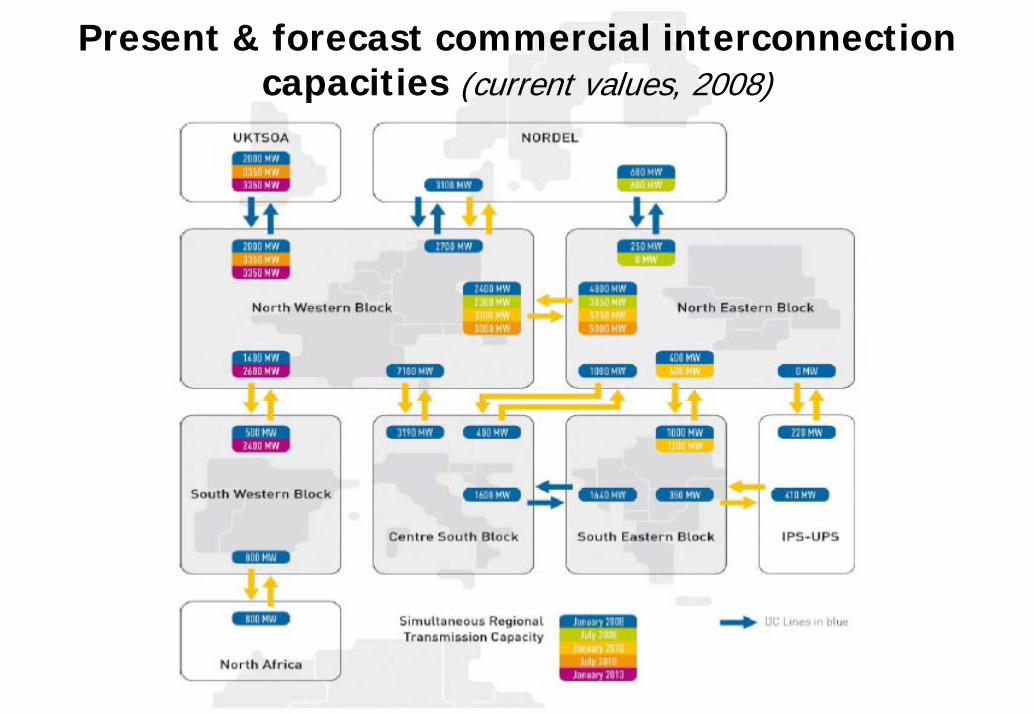
Present & forecast commercial interconnectioncapacities (current values, 2008)
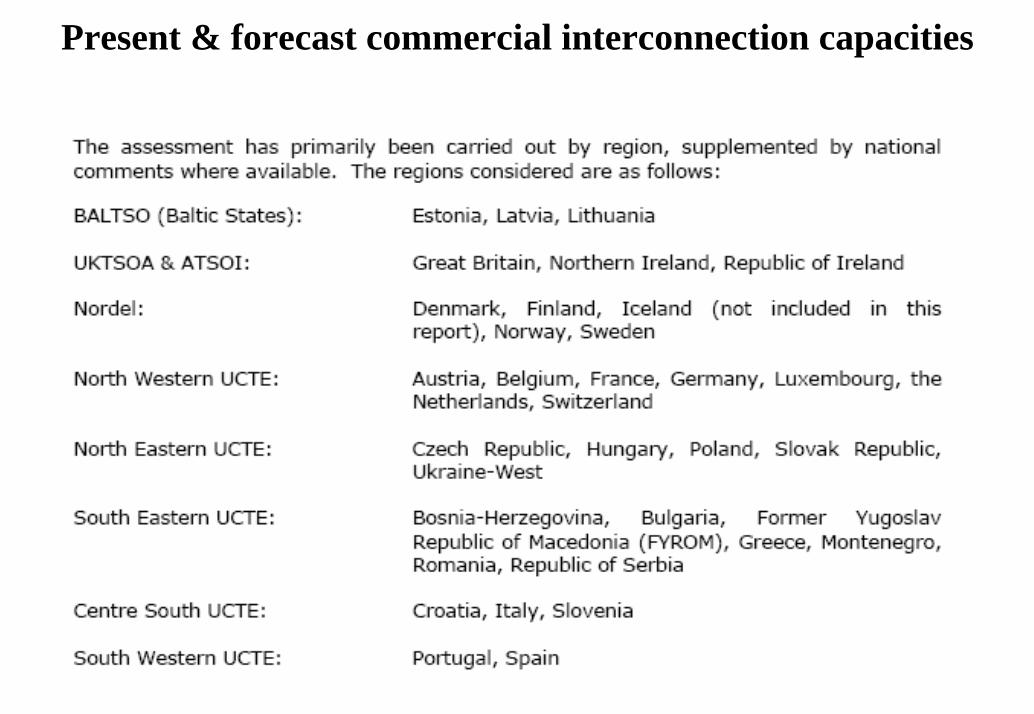
Present & forecast commercial interconnection capacities
24
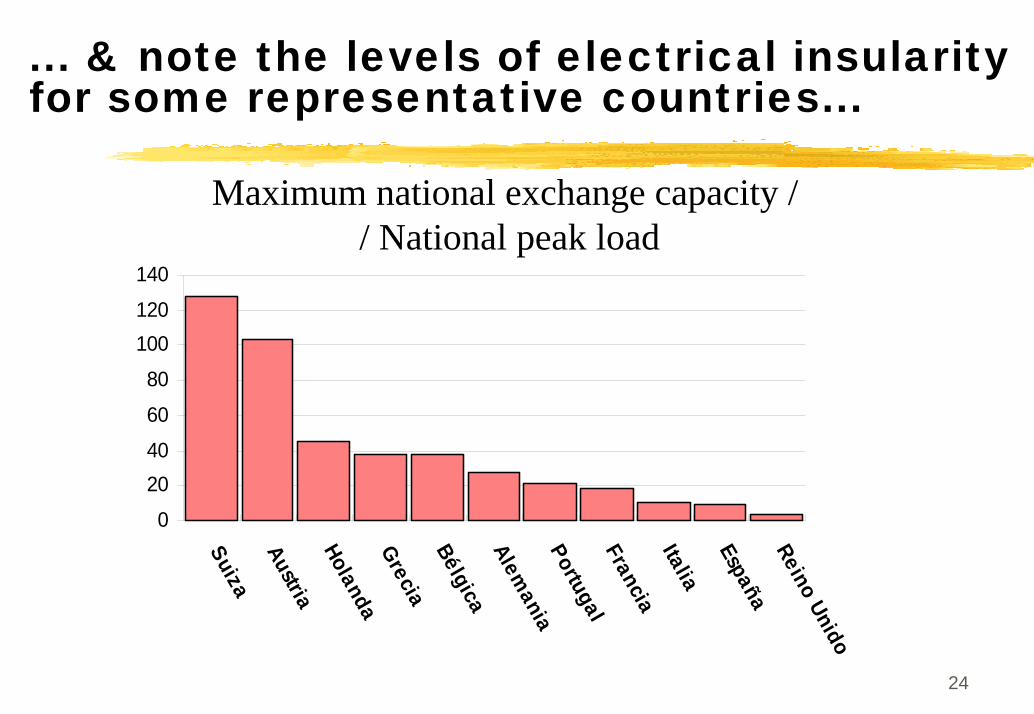
... & note the levels of electrical insularity for some representative countries...
0
2040
60
80
100120
140
SuizaAustriaHolandaGreciaBélgicaAlem
aniaPortugalFranciaItalia
EspañaReino Unido
Maximum national exchange capacity / / National peak load
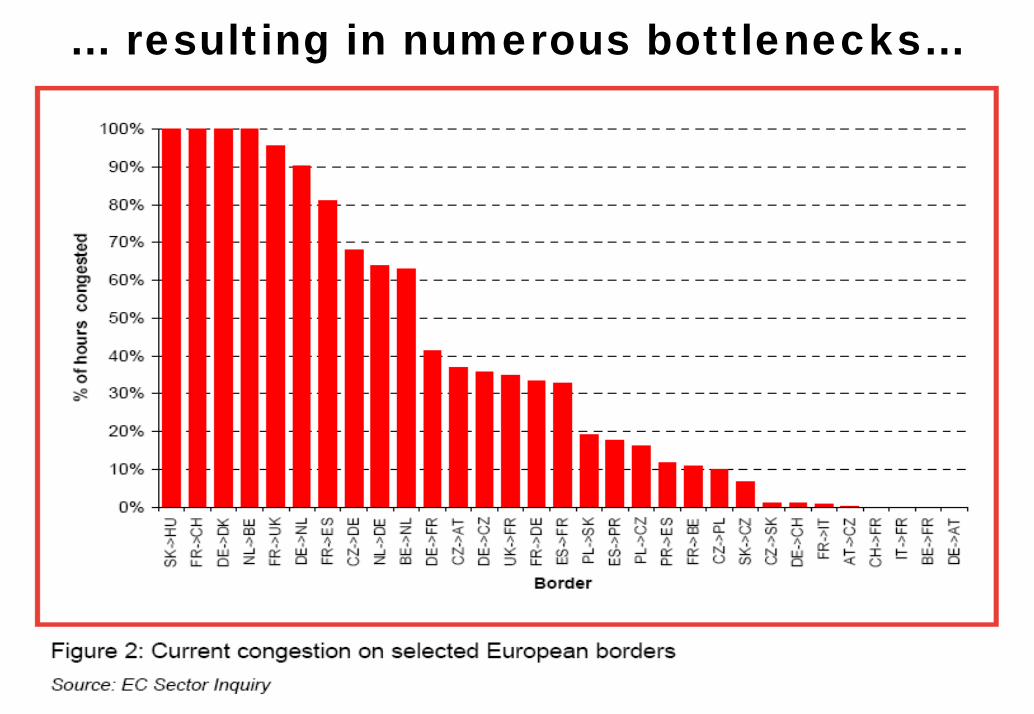
… resulting in numerous bottlenecks…
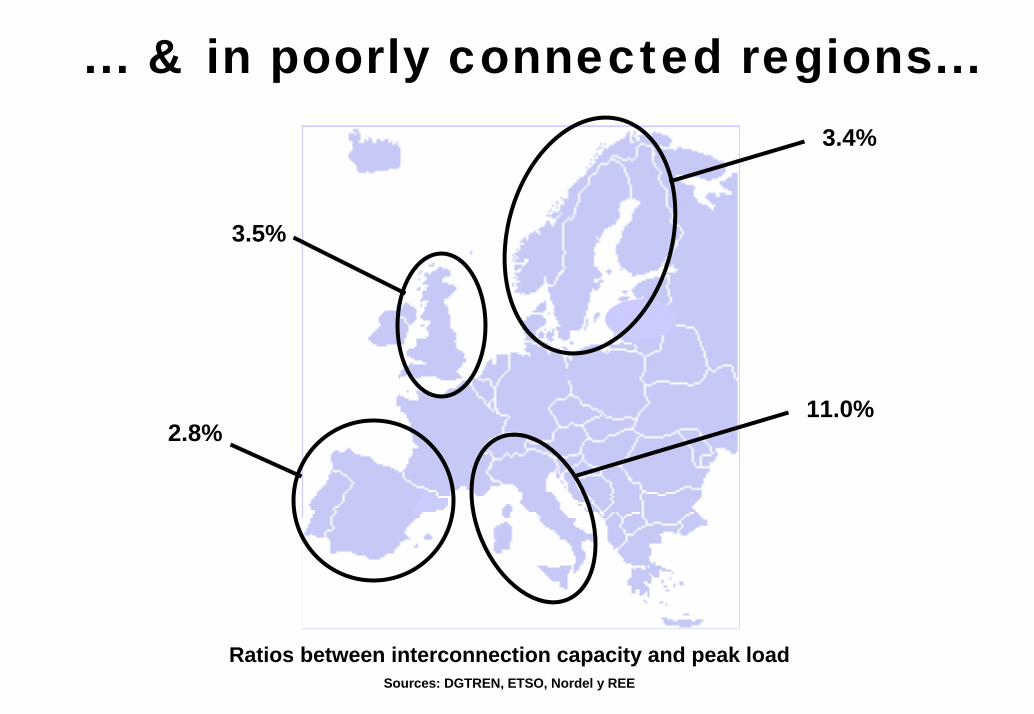
... & in poorly connected regions...3.4%
3.5%
11.0%2.8%
Ratios between interconnection capacity and peak loadSources: DGTREN, ETSO, Nordel y REE

27
The lack of sufficient interconnection capacity
In the past cross-border exchanges of electricity between EU Member States were of limited importance, mainly
for the commercial advantage of vertically integrated utilities (most often in neighboring countries)for system security & mutual support
Transmission networks were developed mainly to transport electricity within national borders
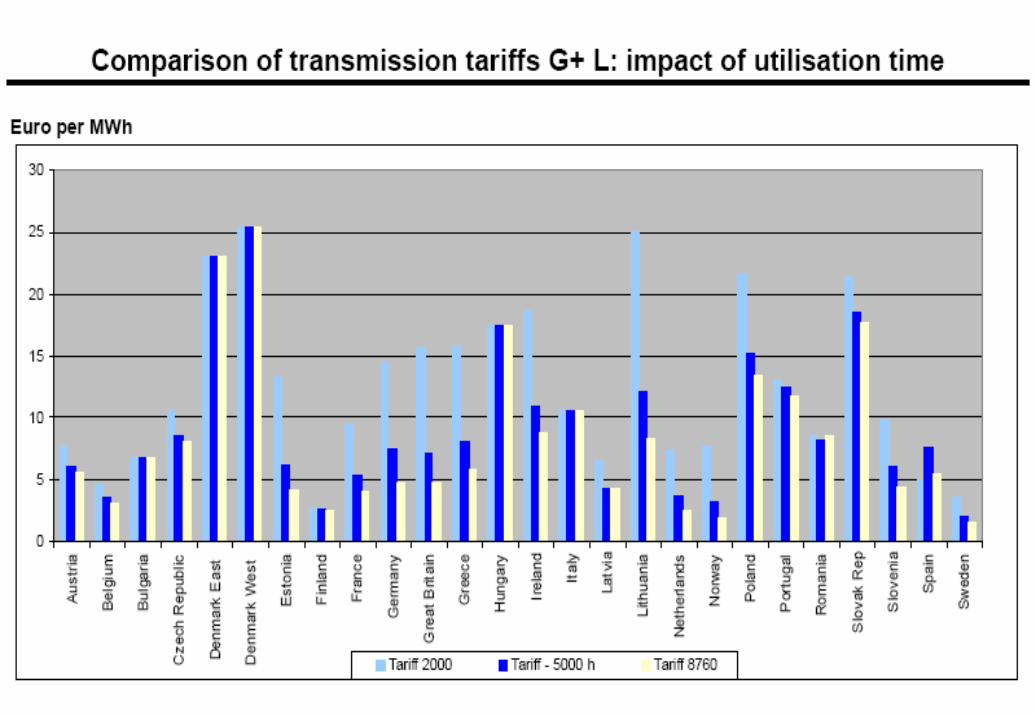
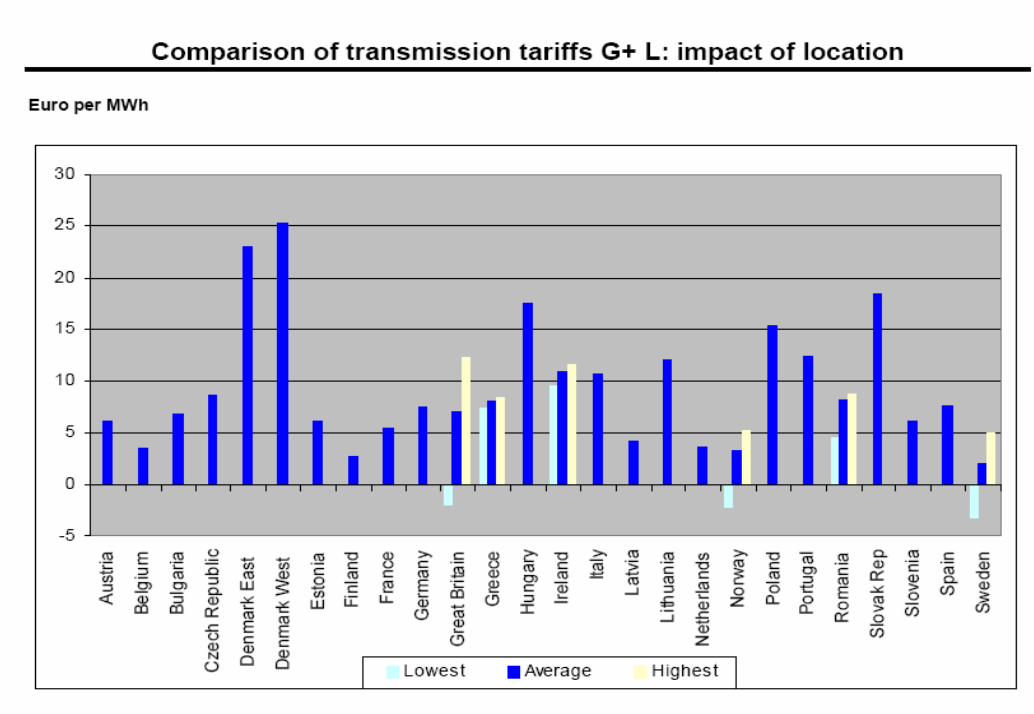
Moreover, the components of the cost in the transmission tariffs in EU differ
widely ...
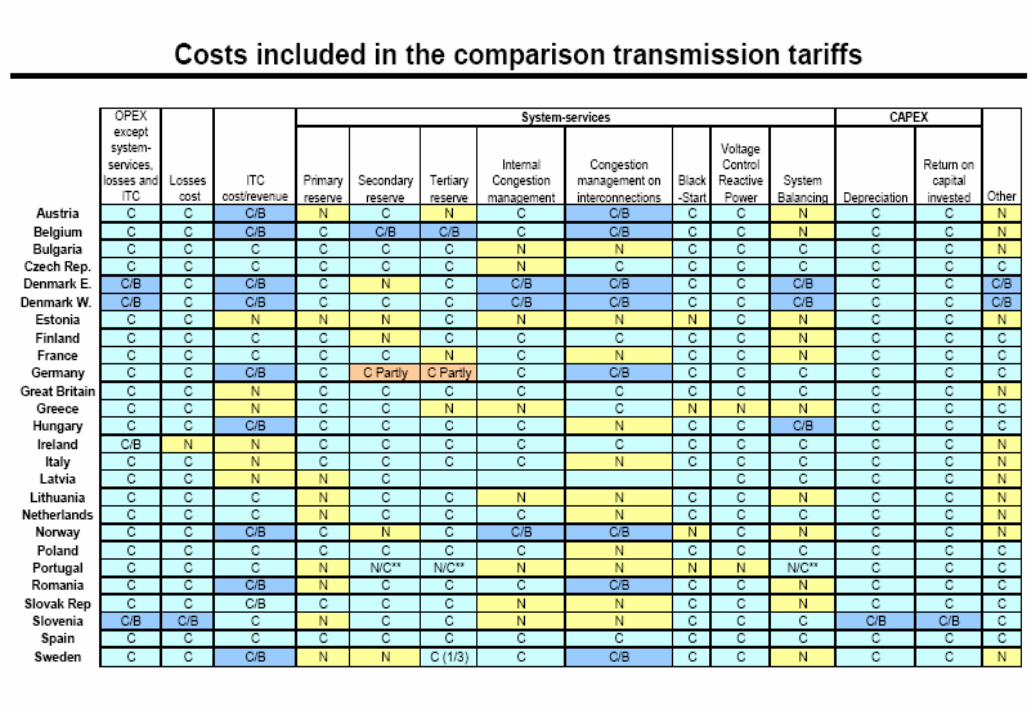

… as well as the structure of the tariffs themselves…

… and the final numerical values of the tariffs, without a convincing explanation
38
Inter-TSO payments:What’s the solution?
39
What is an acceptable cross-border trading scheme?
The “obvious” approach is wrong:Treat each cross-border transaction CBT as a local generator or demand that is placed at the corresponding border node this leads to tariff pancaking & lack of coordination in transactionmanagement
economically inefficientan obstacle to international trade
back to the basics
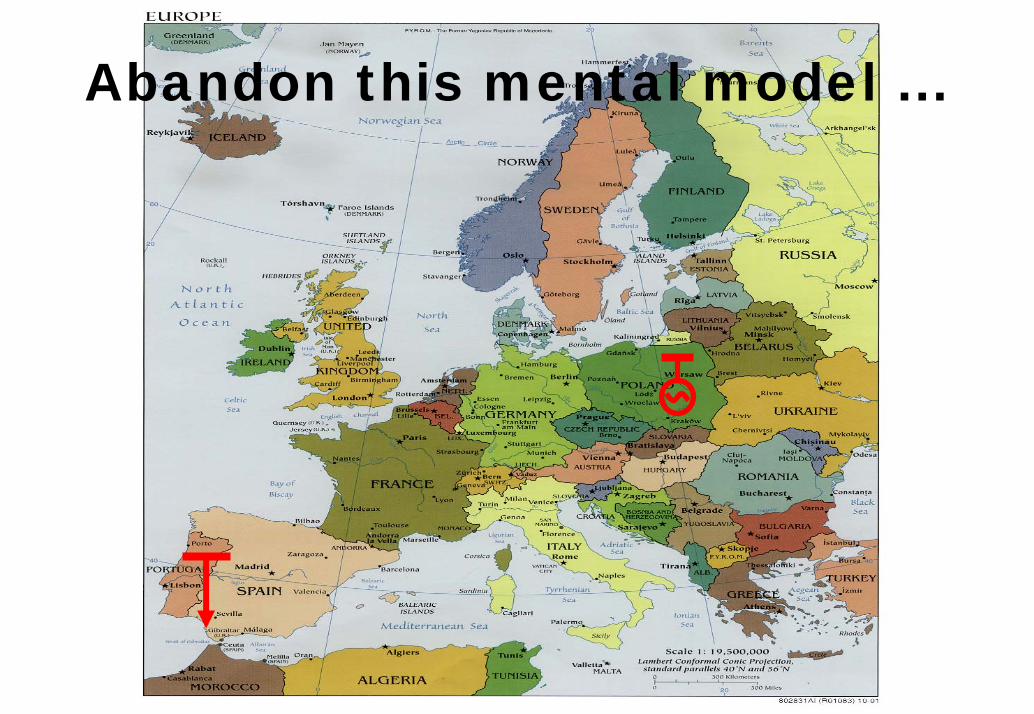
Abandon this mental model ...
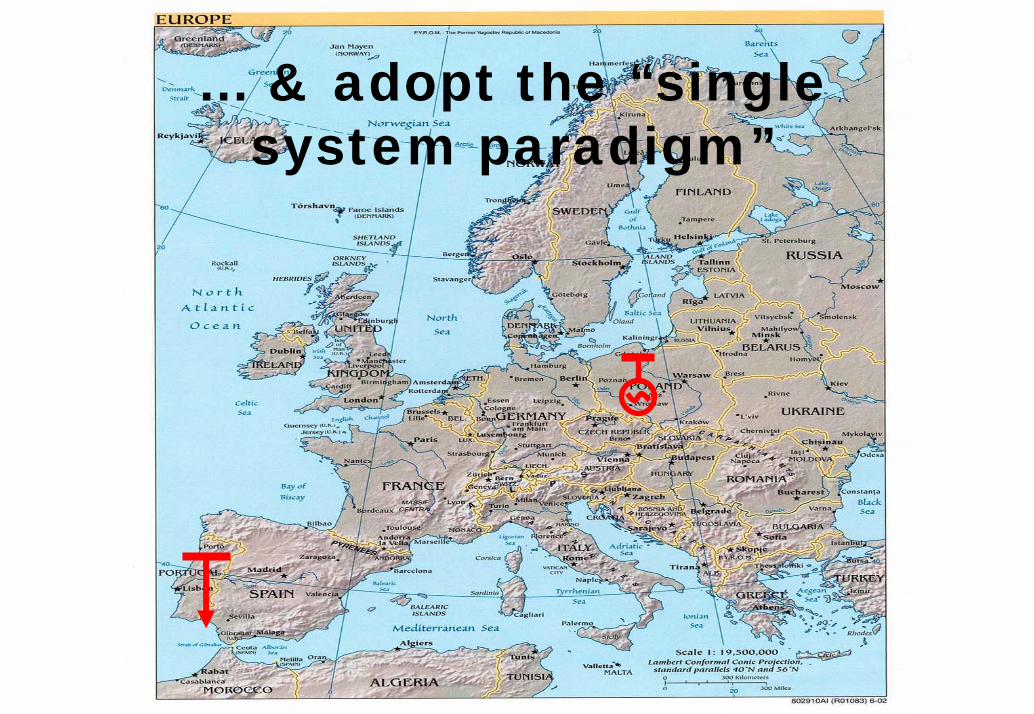
… & adopt the “single system paradigm”
42
Cross-border tarification
“Single system paradigm” for transmission network pricing
Local connection charge (G, L) providesaccess to entire EU network
charges are independent on the commercialtransactions
some transmission tariff harmonization should be achieved
43
Cross-border tarification
ImplementationPan-European access with local G & L charges
Implemented since March 2001• Also an initial export fee was applied, but eliminated two years later
Inter-TSO payments to compensate for external network use
The temporary scheme adopted in 2001 was very crude. The initial disagreement on the appropriate method tomeasure external network use, how to determine its cost & how to allocate the charges still persists
44
Cross-border tarification
Implementation (cont.)
no cross-border tariffs, but inter-TSO payments
with the net balance of inter-TSO payments each country modifies its internal G & L tariffs
Note that the final G & L tariffs are not transaction-based (& this is how it should be)
45
Inter-TSO paymentsComputation
Step 1. Determine the compensation that is due to each country/TSO on the basis of the external use of its network & standard network & energy costsStep 2. Determine the charges to be applied to each country/TSO because of its responsibility in the extra costs of other countriesStep 3. Application of the net balance of compensation & charges of a country/TSO to its internal network users
46
ComputationTwo basic approaches
1. Difference in network costs with & without transits
several possible algorithms2. Allocation of the use (standard cost) of each
one of the lines to individual nodes How much each country (TSO) must pay of each line
Inter-TSO compensations & charges are obtained by aggregation for all linesseveral possible algorithms
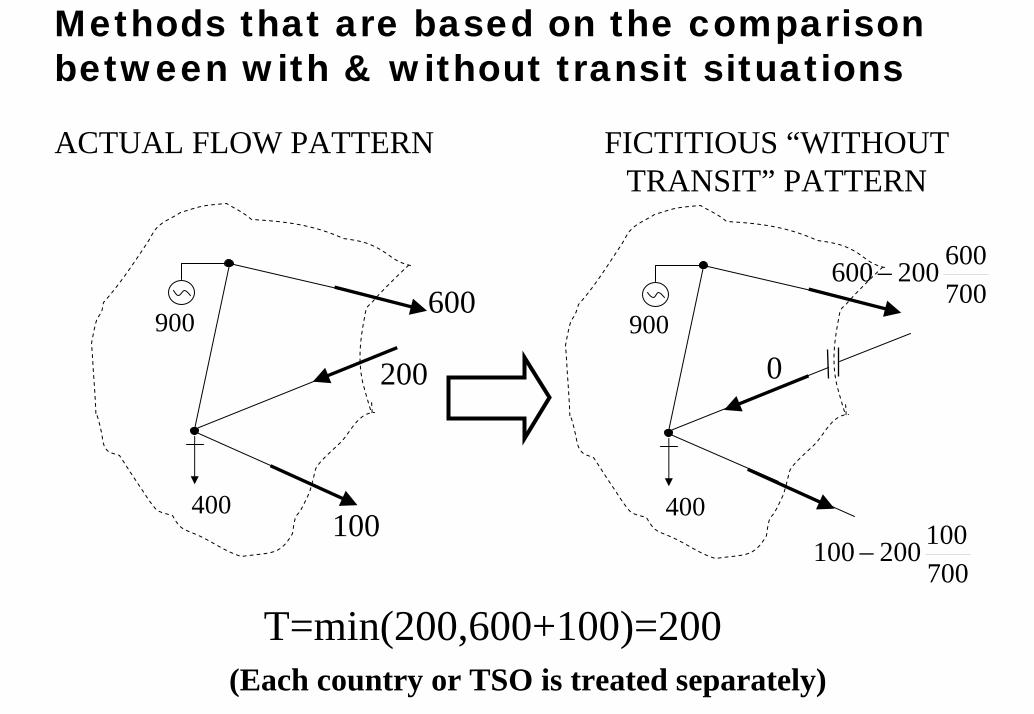
Methods that are based on the comparisonbetween with & without transit situations
ACTUAL FLOW PATTERN FICTITIOUS “WITHOUT TRANSIT” PATTERN
900
400
900
400
600
200
100
0
700600200600−
700100200100 −
T=min(200,600+100)=200(Each country or TSO is treated separately)

Methods (such as AP) that are based on theallocation of the use of each individual line
.12%
. 8%
20%15%6% .
10% ..10%
.8%. 5%
. 4%. 2%
AB
C
D

49
The institutions

50
The EU institutional framework
General: Parliament, Council, CommissionCapacity to establish EU norms (propose & approve Directives)
Specific: General Direction for Energy & Transport (DG TREN) in the EU CommissionInstitutions
Council of European Energy Regulators, CEER ERGEGEuropean Transmission System Operators, ETSOOther: Market Operators (Europex), Consumers, Traders (EFET), Power Companies (Eurelectric) The Florence Forum brought all of them together

Inter-TSO paymentsThe technical
debate
52
Approach 1:Identify the fraction of a network that is used by
“transit”
53
The WWT method (1)
A temporary approach developed by ETSO, evaluated by CEER and approved by EU Commission
First version implemented by 1st March-01 & accepted until Dec-2001
Several temporary modifications have been approved & applied since, while searching for a satisfactory permanent method
The longer-term (permanent?) approach is still under discussion
54
Allocation using the “with & without transits WWT” approach (as of 2008-09)
A definition of transit across a country or TSO is needed
Current version: the sum of all inflows into or of alloutflows from a country, whatever is smaller
Compensation to a TSO (step 1) is determinedby comparison of the with & without transitsituations
Note that the definition of “without transit”situation needs additional assumptions
55
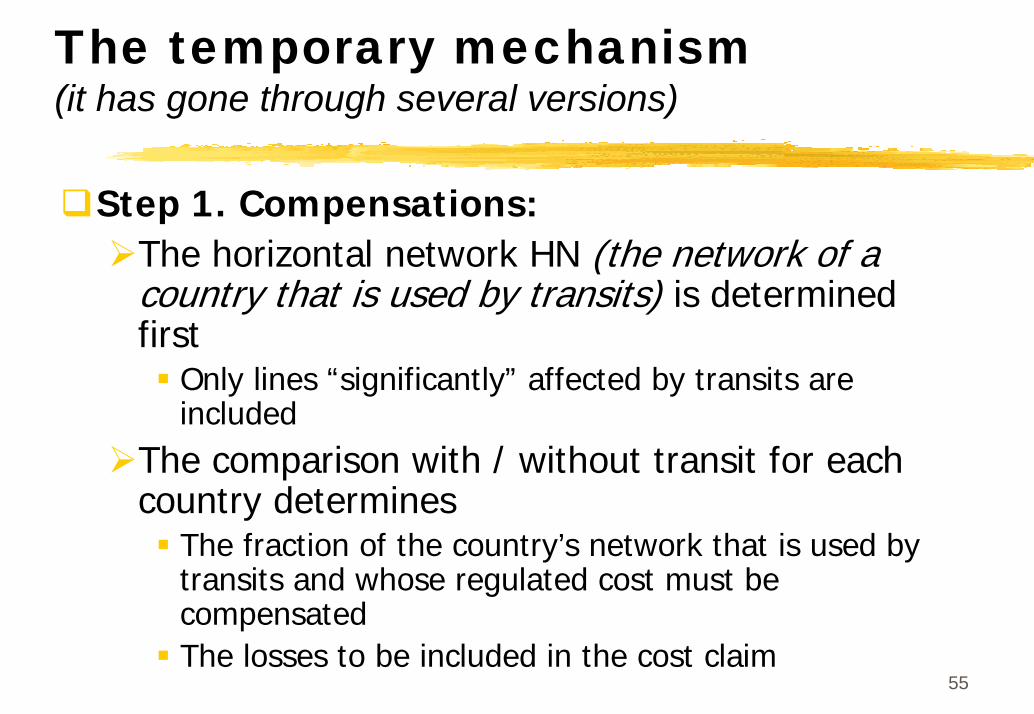
The temporary mechanism(it has gone through several versions)
Step 1. Compensations:The horizontal network HN (the network of a country that is used by transits) is determined first
Only lines “significantly” affected by transits are included
The comparison with / without transit for each country determines
The fraction of the country’s network that is used by transits and whose regulated cost must be compensatedThe losses to be included in the cost claim

56
The temporary mechanism
Step 2. Charges:The cost of the horizontal networks that is determined to be subject to external utilization is allocated to countries in proportion to the total amount of net physical exports or imports of each country (or TSO): “net flows” (computed for each scenario & aggregated for the entire year)
A 1.4 €/MWh fee is applied on imports/exports from perimeter countries
57
The temporary mechanism
Step 3. Application of net result of compensations & charges to the final end network users at each Member State
In the G & L national tariffs, with the allocationbeing left to subsidiarity
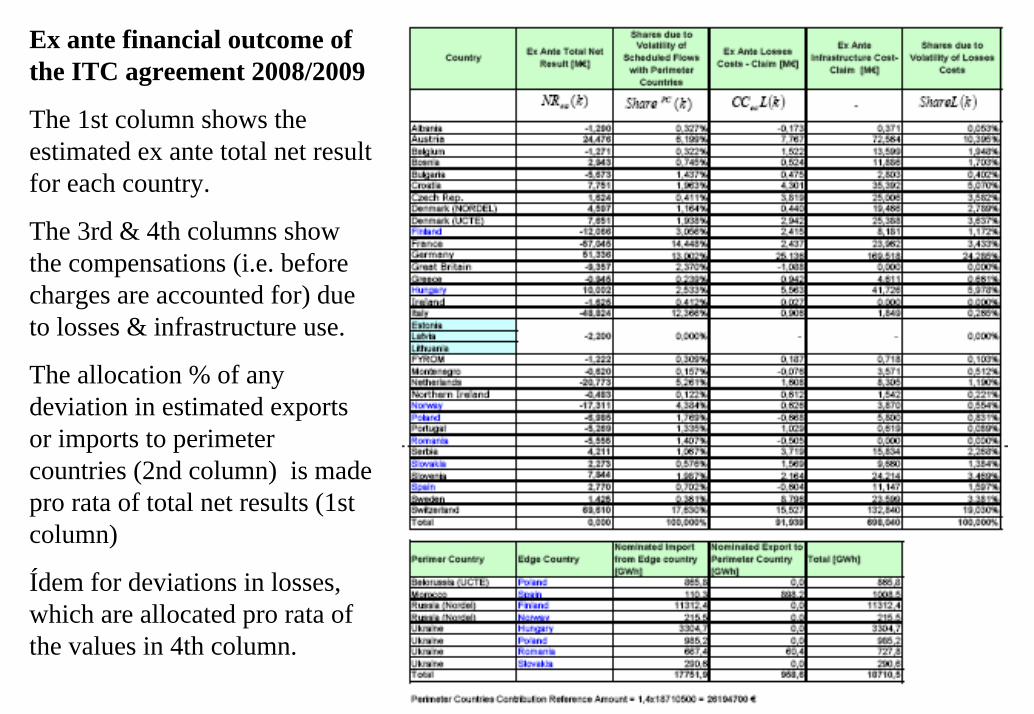
Ex ante financial outcome ofthe ITC agreement 2008/2009
The 1st column shows theestimated ex ante total net resultfor each country.
The 3rd & 4th columns show the compensations (i.e. beforecharges are accounted for) dueto losses & infrastructure use.
The allocation % of anydeviation in estimated exportsor imports to perimetercountries (2nd column) is made pro rata of total net results (1st column)
Ídem for deviations in losses, which are allocated pro rata ofthe values in 4th column.
59
Approach 2:Allocation of the use of each individual network
facility

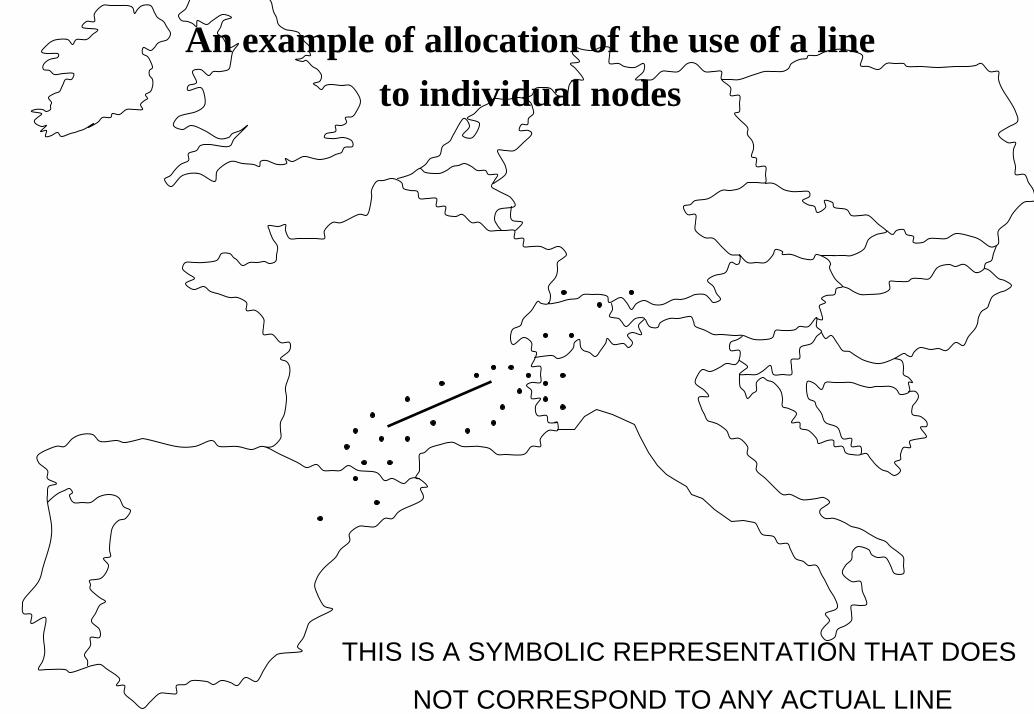
An example of allocation of the use of a line to individual nodes
THIS IS A SYMBOLIC REPRESENTATION THAT DOES
NOT CORRESPOND TO ANY ACTUAL LINE
61
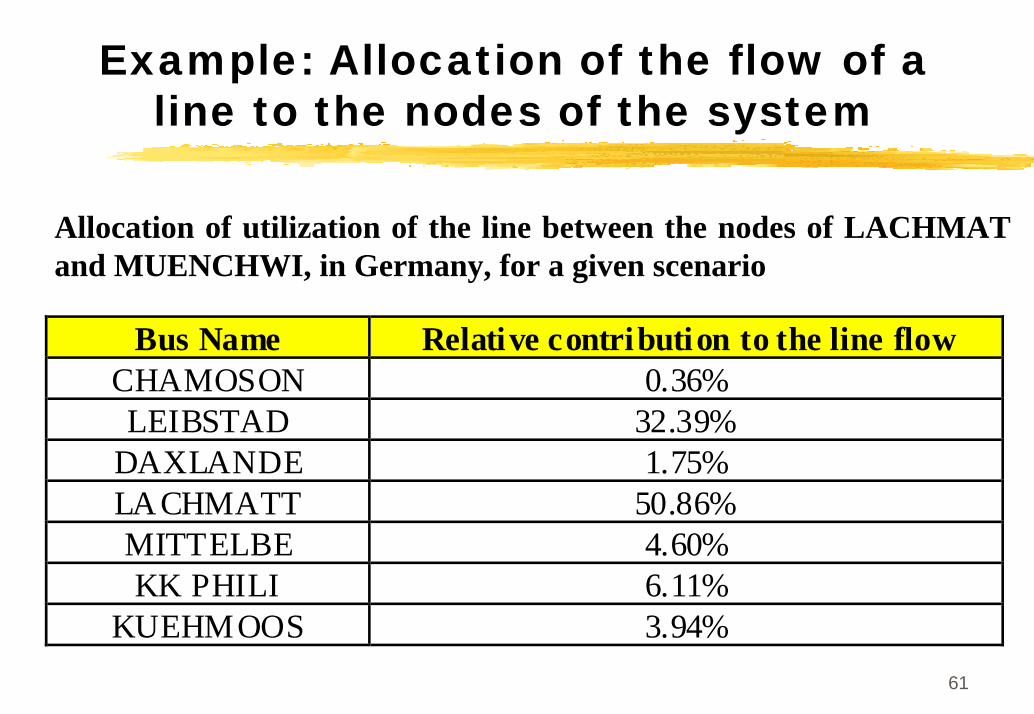
Example: Allocation of the flow of a line to the nodes of the system
Allocation of utilization of the line between the nodes of LACHMAT and MUENCHWI, in Germany, for a given scenario
Bus Name Relative contribution to the line flowCHAMOSON 0.36%LEIBSTAD 32.39%
DAXLANDE 1.75%LACHMATT 50.86%MITTELBE 4.60%KK PHILI 6.11%
KUEHMOOS 3.94%
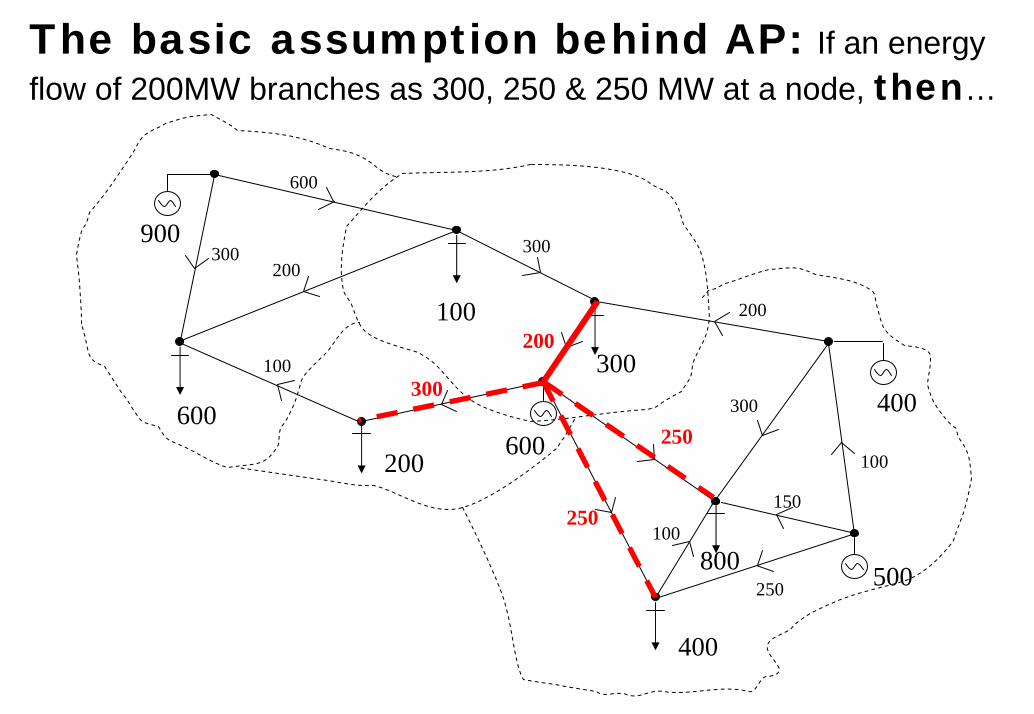
The basic assumption behind AP: If an energy flow of 200MW branches as 300, 250 & 250 MW at a node, then…
900
600
100
200600
300
400
500
400
800
250100
250
100
150
300
200
200
300200
100300
600
300
250

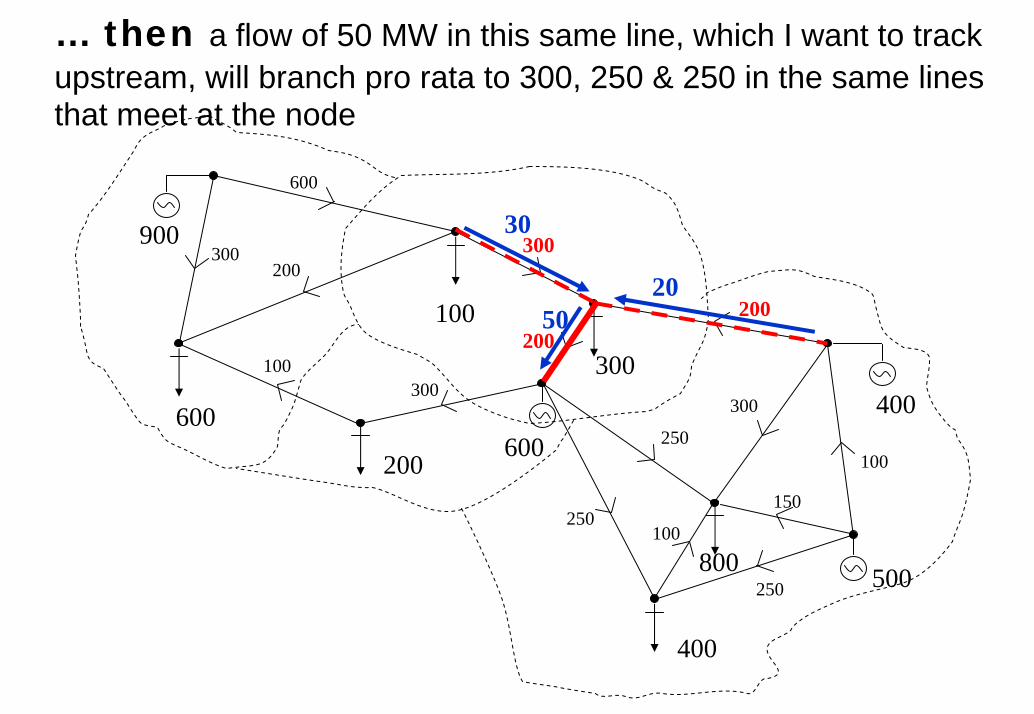
… then a flow of 50 MW in this same line, which I want to track downstream, will branch pro rata to 300, 250 & 250 in the same lines that meet at the node
900
600
100
200600
300
400
500
400
800
250100
250
100
150
300
200
200
300200
100300
600
300
250
50
18,75
16,62516,625
16,625
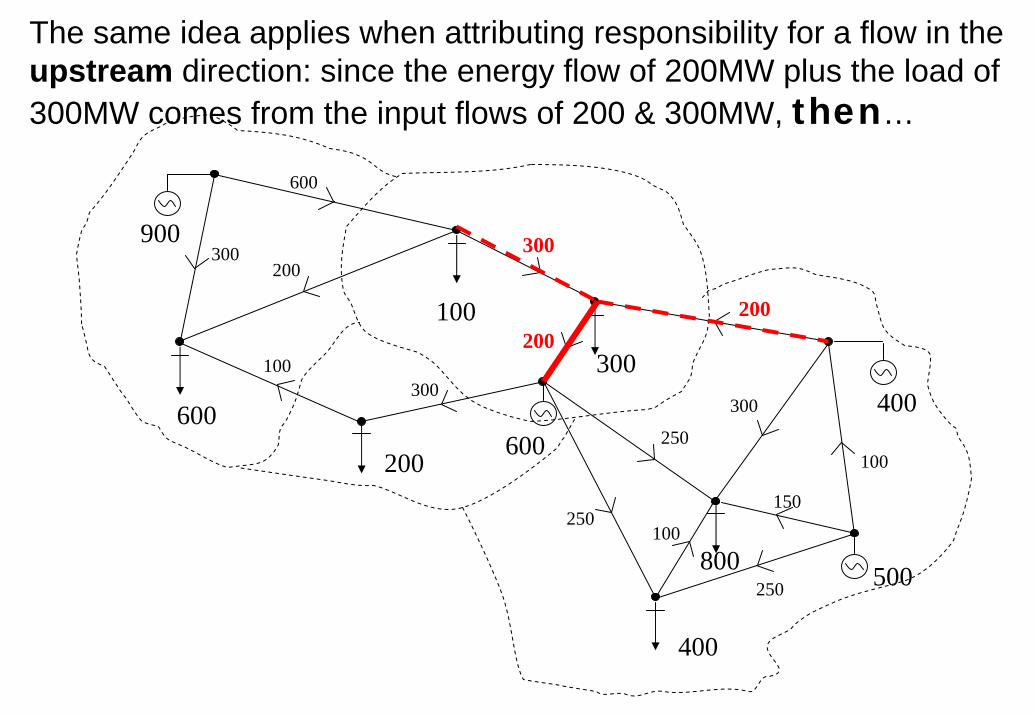
The same idea applies when attributing responsibility for a flow in the upstream direction: since the energy flow of 200MW plus the load of 300MW comes from the input flows of 200 & 300MW, then…
900
600
100
200600
300
400
500
400
800
250100
250
100
150
300
200200
300200
100300
600
300
250
… then a flow of 50 MW in this same line, which I want to track upstream, will branch pro rata to 300, 250 & 250 in the same lines that meet at the node
900
600
100
200600
300
400
500
400
800
250100
250
100
150
300
200200
300200
100300
600
300
250
50
30
20
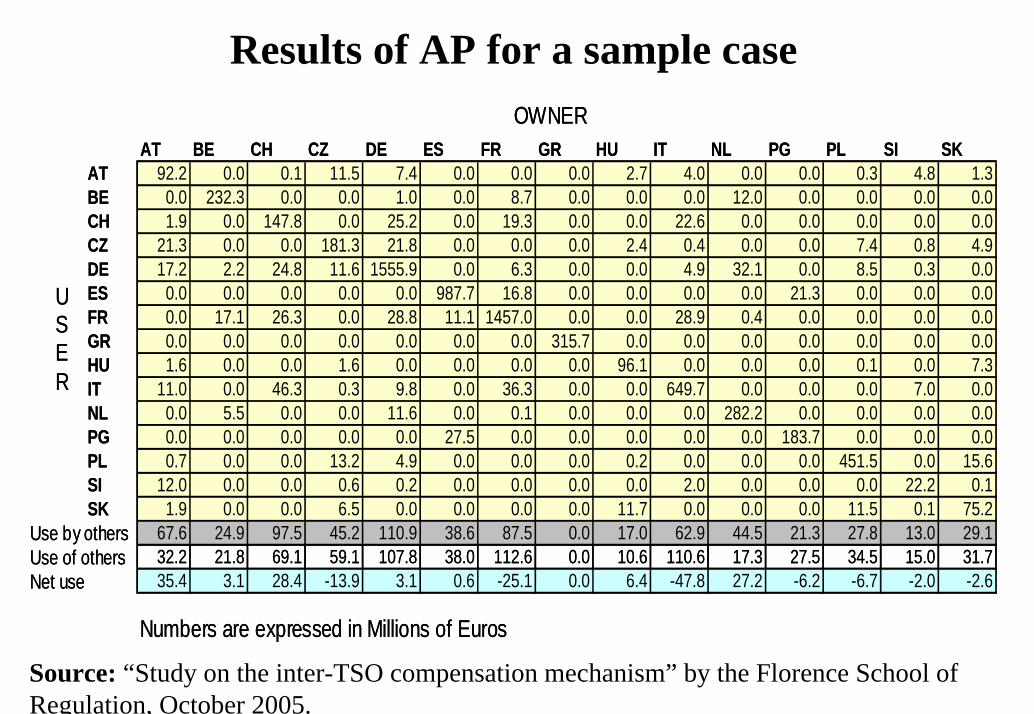
Results of AP for a sample case
Use by othersUse of othersNet use
OWNER
USER
Numbers are expressed in Millions of Euros
AT BE CH CZ DE ES FR GR HU IT NL PG PL SI SKAT 92.2 0.0 0.1 11.5 7.4 0.0 0.0 0.0 2.7 4.0 0.0 0.0 0.3 4.8 1.3BE 0.0 232.3 0.0 0.0 1.0 0.0 8.7 0.0 0.0 0.0 12.0 0.0 0.0 0.0 0.0CH 1.9 0.0 147.8 0.0 25.2 0.0 19.3 0.0 0.0 22.6 0.0 0.0 0.0 0.0 0.0CZ 21.3 0.0 0.0 181.3 21.8 0.0 0.0 0.0 2.4 0.4 0.0 0.0 7.4 0.8 4.9DE 17.2 2.2 24.8 11.6 1555.9 0.0 6.3 0.0 0.0 4.9 32.1 0.0 8.5 0.3 0.0ES 0.0 0.0 0.0 0.0 0.0 987.7 16.8 0.0 0.0 0.0 0.0 21.3 0.0 0.0 0.0FR 0.0 17.1 26.3 0.0 28.8 11.1 1457.0 0.0 0.0 28.9 0.4 0.0 0.0 0.0 0.0GR 0.0 0.0 0.0 0.0 0.0 0.0 0.0 315.7 0.0 0.0 0.0 0.0 0.0 0.0 0.0HU 1.6 0.0 0.0 1.6 0.0 0.0 0.0 0.0 96.1 0.0 0.0 0.0 0.1 0.0 7.3IT 11.0 0.0 46.3 0.3 9.8 0.0 36.3 0.0 0.0 649.7 0.0 0.0 0.0 7.0 0.0NL 0.0 5.5 0.0 0.0 11.6 0.0 0.1 0.0 0.0 0.0 282.2 0.0 0.0 0.0 0.0PG 0.0 0.0 0.0 0.0 0.0 27.5 0.0 0.0 0.0 0.0 0.0 183.7 0.0 0.0 0.0PL 0.7 0.0 0.0 13.2 4.9 0.0 0.0 0.0 0.2 0.0 0.0 0.0 451.5 0.0 15.6SI 12.0 0.0 0.0 0.6 0.2 0.0 0.0 0.0 0.0 2.0 0.0 0.0 0.0 22.2 0.1SK 1.9 0.0 0.0 6.5 0.0 0.0 0.0 0.0 11.7 0.0 0.0 0.0 11.5 0.1 75.2
67.6 24.9 97.5 45.2 110.9 38.6 87.5 0.0 17.0 62.9 44.5 21.3 27.8 13.0 29.132.2 21.8 69.1 59.1 107.8 38.0 112.6 0.0 10.6 110.6 17.3 27.5 34.5 15.0 31.735.4 3.1 28.4 -13.9 3.1 0.6 -25.1 0.0 6.4 -47.8 27.2 -6.2 -6.7 -2.0 -2.6
Source: “Study on the inter-TSO compensation mechanism” by the Florence School of Regulation, October 2005.
67
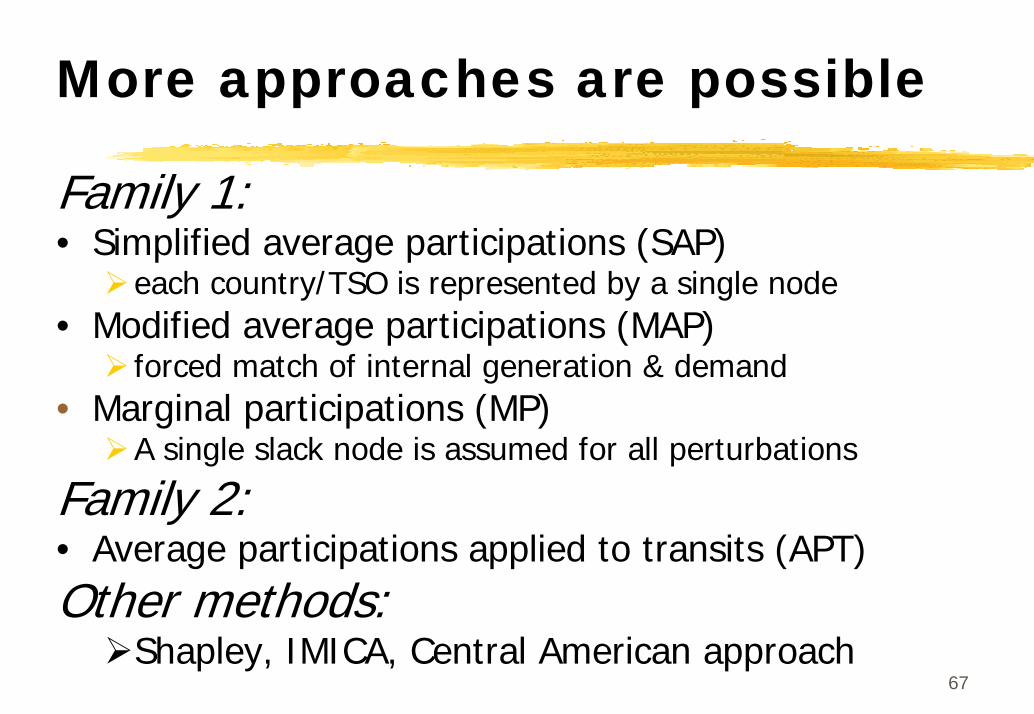
More approaches are possible
Family 1:• Simplified average participations (SAP)
each country/TSO is represented by a single node• Modified average participations (MAP)
forced match of internal generation & demand• Marginal participations (MP)
A single slack node is assumed for all perturbations
Family 2:• Average participations applied to transits (APT)Other methods:
Shapley, IMICA, Central American approach

68
Inter-TSO net paymentsWhy should we care?
Transmission tariff pancaking has been abolished already the most critical issue is already solvedThe net amounts of payments (e.g. the net payment of 49 M€ for Italy means 0,16 €/MWh if charged 100% to Italian energy demand) are typically very small if they are fully passed-through to the transmission tariffHowever
Allocations that are perceived as unfair may be a future source of conflictsThe ITC method will implicitly allocate the cost of any new transmission investment a poor allocation method may make any future line even more difficult to build

Can we tell whichone is best?
I shall reproduce here a fraction of my presentation to a Working Group ofregulators when they were trying to reach a decision in 2006
1) With & without transitsWWT
71
Comparison of ITC methods
What should we look at first when making a comparison?
Do we really understand what each method does?What are the basic assumptions behind each method?Perhaps we can make a choice that is just based on these basic issues & common senseDo not mix up “how good a method is” with “how sophisticated is the computation method that is employed in some step of the calculation”
72
Underlying assumptions behind each methodWith & without transits (WWT)
The external use of the grid of a country can be measured as the incremental impact of the transit through the country on the country’s grid flows
This requires to define “transit” & to allocate the “transit”among the several cross-border lines, therefore creating a new “without transit” situation to be compared to the actual one
The responsibility of each country k in the external use of the network of any other country m is assigned pro rata of the net flow into or out of the country k, regardless of geographical proximity or any other consideration
73
Is WWT a reasonable method? (1)
The following criticisms apply to WWT“transit” is an ambiguous concept
It may refer to flows with origin & end in external countries that actually appear to cross the country (OK)It may refer to flows with origin & end in external countries that actually do not cross the country (not OK)It may refer to “loop flows” that start & end in the own country (not OK)
But WWT does not distinguish among themHowever, “loop flows” may be as important as the flows that do cross the countries
The very foundation of WWT (the external “impact” of the transit on the country or TSO) is unreliable
74
Is WWT a reasonable method? (2)
(continuation)The “without transit” situation is an artificial one: How do you subtract “transit” if it is not clear what a “transit” is? How do you subtract the loop flows that are naturally occurring among systems without net power exchanges?
the resulting “without transits” flow pattern is an artificial construct that may not even be physically possible
Subtracting a flow pattern that may not make sense from the actual flow pattern may result in nonsensical resultsFor instance, some ETSO members have rejected the results of WWT concerning losses because they do not make physical sense
The very foundation of WWT is unreliable
75
Is WWT a reasonable method? (3)
(continuation)If a country (e.g. Germany) consists of several TSOs, WWT will result in different net ITC payments for the country as a whole with respect to the other countries when
The country is treated as a single systemEach TSO is treated as a single system & the results are aggregated
The results do not have the basic additive propertyThe very foundation of WWT is unreliable
76
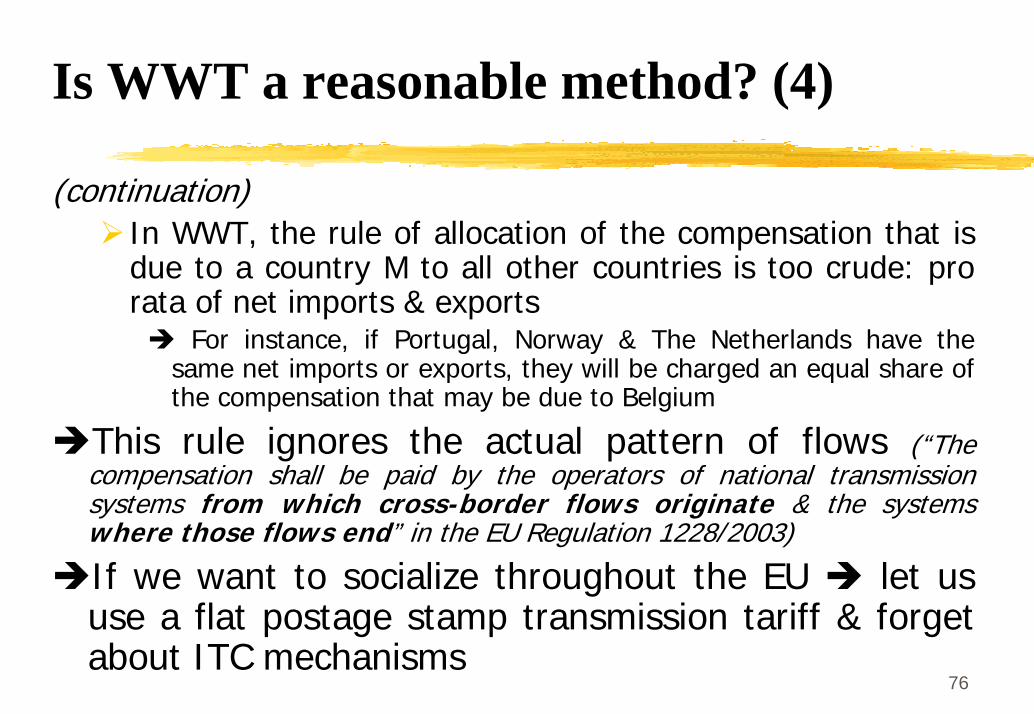
Is WWT a reasonable method? (4)
(continuation)In WWT, the rule of allocation of the compensation that is due to a country M to all other countries is too crude: pro rata of net imports & exports
For instance, if Portugal, Norway & The Netherlands have the same net imports or exports, they will be charged an equal share of the compensation that may be due to Belgium
This rule ignores the actual pattern of flows (“The compensation shall be paid by the operators of national transmission systems from which cross-border flows originate & the systems where those flows end” in the EU Regulation 1228/2003)
If we want to socialize throughout the EU let us use a flat postage stamp transmission tariff & forget about ITC mechanisms
77
Is WWT a reasonable method? (5)
(continuation)Since the “without transit” system condition may not have much sense, the subtraction of the “with” & “without”conditions may lead to bizarre results for individual lines this may have serious implications in the allocation of the cost of new lines
WWT may give conflictive results in the allocation of the cost of new lines
78
Is WWT a reasonable method?Summary
Ambiguity in the very definition of transit WWT mixes up the different types of flows“without transit” is an artificial system condition that may lead to nonsensical resultsWWT results do not have additivityThe rule of allocation of charges ignores the actual pattern of flowsWWT may give bizarre results for individual lines (critical issue when allocating the cost of future lines)
WWT only works with transits, not with all cross-border flows: Is this an advantage?
79
2) Average participationsAP
An example of allocation of the use of a line to individual nodes
THIS IS A SYMBOLIC REPRESENTATION THAT DOES
NOT CORRESPOND TO ANY ACTUAL LINE
81
Underlying assumptions behind each methodAverage participations (AP)
Accepting the technical impossibility to assign line flows unambiguously to sinks or sources, it is assumed that this responsibility can be simply obtained by tracking each flow upstream & downstream following the same paths & branching proportions that exist in the actual flows provided by ETSO
By construction, the use of each line is assigned 50/50 to demand & generation, although this proportion may be easily modified afterwards if the user of the algorithm has a good reason to do so

82
Why is not possible to assign the flows to sources & sinks?: “true” physics!!!
Load flows & circuit theory are just a convenient approximation to electromagnetic field theory, which is “as close as we can get” to explaining the flow of electromagnetic energy:
Energy flow is guided by lines & takes place in the broad space around them (outside the lines)Energy flow establishes at the speed of light & is the result of the joint & inseparable contribution of all sources & sinks acting together & interacting with one another it is not possible to attribute a piece of energy flow to a particular generator or loadProbably the most reasonable thing to say is that any fraction of the flow that is guided by a line, branches in the same proportion as the total flow in the line (this is the basic assumption of AP, which I think it is superior to those of MP & WWT)
83
Is AP a reasonable method?
It tracks the flows as they are, with no other spurious assumptions: If the complete flow (200 MW) branches as it does, a fraction of it (50 MW) will branch in the same proportion
Do the flows die too soon with AP?Who has the a priori knowledge to tell how far or close the flows die? They do what they do; AP does not change realitySome of the actual flows travel farSome small inconsistencies may happen at micro level, which can be fixed & are irrelevant for ITC
84
Is AP a reasonable method?
There is also an economic justification for APIf we accept that power in a line only flows in the direction of the actual flows (this is, we do not think of decomposing actual flows as superposition of many flows going in all directions), then the transmission charges resulting from the application of AP coincide with the Shapley value for each agent in a cooperative game with good properties in terms of fairness, efficiency & stability
AP & a new cost allocation method named Aumann-Shapley, with strong economic basis, have given very similar numerical results on test cases performed in the Brazilian transmission network

Who is in charge here?
86
Current situation is notsatisfactory
Directives, Regulations & GuidelinesMany institutions involved & not clear sense ofdirection
EU Parliament, Council & CommissionAssociations of electric companies & other stakeholdersRegulatory Fora of Florence & MadridCEER & ERGEGNational regulators
The overall approach works, but very slowly; progress isdifficult with so many viewpoints and lack of an effectivedecision-making procedure

87
A little history (1 of 5)
First EU Electricity Directive (1996)Ambiguous. Transmission charges could be negotiated or regulated. Scarce progress in market implementation
National independent regulators take the lead. The Florence Forum is born in 1998
A proposal is requested from TSO. Tariff “pancaking”
Regulators propose the “single system paradigm”The concept of complete access with just local G & L charges plus inter-TSO payments is accepted. But, how to implement the 3 steps?
Creation of ETSO, CEER, EFET, EUROPEX, etc.

88
A little history (2 of 5)
The initial consensus a provisional method (March 2002)
An endless debate to decide on the permanent method. How to reach a decision? Proposals by ETSO (WWT) & some regulators (AP). Positions aligned with national interests. The cases of Italy & Switzerland. Disagreements in ETSO because of the poor performance of the current & proposed methods. Several instances of renewal of provisional method
2003 Directive establishes minimum requirements onNetwork access, creation of wholesale markets, unbundlingof activities, installation of new generation, consumereligibility, role of regulators, etc.
89
A little history (3 of 5)
2003 Regulation does not provide specificimplementation criteria on
Harmonization of transmission charges, cross-bordertarification, network congestion management, handling oflong-term contracts, interconnection reinforcement thepossibilities of cross-border trade are not fully exploited yet
Creation of ERGEG & extension of UEComitology. Gridlock of regulators & TSOs with new proposal (IMICA) by ETSO. Other proposals. Current request of EU Commission to ETSO to make a new proposal by 2009 Nobody is really in charge
90
A little history (4 of 5)
Proposal (Sept. 2007) by the EU Commission toParliament & Council to establish an “Agency for theCooperation of Energy Regulators” (ACER). Main tasks:
Providing a framework for national regulators tocooperateRegulatory oversight of the cooperation among TSOsIndividual decision powers (do not include normative decisions)
Exemption requests for infrastructure assets (direct lines)Regulatory regime concerning cross-border infrastructureSpecific decisions when established by any Guidelines undercomitology procedure
General advisory role

91
A little history (5 of 5)
A European network of TSOs (ENTSO), bothfor electricity (ENTSO-E) and gas (ENTSO-G), will be created to set and coordinate networkaccess rules and grid investment plansStill an open issue is the scope of theresponsibilities of ACER, in particular itscapability to harmonise cross-bordertransmission regulation

92
Some considerations
National regulators are closest to the actual topics, but they are also more prone to be influenced by stakeholders and by the need togive solution to pressing political issuesA European regulatory agency would help in maintaining a distance to national specificinterests & overcoming gridlock situations onissues of medium relevance & EU dimension

Other pending transmission issues in cross-border trade
(maybe another talk?)
Harmonization of network tariffs

95
Harmonization of transmission tariffsThe present situation
The level of the tariffs differs much among countries
objective factors justify that national tariffs should be different regulatory factors of difficult harmonization are also very influential in the level of the tariffs
The tariff structures also differ muchallocation to energy or capacity, to generators or consumers, time or geographical differentiation

96
The impact of lack of tariffharmonization
The average value of the 2002 inter-TSO nationalcompensations (assuming a uniform charge to all consumers) was0.2 €/MWh (with two outliers of 0.5 & 1.8€/MWh)
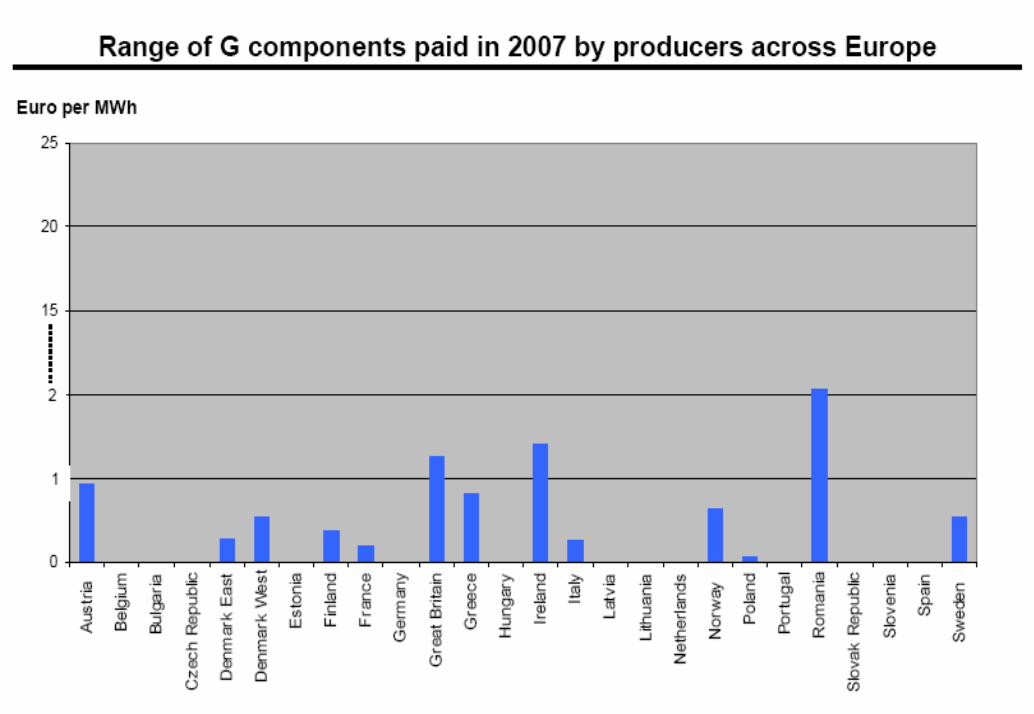
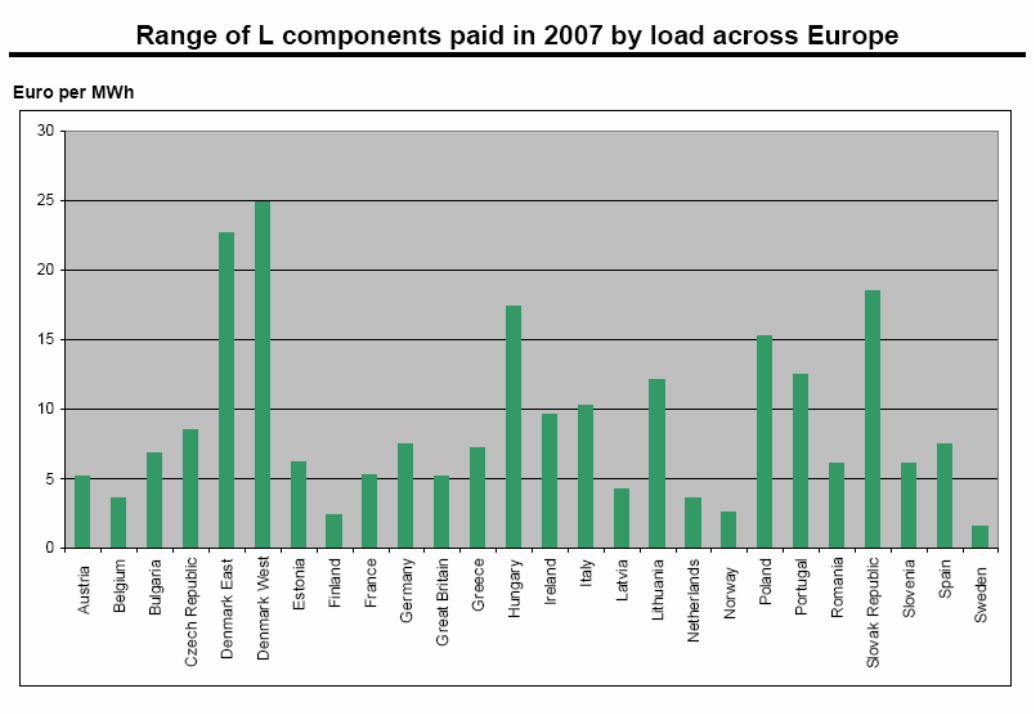
Typical transmission tariffs for large consumers in the IEM range between 2.5 & 25 €/MWh in 2007
tariff harmonization is far more important on thefinal value of the transmission charges than inter-TSO payments
97
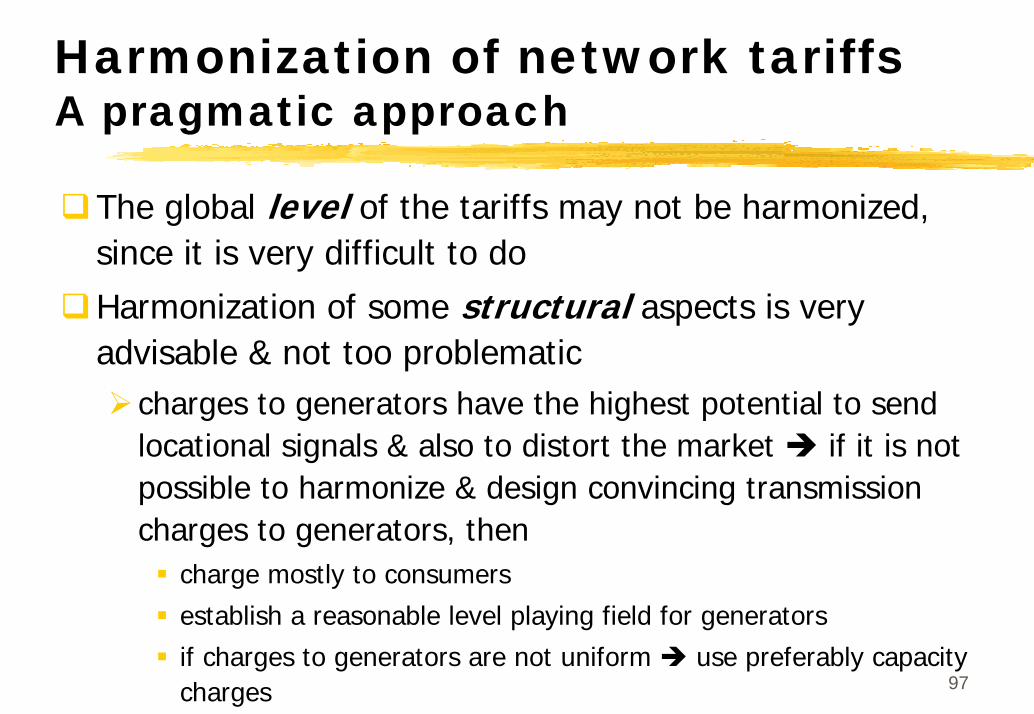
Harmonization of network tariffsA pragmatic approach
The global level of the tariffs may not be harmonized, since it is very difficult to do
Harmonization of some structural aspects is very advisable & not too problematic
charges to generators have the highest potential to send locational signals & also to distort the market if it is not possible to harmonize & design convincing transmission charges to generators, then
charge mostly to consumers
establish a reasonable level playing field for generators
if charges to generators are not uniform use preferably capacity charges

Management ofnetwork constraints
99
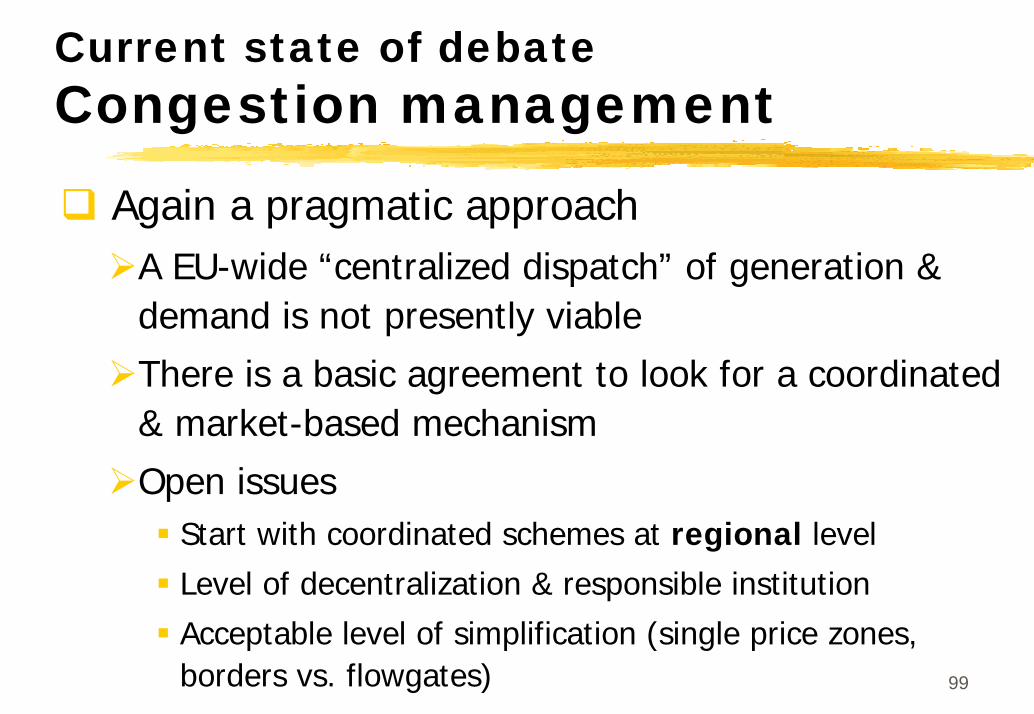
Current state of debateCongestion management
Again a pragmatic approachA EU-wide “centralized dispatch” of generation & demand is not presently viable
There is a basic agreement to look for a coordinated& market-based mechanism
Open issuesStart with coordinated schemes at regional level
Level of decentralization & responsible institution
Acceptable level of simplification (single price zones, borders vs. flowgates)

Network & constraint representation(>4000 nodes & lines)
Gi
Dj
lk
lm
Max. capacitykMax.
capacitym
ljMax.
capacityj
101
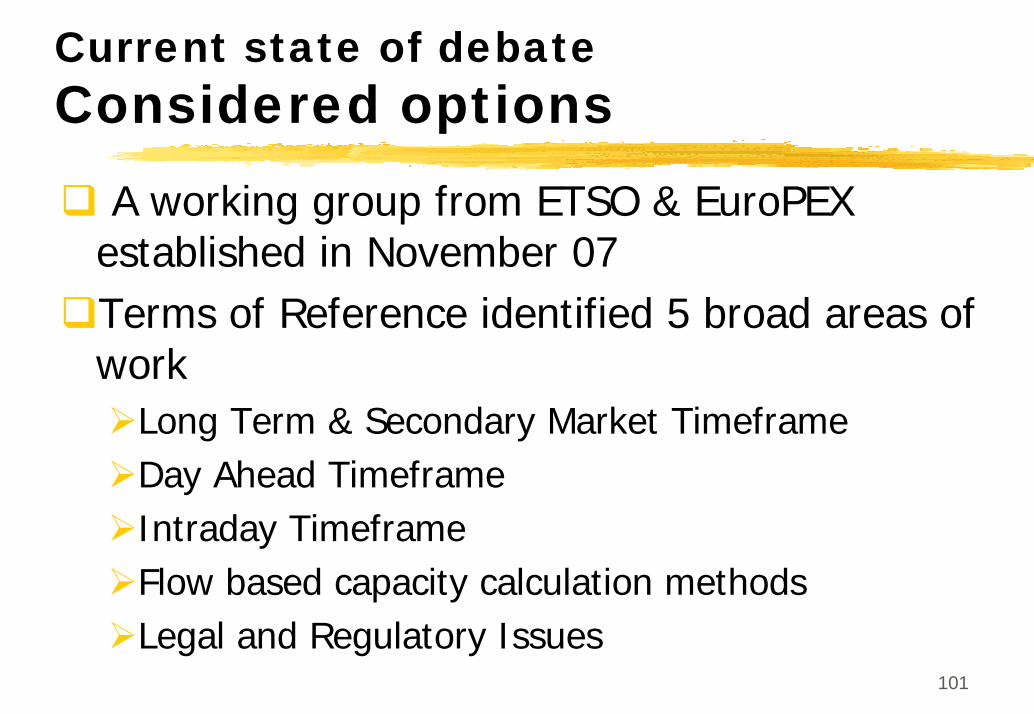
Current state of debateConsidered options
A working group from ETSO & EuroPEXestablished in November 07Terms of Reference identified 5 broad areas of work
Long Term & Secondary Market TimeframeDay Ahead TimeframeIntraday TimeframeFlow based capacity calculation methodsLegal and Regulatory Issues
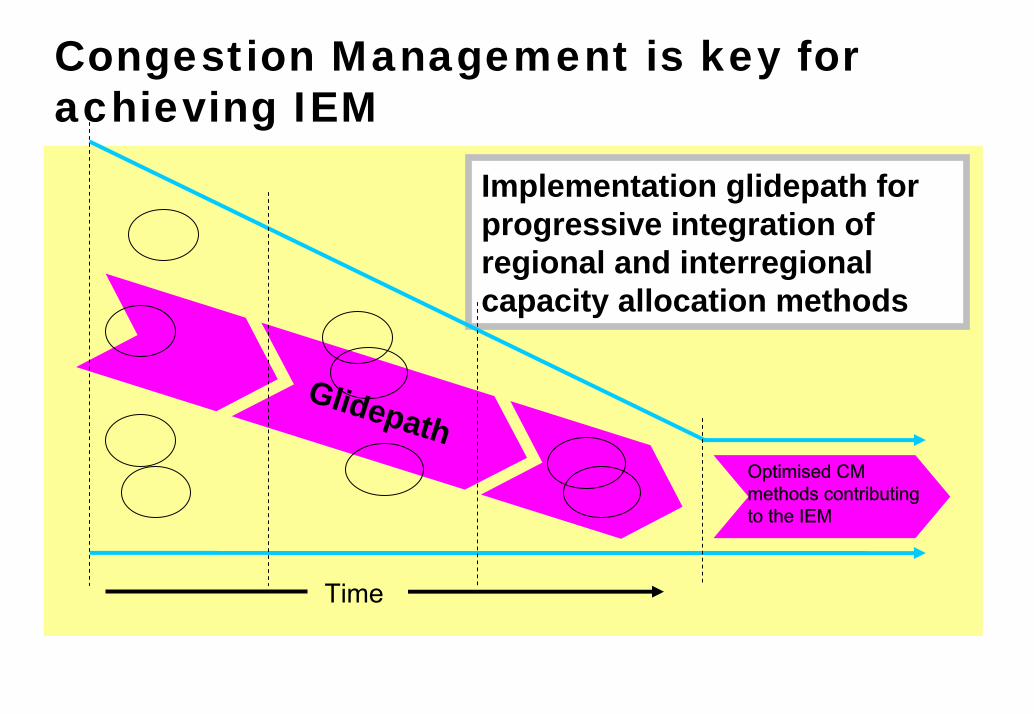
Glidepath
Congestion Management is key for achieving IEM
Implementation glidepath for progressive integration of regional and interregional capacity allocation methods
Time
Optimised CMmethods contributingto the IEM
103
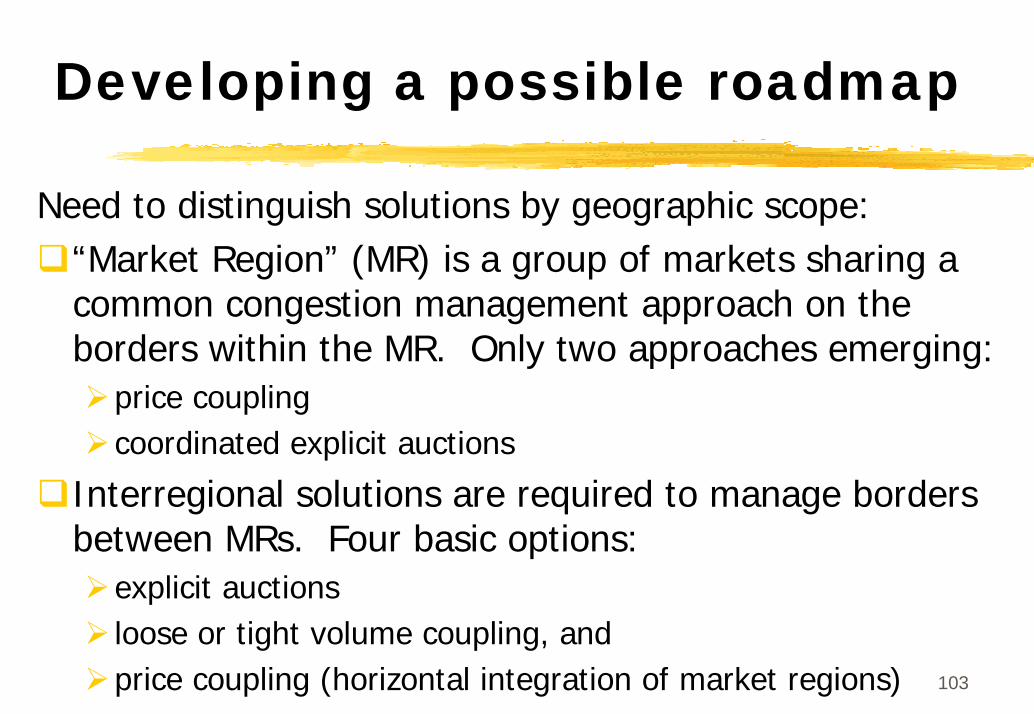
Developing a possible roadmap
Need to distinguish solutions by geographic scope:“Market Region” (MR) is a group of markets sharing a common congestion management approach on the borders within the MR. Only two approaches emerging:
price couplingcoordinated explicit auctions
Interregional solutions are required to manage borders between MRs. Four basic options:
explicit auctionsloose or tight volume coupling, and price coupling (horizontal integration of market regions)
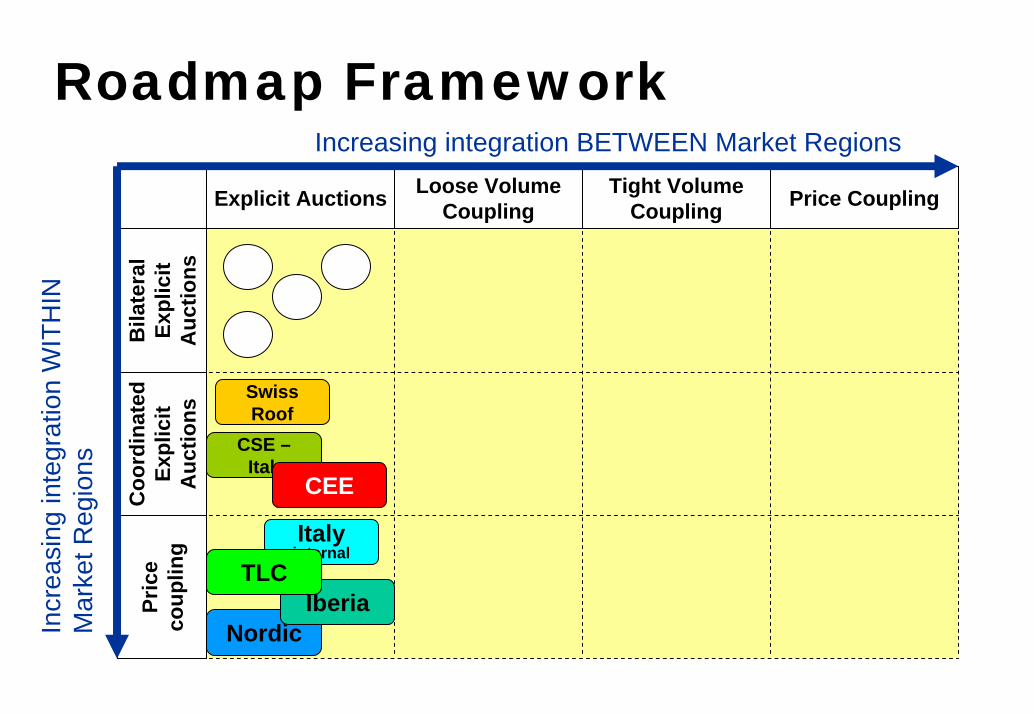
Roadmap FrameworkIncreasing integration BETWEEN Market Regions
Pric
eco
uplin
gExplicit Auctions
Coo
rdin
ated
Ex
plic
it A
uctio
ns
Bila
tera
l Ex
plic
it A
uctio
nsLoose Volume
CouplingTight Volume
Coupling Price Coupling
NordicIberia
Italyinternal
TLC
Swiss Roof
CSE –Italy
CEE
Incr
easi
ng in
tegr
atio
n W
ITH
IN
Mar
ket R
egio
ns
Adequacy ofnetwork
infrastructures
106
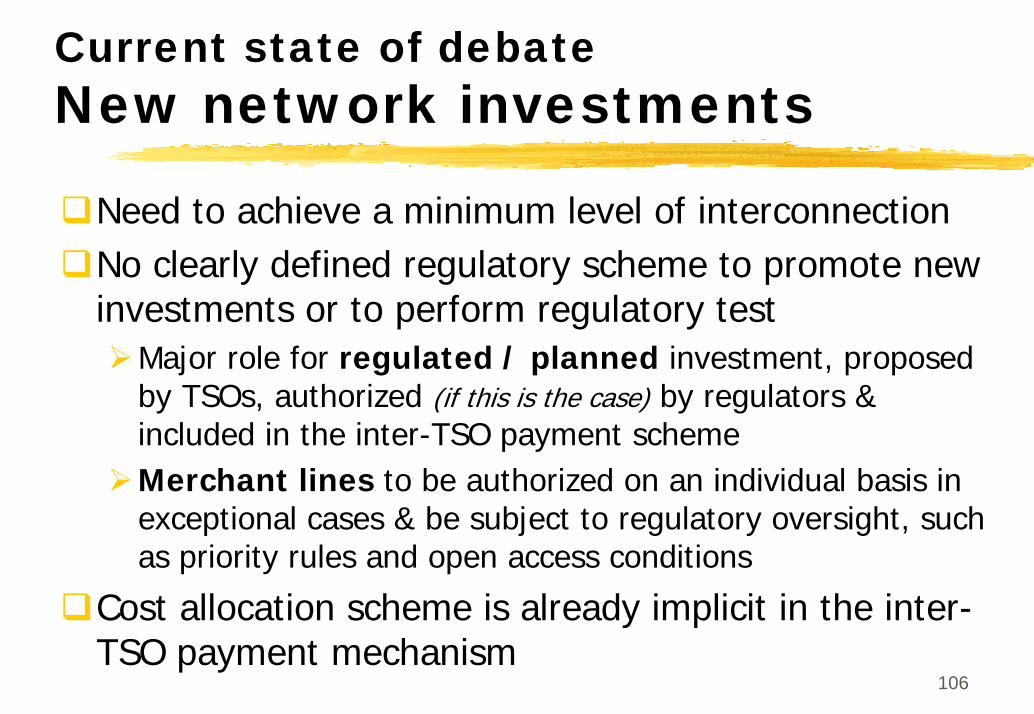
Current state of debateNew network investments
Need to achieve a minimum level of interconnectionNo clearly defined regulatory scheme to promote newinvestments or to perform regulatory test
Major role for regulated / planned investment, proposedby TSOs, authorized (if this is the case) by regulators & included in the inter-TSO payment schemeMerchant lines to be authorized on an individual basis in exceptional cases & be subject to regulatory oversight, suchas priority rules and open access conditions
Cost allocation scheme is already implicit in the inter-TSO payment mechanism

THANK YOUFOR YOURATTENTION

108
Annex 1DETAIL ON THE METHOD OF AVERAGE PARTICIPATIONS
(AP)
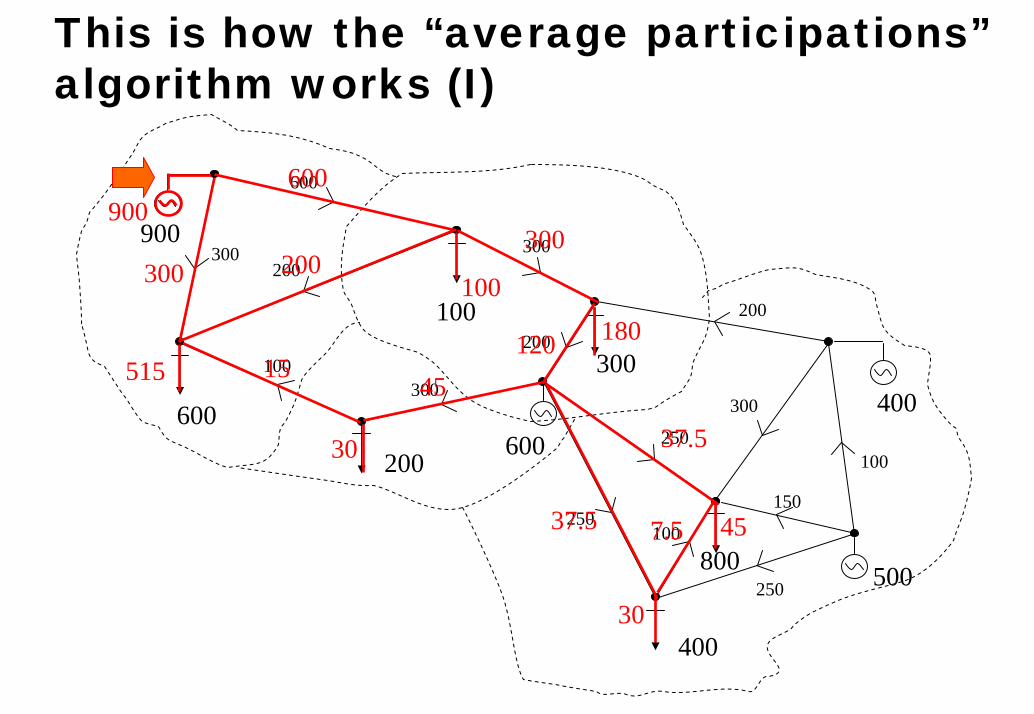
This is how the “average participations”algorithm works (I)
900
600
100
200600
300
400
500
400
800
250100
250
100
150
300
200
200
300200
100300
600
300
250
900
45
600
300 100
300200
180120
37.5
37.5
45
30
15
30
7.5
515
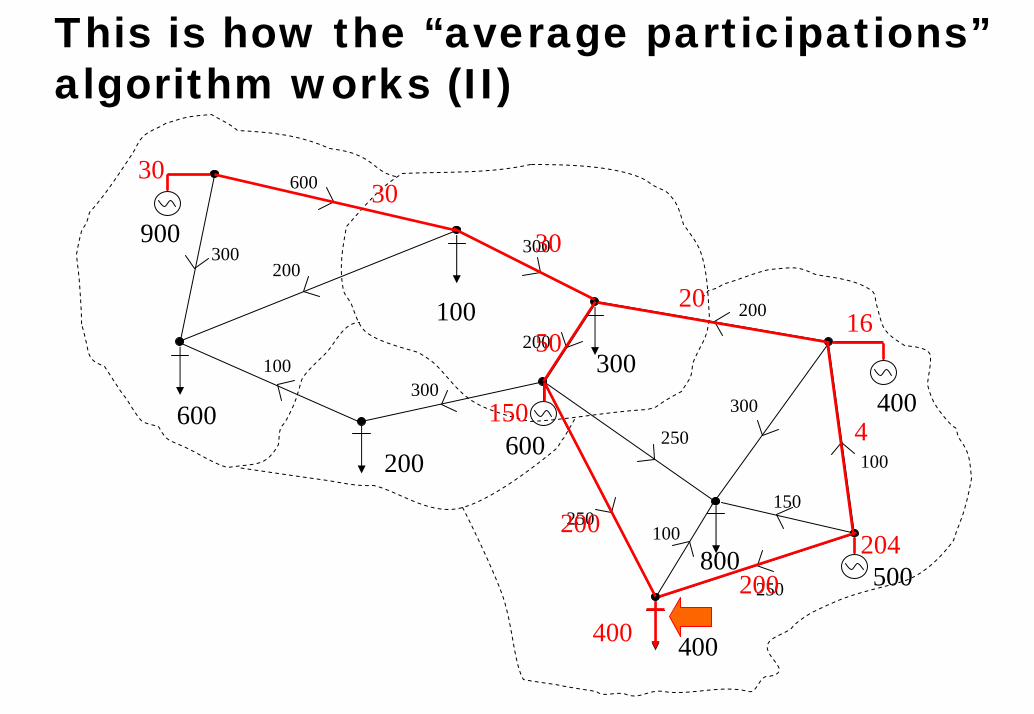
This is how the “average participations”algorithm works (II)
900
600
100
200600
300
400
500
400
800
250100
250
100
150
300
200
200
300200
100300
600
300
250
400
200
200
50
150
20
30
16
4
3030
204
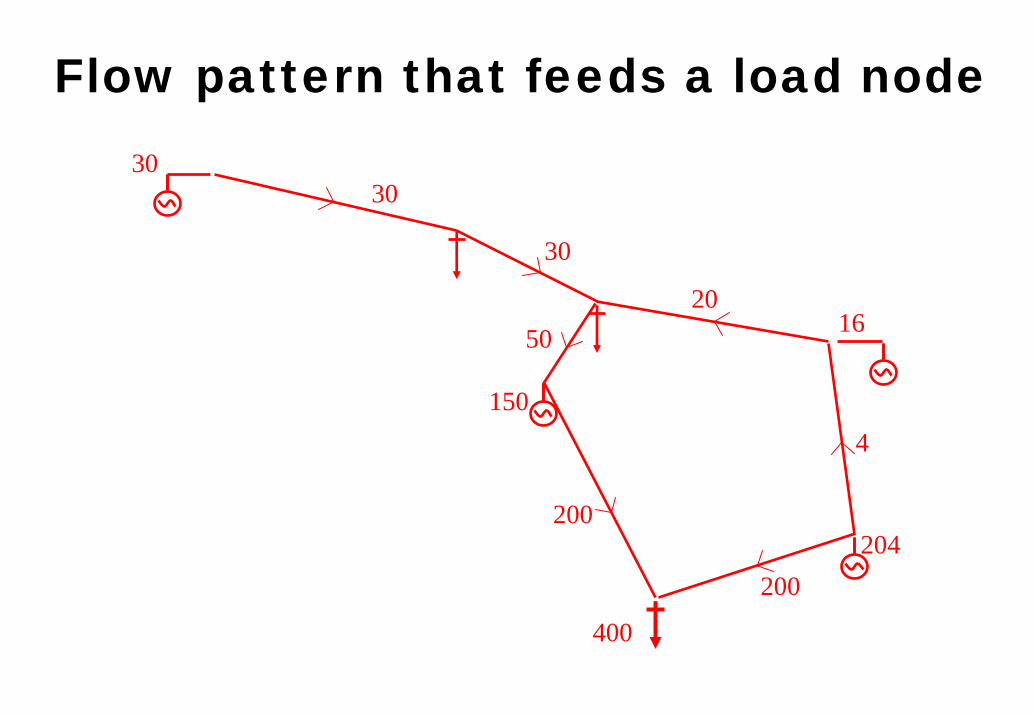
Flow pattern that feeds a load node
400
200
200
50
150
20
30
16
4
3030
204
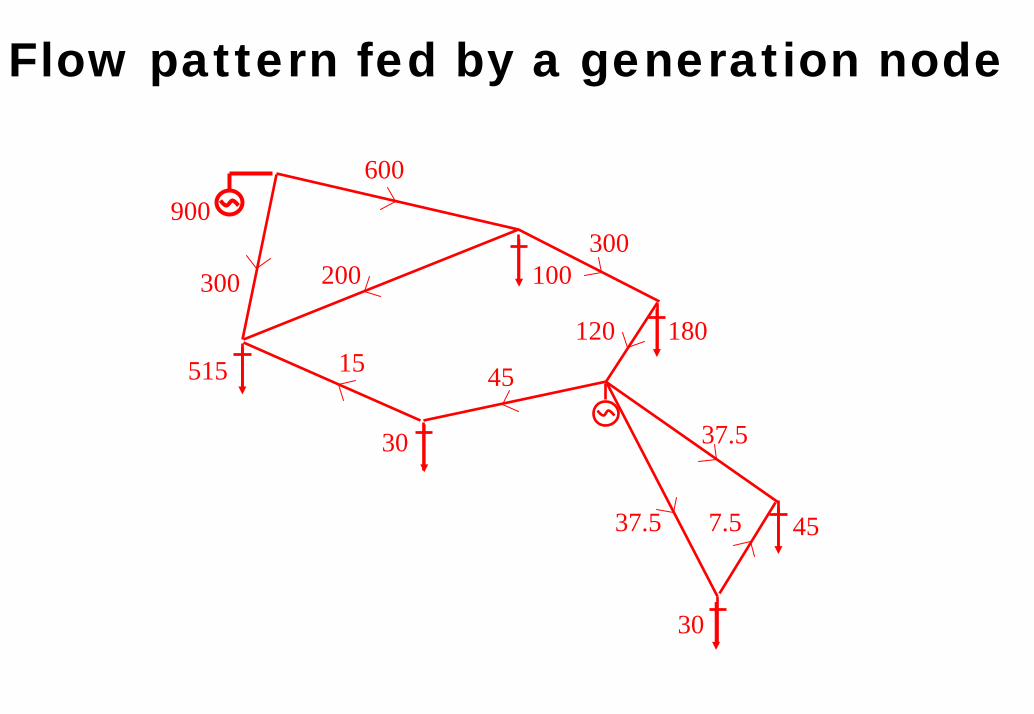
Flow pattern fed by a generation node
900
100
30
180
30
45
600
300300
200
120
37.5
37.5
4515
7.5
515
ANNEX 2Some quantitative
comparisons on a simple case example
114
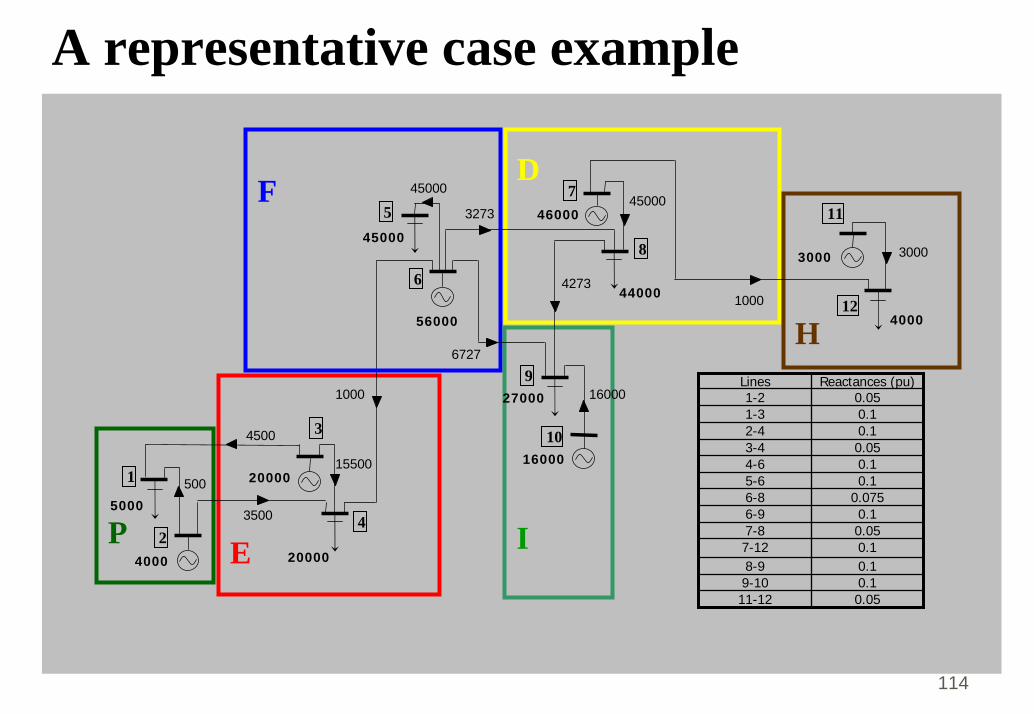
A representative case example
P E
F
I
D
H
4000
5000
20000
20000
56000
45000
27000
16000
44000
46000
4000
3000 3000
1000
45000
4273
6727
3273
1000
45000
16000
500
3500
4500
155001
24
3
5
6
8
7
9
10
11
12
Lines Reactances (pu)1-2 0.051-3 0.12-4 0.13-4 0.054-6 0.15-6 0.16-8 0.0756-9 0.17-8 0.057-12 0.18-9 0.19-10 0.111-12 0.05
115
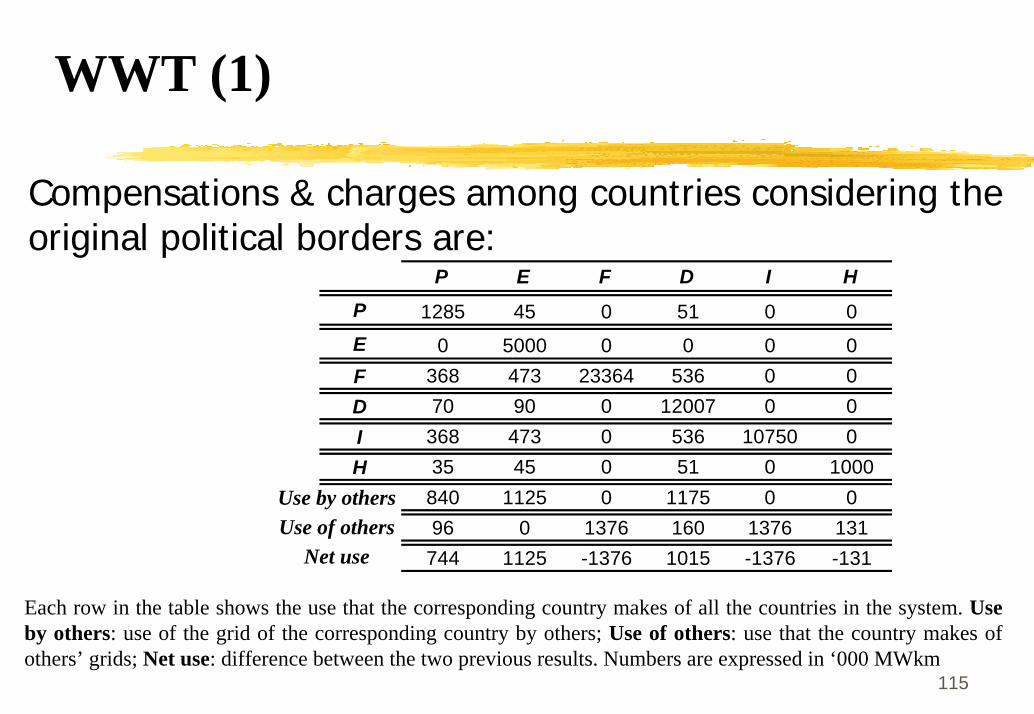
WWT (1)
Compensations & charges among countries considering the original political borders are:
P E F D I HP 1285 45 0 51 0 0E 0 5000 0 0 0 0F 368 473 23364 536 0 0D 70 90 0 12007 0 0I 368 473 0 536 10750 0H 35 45 0 51 0 1000
840 1125 0 1175 0 096 0 1376 160 1376 131
744 1125 -1376 1015 -1376 -131
Use by othersUse of others
Net use
Each row in the table shows the use that the corresponding country makes of all the countries in the system. Use by others: use of the grid of the corresponding country by others; Use of others: use that the country makes of others’ grids; Net use: difference between the two previous results. Numbers are expressed in ‘000 MWkm
116
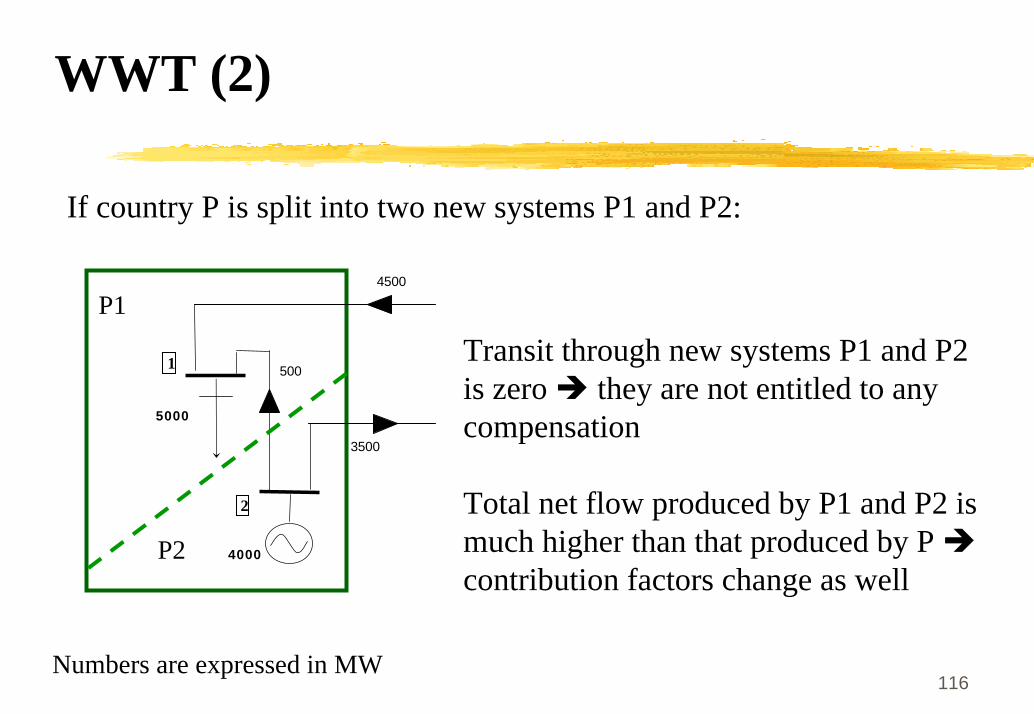
WWT (2)
4000
5000
5001
2
4500
Transit through new systems P1 and P2is zero they are not entitled to any compensation
Total net flow produced by P1 and P2 is much higher than that produced by P contribution factors change as well
3500
P1
P2
If country P is split into two new systems P1 and P2:
Numbers are expressed in MW
117
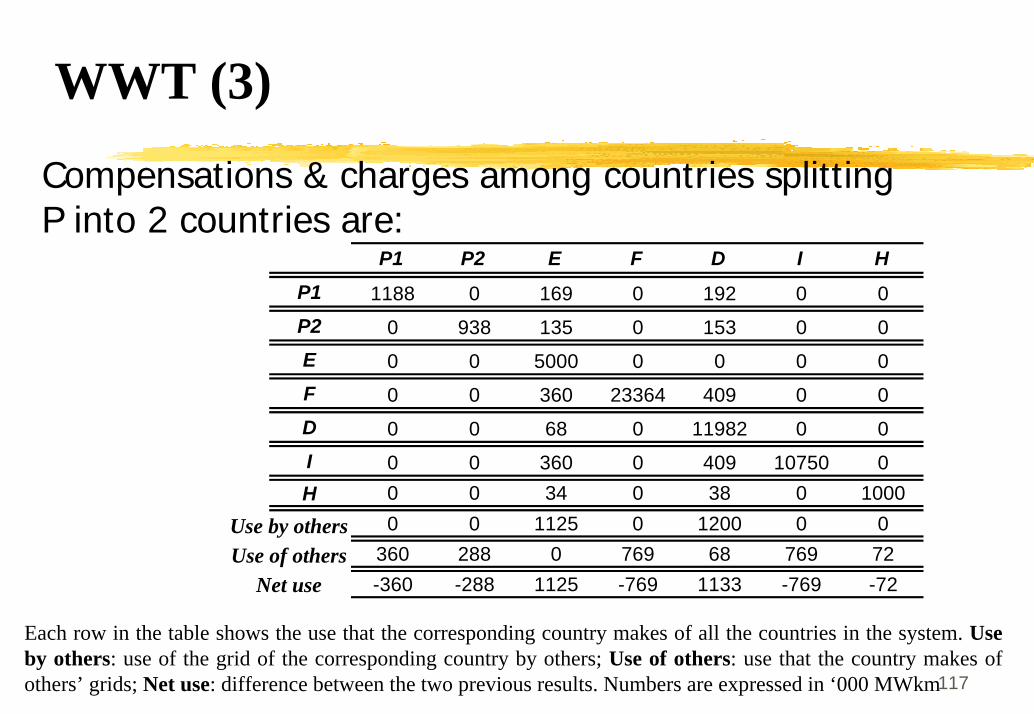
WWT (3)
Compensations & charges among countries splitting P into 2 countries are:
P1 P2 E F D I HP1 1188 0 169 0 192 0 0P2 0 938 135 0 153 0 0E 0 0 5000 0 0 0 0F 0 0 360 23364 409 0 0D 0 0 68 0 11982 0 0I 0 0 360 0 409 10750 0H 0 0 34 0 38 0 1000
0 0 1125 0 1200 0 0360 288 0 769 68 769 72-360 -288 1125 -769 1133 -769 -72
Use by othersUse of others
Net use
Each row in the table shows the use that the corresponding country makes of all the countries in the system. Use by others: use of the grid of the corresponding country by others; Use of others: use that the country makes of others’ grids; Net use: difference between the two previous results. Numbers are expressed in ‘000 MWkm
118
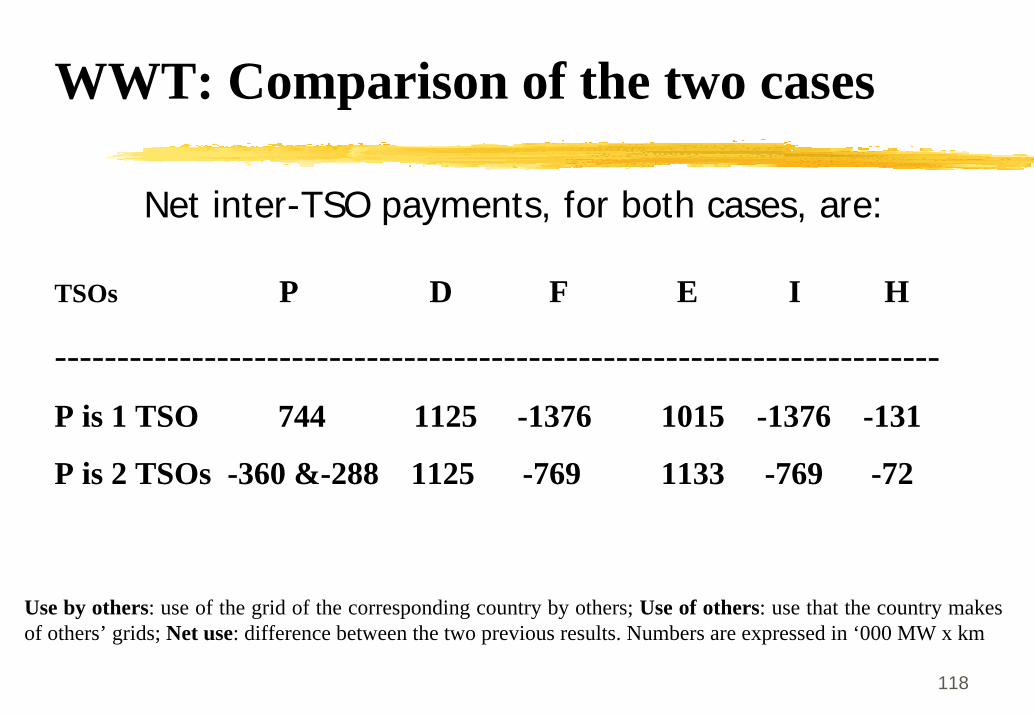
WWT: Comparison of the two cases
Net inter-TSO payments, for both cases, are:
TSOs P D F E I H
-----------------------------------------------------------------------P is 1 TSO 744 1125 -1376 1015 -1376 -131
P is 2 TSOs -360 &-288 1125 -769 1133 -769 -72
Use by others: use of the grid of the corresponding country by others; Use of others: use that the country makes of others’ grids; Net use: difference between the two previous results. Numbers are expressed in ‘000 MW x km
119
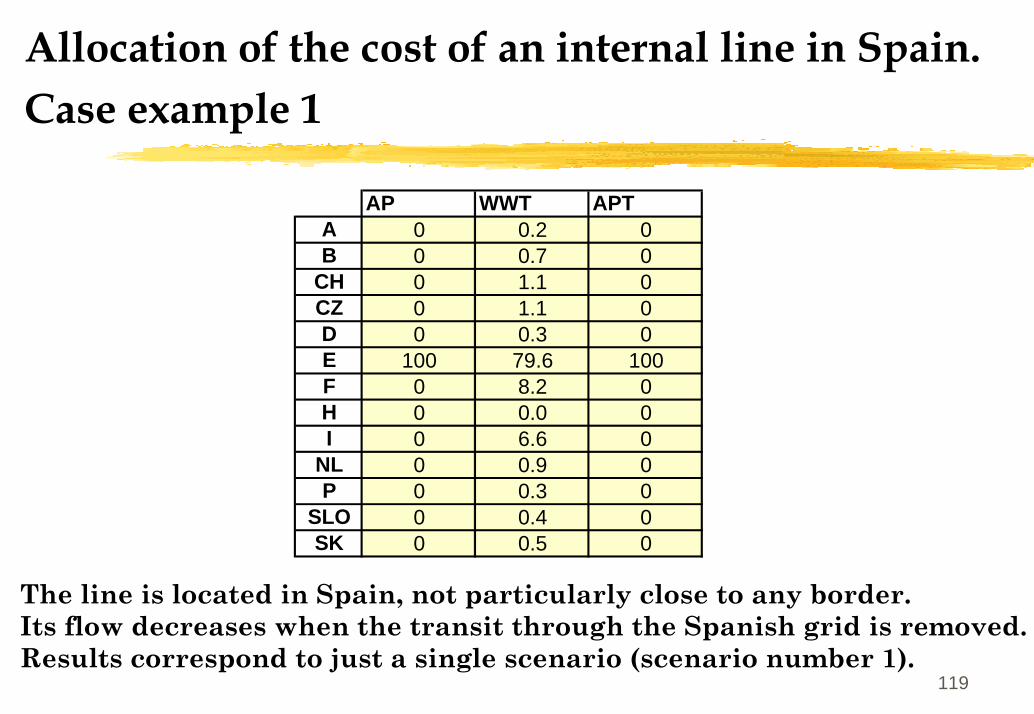
Allocation of the cost of an internal line in Spain. Case example 1
AP WWT APTA 0 0.2 0B 0 0.7 0
CH 0 1.1 0CZ 0 1.1 0D 0 0.3 0E 100 79.6 100F 0 8.2 0H 0 0.0 0I 0 6.6 0
NL 0 0.9 0P 0 0.3 0
SLO 0 0.4 0SK 0 0.5 0
The line is located in Spain, not particularly close to any border. Its flow decreases when the transit through the Spanish grid is removed.Results correspond to just a single scenario (scenario number 1).
120
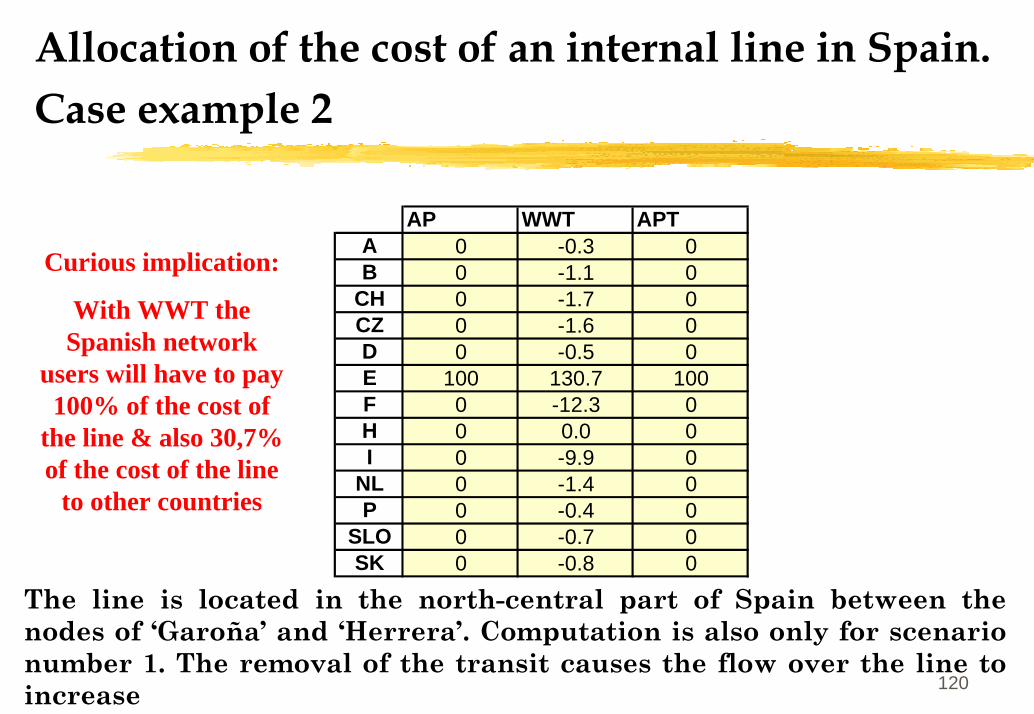
Allocation of the cost of an internal line in Spain. Case example 2
AP WWT APTA 0 -0.3 0B 0 -1.1 0
CH 0 -1.7 0CZ 0 -1.6 0D 0 -0.5 0E 100 130.7 100F 0 -12.3 0H 0 0.0 0I 0 -9.9 0
NL 0 -1.4 0P 0 -0.4 0
SLO 0 -0.7 0SK 0 -0.8 0
Curious implication:
With WWT the Spanish network
users will have to pay 100% of the cost of
the line & also 30,7% of the cost of the line
to other countries
The line is located in the north-central part of Spain between the nodes of ‘Garoña’ and ‘Herrera’. Computation is also only for scenario number 1. The removal of the transit causes the flow over the line to increase
121
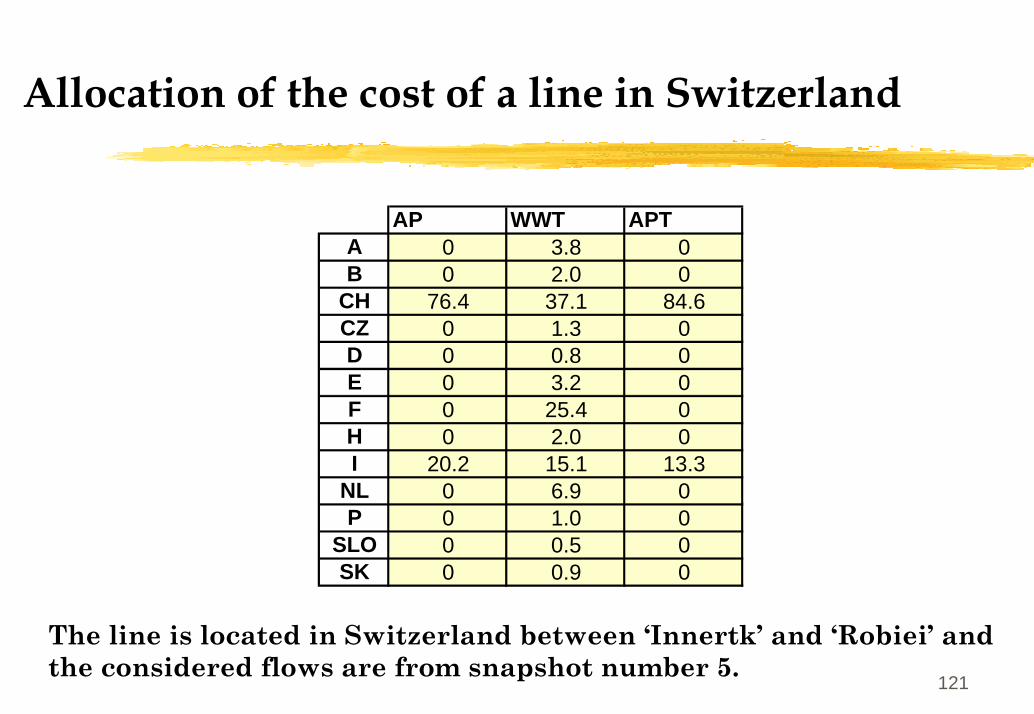
Allocation of the cost of a line in Switzerland
AP WWT APTA 0 3.8 0B 0 2.0 0
CH 76.4 37.1 84.6CZ 0 1.3 0D 0 0.8 0E 0 3.2 0F 0 25.4 0H 0 2.0 0I 20.2 15.1 13.3
NL 0 6.9 0P 0 1.0 0
SLO 0 0.5 0SK 0 0.9 0
The line is located in Switzerland between ‘Innertk’ and ‘Robiei’ and the considered flows are from snapshot number 5.
122
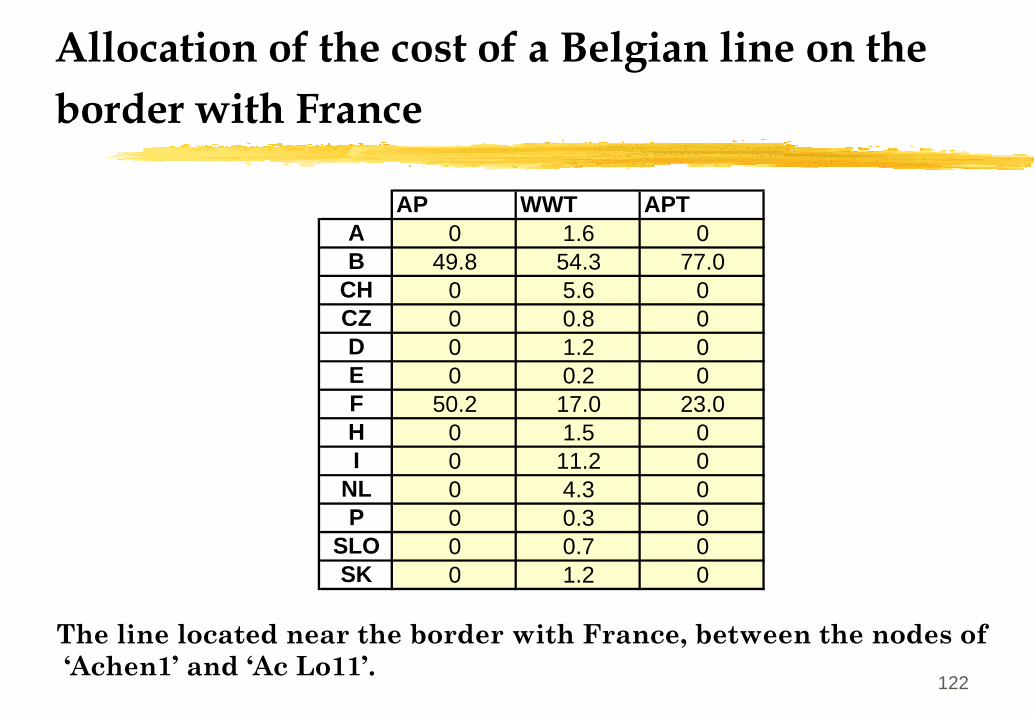
Allocation of the cost of a Belgian line on the border with France
AP WWT APTA 0 1.6 0B 49.8 54.3 77.0
CH 0 5.6 0CZ 0 0.8 0D 0 1.2 0E 0 0.2 0F 50.2 17.0 23.0H 0 1.5 0I 0 11.2 0
NL 0 4.3 0P 0 0.3 0
SLO 0 0.7 0SK 0 1.2 0
The line located near the border with France, between the nodes of‘Achen1’ and ‘Ac Lo11’.
123
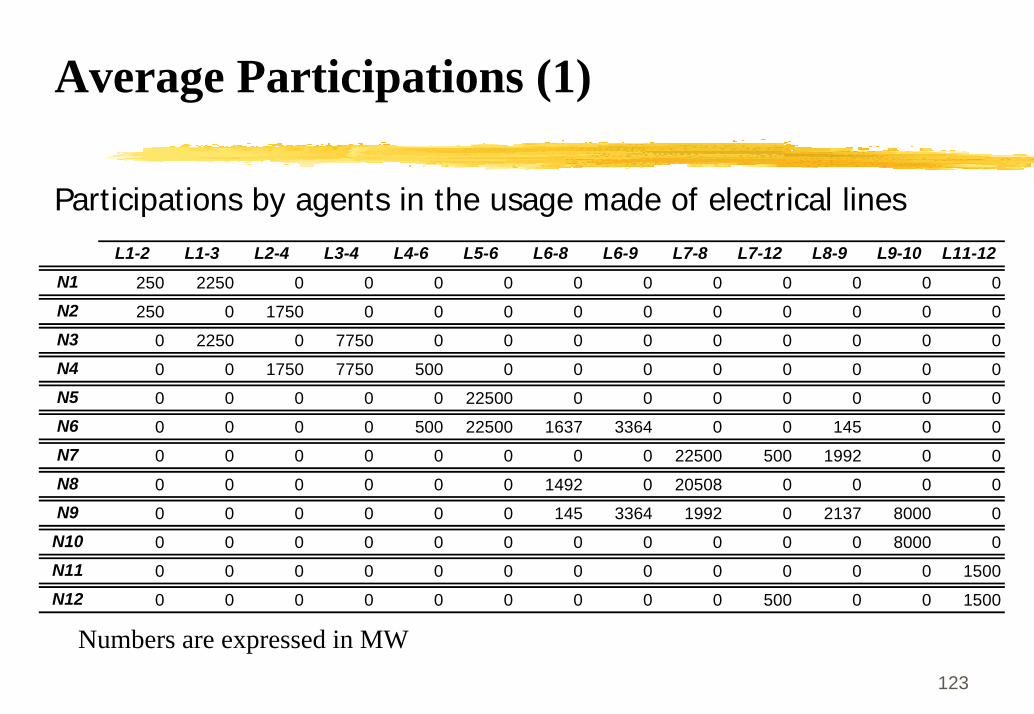
Average Participations (1)
Participations by agents in the usage made of electrical lines
Numbers are expressed in MW
L1-2 L1-3 L2-4 L3-4 L4-6 L5-6 L6-8 L6-9 L7-8 L7-12 L8-9 L9-10 L11-12N1 250 2250 0 0 0 0 0 0 0 0 0 0 0N2 250 0 1750 0 0 0 0 0 0 0 0 0 0N3 0 2250 0 7750 0 0 0 0 0 0 0 0 0N4 0 0 1750 7750 500 0 0 0 0 0 0 0 0N5 0 0 0 0 0 22500 0 0 0 0 0 0 0N6 0 0 0 0 500 22500 1637 3364 0 0 145 0 0N7 0 0 0 0 0 0 0 0 22500 500 1992 0 0N8 0 0 0 0 0 0 1492 0 20508 0 0 0 0N9 0 0 0 0 0 0 145 3364 1992 0 2137 8000 0
N10 0 0 0 0 0 0 0 0 0 0 0 8000 0N11 0 0 0 0 0 0 0 0 0 0 0 0 1500N12 0 0 0 0 0 0 0 0 0 500 0 0 1500
124
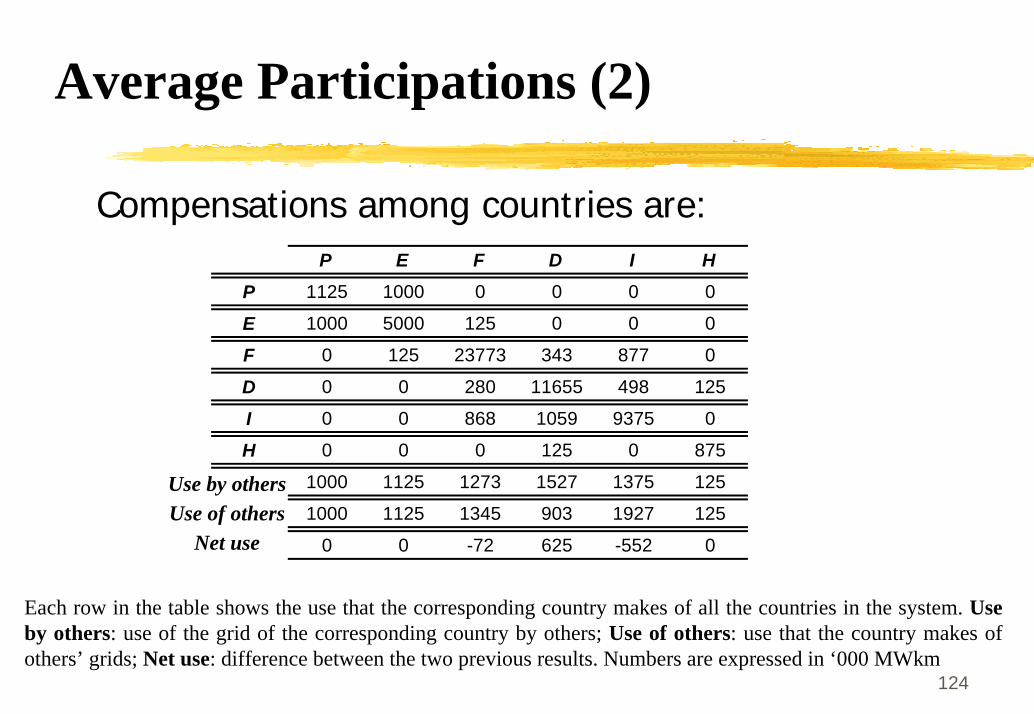
Average Participations (2)
Compensations among countries are:P E F D I H
P 1125 1000 0 0 0 0
E 1000 5000 125 0 0 0
F 0 125 23773 343 877 0
D 0 0 280 11655 498 125
I 0 0 868 1059 9375 0
H 0 0 0 125 0 875
1000 1125 1273 1527 1375 125
1000 1125 1345 903 1927 125
0 0 -72 625 -552 0
Use by othersUse of others
Net use
Each row in the table shows the use that the corresponding country makes of all the countries in the system. Use by others: use of the grid of the corresponding country by others; Use of others: use that the country makes of others’ grids; Net use: difference between the two previous results. Numbers are expressed in ‘000 MWkm
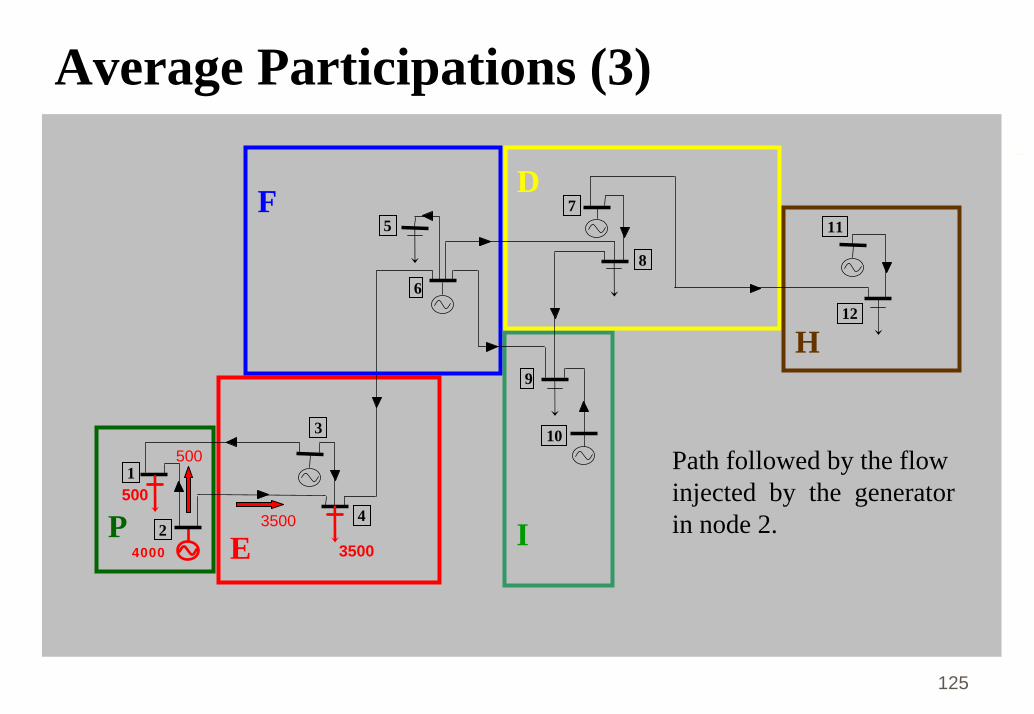
125
Average Participations (3)
PE
F
I
D
H
4000
1
2 4
3
5
6
8
7
9
10
11
12
Path followed by the flow injected by the generator in node 2.
500
3500
3500
500