Embed Size (px)
Citation preview

Spring 2009 Technical WorkshopU.S. DOE 2009 Congestion Study
Bradley M Nickell, PERenewable Integration and Planning Director
Transmission Expansion Planning Policy Committee
2008 Study Results

Today’s Discussion
● TEPPC Study Scenarios● 2008 Study Results● 2009 Study Requests●Related WECC Activities

2017 Renewable Energy Scenarios
● 15% Renewables Case – PC4A● 15% Renewables plus 20% Energy
Efficiency – PC4B● 15% Renewables plus 20% Energy
Efficiency plus a $20 per ton CO2 adder –PC4C-3
3

2017 - Base Case
● Loads – Member supplied 2017 Forecast● Transmission System – WECC base case 2016-2017● Generation –
All existing, plus LRS Category 1 and Category 2 generation. Sufficient RPS resources were added to meet minimum RPS requirements for 2017, which equates to a contribution by renewables of ~8.6% of total WECC energy. High cost local resources were used to fill the remaining load-generation gap.
4

2017 – 15% Renewables
● Loads/Transmission – no change● Generation – A mix of renewable resources were added in
order to increase the energy production from renewables from 8.6% to 15% of total WECC energy
WIRAB provided specifications regarding the type and amount of renewable generation required by state.WECC used a variety of resources, including meso-scale wind and solar data compiled by NREL, to place renewable generation at specific bus locations.The meso-scale data was also used to create the wind and solar profiles used in the study. Final fuel-type split of renewables(by energy):− 45% wind, 16% solar, 32% geothermal, 7% biomass
5

6
0
5000
10000
15000
20000
0 GWh
0
5000
10000
15000
20000
0 GWh
0
5000
10000
15000
20000
0 GWh
0
5000
10000
15000
20000
0 GWh
0
5000
10000
15000
20000
0 GWh
0
5000
10000
15000
20000
0 GWh
0
5000
10000
15000
20000
0 GWh
0
5000
10000
15000
20000
0 GWh
Location of Renewable Resources by Region
RegionTotal Renewables
(GWh)Percentage of Total WECC Renewables
Mexico 2,284 1%Canada 7,965 5%Rockies 16,750 11%Desert Southwest 22,142 14%California South 24,384 15%Northwest 24,672 16%Basin 24,850 16%California North 35,680 22%
Biomass RPS
Geothermal
Small Hydro RPS
Solar
Wind
Legend

Key Results -15% Renewables
Compared to the base case ●CO2 emissions decreased 4.7%●Natural gas generation decreased 18%
relative to the base caseStates with the largest percentage drop in gas production: CO(41%), MT(78%), NM(35%) and UT(22%)
●Other generation relatively unchanged
7

‐15000
‐10000
‐5000
0
5000
10000
15000
0 GWh
‐15000
‐10000
‐5000
0
5000
10000
15000
0 GWh
‐15000
‐10000
‐5000
0
5000
10000
15000
0 GWh
‐15000
‐10000
‐5000
0
5000
10000
15000
0 GWh
‐15000
‐10000
‐5000
0
5000
10000
15000
0 GWh
‐15000
‐10000
‐5000
0
5000
10000
15000
0 GWh
‐15000
‐10000
‐5000
0
5000
10000
15000
0 GWh
‐15000
‐10000
‐5000
0
5000
10000
15000
0 GWh
8
Change in Energy Production from PC-4 Base Case to PC-4ARenewable Coal Gas Oil & Other
Renewable Coal Gas Oil & Other
Net Change in GWh by Fuel Type (WECC‐Wide)
65,443 ‐2,794 ‐61,487 ‐1,074
Percentage Change 70% ‐1% ‐18% ‐1%
Note: Native load was the same in both cases
RegionNet Change in Energy Production (GWh)
California South ‐11,002Rockies ‐2,386Desert Southwest ‐1,927Northwest ‐1,654Mexico ‐395Canada 582California North 4,422Basin 12,448

9
WECC Daily Wind & Solar Enrgy w/TrendlinesPC4A WIRAB (15% Renewables)
0
50
100
150
200
250
300
350
400
450
1/1/
2017
1/15
/201
7
1/29
/201
7
2/12
/201
7
2/26
/201
7
3/12
/201
7
3/26
/201
7
4/9/
2017
4/23
/201
7
5/7/
2017
5/21
/201
7
6/4/
2017
6/18
/201
7
7/2/
2017
7/16
/201
7
7/30
/201
7
8/13
/201
7
8/27
/201
7
9/10
/201
7
9/24
/201
7
10/8
/201
7
10/2
2/20
17
11/5
/201
7
11/1
9/20
17
12/3
/201
7
12/1
7/20
17
12/3
1/20
17
GWh
Solar
Wind
Poly. (Solar)
Poly. (Wind)

2017 – 15% Renewables plus 20% Energy Efficiency
10
● 2017 loads (both the energy and peak demands) were reduced consistent with the WGA/CDEAC Goal of 20% Energy Efficiency in 2020
● Generation and transmission remained the same as the 15% renewables case
Adjustment Factors to Loads for Energy Efficiency
CDEAC Transmission Task Force
Proposed for TEPPC Loads Category
AZ 18.50% 19.00% HighCA 7.00% 12.00% LowCO 16.40% 17.00% MediumID 5.80% 12.00% LowMT 5.00% 12.00% LowNV 19.10% 19.00% HighNM 14.90% 17.00% MediumOR 5.00% 12.00% LowUT 16.60% 17.00% MediumWA 5.00% 12.00% LowWY 13.70% 17.00% MediumAB 0.00% 12.00% Non-WGABC 0.00% 12.00% Non-WGA
MEX 0.00% 12.00% Non-WGA

Key Results – 15% Renewables plus 20% Energy Efficiency Compared to the 15% Renewables Case●CO2 emissions decreased 16.5%●Coal generation decreased 5% ●Natural gas generation decreased 44%● Transmission congestion increased
particularly on paths that move energy from the interior toward the more heavily populated coastal areas
11

‐40000
‐30000
‐20000
‐10000
00 GWh
‐40000
‐30000
‐20000
‐10000
00 GWh
‐40000
‐30000
‐20000
‐10000
00 GWh
‐40000
‐30000
‐20000
‐10000
00 GWh
‐40000
‐30000
‐20000
‐10000
00 GWh
‐40000
‐30000
‐20000
‐10000
00 GWh
‐40000
‐30000
‐20000
‐10000
00 GWh
‐40000
‐30000
‐20000
‐10000
00 GWh
12
Change in Energy Production from PC-4A to PC-4BRenewable Coal Gas Oil & Other
RegionNet Change in Energy Production (GWh)
Desert Southwest ‐41,051Northwest ‐23,988California North ‐22,401California South ‐22,212Rockies ‐11,971Canada ‐11,904Basin ‐7,587Mexico ‐2,495
Renewable Coal Gas Oil & Other
Net Change in GWh by Fuel Type (WECC‐Wide)
‐1,845 ‐13,780 ‐126,219 ‐1,764
Percentage Change ‐1% ‐5% ‐45% ‐2%

2017 – 15% Renewables + 20% EE + plus a $20/ton-CO2●No change to loads, generation, or
transmission● The CO2 adder is a simulation surrogate
for either a carbon tax or a emission cap-and-trade scheme
●A $60 and $40/ton-CO2 adder were tested in addition to the $20/ton adder
Observed extreme shifts in the resource dispatch orderResults not realistic 13

Key Results - 15% Renewables + 20% EE + plus a $20/ton-CO2Compared to the 15% Renewables Case + 20%
Energy Efficiency● CO2 emissions dropped 3.1%● Gas Generation increased by 7.7%● Coal Generation dropped by 4.5%●Resulted in a 50% increase in production
costs
14

‐3000
‐2000
‐1000
0
1000
2000
3000
0 GWh
‐3000
‐2000
‐1000
0
1000
2000
3000
0 GWh
‐3000
‐2000
‐1000
0
1000
2000
3000
0 GWh
‐3000
‐2000
‐1000
0
1000
2000
3000
0 GWh
‐3000
‐2000
‐1000
0
1000
2000
3000
0 GWh
‐3000
‐2000
‐1000
0
1000
2000
3000
0 GWh‐3000
‐2000
‐1000
0
1000
2000
3000
0 GWh
‐3000
‐2000
‐1000
0
1000
2000
3000
0 GWh
15
Change in Energy Production from PC-4B to PC-4C-3Renewable Coal Gas Oil & Other
RegionNet Change in Energy Production (GWh)
Rockies ‐1,735California South ‐1,261Desert Southwest ‐1,152Canada ‐16Mexico 89California North 805Northwest 883Basin 1,210
Renewable Coal Gas Oil & Other
Net Change in GWh by Fuel Type (WECC‐Wide)
170 ‐12,249 12,095 ‐1,193
Percentage Change 0% ‐4% 8% ‐1%

Key Results - 15% Renewables + 20% EE + plus a $20/ton-CO2Compared to the 2017 Base Case(Cumulative Effects)●CO2 emissions dropped 22.9%●Coal generation dropped 10%●Natural gas generation dropped 51%
16
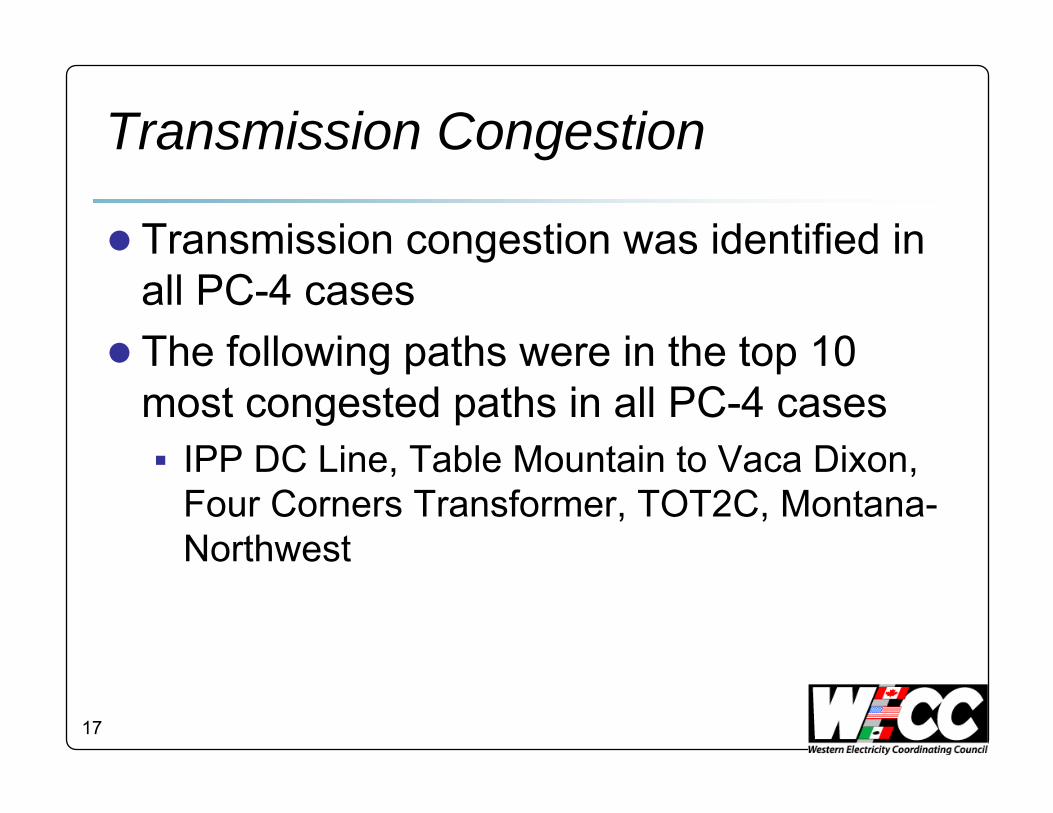
Transmission Congestion
● Transmission congestion was identified in all PC-4 cases
● The following paths were in the top 10 most congested paths in all PC-4 cases
IPP DC Line, Table Mountain to Vaca Dixon, Four Corners Transformer, TOT2C, Montana-Northwest
17

18
TOT 3
PATH C
TOT 2A
TOT 2B
TOT 2C
FOUR CORNERS 345/500 kV
EAST OF COLORADO RIVER (EOR)
WEST OF COLORADO RIVER (WOR)
MIDWAY ‐ LOS BANOS
NORTHWEST – CANADA
COI
PACIFIC DC INTERTIE (PDCI)
MONTANA – NORTHWEST
ALBERTA – BRITISH COLUMBIA
IDAHO – NORTHWEST
TOT 4A
## Path NamePath Name36
20
31
78&79
35
23
49
46
15
3
66
65
8
1
14
37
Flow on selected transmission paths, particularly those that connect regions, were compared between cases
Transmission Paths

19
0.00%
10.00%
20.00%
30.00%
40.00%
50.00%
60.00%
70.00%
% of H
ours Greater than 99
% of Rating
Path Loadings as a Percentage of 99% of RatingPC1A' PC4A PC4B PC4C‐3Base Case

20
DOE Reported Congestion2006 Study
● Projects underway that will address identified congestion
● Local congestion being addressed by affected entities
National Electric Transmission Congestion Study, August 2006, Page 31

21
Proposed Transmission Projects Proposed Transmission Projects in the Western Interconnectionin the Western Interconnection
Note: This plot includes selected projects from Note: This plot includes selected projects from Table 3.2 of 2008 TEPPC Study Plan(v7) Table 3.2 of 2008 TEPPC Study Plan(v7)
Projects have been grouped Projects have been grouped to simplify coding.to simplify coding.
Sea Breeze ProjectsTransCanada ProjectsGateway & Other NTTG ProjectsColumbia Grid ProjectsTransWest ExpressLS Power & Great Basin ProjectsWY-CO Intertie ProjectHigh Plains ExpressSun-ZIACanada/PacNW-NoCalifCentral CA Clean Energy (C3ET)Green Path NorthDevers-Palo Verde 2Navajo Transmission Project
Proposed Major TransmissionProjects in WECC
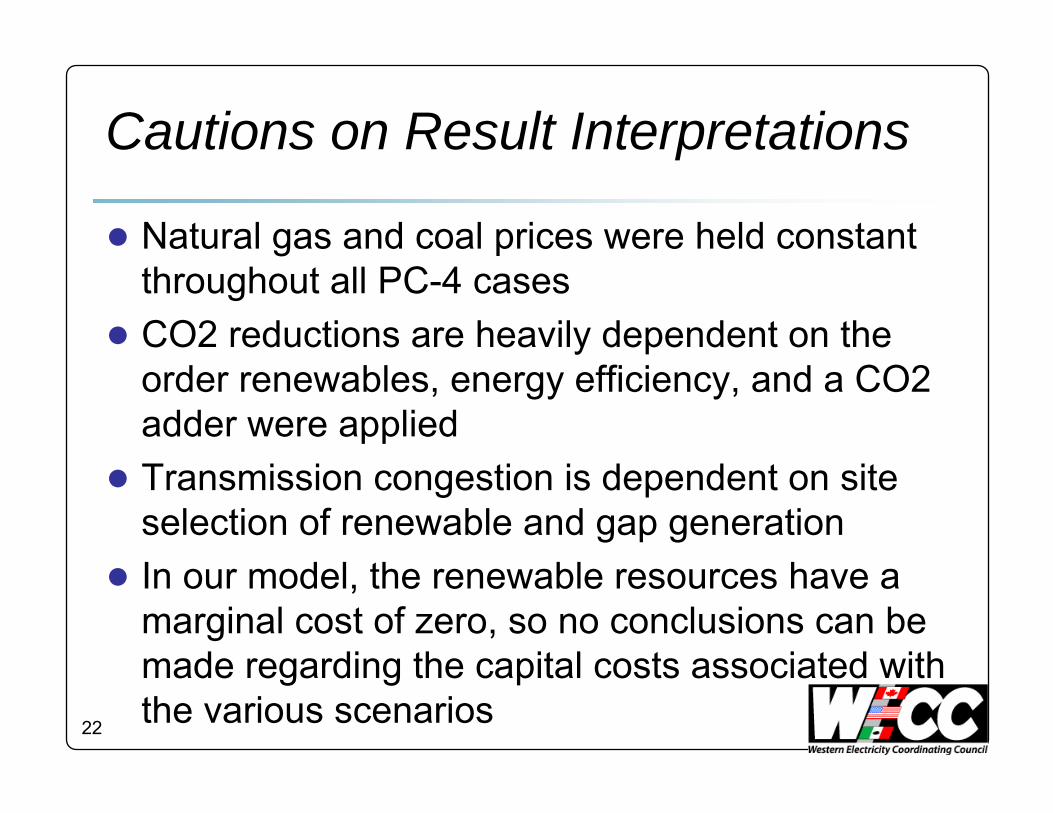
Cautions on Result Interpretations
● Natural gas and coal prices were held constant throughout all PC-4 cases
● CO2 reductions are heavily dependent on the order renewables, energy efficiency, and a CO2 adder were applied
● Transmission congestion is dependent on site selection of renewable and gap generation
● In our model, the renewable resources have a marginal cost of zero, so no conclusions can be made regarding the capital costs associated with the various scenarios22

TEPPC 2009 Study Plan
● TEPPC has received 23 study requests from 9 organizations
Common themes:− Impacts of existing and aggressive RPS and GHG
emission reduction policies− Impacts of large wind resource additions in various
parts of the west− Impacts of specific transmission projects
● TEPPC workgroups and subcommittee will work to combine the requests into a synchronized study plan for 2009
23

Link to Additional Information
● TEPPC 2008 Annual ReportFinal draft will be up for approval by the WECC Board of Directors on April 28Until then, you can find the draft report on the TEPPC webpage of the WECC website
●White papers noted in this presentation can also be found on the TEPPC webpage
www.wecc.biz
24

Related WECC Activities
●Planning Coordination Committee (PCC)Tracks proposed transmission projectsManages path rating process
● Load & Resources Subcommittee (LRS)Gathers and reports information on future load and resource expectations of members
●Variable Generation Subcommittee (VGS)Holistically addressing variable generation integration issues in the West
25

26
Questions
Bradley NickellRenewable Integration & Planning DirectorWestern Electricity Coordinating Council615 Arapeen Drive, Suite 210Salt Lake City, Utah [email protected]