Embed Size (px)
Citation preview

Transmission Category Analysis RIN, 2016-17
Basis of Preparation

CONTACT
This document is the responsibility of the Strategy and Stakeholder Relations Group within Tasmanian Networks Pty Ltd (ABN 24 167 357 299). Please contact the indicated owner of the document with any queries or suggestions.
RESPONSIBILITIES
Document Owner
Regulation Leader Tasmanian Networks Pty Ltd 1 – 7 Maria Street Lenah Valley TAS 7008 email: [email protected]
Document Management
Strategy and Stakeholder Relations Group
Basis of Preparation | Transmission Category Analysis RIN 2016-17 1
Introduction TasNetworks (Tasmanian Networks Pty Ltd, ABN 24 167 357 299) is the owner and operator of the electricity transmission network in Tasmania.
This document forms part of the response of TasNetworks to the Regulatory Information Notice (RIN) issued in March 2014 by the Australian Energy Regulator (AER), under Division 4 of Part 3 of the National Electricity (Tasmania) Law, for the purposes of collecting information for category analysis.
The information and explanatory material included in this RIN Response relate to TasNetworks’ activities as Tasmania’s licensed Transmission Network Service Provider (TNSP) during the 2016-17 Regulatory Year (referred to throughout this document as the current reporting period).
Note that throughout the document:
Telecommunications
Encompasses any telecommunications related asset.
Secondary Systems
Encompasses protection systems, SCADA and Network Control.
Substations Primary Systems
Encompasses power transformers, switchbays, transmission cables and reactive plant.
Transmission Lines
Encompasses towers, support structures and conductors.
2 TasNetworks
Table of Contents Introduction ..................................................................................................................................................... 1
Table of Contents............................................................................................................................................. 2
Template 2.1 Expenditure summary ........................................................................................................... 3
Table 2.1.1 Prescribed transmission services capital expenditure .......................................................... 3
Table 2.1.2 Prescribed transmission services operating expenditure ..................................................... 3
Template 2.2 Replacement expenditure .................................................................................................... 5
Table 2.2.1 Expenditure and replacement volumes by asset category ................................................... 5
Table 2.2.2 Selected assets characteristics.............................................................................................. 9
Template 2.3 Augmentation expenditure ................................................................................................. 11
Table 2.3.1 Augmentation expenditure asset data – substations ......................................................... 12
Table 2.3.2 Augmentation expenditure asset data – lines .................................................................... 12
Table 2.3.4 Augmentation expenditure data – total ............................................................................. 12
Template 2.5 Connections expenditure .................................................................................................... 14
Table 2.5.1 Expenditure on connection projects ................................................................................... 14
Table 2.5.2 Description of connection projects ..................................................................................... 14
Template 2.6 Non-network expenditure .................................................................................................. 16
Template 2.7 Vegetation management .................................................................................................... 19
Table 2.7.1 Descriptor metrics by zone ................................................................................................. 19
Table 2.7.2 Expenditure metrics by zone .............................................................................................. 21
Table 2.7.3 Descriptor metrics for unplanned vegetation events ......................................................... 22
Template 2.8 Maintenance ....................................................................................................................... 24
Table 2.8.1 Descriptor metrics for routine and non-routine maintenance ........................................... 24
Table 2.8.2 Cost metrics for routine and non-routine maintenance ..................................................... 26
Template 2.10 Overheads ........................................................................................................................... 27
Table 2.10.1 Network overheads expenditure ........................................................................................ 27
Table 2.10.2 Corporate overheads expenditure ...................................................................................... 28
Template 2.11 Labour ................................................................................................................................. 29
Table 2.11.1 Cost metrics per annum; and .............................................................................................. 29
Table 2.11.2 Extra descriptor metrics for current year ........................................................................... 29
Template 2.12 Input tables ......................................................................................................................... 31
Template 5.2 Asset age profile ................................................................................................................. 32
Table 5.2.1 Asset age profile ................................................................................................................. 32
Template 5.3 Maximum demand at network level ................................................................................... 36
Table 5.3.1 Raw and weather corrected coincident MD at network level ............................................ 36
Template 5.4 Maximum demand and utilisation at spatial level .............................................................. 38
Table 5.4.1 Non-coincident and coincident maximum demand ........................................................... 38

Basis of Preparation | Transmission Category Analysis RIN 2016-17 3
Template 2.1 Expenditure summary
Table 2.1.1 Prescribed transmission services capital expenditure
(a) Consistency of information with the requirements of the RIN
The information is calculated from worksheets within the RIN with a separate balancing items spreadsheet included per the requirements of the RIN.
(b) Source of information
Worksheets 2.2 – 2.5 of the RIN.
(c) Methodology applied to determine information, including assumptions made
Reconciliation of information provided in worksheets 2.2-2.5 of the RIN to the amounts reported in the Regulatory financial statements. Preparation of a list of balancing items to clarify differences in the RIN and the Regulatory financial statements.
(d) Use of estimates
No estimations have been required in the collation and presentation of this information. Information is based on actual information, historical accounting records or other records used in the ordinary course of business.
(e) Compliance with financial reporting framework
Non-compliance
There has been no non-compliance with the financial reporting framework.
Reason for non-compliance
Not applicable.
Changes in accounting policies
There have been no changes in accounting policies for the expenditure summary.
Table 2.1.2 Prescribed transmission services operating expenditure
(a) Consistency of information with the requirements of the RIN
The information is calculated from worksheets within the RIN per the requirements of the RIN.
(b) Source of information
Worksheets 2.5 - 2.8 of the RIN.
(c) Methodology applied to determine information, including assumptions made
Reconciliation of information provided in worksheets 2.5-2.8 of the RIN to the amounts reported in to the Regulatory financial statements. Preparation of a list of balancing items to clarify differences in the RIN and the Regulatory financial statements.
(d) Use of estimates
No estimations have been required in the collation and presentation of this information. Information is based on actual information, historical accounting records or other records used in the ordinary course of business.

4 TasNetworks
(e) Compliance with financial reporting framework
Non-compliance
There has been no non-compliance with the financial reporting framework.
Reason for non-compliance
Not applicable.
Changes in accounting policies
There have been no changes in accounting policies for the expenditure summary.

Basis of Preparation | Transmission Category Analysis RIN 2016-17 5
Template 2.2 Replacement expenditure
Table 2.2.1 Expenditure and replacement volumes by asset category
(a) Consistency of information with the requirements of the RIN
Information presented has been split in accordance with the categories in the Templates. The corresponding asset age profile has been provided as required.
(b) Source of information
Financial All financial information was sourced from the regulatory asset register; TasNetworks’ WASP asset data, and the Regulatory financial statements.
Technical
Telecommunications
Information has been sourced from the telecommunications operational drawings and telecommunications asset register.
Secondary Systems
Asset replacement and failure information has been sourced from the WASP asset register using business intelligence reporting, failures are based on reporting by “corrective” maintenance. The counts are per scheme where protection is a combination of Bus Coupler, Bus Zone, Capacitor Bank, HV Feeder, System Protection, Transformer and Transmission Circuit schemes. SCADA and Network Control are based on station level SCADA schemes only and do not include SCADA schemes installed at bay level.
Substations Primary Systems
Asset replacement information has been sourced from the WASP asset register using Business Intelligence reporting. Asset failure information has been extracted from WASP asset ‘defect’ register using Business Intelligence reporting and confirmed against failure reports.
Transmission Lines
Asset replacements were sourced from TasNetworks’ asset register. Asset failure information has been taken from the AMIS system. Methodology applied to determine information, including assumptions made.
(c) Methodology applied to determine information, including assumptions made
Financial An extract of all assets commissioned in the the current reporting period was taken from the regulatory asset register and attributed with Investment Category data based onidentifiers taken from TasNetworks’ internal Quarterly Report. The data view was restricted to only those assets which related to replacement capex (investment category being ‘asset renewal’). These assets were then further attributed with RIN Category data based on the WASP Asset ID and a lookup from WASP (eg. 110 kV SF6 circuit breaker equated to the RIN Category “> 66 kV & < ≈ 132 kV ; SF6 INSULATED CIRCUIT BREAKER”). Any assets which did not map were subjected to manual RIN Category classification. A pivot table was then applied to this dataset to generate the base repex data. Due to the regulatory asset register being on an ‘as commissioned’ basis, all data was pro-rated with actual spend data (as incurred) on a financial year basis. This provided the final expenditure data for historical spend.

6 TasNetworks
Technical
Telecommunications
Historical information has been sourced from the telecommunications operational drawings and telecommunications asset register. The number of asset failures for the current reporting period has been taken from the number of assets sent to the vendors for repair.
Secondary Systems
The asset register has an attribute to capture the date a protection or SCADA scheme was commissioned. Existing schemes that were commissioned within the last financial year are counted as asset replacements.
Protection and SCADA device failures are derived from defects or corrective work allocated to assets in the asset register. A report is generated through the business intelligence tool to show the number of protection or SCADA scheme failures per year.
TasNetworks reports systems and schemes at an aggregate level and therefore does not report these assets at granular level in the templates. This is applicable for the Protection schemes / systems and the Station SCADA and control systems functions only. The other functions listed in the template under this category such as ‘Master Station Assets’, ‘Control equipment / systems’, Infrastructure: protection and control’, ‘Metering systems’, ‘Site establishment’, ‘communications network assets’ and ‘Total secondary systems’ are assumed to be additional functions that have been added to the template by other participating NSP’s and are considered to have already been included in TasNetworks’ Protection schemes / systems and the Station SCADA and control systems.
Substations Primary Systems
Historical information has been sourced from the WASP asset register using Business Intelligence reporting sorted for assets that had been commissioned in the time period being reviewed. Commissioned assets may be a mix of new, augmented and replacement and a review of all the commissioned assets was undertaken and only those that were identified as replacement were included in the asset count. This was confirmed against section 2.3 and 5.2.
In the original 2012-13 submission the following industry standard asset categories were reported separately
to align with physical assets installed and asset counts included. In the subsequent RIN reporting periods and
based on the AER’s categorisation, these asset categories where no longer reported separately. These assets
categories where reported against the ‘other’ category. The table below details those assets that has been
used to determine the ‘other’ count.
Asset Category
< ≈ 33 kV; VACUUM INSULATED CIRCUIT BREAKER
< ≈ 33 kV; OIL INSULATED CIRCUIT BREAKER
< ≈ 33 kV; SF6 INSULATED CIRCUIT BREAKER
> 33 kV & < ≈ 66 kV ; OIL INSULATED CIRCUIT BREAKER
> 33 kV & < ≈ 66 kV ; SF6 INSULATED CIRCUIT BREAKER
> 66 kV & < ≈ 132 kV ; OIL INSULATED CIRCUIT BREAKER
> 66 kV & < ≈ 132 kV ; SF6 INSULATED CIRCUIT BREAKER
> 132 kV & < ≈ 275 kV ; OIL INSULATED CIRCUIT BREAKER
> 132 kV & < ≈ 275 kV ; SF6 INSULATED CIRCUIT BREAKER >

Basis of Preparation | Transmission Category Analysis RIN 2016-17 7
For RIN 2016-17 a decision has been made to report against two criteria only, expected to align with what is believed other utilities adhere to. That is to group into GIS switchgear and air insulated switchgear:
GIS switchgear is typically indoor sealed units with SF6 gas insulation encompassing the switch gear mechanism including bus bar chambers and instrument transformers (all encased).
Air insulated switchgear in higher voltage levels (>44kV) is typically outdoor with separate disconnectors and instrument transformers although dead tank circuit breakers do have integral CT’s. Voltage levels less than 44 kV are typically indoor and can have oil, vacuum, air or SF6 gas insulation medium with separate instrument transformers but within the same “air insulated” enclosure. As a result of this the following summated asset counts has been prepared.
Asset Category
Asset replacements
for current reporting period
< = 33 kV ; AIR INSULATED CIRCUIT BREAKER 0
< ≈ 33 kV; VACUUM INSULATED CIRCUIT BREAKER 17
< ≈ 33 kV; OIL INSULATED CIRCUIT BREAKER 0
< ≈ 33 kV; SF6 INSULATED CIRCUIT BREAKER 0
Reported as < = 33 kV ; AIR INSULATED CIRCUIT BREAKER 17
> 33 kV & < ≈ 66 kV ; OIL INSULATED CIRCUIT BREAKER 0
> 33 kV & < ≈ 66 kV ; SF6 INSULATED CIRCUIT BREAKER 0
Reported as > 33 kV & < = 66 kV; AIR INSULATED CIRCUIT BREAKER 0
> 66 kV & < ≈ 132 kV ; OIL INSULATED CIRCUIT BREAKER 0
> 66 kV & < ≈ 132 kV ; SF6 INSULATED CIRCUIT BREAKER 1
Reported as > 66 kV & < ≈ 132 kV; AIR INSULATED CIRCUIT BREAKER 1
> 132 kV & < ≈ 275 kV ; OIL INSULATED CIRCUIT BREAKER 0
> 132 kV & < ≈ 275 kV ; SF6 INSULATED CIRCUIT BREAKER 0
Reported as > 132 kV & < ≈ 275 kV; AIR INSULATED CIRCUIT BREAKER 0
Where an asset has been replaced by its modern equivalent, the new asset is included in the count for the modern equivalent asset type (ie. if 11 kV oil circuit breakers have/are being replaced with11 kV vacuum circuit breakers then the count is included in <33kV Vacuum insulated circuit breakers).
The number of asset failures has been taken from information extracted from WASP asset ‘defects’ register using Business Intelligence reporting and confirmed against failure reporting and discussion with substation engineers. The raw data was reviewed to ensure that the defect resulted in an asset failure (ie. an outage

8 TasNetworks
resulted). An asset failure definition was sourced from RIN information notice (2014) and was summarised to be an event which results in an un-planned outage of plant.
Substation other expenditure value comprises assets not specifically captured in other 2.2.1 asset categories. It includes substation specific ancillary and minor assets including battery systems, AC distribution systems, security systems, fences, oil containment systems, etc. Substation other is not recorded in 5.2.1 as it does not constitute a major asset class.
Due to historical asset delineation between previous separate transmission and distribution companies, assets <=44kV at a transmission substation are classed as transmission assets. Assets connected downstream from the load side connection of a transmission asset are construed to be a distribution owned assets.
Transmission Lines
TasNetworks’ owned asset replacements were sourced from the WASP asset register, filtering by assets with a commissioning date in the current reporting period.
Asset replacements resulting from augmentation projects were excluded.
Where TasNetworks has strung a single circuit in a double circuit configuration, this has been classified as double circuit, due to the increased operational cost resulting from such an arrangement.
The transmission tower category included expenditure on an asset renewal project which related to the enhancement of existing assets. Consequently there is no associated asset replacement number.
Optical Ground Wire (OPGW) data was taken from TasNetworks’ geographical information systems.
Assets of categories not owned by TasNetworks has been marked as ‘0’ as required by the RIN instructions.
Transmission conductor length is represented as circuit length, this is due to it being previously recorded as such.
Transmission Tower Support Structures
The support structures category includes only the following: anodes, foundations, insulators and danger signs. WASP values detail the number at each tower.
Conductors
Two failures recorded for two separate conductor joint failures on TL510 Sheffield – George Town 220 kV circuits 1 and 2.
OPGW
Single OPGW failure recorded for Hadspen – Trevallyn No 2 110 kV transmission line.Transmission Lines Other
This category consists of: Dampers, tracks, support structures and weather stations. This is due to these assets not being represented elsewhere in the REPEX section of the RIN. Replaced volume is reported in the RIN as the total number completed across each program.
(d) Use of estimates
Financial No estimations have been required in the collation and presentation of this information. Information is based on actual information, historical accounting records or other records used in the ordinary course of business.
(e) Compliance with financial reporting framework
Non-compliance
There has been no non-compliance with the financial reporting framework.
Basis of Preparation | Transmission Category Analysis RIN 2016-17 9
Reason for non-compliance
Not applicable.
Changes in accounting policies
There have been no changes in accounting policies for replacement expenditure.
Table 2.2.2 Selected assets characteristics
(a) Consistency of information with the requirements of the RIN
Information presented has been split in accordance with the categories in the Templates consistent with the requirements of the RIN.
(b) Source of information
Substations Primary Systems
Current commissioned assets numbers have been sourced from TasNetworks’ WASP asset register
Transmission Lines
Current commissioned assets numbers have been sourced from TasNetworks’ WASP asset register
(c) Methodology applied to determine information, including assumptions made
Substations Primary Systems
Current asset numbers were determined by restricting the search criteria to only existing commissioned assets. Asset replacement numbers were determined with the knowledge that only new installations have been completed over the required time period.
Transmission Lines
Historical asset replacements were sourced from TasNetworks’ asset register, filtering by assets with a commissioning date within the year in question.
Asset replacements resulting from augmentation projects were excluded.
The following transmission lines were excluded from calculations as they are not owned by TasNetworks:
TL473 – Bluff Point-Smithton
TL474 – Studland Bay Spur
TL485 – Musselroe Bay-Derby
Assets of categories not owned by TasNetworks has been marked as ‘0’ as required by the RIN instructions.
The values for table 2.2.2 were calculated with parallel lines counted separately, however the values for EB(T) 3.5.1.1 were calculated with parallel lines counted as a single circuit and as such the values in table 2.2.2 and 3.5.1.1 do not reconcile.
(d) Use of estimates
No estimations have been required in the collation and presentation of this information. Information is based on actual information, historical accounting records or other records used in the ordinary course of business.
(e) Compliance with financial reporting framework.
Non-compliance
There has been no non-compliance with the financial reporting framework.

10 TasNetworks
Reason for non-compliance
Not applicable.
Changes in accounting policies
There have been no changes in accounting policies for replacement expenditure.
Basis of Preparation | Transmission Category Analysis RIN 2016-17 11
Template 2.3 Augmentation expenditure
Related Projects
Substation project “Rosebery Substation”included as augmentation expenditure occurred to enable dynamic rating of transformers. This did not increase emergency rating (which typically is only for 4 hours) but allows for transformers to be run at emergency rating potentially for longer period of time to temperature limits.
No transmission line augmentation projects in the reporting period in WASP asset data.
Project Type “Other – specify”
With reference to RINS Appendix E, clauses 7.2 (g) and (i), and Tables 2.3.1 and 2.3.2, the following describes the substation type, project type, project trigger and voltage for the major projects listed as “Other – specify”.

12 TasNetworks
Table 2.3.1 Augmentation expenditure asset data – substations Table 2.3.2 Augmentation expenditure asset data – lines Table 2.3.4 Augmentation expenditure data – total
(a) Consistency of information with the requirements of the RIN
Information has been presented for augmentation expenditure as required under the RIN. No gifted assets have been included. Expenditure data has been included on an “as incurred” basis.
(b) Source of information
Information has been sourced from the asset management information system regarding the substation IDs, types and voltages.
Actual incurred augmentation expenditure has been extracted from the trial balance in the finance system.
(c) Methodology applied to determine information, including assumptions made
Actual incurred augmentation expenditure has been extracted from the trial balance in the finance system.
All project data is provided ‘on a project close basis in real dollars ($2012–13) for Table 2.3.1 and Table 2.3.2, and in nominal dollars for Table 2.3.4 in accordance with the RIN; and excludes applied overheads.
The following table based on historic CPI was then used to de-escalate to $2012–13:
Dec-08 Dec-09 Dec-10 Dec-11 Dec-12 Jun-13 Dec-13 Dec-14 Dec-15
CPI 92.4 94.3 96.9 99.8 102.0 102.8 104.8 106.6 108.4
Dec 08 to Jun 13 ($2008-09 to $2012-13) 11.26%
Dec 09 to Jun 13 ($2009-10 to $2012-13) 9.01%
Dec 10 to Jun 13 ($2010-11 to $2012-13) 6.09%
Dec 11 to Jun 13 ($2011-12 to $2012-13) 3.01%
Dec 12 to Jun 13 ($2012-13 to $2012-13) 0.78%
Dec 13 to Jun 13 ($2013-14 to $2012-13) -1.91%
Dec 14 to Jun 13 ($2014-15 to $2012-13) -3.56%
Dec15 to Jun 13 ($2015-16 to $2012-13) -5.17%Assumptions
Dollars expressed in $2012-13 means $June 2013
Nominal dollars in a year are mid-year and therefore in $Dec of the relevant year
For material projects, all projects closed in the final year of the current regulatory control period (1 july 2013 to 30 June 2014) and all projects closed in the forthcoming regulatory control period (1 July 2014 to 30 June 2019) have been included in tables 2.3.1 and 2.3.2.
For non-material projects, all projects closed in the initial regulatory years (1 July 2009 to 30 June 2014) have been included in the top row of ‘non material projects’ in tables 2.3.1 and 2.3.2. For non-material projects closed in the forthcoming regulatory period (1 July 2014 to 30 June 2019), these have been included in the bottom row of ‘non material projects’ in tables 2.3.1 and 2.3.2.
There are no Related Parties in the delivery of TasNetworks projects.

Basis of Preparation | Transmission Category Analysis RIN 2016-17 13
The substation and transformer MVA ratings provided are based on ‘cyclic rating’ as required by the RIN. This applies to substation normal and emergency ratings as well as individual transformer ratings. Substation ratings are typically based on nameplate rating from the equipment manufacturer. As TasNetworks does not currently have thermal models of the transformer loading capacity the cyclic ratings provided are a 20% increase of nameplate continuous rating.
(d) Use of estimates
No estimations have been required in the collation and presentation of this information. Information is based on actual information, historical accounting records or other records used in the ordinary course of business.
(e) Compliance with financial reporting framework
Non-compliance
There has been no non-compliance with the financial reporting framework.
Reason for non-compliance
Not applicable.
Changes in accounting policies
There have been no changes in accounting policies for augmentation expenditure.

14 TasNetworks
Template 2.5 Connections expenditure
Table 2.5.1 Expenditure on connection projects
(a) Consistency of information with the requirements of the RIN
Information has been presented for connections expenditure in accordance with the definitions and requirements of the RIN.
(b) Source of information
Actual incurred connections expenditure has been extracted from the trial balance in the finance system.
(c) Methodology applied to determine information, including assumptions made
Total project costs and total labour costs incurred in connections expenditure were extracted from the trial balance in the finance system. Total material costs were derived by taking total labour costs from total project costs.
Contract labour has been considered to be material costs, and only internal labour costs are considered to be labour costs for the purposes of populating table 2.5.1.
(d) Use of estimates
No estimations have been required in the collation and presentation of this information. Information is based on actual information, historical accounting records or other records used in the ordinary course of business.
(e) Compliance with financial reporting framework
Non-compliance
There has been no non-compliance with the financial reporting framework.
Reason for non-compliance
Not applicable.
Changes in accounting policies
There have been no changes in accounting policies for connections expenditure.
Table 2.5.2 Description of connection projects
(a) Consistency of information with the requirements of the RIN
Information has been presented for connections expenditure in accordance with the definitions and requirements of the RIN.
(b) Source of information
The descriptions of connection projects undertaken have been sourced from the Certificates of Operational Completion for each project.
Connection point rating information has been sourced from the asset management information system.
(c) Methodology applied to determine information, including assumptions made
Descriptions of connection projects were extracted from the Certificates of Operational Completion for each project, which aligns with the Regulatory Assets Register and the asset management information system.

Basis of Preparation | Transmission Category Analysis RIN 2016-17 15
The connection MVA ratings provided are based on ‘cyclic rating’ as required by the RIN. Substation ratings are typically based on nameplate rating from the equipment manufacturer. As TasNetworks does not currently have thermal models of the transformer loading capacity connection ratings (MVA) provided are a 20% increase of nameplate continuous rating.
(d) Use of estimates
No estimations have been required in the collation and presentation of this information. Information is based on actual information, historical accounting records or other records used in the ordinary course of business.
(e) Compliance with financial reporting framework
Non-compliance
There has been no non-compliance with the financial reporting framework.
Reason for non-compliance
Not applicable.
Changes in accounting policies
There have been no changes in accounting policies for connections expenditure.
16 TasNetworks
Template 2.6 Non-network expenditure
Table 2.6.1 Non-Network Expenditure
(a) Compliance with the requirements of the RIN
The information provided in Table 2.6.1 – Non-Network Expenditure is consistent with the requirements of the Category Analysis RIN, in that:
All relevant cells in the template have been populated
All data has been gathered from reliable and objective data sources which are used in the normal course of TasNetworks’ business
Each category of expenditure has been populated in line with the AER’s definitions outlined in the Regulatory Information Notice under Division 4 of Part 3 of the National Electricity Law
(b) Information sources
The information in Table 2.6.1 Non-Network Expenditure was sourced from TasNetworks’ financial accounting systems Navision and SUN and TasNetworks’ Fleet Management System.
(c) Methodology applied to determine information, including assumptions made
Client Device Expenditure
Expenditure that relates to a hardware device that accesses services made available by a server. Items included in this category are the costs associated with our IT service provider, plus all capital expenditure associated with the purchase of desktop computers, laptops, tablets etc. This information has been generated from the financial accounting systems.
Recurrent Expenditure
Expenditure included in this category are items that occur on a regular on-going basis and would include the operating labour costs of the IT department, plus all costs associated with landlines, mobile phones, software, data communications etc. This information has been generated from the financial accounting systems.
Non-Recurrent Expenditure
Expenditure included in this category are items that occur on a non-recurring basis and has been gathered from the financial accounting systems.
Motor Vehicles
All motor vehicles are split into the relevant RIN category per the category number generated from the Fleet Management System. Costs are then allocated on a proportionate basis per the number of vehicles within each category for determining Opex expenditure. Capex expenditure is the value of additions within the financial year, split into the relevant motor vehicle category.
Buildings and Property
Opex and Capex expenditure has been sourced from the financial accounting systems.
Other Expenditure
Opex and Capex expenditure has been sourced from the financial accounting systems.
(d) Estimated information
No estimates have been used in the compilation of this table.

Basis of Preparation | Transmission Category Analysis RIN 2016-17 17
Table 2.6.2 Annual Descriptor Metrics - IT & Communications Expenditure
(a) Compliance with the requirements of the RIN
The information provided in Table 2.6.2 IT & Communications Expenditure is consistent with the requirements of the Category Analysis RIN, in that:
All relevant cells in the template have been populated
All data has been gathered from reliable and objective data sources which are used in the normal course of TasNetworks’ business
Each category of expenditure has been populated in line with the AER’s definitions outlined in the Regulatory Information Notice under Division 4 of Part 3 of the National Electricity Law
(b) Information sources
The descriptor metrics relating to TasNetworks IT & Communications expenditure has been sourced from TasNetworks’ Human Resources system (Peoplesoft) at the time of the Financial Year End. The numbers provided are as per the TasNetworks’ published accounts.
(c) Methodology applied to determine information, including assumptions made
Employee numbers represent total TasNetworks employee numbers as published in the annual accounts.
(d) Estimated information
No estimates have been used in the compilation of this table.
Table 2.6.3 Annual Descriptor Metrics - Motor Vehicles
(a) Compliance with the requirements of the RIN
The information provided about Motor Vehicles in Table2.6.3 – Motor Vehicles is consistent with the requirements of the Category Analysis RIN, in that:
All relevant cells in the template have been populated
All data has been gathered from reliable and objective data sources which are used in the normal course of TasNetworks’ business
Each category of expenditure has been populated in line with the AER’s definitions outlined in the Regulatory Information Notice under Division 4 of Part 3 of the National Electricity Law
(b) Information sources
Information regarding TasNetworks’ vehicle fleet has been sourced from TasNetworks’ Fleet Management Systems (AusFleet) and TasNetworks’ Financial System (Navision).
(c) Methodology applied to determine information, including assumptions made
Kilometres travelled
The opening and closing odometer readings for each vehicle were used to calculate the kilometres travelled in the current reporting period, with the mileages then sorted by category of vehicle and aggregated.
Number purchased
The number of vehicles purchased by TasNetworks during the current reporting periodwas extracted from the TasNetworks’ fleet management systems (AusFleet).
18 TasNetworks
Number in fleet
The number of vehicles in TasNetworks’ fleet was derived for each category of vehicle using information taken from TasNetworks’ fleet management systems (AusFleet).
Proportion of fleet expenditure
The proportion of fleet expenditure was derived by:
gathering motor vehicle expenditure for each vehicle from TasNetworks’ fleet management system (AusFleet)
allocating each motor vehicle to the appropriate category (e.g. Light Commercial, Passenger, Trailer)
calculating the total expenditure for each category of motor vehicle
splitting out the cost of each category of vehicle into prescribed and non-prescribed expenditure (consistent with the methodology used in the previous reporting period)
calculating the Regulatory Percentage by dividing prescribed expenditure by total expenditure
(d) Estimated information
No estimates were used in the compilation of this table.

Basis of Preparation | Transmission Category Analysis RIN 2016-17 19
Template 2.7 Vegetation management
Table 2.7.1 Descriptor metrics by zone
a) Consistency of information with the requirements of the RIN
Information has been provided regarding vegetation management in accordance with the definitions included within the RIN.
As part of its licence requirements, TasNetworks produces and maintains an Easement Management Plan and Transmission System Management Plan (TSMP). TasNetworks is not subject to any other external regulatory requirements for vegetation management.
TasNetworks internally mitigates its bushfire risk through the implementation of recommendations made within the Easement Management Plan and TSMP. It also undertakes periodic external audits of its vegetation management and bushfire mitigation practices to minimise risk, liability and insurance costs.
b) Source of information
Route line length within zone
The total length of the maintenance spans has been sourced from WASP asset data. It includes all TasNetworks-owned transmission lines, even if not currently in service.
Number of maintenance spans
Information has been sourced from completed work orders which have been issued to vegetation management contractors. Where one span has been maintained more than once in any period, only one maintenance span has been counted.
Total length of maintenance spans
Information has been sourced from the asset management information system.
Average number of trees per maintenance span
Information regarding the total number of vegetation maintenance spans has been sourced from completed work orders which have been issued to vegetation management contractors. The density of vegetation within the spans has been determined by:
using vegetation density data collected by contractors approximately 10 years ago; and/or
viewing the spans via an online medium (e.g. Google Earth) and, through experience, assigning a particular density to the vegetation in like areas.
TasNetworks has used data provided by Forestry Tasmania in quantifying ‘Medium’ vegetation density.
Information for the quantification of other vegetation density categories was sourced internally through experience of TasNetworks’ easements and the types of vegetation typically encountered.
Length of vegetation corridors
Information has been sourced from the geographical information system.
Average width of vegetation corridors
Information has been derived from information maintained in the geographical information system.
Average frequency of cutting cycle
Information has been sourced from the Transmission Line Easement Asset Management Plan.
c) Methodology applied to determine information, including assumptions made
The assumption has been made that the entire network is in one zone only.

20 TasNetworks
Route line length within zone
The total length of the maintenance spans has been sourced from WASP asset data. It includes all TasNetworks-owned transmission lines, even if not currently in service.
Number of maintenance spans
Information has been extracted from the asset management system for completed work orders. No assumptions were required for the majority of work orders. A small number of work orders included a scope of works that seemed larger than that suggested by actual expenditure. In the absence of any additional information it has been assumed that the scope of works is correct.
Total length of maintenance spans
Information has been sourced from the asset management information system. The length of the forward looking span has been used in the calculation of total length of the maintenance span.
Average number of trees per maintenance span
TasNetworks has interpreted the definition as requiring TasNetworks to report the total number of trees that could require maintenance within a span in which one or more vegetation defects have been identified.
The average number of trees per vegetation maintenance span has been arrived at by multiplying the span length (for the span where the maintenance was completed) by the easement width by the determined density of vegetation within each of the spans (the ‘density factor’). It has been assumed that all 110 kV transmission lines have an easement width of 50m, and 220 kVA lines have a width of 60m.
Historically, TasNetworks’ field works management processes, asset information systems and reporting tools have not collected information regarding geography and the height of trees, and hence TasNetworks has not considered these in the calculation of its average number of trees per maintenance span.
Where TasNetworks does not have access to vegetation density data, it has excluded those vegetation maintenance spans from its calculations.
Length of vegetation corridors
Information has been sourced from the geographical information system. Where more than one transmission line runs parallel, only one length has been counted as a vegetation corridor.
Average width of vegetation corridors
The total area of all corridors has been sourced from the geographical information system, applying a 50m or 60m easement width depending on voltage, with these then being merged to create a single area. This area (of all corridors) was then divided by the total length of the vegetation corridors as sourced from the geographical information system (described above).
Average frequency of cutting cycle
Information has been sourced from the Transmission Line Easement Asset Management Plan, whereby each asset is inspected on a 5 year cycle, with 20 per cent inspected each year.
d) Use of estimates
Route line length within zone
No estimations have been required in the collation and presentation of this information. Information is based on actual information, historical accounting records or other records used in the ordinary course of business.
Number of maintenance spans
No estimations have been required in the collation and presentation of this information. Information is based on actual information, historical accounting records or other records used in the ordinary course of business.

Basis of Preparation | Transmission Category Analysis RIN 2016-17 21
Total length of maintenance spans
No estimations have been required in the collation and presentation of this information. Information is based on actual information, historical accounting records or other records used in the ordinary course of business.
Average number of trees per maintenance span
The determined density factor has been broken down into four bands, and an estimate has been required to determine the number of trees in each band of density (through practical experience and through an assessment of aerial photos for each easement where vegetation maintenance has occurred). This estimate has been required as information has historically been impracticable to collect and maintain.
Pasture = 5 trees per Ha
Low = 50 trees per Ha
Medium = 1300 per Ha (approximately equal to typical Forestry Tasmania plantation density)
High = 2000 per Ha
Length of vegetation corridors
No estimations have been required in the collation and presentation of this information. Information is based on actual information.
Average width of vegetation corridors
TasNetworks has applied standard easement widths in the calculation of this value (as physically maintained by TasNetworks in the field), rather than utilising actual easement widths. In the vast majority of cases these will be the same, however in a small number of instances there may be a difference. TasNetworks considers the effort required to determine these actual widths to be excessive for the benefit achieved in terms of accuracy and for comparative purposes.
Average frequency of cutting cycle
No estimations have been required in the collation and presentation of this information. Information is based on actual information.
e) Compliance with financial reporting framework
Non-compliance
There has been no non-compliance with the financial reporting framework.
Reason for non-compliance
Not applicable.
Changes in accounting policies
There have been no changes in accounting policies relating to vegetation management.
Table 2.7.2 Expenditure metrics by zone
(a) Consistency of information with the requirements of the RIN
Information has been provided regarding vegetation management in accordance with the definitions included within the RIN.
As part of its licence requirements, TasNetworks produces and maintains an Easement Management Plan and Transmission System Management Plan (TSMP). TasNetworks is not subject to any other external regulatory requirements for vegetation management.
TasNetworks internally mitigates its bushfire risk through the implementation of recommendations made within the Easement Management Plan and TSMP. It also undertakes periodic external audits of its vegetation management and bushfire mitigation practices to minimise risk, liability and insurance costs.

22 TasNetworks
All vegetation management costs submitted within this RIN can be considered to be the cost associated with TasNetworks’ compliance with the TSMP and other, self-imposed standards.
A high percentage of TasNetworks transmission lines are located in forested and other rural areas that are populated with rapidly growing species of vegetation.
Past and recent bushfire events in Tasmania demonstrate the potential for bushfires in these areas and the associated impact. While rare, past bushfire events in this and other jurisdictions demonstrate that bushfires can be initiated by transmission assets.
Similarly, past events demonstrate that vegetation in these forested and rural areas can cause unplanned outages, impacting detrimentally on customer supply.
Meeting the applicable regulations and self-imposed standards for vegetation management in these areas drives significant costs for TasNetworks.
(b) Source of information
The reported vegetation management information has been sourced from the general ledger in the Sun finance system.
(c) Methodology applied to determine information, including assumptions made
Information was sourced from the general ledger in the finance system by extracting costs by contractor to ascertain the amount spent for contracted services for the current reporting period. Work orders were obtained to confirm the nature of the contracted service provided. Contracted services were classified based on the requirements of the RIN.
No contractor liaison costs were able to be sourced from contractor work orders. As such, any contractor liaison costs that were incurred are included within Other vegetation management costs.
(d) Use of estimates
No estimations have been required in the collation and presentation of this information. Information is based on actual information, historical accounting records or other records used in the ordinary course of business.
(e) Compliance with financial reporting framework
Non-compliance
There has been no non-compliance with the financial reporting framework.
Reason for non-compliance
Not applicable.
Changes in accounting policies
There have been no changes in accounting policies relating to vegetation management.
Table 2.7.3 Descriptor metrics for unplanned vegetation events
(a) Consistency of information with the requirements of the RIN
Information reported has been provided in accordance with the definitions provided in the RIN.
(b) Source of information
Information is based on actual outages recorded for the current reporting period.
(c) Methodology applied to determine information, including assumptions made
Review of outage reports was undertaken to determine the cause of outage. Wind borne debris, eg bark was not considered as an outage caused by vegetation.

Basis of Preparation | Transmission Category Analysis RIN 2016-17 23
(d) Use of estimates
No estimations have been required in the collation and presentation of this information. Information is based on actual information, historical accounting records or other records used in the ordinary course of business.
(e) Compliance with financial reporting framework
Non-compliance
There has been no non-compliance with the financial reporting framework.
Reason for non-compliance
Not applicable.
Changes in accounting policies
There have been no changes in accounting policies relating to maintenance expenditure.
24 TasNetworks
Template 2.8 Maintenance
Table 2.8.1 Descriptor metrics for routine and non-routine maintenance
(a) Consistency of information with the requirements of the RIN
Information has been provided regarding maintenance expenditure in accordance with the definitions included within the RIN. Information was not able to be sourced for the asset track maintenance and decommissioned assets.
(b) Source of information
Telecommunications network / Systems
Information has been sourced from the internally maintained telecommunications asset register, the Telecommunications RIN Data MS Excel spreadsheet, and from the asset management plan.
Access track maintenance and decommission assets
Information was not able to be sourced for these assets. Many of these assets are not owned by TasNetworks and the collation of such information would be impracticable.
Substation equipment and property maintenance
Information has been sourced from the asset management information system and the asset management plan.
Asset ‘inspection/maintained’ data was obtained from the asset management information system and BASIX.
Substation Secondary assets
Information is sourced from the WASP asset register and reported through business intelligence reporting tools.
All other assets
Information has been sourced from the asset management information system and the asset management plan.
(c) Methodology applied to determine information, including assumptions made
Asset quantities in this table have been collected for those assets that have undergone either routine or non-routine maintenance.
Telecommunications network / Systems
Information regarding the number of elements owned, inspected and maintained was extracted from the telecommunications asset register.
Asset ages were extracted from the telecommunications asset register.
Inspections and maintenance occurs on telecommunications assets every six months’ to reflect the maintenance and inspection cycle reported in RIN data, noting that this reflects the highest value activity.
Substation equipment and property maintenance
Switch bays, cables and transformers are visually inspected several times per year as part of substation inspection and hence TasNetworks has specified that ‘All’ assets are inspected and with a similar inspection cycle.
In calculating the number of switch bays maintained, TasNetworks has determined to best reflect the actual installations that a switchbay comprises a 𝐶𝑖𝑟𝑐𝑢𝑖𝑡 𝐵𝑟𝑒𝑎𝑘𝑒𝑟 + 𝐷𝑖𝑠𝑐𝑜𝑛𝑛𝑒𝑐𝑡𝑜𝑟 + 𝐶𝑇 + 𝑉𝑇 as applicable and as

Basis of Preparation | Transmission Category Analysis RIN 2016-17 25
such the switchbay count is taken to be the number of circuit breakers only. This point needs to be considered when comparing to data recorded at CA5.2.1.
In calculating the number of transformers maintained, TasNetworks has included those transformers where tap changer maintenance has been completed, and excluded those transformers where only condition monitoring was undertaken (eg. bushing and/or oil testing).
Average age has been calculated as follows:
o Transmission cables has been based on 𝑎𝑔𝑒 𝑥 𝑙𝑒𝑛𝑔𝑡ℎ
𝑡𝑜𝑡𝑎𝑙 𝑙𝑒𝑛𝑔𝑡ℎ
o 𝑠𝑢𝑏𝑠𝑡𝑎𝑡𝑖𝑜𝑛 𝑝𝑟𝑜𝑝𝑒𝑟𝑡𝑦 =(Σ 𝑜𝑓 𝑐𝑢𝑟𝑟𝑒𝑛𝑡 𝑑𝑎𝑡𝑒 − 𝑐𝑜𝑚𝑚𝑖𝑠𝑠𝑖𝑜𝑛𝑖𝑛𝑔 𝑑𝑎𝑡𝑒)/𝑛𝑢𝑚𝑏𝑒𝑟 𝑜𝑓 𝑝𝑟𝑜𝑝𝑒𝑟𝑡𝑖𝑒𝑠
o 𝑃𝑜𝑤𝑒𝑟 𝑡𝑟𝑎𝑛𝑠𝑓𝑜𝑟𝑚𝑒𝑟𝑠 =(Σ 𝑜𝑓 𝑐𝑢𝑟𝑟𝑒𝑛𝑡 𝑑𝑎𝑡𝑒 − 𝑐𝑜𝑚𝑚𝑖𝑠𝑠𝑖𝑜𝑛𝑖𝑛𝑔 𝑑𝑎𝑡𝑒)/𝑛𝑢𝑚𝑏𝑒𝑟 𝑜𝑓 𝑡𝑟𝑎𝑛𝑠𝑓𝑜𝑟𝑚𝑒𝑟𝑠
o 𝑆𝑤𝑖𝑡𝑐ℎ𝑏𝑎𝑦𝑠 = (Σ 𝑜𝑓 𝑐𝑢𝑟𝑟𝑒𝑛𝑡 𝑑𝑎𝑡𝑒 − 𝑐𝑜𝑚𝑚𝑖𝑠𝑠𝑖𝑜𝑛𝑖𝑛𝑔 𝑑𝑎𝑡𝑒)/𝑛𝑢𝑚𝑏𝑒𝑟 𝑜𝑓 𝑠𝑤𝑖𝑡𝑐ℎ𝑏𝑎𝑦𝑠
Transmission towers
The number of towers and the line lengths owned, inspected and maintained were extracted from the asset management information system.
The number of towers maintained includes commissioned, decommissioned and out of service towers whereas quantities in section 5.2.1 only include commissioned towers.
Asset ages were extracted from the asset management information system.
Inspection cycles were extracted from the asset management plan.
Transmission Tower Support Structures
No value has been entered against transmission tower support structures as all towers and associated fittings ie: insulators, foundations, dampers, anodes etc. have been deemed to be accounted for in the transmission towers quantity. This is different to table 5.2 where the individual replacement assets ie: insulators, foundations, signs etc. have been included in the transmission tower support structures numbers.
SCADA and network control maintenance
SCADA assets count includes the number of SCADA schemes registered in WASP for the period. SCADA schemes are defined as one or more SCADA Gateways on a per site basis, and excludes Bay Controllers.
The average SCADA scheme asset age is derived from the average of the SCADA scheme commissioned dates. The number of SCADA schemes inspected/maintained is equal to the number of protection schemes inspected/maintained because the SCADA scheme forms part of the protection scheme tests during the inspection/maintenance.
The new maintenance tasks specifically for the SCADA schemes has a frequency of 6 years.
Protection systems maintenance
Protection system asset count includes Bus Coupler, Bus Zone, Capacitor Bank, HV Feeder, System Protection, Station Services Transformer, Transformer and Transmission Circuit schemes.
The average protection scheme asset age is derived from the average of the protection scheme commissioned dates.
Maintenance cycle is as per the relevant asset management plans, which is 6 years for self-monitored schemes, and 3 years for non-self-monitored schemes.
(d) Use of estimates
No estimations have been required in the collation and presentation of this information. Information is based on actual information, historical accounting records or other records used in the ordinary course of business.

26 TasNetworks
(e) Compliance with financial reporting framework
Non-compliance
There has been no non-compliance with the financial reporting framework.
Reason for non-compliance
Not applicable.
Changes in accounting policies
There have been no changes in accounting policies relating to maintenance expenditure.
Table 2.8.2 Cost metrics for routine and non-routine maintenance
(a) Consistency of information with the requirements of the RIN
Information has been provided regarding maintenance expenditure in accordance with the definitions included within the RIN.
(b) Source of information
Information has been sourced from the finance system, asset management information system and the asset management plan.
(c) Methodology applied to determine information, including assumptions made
Information was sourced from the general ledger in the Sun finance system by extracting maintenance expenditure costs by asset class for each financial year.
For protection systems and SCADA and network control, total costs were split based on the following:
a. Experience
b. Work undertaken on a two day maintenance job (15 Hours) would typically involve 12 hours on protection and 3 hours on SCADA
c. Non-routine maintenance personnel – 50% SCADA and 50% protection
d. Engineering and technical support based on total workload
(d) Use of estimates
No estimations have been required in the collation and presentation of this information. Information is based on actual information, historical accounting records or other records used in the ordinary course of business.
(e) Compliance with financial reporting framework
Non-compliance
There has been no non-compliance with the financial reporting framework.
Reason for non-compliance
Not applicable.
Changes in accounting policies
There have been no changes in accounting policies for maintenance expenditure.

Basis of Preparation | Transmission Category Analysis RIN 2016-17 27
Template 2.10 Overheads
Table 2.10.1 Network overheads expenditure
(a) Consistency of information with the requirements of the RIN
The information provided in Table 2.10 is consistent with the requirements of the Category Analysis RIN, in that:
The template has been prepared in accordance with RIN paragraphs 14.1-14.4 of Appendix E – Principles and Requirements
All relevant input cells have been populated
All data has been gathered from reliable and objective data sources which are used in the normal course of TasNetworks’ business
(b) Source of information
For both network and corporate overhead expenditure, historical information has been extracted from the audited Regulatory financial statements.
(c) Methodology applied to determine information, including assumptions made
For both network and corporate overhead expenditure:
Prescribed overhead expenditure has been extracted from the audited Regulatory financial statements
Non-prescribed overhead expenditure has been extracted from the general ledger in the Sun finance system, which is broken down into the required expenditure subcategories
TasNetworks capitalises overheads to ensure that all costs directly attributable to bringing an asset to the location and condition necessary for its use are capitalised per AASB 116.16.
The overhead costs included in this worksheet include both capital and operational overheads which are separated in worksheet 2.1.
Negotiated Services & Unregulated Services Overhead Expenditure
In prior years, overheads applied were grossed up on the basis of what categories the overheads were applied to, rather than where the overheads were recovered from. We have changed this approach to ensure that each category now reflects the gross cost incurred in each category, prior to the application of overheads recovered.
(d) Use of estimates
No estimations have been required in the collation and presentation of this information. Information is based on actual information, historical accounting records or other records used in the ordinary course of business.
(e) Compliance with financial reporting framework
Non-compliance
There has been no non-compliance with the financial reporting framework.
Reason for non-compliance
Not applicable.
Changes in accounting policies

28 TasNetworks
There have been no changes in accounting policies for network and corporate overhead expenditure.
Table 2.10.2 Corporate overheads expenditure
(a) Consistency of information with the requirements of the RIN
Information reported has been determined regarding overheads in accordance with the definitions provided in the RIN.
(b) Source of information
For both network and corporate overhead expenditure, historical information has been extracted from the audited Regulatory financial statements.
(c) Methodology applied to determine information, including assumptions made
For both network and corporate overhead expenditure:
Prescribed overhead expenditure has been extracted from the audited Regulatory financial statements
Non-prescribed overhead expenditure has been extracted from the general ledger in the Sun finance system, which is broken down into the required expenditure subcategories
TasNetworks capitalises overheads to ensure that all costs directly attributable to bringing an asset to the location and condition necessary for its use are capitalised per AASB 116.16.
The overhead costs included in this worksheet include both capital and operational overheads which are separated in worksheet 2.1.
(d) Use of estimates
No estimations have been required in the collation and presentation of this information. Information is based on actual information, historical accounting records or other records used in the ordinary course of business.
(e) Compliance with financial reporting framework
Non-compliance
There has been no non-compliance with the financial reporting framework.
Reason for non-compliance
Not applicable.
Changes in accounting policies
There have been no changes in accounting policies for network and corporate overhead expenditure.

Basis of Preparation | Transmission Category Analysis RIN 2016-17 29
Template 2.11 Labour
Table 2.11.1 Cost metrics per annum; and Table 2.11.2 Extra descriptor metrics for current year
(a) Consistency of information with the requirements of the RIN
The information provided in Table 2.11 is consistent with the requirements of the Category Analysis RIN, in that:
All relevant input cells have been populated; and
All data has been gathered from reliable and objective data sources which are used in the normal course of TasNetworks’ business.
(b) Source of information
Financial information has been sourced from the trial balance in the finance system, which integrates information directly from the payroll system.
Information regarding the average staffing level has been determined with reference to the staff list at year end.
The average productive work hours per average staffing level has been determined based on a standard working week for all employees, with allowances made for leave. Methodology applied to determine information, including assumptions made
Information regarding the full time equivalent average staffing level has been determined with reference to the staff list at year end, which details staff headcount by department and by labour classification level.
The total labour costs per average staffing level have been determined using the cost allocated to prescribe services based on TasNetworks Cost Allocation Methodology (CAM) and the payroll report per classification levels.
The average productive work hours per average staffing level have been determined based on a standard working week for all employees, with allowances made for
The average productive work hours hourly rate per average staffing level is the labour cost divided by the average productive work hours per average staffing level.
There have been no stand-down occurrences to report.
Overtime includes only salary and wage costs as per the definition in the RIN and not any related oncosts.
(c) Use of estimates
No estimations have been required in the collation and presentation of this information. Information is based on actual information, historical accounting records or other records used in the ordinary course of business.
(d) Compliance with financial reporting framework
Non-compliance
There has been no non-compliance with the financial reporting framework.
Reason for non-compliance
Not applicable.

30 TasNetworks
Changes in accounting policies
There have been no changes in accounting policies for labour.

Basis of Preparation | Transmission Category Analysis RIN 2016-17 31
Template 2.12 Input tables
(a) Consistency of information with the requirements of the RIN
Information reported has been determined in accordance with the definitions and instructions provided in the RIN.
(b) Source of information
Information presented on the Input tables worksheet has been sourced from other worksheets in the RIN templates.
(c) Methodology applied to determine information, including assumptions made
The split of costs into the categories required by the RIN was based on actual expenditure in the year from the finance system, with a percent of costs to each actual category (i.e. direct materials) then applied across the line items in the RIN.
(d) Use of estimates
No estimations have been required in the collation and presentation of this information. Information is based on actual information, historical accounting records or other records used in the ordinary course of business.
(e) Compliance with financial reporting framework
Non-compliance
There has been no non-compliance with the financial reporting framework.
Reason for non-compliance
Not applicable.
Changes in accounting policies
Changes in accounting policies are not applicable for input tables.

32 TasNetworks
Template 5.2 Asset age profile
Table 5.2.1 Asset age profile
(a) Consistency of information with the requirements of the RIN
Information has been provided regarding asset age profile in accordance with the definitions included within the RIN.
(b) Source of information
The economic lives of assets and the age of assets currently in commission have been sourced from information maintained within the the WASP asset register using Business Intelligence reporting.
The economic lives and age of telecommunications assets currently in commission were sourced from the telecommunications asset register, telecommunications operational drawings and asset management plans.
(c) Methodology applied to determine information, including assumptions made
Information was extracted from the asset management information system. Information was filtered on commissioned status and year of commissioning. Where a parent asset has multiple child assets, the age of the parent asset has been presented.
The mean age presented is the useful life of the assets for each category.
The standard deviation has been calculated as the square root of the mean for each asset category, in accordance with the definitions included within the RIN.
Transmission Towers
The volumes were extracted from WASP and the age profile developed only on commissioned assets. This figure differs from section 2.8.1 wher the number of towers maintained includes commissioned, decommissioned and out of service towers..
Transmission Tower Support Structures
The values entered for the support structures category includes the following: anodes, foundations, insulators and danger signs that have been replaced on existing Transmission Towers. This is different to table 2.8 where all these components have been counted as part of the Transmission Towers...
To generate the age profile the support structure installation dates where extracted from WASP, and counted after being filtered between multiple circuit, single circuit and by voltage. The age profile generated is then inputted into the RIN spreadsheet as a complete set, over writing that of previous years.
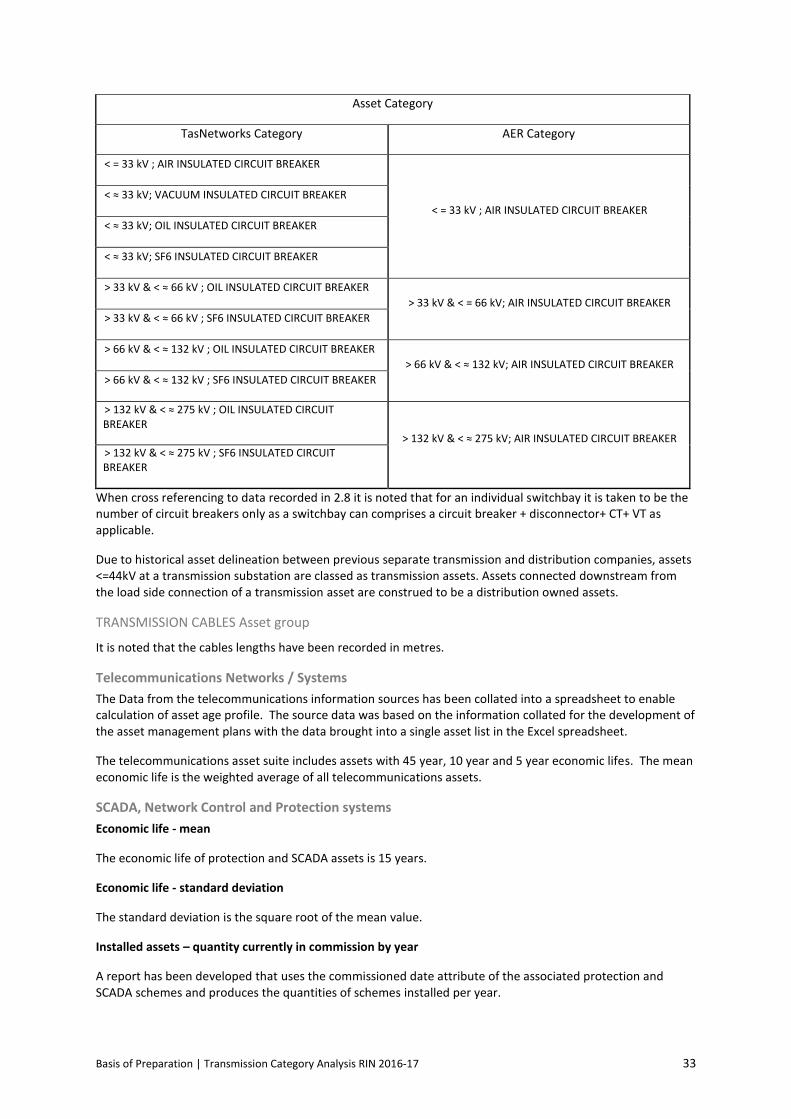
Substation Switchbays Asset group
For this table 5.2.1 the following substation switchbay asset grouping has been categorised according to either GIS module or air insulated categories.
GIS switchgear is typically indoor sealed units with SF6 gas insulation encompassing the switch gear mechanism including bus bar chambers and instrument transformers (all encased).
Air insulated switchgear in higher voltage levels (>44kV) is typically outdoor with separate disconnectors and instrument transformers although dead tank circuit breakers do have integral CT’s. Voltage levels less than 44 kV are typically indoor and can have oil, vacuum, air or SF6 gas insulation medium with separate instrument transformers but within the same “air insulated” enclosure.
As a result of this the following table details the grouping of TasNetworks recorded categories against AER reporting requirements.
Basis of Preparation | Transmission Category Analysis RIN 2016-17 33
Asset Category
TasNetworks Category AER Category
< = 33 kV ; AIR INSULATED CIRCUIT BREAKER
< = 33 kV ; AIR INSULATED CIRCUIT BREAKER
< ≈ 33 kV; VACUUM INSULATED CIRCUIT BREAKER
< ≈ 33 kV; OIL INSULATED CIRCUIT BREAKER
< ≈ 33 kV; SF6 INSULATED CIRCUIT BREAKER
> 33 kV & < ≈ 66 kV ; OIL INSULATED CIRCUIT BREAKER
> 33 kV & < = 66 kV; AIR INSULATED CIRCUIT BREAKER
> 33 kV & < ≈ 66 kV ; SF6 INSULATED CIRCUIT BREAKER
> 66 kV & < ≈ 132 kV ; OIL INSULATED CIRCUIT BREAKER
> 66 kV & < ≈ 132 kV; AIR INSULATED CIRCUIT BREAKER
> 66 kV & < ≈ 132 kV ; SF6 INSULATED CIRCUIT BREAKER
> 132 kV & < ≈ 275 kV ; OIL INSULATED CIRCUIT BREAKER
> 132 kV & < ≈ 275 kV; AIR INSULATED CIRCUIT BREAKER > 132 kV & < ≈ 275 kV ; SF6 INSULATED CIRCUIT BREAKER
When cross referencing to data recorded in 2.8 it is noted that for an individual switchbay it is taken to be the number of circuit breakers only as a switchbay can comprises a circuit breaker + disconnector+ CT+ VT as applicable.
Due to historical asset delineation between previous separate transmission and distribution companies, assets <=44kV at a transmission substation are classed as transmission assets. Assets connected downstream from the load side connection of a transmission asset are construed to be a distribution owned assets.
TRANSMISSION CABLES Asset group
It is noted that the cables lengths have been recorded in metres.
Telecommunications Networks / Systems
The Data from the telecommunications information sources has been collated into a spreadsheet to enable calculation of asset age profile. The source data was based on the information collated for the development of the asset management plans with the data brought into a single asset list in the Excel spreadsheet.
The telecommunications asset suite includes assets with 45 year, 10 year and 5 year economic lifes. The mean economic life is the weighted average of all telecommunications assets.
SCADA, Network Control and Protection systems
Economic life - mean
The economic life of protection and SCADA assets is 15 years.
Economic life - standard deviation
The standard deviation is the square root of the mean value.
Installed assets – quantity currently in commission by year
A report has been developed that uses the commissioned date attribute of the associated protection and SCADA schemes and produces the quantities of schemes installed per year.
34 TasNetworks
TasNetworks report systems and schemes at an aggregate level and therefore do not report these assets at granular level in the templates. This is applicable for the Protection schemes / systems and the Station SCADA and control systems functions only. The other functions listed in the template under this category such as ‘Master Station Assets’, ‘Control equipment / systems’, Infrastructure: protection and control’, ‘Metering systems’, ‘Site establishment’, communications network assets and ‘Total secondary systems’ are assumed to be additional functions that have been added to the template by other participating NSP’s and are considered to have already been included in TasNetworks’ Protection schemes / systems and the Station SCADA and control systems.
OPGW
No new OPGW was installed in the current reporting period, therefore the asset numbers remain as submitted in the previous reporting period.
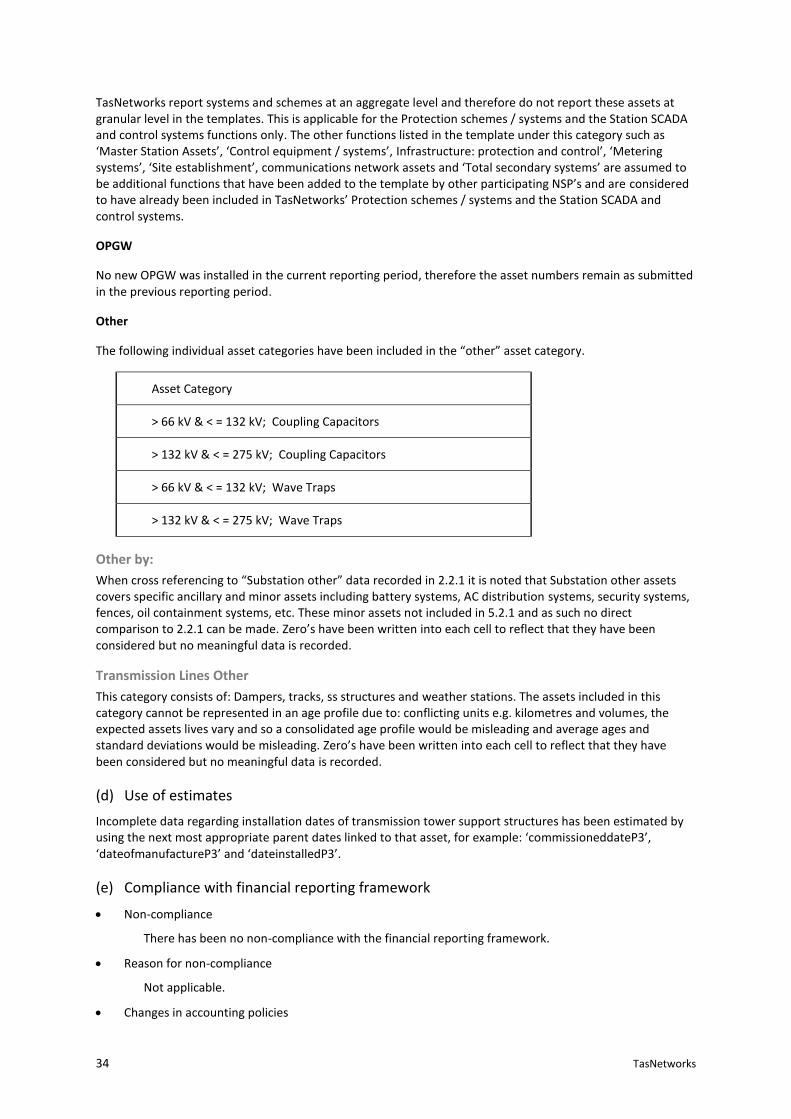
Other
The following individual asset categories have been included in the “other” asset category.
Asset Category
> 66 kV & < = 132 kV; Coupling Capacitors
> 132 kV & < = 275 kV; Coupling Capacitors
> 66 kV & < = 132 kV; Wave Traps
> 132 kV & < = 275 kV; Wave Traps
Other by:
When cross referencing to “Substation other” data recorded in 2.2.1 it is noted that Substation other assets covers specific ancillary and minor assets including battery systems, AC distribution systems, security systems, fences, oil containment systems, etc. These minor assets not included in 5.2.1 and as such no direct comparison to 2.2.1 can be made. Zero’s have been written into each cell to reflect that they have been considered but no meaningful data is recorded.
Transmission Lines Other
This category consists of: Dampers, tracks, ss structures and weather stations. The assets included in this category cannot be represented in an age profile due to: conflicting units e.g. kilometres and volumes, the expected assets lives vary and so a consolidated age profile would be misleading and average ages and standard deviations would be misleading. Zero’s have been written into each cell to reflect that they have been considered but no meaningful data is recorded.
(d) Use of estimates
Incomplete data regarding installation dates of transmission tower support structures has been estimated by using the next most appropriate parent dates linked to that asset, for example: ‘commissioneddateP3’, ‘dateofmanufactureP3’ and ‘dateinstalledP3’.
(e) Compliance with financial reporting framework
Non-compliance
There has been no non-compliance with the financial reporting framework.
Reason for non-compliance
Not applicable.
Changes in accounting policies

Basis of Preparation | Transmission Category Analysis RIN 2016-17 35
There have been no changes in accounting policies relating to asset age profiles.

36 TasNetworks
Template 5.3 Maximum demand at network level
Table 5.3.1 Raw and weather corrected coincident MD at network level
(a) Consistency of information with the requirements of the RIN
Information has been provided regarding maximum demand at the network level in accordance with the definitions included within the RIN.
The maximum demand transported through the network has been taken from the downstream settlement location in Tasmania, and includes Basslink transfers at the time of Tasmanian maximum demand.
(b) Source of information
Raw network coincident maximum demand
Information has been sourced from TasNetworks’ metering and billing system.
Date and time period maximum demand occurred
Information has been sourced from TasNetworks’ metering and billing system.
Winter/summer peaking
Information has been sourced from TasNetworks’ metering and billing system.
Embedded generation
Embedded generation data downstream of connection point Have been sourced from TasNetworks distribution metering data.
Weather corrected maximum demand – 10% or 50% probability of exceedance
Historical information has been sourced from TasNetworks’ metering and billing system.
Weather data has been sourced from the Bureau of Meteorology.
Where possible, the closest weather station data have been used to determine the weather correction for each connection point. For each connection point there is a corresponding weather station, with satisfactory historical data collection.
(c) Methodology applied to determine information, including assumptions made
Raw network coincident maximum demand assumptions:
Information extracted includes the maximum demand on the Tasmanian network, and the load being transmitted by Basslink at the time of maximum demand on the Tasmanian network
Information relating to Basslink is included in the raw network coincident maximum demand where Basslink is exporting electricity
Coincident weather adjusted maximum demand is derived based on the following methodology and
assumptions:
Based on historic daily maximum and minimum temperatures obtained from Bureau of Meteorology, Daily effective temperatures have been calculated in accordance with the definition provided by NIEIR, which is defined as the weighted average of the overnight minimum and the previous daily maximum. The daily minimum was assigned a weight of 0.8, while the previous day’s maximum a weight of 0.2 in this calculation.
Annual minimum effective temperatures for the period from 1970 to current regulatory year were extracted from the calculated daily effective temperatures.

Basis of Preparation | Transmission Category Analysis RIN 2016-17 37
The temperatures at 10% and 50% probability of exceedance were derived from the annual minimum effective temperatures for the period from 1970 to current regulatory year.
Daily maximum demand has been taken from metering data and effective temperature data has been taken from previous calculations for weekdays for current regulatory year.
The assumption has been made that demand of the major industrial companies and Basslink flow are not dependent on weather, and this load has not been forecast to change with the 10% or 50% probability of exceedance.
Weather adjustments for winter and summer (seasons) have been done separately. December to March are considered summer months. June to September are considered winter months.
The difference between the probability of exceedance temperature and the lowest of the daily effective temperature or the historic maximum of annual lowest effective temperatures has been multiplied by the load sensitivity to determine the total change in demand for the probability of exceedance.
(d) Use of estimates
No estimations have been required in the collation and presentation of this information. Information is based on actual historic information, historical accounting records or other records used in the ordinary course of business.
(e) Compliance with financial reporting framework
Non-compliance
There has been no non-compliance with the financial reporting framework.
Reason for non-compliance
Not applicable.
Changes in accounting policies
Changes in accounting policies are not applicable for the maximum demand information requirements.

38 TasNetworks
Template 5.4 Maximum demand and utilisation at spatial level
Table 5.4.1 Non-coincident and coincident maximum demand
(a) Consistency of information with the requirements of the RIN
Information has been provided regarding maximum demand and utilisation at the spatial level in accordance with the definitions included within the RIN.
(b) Source of information
Connection Point Rating
Information has been sourced from the asset management information system.
Where ratings change with season (transmission lines for instance) the rating that applies at the relevant season is used.
The substation MVA ratings provided are based on ‘cyclic rating’ as required by the RIN. Substation ratings are typically based on nameplate rating from the equipment manufacturer. As TasNetworks does not currently have thermal models of the transformer loading capacity the cyclic ratings provided are a 20% increase of nameplate continuous rating. It is noted that all connection points have been provided with cyclic loadings details including those not owned by TasNetworks (ie. Comalco and Temco).
For operation of transmission lines, TasNetworks uses dynamic line ratings based on real time wind speed, temperature and conductor tension monitors. However, for planning studies, TasNetworks uses static (winter and summer) ratings based on ‘normal operating conditions’. Normal operating conditions for transmission line planning are 25°C and 0.5 m/sec wind speed for summer and 15°C and 0.5 m/sec wind speed for winter. Where applicable the templates are populated with static ratings of transmission lines.
Raw adjusted maximum demand
Information has been sourced from the metering and billing system. There are no identified temporary load transfers in the network.
Date and time period maximum demand occurred
Information has been sourced from TasNetworks’ metering and billing system.
Winter/summer peaking
Information has been sourced from TasNetworks’ metering and billing system.
Embedded generation
TasNetworks does not have information on historical embedded generation data downstream of connection points.
Weather corrected maximum demand – 10% or 50% probability of exceedance
Historical information has been sourced from the metering and billing system.
Weather data has been sourced from the Bureau of Meteorology.
(c) Methodology applied to determine information, including assumptions made
Raw adjusted maximum demand
Information has been sourced from TasNetworks’ metering and billing system.
Weather Corrected maximum demand is derived based on the following methodology and assumptions:

Basis of Preparation | Transmission Category Analysis RIN 2016-17 39
Based on historic daily maximum and minimum temperatures obtained from Bureau of Meteorology, daily effective temperatures have been calculated in accordance with the definition provided by NIEIR.
Annual minimum effective temperatures for the period from 1970 to current regulatory year were extracted from the calculated daily effective temperatures.
The temperatures at 10% and 50% probability of exceedance were derived from the annual minimum effective temperatures for the period from 1970 to current regulatory year.
Daily maximum demand has been taken from metering data and effective temperature data has been taken from previous calculations for weekdays for the current reporting period.
The assumption has been made that demand of the major industrial companies is not dependent on
weather, and this load has not been forecast to change with the 10% or 50% probability of exceedance.
Weather adjustments for winter and summer (seasons) have been done separately. December to March are considered summer months. June to September are considered winter months.
Weather adjustments for each connection point have been done separately, and where possible the closest weather station data have been utilised.
Weather adjustments for state total demand is based on temperature data in Hobart only.
The difference between the probability of exceedance temperature and the lowest of the daily effective temperature or the historic maximum of annual lowest effective temperatures has been multiplied by the load sensitivity to determine the total change in demand for the probability of exceedance.
(d) Use of estimates
No estimations have been required in the collation and presentation of this information. Information is based on actual historic information, historical accounting records or other records used in the ordinary course of business.
(e) Compliance with financial reporting framework
Non-compliance
There has been no non-compliance with the financial reporting framework.
Reason for non-compliance
Not applicable.
Changes in accounting policies
Changes in accounting policies are not applicable for the maximum demand information requirements.


Tasmanian Networks Pty Ltd