Embed Size (px)
Citation preview

Biochimica et Biophysica Acta 1838 (2014) 2882–2898
⁎
ofTe
Contents lists available at ScienceDirect
Biochimica et Biophysica Acta
j ourna l homepage: www.e lsev ie r .com/ locate /bbamem
Translocation mechanism of P-glycoprotein and conformational changesoccurring at drug-binding site: Insights from multi-targetedmolecular dynamics
Rameshwar Prajapati, Abhay T. Sangamwar ⁎Department of Pharmacoinformatics, National Institute of Pharmaceutical Education and Research (NIPER), Sector-67, S. A. S. Nagar, Punjab, India
Corresponding author at: Department of PharmacoinfPharmaceutical Education and Research (NIPER) S.A.S. Nl.: +91 172 2214682.E-mail address: [email protected] (A.T. Sangamwar).
http://dx.doi.org/10.1016/j.bbamem.2014.07.0180005-2736/© 2014 Elsevier B.V. All rights reserved.
a b s t r a c t
a r t i c l e i n f oArticle history:Received 13 February 2014Received in revised form 3 July 2014Accepted 8 July 2014Available online 25 July 2014
Keywords:P-glycoproteinMulti-targeted molecular dynamicsTranslocation mechanism
P-glycoprotein (P-gp) iswell known formultidrug resistance in drug therapy. Its over-expression results into theincreased efflux of therapeutic agents rendering them inefficacious. A clear understanding of P-gp effluxmecha-nismand substrate/inhibitor interactions during the course of efflux cyclewill be crucial for designing effective P-gpinhibitors, and therapeutic agents that are non-substrate to P-gp. In the present work, we have modeled P-gp inthree different catalytic states. These models were utilized for elucidation of P-gp translocation mechanism usingmulti-targeted molecular dynamics (MTMD). The gradual changes occurring in P-gp structure from inward opento outward open conformation were sampled out. A detailed investigation of conformational changes occurring intrans-membrane domains (TMDs) during the course of catalytic cycle was carried out. Movements of each TM he-lices in response to pronounced twisting and translatorymotion of NBDs were measured quantitatively. The role ofintracellular coupling helices (ICHs) during the structural transition of P-gp was studied, and observed as vital linksfor structural transition. A close observation of displacements and conformational changes in the residues liningdrug-binding pocket was also carried out. Further, we have analyzed the molecular interactions of P-gp sub-strates/inhibitors during the P-gp translocation to find out how stable binding interactions of a compound atdrug-binding site(s) in open conformation, becomes highly destabilized in closed conformation. The study revealedstriking differences between the molecular interactions of substrate and inhibitor; inhibitors showed a tendency tomaintain stable binding interactions during the catalytic transition cycle.
© 2014 Elsevier B.V. All rights reserved.
1. Introduction
In 1976, Ling and Juliano introduced a permeability glycoprotein(P-glycoprotein, P-gp) that efficiently “pump” substrates out of tumorcells through an ATP-dependent mechanism in an unidirectionalfashion [1]. P-gp is a member of ATP-binding cassette (ATP) transporterproteins, also known as ABCB1 or MDR1. It is expressed at cellular leveland function as xenobiotic monitor protecting cells from toxicants [2].Over-expression of P-gp is associatedwith increased efflux of therapeuticagents from their site of action. Thus, its over-expression has resulted inthe reduced efficacy of many therapeutic agents like anticancer agents,antiviral agents, calcium channel blockers, neuroleptics, antiarrythmics,antimalarials and antifungals [3]. Moreover, substrate promiscuityconfers this protein an abnormal ability to effluxout chemically unrelated
ormatics, National Instituteagar, Punjab 160 062, India.
drugs. P-gp effluxes out substrates ranging from approximately 300 to4000 Da in mass, for instance mitomycin (334 Da), amisulpride(362 Da), flupheanzine (437 Da), daunorubicin (527 Da), docetaxel(807 Da), rapamycine (914 Da), and cyclosporine (1202 Da) [4–6].
P-gp has 1280 amino acid residues, constituting a molecular massof approximately 170 kDa. Structurally, P-gp is a single polypeptidecomprising of two homologous halves; each consisting of a trans-membrane domain (TMD) and a nucleotide binding domain (NBD).The two homologous parts are separated by an intracellular linkerregion of about 60 amino acid residues. Each TMD consists of sixmembrane spanning helices arranged in a specific pattern. Both TMDsare arranged together to form a large highly hydrophobic cavity thatcould accommodatemultiple substrates. TheNBDs are highly conservedregions, and are sites of ATP binding/hydrolysis [7–9].
P-gp has been crystallized in different catalytic forms from differentorganisms, but the crystal structure of human P-gp is not yet available.Recently, human mitochondrial P-gp crystal structure has beenpublished in complex with nucleotide analogs [PDB IDs: 4AYT (rodform A), 4AYX (rod form B), 4AYW (plate form)], and in a ligand-freeapo form [PDB ID: 3ZDQ] [10]. The bacterial P-gp crystal structureswith relatively good resolution reported prior to 2007 were Sav1866(Staphylococcus aureus transporter) and MsbA [11,12]. These bacterial

2883R. Prajapati, A.T. Sangamwar / Biochimica et Biophysica Acta 1838 (2014) 2882–2898
crystal structure templates were widely used for homologymodeling ofhuman P-gp. MsbA crystallographic structure was used to modelhuman P-gp in open conformation (drug-binding cavity open to intra-cellular space, NBDs far apart). Sav1866 crystallographic structure wasutilized to model closed conformation (drug-binding cavity open toextracellular space, NBDs in close proximity). The three murine P-gpcrystallographic structures [13] (PDB IDs: 3G5U, 3G60 and 3G61) pub-lished by Aller et al. in 2009, were promising templates for modelinghuman P-gp in open conformation. However, in a recently publishedCaenorhabditis elegans P-gp crystal structure [14], Jin et al. have pointedout significant register errors in TM3, TM4 and TM5 regions in themurine P-gp crystallographic structure (corrected structure has beenrecently published [15]). Corrections in these errors are relevant to theidentification of drug-interacting amino acids and an accurate definitionof the NBD–TMD interface. Thus, the model built from murine P-gp isnot much reliable for substrate binding studies. However, the crystallo-graphic structure of C. elegansP-gp,with a resolution of 3.4 Å, shares lesssequence identity (49%) to human P-gp as compared to that of murineP-gp (87%), but the similarities between their amino acid sequencesand functional properties suggest that the structure of C. elegans P-gpis a reasonable starting point for substrate binding studies and mecha-nistic understanding of human P-gp [14].
Molecular dynamics studies have been predominantly used forelucidation of translocation mechanism and substrate binding of P-gp.Detailed depictions of ATP hydrolysis mechanisms and conformationalchanges taking place in response to hydrolysis were reported fromMD studies on isolated NBDs [16–26]. Furthermore, full-length ABCtransporter molecular dynamics simulations [27–36] gave insightsinto the conformational changes in TMDs and substrate binding siteduring substrate translocation. Recently, using MD studies researchershave reported the effect of surrounding environment on the structureand function of P-gp [37] and importance of linker region in the stabilityof P-gp structure [38]. However, inmost of these studiesmurine crystal-lographic structure was used as template for human P-gp modelbuilding, which raises some dubiety of these studies regarding registererror in murine P-gp structure.
In the present study, we have employedmulti-targetedmoleculardynamics (MTMD) technique to trace out catalytic transition cycle ofP-gp efflux pump. The technique employs addition of an extra termto the energy function based on the mass-weighted root meansquare deviation of a set of atoms in the current structure comparedto the reference structure. Using MTMD, multiple reference struc-tures can be specified through which the specified structure willmove. The present structure is fitted to the target structure by theapplication of a force vector calculated to decrease the RMSD be-tween the two structures.
Human P-gp was modeled in three different catalytic states; inwardopen (IO) (NBDs far apart), intermediate open (IIO) and outward open(OO) (NBDs in close proximity). Inward open catalytic structure ofhuman P-gp was taken from our previously reported model developedusing C. elegans P-gp crystal structure as a template [39]. The othertwo catalytic states; intermediate inward open and outward openweremodeled using humanmitochondrial P-gp and Sav1866 P-gp crys-tal structures as templates, respectively. The three catalytic structureswere subjected to MTMD simulation to gain valuable insights into theP-gp efflux mechanism. In-depth analysis of shifts in TMDs was carriedout during the course of catalytic cycle. Quantitative measurement ofmovement of NBDs and ICHs was performed. The stretching of TMs incorrespondence with movement of intracellular coupling helices(ICHs) was also noticed. A detailed analysis of conformational changesoccurring at drug-binding site and, the relative changes in distanceand angles of drug-binding residueswas carried out. A relation betweenthe conserved apical interactions and the twisting movement of NBDswas noticed. Hydrophobic substrate gates were also observed duringMTMD simulations. Furthermore, MTMD simulations were carried outwith known substrates and inhibitors of P-gp to find out the relative
difference in their binding pattern and the motion path they followswhen efflux out by P-gp. A clear difference was noticed betweensubstrates and inhibitors interactions during the course of P-gp structuraltransition. Most of the results well correlatedwith large body of reportedbiochemical and biophysical data giving substantial clues to hypothesizeP-gp efflux mechanism.
2. Methods
2.1. Homology modeling
Human P-gp homology model in IO catalytic state was utilized fromour previous study. C. elegans P-gp crystallographic structure was takenas a template to model IO catalytic state. Human mitochondrial P-gp(PDB ID: 4AYT) and Sav1866 P-gp crystal structures were usedto model IIO catalytic state and OO catalytic state of human P-gp,respectively. The amino acid sequences of human P-gp, humanmito-chondrial P-gp and Sav1866 P-gp were retrieved from UniProtKB/TrEMBL database, primary accession numbers P08183, Q9NRK6 andQ99T13, respectively. Sequence alignment was performed on ClustalW(Figs. S1 and S2), using a gap penalty of 10 and a gap extension penaltyof 0.05. Subsequently, homology modeling of human P-gp wasperformed on MODELLER 9v8. The linker region was not modeled.The initially generated models were evaluated by Ramachandranplot and Errat plot using PROCHECK program in SAVES server. Theiterative loop refinement and energy minimization were performedto refine the obtained homology model.
2.2. Induced fit docking
2.2.1. Preparation of model and ligands for the IFD protocolThe 3D structures of the P-gp substrates and inhibitors were built on
Sybyl7.1 software package. All 3D structures wereminimized by Powellmethod. The minimization was terminated when the energy gradientconvergence criteria of 0.05 kcal/mol ∗ Å was reached or 2000 steps ofminimization cycle were exceeded. Table S1 shows the list of substratesand inhibitors used in docking experiments.
Protein preparationwizard of Schrödinger suite 9.0.211was used forstructural preparations of P-gp homology model. The protein prepara-tion includes the addition of hydrogen atoms, optimization of hydrogenbonding networks, and minimization of protein to RMSD 0.30 Å, usingOptimized Potential for Liquid Simulations (OPLS) 2005 force field.The selected ligands were prepared in LigPrep and minimized usingOPLS 2005 force field.
2.2.2. Induced-fit docking protocolThe IFD protocol asmentioned in IFDmanual of Schrödinger 9.0.211,
was followed. [40,41] In brief, Schrödinger suite uses two modules,Glide and Prime to perform IFD. The ligand flexibility and the receptorflexibility are accounted by Glide and Prime, respectively. IFD was per-formed in following steps. (i) The receptor was minimized applyingconstrain (Glide protein preparation, refinement only) with an RMSDcutoff of 0.18 Å. (ii) A softened potential (van der Waals radii scaling)was used for initial Glide docking of each ligand. Twenty poses perligand that had a Coulomb–vdW score less than 100 and an H-bondscore less than 0.05 were retained. (iii) Each protein–ligand complexwas subjected to one round of Prime side chain prediction. In ourstudy, residues of active site(s) were defined instead of consideringresidues within the cutoff distance from the ligand. (iv) The same setof residues and the ligand for each protein–ligand complex poseswere minimized by Prime. Each pose of receptor structure reflected aninduced fit to the ligand structure and conformation. (v) The protein–ligand complexes within a specified energy of the lowest-energystructure (default 30 kcal/mol) were subjected to Glide re-docking.The ligand was then rigorously docked, using default Glide settings,

2884 R. Prajapati, A.T. Sangamwar / Biochimica et Biophysica Acta 1838 (2014) 2882–2898
into the induced-fit receptor structure.(vi) Estimation of the bindingenergy (IFD Score) for each output pose.
Residues reported in experimental studies [42–45] that have beenimplicated in drug bindingwere specified for active site grid generation(listed in supplementary information, Table S2). The ligand dockingcalculationswere done on the standard precisionmode of Glide software.
2.3. Molecular dynamics simulations
The generated homologymodelswere embedded into POPC lipid bi-layer. CHARMM-GUI Lipid Builderwas used to embed protein structuresinto lipid bilayer. The coordinates of lipid bilayer were taken from OPMdatabase. The lipid–protein systems were solvated using TIP3P watermodel and neutralized by the addition of counter ions. The CHARMM-GUI generated PDB files were reformatted to files that conform to theLipid11 force field naming convention using charmmlipid2amber.xscript. AMBER99SB force field was used for the parameterization ofprotein and Lipid 11 force field was used for the parameterization ofPOPC lipid. The final system of each membrane embedded homologymodel contained 340 lipid molecules, 44,313 solvent molecules, Mg2+
ion, ATP, ADP, Pi, 14 Na+ and 26 Cl− ions, constituting 1,96,939 totalnumber of atoms (Figs. S3).
Minimization of the protein–lipid systems was carried out in twosuccessive steps. Firstly, the proteinwas restrainedwith a force constantof 50 kcal/mol/Å2, and only solvent and lipid phase were minimizedwith 500 cycles of each steepest descent and conjugate gradientmethods. In the second step, whole system was minimized with500 cycles of both steepest descent and conjugate gradient. The systemswere gradually heated to 310 K on NVT ensemble for 50 ps, where theprotein was restrained with a force constant of 20 kcal/mol/Å2.Equilibration was performed on NPT ensemble at 310 K temperatureand 1 atm pressure for 50 ns with a restraint force constant of20 kcal/mol/Å2 on the protein. For entire simulation the step sizewas kept 2 fs. During the MD run all bonds containing hydrogenatoms were constrained using SHAKE algorithm. Langevin thermostatand barostat were used for temperature and pressure coupling. Thenon-bonded cutoffwas kept at 8 Å, and long-range electrostatic interac-tions were treated by the Particle–Mesh Ewald (PME) method.
2.4. Multi-targeted molecular dynamics simulations
All MTMD simulations were carried out on AMBER 12. The equili-brated protein–lipid systems were subjected to MTMD simulations.The IO catalytic transition state was taken as initial structure and, IIOand OO catalytic states of P-gp were taken as reference structures. Theroot mean square deviation between IO and IIO was 8.69 Å and thatbetween IO and OO was 12.46 Å. The IO was first targeted to IIO andthen to OO transition state to trace out the catalytic cycle. The presentstructure was fitted to the target structure by the application of a forcevector calculated to decrease the RMSD between two structures. Anadditional term to the energy function based on the mass-weightedroot mean square deviation of a set of atoms in the current structurecompared to a reference structure is added by the MTMD simulationpackage of AMBER 12.
Prior to MTMD simulations of protein–ligand systems, the ligandfrom best docked pose of each protein was extracted. The atomiccharges for ligands were derived with AM1-BBC method implementedin Antechamber program of AmberTools. General amber force field(GAFF) was used to generate missing parameters of ligands usingParmchk module of Antechamber. The protein–ligand system wasthen embedded into POPC lipid bilayer and subjected to moleculardynamics simulation, following the similar protocol mentioned aboveto get an equilibrated structure for MTMD simulation. The simulationstudies consisted of total 17 systems (16 with ligand and one initialwithout ligand). Each system was subjected to 50 ns of equilibration
and 50 ns of MTMD simulation. Ptraj module of Amber tools, VMD,Pymol and xmgrace were used for trajectory analysis.
3. Results and discussion
3.1. Models of catalytic transition structures
P-gp efflux pump undergoes a large body of structural transforma-tion from fully open inward (NBDs are far apart) to fully open outward(NBDs in close proximity) conformation state. The crystal structureof P-gp is available in different catalytic forms. In this study, we havemodeled human P-gp in three different catalytic states utilizing crystal-lographic structural templates of C. elegans P-gp, human mitochondrialP-gp and Sav1866 P-gp. Though, both C. elegans P-gp and humanmitochondrial P-gp crystal structures (PDB ID: 4AYT) are in inwardopen conformation, the distances between their NBDs with respect toC-α atom of conserved glutamate residues (E556 and E1201) are 39.5Å and 26.5 Å, respectively. The respective distance in Sav1866 P-gp is14.3 Å. Thus, mitochondrial P-gp could be utilized as an intermediatestructure between inward open and outward open state for studyingthe catalytic transformation of P-gp. Moreover, the model generatedfrom C. elegans P-gp was used as starting structure because it showedmaximum consistency with reported biochemical and biophysicaldata [42–59] (discussed in detail further in text).
Themodel of human P-gp in inward open state built using C. elegansP-gp as template was taken from our previously reported model [39].The models of human P-gp in intermediate inward open state andoutward open state were generated using mitochondrial P-gp andSav1866 P-gp as templates, respectively. The sequence identity ofhuman P-gp with mitochondrial P-gp is 41% and that with Sav1866 is17%. Sequence alignment was performed on ClustalW (Figs. S1 andS2). ClustalW alignments were used to generate homology modelsusing MODELLER 9v8 software following similar procedure as reportedin our previous study [39]. 100 structures were generated and ten bestmodeled structures were selected on the basis of dope score, andRMSD with respect to crystal structure. The quality of these modelswas further analyzed with Errat plot and their dihedral angledistributions were analyzed using Ramachandran plot (Figs. S4 andS5). Ramachandran plot of human P-gp homology model generatedusing mitochondrial P-gp as a template (Fig. S4) showed two residuesin the disallowed region. The overall quality factor of homology modelwas 94.91% in Errat plot. Ramachandran plot of human P-gp homologymodel generated using Sav1866 as a template (Fig. S5) showed fourresidues in the disallowed region. The overall quality factor of homologymodel was 89.91% in Errat plot.
3.2. MTMD
MTMD simulations were performed to incur a better understandingof P-gp translocation mechanism. The technique could be utilized totransform inward open structure of P-gp to outward open throughspecified intermediate structures. MTMD is a unique technique inwhich important intermediate catalytic structures could be sampledout, as the P-gp structure transforms from IO to OO state. A quantitativeanalysis of conformational changes occurring at drug-binding site couldbe performed and a better understanding of conformational changesresponsible for the loss of stable binding interaction of substrate in OOstate could be obtained.
The human P-gp homology model generated from C. elegans P-gptemplate was taken as starting structure for MTMD simulation. The IIOstate and OO state models generated using human mitochondrial P-gpand Sav1866 P-gp templates, respectively, were taken as targetedstructures. The coordinates of IO state model were forced to IIO stateand then to OO state using residue mask and applying force constantproportional to difference between RMSD of reference and targetstructure. During simulation it was observed that the NBDs gradually

2885R. Prajapati, A.T. Sangamwar / Biochimica et Biophysica Acta 1838 (2014) 2882–2898
approach each other and finally dimerize in OO state forming acatalytic dyad. When viewed from intracellular side, stretching ofTM helices can be noticed in correspondence to NBD movements. Itappeared as the NBDs were pushing TM helices in a specific pattern,finally exposing the drug-binding region to extracellular space. Fromextracellular view, it can be clearly observed how pliers like theaction of NBD result in opening of TMDs in a specific pattern; notthe two TMDs move apart, rather parts of each move apart. TheTM1 and 2, of TMD1 and TM9, 10, 11, and 12 of TMD2 move apartfrom TM3, 4, 5, and 6, of TMD1 and TM7 and 8, of TMD2 (see supple-mentary information, Movie 1). The MTMD trajectory was quantita-tively analyzed for shifts in TMDs, ICH movement in conjunctionwith NBDs, and stretching in TM helices corresponding to ICH andNBDmovements. The placement of ATP-Mg2+-H2O at NBDs support-ed alternating site mechanism of ATP hydrolysis [60]. As per recentstudy of Oldham and Chen [61] that strongly supported the generalbase ATP hydrolysis mechanisms, ATP-Mg2+-H2O complex wasfirst placed in NBD1 and ADP and Pi at NBD2. The structure wasstable and complex formed stable binding interactions with E556.Subsequent MD trials were also conducted placing ATP-Mg2+-H2Ocomplex at both NBDs and, ATP-Mg2+-H2O complex at NBD2 andADP at NBD1, but none gave stable conformation. Similar observa-tions were also reported in another simulation study conducted byWise [62]. All further simulations were carried out placing ATP-Mg2+-H2O at NBD1 and, ADP and Pi at NBD2. Moreover, the confor-mational changes occurring at drug-binding site during the course ofsimulation, and the corresponding distance and angular changes indrug-binding residues were also analyzed. Interestingly, we noticeda correlation between conserved apical interactions and NBD move-ment. The hydrophobic substrate gates were also observed duringthe course of MTMD simulation. Furthermore, MTMD simulationsof substrates and inhibitors gave important insights into their molec-ular interaction differences during the structural transition of P-gp.
3.2.1. Movement of NBDs and intracellular coupling helices (ICHs)Before discussing the movements of NBDs during MTMD simula-
tions, it is worthwhile to mention the communication links betweenNBDs and TMDs. There is a single physical linkage between each NBDand TMD, viz. a loop region (D398-K418) connecting TM6 of TMD1with NBD1 and another loop region (K1064-G1083) connecting TM12of TMD2 with NBD2. The other possible communications are non-bonded interactions between NBD and ICH. Out of four ICHs, the ICH1and ICH4 form a ball and socket like joint with NBD1 and, ICH2 andICH3 form ball and socket like joint with NBD2 (Fig. 1). These ICH formsconserved salt bridge and H-bonding interactions with corresponding
Fig. 1. Arrangement of ICHs on NBDs, ICH2 and ICH4 are arranged in the grove formed bylobe 1 [ATP binding core subdomain (blue)+beta-subdomain (wheat)] and lobe 2 [helicalsubdomain (red)]. The color coding of other conserved region are: A-loop—green,Walker-A—cyan, P-loop—orange, Signature/C-motif—yellow, Walker-B—violet.
residues in NBDs. ICH1 is a short helix between TM2 and TM3 that insertinto the groove of NBD1 near Walker-A region and form close contactwith A-loop. ICH3, a short helix between TM8 and TM 9, position itselfinto the groove of NBD2. ICH2 and ICH4 are short helices between TM4and TM5, and TM10 and TM11, respectively. These helices are insertedinto the groove of opposite half NBD formed by the three subdomains;ATP binding core subdomain (blue), beta-subdomain (wheat) and helicalmotif (red) (Fig. 1). A detailed list of ICH residues interacting withdifferent parts of NBD and TM helices is provided in Table S3.
As the simulation progressed the separation between NBD1 andNBD2, measured with respect to conserved glutamate residues (Glu556 and Glu 1201) reduces from 39 Å in IO state to ~14 Å in OO state.Interestingly, it was observed that the NBDs do not follow a straightline path as they approach each other rather they rotate with respectto each other. Fig. 2 represents themovement of NBD during the courseof MTMD simulation. In the initial stage of IO to IIO transition the NBDsshowed a twisting movement.
The ICHs showed a concerted movement with NBDs. As ICH movedalong with NBD it was noticed that most of the conserved interactionsbetween NBD and ICH maintained during IO to IIO state transition ofP-gp structure. The conserved salt bridge interactions between Arg905 (ICH4), Asp 164 (ICH1) and Tyr 444 (NBD1), and that in betweenArg 262 (ICH2), Asp 805 (ICH3) and Tyr 1087 (NBD2), disruptedgradually as the simulation progressed from IIO to OO catalyticstate (Fig. 3). This was due to the rotation of ICH1 and ICH4 by~20○and ~82○, respectively, about their horizontal axis (Fig. 4A and B).ICH3 and ICH2 also showed a rotation of ~30○ and ~46○, respectively,about their horizontal axis (Fig. 4). During the course of simulation theICH2 and ICH4 also showed a pivot of ~30○ about their vertical axis.Fig. 3 depicts the ball and socket-like movement of ICHs during thecourse of simulation. Initially, in IO state the ICHs were well fitted intothe corresponding grooves of NBDs and as the simulation progressedthey rotated into the groove occupying their original position. Thiscombined rotator and translator movements of ICHs prompted us toinvestigate the relative effects of their movements on the connectedTM helices.
3.2.2. Rearrangements in TMDsThe rearrangements in TMDs resulted not only due to translatory
motion of NBDs, but also due to rotatory motion of NBDs. In depth anal-ysis revealed that the separation of TMDs occurs in a specific pattern,which resulted due to the arrangement pattern of TMs (Fig. 5),i.e., (i) TM4 and 5 of TMD1 interact with NBD2 and TM10 and TM11of TMD2 interact with NBD1, (ii) TM6 and TM12, which form physicallinkage with NBDs, connects to their respective NBD intersecting theinverted “V” formed by TM3 and TM4 (in case of TM6), and TM9 andTM10 (in case of TM12). Thus, as the NBD moves close, accompanied
Fig. 2.Distance between two NBDsmeasure with respect to distance between Cα-atom ofconserved residues E556 and E1201.

Fig. 3. The conserved salt bridge interactions between Arg 905 (ICH4), Asp 164 (ICH1) and Tyr 444 (NBD1), and that in between Arg 262 (ICH2), Asp 805 (ICH3) and Tyr 1087 (NBD2).These interactions remained intact till IIO conformational state (4 ns), then disrupted gradually as the simulation progressed from IIO to OO catalytic state.
2886 R. Prajapati, A.T. Sangamwar / Biochimica et Biophysica Acta 1838 (2014) 2882–2898
with their twisting motion, the stretching of these TM results into theopening of the TMDs in a plane perpendicular to themovement of NBD.
A quantitative investigation of movements in TMs helices was per-formed. The distance between adjacent TMs, and TMs facing eachother in the two TMDs were plotted during the course of simulation.Figs. 6, 7 and 8 (also see supplementary Fig. S6 for the top view fromextracelluar side) depict the separation between different TMs duringthe IO to OO conformational change of P-gp. Three types of distanceplot were plotted: (i) distance between top residues (residue towardextracellular region) of the TM helices (ii) distance between bottomresidues (residue toward NBD on helix) of TM helices and (iii) distancebetween center of mass (COM) of the TM helices. The distance of TM1was measured with respect to TM2 and TM7, as TM2 is adjacent toTM1 and TM7 was in front of TM1. The initial distance between W55(bottom residue, TM1) and V711 (bottom residue, TM7) was ~64 Å inIO state, which changed to ~51 Å in OO state (Fig. 6A). Similarly, the dis-tance between E86 (top residue, TM1) and V736 (top residue, TM7)changed from ~16 to 35 Å. In contrast, when the COMdistance between
TM1 and TM7 was plotted, no noticeable change was observed, thisindicated that the TMs moved around a fixed point analogous to alever/pry-like action. The distance between TM1 and TM2 decreased,and the top residues (E86, TM1 and L107, TM2) moved from ~14 Å to7 Å, while the bottom residues (Y55, TM1 and R157, TM2) movedfrom ~32 Å to 27 Å (Fig. 6B). Similar trend was noticed for TM1–TM2COM movement (moved closed by ~4 Å), indicating that TM1 movedalong with TM2 in same direction. A large body of conformational rear-rangement was noticed in case of TM2 and TM3, the helices that werealso connected to ICH1. The top residues (L107, TM2 and R210, TM3)moved apart from ~23 Å to 33 Å, while the bottom residues (R157,TM2 and V158, TM3) came close from ~23 Å to ~17 Å (Fig. 6C). Anapproximate separation of 4 Å was observed between COM of bothhelices. This particular rearrangement was only possible if there was atwisting motion along with translatory motion between two helices;implicating the angular rotation of ICH1 and twisting ofNBDs. Themove-ment between TM7 and TM8 was similar to that of TM1 and TM2. Both,TM7 and TM8 showed concerted movement in same direction, the

Fig. 4.Changes in angles between Cα-atoms of ICH residues andNBD residues. (A) angularrotation between Cα-atoms of ICH2, ICH3 and NBD2 residues Arg 262-Thr 263-Val264(black), Asp 805-Asp 806-Pro 807 (green) and Tyr 1087-Asp 1088-Pro 1089 (red),respectively. (B) angular rotation between Cα-atoms of ICH4, ICH1 and NBD1 residues Arg905-Thr 906-Val 907 (black), Asp 164-Val 165-His 166 (red) and Tyr 444-Asp 445-Pro 446(green), respectively.
Fig. 5. Arrangement pattern of TMs (number shown in rectangular box) and type oflinkage between TMs and NBDs. Solid blue line indicate physical linkage via loop regionand dotted red line indicate linkage through non-bonded interactions. The image incartoon representation shows how inverted V like structure formed by TM3 and TM4,and TM9 and TM10 is intersected by TM6 and TM12, respectively.
2887R. Prajapati, A.T. Sangamwar / Biochimica et Biophysica Acta 1838 (2014) 2882–2898
distance between top residues (V736, TM7 and T745, TM8), bottomresidues (V711, TM7 and Q797, TM8) and COM changed by ~2 Å(Fig. 7A). Similar to TM2 and TM3 connected to ICH1, TM8 and TM9were connected to ICH3, which form non-bonded contacts withNBD2. The distance between COM and bottom residues (Q797, TM8and L812, TM9) changed by ~3 Å, whereas the distance betweentop residues (T745, TM8 and W853, TM9) increased by ~15 Å(Fig. 7B). This implicated the angular rotation of ICH3 and twistingof NBDs, similar to that noticed in case of TM2 and TM3.
As per the reported experimental data, TM2, TM3, and TM8 do notparticipate in ligand binding and their conformational changes ob-served during IO to OO transition of P-gp structuremay not affect ligandbinding, but their movement and conformational changes had a majorcontribution in TMD rearrangement cascade. The residues on TM4,TM5, and TM6 of TMD1, and TM9, TM10, TM11 and TM12 of TMD2that face toward the hydrophobic cavity of P-gp structure in IO statehave been reported to participate in ligand binding (list of these resi-dues is provided in supplementary information, Table S2). Further, themovements of these TMs were analyzed. During the IO to OO catalyticstate transition of P-gp structure, prominent changes in distance andconformations were observed between T4 and TM10, TM5 and TM11,and TM6 and TM9. Initially, the bottom residues (A259, TM4 andV905, TM10) of TM4 and TM10 had a separation of ~44 Å in IO state,which decreased to 22 Å in OO state (Fig. 7C). Similarly, the bottomresidues of TM5 and TM11 came close by ~22 Å (Fig. 8A). Moreover,TM4 and TM5 and TM10 and TM11 are connected to ICH2 and ICH4,
respectively; theirmovements could be directly correlated to themove-ments of both the ICHs. TM6, which is directly connected to NBD1, andTM9 connected to ICH3 also showed a decrease from 45 Å to 25 Åbetween their bottom residues (I368, TM6 and L812, TM9) (Fig. 8B).TM6 and TM12 are TM helices physically connected to NBD1 andNBD2, respectively, and their movements directly correspond to themovements in NBDs. The initial separation between bottom residues(I368, TM6 and K1012, TM12) of these TMs was ~52 Å in IO state,which gradually decreased to ~38 Å in OO state (Fig. 8C). A similarstudy performed byWise [62] using muring, Sav1866 and MsbA as tar-get structures provides valuable insights into P-gp efflux mechanismand TMD rearrangement. We further tested our simulation protocolby simulating similar targets. The results obtained were similar tothose reported by Wise. This further validated our simulation protocol.Fig. S7 provide a comparison of both MTMD simulations. However,both the simulations provide similar insights in TMD rearrangement,but the murine crystallographic structure has been reported to havecertain register errors which may raise concerns regarding the drug-binding residues lining TM4 and TM5 (discussed further in text).
On collective observation of distance plots between the TM helicesinvolved in ligand/drug binding, it was inferred that in most of thecases the change in distance between the top residues and COM wasless pronounced as compared to the bottom residues. Thus, therewere nomajor displacements in the upper half of these helices as com-pared to lower one. Therefore, it indicates that along with displace-ments, the conformational changes in the residues in these TMsmajorly contribute to the loss of ligand/drug binding at drug-bindingsite in OO state.
Further, to analyze the displacement of individual TMhelix, RMSD ofeach TM was plotted. Fig. 9 depicts the RMSD plots of TM helices. TheRMSD plots revealed that TM1, TM3 and TM4 of TMD1 (Fig. 9A), andTM9, TM10 and TM12 of TMD2 showed higher RMSD (Fig. 9B).
3.2.3. Conformational changes at DBS and correlationwith biochemical andbiophysical data
Many efforts have beenmade to date to characterize the DBS of P-gp.A significant amount of studies have been performed by Loo andClarke [42–45,49,52,54,55,63], and some other important were thosepublished by Dey et al. [64], Pascaud et al. [65], Shapiro et al. [66] andLugo et al. [67] Loo and Clarke used cysteine or arginine scanningmuta-genesis [49,52] to identify drug-binding residues. In these studies theyidentified seven residues protected by verapamil. A novel approach ofarginine scanning mutagenesis was used by Loo and Clarke to locateresidues in P-gp structure that faced toward DBS. These studies were

Fig. 6. Relative displacements in TM helices from IO to OO structural transition, initial IO conformation is represented as transparent blue ribbon. The adjacent distance versus time plotshows the quantitative data of the corresponding TMhelices duringMTMD simulation. A, B and C represent displacements in TM1 and TM7, TM1and TM2, and TM2 and TM3, respectively.
2888 R. Prajapati, A.T. Sangamwar / Biochimica et Biophysica Acta 1838 (2014) 2882–2898
based on rescuing of P-gp folding upon mutation as the bulky arginineside chain, when present in the drug-binding site, mimicked the rescueof folding of certain mutations by transport substrates. Another, 16residues were identified using dibromobimane studies [44,45,52].Thio-reactive rhodamine B analog and MTS-verapamil studies wereused to identify residues on TM5 and TM6 [55]. On the basis of studiesconducted by Dey et al., Pascaud et al., Shapiro et al. and Lugo et al. itmay be proposed that P-gp has four binding sites. All drug-bindingresidues, those identified by Loo and Clarke, Aller et al. [13], Jin et al.[14] and the authors mentioned above were analyzed for their locationand respective conformational changes in drug-binding site.
The reported studies depicted that the drug-binding residueswere distributed on TM1, TM4, TM5, TM6, TM7, TM9, TM10, TM11and TM12 in the hydrophobic cavity of P-gp. The generated modelwas consistent with these biochemical data. The MTMD trajectorieswere analyzed with the aim to find out the conformational changesand displacements occurring in these drug-binding residues that
rendered loss of stable substrate binding interactions. The movementsof these residues during the course of simulation are shown in supple-mentary information Movie 2. Fig. 10 shows the displacements andconformational changes occurring in the drug-binding residues. Theprogressive changes in the conformation of these residues are indicatedusing color coding (yellow, orange, gray, red and blue; yellow→ orangecorresponds to IO → IIO transition; and orange → gray → red → bluecorresponds to IIO → OO transition). In the initial IO state the drug-binding residueswere facing thehydrophobic cavity andhad anoptimalconformation for substrate binding. As the simulation progressed fromIO to IIO state major displacements in the position of drug-bindingresidues were noticed (Fig. 10). The structural transition from IIO toOO state was themajor transition phase in which substantial conforma-tional changes were noticed that would affect substrate binding. Onviewing the movement of these residues from the intracellular sideone can notice the residuesmove away from central axis, finally becom-ing accessible from extracellular space. On observing the lateral view of

Fig. 7. Relative displacements in TM helices from IO to OO structural transition, initial IO conformation is represented as transparent blue ribbon. The adjacent distance versus time plotshows the quantitative data of the corresponding TM helices during MTMD simulation. A, B and C represent displacements in TM7 and TM8, TM8and TM9, and TM11 and TM12,respectively.
2889R. Prajapati, A.T. Sangamwar / Biochimica et Biophysica Acta 1838 (2014) 2882–2898
the structural transition (shown as magnified images), it was noticedthat the TMs were accompanied by stretching movements. The TMstretching was observed in all TMs but it was more pronounced incase of TM4,−5,−6,−10,−11 and −12. Initially for L65 on TM1 nosignificant displacement was noticed but as the simulation progressesfrom IIO to OO state the conformation of Leu residue changes (orange→ gray → red → blue) and it faces away from hydrophobic cavity.The S222 residue on TM4 clearly indicates that both stretching anddisplacement was observed in TM4 but there was no major change inthe conformation of Ser residue. Similar movements were noticed forI306 on TM5. In case of L339, I340 and F343 on TM6 stretching move-ments were coupled with major conformational changes of theseresidues. The F728 residue on TM7, implicated in verapamil bindingshowed substantial change in the orientation of phenyl ring, whichfinally results in loss of stable interaction in OO state. The residues onTM10 (I868 and G872) showed a large displacement and conformation
change, the Ile residue rotated by ~60° about vertical axis during thecourse of transition from IIO to OO state. The F942 and T945 residueson TM11 also showed a substantial displacement from the initialposition (yellow, IO state) as the structure transformed to OO state.The F942 residue that forms hydrophobic interactions with substrateshowed a high degree of conformational change. In case of TM12,more pronounced conformational changeswere observed. It was clearlynoticed that the residues L975, V981, V982 and A985, which faced thehydrophobic cavity in IO state, rotated along the vertical axis andattained a conformation in OO state that faced away from hydrophobiccavity.
Cysteine scanning mutagenesis experiments performed by Loo andClarke [46,47] on IO state of P-gp structure provide important structuralinformation about the relative position of different parts of the TMdomains. The consistency of the IO state model with these studies hasbeen proven in our previous study [39]. The TM residues that have

Fig. 8. Relative displacements in TM helices from IO to OO structural transition, initial IO conformation is represented as transparent blue ribbon. The adjacent distance versus time plotshows the quantitative data of the corresponding TM helices during MTMD simulation. A, B and c represent displacements in TM5 and TM11, TM6and TM9, and TM6 and TM12,respectively.
2890 R. Prajapati, A.T. Sangamwar / Biochimica et Biophysica Acta 1838 (2014) 2882–2898
been implicated to form disulfide bond upon cysteine mutagenesiswere shown to be located in close proximity in the modeled structure.It was shown using in silico cysteine mutation that the residues ofTM2 (Val 133, Cys 137, Leu 138) and TM11 (Gly 939, Ala 935) hadinter-residue sulfur distance ranged from 3.3 Å to 5.2 Å, which waswithin the prerequisite for disulfide bond formation. Similar inter-actions were shown for TM8 (Phe 766, Phe 770, Phe 771, Gly 774, Phe775) and TM5 (Gly 300, Ile 299, Ile 297, Asn 296, Ile 293) residues.
Loo and Clarke also established the experimental evidences impli-cating that the transmembrane helices undergo relative movementduring ATP hydrolysis. In a series of cysteine cross-linking studies [48,51,56] they showed that TM helices 11 and 12, 1 and 11, and 6 and 12formed cysteine cross-linking only if the transporter turned via ATPhydrolysis.
TheMTMD simulation trajectorieswere also analyzed to find out themovement of these TM helices and the residues implicated in cross-
linking studies. The distance plot of these residues is shown in Fig. S8.As the simulation progressed from IO to IIO conformation state, theseparation between these residues increased, maximum separationwas noticed at IIO state (at ~25 ns). Further, as the simulationprogressed from IIO to OO state, the transition showed minimumseparation between these residues and finally the separation increasedas the OO conformation state was achieved (at ~40 ns).
In a recent study, Loo and Clarke [58] provided biochemical evidencethat the structure of ICH2 in human P-gp resembles the crystal structureof C. elegans, rather than that of mouse P-gp. The homology model ofhuman P-gp based on mouse P-gp erroneously predicts ICH2 residues(residues Val253–Ala259 and Gly269–Lys272) as loop instead of α-helices. The correct conformation of this region can be modeled usingC. elegans P-gp as template. The major difference between the twomodels is the conserved salt bridge interaction between Glu256 andArg276, which is noticed only in C. elegans-based homology models.

Fig. 9. RMSD versus time plot of TM helices. (A) Plot of TM helices in TMD1, (B) Plot of TMhelices in TMD2.
2891R. Prajapati, A.T. Sangamwar / Biochimica et Biophysica Acta 1838 (2014) 2882–2898
The presence of a salt bridge between Glu256 and Arg276 was found topromote maturation of human P-gp.
The simulation was found consistent with the conserved salt bridgeinteractions between Glu256 and Arg276. Fig. S9 shows the conservedsalt bridge interaction during MTMD simulation. It was noticed duringMTMD simulation that the conserved salt bridge interactions main-tained from IO to IIO structural transition and disrupted when thetransition structure approached closer to OO state.
In another recent study, Loo and Clarke [57] performed drug rescueof P-gp processing mutant experiments containing an arginine at eachposition in TM5. The experiments help to identify positions of residuesfacing the lipid or internal aqueous chamber. Correct orientationof TM5 is critical for P-gp-drug binding in silico experiments, sinceresidues in TM5 (particularly I306) have been implicated to play acrucial role in binding of drug substrates and coupling of drug bindingto activation of ATPase activity [68]. In their study, the authors showedthat the human P-gp homology models based on mouse P-gp predictwrong orientation of I297, G300, A301, L304, A308, and A311 (actuallyface lipid environment, but predicted to face drug-binding pocket),and A295, S298, A302, L305, I306, and S309 (actually face drug-bindingpocket, but predicted to face lipid environment). The developed modelwas found consistent with the position of these residues (Fig. S10).Thus, corroborates the accuracy of structural modeling and suitabilityof performing P-gp substrate/inhibitor binding studies on the developedmodel.
In another recent experiment [69], Loo and Clarke tested the effectsof cross-linking mutant L175C (ICL1)/N820C (ICL3) to determine thedistance between N-terminal and C-terminal half of P-gp that show
high or low ATPase activity. They observed that there was over 10 foldincrease in basal ATPase activity when L175C was linked to N820Cwith cross-linkers predicted to span a distance of less than 20 Å, andpredicted that the ATPase activation switch appears to be turned on oroff when this distance is less than or greater than 20 Å, respectively. Incontext to this study, here in our simulation studies we monitored thedistance between the L175 and N820 with respect to distance betweencatalytic important residue E556 and E1201 and movement of NBDs (avideo in supplementary information, Movie 3 presents the motion ofthese residues and NBDs during the course of simulation). It wasobserved that as the distance between L175 and N820 reducedfrom initial 29 Å to 20 Å the NBDs showed a twisting movementand came closer. At a point where the distance between L175 andN820 was 20 Å the distance between E556 and E1201 was 21 Å (initial,at IO conformation was 39 Å). During this transition phase the NBDscompleted their twisting movement and were properly aligned, readyto form a sandwich dimer thereafter, indicating the possible structuralrearrangement in P-gp that resulted in increased ATPase activitywhen the distance between L175 and N820 decreased below 20 Åseparations. Similar type of NBD movement was also observed byWise [62].
Further, we performed in silico mutation analysis followed byMTMD to get insights into the role of conserved apical interactionsbetween Phe335, Tyr310, Phe314 and Ile218, which is believed to beresponsible for the stability of IO conformation of P-gp structure [14,70,71]. The Phe335 was located at the apex of the drug transportpathway, making van der Waals interactions with Tyr310 and Phe314in TM5, and Ile218 in TM4 (Fig. S11B). Interestingly, it was noticedduring MTMD simulation that the movement of NBDs and formationof their catalytic dyadduringOO catalytic state, are somehowcorrelatedto these conserved apical interactions in P-gp structure in IO catalyticstate. To verify the role of these interactions in P-gp catalytic transfor-mation, these residues were mutated to alanine (Fig. S11C). As a resultthe binding interactions were disrupted. The mutated structures wereagain subjected to MTMD simulation. It was observed that the move-ment of NBDs changed substantially. Figs. S11D and S11E show themovement of conserved Glu residues of NBD before and after mutation,respectively. The twistingmovement of NBDs became less pronounced.The graph in Fig. S11F clearly shows that the separation between theGlu residues increased aftermutation. Thus, resulting into the distortionof catalytic dyad and may result in loss of activity.
Moreover, the hydrophobic substrate gates were also noticed duringthe MTMD simulation. These gates were noticed during IO to IIO tran-sition of P-gp structure. The gates were noticed in the hydrophobicmembrane embedded region of P-gp. A hydrophobic gate with ~18 Åin diameter was noticed between TM1 and TM2 (constituted by resi-dues Ile 60, Val 125 and Ala 128) and another of ~14 Å in diameterwas noticed between TM7 and TM9 (constituted by residues Ala 718,Gly 722, Ala 834 and Ala 841) (Fig. S12). Similar hydrophobic gatesbetween TM1 and TM2 were also noticed by Shintre et al. [10], thoughthe study does not mention any hydrophobic portal between TM7 andTM9. It was noticed during the simulation that the residues Ala 718,Gly 722, Ala 834 and Ala 841 that formed a tight packing close to lipidbilayer in IO conformation gradually move away making an accessportal to the cavity of P-gp. Similar transition was also noticed betweenresidues of TM1 and TM2.
3.3. Induced fit docking and MTMD analysis of substrates/inhibitors
This part of study was conducted with an objective to addressfollowing queries: (i) to figure out is there different binding site forsubstrate and inhibitor, (ii) differences in molecular interactions ofsubstrate and inhibitor, (iii) conformational changes in the key residuesinvolved in ligand binding and how these conformational changesrender instability in ligandbinding, and (iv) effluxmotion path followedby substrates and inhibitors. To confer these objectives, eight substrates

Fig. 10. Conformational changes and displacements observed in drug-binding residues during IO to OO structural transition of P-gp. The figure shows intracellular view of the initial IOconformation state, represented as transparent ribbon (NBDs are not shown). The progressive changes in the conformation of drug-binding residues (magnified lateral view) are indicatedusing color coding (yellow, orange, gray, red and blue; yellow → orange correspond to IO→ IIO transition; and orange → gray→ red → blue correspond to IIO → OO transition).
2892 R. Prajapati, A.T. Sangamwar / Biochimica et Biophysica Acta 1838 (2014) 2882–2898
and eight inhibitors of P-gp were subjected to induced fit docking indeveloped human P-gp homology model. The best docked poses ofsubstrates and inhibitors were then subjected to multi-targetedmolecular dynamics to investigate the changes in molecular interac-tions during the catalytic transition of P-gp.
The IFD protocol was validated as mentioned in the previous work[39] (data not shown). The co-crystallized structure (OSA) was dockedinto C. elegans crystal structure. Interactions and conformation of co-crystallized ligand similar to crystal structure were generated by IFD,forming H-bonding interactions with Thr 1025 and Thr 1028, andhaving an atomic RMSD of 0.68 Å. IFD in human P-gp homologymodel also showed interaction with homologous residues. Further, IFDstudies of knownP-gp substrates and inhibitors (listed in supplementaryinformation Table S1)were performed on human P-gp homologymodel.
The in-depth investigation of IFD poses showed that the substratesand inhibitors formed stable binding interactions with the experimen-tally reported residues. The first row of each entry (labeled as initial)in Table S4 and S5 enlists the residues thatwere in close contactwith re-spective inhibitor and substrate. 3D interaction images of each substrateand inhibitor are provided in Figs. S13–S25. Each substrate and inhibitorformed stable binding interactions with at least three of the experimen-tally reported residues except nifedipine. The docking of co-crystallizedsubstrate and the stable binding interactions of test compounds wellcorrelated with the experimental studies [42–45,49,52,63,64,67]. Thus,the results strongly supported the validity of docking experiments andstructural modeling of human P-gp.
In context to first objective no separate binding sites were observedfor substrate and inhibitor. Two binding sites were noticed viz. oneaccommodated between TM4, TM5, TM6 TM7, TM8 TM9 and TM12
(site 1) (Fig. 11A) and other between TM1, TM2, TM3, TM6, TM10,TM11 and TM12 (site 2) (Fig. 11B). Both sites had TM6 and TM12 incommon, which have been proved to be involved in ligand bindingthrough experimental studies [45,49]. Both substrate and inhibitorshowed binding tendency in either of the active site. The test substrateetoposide occupied stable docked conformation in site 1, whereasthe other test substrate showed stable binding conformation at site 2(substrates/inhibitors occupying site 1would bewritten in italics furtherin text for easy distinction). However, in case of inhibitor about halfof the inhibitors occupied site 1 (biricodar, tamoxifen, tariquidar andverapamil) and the other half occupied the site 2 (laniquidar, nifedipine,reserpine and ketoconazole). Tables S4 and S5 clearly indicate that mostof the substrates and inhibitors have common interacting residues.Analyses concerning the difference in molecular interactions betweensubstrate and inhibitor, each compound had varied interactionsdepending upon its molecular structure and property, but no cleardistinction between the interactions of substrates and inhibitorswas noticed. Hydrophobic interactionswere predominantly responsiblefor stable binding in most of the cases.
Moreover, as discussed in a study conducted by Loo and Clarke [72]binding of substrate induces conformational changes in TM helices. InIFD experiments substrate and inhibitor induced conformational changesin the residues of TM helices were noticed. For instance, doxorubicinshowed conformational changes in residues of TM helices (Fig. S26A).The residues P350 (TM6) and S993 (TM12) were reported to cross linkin the cysteine mutagenesis experiments, the distance between theseresidues increased in response to doxorubicin binding. The residueV991 (TM12) shown to cross link with P350 due to substrate(colchicines/demecolcine) induced conformational changes, was

Fig. 11. The two binding sites observed during induced fit docking studies. (A) Site 1,accommodated between TM4, TM5, TM6 TM7, TM8 TM9 and TM12. (B) Site 2,accommodated between TM1, TM2, TM3, TM6, TM10, TM11 and TM12.
Fig. 12.RMSDplot of compounds during the course ofMTMDsimulation. (A) RMSDplot ofinhibitors (B) RMSD plot of substrates.
2893R. Prajapati, A.T. Sangamwar / Biochimica et Biophysica Acta 1838 (2014) 2882–2898
observed to move closer to P350 in response to doxorubicin binding,indicating the possible reason of cross linking observed due to substrateinduced conformational changes. Similar conformational changeswere observed for all anthracycline compounds (Fig. S26B). The studyreported, no cross linkingwas observed in anymutants in case of verap-amil and vinblastine, however conformational changes in residueswereobserved in response to verapamil and vinblastine binding. The possiblereason why cross-linking was not observed could be; (i) in case ofvinblastine it was observed that the residues V991 (TM12) and S993(TM12) both moved away from P350 (Fig. S26C) and (ii) in case ofverapamil it was observed that verapamil binds at site 1, which do notinvolve TM11, and its binding induced major conformational changesin the residues of TM5, TM6 and TM12 (Fig. S26D), moreover theresidues P350 and S993 were not in the vicinity of verapamil binding.
MTMD studies of stable binding poses of substrates and inhibitorswere further carried out to analyze the conformational changes in theresidues forming stable binding interactions. In depth analyses of con-formational changes in drug-binding residues were carried out duringthe P-gp structure transition from IO to OO catalytic state. Each residuewas closely observed to find out the changes in molecular interactionsthat destabilized the stable binding of substrates and inhibitors. Also,to elucidate the path followed by substrate and inhibitor, while theyare effluxed out, and any possible distinction between the two, whichdifferentiate them as substrate and inhibitor. However, the timescaleof simulation was insufficient to trace out the actual motion path ofsubstrate and inhibitor; we observed a clear distinction betweenthe molecular interactions of substrate and inhibitor. On analyses of
MTMD trajectories it was observed that most of the residues, whichhave been implicated in ligand binding, face away from the transloca-tion pathway as the structure approaches closer to OO catalytic state.These conformational changes in the drug-binding residues completelydestabilized the stable hydrophobic interactions essential for ligandbinding. As the transition in P-gp structure proceeds from IO to OOstate, the lining of the drug translocation pathway gradually changesfrom highly hydrophobic to less hydrophobic and finally to hydrophilic.The RMSD plot of each substrate and inhibitor (Fig. 12) clearly indicatesthat as the P-gp structure enters the IIO to OO transition phase there is anoticeable increase in the RMSD of substrates and inhibitors. It wasobserved that most of the substrates get destabilized due the confor-mational changes in the residues lining the drug-binding pocket anddislocates from actual binding site. In Fig. 12B the increase in RMSDcorresponds to the dislocation of substrate from the drug-bindingsite. Similar kind of destabilization was also noticed in inhibitors(Fig. 12A), however the changes in their interactions were differentfrom substrates. Though the inhibitors also dislocated from actualbinding site, they seemed to be “sticky” i.e. they showed a tendencyto retain stable binding interaction with at least one of the drug-binding residue during the catalytic transition from IO to OO state.Table S4 lists the residues in close contact during each nanosecondof simulation, residue represented in bold (at least one is the drug-binding residue implicated in experimental studies) maintain closecontact during all phases of simulation. The table clearly shows thatunlike substrate, each inhibitor maintained a close contact with eitherof the drug-binding residue during all phases of the catalytic transition.
2894 R. Prajapati, A.T. Sangamwar / Biochimica et Biophysica Acta 1838 (2014) 2882–2898
Biricodar tends to retain its hydrophobic interaction with I306, A342and F343, ligand binding residues implicated in experimental studies,during the all transition phase of P-gp structure from IO to OO state. Italso maintained close contact with F303 and Y310. Laniquidar main-tained close contact with I868. Reserpine maintained its hydrophobicinteractions with F942 and A985. Tariquidar maintained binding inter-actionswith I306 and F343. Tamoxifenmaintained hydrophobic interac-tions with L399, F343 and F728. Ketoconazole retained its interactionswith T941 and T945. Verapamil maintained hydrophobic interactionswith I306, L399, A342, F343 and V982. In contrast, the substrateslost their stable binding interactions after IIO catalytic state and getdestabilized, and dislocates from actual binding site. Snapshots of inter-action of each substrate and inhibitor during the course of MTMDsimulation is provided in supplementary information Figs. S13–S25.The four anthracycline compounds occupied the same binding site(site 2) having almost similar molecular interactions. The change intheir RMSD pattern (Fig. 12B) was also observed to be similar as themost of interacting residueswere common, the conformational changesin the interacting residues (Table S4) during IIO to OO transition resultedin sudden increase in the RMSD as the compound losesmost of its stableinteractions. Verapamil and doxorubicin as a representative of inhibitorand substrate respectively are discussed in detail.
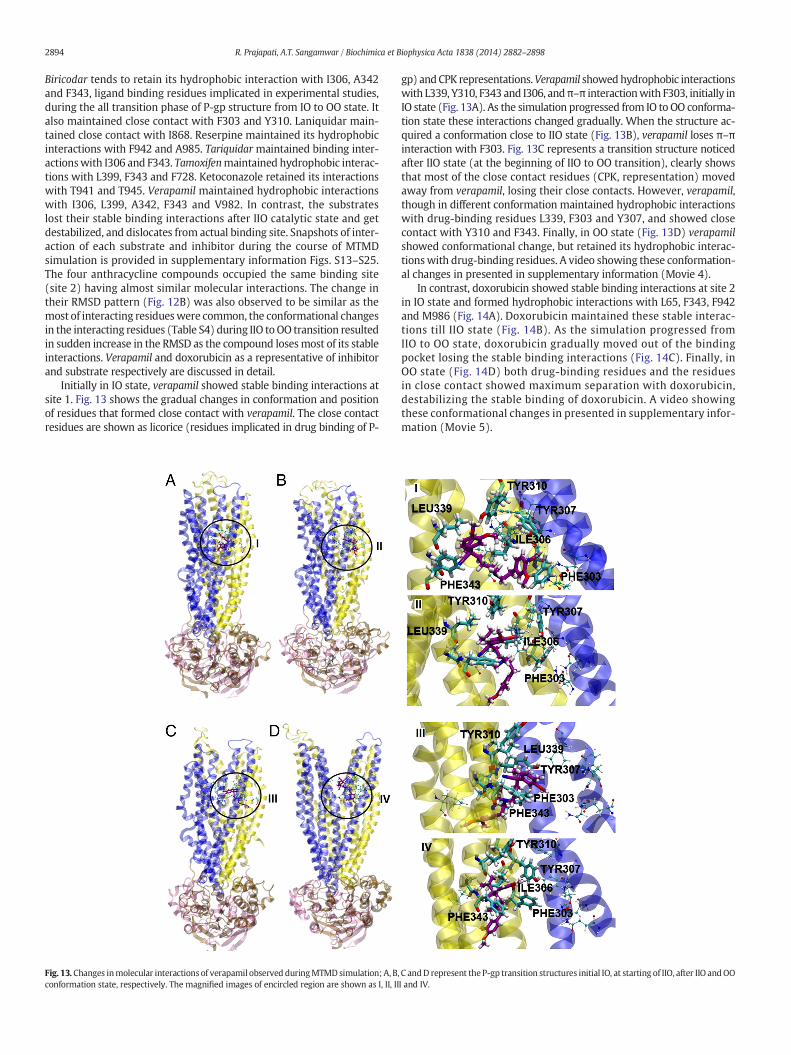
Initially in IO state, verapamil showed stable binding interactions atsite 1. Fig. 13 shows the gradual changes in conformation and positionof residues that formed close contact with verapamil. The close contactresidues are shown as licorice (residues implicated in drug binding of P-
Fig. 13. Changes inmolecular interactions of verapamil observed duringMTMDsimulation; A, B,conformation state, respectively. The magnified images of encircled region are shown as I, II, II
gp) andCPK representations.Verapamil showedhydrophobic interactionswith L339, Y310, F343 and I306, andπ–π interactionwith F303, initially inIO state (Fig. 13A). As the simulation progressed from IO to OO conforma-tion state these interactions changed gradually. When the structure ac-quired a conformation close to IIO state (Fig. 13B), verapamil loses π–πinteraction with F303. Fig. 13C represents a transition structure noticedafter IIO state (at the beginning of IIO to OO transition), clearly showsthat most of the close contact residues (CPK, representation) movedaway from verapamil, losing their close contacts. However, verapamil,though in different conformation maintained hydrophobic interactionswith drug-binding residues L339, F303 and Y307, and showed closecontact with Y310 and F343. Finally, in OO state (Fig. 13D) verapamilshowed conformational change, but retained its hydrophobic interac-tionswith drug-binding residues. A video showing these conformation-al changes in presented in supplementary information (Movie 4).
In contrast, doxorubicin showed stable binding interactions at site 2in IO state and formed hydrophobic interactions with L65, F343, F942and M986 (Fig. 14A). Doxorubicin maintained these stable interac-tions till IIO state (Fig. 14B). As the simulation progressed fromIIO to OO state, doxorubicin gradually moved out of the bindingpocket losing the stable binding interactions (Fig. 14C). Finally, inOO state (Fig. 14D) both drug-binding residues and the residuesin close contact showed maximum separation with doxorubicin,destabilizing the stable binding of doxorubicin. A video showingthese conformational changes in presented in supplementary infor-mation (Movie 5).
C andD represent the P-gp transition structures initial IO, at starting of IIO, after IIO andOOI and IV.

2895R. Prajapati, A.T. Sangamwar / Biochimica et Biophysica Acta 1838 (2014) 2882–2898
3.4. Insights into P-gp translocation mechanism
TheMTMD technique used here to study the structural changes in P-gp structure as it transforms from IO to OO catalytic state provided valu-able insights into the P-gp effluxmechanism. The TMD analyses, detailsof NBD movements, and measurements of ICH movement and rotationin ball and socket joint of NBD provide a clear picture how P-gp struc-ture undergoes a large body of structural changes from drug-bindingpocket exposed to intracellular space to drug-binding pocket exposedto extracellular space. Also, the specific pattern of opening of P-gp struc-ture to the extracellular space is due to the specific arrangement patternof TM helices in TMDs.
The ICHs were noticed as main connecting link between TMDs andNBDs and could be regarded as motion transformers that transformthe twisting and translatory motion of NBDs to pushing motion. Thesemotion transformers are vital link for P-gp efflux mechanism. Duringthe transition from IO to IIO state the NBDs move closer, the ICHs alsomove in concert and the translatory shift of NBDs is transmitted toTMDs via ICHs as a pushing motion. ICH1 connected to TM2 and TM3,pushes these TMs as it moves from IO to OO conformation state; how-ever the stretching of both TMs is in opposite direction. This is due tothe arrangement of TMs in TMD1. TM3 is connected to TM4 through ashort extracellular loop, which in turn is connected to ICH2 embeddedin NBD2. Thus, the movement of TM3 is also affected by the movementof TM4. TM4 and TM5 are connected to ICH2 and shows stretching dueto a push exerted by ICH2 in response to NBD2 movement. Moreover,TM5 connected to TM6 (has physical contact with NBD1), through anextracellular loop, which intersect the inverted V formed by TM3 andTM4. This arrangement results into the movement of TM3, −4, −5
Fig. 14. Changes inmolecular interactions of doxorubicin observed duringMTMD simulation; AOO conformation state, respectively. The magnified images of encircled region are shown as I,
and−6 toward the same side. So, if one observes the structural changein TMD1 from a lateral view with both NBD overlapping each other, itcould be clearly observed that the TM3, −4, −5 and −6 moves in leftdirections and TM1 and TM2 moves in right direction. Interestingly,the gradual pushing motion of ICH2 on TM4 and TM5 during transitionfrom IO to OO state gradually straightened these helices and finally theyattained a bow-like structure in the OO conformation state. However,the curvature was more pronounced in the case of TM4. Similar typeof rearrangements was observed in TMD2 in response to pushingforce exerted by ICH3 and ICH4, while showing a concerted movementwith NBD1 andNBD2. In TMD2, TM10 and TM11 showed a curved bow-like structure in final OO conformational state, TM10 showedmore pro-nounced curvature. These gradual rearrangements in TMD1 and TMD2from IO to IIO, and then to OO state finally resulted in the opening ofP-gp structure toward the extracellular space making the drug-binding region solvent accessible from the extracellular side.
Moreover, the movements of ICHs and the corresponding move-ments in TM helices observed in MTMD simulation provide a good ex-planation for the inactivation of P-gp on cross-linking ICH2 and ICH3,mentioned in a recent experimental study [73]. In this experiment Looand Clarke cross-linked A259C (ICH2) andW803C (ICH3) that resultedin loss of P-gp ATPase activity. The role of ICHdiscussed above and in theprevious section clearly explains that the cross-linkingwill inhibited theconformation changes in TM4, TM5, TM8 and TM9 in response to ICH2and ICH3 movement, which possibly explain the reason of P-gp in-activation. The study also discusses the importance of Y1087, mutationin which inhibited maturation of P-gp. In our simulation studies Y1087was found to form conserved salt-bridge interactions with Arg262 (ICH2) and Asp 805 (ICH3) in IO conformation, which gradually
, B, C and D represent the P-gp transition structures initial IO, at starting of IIO, after IIO andII, III and IV.

2896 R. Prajapati, A.T. Sangamwar / Biochimica et Biophysica Acta 1838 (2014) 2882–2898
disrupted from IO to OO transition (Fig. 3). The mutation in Y1087 willnot only abolish conserved salt-bridge interaction but also inhibit therelated conformational changes in ICH2 and ICH3.
The quantitative data relating movements of TM and ICH discussedin the previous section well correlates with the mechanism hypo-thesized above on the basis of MTMD experiments. A negligible changewas observed in the distance between TM1 and TM2 that indicates boththe TMs move in same direction. However, the straightening of TM2resulted into the conformational change in the extracellular loopconnecting TM1 and TM2. This loop is analogous to a lid that coversthe extracellular opening of the P-gp transporter. As the TM2straightens during IO to OO transition this loop gradually moves toopen the extracellular covering. The large change noticed in distancebetween TM2 and TM3 is reasonable as both TMs move in oppositedirection. The angular twist of ~20 Å observed in ICH1 could becorrelated to provide initial opposite directional momentum toTM2 and TM3 in response to pushing exerted by ICH1. The pro-minent change in the distance between TM4 and TM10, TM5 andTM11, and TM6 and TM9 was observed as they moved in oppositedirection. The higher RMSD of TM4 and the twist in ICH2 could becorrelated to higher curvature observed for TM4. The higher RMSDof TM1 as compared to TM7 was attributed to higher conformationalchange in extracellular loop connecting TM1 and TM2.
The MTMD simulations of substrates and inhibitors gave insightsinto the structural transition of TM helices. During IO to OO transitionthe TM helices move away accompanied by conformational changes inthe drug-binding residues, in response to these conformational changesboth substrate and inhibitor were dislocate from their actual bindingsite, but the inhibitors seemed to maintain the binding interactionswith some of the drug-binding residues. The observed results does notstate any quantitative differentiation in binding affinity of substrate orinhibitor, however it could be proposed that in actual biological mecha-nism inhibitors may have a tendency to inhibit certain conformationalchanges in these drug-binding residues and thus hindering the move-ment of TM helices essential for catalytic efflux. Also, it could be inter-preted that the inhibitors may have higher binding affinity thensubstrates.
The translocation mechanism of P-gp proposed here on the basis ofMTMD experiments on P-gp structures and large number of MTMDexperiments conducted with known P-gp substrate and inhibitorspresents an overall picture of P-gp translocation mechanism.The study gives substantial detailed into reaarangements of TMDs,importance of ICHs and interactions of inhibitors during P-gp catalyticproviding testable hypotheses for future studies.
4. Conclusions
The selected template structures for modeling studies had a largedifference between their NBDs representing different catalytic state ofP-gp. The generated human P-gp models in three different catalyticstates, using C. elegans, human mitochondrial and Sav1866 P-gp astemplates showed very few geometric constraints. Ramachandran anderrat plot indicated good reliability of generated models. The subse-quent embedding of model in lipid bilayer followed by 50 ns MDequilibration further refined the overall geometry of the structures.Furthermore, the models showed good consistency with experimentalstudies, providing reasonable structures to perform ligand bindinginteraction studies.
The MTMD technique used here gave valuable insights into the P-gpeffluxmechanism. The IO conformational statewas taken as the startingstructure for MTMD studies, as this structural state was well validatedagainst experimental data. Moreover, the IO to OO structural transitioncould be better utilized to study substrate/inhibitor binding interac-tions, as the substrate and inhibitor bind stably in IO conformation ofP-gp and later get destabilized in OO conformational state. The MTMDsimulation from IO to OO state incurred a better understanding of the
NBD movements, role of ICHs and TMD rearrangements during theP-gp efflux cycle. The IO to OO structural change of P-gp is contributedby both twisting and translatory motion of NBDs. The IO to IIO statechange showed the initial twisting motion of NBDs, while IIO to OOstate transition showed translatory motion where the NBDs approacheach other and dimerize to form catalytic dyad. ICHs, which were welladjusted into the grooves of NBDs forming a ball and socket-like joint,showed concerted movement with NBDs. These ICHs were observedas motion transformers that transform rotatory and translatory motionof NBDs to a pushingmotion, resulting into the rearrangement of TMDs.Moving along with NBDs, ICHs also showed rotatory motion into thegrooves of NBDs as governed by conserved interactions. Coupled withrotatory motion the ICHs pushed 8 out of 12 TM helices (2, 3, 4, 5, 8,9, 10 and 11), predominant pushing force was exerted on TM4–TM5,and TM10–TM11 via ICH2 and ICH4, respectively. In response to NBDand ICHmovement, the TMDs showed a dramatic rearrangement, final-ly resulting into the opening of drug-binding region to extracellularspace. A specific pattern of opening of TMDs was due to the topologicalarrangement of TMhelices. The diametric stretching of TM2 and TM3 inresponse to ICH1 movement was observed on account of the arrange-ment of TM3, 4 and 6, and bent topology of TM3helix. Identical arrange-ment of TM8, 9 and 12 resulted into the diametric stretching of TM8 andTM9. The stretching TM2 also resulted into the conformational changein extracellular loop connecting TM1 and TM2. Prominent straighteningof TM4, 5, 10 and 11 observed during IO to OO structural transition ofP-gp in response to ICH2 and ICH4movements, respectively, majorlycontributed to TMD rearrangement.
The study provides significant details of conformational changesin the drug-binding residues that occurred from IO state, where drug-binding pocket is accessible from intracellular space to OO state,where drug-binding region becomes accessible from extracellularspace. The simulation clearly depicted that the drug binding-residuesacquired conformation that face away from drug-binding pocket asthe P-gp structure approached the OO state. Alongwith conformationalchanges, these residues also showed displacements from their initialposition, gradually moving apart from central axis. The conformationalchanges in drug-binding residues and their corresponding movementsdistorted the binding site(s) and represented a clear picture how astably binding ligand possibly get destabilized in OO conformationstate. Furthermore, the consistency of developed model and MTMDsimulations with experimental data provide strong evidence towardthe validity and reliability of the results presented here.
Here, using MTMD studies we reported the interaction studies ofP-gp substrate and inhibitor during the P-gp efflux cycle. The reportedstudy gives an incisive understanding of the P-gp substrate and inhibi-tor molecular interactions. No distinct site for substrate and inhibitorbinding was noticed, however, substantial difference in substrate andinhibitor binding interaction was noticed during the simulation fromIO to OO state. The results clearly showed how substrate binding inthe active site of P-gp gradually gets destabilized as the structuretransform from IO to OO state. The results also showed a clear distinc-tion between substrate and inhibitor interactions during P-gp catalyticcycle. The substrates loose their stable binding interactions and dislocatefrom actual binding site as the conformation of drug-binding residuesgradually changed from IO to OO state, whereas the inhibitors main-tained stable interactionswith drug-binding residues, posing possibilityof inhibition of the conformational change in P-gp structure. The resi-dues F303, I306, F343, F728, I868, F942, T945 and A985 were foundcrucial for inhibitor interactions. The inhibitors in docking and MTMDexperiments showed stable binding interactions with at least one ofthese residues depending on the binding site they occupied.
Apart from mechanistic insights drawn from MTMD simulationshere, further MD simulation experiments would be required to recon-cile in silico studies with experimental studies. For instance, the studyhere considered lowest energy docked pose in MTMD studies, howevera ligand could bind in multiple orientations. It has been reported that

2897R. Prajapati, A.T. Sangamwar / Biochimica et Biophysica Acta 1838 (2014) 2882–2898
two substrates could bind simultaneous in drug-binding pocket andoccupy different regions in the common drug-binding pocket [74].Another set of simulation needs to be carried out to study how bindingof two substrates will affect themovements and conformational chang-es in TM helices. Further, the MTMD technique could not be efficientlyutilized to study the difference between substrate and inhibitor inducedconformational changes in NBDs [75]. There are also biochemical evi-dences that the binding of nucleotide at NBDs induces conformationalchanges in TMDs [76]. Very long atomistic simulationswould be furtherrequired to accommodate in silico experiments with these biochemicalevidences.
The mechanistic picture of translocation of P-gp presented here,usingMTMD studies gave sufficient details into conformational changesin drug-binding region, role of ICHs and topological arrangements of TMhelices in P-gp translocation, and quantitative shifts TM helices pro-viding valuable information for future experiments.
Abbreviations
P-gp P-glycoproteinTMD trans-membrane domainNBD nucleotide binding domainICH intracellular coupling helixMTMD multi-targeted molecular dynamicsIFD induced fit dockingTM trans-membrane.
Supplementary data to this article can be found online at http://dx.doi.org/10.1016/j.bbamem.2014.07.018.
Acknowledgement
The authors are thankful to the Department of Biotechnology(DBT), New Delhi (Grant number is BT/PR/14979/BID/07/353/2010), for financial support.
References
[1] R.L. Juliano, V. Ling, A surface glycoprotein modulating drug permeability in Chinesehamster ovary cell mutants, Biochim. Biophys. Acta 455 (1976) 152–162.
[2] H.S.L. Chan, G. Haddad, P.S. Thorner, G. DeBoer, Y.P. Lin, N. Ondrusek, H. Yeger, V.Ling, P-glycoprotein expression as a predictor of the outcome of therapy forneuroblastoma, N. Engl. J. Med. 325 (1991) 1608–1614.
[3] P.D.W. Eckford, F.J. Sharom, ABC efflux pump-based resistance to chemotherapydrugs, Chem. Rev. 109 (2009) 2989–3011.
[4] M.M. Gottesman, I. Pastan, The multidrug transporter, a double-edged sword, J. Biol.Chem. 263 (1988) 12163–12166.
[5] M. Hennessy, J.P. Spiers, A primer on the mechanics of P-glycoprotein the multidrugtransporter, Pharmacol. Res. 55 (2007) 1–15.
[6] G. Szakács, J.K. Paterson, J.A. Ludwig, C. Booth-Genthe, M.M. Gottesman, Targetingmultidrug resistance in cancer, Nat. Rev. Drug Discovery 5 (2006) 219–234.
[7] C.F. Higgins, R. Callaghan, K.J. Linton, M.F. Rosenberg, R.C. Ford, Structure of themultidrug resistance P-glycoprotein, Semin. Cancer Biol. 8 (1997) 135–142.
[8] P.M. Jones, A.M. George, Subunit interactions in ABC transporters: towards afunctional architecture, FEMS Microbiol. Lett. 179 (1999) 187–202.
[9] F.J. Sharom, The P-glycoprotein efflux pump: how does it transport drugs? J. Membr.Biol. 160 (1997) 161–175.
[10] C.A. Shintre, A.C.W. Pike, Q. Li, J.-I. Kim, A.J. Barr, S. Goubin, L. Shrestha, J. Yang, G.Berridge, J. Ross, P.J. Stansfeld, M.S.P. Sansom, A.M. Edwards, C. Bountra, B.D.Marsden, F. von Delft, A.N. Bullock, O. Gileadi, N.A. Burgess-Brown, E.P. Carpenter,Structures of ABCB10, a human ATP-binding cassette transporter in apo- andnucleotide-bound states, Proc. Natl. Acad. Sci. U. S. A. 110 (2013) 9710–9715.
[11] R.J.P. Dawson, K.P. Locher, Structure of a bacterial multidrug ABC transporter, Nature443 (2006) 180–185.
[12] A. Ward, C.L. Reyes, J. Yu, C.B. Roth, G. Chang, Flexibility in the ABC transporter MsbA:alternating access with a twist, Proc. Natl. Acad. Sci. U. S. A. 104 (2007) 19005–19010.
[13] S.G. Aller, J. Yu, A. Ward, Y. Weng, S. Chittaboina, R. Zhuo, P.M. Harrell, Y.T. Trinh, Q.Zhang, I.L. Urbatsch, G. Chang, Structure of P-glycoprotein reveals a molecular basisfor poly-specific drug binding, Science 323 (2009) 1718–1722.
[14] M.S. Jin, M.L. Oldham, Q. Zhang, J. Chen, Crystal structure of the multidrug transport-er P-glycoprotein from Caenorhabditis elegans, Nature 490 (2012) 566–569.
[15] J. Li, K.F. Jaimes, S.G. Aller, Refined structures of mouse P-glycoprotein, Protein Sci.(23) (2014) 34–46.
[16] J.D. Campbell, S.S. Deol, F.M. Ashcroft, I.D. Kerr, M.S.P. Sansom, Nucleotide-dependent conformational changes in HisP: molecular dynamics simulations of anABC transporter nucleotide-binding domain, Biophys. J. 87 (2004) 3703–3715.
[17] J.D. Campbell, M.S.P. Sansom, Nucleotide binding to the homodimeric MJ0796protein: a computational study of a prokaryotic ABC transporter NBD dimer, FEBSLett. 579 (2005) 4193–4199.
[18] J.M. Damas, A.S.F. Oliveira, A.M. Baptista, C.M. Soares, Structural consequences ofATP hydrolysis on the ABC transporter NBD dimer: molecular dynamics studies ofHlyB, Protein Sci. 20 (2011) 1220–1230.
[19] P.M. Jones, A.M. George, Mechanism of ABC transporters: a molecular dynamicssimulation of a well characterized nucleotide-binding subunit, Proc. Natl. Acad.Sci. U. S. A. 99 (2002) 12639–12644.
[20] P.M. Jones, A.M.George, TheABC transporter structure andmechanism: perspectiveson recent research, Cell. Mol. Life Sci. 61 (2004) 682–699.
[21] P.M. Jones, A.M. George, Nucleotide-dependent allostery within the ABC transporterATP-binding cassette, J. Biol. Chem. 282 (2007) 22793–22803.
[22] P.M. Jones, A.M.George, Opening of theADP-bound active site in the ABC transporterATPase dimer: evidence for a constant contact, alternating sites model for thecatalytic cycle, Proteins Struct. Funct. Genet. 75 (2009) 387–396.
[23] P.M. Jones, A.M. George, Molecular-dynamics simulations of the ATP/apo state of amultidrug ATP-binding cassette transporter provide a structural and mechanisticbasis for the asymmetric occluded state, Biophys. J. 100 (2011) 3025–3034.
[24] A.S.F. Oliveira, A.M. Baptista, C.M. Soares, Insights into the molecular mechanism ofan ABC transporter: conformational changes in the NBD dimer of MJ0796, J. Phys.Chem. B 114 (2010) 5486–5496.
[25] E.O. Oloo, E.Y. Fung, D.P. Tieleman, The dynamics of the MgATP-driven closure ofMalK, the energy-transducing subunit of the maltose ABC transporter, J. Biol.Chem. 281 (2006) 28397–28407.
[26] P.C. Wen, E. Tajkhorshid, Dimer opening of the nucleotide binding domains of ABCtransporters after ATP hydrolysis, Biophys. J. 95 (2008) 5100–5110.
[27] J.P. Becker, G. Depret, F. Van Bambeke, P.M. Tulkens, M. Pravost, Molecularmodels ofhuman P-glycoprotein in two different catalytic states, BMC Struct. Biol. 9 (2009) 3.
[28] A. Ivetac, J.D. Campbell, M.S.P. Sansom, Dynamics and function in a bacterial ABCtransporter: simulation studies of theBtuCDF systemand its components, Biochemistry46 (2007) 2767–2778.
[29] C. Kandt, D.P. Tieleman, Holo-BtuF stabilizes the open conformation of the vitaminB12 ABC transporter BtuCD, Proteins Struct. Funct. Genet. 78 (2010) 738–753.
[30] A.S. Oliveira, A.M. Baptista, C.M. Soares, Conformational changes induced by ATP-hydrolysis in an ABC transporter: a molecular dynamics study of the Sav 1866exporter, Proteins Struct. Funct. Genet. 79 (2011) 1977–1990.
[31] E.O. Oloo, D.P. Tieleman, Conformational transitions induced by the binding ofMgATP to the vitamin B12 ATP-binding cassette (ABC) transporter BtuCD, J. Biol.Chem. 279 (2004) 45013–45019.
[32] J. Sonne, C. Kandt, G.H. Peters, F.Y. Hansen, M.Ã. Jensen, D.P. Tieleman, Simulation ofthe coupling between nucleotide binding and transmembrane domains in the ATPbinding cassette transporter BtuCD, Biophys. J. 92 (2007) 2727–2734.
[33] J.F. St-Pierre, A. Bunker, T. Rog, M. Karttunen, N. Mousseau, Molecular dynamicssimulations of the bacterial ABC transporter SAV1866 in the closed form, J. Phys.Chem. B 116 (2012) 2934–2942.
[34] T.G. Sun, M. Liu, W.Z. Chen, C.X. Wang, Molecular dynamics simulation of the trans-membrane subunit of BtuCD in the lipid bilayer, Sci. China Life Sci. 53 (2010) 620–630.
[35] P.C. Wen, E. Tajkhorshid, Conformational coupling of the nucleotide-binding and thetransmembrane domains in ABC transporters, Biophys. J. 101 (2011) 680–690.
[36] J.W. Weng, K.N. Fan, W.N. Wang, The conformational transition pathway of ATPbinding cassette transporter MsbA revealed by atomistic simulations, J. Biol.Chem. 285 (2010) 3053.
[37] M.L. O'Mara, A.E. Mark, The effect of environment on the structure of a membraneprotein: P-glycoprotein under physiological conditions, J. Chem. Theory Comput. 8(2012) 3964–3976.
[38] R.J. Ferreira, M.-J.U. Ferreira, D.J.V.A. dos Santos, Insights on P-glycoprotein's effluxmechanism obtained by molecular dynamics simulations, J. Chem. Theory Comput.8 (2012) 1853–1864.
[39] R. Prajapati, U. Singh, A. Patil, K.S. Khomane, P. Bagul, A.K. Bansal, A.T. Sangamwar, Insilico model for P-glycoprotein substrate prediction: insights from moleculardynamics and in vitro studies, J. Comput. Aided Mol. Des 27 (2013) 347–363.
[40] Schrödinger Suite 2009 Induced Fit Docking protocol; Glide version 5.5, Primeversion 2.1, Schrödinger, LLC, New York, NY, 2009.
[41] W. Sherman, H.S. Beard, R. Farid, Use of an induced fit receptor structure in virtualscreening, Chem. Biol. Drug Des. 67 (2006) 83–84.
[42] T.W. Loo, M.C. Bartlett, D.M. Clarke, Transmembrane segment 1 of human P-glycoprotein contributes to the drug-binding pocket, Biochem. J. 396 (2006)537–545.
[43] T.W. Loo, M.C. Bartlett, D.M. Clarke, Transmembrane segment 7 of human P-glycoprotein forms part of the drug-binding pocket, Biochem. J. 399 (2006) 351–359.
[44] T.W. Loo, D.M. Clarke, Identification of residues in the drug-binding site of human P-glycoprotein using a thiol-reactive substrate, J. Biol. Chem. 272 (1997) 31945–31948.
[45] T.W. Loo, D.M. Clarke, Identification of residues within the drug-binding domainof the human multidrug resistance P-glycoprotein by cysteine-scanningmutagenesis and reaction with dibromobimane, J. Biol. Chem. 275 (2000)39272–39278.
[46] T.W. Loo, M.C. Bartlett, D.M. Clarke, Disulfide cross-linking analysis shows thattransmembrane segments 5 and 8 of human P-glycoprotein are close together onthe cytoplasmic side of the membrane, J. Biol. Chem. 279 (2004) 7692–7697.
[47] T.W. Loo, M.C. Bartlett, D.M. Clarke, Val133 and Cys137 in transmembrane segment2 are close to Arg935 and Gly939 in transmembrane segment 11 of human P-glycoprotein, J. Biol. Chem. 279 (2004) 18232–18238.

2898 R. Prajapati, A.T. Sangamwar / Biochimica et Biophysica Acta 1838 (2014) 2882–2898
[48] T.W. Loo, M.C. Bartlett, D.M. Clarke, ATP hydrolysis promotes interactions betweenthe extracellular ends of transmembrane segments 1 and 11 of human multidrugresistance P-glycoprotein, Biochemistry 44 (2005) 10250–10258.
[49] T.W. Loo, M.C. Bartlett, D.M. Clarke, Identification of residues in the drug translocationpathway of the human multidrug resistance P-glycoprotein by arginine mutagenesis,J. Biol. Chem. 284 (2009) 24074–24087.
[50] T.W. Loo, M.C. Bartlett, D.M. Clarke, Human P-glycoprotein contains a greasyball-and-socket joint at the second transmission interface, J. Biol. Chem. 288(2013) 20326–20333.
[51] T.W. Loo, D.M. Clarke, Drug-stimulated ATPase activity of human P-glycoproteinrequires movement between transmembrane segments 6 and 12, J. Biol. Chem.272 (1997) 20986–20989.
[52] T.W. Loo, D.M. Clarke, Identification of residues in the drug-binding domain ofhuman P-glycoprotein. Analysis of transmembrane segment 11 by cysteine-scanning mutagenesis and inhibition by dibromobimane, J. Biol. Chem. 274(1999) 35388–35392.
[53] T.W. Loo, D.M. Clarke, The packing of the transmembrane segments of human mul-tidrug resistance P-glycoprotein is revealed by disulfide cross-linking analysis, J.Biol. Chem. 275 (2000) 5253–5256.
[54] T.W. Loo, D.M. Clarke, Determining the dimensions of the drug-binding domain ofhuman P-glycoprotein using thiol cross-linking compounds as molecular rulers, J.Biol. Chem. 276 (2001) 36877–36880.
[55] T.W. Loo, D.M. Clarke, Defining thedrug-binding site in thehumanmultidrug resistanceP-glycoprotein using a methanethiosulfonate analog of verapamil MTS-verapamil, J.Biol. Chem. 276 (2001) 14972–14979.
[56] T.W. Loo, D.M. Clarke, Cross-linking of human multidrug resistance P-glycoprotein bythe substrate, tris-(2-maleimidoethyl) amine, is altered by ATP hydrolysis evidencefor rotation of a transmembrane helix, J. Biol. Chem. 276 (2001) 31800–31805.
[57] T.W. Loo, D.M. Clarke, Drug rescue distinguishes between different structuralmodels of human P-glycoprotein, Biochemistry 52 (2013) 7167–7169.
[58] T.W. Loo, D.M. Clarke, A salt bridge in intracellular loop 2 is essential for folding ofhuman P-glycoprotein, Biochemistry 52 (2013) 3194–3196.
[59] X. Zhang, K.I. Collins, L.M. Greenberger, Functional evidence that transmembrane 12and the loop between transmembrane 11 and 12 form part of the drug-bindingdomain in P-glycoprotein encoded by MDR1, J. Biol. Chem. 270 (1995) 5441–5448.
[60] I.L. Urbatsch, B. Sankaran, S. Bhagat, A.E. Senior, Both P-glycoprotein nucleotide-binding sites are catalytically active, J. Biol. Chem. 270 (1995) 26956–26961.
[61] M.L. Oldham, J. Chen, Snapshots of the maltose transporter during ATP hydrolysis,Proc. Natl. Acad. Sci. U. S. A. 108 (2011) 15152–15156.
[62] J.G. Wise, Catalytic transitions in the human MDR1 P-glycoprotein drug-bindingsites, Biochemistry 51 (2012) 5125–5141.
[63] T.W. Loo, D.M. Clarke, Location of the rhodamine-binding site in the human multi-drug resistance P-glycoprotein, J. Biol. Chem. 277 (2002) 44332–44338.
[64] S. Dey, M. Ramachandra, I. Pastan, M.M. Gottesman, S.V. Ambudkar, Evidence fortwo nonidentical drug-interaction sites in the human P-glycoprotein, Proc. Natl.Acad. Sci. U. S. A. 94 (1997) 10594–10599.
[65] C. Pascaud, M. Garrigos, S. Orlowski, Multidrug resistance transporter P-glycoproteinhas distinct but interacting binding sites for cytotoxic drugs and reversing agents,Biochem. J. 333 (1998) 351–358.
[66] A.B. Shapiro, K. Fox, P. Lam, V. Ling, Stimulation of P-glycoprotein-mediated drugtransport by prazosin and progesterone, Eur. J. Biochem. 259 (1999) 841–850.
[67] M.R. Lugo, F.J. Sharom, Interaction of LDS-751 with P-glycoprotein and mapping ofthe location of the R drug-binding site, Biochemistry 44 (2005) 643–655.
[68] T.W. Loo, M.C. Bartlett, D.M. Clarke, Permanent activation of the human P-glycoprotein by covalent modification of a residue in the drug-binding site, J. Biol.Chem. 278 (2003) 20449–20452.
[69] T.W. Loo, D.M. Clarke, Identification of the distance between the homologous halvesof P-glycoprotein that triggers the high/low ATPase activity switch, J. Biol. Chem.289 (2014) 8484–8492.
[70] T.W. Loo, D.M. Clarke, Functional consequences of phenylalanine mutations in thepredicted transmembrane domain of P-glycoprotein, J. Biol. Chem. 268 (1993)19965–19972.
[71] I.K. Pajeva, C. Globisch, M. Wiese, Structure–function relationships of multidrugresistance P-glycoprotein, J. Med. Chem. 47 (2004) 2523–2533.
[72] T.W. Loo, M.C. Bartlett, D.M. Clarke, Substrate-induced conformational changes inthe transmembrane segments of human P-glycoprotein. Direct evidence for thesubstrate-induced fit mechanism for drug binding, J. Biol. Chem. 278 (2003)13603–13606.
[73] T.W. Loo, D.M. Clarke, Locking intracellular helices 2 and 3 together inactivateshuman P-glycoprotein, J. Biol. Chem. 289 (2014) 229–236.
[74] T.W. Loo, M.C. Bartlett, D.M. Clarke, Simultaneous binding of two different drugs inthe binding pocket of the human multidrug resistance P-glycoprotein, J. Biol. Chem.278 (2003) 39706–39710.
[75] T.W. Loo, M.C. Bartlett, D.M. Clarke, Drug binding in human P-glycoprotein causesconformational changes in both nucleotide-binding domains, J. Biol. Chem. 278(2003) 1575–1578.
[76] T.W. Loo, M.C. Bartlett, D.M. Clarke, Nucleotide binding, ATP hydrolysis, and mutationof the catalytic carboxylates of human P-glycoprotein cause distinct conformationalchanges in the transmembrane segments, Biochemistry 46 (2007) 9328–9336.