Embed Size (px)
Citation preview

TransLink’s Tracker
2010–2011 Q1

The materials presented in this publication are an information source only. The TransLink Transit Authority makes no statements, representation or warranties about the accuracy, currency or completeness of any information contained in this publication.
The TransLink Transit Authority disclaims all responsibilities for the information and liability (including without limitation, liability
for negligence) for any loss, damage, expense and costs arising from any information being inaccurate or incomplete in any way for any reason.
Materials from this publication may be used or reproduced for study, research or training purposes providing the meaning is unchanged and the TransLink Transit Authority is acknowledged.
For more information
Web www.translink.com.au Phone 07 3167 4000 Fax 07 3167 4001 Mail TransLink’s Tracker TransLink Transit Authority GPO Box 50 Brisbane Qld 4001
About TransLink
In July 2008, TransLink Transit Authority was established as the statutory authority responsible for purchasing, delivering and managing public transport services within South East Queensland – an area that stretches from Gympie and the Sunshine Coast to Coolangatta on the Gold Coast, and west to Helidon.
We are committed to developing and delivering a world-class public transport network for the people of South East Queensland.
We contract 18 service delivery partners – including QR, Brisbane City Council and 15 private operators – to deliver public transport. In conjunction with these partners and other stakeholders we drive the improvement and expansion of public transport services across the network.
TransLink’s key functions include:
• overseeing the delivery of public transport services across South East Queensland to meetademandwhichhasincreasedby50percentinthepastfiveyears
• managing and ensuring the standards of contracted service delivery partners
• delivering and managing infrastructure, including a 24 km network consisting of the Eastern, South Eastern, Inner Northern and Northern busways, and train station upgrades
• managing ticketing products, including the development of the go card which was rolled out in 2008
• providing customers with a single point of contact for feedback and information
• planning, coordinating and integrating services for bus, train and ferry across a 10,000 sq km area.
As a statutory authority, the board of TransLink is accountable to the Queensland Government’s Minister for Transport.
TransLink’s Tracker 2010–2011 Q1 1
Contents
4 Patronage
4 Networkwide patronage - quarterly
4 Bus patronage - quarterly
4 Train patronage - quarterly
5 Ferry patronage - quarterly
5 Fare and subsidy per trip
5 Fare and subsidy - networkwide
6 Service on-time running and service delivered
6 On-time running and service delivered – train
6 On-time running – bus
7 Customer enquiries
7 Total customer enquiries
7 Journey planner customer enquires
7 Complaints customer enquiries
8 go card
8 go card use network wide
8 go card use by mode
9 go card customer complaints and adjustment requests
9 go card fixed fares
9 go card adjustments
10 Customer satisfaction
10 Overall satisfaction
10 Safety and security
10 Reliability and frequency
11 Comfort of ride
11 Ease of use
11 Proximity
12 Efficiency.
12 Information
12 Helpfulness of staff
13 Affordability
13 Accessibility
13 go card
14 Passenger safety and fare evasion
14 Fines and warnings
14 Passenger injuries
15 Operator Profile Thompson Bus Services
16 Train passenger load
16 Morning peak period – overall
16 Afternoon peak period – overall
17 Services which exceed benchmark
18 Service kilometres
18 Service kms – bus
18 Service kms – train
18 Place kms

As this is the first edition of Tracker for the new reporting year, it is also a chance to introduce new regular data and features such as this edition’s customer safety and place kilometres data and a profile on one of our service delivery partners.
The quarter’s profile is Thompson Bus Services. I am proud to have such an iconic family business under the TransLink umbrella.
2 TransLink’s Tracker 2010–2011 Q1
Innovation in public transport is crucial to allow TransLink to implement new ideas to continue to improve the way we provide public transport services.
Recent innovations range from a bus service through the Clem 7 tunnel, FlexiLink services to lower density areas on the network, standard peak stopping patterns onthetrainnetworkandafarestructurethatmaximisesthebenefitsofgo card.
Innovation will also be a key to the future success of the network. In this year’s four editions of Tracker I will look at innovations across customer information, Cross River Rail, the expanding TransLink network and, in this edition, Gold Coast Light Rail.
Light rail will be an exciting addition for TransLink customers on the Gold Coast. It will not only provide a fourth mode of public transport on the network, but also an innovative form of mass transport capable of tackling future congestion along the spine of the Gold Coast.
Aside from the innovation in the design process, a landmark funding model was the start of a partnership between the Queensland Government, Gold Coast City Council and Australian Government to pledge $949 million to complete Stage One of the project.
Light rail services are expected to commence operation in 2014 and TransLink is already looking at innovative ways to ensure light rail meets the needs of customers, including:
• A re-design of bus services to fully integrate with light rail services which are capable of carrying over 200 passengers per service.
• Ensure light rail stations are multi-purpose providing customers with both information and commercial opportunities.
• Information to make travel easy on a 13-kilometre, 16-station corridor linking the new GoldCoastUniversityHospital,GriffithUniversity,Southportmedicalprecinctandthetourist and business hubs of Southport, Surfers Paradise and Broadbeach.
• A city building approach to implementing a new form of transport and public transport culture.
Having watched similar city-wide light rail projects develop in other parts of the world, I’m excited at the prospect of having this project forming part of the TransLink network.
While all light rail systems require clever innovations, one challenge that very few would have had to overcome is the best way to cater for surfboards...such is South East Queensland’sownuniqueflavour.
Peter Strachan
Chief Executive Officer TransLink Transit Authority
Light rail innovation

TransLink’s Tracker 2010–2011 Q1 3
Artist’s impression

4 TransLink’s Tracker 2010–2011 Q1
Networkwide patronage - quarterly
Train patronage - quarterly
Bus patronage - quarterly
PatronagePatronage for Q1 increased for bus and rail and decreased for ferries.
Overall, there were 49.23 million trips taken across the TransLink network during the quarter – an increase of 2.7 per cent or 1.3 million trips compared with the same period last year.
This is the highest level of patronage for a three month period since South East Queensland public transport services
were integrated in 2004.
Bus trips rose by 963 000 or 3.2 per cent to 31.37 million trips across the network compared with the corresponding period last year. The largest bus provider is the Brisbane City Council with 20.48 million trips, an 800 000 increase on Q1 last year.
Train trip numbers continued to grow with an additional 590 000 trips taken on Queensland Rail’s network – a 3.7 per cent increase on the same period last year.
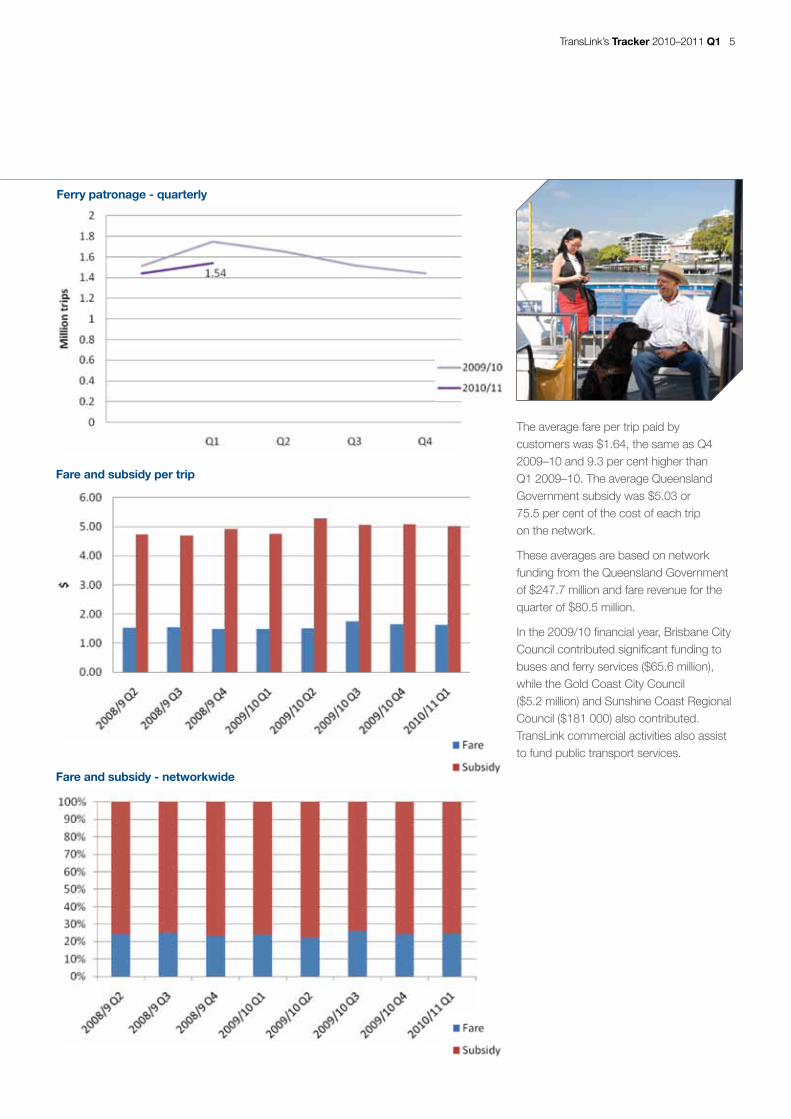
The CityCats and CityFerry services, which make up about three per cent of all trips on the TransLink network, continued to decline – down 212 000 trips, or 12.1 per cent to 1.54 million trips compared to the same period last year.
TransLink’s Tracker 2010–2011 Q1 5
Fare and subsidy per trip
Fare and subsidy - networkwide
Ferry patronage - quarterly
The average fare per trip paid by customers was $1.64, the same as Q4 2009–10 and 9.3 per cent higher than Q1 2009–10. The average Queensland Government subsidy was $5.03 or 75.5 per cent of the cost of each trip on the network.
These averages are based on network funding from the Queensland Government of $247.7 million and fare revenue for the quarter of $80.5 million.
Inthe2009/10financialyear,BrisbaneCityCouncilcontributedsignificantfundingtobuses and ferry services ($65.6 million), while the Gold Coast City Council ($5.2 million) and Sunshine Coast Regional Council ($181 000) also contributed. TransLink commercial activities also assist to fund public transport services.
6 TransLink’s Tracker 2010–2011 Q1
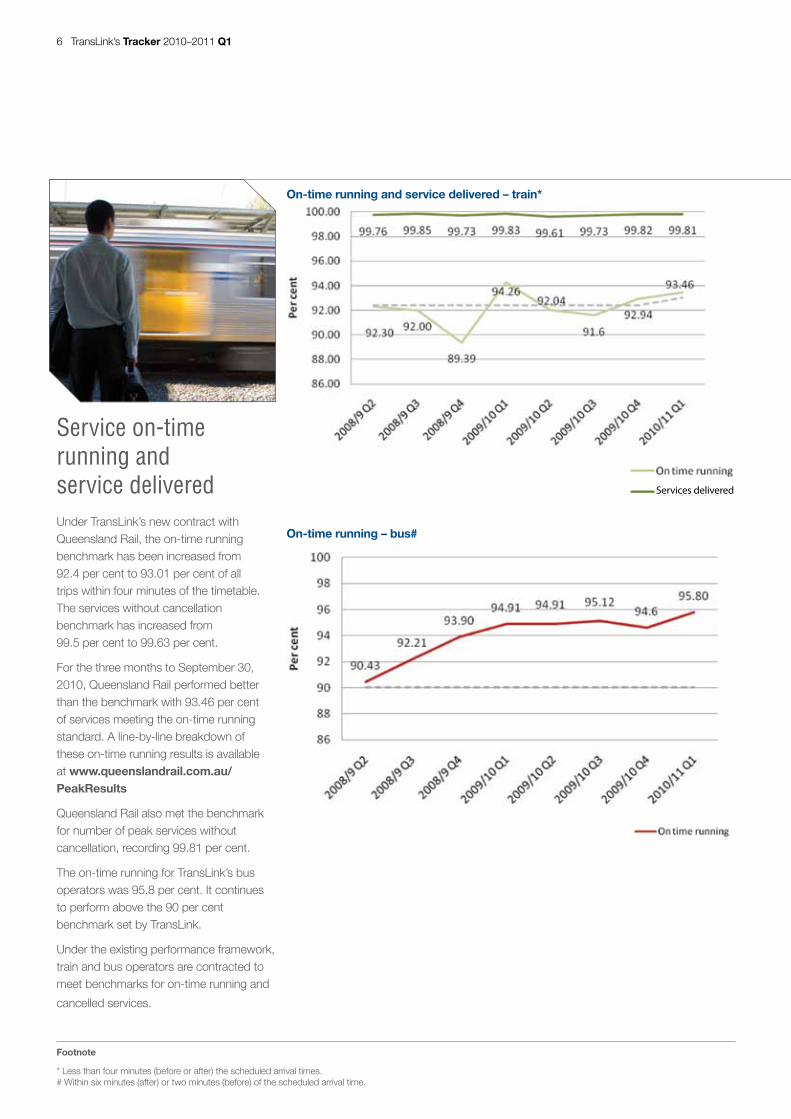
Service on-time running and service deliveredUnder TransLink’s new contract with Queensland Rail, the on-time running benchmark has been increased from 92.4 per cent to 93.01 per cent of all trips within four minutes of the timetable. The services without cancellation benchmark has increased from 99.5 per cent to 99.63 per cent.
For the three months to September 30, 2010, Queensland Rail performed better than the benchmark with 93.46 per cent of services meeting the on-time running standard. A line-by-line breakdown of these on-time running results is available at www.queenslandrail.com.au/PeakResults
Queensland Rail also met the benchmark for number of peak services without cancellation, recording 99.81 per cent.
The on-time running for TransLink’s bus operators was 95.8 per cent. It continues to perform above the 90 per cent benchmark set by TransLink.
Under the existing performance framework, train and bus operators are contracted to meet benchmarks for on-time running and
cancelled services.
On-time running and service delivered – train*
On-time running – bus#
Footnote
* Less than four minutes (before or after) the scheduled arrival times. # Within six minutes (after) or two minutes (before) of the scheduled arrival time.
Services delivered

TransLink’s Tracker 2010–2011 Q1 7
Customer enquiriesThe TransLink website received a record 4.3 million visits during Q1 – an increase of 49 per cent compared to the same period last year.
Journey planning enquires continues to be the primary reason for contacting TransLink through the website or call centre – 61 per cent or 2.8 million visits and calls.
There has been strong interest in the new mobile website following the launch of themobilespecificwebsiteinJulythisyear.Duringthefirstthreemonthsthemobile website experienced an average of nearly 6800 page views per day with approximately 63 per cent of visits accessing TransLink’s journey planner.
The website can be accessed at www.mobile.translink.com.au
TransLink is also working with customers to make the traditional website more user friendly with a new site launched
during Q2.
Customer complaints were down slightly from 3.87 to 3.62 per 10 000 trips, compared to the previous quarter. Compared with the same quarter last year, the overall number of customer complaints per 10 000 trips fell one per 10 000 trips – from 4.64 to 3.62 per 10 000 trips.
Customers can contact TransLink through the website at www.translink.com.au or
by calling the 24/7 call centre on 13 12 30.
Journey planner customer enquires
Total customer enquiries
Complaints customer enquiries

8 TransLink’s Tracker 2010–2011 Q1
go card use network wide
go card use by mode
go cardTransLink’s promotion to give away 400 000 go cards with $10 credit was completed during this quarter with 388 000 go cards distributed to individual Queenslanders and eligible charity groups. The remaining cards will continue to be distributed as part of the go ready program which presents to senior, pensioner and disability groups.
The transition of customers to go card continued at a similar rate to the previous quarter with go card used on 62.5 per cent of all trips, compared to 58.8 during Q4 2009–10.
There were 30.8 million trips taken using go card during the quarter, compared to 27.4 million trips during the previous quarter and more than double the 14.9 million trips taken during the corresponding quarter last year.

TransLink’s Tracker 2010–2011 Q1 9
go card customer complaints and adjustment requests
go card adjustments
The combined measure of go card complaints and adjustment requests has continued to fall, and is now at the lowest level since the go card was introduced to thenetworkduringthefirsthalfof2008.
Thenumberoffixedfares–customerseither not touching off or touching on – was 3.4 per cent, down from 3.5 per cent in Q4 2009–10. The number of customers receiving an adjustment was 3.8 per 10 000 trips.
If the go card fails to read correctly or the customer believes the charge amount is incorrect, they can request an adjustment by ringing TransLink’s 24-hour call centre
on 13 12 30.
go card fixed fares

10 TransLink’s Tracker 2010–2011 Q1
Customer satisfactionCustomer satisfaction continues to improve in various categories.
The quarterly customer satisfaction surveys are undertaken by TransLink to measure and compare changes in the opinions of public transport users across South East Queensland.
An overall satisfaction level has been added to this edition of Tracker. The categorieswithmostinfluenceofthis overall measure are reliability and frequency,efficiency,andcomfortofride.
In addition to the overall satisfaction level, there are 10 categories for all modes of public transport and one further category for go card. This edition of Tracker includes two bus categories – all TransLink contracted bus operators including Brisbane City Council (BCC) contract buses, and a stand-alone reporting of the BCC contract buses. This recognises that BCC is the major carrier of bus customers across the TransLink network.
Safety and security Safety at stops, stations and onboard vehicles.
Reliability and frequency Ability to meet departure times, frequency of services and reliability of
go card readers*.
Overall satisfaction A combination of all reported categories
Footnote
* Includes correction to previously published Ferry data.
TransLink’s Tracker 2010–2011 Q1 11
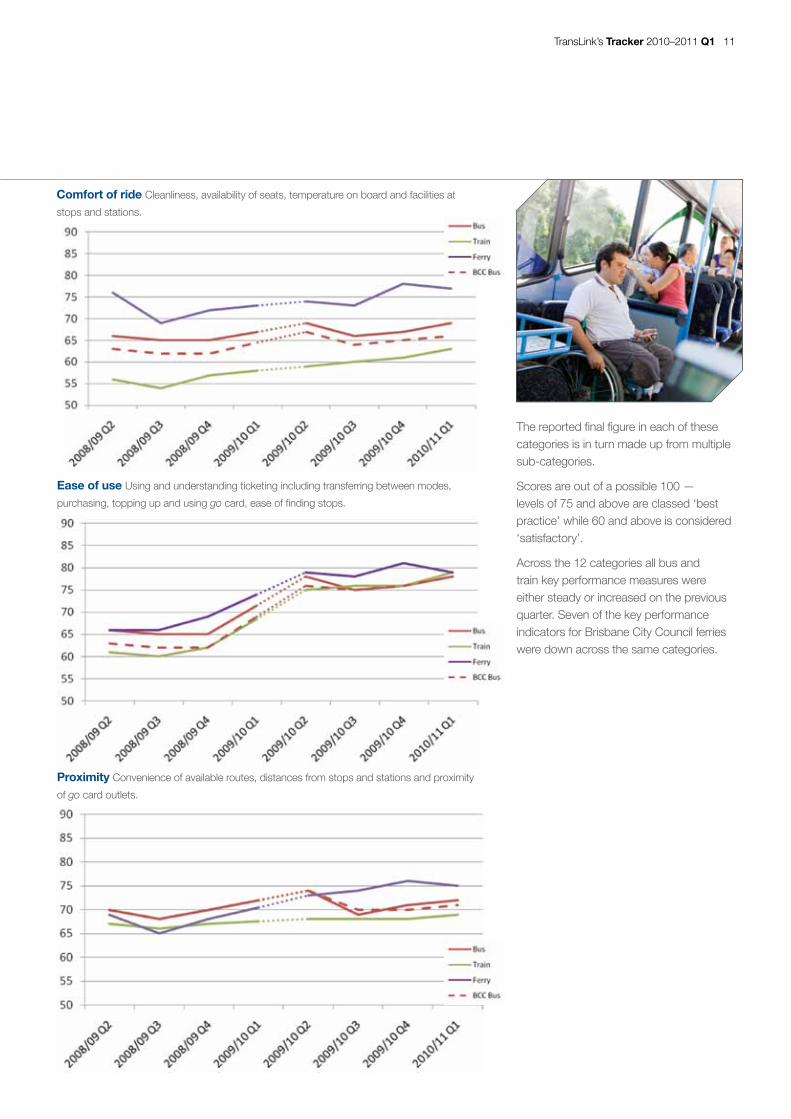
Ease of use Using and understanding ticketing including transferring between modes,
purchasing, topping up and using gocard,easeoffindingstops.
Proximity Convenience of available routes, distances from stops and stations and proximity
of go card outlets.
Comfort of ride Cleanliness, availability of seats, temperature on board and facilities at
stops and stations.
Thereportedfinalfigureineachofthesecategories is in turn made up from multiple sub-categories.
Scores are out of a possible 100 — levels of 75 and above are classed ‘best practice’ while 60 and above is considered ‘satisfactory’.
Across the 12 categories all bus and train key performance measures were either steady or increased on the previous quarter. Seven of the key performance indicators for Brisbane City Council ferries were down across the same categories.

12 TransLink’s Tracker 2010–2011 Q1
Information Ability to understand onboard and at-station information, timetables, maps
and journey planning information.
Helpfulness of staff Knowledge, conduct, presentation and helpfulness of staff.
Efficiency Door-to-door travel time, connections with other services and avoidance of congestion.

TransLink’s Tracker 2010–2011 Q1 13
Affordability Costofticketsandbenefitofnothavingtopayforparking.
Accessibility Ease of getting on and off the platform, and on and off the vehicles; reliability
of escalators and elevators.
go card Ease of purchasing and topping up a go card, managing a go card account and understanding information about the go card*.
Footnote
* This is a sub-category of the ‘Ease of Use’ category.

14 TransLink’s Tracker 2010–2011 Q1
Passenger safety and fare evasion Fare evasion continues to be a major challenge across the network, estimated to cost up to $18 million a year. Efforts to target fare evasion during this quarter included the closure of paper ticket fare gates at Central, Roma St and Fortitude Valley stations. Paper ticket customers are now required to show their ticket to a Queensland Rail staff member who activates the go card gates.
EightSeniorNetworkOfficerswereaddedto the network to provide an increased security presence, in addition to TransLink TransitOfficers,RailSquadPoliceand
private security staff.
Transitstaffissued4927finesand5323warnings during Q1.
Passenger safety data on passenger injuriesisincludedinTrackerforthefirsttime. This includes passengers on a bus and any persons injured in an incident where a bus is involved (such as a collision).
Fines and warnings
Passenger injuries

TransLink’s Tracker 2010–2011 Q1 15
Operator Profile Thompson Bus ServicesThompson Bus Service is a family owned company that commenced operations in 1979 when Geoff and Jean Thompson purchased Lawnton Bus Service. They startedwithfiveBedfordbuses,threeschool runs and two employees.
Geoff and Jean worked hard to grow the business over the years and today theyoperate40busesandcoaches,fiveDouble Decker buses, six urban services 7 days a week, 34 school runs, and they now have 60 employees.
This steady growth saw Thompson Bus Services relocate to their current depot at Youngs Crossing Road, Joyner in 1999.
During this time, Geoff and Jean had fivechildrenwhoallcommencedtheirapprenticeship in the bus industry from an early age—learning from the safety of their baby seat located directly behind the bus driver, who happened to be mum Jean.
Customer service, scheduling and rostering skills were learned from their father. Family values such as honesty, respect and reliability were also entrenched from an early age; and along with safety and customer service, these are the characteristics that resonate through the culture at Thompson Bus Services today.
2005wasadifficultyearforthecompanywith the sad passing of Geoff. This resulted in the second generation of Thompsons—who are equally passionate about the bus transport industry—taking responsibility for the day to day running and management of the company.
The third generations of Thompsons can on occasions be seen taking a keen interest in the daily operations or—as all parents relate to—providing solutions to computer or technological related problems.
Regardless of modern innovations and a move to more sustainable and greener ways to operate, Thompson’s core business principles remain unchanged today—excellent customer service and the delivery of quality reliable services.
Last year Thompson Bus Services celebrated 30 years in the industry. Management attribute much of the success and longevity of the company to their employees, and driving staff.
A spokesperson said they consider it a privilege to manage such a skilled and professional group of drivers many of whom have been loyal to the company for many years.
“We are very thankful to all our wonderful and loyal drivers.”
Coming from a large family of their own, the Thompsons fully appreciate the trust and responsibility that parents have entrusted in their business to transport their children to school.
“Taking children to school is taken very seriously and safety has always been, and will continue to be our number one priority. The bottom line is, we love driving your children to school.”
Following the commencement of their TransLinkcontractfiveyearsago,Thompsons have been able to provide 23 new buses for their school runs and urban services.
“Thishasbeenasignificantandimportantachievement for the local Pine Rivers community and has aided in integrating the community into the rapidly expanding Brisbane metropolitan area.
“Thompsons would like to take the opportunity to thank the Queensland Government and TransLink for the improvement in the public transport network that services the Pine Rivers region.
“We are looking forward to continuing to work with TransLink and the Queensland Government in the years ahead as solutions are sought to meet the ever increasing complexities surrounding public transport requirements and community expectations.”
Geoff Thompson
16 TransLink’s Tracker 2010–2011 Q1
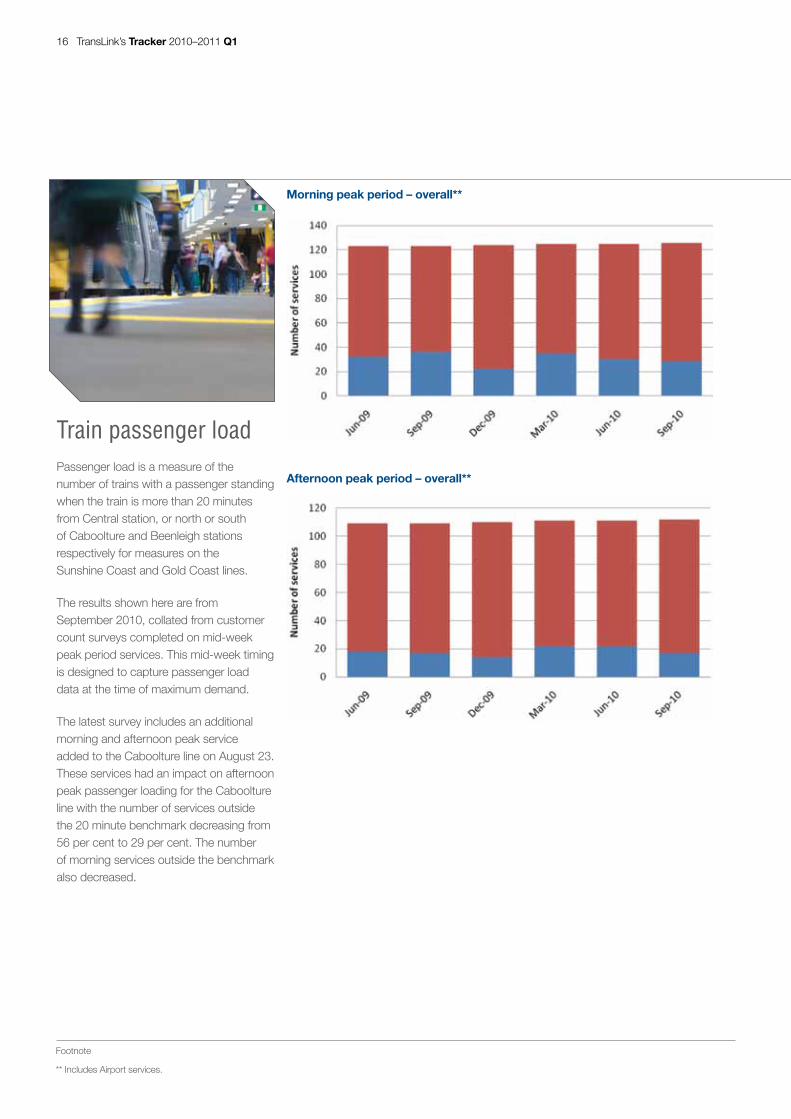
Train passenger loadPassenger load is a measure of the number of trains with a passenger standing when the train is more than 20 minutes from Central station, or north or south of Caboolture and Beenleigh stations respectively for measures on the Sunshine Coast and Gold Coast lines.
The results shown here are from September 2010, collated from customer count surveys completed on mid-week peak period services. This mid-week timing is designed to capture passenger load data at the time of maximum demand.
The latest survey includes an additional morning and afternoon peak service added to the Caboolture line on August 23. These services had an impact on afternoon peak passenger loading for the Caboolture line with the number of services outside the 20 minute benchmark decreasing from 56 per cent to 29 per cent. The number of morning services outside the benchmark also decreased.
Footnote
** Includes Airport services.
Morning peak period – overall**
Afternoon peak period – overall**

TransLink’s Tracker 2010–2011 Q1 17
Services which exceed benchmark
Morning peak by line
Jun-09 Sep-09 Dec-09 Mar-10 Jun-10 Sep-10
Beenleigh# 5 of 15 4 of 15 1 of 15 3 of 15 3 of 15 2 of 15
Caboolture# 6 of 21 9 of 21 6 of 21 8 of 21 10 of 21 9 of 22
Cleveland# 4 of 15 4 of 15 4 of 15 5 of 15 4 of 15 1 of 15
Doomben# 0 of 5 0 of 5 0 of 5 0 of 5 1 of 5 0 of 5
Ferny Grove# 0 of 15 0 of 15 0 of 15 2 of 15 0 of 15 0 of 15
Ipswich# 7 of 25 8 of 25 4 of 26 5 of 25 4 of 25 6 of 25
Shorncliffe# 3 of 8 3 of 8 2 of 8 3 of 8 3 of 8 3 of 8
Gold Coast# 5 of 7 5 of 7 4 of 7 5 of 8 3 of 8 4 of 8
Sunshine Coast# 2 of 5 3 of 5 1 of 5 4 of 5 2 of 5 3 of 5
Gold Coast only* 2 of 7 3 of 7 1 of 7 5 of 8 2 of 8 3 of 8
Sunshine Coast only* 0 of 5 0 of 5 0 of 5 0 of 5 1 of 5 0 of 5
Afternoon peak by line
Jun-09 Sep-09 Dec-09 Mar-10 Jun-10 Sep-10
Beenleigh# 0 of 12 1 of 12 0 of 12 1 of 12 0 of 12 0 of 12
Caboolture# 4 of 16 5 of 16 4 of 16 8 of 16 9 of 16 5 of 17
Cleveland# 3 of 12 3 of 12 3 of 12 3 of 12 3 of 12 2 of 12
Doomben# 0 of 4 0 of 4 0 of 4 0 of 4 0 of 4 0 of 4
Ferny Grove# 0 of 16 0 of 16 0 of 16 0 of 16 0 of 16 0 of 16
Ipswich# 4 of 19 2 of 19 2 of 20 4 of 20 2 of 20 3 of 20
Shorncliffe# 1 of 8 1 of 8 1 of 8 1 of 8 1 of 8 1 of 8
Gold Coast# 4 of 8 4 of 8 4 of 8 3 of 9 5 of 9 4 of 9
Sunshine Coast# 2 of 5 1 of 5 0 of 5 2 of 5 2 of 5 2 of 5
Gold Coast only* 2 of 8 1 of 8 0 of 8 2 of 9 2 of 9 2 of 9
Sunshine Coast only* 0 of 5 0 of 5 0 of 5 0 of 5 0 of 5 0 of 5
Additional morning and afternoon peak period services added to the Ipswich line on October 4 will be included as part of the next survey.
Overall the number of services outside the benchmark has decreased in the morning peak from 29 to 22 percent and in the afternoon peak period from 16 to 15 per cent when compared to the September 2009 survey.
Footnote
* Considers passengers standing north of Caboolture (Sunshine Coast only) and south of Beenleigh (Gold Coast only). # Considers passengers standing outside 20 minutes of the CBD.
18 TransLink’s Tracker 2010–2011 Q1
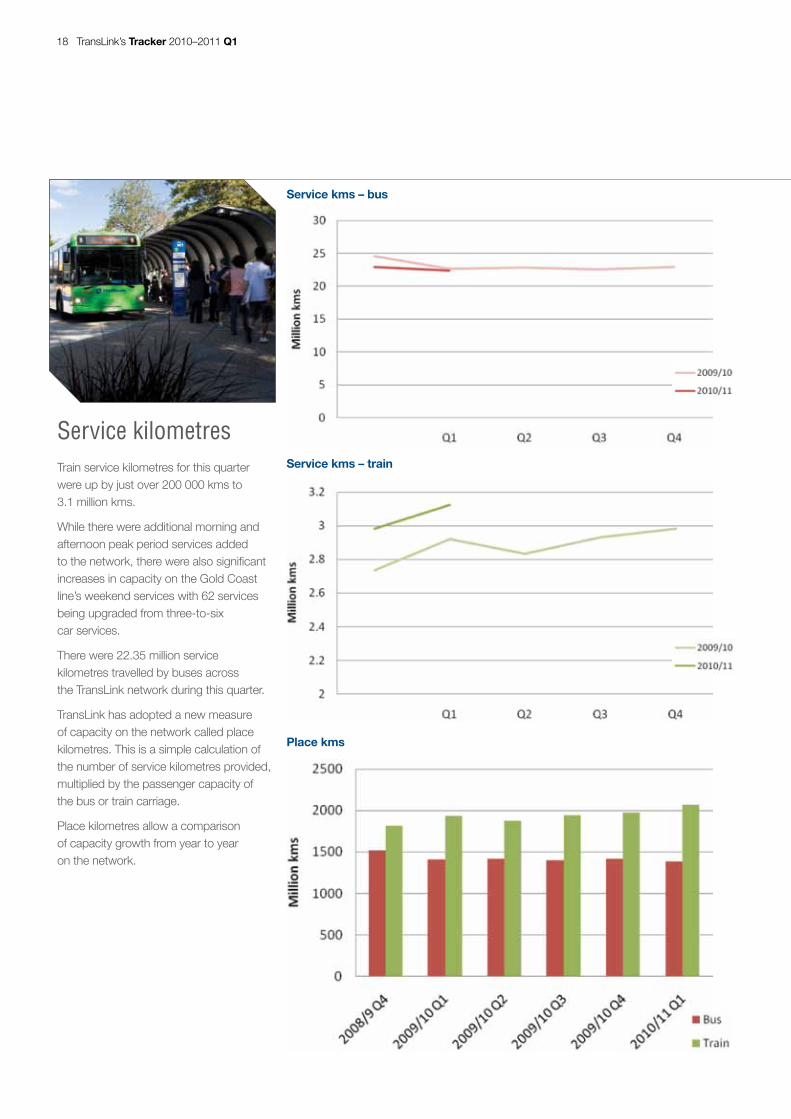
Service kilometres Train service kilometres for this quarter were up by just over 200 000 kms to 3.1 million kms.
While there were additional morning and afternoon peak period services added tothenetwork,therewerealsosignificantincreases in capacity on the Gold Coast line’s weekend services with 62 services being upgraded from three-to-six car services.
There were 22.35 million service kilometres travelled by buses across the TransLink network during this quarter.
TransLink has adopted a new measure of capacity on the network called place kilometres. This is a simple calculation of the number of service kilometres provided, multiplied by the passenger capacity of the bus or train carriage.
Place kilometres allow a comparison of capacity growth from year to year on the network.
Service kms – bus
Service kms – train
Place kms