Embed Size (px)
Citation preview
TRANSLATION OF THE FRENCHFINANCIAL DOCUMENTS
FISCAL YEAR ENDED DECEMBER 31, 2018
1_VA_V3 28/01/2019 13:34 PageI
CONTENTS
EXECUTIVE AND SUPERVISORY BODIES; STATUTORY AUDITORS AS OF DECEMBER 31, 2018 1FINANCIAL HIGHLIGHTS 2HIGHLIGHTS AND OUTLOOK 4SHARE CAPITAL AND VOTING RIGHTS 4
BUSINESS REVIEW AND COMMENTS ON THE CONSOLIDATED FINANCIAL STATEMENTS OF LVMH GROUP 5
COMMENTS ON THE CONSOLIDATED INCOME STATEMENT 6WINES AND SPIRITS 10FASHION AND LEATHER GOODS 11PERFUMES AND COSMETICS 13WATCHES AND JEWELRY 14SELECTIVE RETAILING 15COMMENTS ON THE CONSOLIDATED BALANCE SHEET 17COMMENTS ON THE CONSOLIDATED CASH FLOW STATEMENT 18
CONDENSED CONSOLIDATED FINANCIAL STATEMENTS 21
CONSOLIDATED INCOME STATEMENT 22CONSOLIDATED STATEMENT OF COMPREHENSIVE GAINS AND LOSSES 23CONSOLIDATED BALANCE SHEET 24CONSOLIDATED STATEMENT OF CHANGES IN EQUITY 25CONSOLIDATED CASH FLOW STATEMENT 26SELECTED NOTES TO THE CONSOLIDATED FINANCIAL STATEMENTS 27
This document is a free translation into English of the original French “Documents financiers – 31 décembre 2018”, hereafterreferred to as the “Financial Documents”. It is not a binding document. In the event of a conflict in interpretation, referenceshould be made to the French version, which is the authentic text.
1_VA_V3 28/01/2019 13:34 PageII
(a) Independent Director.(b) Appointment proposed to the Shareholders’ Meeting of April 18, 2019.(c) Appointment as from January 15, 2019.
Board of Directors
Bernard ArnaultChairman and Chief Executive Officer
Antonio BelloniGroup Managing Director
Antoine Arnault
Delphine Arnault
Nicolas Bazire
Bernadette Chirac (a)
Charles de Croisset (a)
Diego Della Valle (a)
Clara Gaymard(a)
Marie-Josée Kravis (a)
Lord Powell of Bayswater
Marie-Laure Sauty de Chalon(a)
Yves-Thibault de Silguy(a)
Hubert Védrine(a)
Sophie Chassat (b)
Advisory Board member
Paolo Bulgari
Executive Committee
Bernard ArnaultChairman and Chief Executive Officer
Antonio BelloniGroup Managing Director
Delphine Arnault (c)
Louis Vuitton Products
Nicolas BazireDevelopment and Acquisitions
Pietro BeccariChristian Dior Couture
Michael BurkeLouis Vuitton
Chantal GaemperleHuman Resources and Synergies
Jean-Jacques GuionyFinance
Christopher de LapuenteSephora and Beauty
Philippe SchausWines and Spirits
Sidney ToledanoFashion Group
Jean-Baptiste VoisinStrategy
General Secretary
Marc-Antoine Jamet
Performance Audit Committee
Yves-Thibault de Silguy(a)
Chairman
Antoine Arnault
Charles de Croisset (a)
Nominations and Compensation Committee
Charles de Croisset (a)
Chairman
Marie-Josée Kravis (a)
Yves-Thibault de Silguy(a)
Ethical and Sustainable Development Committee
Yves-Thibault de Silguy(a)
Chairman
Delphine Arnault
Marie-Laure Sauty de Chalon(a)
Hubert Védrine(a)
Statutory Auditors
ERNST & YOUNG Auditrepresented by Jeanne Boillet and Patrick Vincent-Genod
MAZARSrepresented by Simon Beillevaire and Loïc Wallaert
EXECUTIVE AND SUPERVISORY BODIES; STATUTORY AUDITORS AS OF DECEMBER 31, 2018
1Financial Documents - December 31, 2018
1_VA_V3 28/01/2019 13:34 Page1
FINANCIAL HIGHLIGHTS
2 Financial Documents - December 31, 2018
Revenue(EUR millions) Change in revenue by business group 2018 2017 2018/2017 Change 2016
(EUR millions and percentage) Published Organic(a)
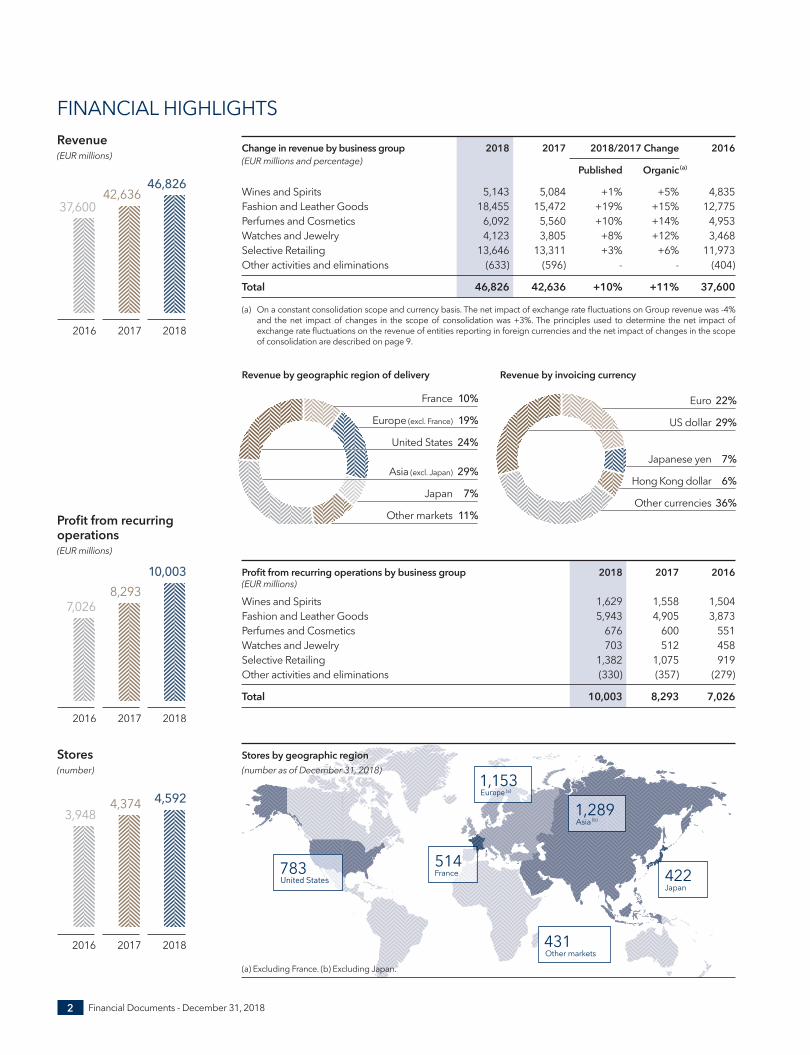
Wines and Spirits 5,143 5,084 +1% +5% 4,835Fashion and Leather Goods 18,455 15,472 +19% +15% 12,775Perfumes and Cosmetics 6,092 5,560 +10% +14% 4,953Watches and Jewelry 4,123 3,805 +8% +12% 3,468Selective Retailing 13,646 13,311 +3% +6% 11,973Other activities and eliminations (633) (596) - - (404)
Total 46,826 42,636 +10% +11% 37,600
(a) On a constant consolidation scope and currency basis. The net impact of exchange rate fluctuations on Group revenue was - 4%and the net impact of changes in the scope of consolidation was +3%. The principles used to determine the net impact ofexchange rate fluctuations on the revenue of entities reporting in foreign currencies and the net impact of changes in the scopeof consolidation are described on page 9.
Profit from recurring operations by business group 2018 2017 20 16(EUR millions)Wines and Spirits 1,629 1,558 1,504Fashion and Leather Goods 5,943 4,905 3,873Perfumes and Cosmetics 676 600 551Watches and Jewelry 703 512 458Selective Retailing 1,382 1,075 919Other activities and eliminations (330) (357) (279)
Total 10,003 8,293 7,026
11%Other markets
19%Europe (excl. France)
24%United States
Asia (excl. Japan) 29%
Japan 7%
France 10% 22%Euro
29%US dollar
Japanese yen 7%
Other currencies 36%
Hong Kong dollar 6%
Revenue by invoicing currency
37,60042,636
46,826
2016 2017 2018
Profit from recurringoperations(EUR millions)
7,0268,293
10,003
2016 2017 2018
Stores(number)
Stores by geographic region(number as of December 31, 2018)
2016
3,948
2017
4,374
2018
4,592
783United States
514France
1,153Europe (a)
431Other markets
(a) Excluding France. (b) Excluding Japan.
1,289Asia (b)
422Japan
Revenue by geographic region of delivery
1_VA_V3 28/01/2019 13:34 Page2
3Financial Documents - December 31, 2018
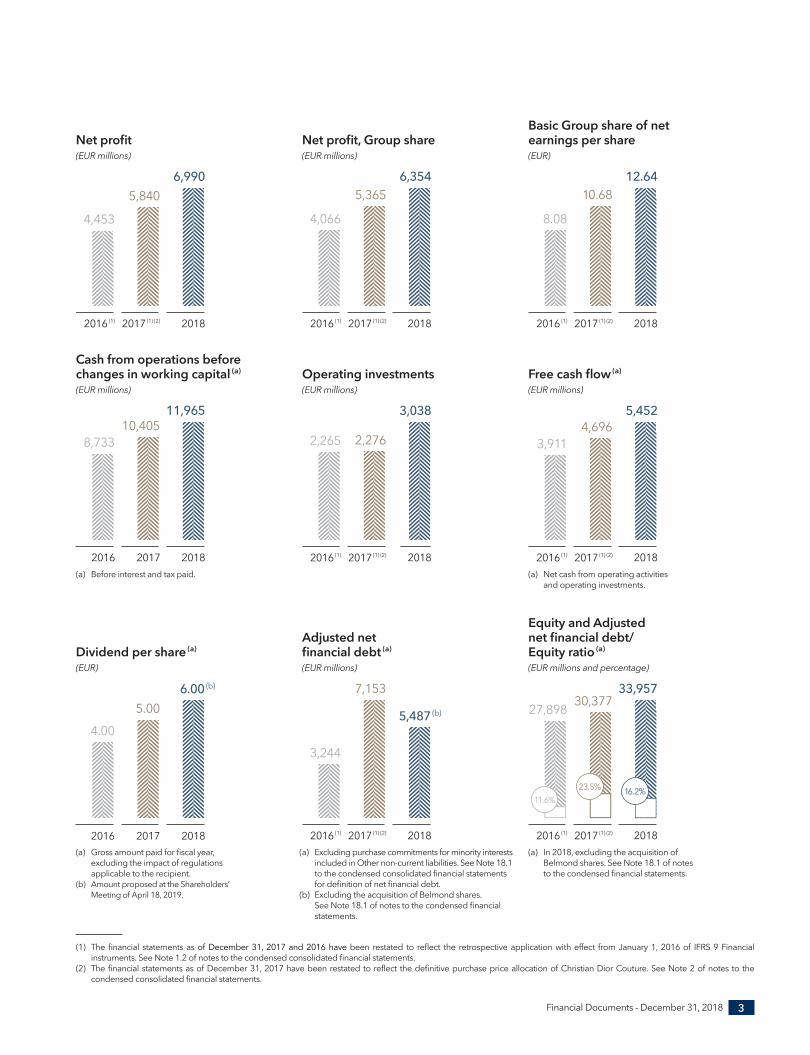
Net profit(EUR millions)
6,990
2016 (1) 2017 (1) (2) 2018
4,4535,840
Net profit, Group share(EUR millions)
2018
4,066
6,3545,365
2016 (1) 2017 (1) (2) 2018
8.0810.68
12.64
2016 (1) 2017 (1) (2)
2016 2017 2018
4.005.00
6.00 (b)
3,244
7,153
20182016 (1) 2017 (1) (2)
5,487 (b)
33,95727,898 30,377
23.5% 16.2%11.6%
20182016 (1) 2017 (1) (2)
8,73310,405
11,965
2016 2017 2018
Operating investments(EUR millions)
3,038
2,265 2,276
20182016 (1) 2017 (1) (2)
3,9114,696
5,452
20182016 (1) 2017 (1) (2)
(a) Gross amount paid for fiscal year,excluding the impact of regulationsapplicable to the recipient.
(b) Amount proposed at the Shareholders’Meeting of April 18, 2019.
(a) In 2018, excluding the acquisition of Belmond shares. See Note 18.1 of notes to the condensed financial statements.
(a) Before interest and tax paid.
(a) Excluding purchase commitments for minority interestsincluded in Other non-current liabilities. See Note 18.1to the condensed consolidated financial statementsfor definition of net financial debt.
(b) Excluding the acquisition of Belmond shares. See Note 18.1 of notes to the condensed financialstatements.
(1) The financial statements as of December 31, 2017 and 2016 have been restated to reflect the retrospective application with effect from January 1, 2016 of IFRS 9 Financialinstruments. See Note 1.2 of notes to the condensed consolidated financial statements.
(2) The financial statements as of December 31, 2017 have been restated to reflect the definitive purchase price allocation of Christian Dior Couture. See Note 2 of notes to thecondensed consolidated financial statements.
(a) Net cash from operating activities and operating investments.
Dividend per share (a)
(EUR)
Cash from operations beforechanges in working capital (a)
(EUR millions)
Adjusted net financial debt (a)
(EUR millions)
Equity and Adjusted net financial debt/Equity ratio (a)
(EUR millions and percentage)
Free cash flow (a)
(EUR millions)
Basic Group share of netearnings per share(EUR)
1_VA_V3 28/01/2019 13:34 Page3
SHARE CAPITAL AND VOTING RIGHTS
Number Number of % of capital % of voting of shares voting rights(a) rights
Arnault Family Group 238,155,505 464,890,015 47.16% 63.27%Other 266,873,990 269,838,087 52.84% 36.73%
Total as of December 31, 2018 505,029,495 734,728,102 100.00% 100.00%
(a) Total number of voting rights that may be exercised at Shareholders’ Meetings.
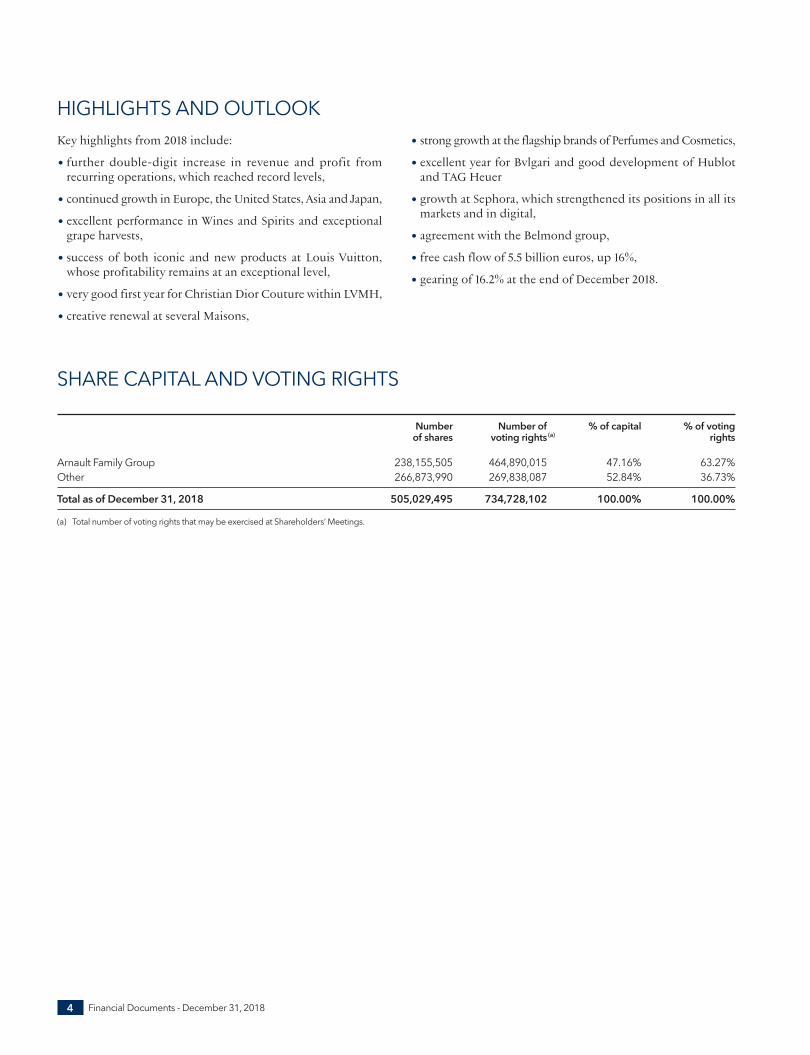
Key highlights from 2018 include:
• further double-digit increase in revenue and profit fromrecurring operations, which reached record levels,
• continued growth in Europe, the United States, Asia and Japan,
• excellent performance in Wines and Spirits and exceptionalgrape harvests,
• success of both iconic and new products at Louis Vuitton,whose profitability remains at an exceptional level,
• very good first year for Christian Dior Couture within LVMH,
• creative renewal at several Maisons,
• strong growth at the flagship brands of Perfumes and Cosmetics,
• excellent year for Bvlgari and good development of Hublotand TAG Heuer
• growth at Sephora, which strengthened its positions in all itsmarkets and in digital,
• agreement with the Belmond group,
• free cash flow of 5.5 billion euros, up 16%,
• gearing of 16.2% at the end of December 2018.
4 Financial Documents - December 31, 2018
HIGHLIGHTS AND OUTLOOK
1_VA_V3 28/01/2019 13:34 Page4
5Financial Documents - December 31, 2018
BUSINESS REVIEW AND COMMENTS ON THE CONSOLIDATED FINANCIAL STATEMENTS OF LVMH GROUP
1 COMMENTS ON THE CONSOLIDATED INCOME STATEMENT 62. WINES AND SPIRITS 103. FASHION AND LEATHER GOODS 114. PERFUMES AND COSMETICS 135. WATCHES AND JEWELRY 146. SELECTIVE RETAILING 157. COMMENTS ON THE CONSOLIDATED BALANCE SHEET 178. COMMENTS ON THE CONSOLIDATED CASH FLOW STATEMENT 18
1_VA_V3 28/01/2019 13:34 Page5
BUSINESS REVIEW AND COMMENTS ON THE CONSOLIDATED FINANCIAL STATEMENTS OF LVMH GROUP
6 Financial Documents - December 31, 2018
Comments on the consolidated income statement
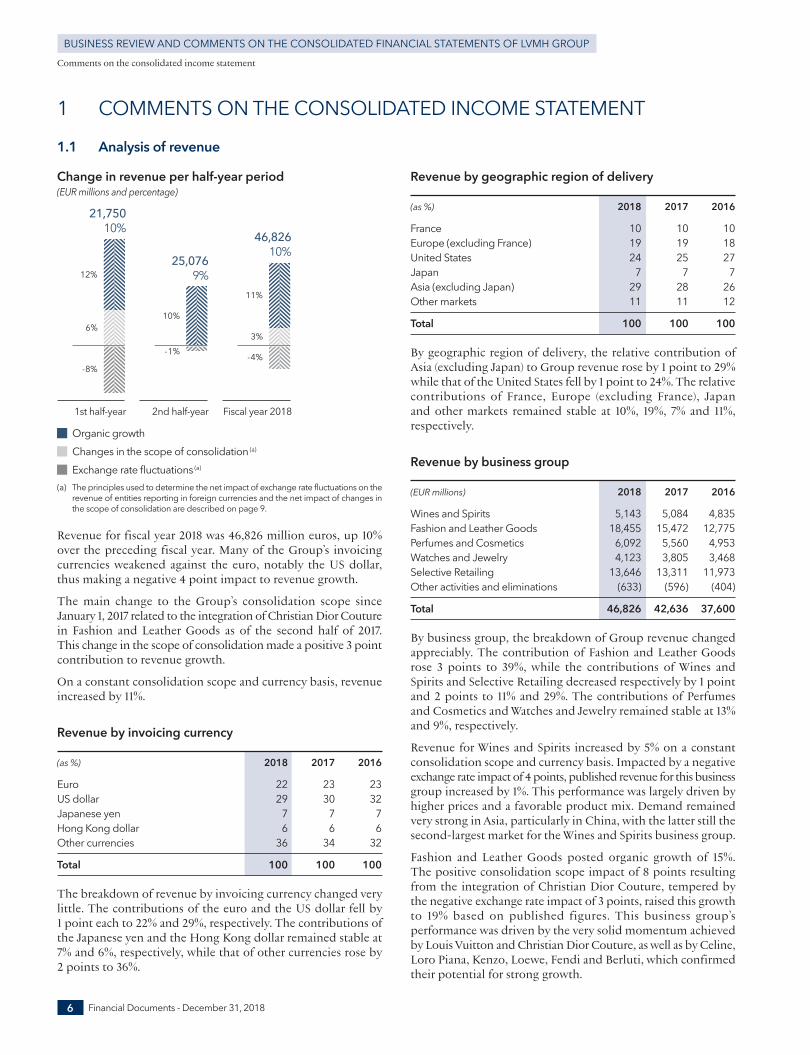
Change in revenue per half-year period (EUR millions and percentage)
(a) The principles used to determine the net impact of exchange rate fluctuations on therevenue of entities reporting in foreign currencies and the net impact of changes inthe scope of consolidation are described on page 9.
Revenue for fiscal year 2018 was 46,826 million euros, up 10%over the preceding fiscal year. Many of the Group’s invoicingcurrencies weakened against the euro, notably the US dollar,thus making a negative 4 point impact to revenue growth.
The main change to the Group’s consolidation scope sinceJanuary 1, 2017 related to the integration of Christian Dior Couturein Fashion and Leather Goods as of the second half of 2017.This change in the scope of consolidation made a positive 3 pointcontribution to revenue growth.
On a constant consolidation scope and currency basis, revenueincreased by 11%.
Revenue by invoicing currency
(as %) 2018 2017 2016
Euro 22 23 23US dollar 29 30 32Japanese yen 7 7 7Hong Kong dollar 6 6 6Other currencies 36 34 32
Total 100 100 100
The breakdown of revenue by invoicing currency changed verylittle. The contributions of the euro and the US dollar fell by 1 point each to 22% and 29%, respectively. The contributions ofthe Japanese yen and the Hong Kong dollar remained stable at7% and 6%, respectively, while that of other currencies rose by 2 points to 36%.
Revenue by geographic region of delivery
(as %) 2018 2017 2016
France 10 10 10Europe (excluding France) 19 19 18United States 24 25 27Japan 7 7 7Asia (excluding Japan) 29 28 26Other markets 11 11 12
Total 100 100 100
By geographic region of delivery, the relative contribution ofAsia (excluding Japan) to Group revenue rose by 1 point to 29%while that of the United States fell by 1 point to 24%. The relativecontributions of France, Europe (excluding France), Japan and other markets remained stable at 10%, 19%, 7% and 11%,respectively.
Revenue by business group
(EUR millions) 2018 2017 2016
Wines and Spirits 5,143 5,084 4,835Fashion and Leather Goods 18,455 15,472 12,775Perfumes and Cosmetics 6,092 5,560 4,953Watches and Jewelry 4,123 3,805 3,468Selective Retailing 13,646 13,311 11,973Other activities and eliminations (633) (596) (404)
Total 46,826 42,636 37,600
By business group, the breakdown of Group revenue changedappreciably. The contribution of Fashion and Leather Goodsrose 3 points to 39%, while the contributions of Wines andSpirits and Selective Retailing decreased respectively by 1 pointand 2 points to 11% and 29%. The contributions of Perfumesand Cosmetics and Watches and Jewelry remained stable at 13%and 9%, respectively.
Revenue for Wines and Spirits increased by 5% on a constantconsolidation scope and currency basis. Impacted by a negativeexchange rate impact of 4 points, published revenue for this businessgroup increased by 1%. This performance was largely driven byhigher prices and a favorable product mix. Demand remainedvery strong in Asia, particularly in China, with the latter still thesecond-largest market for the Wines and Spirits business group.
Fashion and Leather Goods posted organic growth of 15%. The positive consolidation scope impact of 8 points resultingfrom the integration of Christian Dior Couture, tempered bythe negative exchange rate impact of 3 points, raised this growthto 19% based on published figures. This business group’sperformance was driven by the very solid momentum achievedby Louis Vuitton and Christian Dior Couture, as well as by Celine,Loro Piana, Kenzo, Loewe, Fendi and Berluti, which confirmedtheir potential for strong growth.
1 COMMENTS ON THE CONSOLIDATED INCOME STATEMENT
1.1 Analysis of revenue
12%
10%
11%
6%
-8%
-1% -4%
3%
21,75010%
25,0769%
46,82610%
Fiscal year 2018
Organic growthChanges in the scope of consolidation (a)
Exchange rate fluctuations (a)
2nd half-year1st half-year
1_VA_V3 28/01/2019 13:34 Page6
7Financial Documents - December 31, 2018
Comments on the consolidated income statement
BUSINESS REVIEW AND COMMENTS ON THE CONSOLIDATED FINANCIAL STATEMENTS OF LVMH GROUP
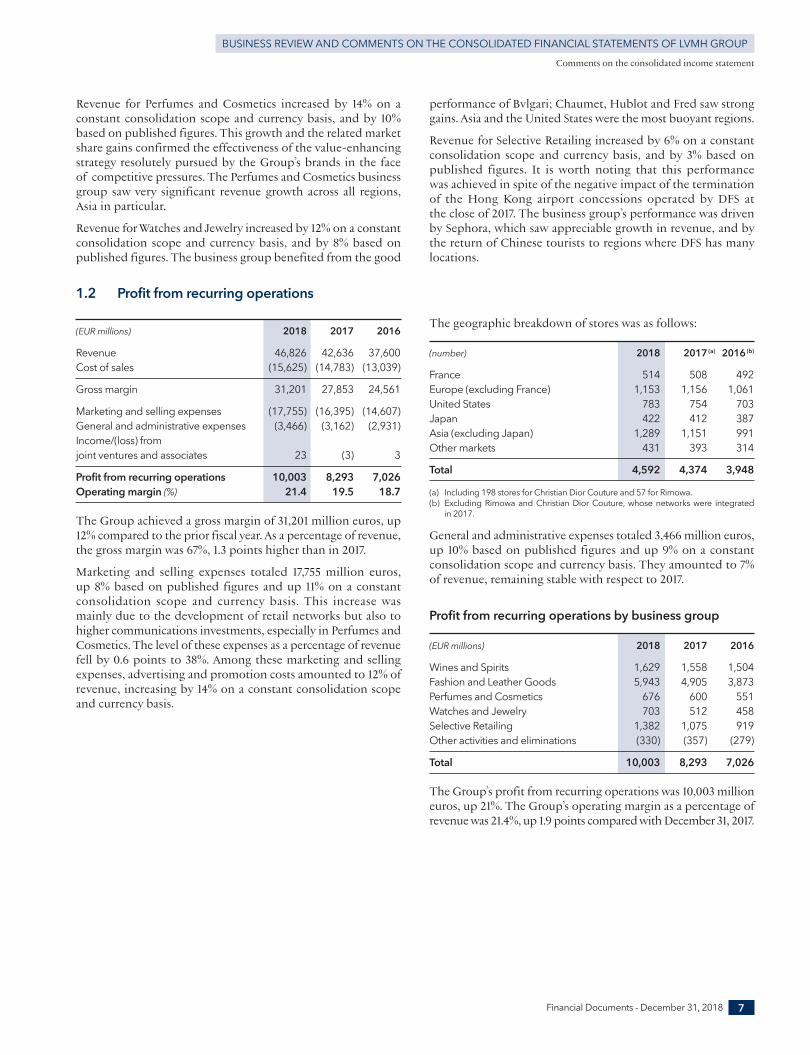
(EUR millions) 2018 2017 2016
Revenue 46,826 42,636 37,600Cost of sales (15,625) (14,783) (13,039)
Gross margin 31,201 27,853 24,561
Marketing and selling expenses (17,755) (16,395) (14,607)General and administrative expenses (3,466) (3,162) (2,931)Income/(loss) from joint ventures and associates 23 (3) 3
Profit from recurring operations 10,003 8,293 7,026Operating margin (%) 21.4 19.5 18.7
The Group achieved a gross margin of 31,201 million euros, up12% compared to the prior fiscal year. As a percentage of revenue,the gross margin was 67%, 1.3 points higher than in 2017.
Marketing and selling expenses totaled 17,755 million euros, up 8% based on published figures and up 11% on a constantconsolidation scope and currency basis. This increase was mainly due to the development of retail networks but also tohigher communications investments, especially in Perfumes andCosmetics. The level of these expenses as a percentage of revenuefell by 0.6 points to 38%. Among these marketing and sellingexpenses, advertising and promotion costs amounted to 12% ofrevenue, increasing by 14% on a constant consolidation scopeand currency basis.
The geographic breakdown of stores was as follows:
(number) 2018 2017(a) 2016(b)
France 514 508 492Europe (excluding France) 1,153 1,156 1,061United States 783 754 703Japan 422 412 387Asia (excluding Japan) 1,289 1,151 991Other markets 431 393 314
Total 4,592 4,374 3,948
(a) Including 198 stores for Christian Dior Couture and 57 for Rimowa.(b) Excluding Rimowa and Christian Dior Couture, whose networks were integrated
in 2017.
General and administrative expenses totaled 3,466 million euros,up 10% based on published figures and up 9% on a constantconsolidation scope and currency basis. They amounted to 7%of revenue, remaining stable with respect to 2017.
Profit from recurring operations by business group
(EUR millions) 2018 2017 2016
Wines and Spirits 1,629 1,558 1,504Fashion and Leather Goods 5,943 4,905 3,873Perfumes and Cosmetics 676 600 551Watches and Jewelry 703 512 458Selective Retailing 1,382 1,075 919Other activities and eliminations (330) (357) (279)
Total 10,003 8,293 7,026
The Group’s profit from recurring operations was 10,003 millioneuros, up 21%. The Group’s operating margin as a percentage ofrevenue was 21.4%, up 1.9 points compared with December 31, 2017.
1.2 Profit from recurring operations
Revenue for Perfumes and Cosmetics increased by 14% on aconstant consolidation scope and currency basis, and by 10%based on published figures. This growth and the related marketshare gains confirmed the effectiveness of the value-enhancingstrategy resolutely pursued by the Group’s brands in the face of competitive pressures. The Perfumes and Cosmetics businessgroup saw very significant revenue growth across all regions,Asia in particular.
Revenue for Watches and Jewelry increased by 12% on a constantconsolidation scope and currency basis, and by 8% based onpublished figures. The business group benefited from the good
performance of Bvlgari; Chaumet, Hublot and Fred saw stronggains. Asia and the United States were the most buoyant regions.
Revenue for Selective Retailing increased by 6% on a constantconsolidation scope and currency basis, and by 3% based onpublished figures. It is worth noting that this performance was achieved in spite of the negative impact of the terminationof the Hong Kong airport concessions operated by DFS at the close of 2017. The business group’s performance was drivenby Sephora, which saw appreciable growth in revenue, and bythe return of Chinese tourists to regions where DFS has manylocations.
1_VA_V3 28/01/2019 13:34 Page7
BUSINESS REVIEW AND COMMENTS ON THE CONSOLIDATED FINANCIAL STATEMENTS OF LVMH GROUP
8 Financial Documents - December 31, 2018
Comments on the consolidated income statement
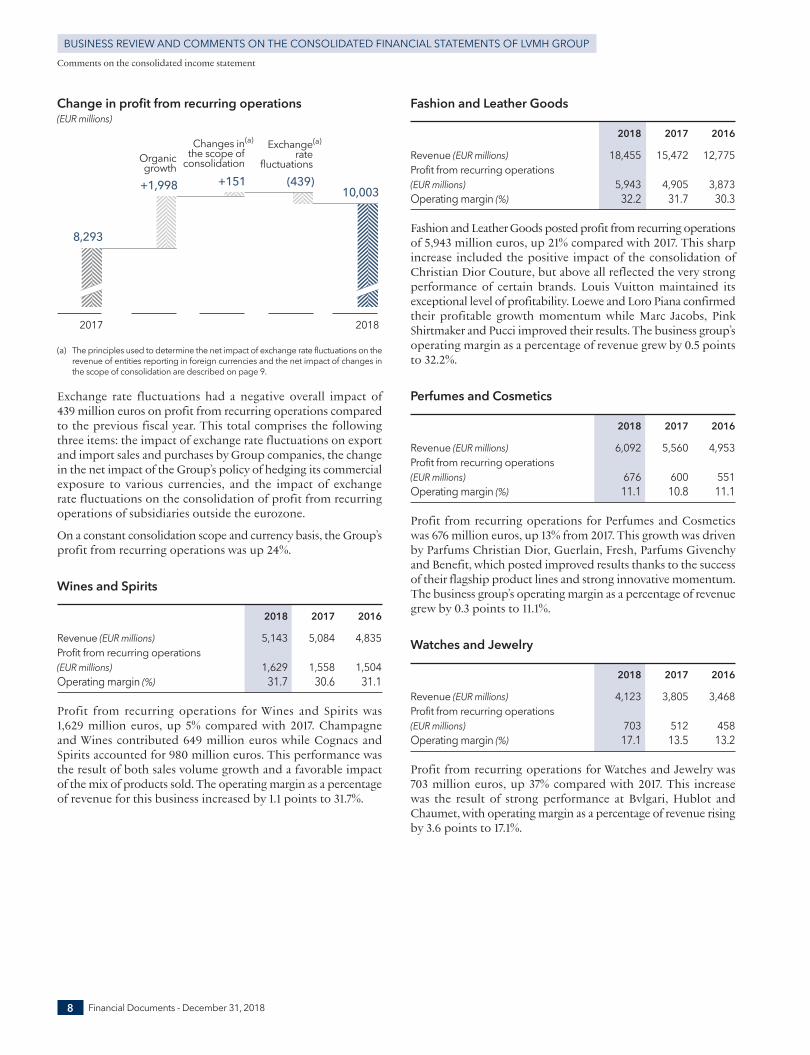
Change in profit from recurring operations (EUR millions)
(a) The principles used to determine the net impact of exchange rate fluctuations on therevenue of entities reporting in foreign currencies and the net impact of changes inthe scope of consolidation are described on page 9.
Exchange rate fluctuations had a negative overall impact of439 million euros on profit from recurring operations comparedto the previous fiscal year. This total comprises the followingthree items: the impact of exchange rate fluctuations on exportand import sales and purchases by Group companies, the changein the net impact of the Group’s policy of hedging its commercialexposure to various currencies, and the impact of exchange rate fluctuations on the consolidation of profit from recurringoperations of subsidiaries outside the eurozone.
On a constant consolidation scope and currency basis, the Group’sprofit from recurring operations was up 24%.
Wines and Spirits
2018 2017 2016
Revenue (EUR millions) 5,143 5,084 4,835Profit from recurring operations (EUR millions) 1,629 1,558 1,504Operating margin (%) 31.7 30.6 31.1
Profit from recurring operations for Wines and Spirits was1,629 million euros, up 5% compared with 2017. Champagneand Wines contributed 649 million euros while Cognacs andSpirits accounted for 980 million euros. This performance wasthe result of both sales volume growth and a favorable impactof the mix of products sold. The operating margin as a percentageof revenue for this business increased by 1.1 points to 31.7%.
Fashion and Leather Goods
2018 2017 2016
Revenue (EUR millions) 18,455 15,472 12,775Profit from recurring operations (EUR millions) 5,943 4,905 3,873Operating margin (%) 32.2 31.7 30.3
Fashion and Leather Goods posted profit from recurring operationsof 5,943 million euros, up 21% compared with 2017. This sharpincrease included the positive impact of the consolidation ofChristian Dior Couture, but above all reflected the very strongperformance of certain brands. Louis Vuitton maintained itsexceptional level of profitability. Loewe and Loro Piana confirmedtheir profitable growth momentum while Marc Jacobs, PinkShirtmaker and Pucci improved their results. The business group’soperating margin as a percentage of revenue grew by 0.5 pointsto 32.2%.
Perfumes and Cosmetics
2018 2017 2016
Revenue (EUR millions) 6,092 5,560 4,953Profit from recurring operations (EUR millions) 676 600 551Operating margin (%) 11.1 10.8 11.1
Profit from recurring operations for Perfumes and Cosmeticswas 676 million euros, up 13% from 2017. This growth was drivenby Parfums Christian Dior, Guerlain, Fresh, Parfums Givenchyand Benefit, which posted improved results thanks to the successof their flagship product lines and strong innovative momentum.The business group’s operating margin as a percentage of revenuegrew by 0.3 points to 11.1%.
Watches and Jewelry
2018 2017 2016
Revenue (EUR millions) 4,123 3,805 3,468Profit from recurring operations (EUR millions) 703 512 458Operating margin (%) 17.1 13.5 13.2
Profit from recurring operations for Watches and Jewelry was703 million euros, up 37% compared with 2017. This increasewas the result of strong performance at Bvlgari, Hublot andChaumet, with operating margin as a percentage of revenue risingby 3.6 points to 17.1%.
(439)
8,293
2017
+1,998 +15110,003
2018
(a)(a)
Organicgrowth
Changes inthe scope of
consolidationExchange
ratefluctuations
1_VA_V3 28/01/2019 13:34 Page8
9Financial Documents - December 31, 2018
Comments on the consolidated income statement
BUSINESS REVIEW AND COMMENTS ON THE CONSOLIDATED FINANCIAL STATEMENTS OF LVMH GROUP
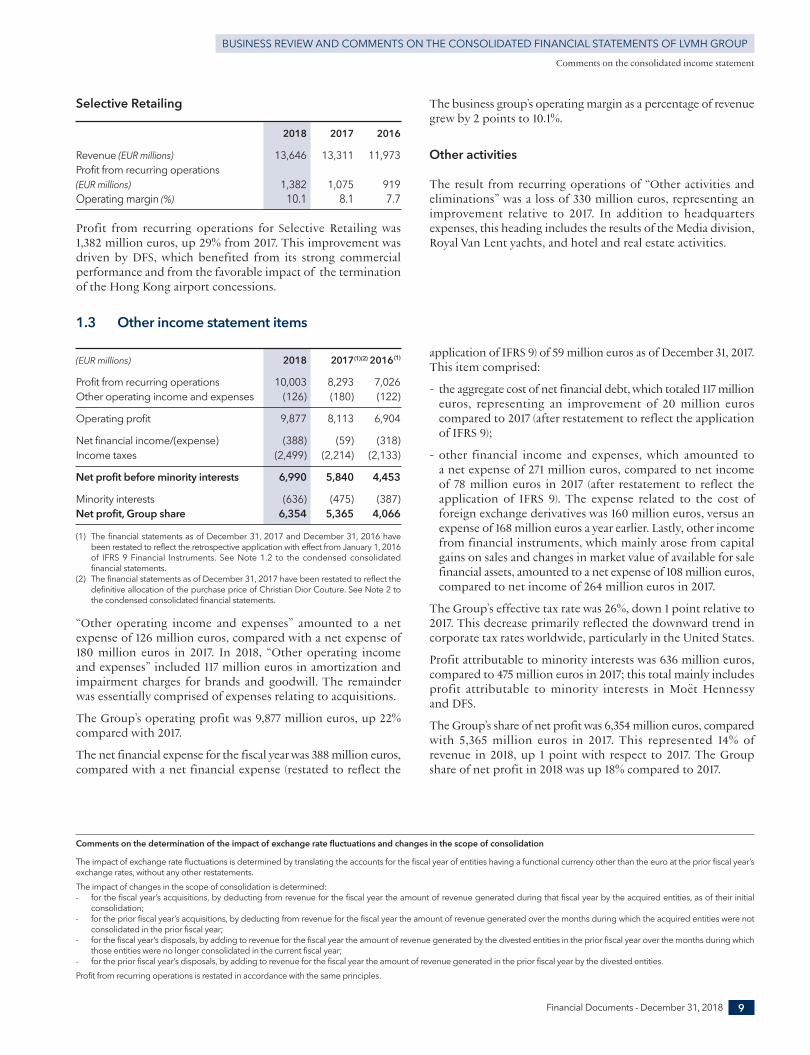
(EUR millions) 2018 2017(1) (2) 2016(1)
Profit from recurring operations 10,003 8,293 7,026Other operating income and expenses (126) (180) (122)
Operating profit 9,877 8,113 6,904
Net financial income/(expense) (388) (59) (318)Income taxes (2,499) (2,214) (2,133)
Net profit before minority interests 6,990 5,840 4,453
Minority interests (636) (475) (387)Net profit, Group share 6,354 5,365 4,066
(1) The financial statements as of December 31, 2017 and December 31, 2016 havebeen restated to reflect the retrospective application with effect from January 1, 2016of IFRS 9 Financial Instruments. See Note 1.2 to the condensed consolidatedfinancial statements.
(2) The financial statements as of December 31, 2017 have been restated to reflect thedefinitive allocation of the purchase price of Christian Dior Couture. See Note 2 tothe condensed consolidated financial statements.
“Other operating income and expenses” amounted to a netexpense of 126 million euros, compared with a net expense of180 million euros in 2017. In 2018, “Other operating incomeand expenses” included 117 million euros in amortization andimpairment charges for brands and goodwill. The remainderwas essentially comprised of expenses relating to acquisitions.
The Group’s operating profit was 9,877 million euros, up 22%compared with 2017.
The net financial expense for the fiscal year was 388 million euros,compared with a net financial expense (restated to reflect the
application of IFRS 9) of 59 million euros as of December 31, 2017.This item comprised:
- the aggregate cost of net financial debt, which totaled 117 millioneuros, representing an improvement of 20 million euroscompared to 2017 (after restatement to reflect the applicationof IFRS 9);
- other financial income and expenses, which amounted to a net expense of 271 million euros, compared to net incomeof 78 million euros in 2017 (after restatement to reflect theapplication of IFRS 9). The expense related to the cost offoreign exchange derivatives was 160 million euros, versus anexpense of 168 million euros a year earlier. Lastly, other incomefrom financial instruments, which mainly arose from capitalgains on sales and changes in market value of available for salefinancial assets, amounted to a net expense of 108 million euros,compared to net income of 264 million euros in 2017.
The Group’s effective tax rate was 26%, down 1 point relative to2017. This decrease primarily reflected the downward trend incorporate tax rates worldwide, particularly in the United States.
Profit attributable to minority interests was 636 million euros,compared to 475 million euros in 2017; this total mainly includesprofit attributable to minority interests in Moët Hennessy and DFS.
The Group’s share of net profit was 6,354 million euros, comparedwith 5,365 million euros in 2017. This represented 14% ofrevenue in 2018, up 1 point with respect to 2017. The Groupshare of net profit in 2018 was up 18% compared to 2017.
1.3 Other income statement items
Selective Retailing
2018 2017 2016
Revenue (EUR millions) 13,646 13,311 11,973Profit from recurring operations (EUR millions) 1,382 1,075 919Operating margin (%) 10.1 8.1 7.7
Profit from recurring operations for Selective Retailing was1,382 million euros, up 29% from 2017. This improvement wasdriven by DFS, which benefited from its strong commercialperformance and from the favorable impact of the terminationof the Hong Kong airport concessions.
The business group’s operating margin as a percentage of revenuegrew by 2 points to 10.1%.
Other activities
The result from recurring operations of “Other activities andeliminations” was a loss of 330 million euros, representing animprovement relative to 2017. In addition to headquartersexpenses, this heading includes the results of the Media division,Royal Van Lent yachts, and hotel and real estate activities.
Comments on the determination of the impact of exchange rate fluctuations and changes in the scope of consolidation
The impact of exchange rate fluctuations is determined by translating the accounts for the fiscal year of entities having a functional currency other than the euro at the prior fiscal year’sexchange rates, without any other restatements.The impact of changes in the scope of consolidation is determined:- for the fiscal year’s acquisitions, by deducting from revenue for the fiscal year the amount of revenue generated during that fiscal year by the acquired entities, as of their initial
consolidation;- for the prior fiscal year’s acquisitions, by deducting from revenue for the fiscal year the amount of revenue generated over the months during which the acquired entities were not
consolidated in the prior fiscal year;- for the fiscal year’s disposals, by adding to revenue for the fiscal year the amount of revenue generated by the divested entities in the prior fiscal year over the months during which
those entities were no longer consolidated in the current fiscal year;- for the prior fiscal year’s disposals, by adding to revenue for the fiscal year the amount of revenue generated in the prior fiscal year by the divested entities.Profit from recurring operations is restated in accordance with the same principles.
1_VA_V3 28/01/2019 13:34 Page9
BUSINESS REVIEW AND COMMENTS ON THE CONSOLIDATED FINANCIAL STATEMENTS OF LVMH GROUP
10 Financial Documents - December 31, 2018
Wines and Spirits
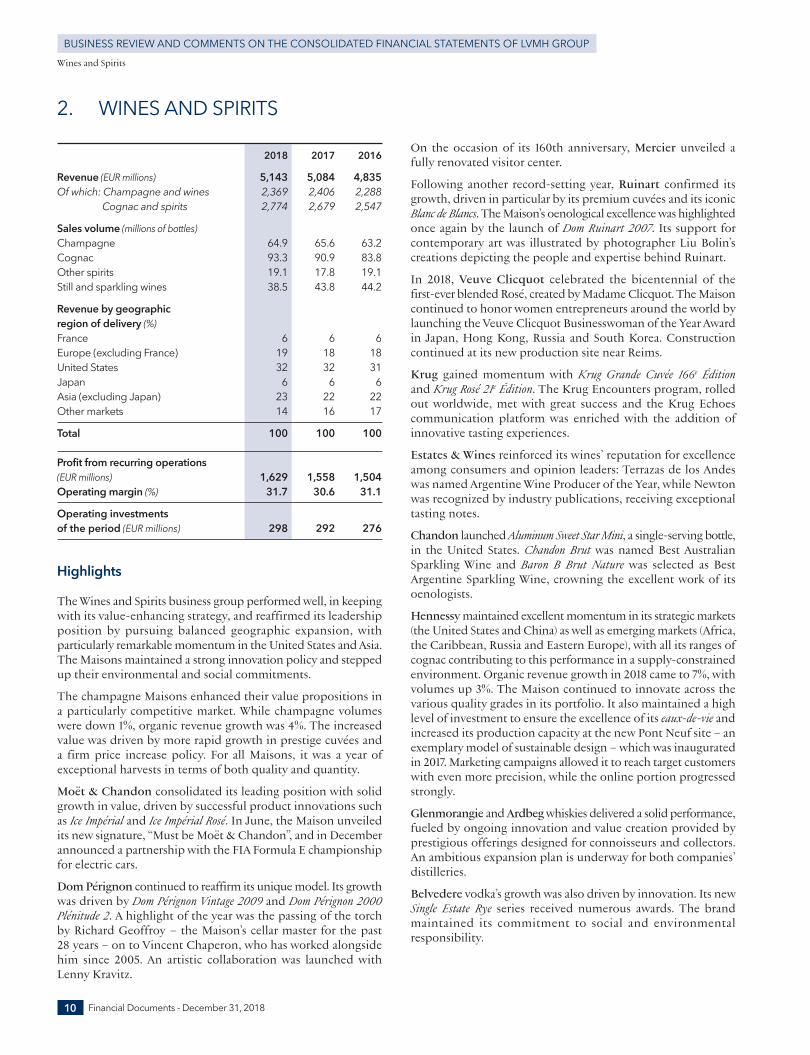
2018 2017 2016
Revenue (EUR millions) 5,143 5,084 4,835Of which: Champagne and wines 2,369 2,406 2,288
Cognac and spirits 2,774 2,679 2,547
Sales volume (millions of bottles) Champagne 64.9 65.6 63.2Cognac 93.3 90.9 83.8Other spirits 19.1 17.8 19.1Still and sparkling wines 38.5 43.8 44.2
Revenue by geographic region of delivery (%) France 6 6 6Europe (excluding France) 19 18 18United States 32 32 31Japan 6 6 6Asia (excluding Japan) 23 22 22Other markets 14 16 17
Total 100 100 100
Profit from recurring operations (EUR millions) 1,629 1,558 1,504Operating margin (%) 31.7 30.6 31.1
Operating investments of the period (EUR millions) 298 292 276
Highlights
The Wines and Spirits business group performed well, in keepingwith its value- enhancing strategy, and reaffirmed its leadershipposition by pursuing balanced geographic expansion, withparticularly remarkable momentum in the United States and Asia.The Maisons maintained a strong innovation policy and steppedup their environmental and social commitments.
The champagne Maisons enhanced their value propositions ina particularly competitive market. While champagne volumeswere down 1%, organic revenue growth was 4%. The increasedvalue was driven by more rapid growth in prestige cuvées and a firm price increase policy. For all Maisons, it was a year ofexceptional harvests in terms of both quality and quantity.
Moët & Chandon consolidated its leading position with solidgrowth in value, driven by successful product innovations suchas Ice Impérial and Ice Impérial Rosé. In June, the Maison unveiledits new signature, “Must be Moët & Chandon”, and in Decemberannounced a partnership with the FIA Formula E championshipfor electric cars.
Dom Pérignon continued to reaffirm its unique model. Its growthwas driven by Dom Pérignon Vintage 2009 and Dom Pérignon 2000Plénitude 2. A highlight of the year was the passing of the torchby Richard Geoffroy – the Maison’s cellar master for the past28 years – on to Vincent Chaperon, who has worked alongsidehim since 2005. An artistic collaboration was launched withLenny Kravitz.
On the occasion of its 160th anniversary, Mercier unveiled afully renovated visitor center.
Following another record- setting year, Ruinart confirmed itsgrowth, driven in particular by its premium cuvées and its iconicBlanc de Blancs. The Maison’s oenological excellence was highlightedonce again by the launch of Dom Ruinart 2007. Its support forcontemporary art was illustrated by photographer Liu Bolin’screations depicting the people and expertise behind Ruinart.
In 2018, Veuve Clicquot celebrated the bicentennial of thefirst- ever blended Rosé, created by Madame Clicquot. The Maisoncontinued to honor women entrepreneurs around the world bylaunching the Veuve Clicquot Businesswoman of the Year Awardin Japan, Hong Kong, Russia and South Korea. Constructioncontinued at its new production site near Reims.
Krug gained momentum with Krug Grande Cuvée 166e Éditionand Krug Rosé 21e Édition. The Krug Encounters program, rolledout worldwide, met with great success and the Krug Echoescommunication platform was enriched with the addition ofinnovative tasting experiences.
Estates & Wines reinforced its wines’ reputation for excellenceamong consumers and opinion leaders: Terrazas de los Andeswas named Argentine Wine Producer of the Year, while Newtonwas recognized by industry publications, receiving exceptionaltasting notes.
Chandon launched Aluminum Sweet Star Mini, a single- serving bottle,in the United States. Chandon Brut was named Best AustralianSparkling Wine and Baron B Brut Nature was selected as BestArgentine Sparkling Wine, crowning the excellent work of itsoenologists.
Hennessy maintained excellent momentum in its strategic markets(the United States and China) as well as emerging markets (Africa,the Caribbean, Russia and Eastern Europe), with all its ranges ofcognac contributing to this performance in a supply- constrainedenvironment. Organic revenue growth in 2018 came to 7%, withvolumes up 3%. The Maison continued to innovate across thevarious quality grades in its portfolio. It also maintained a highlevel of investment to ensure the excellence of its eaux- de- vie andincreased its production capacity at the new Pont Neuf site – anexemplary model of sustainable design – which was inauguratedin 2017. Marketing campaigns allowed it to reach target customerswith even more precision, while the online portion progressedstrongly.
Glenmorangie and Ardbegwhiskies delivered a solid performance,fueled by ongoing innovation and value creation provided byprestigious offerings designed for connoisseurs and collectors.An ambitious expansion plan is underway for both companies’distilleries.
Belvedere vodka’s growth was also driven by innovation. Its newSingle Estate Rye series received numerous awards. The brandmaintained its commitment to social and environmentalresponsibility.
2. WINES AND SPIRITS
1_VA_V3 28/01/2019 13:34 Page10
11Financial Documents - December 31, 2018
Fashion and Leather Goods
BUSINESS REVIEW AND COMMENTS ON THE CONSOLIDATED FINANCIAL STATEMENTS OF LVMH GROUP
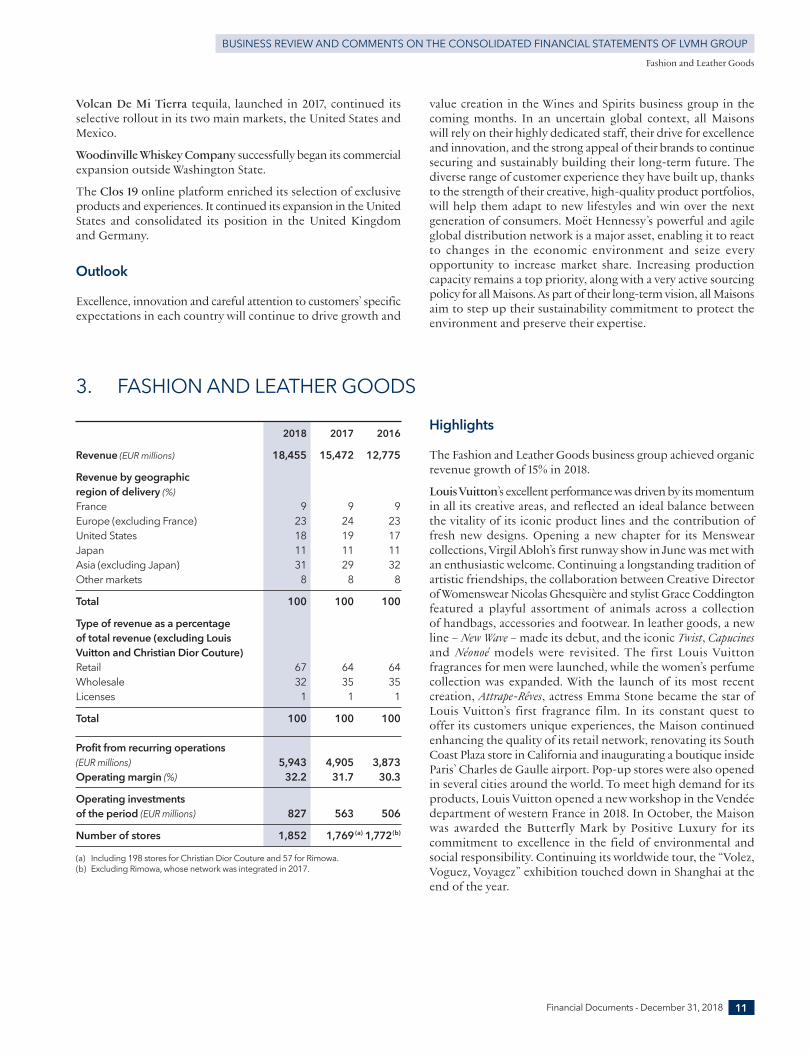
2018 2017 2016
Revenue (EUR millions) 18,455 15,472 12,775
Revenue by geographicregion of delivery (%) France 9 9 9Europe (excluding France) 23 24 23United States 18 19 17Japan 11 11 11Asia (excluding Japan) 31 29 32Other markets 8 8 8
Total 100 100 100
Type of revenue as a percentage of total revenue (excluding Louis Vuitton and Christian Dior Couture) Retail 67 64 64Wholesale 32 35 35Licenses 1 1 1
Total 100 100 100
Profit from recurring operations (EUR millions) 5,943 4,905 3,873Operating margin (%) 32.2 31.7 30.3
Operating investments of the period (EUR millions) 827 563 506
Number of stores 1,852 1,769(a) 1,772(b)
(a) Including 198 stores for Christian Dior Couture and 57 for Rimowa.(b) Excluding Rimowa, whose network was integrated in 2017.
Highlights
The Fashion and Leather Goods business group achieved organicrevenue growth of 15% in 2018.
Louis Vuitton’s excellent performance was driven by its momentumin all its creative areas, and reflected an ideal balance betweenthe vitality of its iconic product lines and the contribution offresh new designs. Opening a new chapter for its Menswearcollections, Virgil Abloh’s first runway show in June was met withan enthusiastic welcome. Continuing a longstanding tradition ofartistic friendships, the collaboration between Creative Directorof Womenswear Nicolas Ghesquière and stylist Grace Coddingtonfeatured a playful assortment of animals across a collection of handbags, accessories and footwear. In leather goods, a newline – New Wave – made its debut, and the iconic Twist, Capucinesand Néonoé models were revisited. The first Louis Vuittonfragrances for men were launched, while the women’s perfumecollection was expanded. With the launch of its most recentcreation, Attrape- Rêves, actress Emma Stone became the star ofLouis Vuitton’s first fragrance film. In its constant quest to offer its customers unique experiences, the Maison continuedenhancing the quality of its retail network, renovating its SouthCoast Plaza store in California and inaugurating a boutique insideParis’ Charles de Gaulle airport. Pop- up stores were also openedin several cities around the world. To meet high demand for itsproducts, Louis Vuitton opened a new workshop in the Vendéedepartment of western France in 2018. In October, the Maisonwas awarded the Butterfly Mark by Positive Luxury for itscommitment to excellence in the field of environmental andsocial responsibility. Continuing its worldwide tour, the “Volez,Voguez, Voyagez” exhibition touched down in Shanghai at theend of the year.
3. FASHION AND LEATHER GOODS
Volcan De Mi Tierra tequila, launched in 2017, continued itsselective rollout in its two main markets, the United States andMexico.
Woodinville Whiskey Company successfully began its commercialexpansion outside Washington State.
The Clos 19 online platform enriched its selection of exclusiveproducts and experiences. It continued its expansion in the UnitedStates and consolidated its position in the United Kingdomand Germany.
Outlook
Excellence, innovation and careful attention to customers’ specificexpectations in each country will continue to drive growth and
value creation in the Wines and Spirits business group in thecoming months. In an uncertain global context, all Maisonswill rely on their highly dedicated staff, their drive for excellenceand innovation, and the strong appeal of their brands to continuesecuring and sustainably building their long- term future. Thediverse range of customer experience they have built up, thanksto the strength of their creative, high- quality product portfolios,will help them adapt to new lifestyles and win over the nextgeneration of consumers. Moët Hennessy’s powerful and agileglobal distribution network is a major asset, enabling it to reactto changes in the economic environment and seize everyopportunity to increase market share. Increasing productioncapacity remains a top priority, along with a very active sourcingpolicy for all Maisons. As part of their long- term vision, all Maisonsaim to step up their sustainability commitment to protect theenvironment and preserve their expertise.
1_VA_V3 28/01/2019 13:34 Page11
For its first full year as part of the LVMH group, Christian DiorCouture turned in a remarkable performance in all its productcategories and all its regions, and enhanced its appeal worldwide.Dior’s excellence and creativity were on display, particularly at therunway shows for Maria Grazia Chiuri’s womenswear collections:the highly acclaimed Spring/Summer 2018 Haute Couture show,an ode to surrealism, was followed by an extraordinary maskedball in the gardens of the Rodin Museum; the Cruise show washeld at the Domaine de Chantilly, with a spectacular performanceby traditional female equestrians from Mexico; the Spring/Summer2019 Ready- to- Wear collection was accompanied by a poeticballet of contemporary dance. In June 2018, the new CreativeDirector of Menswear Kim Jones had his runway debut with theSpring/Summer 2019 show, held in the courtyard of the FrenchRepublican Guard in Paris, which was a resounding success, aswas the Fall 2019 show held in Tokyo in November 2018. Dior’siconic Toile de Jouy design embellished the imposing facadesof its largest boutiques. In another first, the Dior Dior Dior highjewelry collection was exhibited at the City of Paris’ Museum ofModern Art during Couture Week, and was a great success.
Fendi continued to reaffirm its creativity and expertise throughits ready- to- wear, handbag and footwear collections, as well asits Couture runway show in Paris, designed by Karl Lagerfeldand Silvia Fendi. The iconic Peekaboo handbag was showcasedin an innovative digital marketing campaign, while two capsulecollections – FF Reloaded and Fendi Mania – were launched,expressing a highly contemporary side of the brand. Fendireinforced its retail network and reaffirmed its commitment topreserving expertise with an exhibition in Rome and stronginvolvement in LVMH’s Institut des Métiers d’Excellence.
Growth at Loro Piana was driven in particular by the success ofits recent Gift of Kings collection, made from the world’s finestwool, an emblem of the excellence of the raw materials sourcedby the company. Its Baby Cashmere, another exceptional material,celebrated its 10th anniversary at a series of pop- up stores aroundthe world. Footwear turned in an excellent performance. Thebrand focused on developing women’s ready- to- wear and thecustomer experience in a network of stores whose expansionremained selective.
Celine’s momentum remained strong, driven by the ongoingsuccess of its leather goods lines. It embarked on a new phasein its development with the arrival of Hedi Slimane as Artistic,Creative and Image Director. In September, his first runwayshow was a great success and had a huge impact in the fashionworld.
Givenchy was boosted by the success of Clare Waight Keller’sfirst collections, available in boutiques starting in February. Thedesign of the Duchess of Sussex’s wedding gown substantiallyraised its brand exposure. Clare Waight Keller’s talent wasrecognized several times throughout the year, particularly atthe British Fashion Awards. A flagship boutique was inauguratedon New Bond Street in London.
Under the leadership of its Creative Director Jonathan Anderson,Loewe achieved very strong momentum, with the success of itsnew Gate line of leather goods and rapid growth in ready- to- wear.A wide range of gifts was on offer at the end of the year. Thebrand continued to selectively expand and improve its networkof stores.
Kenzo’s casual urban offering was expanded, with Menswearperforming especially well. Women’s ready- to- wear reaffirmedthe balance sought between modernity and desirability. One ofthe year’s highlights was a significant geographic expansion,with the brand opening boutiques and inaugurating its digitalpresence in the United States, and resuming retail operationsin China and Macao.
Berluti achieved strong performance and expanded its retailnetwork. All product categories posted growth, especiallyexceptional items such as tailored footwear, exotic leathers andspecial orders. The Zero Cut shoe, crafted from a single piece ofleather, expresses the quintessence of Berluti’s shoemakingexpertise. The year was marked by the arrival of Kris Van Asscheas its new Artistic Director.
Marc Jacobs continued to reorganize and to develop its productlines. Its Snapshot leather goods line saw rapid growth. A pop- upstore was opened on Madison Avenue in New York to mark thelaunch of the Redux Grunge Collection 1993/2018 capsule collection.
Rimowa continued its collaborations to design limited- editionsuitcases. The collections designed together with streetwearbrand Supreme and Off- White, Virgil Abloh’s label, were verywell received and enhanced Rimowa’s appeal. The brandcelebrated its 120th anniversary and launched its first globalmarketing campaign.
Thomas Pink revised its visual identity and became Pink ShirtmakerLondon.
Outlook
Louis Vuitton will keep building its growth on its creativemomentum and its unique traditional craftsmanship. In terms ofproducts, high- profile initiatives will be launched in all businesses.Plans are underway for a number of emblematic stores. Campaignsand events connected with Louis Vuitton’s business highlightswill support these developments. The Maison will continue to reinforce its production capacity with the opening of a newworkshop in Beaulieu- sur- Layon in the Maine- et- Loire departmentof western France in early 2019.
Christian Dior Couture has set itself ever more ambitious targetsfor the months ahead. Creativity, innovation and expertise willcontinue to fuel its business, and several high- impact events inkey markets will increase the brand’s international reach.
Fendi plans to step up the pace of its growth, with a number ofproduct launches in the coming months and strong performancein ready- to- wear collections as well as the expansion of its leathergoods offering. The first highlight of the year will involve a refocuson its iconic Baguette handbag. At Celine, its new designer’s firstready- to- wear collections will debut in boutiques in the firsthalf of the year, marking the beginning of the rollout of its newstore concept. All of the business group’s brands will maintaintheir focus on creativity in their collections and achieving excellencewith respect to products, retail and the customer experience.The continued selective expansion of their boutique networkswill go hand in hand with a stronger digital strategy and thedevelopment of online sales.
BUSINESS REVIEW AND COMMENTS ON THE CONSOLIDATED FINANCIAL STATEMENTS OF LVMH GROUP
12 Financial Documents - December 31, 2018
Fashion and Leather Goods
1_VA_V3 28/01/2019 13:34 Page12
2018 2017 2016
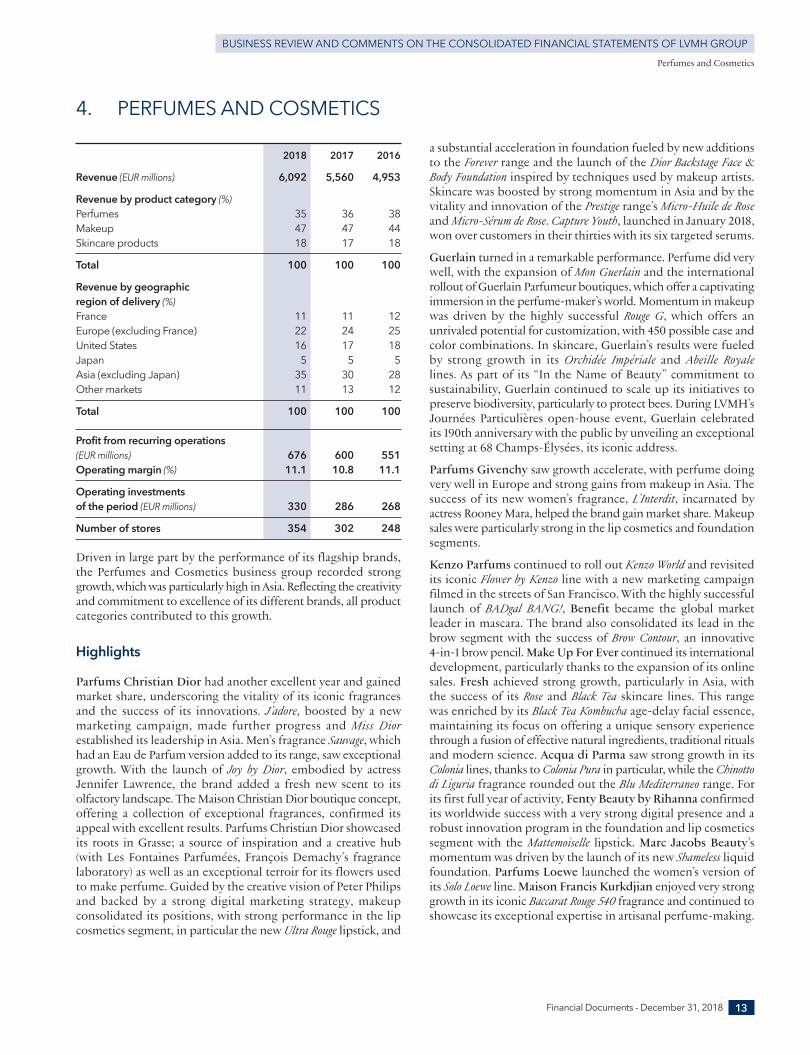
Revenue (EUR millions) 6,092 5,560 4,953
Revenue by product category (%) Perfumes 35 36 38Makeup 47 47 44Skincare products 18 17 18
Total 100 100 100
Revenue by geographic region of delivery (%) France 11 11 12Europe (excluding France) 22 24 25United States 16 17 18Japan 5 5 5Asia (excluding Japan) 35 30 28Other markets 11 13 12
Total 100 100 100
Profit from recurring operations(EUR millions) 676 600 551Operating margin (%) 11.1 10.8 11.1
Operating investments of the period (EUR millions) 330 286 268
Number of stores 354 302 248
Driven in large part by the performance of its flagship brands,the Perfumes and Cosmetics business group recorded stronggrowth, which was particularly high in Asia. Reflecting the creativityand commitment to excellence of its different brands, all productcategories contributed to this growth.
Highlights
Parfums Christian Dior had another excellent year and gainedmarket share, underscoring the vitality of its iconic fragrancesand the success of its innovations. J’adore, boosted by a newmarketing campaign, made further progress and Miss Diorestablished its leadership in Asia. Men’s fragrance Sauvage, whichhad an Eau de Parfum version added to its range, saw exceptionalgrowth. With the launch of Joy by Dior, embodied by actressJennifer Lawrence, the brand added a fresh new scent to itsolfactory landscape. The Maison Christian Dior boutique concept,offering a collection of exceptional fragrances, confirmed itsappeal with excellent results. Parfums Christian Dior showcasedits roots in Grasse; a source of inspiration and a creative hub(with Les Fontaines Parfumées, François Demachy’s fragrancelaboratory) as well as an exceptional terroir for its flowers usedto make perfume. Guided by the creative vision of Peter Philipsand backed by a strong digital marketing strategy, makeupconsolidated its positions, with strong performance in the lipcosmetics segment, in particular the new Ultra Rouge lipstick, and
a substantial acceleration in foundation fueled by new additionsto the Forever range and the launch of the Dior Backstage Face &Body Foundation inspired by techniques used by makeup artists.Skincare was boosted by strong momentum in Asia and by thevitality and innovation of the Prestige range’s Micro- Huile de Roseand Micro- Sérum de Rose. Capture Youth, launched in January 2018,won over customers in their thirties with its six targeted serums.
Guerlain turned in a remarkable performance. Perfume did verywell, with the expansion of Mon Guerlain and the internationalrollout of Guerlain Parfumeur boutiques, which offer a captivatingimmersion in the perfume- maker’s world. Momentum in makeupwas driven by the highly successful Rouge G, which offers anunrivaled potential for customization, with 450 possible case andcolor combinations. In skincare, Guerlain’s results were fueledby strong growth in its Orchidée Impériale and Abeille Royalelines. As part of its “In the Name of Beauty” commitment tosustainability, Guerlain continued to scale up its initiatives topreserve biodiversity, particularly to protect bees. During LVMH’sJournées Particulières open- house event, Guerlain celebratedits 190th anniversary with the public by unveiling an exceptionalsetting at 68 Champs- Élysées, its iconic address.
Parfums Givenchy saw growth accelerate, with perfume doingvery well in Europe and strong gains from makeup in Asia. Thesuccess of its new women’s fragrance, L’Interdit, incarnated byactress Rooney Mara, helped the brand gain market share. Makeupsales were particularly strong in the lip cosmetics and foundationsegments.
Kenzo Parfums continued to roll out Kenzo World and revisitedits iconic Flower by Kenzo line with a new marketing campaignfilmed in the streets of San Francisco. With the highly successfullaunch of BADgal BANG!, Benefit became the global marketleader in mascara. The brand also consolidated its lead in thebrow segment with the success of Brow Contour, an innovative4- in- 1 brow pencil. Make Up For Ever continued its internationaldevelopment, particularly thanks to the expansion of its onlinesales. Fresh achieved strong growth, particularly in Asia, withthe success of its Rose and Black Tea skincare lines. This rangewas enriched by its Black Tea Kombucha age- delay facial essence,maintaining its focus on offering a unique sensory experiencethrough a fusion of effective natural ingredients, traditional ritualsand modern science. Acqua di Parma saw strong growth in itsColonia lines, thanks to Colonia Pura in particular, while the Chinottodi Liguria fragrance rounded out the Blu Mediterraneo range. Forits first full year of activity, Fenty Beauty by Rihanna confirmedits worldwide success with a very strong digital presence and arobust innovation program in the foundation and lip cosmeticssegment with the Mattemoiselle lipstick. Marc Jacobs Beauty’smomentum was driven by the launch of its new Shameless liquidfoundation. Parfums Loewe launched the women’s version ofits Solo Loewe line. Maison Francis Kurkdjian enjoyed very stronggrowth in its iconic Baccarat Rouge 540 fragrance and continued toshowcase its exceptional expertise in artisanal perfume- making.
4. PERFUMES AND COSMETICS
13Financial Documents - December 31, 2018
Perfumes and Cosmetics
BUSINESS REVIEW AND COMMENTS ON THE CONSOLIDATED FINANCIAL STATEMENTS OF LVMH GROUP
1_VA_V3 28/01/2019 13:34 Page13
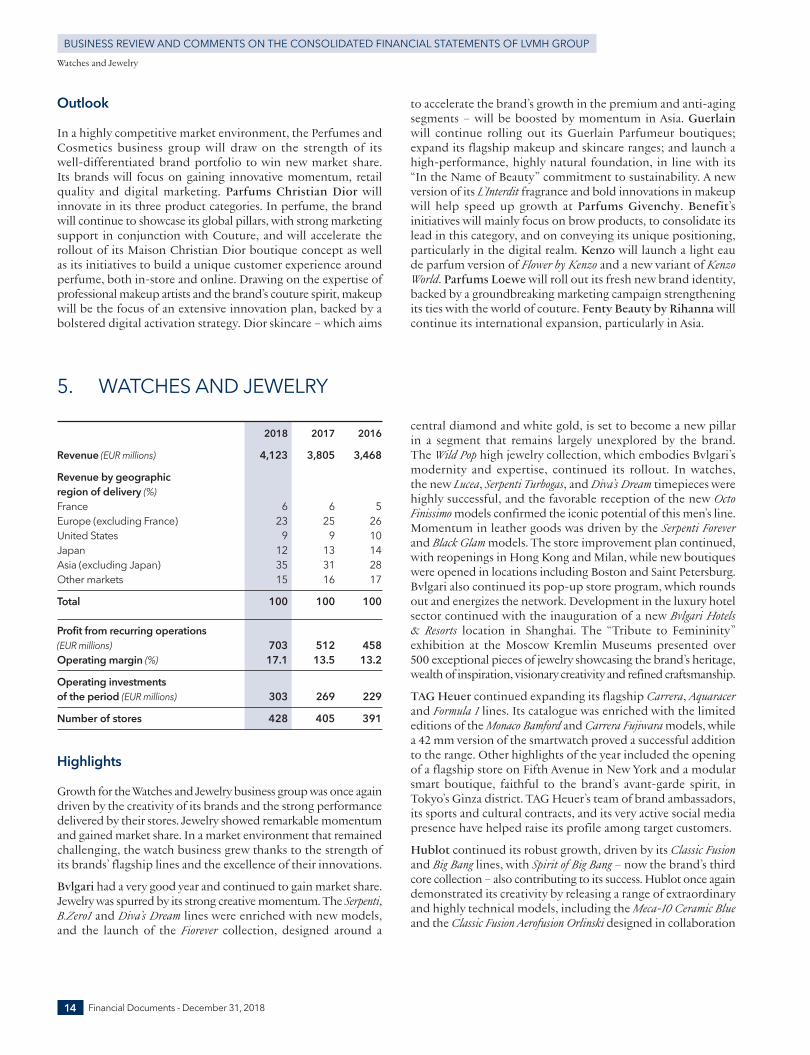
2018 2017 2016
Revenue (EUR millions) 4,123 3,805 3,468
Revenue by geographic region of delivery (%) France 6 6 5Europe (excluding France) 23 25 26United States 9 9 10Japan 12 13 14Asia (excluding Japan) 35 31 28Other markets 15 16 17
Total 100 100 100
Profit from recurring operations (EUR millions) 703 512 458Operating margin (%) 17.1 13.5 13.2
Operating investments of the period (EUR millions) 303 269 229
Number of stores 428 405 391
Highlights
Growth for the Watches and Jewelry business group was once againdriven by the creativity of its brands and the strong performancedelivered by their stores. Jewelry showed remarkable momentumand gained market share. In a market environment that remainedchallenging, the watch business grew thanks to the strength ofits brands’ flagship lines and the excellence of their innovations.
Bvlgari had a very good year and continued to gain market share.Jewelry was spurred by its strong creative momentum. The Serpenti,B.Zero1 and Diva’s Dream lines were enriched with new models,and the launch of the Fiorever collection, designed around a
central diamond and white gold, is set to become a new pillarin a segment that remains largely unexplored by the brand. The Wild Pop high jewelry collection, which embodies Bvlgari’smodernity and expertise, continued its rollout. In watches, the new Lucea, Serpenti Turbogas, and Diva’s Dream timepieces werehighly successful, and the favorable reception of the new OctoFinissimo models confirmed the iconic potential of this men’s line.Momentum in leather goods was driven by the Serpenti Foreverand Black Glam models. The store improvement plan continued,with reopenings in Hong Kong and Milan, while new boutiqueswere opened in locations including Boston and Saint Petersburg.Bvlgari also continued its pop- up store program, which roundsout and energizes the network. Development in the luxury hotelsector continued with the inauguration of a new Bvlgari Hotels& Resorts location in Shanghai. The “Tribute to Femininity”exhibition at the Moscow Kremlin Museums presented over500 exceptional pieces of jewelry showcasing the brand’s heritage,wealth of inspiration, visionary creativity and refined craftsmanship.
TAG Heuer continued expanding its flagship Carrera, Aquaracerand Formula 1 lines. Its catalogue was enriched with the limitededitions of the Monaco Bamford and Carrera Fujiwara models, whilea 42 mm version of the smartwatch proved a successful additionto the range. Other highlights of the year included the openingof a flagship store on Fifth Avenue in New York and a modularsmart boutique, faithful to the brand’s avant- garde spirit, inTokyo’s Ginza district. TAG Heuer’s team of brand ambassadors,its sports and cultural contracts, and its very active social mediapresence have helped raise its profile among target customers.
Hublot continued its robust growth, driven by its Classic Fusionand Big Bang lines, with Spirit of Big Bang – now the brand’s thirdcore collection – also contributing to its success. Hublot once againdemonstrated its creativity by releasing a range of extraordinaryand highly technical models, including the Meca- 10 Ceramic Blueand the Classic Fusion Aerofusion Orlinski designed in collaboration
5. WATCHES AND JEWELRY
Outlook
In a highly competitive market environment, the Perfumes andCosmetics business group will draw on the strength of itswell- differentiated brand portfolio to win new market share.Its brands will focus on gaining innovative momentum, retailquality and digital marketing. Parfums Christian Dior willinnovate in its three product categories. In perfume, the brandwill continue to showcase its global pillars, with strong marketingsupport in conjunction with Couture, and will accelerate therollout of its Maison Christian Dior boutique concept as well as its initiatives to build a unique customer experience aroundperfume, both in- store and online. Drawing on the expertise ofprofessional makeup artists and the brand’s couture spirit, makeupwill be the focus of an extensive innovation plan, backed by abolstered digital activation strategy. Dior skincare – which aims
to accelerate the brand’s growth in the premium and anti- agingsegments – will be boosted by momentum in Asia. Guerlainwill continue rolling out its Guerlain Parfumeur boutiques;expand its flagship makeup and skincare ranges; and launch ahigh- performance, highly natural foundation, in line with its“In the Name of Beauty” commitment to sustainability. A newversion of its L’Interdit fragrance and bold innovations in makeupwill help speed up growth at Parfums Givenchy. Benefit’sinitiatives will mainly focus on brow products, to consolidate itslead in this category, and on conveying its unique positioning,particularly in the digital realm. Kenzo will launch a light eaude parfum version of Flower by Kenzo and a new variant of KenzoWorld. Parfums Loewe will roll out its fresh new brand identity,backed by a groundbreaking marketing campaign strengtheningits ties with the world of couture. Fenty Beauty by Rihanna willcontinue its international expansion, particularly in Asia.
BUSINESS REVIEW AND COMMENTS ON THE CONSOLIDATED FINANCIAL STATEMENTS OF LVMH GROUP
14 Financial Documents - December 31, 2018
Watches and Jewelry
1_VA_V3 28/01/2019 13:34 Page14
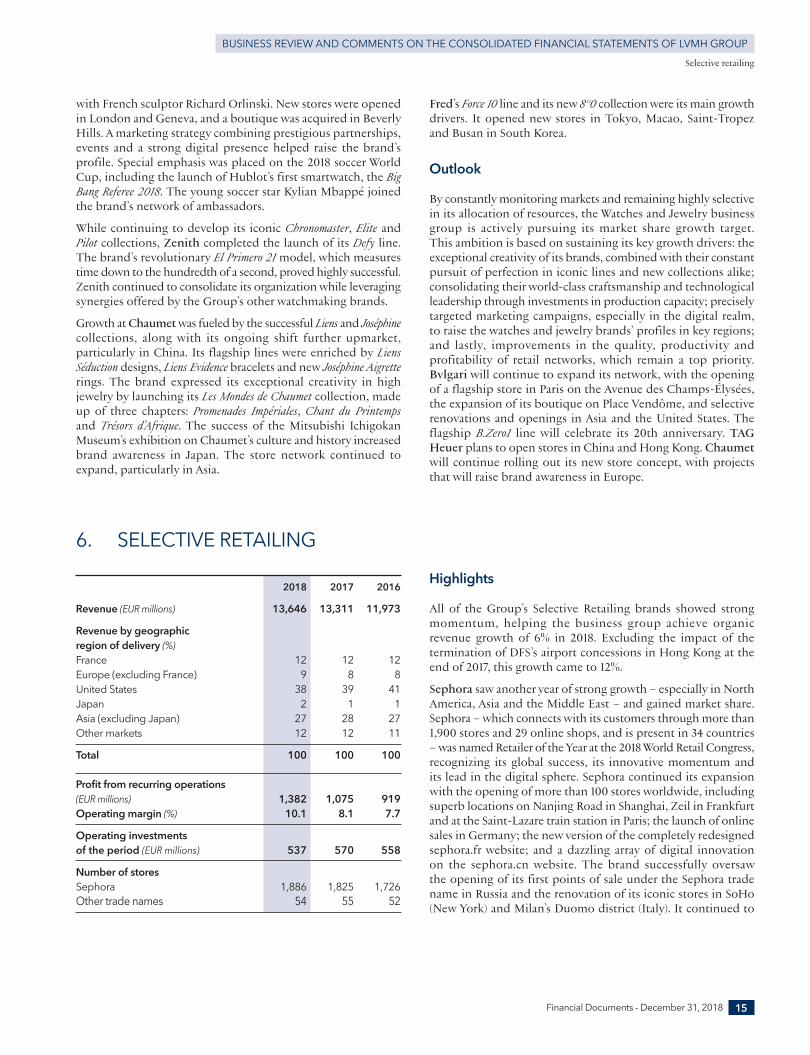
2018 2017 2016
Revenue (EUR millions) 13,646 13,311 11,973
Revenue by geographic region of delivery (%) France 12 12 12Europe (excluding France) 9 8 8United States 38 39 41Japan 2 1 1Asia (excluding Japan) 27 28 27Other markets 12 12 11
Total 100 100 100
Profit from recurring operations (EUR millions) 1,382 1,075 919Operating margin (%) 10.1 8.1 7.7
Operating investments of the period (EUR millions) 537 570 558
Number of stores Sephora 1,886 1,825 1,726Other trade names 54 55 52
Highlights
All of the Group’s Selective Retailing brands showed strongmomentum, helping the business group achieve organicrevenue growth of 6% in 2018. Excluding the impact of thetermination of DFS’s airport concessions in Hong Kong at theend of 2017, this growth came to 12%.
Sephora saw another year of strong growth – especially in NorthAmerica, Asia and the Middle East – and gained market share.Sephora – which connects with its customers through more than1,900 stores and 29 online shops, and is present in 34 countries– was named Retailer of the Year at the 2018 World Retail Congress,recognizing its global success, its innovative momentum andits lead in the digital sphere. Sephora continued its expansionwith the opening of more than 100 stores worldwide, includingsuperb locations on Nanjing Road in Shanghai, Zeil in Frankfurtand at the Saint- Lazare train station in Paris; the launch of onlinesales in Germany; the new version of the completely redesignedsephora.fr website; and a dazzling array of digital innovationon the sephora.cn website. The brand successfully oversaw the opening of its first points of sale under the Sephora tradename in Russia and the renovation of its iconic stores in SoHo(New York) and Milan’s Duomo district (Italy). It continued to
6. SELECTIVE RETAILING
Selective retailing
15Financial Documents - December 31, 2018
with French sculptor Richard Orlinski. New stores were openedin London and Geneva, and a boutique was acquired in BeverlyHills. A marketing strategy combining prestigious partnerships,events and a strong digital presence helped raise the brand’sprofile. Special emphasis was placed on the 2018 soccer WorldCup, including the launch of Hublot’s first smartwatch, the BigBang Referee 2018. The young soccer star Kylian Mbappé joinedthe brand’s network of ambassadors.
While continuing to develop its iconic Chronomaster, Elite andPilot collections, Zenith completed the launch of its Defy line.The brand’s revolutionary El Primero 21 model, which measurestime down to the hundredth of a second, proved highly successful.Zenith continued to consolidate its organization while leveragingsynergies offered by the Group’s other watchmaking brands.
Growth at Chaumet was fueled by the successful Liens and Joséphinecollections, along with its ongoing shift further upmarket,particularly in China. Its flagship lines were enriched by LiensSéduction designs, Liens Evidence bracelets and new Joséphine Aigretterings. The brand expressed its exceptional creativity in highjewelry by launching its Les Mondes de Chaumet collection, madeup of three chapters: Promenades Impériales, Chant du Printempsand Trésors d’Afrique. The success of the Mitsubishi IchigokanMuseum’s exhibition on Chaumet’s culture and history increasedbrand awareness in Japan. The store network continued toexpand, particularly in Asia.
Fred’s Force 10 line and its new 8°0 collection were its main growthdrivers. It opened new stores in Tokyo, Macao, Saint- Tropezand Busan in South Korea.
Outlook
By constantly monitoring markets and remaining highly selectivein its allocation of resources, the Watches and Jewelry businessgroup is actively pursuing its market share growth target. This ambition is based on sustaining its key growth drivers: theexceptional creativity of its brands, combined with their constantpursuit of perfection in iconic lines and new collections alike;consolidating their world- class craftsmanship and technologicalleadership through investments in production capacity; preciselytargeted marketing campaigns, especially in the digital realm,to raise the watches and jewelry brands’ profiles in key regions;and lastly, improvements in the quality, productivity andprofitability of retail networks, which remain a top priority.Bvlgari will continue to expand its network, with the openingof a flagship store in Paris on the Avenue des Champs- Élysées,the expansion of its boutique on Place Vendôme, and selectiverenovations and openings in Asia and the United States. Theflagship B.Zero1 line will celebrate its 20th anniversary. TAGHeuer plans to open stores in China and Hong Kong. Chaumetwill continue rolling out its new store concept, with projectsthat will raise brand awareness in Europe.
BUSINESS REVIEW AND COMMENTS ON THE CONSOLIDATED FINANCIAL STATEMENTS OF LVMH GROUP
1_VA_V3 28/01/2019 13:34 Page15
personalize the customer experience as part of its ongoing questto captivate and satisfy beauty fans around the world. Thanks toits dedicated staff, Sephora’s boutiques offer beauty and makeupservices that are constantly being updated, based around its BeautyHubs, as well as a plethora of experiences available throughoutthe store. In addition, across its entire digital ecosystem, interactivemobile app features let users extend the in- store experience andconnect with its community of self- proclaimed beauty addicts.This personalized, omnichannel relationship helps providebespoke support to each and every one of its customers as they discover the iconic brands, wide range of new productsand highly innovative exclusive collections that make up theSephora offering.
Amidst an upturn in its markets, DFS saw strong revenue growth,buoyed by sales initiatives launched to win over internationaltravelers, including high- impact marketing campaigns, in- storeevents and the introduction of new communication tools. It expanded its selection of products to meet the expectationsof younger, more exacting travelers while showcasing theuniqueness of each destination. While major renovation workwas completed in Sydney and Auckland, DFS continued toexpand its presence in Macao with the opening of two boutiquesdevoted to beauty, bringing its store count to six in the city. A multi- brand fashion boutique designed to attract a millennialclientele was also inaugurated within the T Galleria City of Dreams.In Venice, the T Fondaco dei Tedeschi store turned in an excellentperformance, boosted by a year- round program of events thatmake it an unrivaled venue for shopping and culture. The SiemReap T Galleria in Cambodia also enjoyed strong momentum, withan offering that showcased the quality of local craftsmanshipalongside luxury products.
Starboard Cruise Services maintained its position as the leadingretailer of high- end brands on board cruise ships by expandingits presence in Asia. It further enhanced the appeal of its storeswhile improving the quality of its product offerings and theexperiences it offers its customers.
Le Bon Marché continued on its strong growth trajectory duringa very eventful year. The refinement, quality of service andselectivity on offer at the iconic department store on Paris’ Left
Bank continued to place it a cut above the rest for its Frenchand international clientele, and its loyalty program was highlysuccessful. The new children’s department – the renovation ofwhich was completed in the second half of the year – introduced“Les Récrés du Bon Marché”, an ingenious new concept whichis the first of its kind among department stores: fun workshopsfor children of all ages to enjoy while their parents shop inpeace. Event highlights included the substantial media coverageof the exhibition of works by Argentinian artist Leandro Erlichin the beginning of the year, and the major success of the Los Angeles exhibition in the fall. La Grande Épicerie de ParisRive Droite, which opened in late 2017, won over a new clientele.The 24 Sèvres digital platform continued its targeted growth,enriching its range with exclusive offerings including a capsulecollection in collaboration with designer Inès de la Fressange.
Outlook
In 2019, Sephora will continue to design and offer its customersthe best omnichannel experience in the beauty world, whilemaintaining its focus on its core strengths: its dedicated, professionalstaff; the expansion and renovation of its store network; itsrich, innovative range of products and services; and its desireto keep surprising its customers and give them an ever morepersonalized connection at its stores and throughout its digitalecosystem. DFS enters 2019 with confidence, while remainingvigilant to the key issues inherent in its business segment, such as currency fluctuations and potential changes in the salesenvironment. Work is underway to expand and enhance theflagship store on Canton Road in Hong Kong and to renovatethe Four Seasons Hotel Macao store. The brand will expand its store network, particularly in Asia, and step up its digitalinitiatives to better serve travelers. Le Bon Marché will continueto cultivate its uniqueness, its creative and exclusive offerings,and its dual identity as both a trendsetting retail destinationand a venue for art and culture. The opening of a VIP lounge willround out the range of perks available to its customers. La GrandeÉpicerie de Paris will keep working to enhance its appeal andbuild customer loyalty on both sides of the Seine.
16 Financial Documents - December 31, 2018
Selective retailing
BUSINESS REVIEW AND COMMENTS ON THE CONSOLIDATED FINANCIAL STATEMENTS OF LVMH GROUP
1_VA_V3 28/01/2019 13:34 Page16
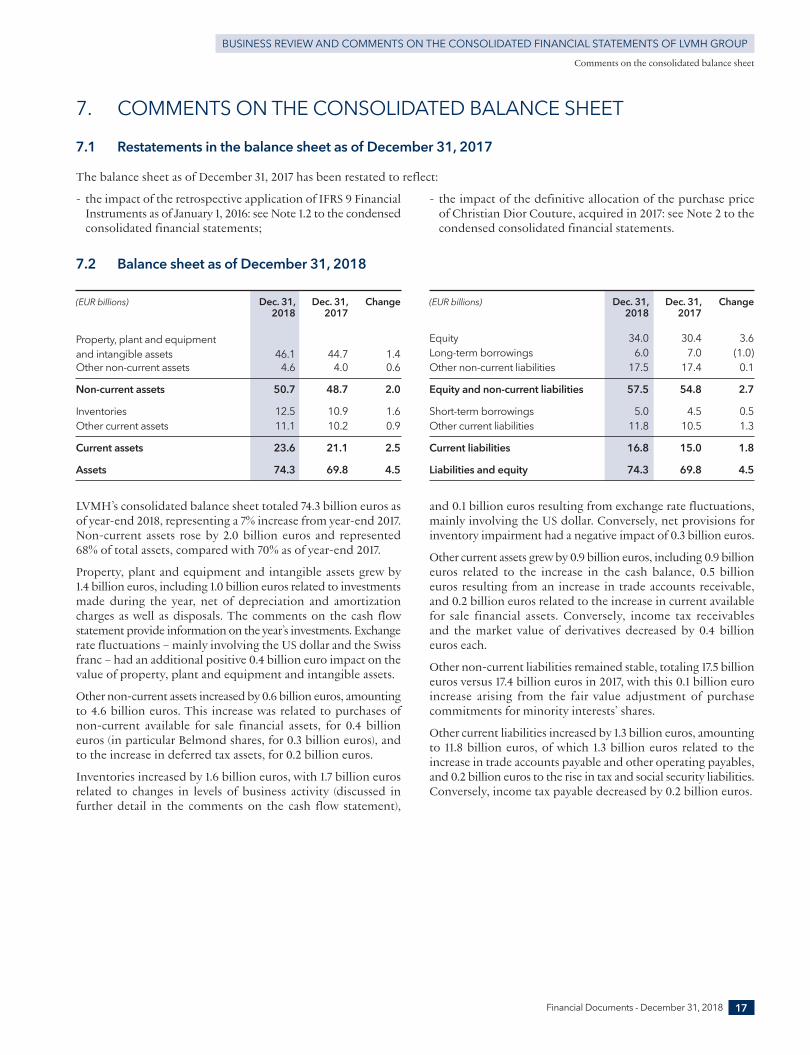
LVMH’s consolidated balance sheet totaled 74.3 billion euros asof year- end 2018, representing a 7% increase from year- end 2017.Non- current assets rose by 2.0 billion euros and represented68% of total assets, compared with 70% as of year- end 2017.
Property, plant and equipment and intangible assets grew by1.4 billion euros, including 1.0 billion euros related to investmentsmade during the year, net of depreciation and amortizationcharges as well as disposals. The comments on the cash flowstatement provide information on the year’s investments. Exchangerate fluctuations – mainly involving the US dollar and the Swissfranc – had an additional positive 0.4 billion euro impact on thevalue of property, plant and equipment and intangible assets.
Other non- current assets increased by 0.6 billion euros, amountingto 4.6 billion euros. This increase was related to purchases ofnon- current available for sale financial assets, for 0.4 billioneuros (in particular Belmond shares, for 0.3 billion euros), andto the increase in deferred tax assets, for 0.2 billion euros.
Inventories increased by 1.6 billion euros, with 1.7 billion eurosrelated to changes in levels of business activity (discussed infurther detail in the comments on the cash flow statement),
and 0.1 billion euros resulting from exchange rate fluctuations,mainly involving the US dollar. Conversely, net provisions forinventory impairment had a negative impact of 0.3 billion euros.
Other current assets grew by 0.9 billion euros, including 0.9 billioneuros related to the increase in the cash balance, 0.5 billioneuros resulting from an increase in trade accounts receivable,and 0.2 billion euros related to the increase in current availablefor sale financial assets. Conversely, income tax receivables and the market value of derivatives decreased by 0.4 billioneuros each.
Other non- current liabilities remained stable, totaling 17.5 billioneuros versus 17.4 billion euros in 2017, with this 0.1 billion euroincrease arising from the fair value adjustment of purchasecommitments for minority interests’ shares.
Other current liabilities increased by 1.3 billion euros, amountingto 11.8 billion euros, of which 1.3 billion euros related to theincrease in trade accounts payable and other operating payables,and 0.2 billion euros to the rise in tax and social security liabilities.Conversely, income tax payable decreased by 0.2 billion euros.
(EUR billions) Dec. 31, Dec. 31, Change 2018 2017
Property, plant and equipment and intangible assets 46.1 44.7 1.4Other non- current assets 4.6 4.0 0.6
Non- current assets 50.7 48.7 2.0
Inventories 12.5 10.9 1.6Other current assets 11.1 10.2 0.9
Current assets 23.6 21.1 2.5
Assets 74.3 69.8 4.5
(EUR billions) Dec. 31, Dec. 31, Change 2018 2017
Equity 34.0 30.4 3.6Long- term borrowings 6.0 7.0 (1.0)Other non- current liabilities 17.5 17.4 0.1
Equity and non- current liabilities 57.5 54.8 2.7
Short- term borrowings 5.0 4.5 0.5Other current liabilities 11.8 10.5 1.3
Current liabilities 16.8 15.0 1.8
Liabilities and equity 74.3 69.8 4.5
7.2 Balance sheet as of December 31, 2018
- the impact of the retrospective application of IFRS 9 FinancialInstruments as of January 1, 2016: see Note 1.2 to the condensedconsolidated financial statements;
- the impact of the definitive allocation of the purchase priceof Christian Dior Couture, acquired in 2017: see Note 2 to thecondensed consolidated financial statements.
17Financial Documents - December 31, 2018
Comments on the consolidated balance sheet
7. COMMENTS ON THE CONSOLIDATED BALANCE SHEET
7.1 Restatements in the balance sheet as of December 31, 2017
The balance sheet as of December 31, 2017 has been restated to reflect:
BUSINESS REVIEW AND COMMENTS ON THE CONSOLIDATED FINANCIAL STATEMENTS OF LVMH GROUP
1_VA_V3 28/01/2019 13:34 Page17
BUSINESS REVIEW AND COMMENTS ON THE CONSOLIDATED FINANCIAL STATEMENTS OF LVMH GROUP
18 Financial Documents - December 31, 2018
Comments on the consolidated cash flow statement
- the impact of the retrospective application of IFRS 9 FinancialInstruments as of January 1, 2016: see Note 1.2 to the condensedconsolidated financial statements;
- the impact of the definitive allocation of the purchase priceof Christian Dior Couture, acquired in 2017: see Note 2 to thecondensed consolidated financial statements.
8. COMMENTS ON THE CONSOLIDATED CASH FLOW STATEMENT
8.1 Restatements in the consolidated cash flow statement as of December 31, 2017
The consolidated cash flow statement as of December 31, 2017 has been restated to reflect:
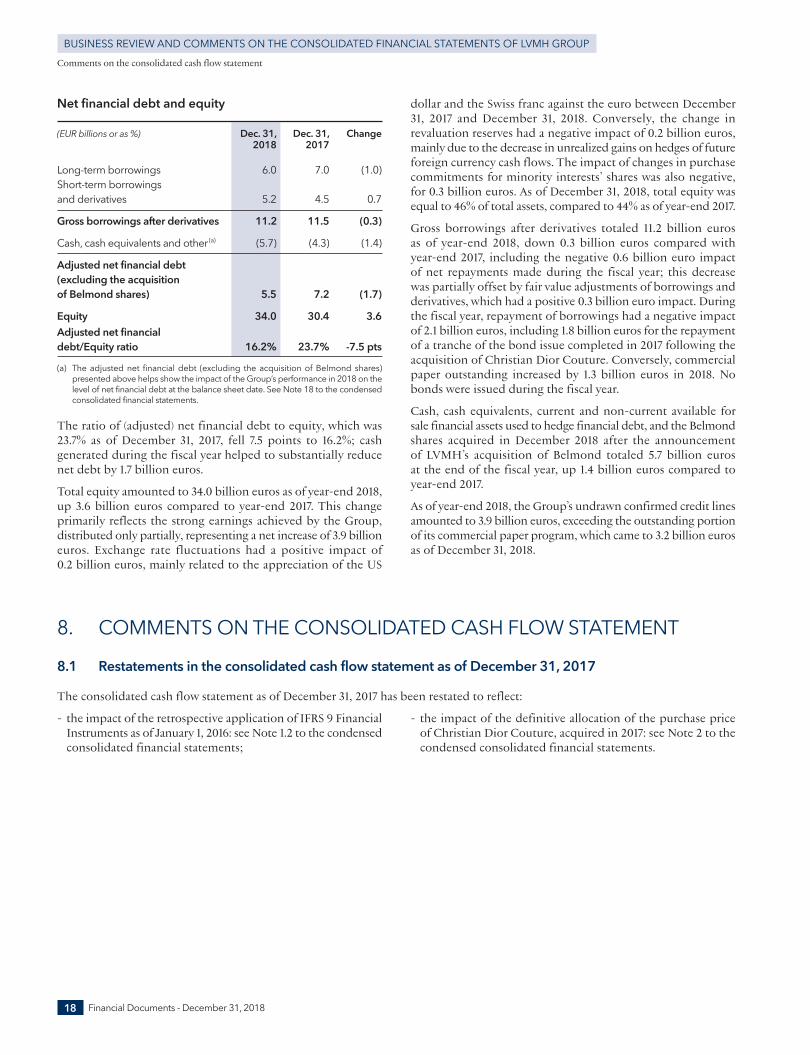
Net financial debt and equity
(EUR billions or as %) Dec. 31, Dec. 31, Change 2018 2017
Long- term borrowings 6.0 7.0 (1.0)Short- term borrowings and derivatives 5.2 4.5 0.7
Gross borrowings after derivatives 11.2 11.5 (0.3)
Cash, cash equivalents and other(a) (5.7) (4.3) (1.4)
Adjusted net financial debt (excluding the acquisition of Belmond shares) 5.5 7.2 (1.7)
Equity 34.0 30.4 3.6Adjusted net financial debt/Equity ratio 16.2% 23.7% - 7.5 pts
(a) The adjusted net financial debt (excluding the acquisition of Belmond shares)presented above helps show the impact of the Group’s performance in 2018 on thelevel of net financial debt at the balance sheet date. See Note 18 to the condensedconsolidated financial statements.
The ratio of (adjusted) net financial debt to equity, which was23.7% as of December 31, 2017, fell 7.5 points to 16.2%; cashgenerated during the fiscal year helped to substantially reducenet debt by 1.7 billion euros.
Total equity amounted to 34.0 billion euros as of year- end 2018,up 3.6 billion euros compared to year- end 2017. This changeprimarily reflects the strong earnings achieved by the Group,distributed only partially, representing a net increase of 3.9 billioneuros. Exchange rate fluctuations had a positive impact of0.2 billion euros, mainly related to the appreciation of the US
dollar and the Swiss franc against the euro between December31, 2017 and December 31, 2018. Conversely, the change inrevaluation reserves had a negative impact of 0.2 billion euros,mainly due to the decrease in unrealized gains on hedges of futureforeign currency cash flows. The impact of changes in purchasecommitments for minority interests’ shares was also negative,for 0.3 billion euros. As of December 31, 2018, total equity wasequal to 46% of total assets, compared to 44% as of year- end 2017.
Gross borrowings after derivatives totaled 11.2 billion euros as of year- end 2018, down 0.3 billion euros compared withyear- end 2017, including the negative 0.6 billion euro impact of net repayments made during the fiscal year; this decreasewas partially offset by fair value adjustments of borrowings andderivatives, which had a positive 0.3 billion euro impact. Duringthe fiscal year, repayment of borrowings had a negative impactof 2.1 billion euros, including 1.8 billion euros for the repaymentof a tranche of the bond issue completed in 2017 following theacquisition of Christian Dior Couture. Conversely, commercialpaper outstanding increased by 1.3 billion euros in 2018. Nobonds were issued during the fiscal year.
Cash, cash equivalents, current and non- current available forsale financial assets used to hedge financial debt, and the Belmondshares acquired in December 2018 after the announcement of LVMH’s acquisition of Belmond totaled 5.7 billion euros at the end of the fiscal year, up 1.4 billion euros compared toyear- end 2017.
As of year- end 2018, the Group’s undrawn confirmed credit linesamounted to 3.9 billion euros, exceeding the outstanding portionof its commercial paper program, which came to 3.2 billion eurosas of December 31, 2018.
1_VA_V3 28/01/2019 13:34 Page18
19Financial Documents - December 31, 2018
Comments on the consolidated cash flow statement
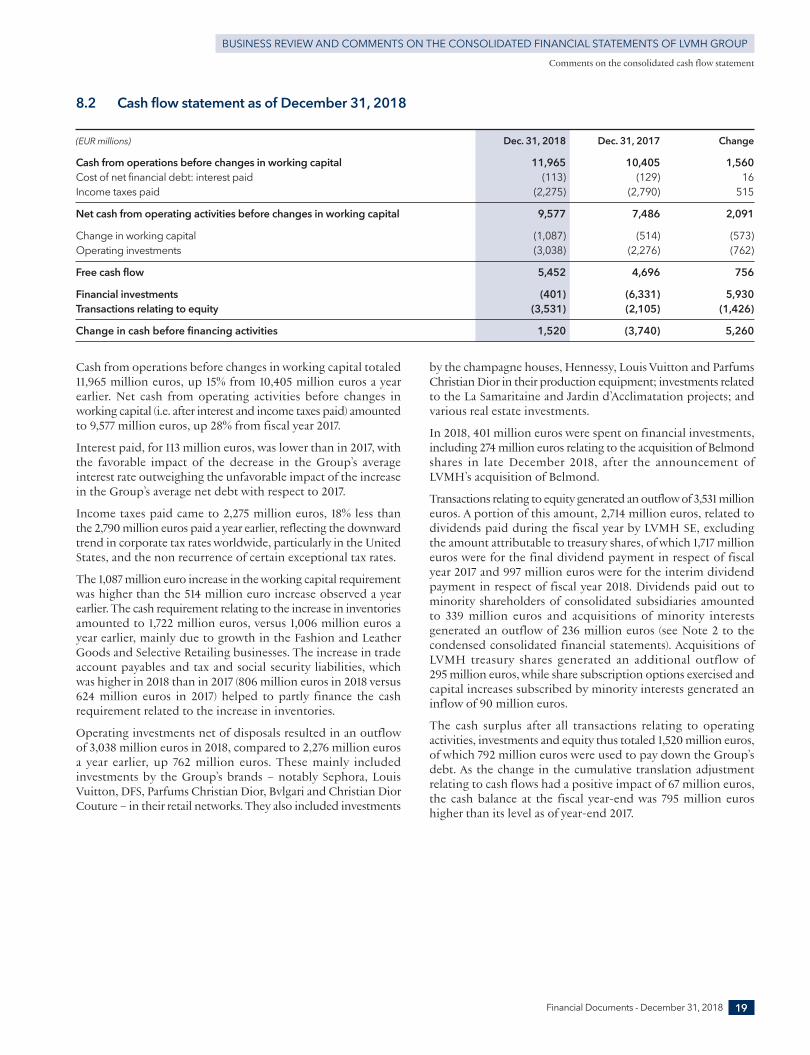
Cash from operations before changes in working capital totaled11,965 million euros, up 15% from 10,405 million euros a yearearlier. Net cash from operating activities before changes inworking capital (i.e. after interest and income taxes paid) amountedto 9,577 million euros, up 28% from fiscal year 2017.
Interest paid, for 113 million euros, was lower than in 2017, withthe favorable impact of the decrease in the Group’s averageinterest rate outweighing the unfavorable impact of the increasein the Group’s average net debt with respect to 2017.
Income taxes paid came to 2,275 million euros, 18% less thanthe 2,790 million euros paid a year earlier, reflecting the downwardtrend in corporate tax rates worldwide, particularly in the UnitedStates, and the non recurrence of certain exceptional tax rates.
The 1,087 million euro increase in the working capital requirementwas higher than the 514 million euro increase observed a yearearlier. The cash requirement relating to the increase in inventoriesamounted to 1,722 million euros, versus 1,006 million euros ayear earlier, mainly due to growth in the Fashion and LeatherGoods and Selective Retailing businesses. The increase in tradeaccount payables and tax and social security liabilities, whichwas higher in 2018 than in 2017 (806 million euros in 2018 versus624 million euros in 2017) helped to partly finance the cashrequirement related to the increase in inventories.
Operating investments net of disposals resulted in an outflowof 3,038 million euros in 2018, compared to 2,276 million eurosa year earlier, up 762 million euros. These mainly includedinvestments by the Group’s brands – notably Sephora, LouisVuitton, DFS, Parfums Christian Dior, Bvlgari and Christian DiorCouture – in their retail networks. They also included investments
by the champagne houses, Hennessy, Louis Vuitton and ParfumsChristian Dior in their production equipment; investments relatedto the La Samaritaine and Jardin d’Acclimatation projects; andvarious real estate investments.
In 2018, 401 million euros were spent on financial investments,including 274 million euros relating to the acquisition of Belmondshares in late December 2018, after the announcement ofLVMH’s acquisition of Belmond.
Transactions relating to equity generated an outflow of 3,531 millioneuros. A portion of this amount, 2,714 million euros, related todividends paid during the fiscal year by LVMH SE, excludingthe amount attributable to treasury shares, of which 1,717 millioneuros were for the final dividend payment in respect of fiscalyear 2017 and 997 million euros were for the interim dividendpayment in respect of fiscal year 2018. Dividends paid out tominority shareholders of consolidated subsidiaries amountedto 339 million euros and acquisitions of minority interestsgenerated an outflow of 236 million euros (see Note 2 to thecondensed consolidated financial statements). Acquisitions ofLVMH treasury shares generated an additional outflow of295 million euros, while share subscription options exercised andcapital increases subscribed by minority interests generated aninflow of 90 million euros.
The cash surplus after all transactions relating to operatingactivities, investments and equity thus totaled 1,520 million euros,of which 792 million euros were used to pay down the Group’sdebt. As the change in the cumulative translation adjustmentrelating to cash flows had a positive impact of 67 million euros,the cash balance at the fiscal year- end was 795 million euroshigher than its level as of year- end 2017.
BUSINESS REVIEW AND COMMENTS ON THE CONSOLIDATED FINANCIAL STATEMENTS OF LVMH GROUP
8.2 Cash flow statement as of December 31, 2018
(EUR millions) Dec. 31, 2018 Dec. 31, 2017 Change
Cash from operations before changes in working capital 11,965 10,405 1,560Cost of net financial debt: interest paid (113) (129) 16Income taxes paid (2,275) (2,790) 515
Net cash from operating activities before changes in working capital 9,577 7,486 2,091
Change in working capital (1,087) (514) (573)Operating investments (3,038) (2,276) (762)
Free cash flow 5,452 4,696 756
Financial investments (401) (6,331) 5,930Transactions relating to equity (3,531) (2,105) (1,426)
Change in cash before financing activities 1,520 (3,740) 5,260
1_VA_V3 28/01/2019 13:34 Page19

20 Financial Documents - December 31, 2018
1_VA_V3 28/01/2019 13:34 Page20
Financial Documents - December 31, 2018 21
CONDENSED CONSOLIDATED FINANCIAL STATEMENTS
CONSOLIDATED INCOME STATEMENT 22CONSOLIDATED STATEMENT OF COMPREHENSIVE GAINS AND LOSSES 23CONSOLIDATED BALANCE SHEET 24CONSOLIDATED STATEMENT OF CHANGES IN EQUITY 25CONSOLIDATED CASH FLOW STATEMENT 26SELECTED NOTES TO THE CONSOLIDATED FINANCIAL STATEMENTS 27
2_VA_V3 28/01/2019 13:20 Page21
Financial Documents - December 31, 201822
CONDENSED CONSOLIDATED FINANCIAL STATEMENTS
CONSOLIDATED INCOME STATEMENT
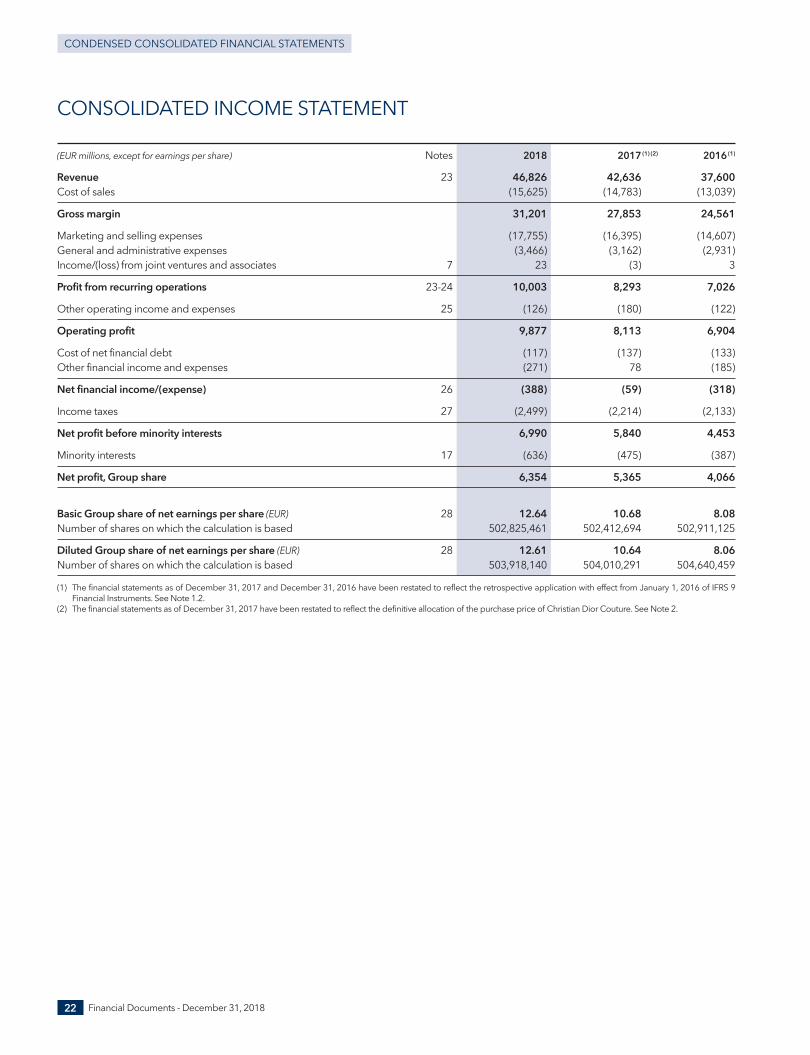
(EUR millions, except for earnings per share) Notes 2018 2017(1) (2) 2016(1)
Revenue 23 46,826 42,636 37,600Cost of sales (15,625) (14,783) (13,039)
Gross margin 31,201 27,853 24,561
Marketing and selling expenses (17,755) (16,395) (14,607)General and administrative expenses (3,466) (3,162) (2,931)Income/(loss) from joint ventures and associates 7 23 (3) 3
Profit from recurring operations 23- 24 10,003 8,293 7,026
Other operating income and expenses 25 (126) (180) (122)
Operating profit 9,877 8,113 6,904
Cost of net financial debt (117) (137) (133)Other financial income and expenses (271) 78 (185)
Net financial income/(expense) 26 (388) (59) (318)
Income taxes 27 (2,499) (2,214) (2,133)
Net profit before minority interests 6,990 5,840 4,453
Minority interests 17 (636) (475) (387)
Net profit, Group share 6,354 5,365 4,066
Basic Group share of net earnings per share (EUR) 28 12.64 10.68 8.08Number of shares on which the calculation is based 502,825,461 502,412,694 502,911,125
Diluted Group share of net earnings per share (EUR) 28 12.61 10.64 8.06Number of shares on which the calculation is based 503,918,140 504,010,291 504,640,459
(1) The financial statements as of December 31, 2017 and December 31, 2016 have been restated to reflect the retrospective application with effect from January 1, 2016 of IFRS 9Financial Instruments. See Note 1.2.
(2) The financial statements as of December 31, 2017 have been restated to reflect the definitive allocation of the purchase price of Christian Dior Couture. See Note 2.
2_VA_V3 28/01/2019 13:20 Page22
Financial Documents - December 31, 2018 23
CONDENSED CONSOLIDATED FINANCIAL STATEMENTS
CONSOLIDATED STATEMENT OF COMPREHENSIVE GAINS AND LOSSES
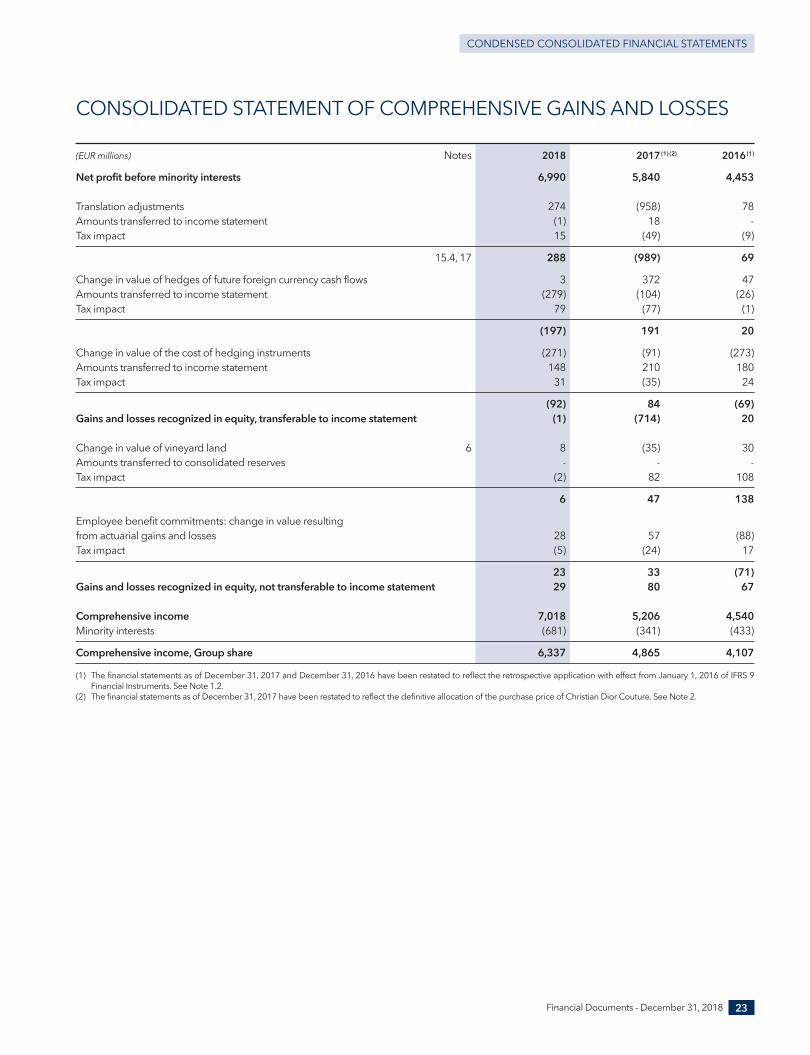
(EUR millions) Notes 2018 2017(1) (2) 2016(1)
Net profit before minority interests 6,990 5,840 4,453
Translation adjustments 274 (958) 78Amounts transferred to income statement (1) 18 - Tax impact 15 (49) (9)
15.4, 17 288 (989) 69
Change in value of hedges of future foreign currency cash flows 3 372 47Amounts transferred to income statement (279) (104) (26)Tax impact 79 (77) (1)
(197) 191 20
Change in value of the cost of hedging instruments (271) (91) (273)Amounts transferred to income statement 148 210 180Tax impact 31 (35) 24
(92) 84 (69)Gains and losses recognized in equity, transferable to income statement (1) (714) 20
Change in value of vineyard land 6 8 (35) 30Amounts transferred to consolidated reserves - - - Tax impact (2) 82 108
6 47 138
Employee benefit commitments: change in value resulting from actuarial gains and losses 28 57 (88)Tax impact (5) (24) 17
23 33 (71)Gains and losses recognized in equity, not transferable to income statement 29 80 67
Comprehensive income 7,018 5,206 4,540Minority interests (681) (341) (433)
Comprehensive income, Group share 6,337 4,865 4,107
(1) The financial statements as of December 31, 2017 and December 31, 2016 have been restated to reflect the retrospective application with effect from January 1, 2016 of IFRS 9Financial Instruments. See Note 1.2.
(2) The financial statements as of December 31, 2017 have been restated to reflect the definitive allocation of the purchase price of Christian Dior Couture. See Note 2.
2_VA_V3 28/01/2019 13:20 Page23
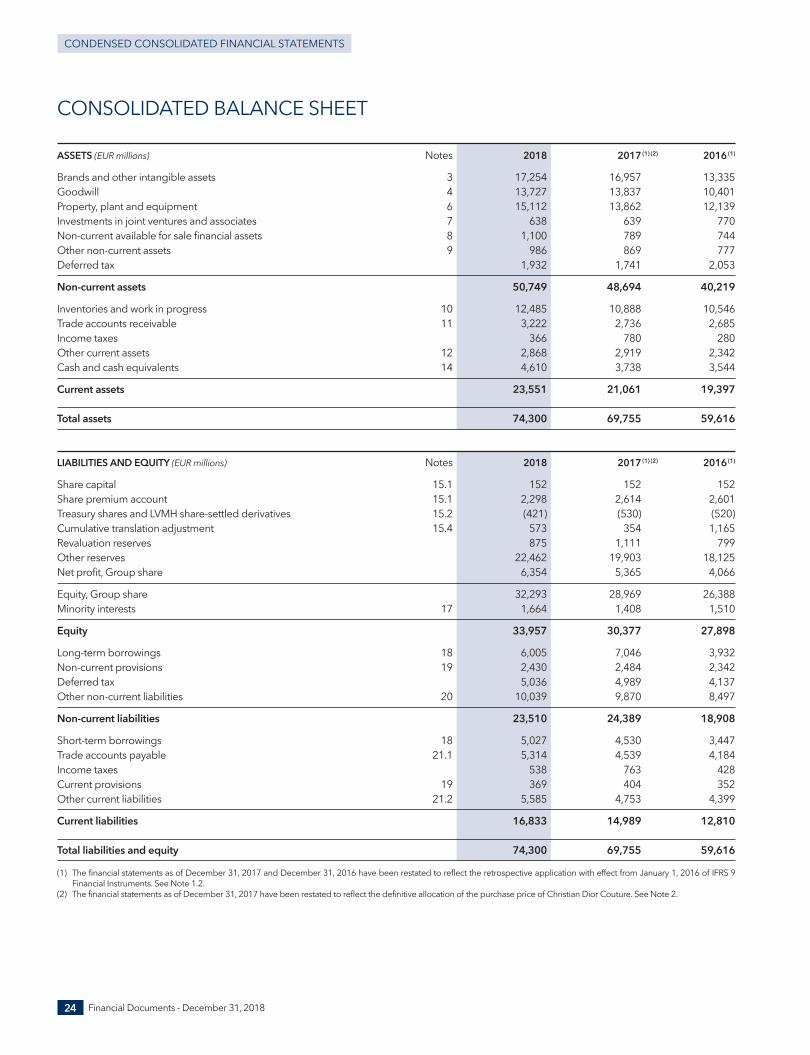
Financial Documents - December 31, 201824
CONDENSED CONSOLIDATED FINANCIAL STATEMENTS
CONSOLIDATED BALANCE SHEET
ASSETS (EUR millions) Notes 2018 2017(1) (2) 2016(1)
Brands and other intangible assets 3 17,254 16,957 13,335Goodwill 4 13,727 13,837 10,401Property, plant and equipment 6 15,112 13,862 12,139Investments in joint ventures and associates 7 638 639 770Non- current available for sale financial assets 8 1,100 789 744Other non- current assets 9 986 869 777Deferred tax 1,932 1,741 2,053
Non- current assets 50,749 48,694 40,219
Inventories and work in progress 10 12,485 10,888 10,546Trade accounts receivable 11 3,222 2,736 2,685Income taxes 366 780 280Other current assets 12 2,868 2,919 2,342Cash and cash equivalents 14 4,610 3,738 3,544
Current assets 23,551 21,061 19,397
Total assets 74,300 69,755 59,616
LIABILITIES AND EQUITY (EUR millions) Notes 2018 2017(1) (2) 2016(1)
Share capital 15.1 152 152 152Share premium account 15.1 2,298 2,614 2,601Treasury shares and LVMH share- settled derivatives 15.2 (421) (530) (520)Cumulative translation adjustment 15.4 573 354 1,165Revaluation reserves 875 1,111 799Other reserves 22,462 19,903 18,125Net profit, Group share 6,354 5,365 4,066
Equity, Group share 32,293 28,969 26,388Minority interests 17 1,664 1,408 1,510
Equity 33,957 30,377 27,898
Long- term borrowings 18 6,005 7,046 3,932Non- current provisions 19 2,430 2,484 2,342Deferred tax 5,036 4,989 4,137Other non- current liabilities 20 10,039 9,870 8,497
Non- current liabilities 23,510 24,389 18,908
Short- term borrowings 18 5,027 4,530 3,447Trade accounts payable 21.1 5,314 4,539 4,184Income taxes 538 763 428Current provisions 19 369 404 352Other current liabilities 21.2 5,585 4,753 4,399
Current liabilities 16,833 14,989 12,810
Total liabilities and equity 74,300 69,755 59,616
(1) The financial statements as of December 31, 2017 and December 31, 2016 have been restated to reflect the retrospective application with effect from January 1, 2016 of IFRS 9Financial Instruments. See Note 1.2.
(2) The financial statements as of December 31, 2017 have been restated to reflect the definitive allocation of the purchase price of Christian Dior Couture. See Note 2.
2_VA_V3 28/01/2019 13:20 Page24
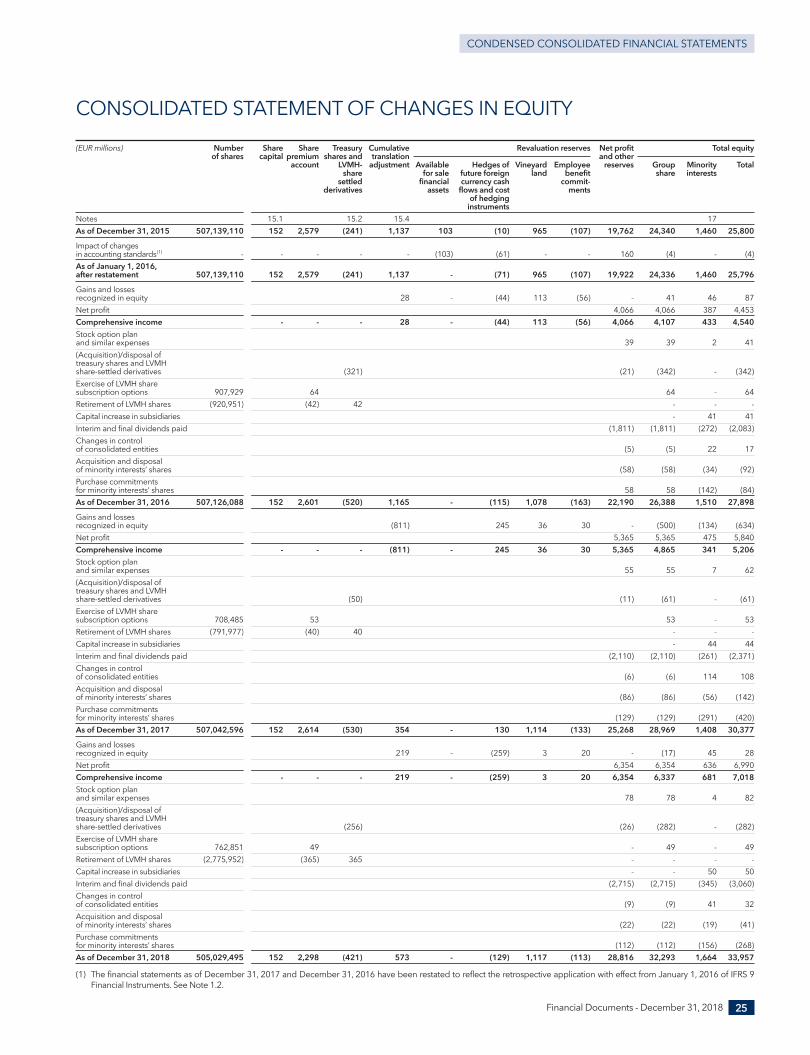
CONSOLIDATED STATEMENT OF CHANGES IN EQUITY
(EUR millions) Number Share Share Treasury Cumulative Revaluation reserves Net profit Total equity of shares capital premium shares and translation and other account LVMH- adjustment Available Hedges of Vineyard Employee reserves Group Minority Total share for sale future foreign land benefit share interests settled financial currency cash commit-
derivatives assets flows and cost ments of hedging instruments Notes 15.1 15.2 15.4 17 As of December 31, 2015 507,139,110 152 2,579 (241) 1,137 103 (10) 965 (107) 19,762 24,340 1,460 25,800
Impact of changes in accounting standards(1) - - - - - (103) (61) - - 160 (4) - (4) As of January 1, 2016, after restatement 507,139,110 152 2,579 (241) 1,137 - (71) 965 (107) 19,922 24,336 1,460 25,796
Gains and losses recognized in equity 28 - (44) 113 (56) - 41 46 87Net profit 4,066 4,066 387 4,453Comprehensive income - - - 28 - (44) 113 (56) 4,066 4,107 433 4,540Stock option plan and similar expenses 39 39 2 41(Acquisition)/disposal of treasury shares and LVMH share- settled derivatives (321) (21) (342) - (342)Exercise of LVMH share subscription options 907,929 64 64 - 64Retirement of LVMH shares (920,951) (42) 42 - - - Capital increase in subsidiaries - 41 41Interim and final dividends paid (1,811) (1,811) (272) (2,083)Changes in control of consolidated entities (5) (5) 22 17Acquisition and disposal of minority interests’ shares (58) (58) (34) (92)Purchase commitments for minority interests’ shares 58 58 (142) (84)As of December 31, 2016 507,126,088 152 2,601 (520) 1,165 - (115) 1,078 (163) 22,190 26,388 1,510 27,898
Gains and losses recognized in equity (811) 245 36 30 - (500) (134) (634)Net profit 5,365 5,365 475 5,840Comprehensive income - - - (811) - 245 36 30 5,365 4,865 341 5,206Stock option plan and similar expenses 55 55 7 62(Acquisition)/disposal of treasury shares and LVMH share- settled derivatives (50) (11) (61) - (61)Exercise of LVMH share subscription options 708,485 53 53 - 53Retirement of LVMH shares (791,977) (40) 40 - - - Capital increase in subsidiaries - 44 44Interim and final dividends paid (2,110) (2,110) (261) (2,371)Changes in control of consolidated entities (6) (6) 114 108Acquisition and disposal of minority interests’ shares (86) (86) (56) (142)Purchase commitments for minority interests’ shares (129) (129) (291) (420)As of December 31, 2017 507,042,596 152 2,614 (530) 354 - 130 1,114 (133) 25,268 28,969 1,408 30,377
Gains and losses recognized in equity 219 - (259) 3 20 - (17) 45 28Net profit 6,354 6,354 636 6,990Comprehensive income - - - 219 - (259) 3 20 6,354 6,337 681 7,018Stock option plan and similar expenses 78 78 4 82(Acquisition)/disposal of treasury shares and LVMH share- settled derivatives (256) (26) (282) - (282)Exercise of LVMH share subscription options 762,851 49 - 49 - 49Retirement of LVMH shares (2,775,952) (365) 365 - - - - Capital increase in subsidiaries - - 50 50Interim and final dividends paid (2,715) (2,715) (345) (3,060)Changes in control of consolidated entities (9) (9) 41 32Acquisition and disposal of minority interests’ shares (22) (22) (19) (41)Purchase commitments for minority interests’ shares (112) (112) (156) (268)As of December 31, 2018 505,029,495 152 2,298 (421) 573 - (129) 1,117 (113) 28,816 32,293 1,664 33,957
(1) The financial statements as of December 31, 2017 and December 31, 2016 have been restated to reflect the retrospective application with effect from January 1, 2016 of IFRS 9Financial Instruments. See Note 1.2.
Financial Documents - December 31, 2018 25
CONDENSED CONSOLIDATED FINANCIAL STATEMENTS
2_VA_V3 28/01/2019 13:20 Page25
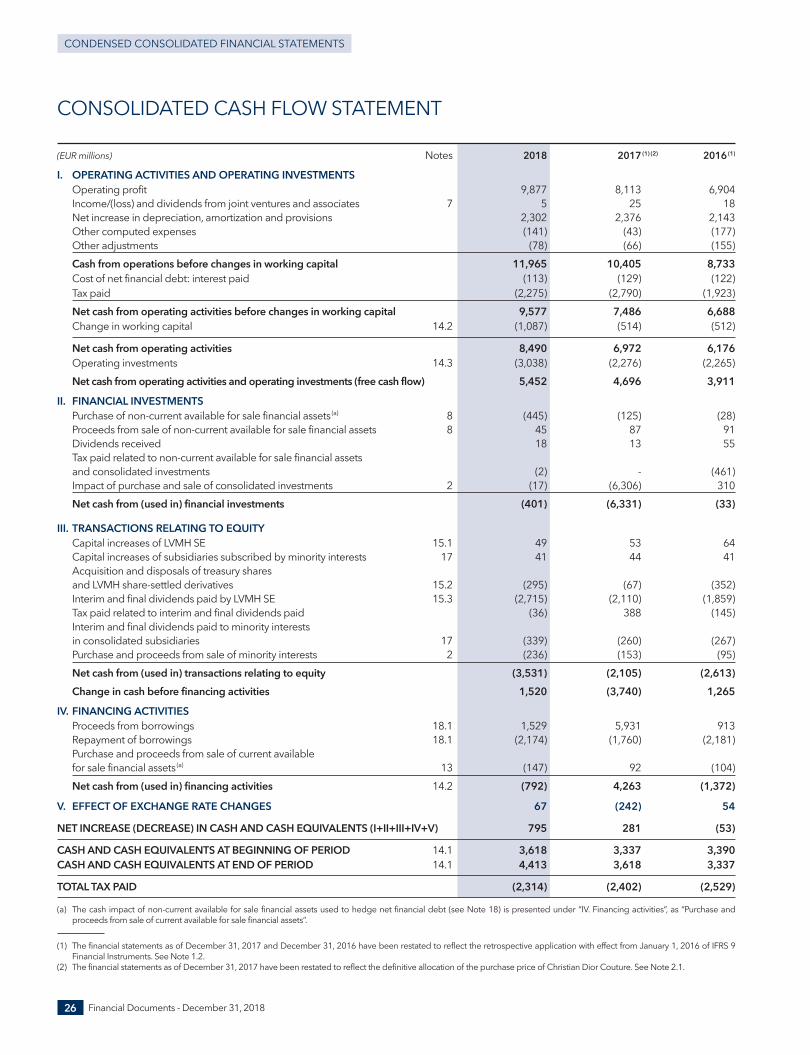
Financial Documents - December 31, 201826
CONDENSED CONSOLIDATED FINANCIAL STATEMENTS
CONSOLIDATED CASH FLOW STATEMENT
(EUR millions) Notes 2018 2017(1) (2) 2016(1)
I. OPERATING ACTIVITIES AND OPERATING INVESTMENTS Operating profit 9,877 8,113 6,904Income/(loss) and dividends from joint ventures and associates 7 5 25 18Net increase in depreciation, amortization and provisions 2,302 2,376 2,143Other computed expenses (141) (43) (177)Other adjustments (78) (66) (155)
Cash from operations before changes in working capital 11,965 10,405 8,733Cost of net financial debt: interest paid (113) (129) (122)Tax paid (2,275) (2,790) (1,923)
Net cash from operating activities before changes in working capital 9,577 7,486 6,688Change in working capital 14.2 (1,087) (514) (512)
Net cash from operating activities 8,490 6,972 6,176Operating investments 14.3 (3,038) (2,276) (2,265)
Net cash from operating activities and operating investments (free cash flow) 5,452 4,696 3,911
II. FINANCIAL INVESTMENTS Purchase of non- current available for sale financial assets(a) 8 (445) (125) (28)Proceeds from sale of non- current available for sale financial assets 8 45 87 91Dividends received 18 13 55Tax paid related to non- current available for sale financial assets and consolidated investments (2) - (461)Impact of purchase and sale of consolidated investments 2 (17) (6,306) 310
Net cash from (used in) financial investments (401) (6,331) (33)
III. TRANSACTIONS RELATING TO EQUITY Capital increases of LVMH SE 15.1 49 53 64Capital increases of subsidiaries subscribed by minority interests 17 41 44 41Acquisition and disposals of treasury shares and LVMH share- settled derivatives 15.2 (295) (67) (352)Interim and final dividends paid by LVMH SE 15.3 (2,715) (2,110) (1,859)Tax paid related to interim and final dividends paid (36) 388 (145)Interim and final dividends paid to minority interests in consolidated subsidiaries 17 (339) (260) (267)Purchase and proceeds from sale of minority interests 2 (236) (153) (95)
Net cash from (used in) transactions relating to equity (3,531) (2,105) (2,613)
Change in cash before financing activities 1,520 (3,740) 1,265
IV. FINANCING ACTIVITIES Proceeds from borrowings 18.1 1,529 5,931 913Repayment of borrowings 18.1 (2,174) (1,760) (2,181)Purchase and proceeds from sale of current available for sale financial assets(a) 13 (147) 92 (104)
Net cash from (used in) financing activities 14.2 (792) 4,263 (1,372)
V. EFFECT OF EXCHANGE RATE CHANGES 67 (242) 54
NET INCREASE (DECREASE) IN CASH AND CASH EQUIVALENTS (I+II+III+IV+V) 795 281 (53)
CASH AND CASH EQUIVALENTS AT BEGINNING OF PERIOD 14.1 3,618 3,337 3,390CASH AND CASH EQUIVALENTS AT END OF PERIOD 14.1 4,413 3,618 3,337
TOTAL TAX PAID (2,314) (2,402) (2,529)
(a) The cash impact of non- current available for sale financial assets used to hedge net financial debt (see Note 18) is presented under “IV. Financing activities”, as “Purchase andproceeds from sale of current available for sale financial assets”.
(1) The financial statements as of December 31, 2017 and December 31, 2016 have been restated to reflect the retrospective application with effect from January 1, 2016 of IFRS 9Financial Instruments. See Note 1.2.
(2) The financial statements as of December 31, 2017 have been restated to reflect the definitive allocation of the purchase price of Christian Dior Couture. See Note 2.1.
2_VA_V3 28/01/2019 13:20 Page26
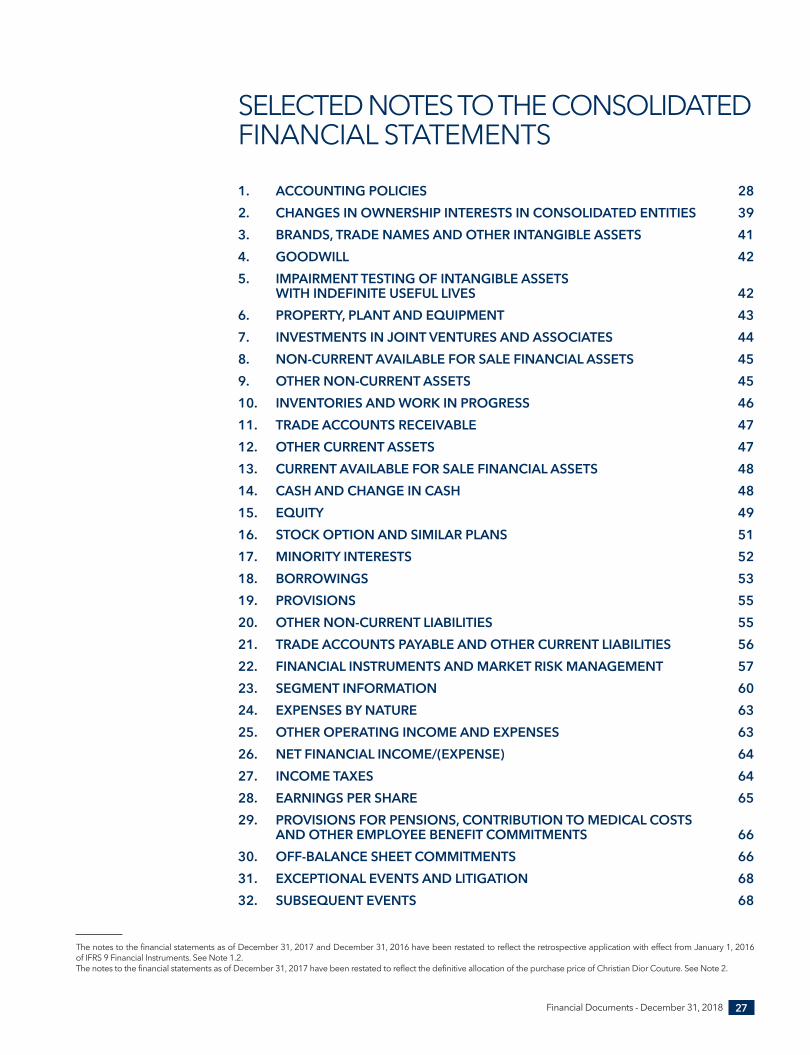
The notes to the financial statements as of December 31, 2017 and December 31, 2016 have been restated to reflect the retrospective application with effect from January 1, 2016 of IFRS 9 Financial Instruments. See Note 1.2.The notes to the financial statements as of December 31, 2017 have been restated to reflect the definitive allocation of the purchase price of Christian Dior Couture. See Note 2.
SELECTED NOTES TO THE CONSOLIDATED FINANCIAL STATEMENTS
1. ACCOUNTING POLICIES 282. CHANGES IN OWNERSHIP INTERESTS IN CONSOLIDATED ENTITIES 393. BRANDS, TRADE NAMES AND OTHER INTANGIBLE ASSETS 414. GOODWILL 425. IMPAIRMENT TESTING OF INTANGIBLE ASSETS
WITH INDEFINITE USEFUL LIVES 426. PROPERTY, PLANT AND EQUIPMENT 437. INVESTMENTS IN JOINT VENTURES AND ASSOCIATES 448. NON- CURRENT AVAILABLE FOR SALE FINANCIAL ASSETS 459. OTHER NON- CURRENT ASSETS 4510. INVENTORIES AND WORK IN PROGRESS 4611. TRADE ACCOUNTS RECEIVABLE 4712. OTHER CURRENT ASSETS 4713. CURRENT AVAILABLE FOR SALE FINANCIAL ASSETS 4814. CASH AND CHANGE IN CASH 4815. EQUITY 4916. STOCK OPTION AND SIMILAR PLANS 5117. MINORITY INTERESTS 5218. BORROWINGS 5319. PROVISIONS 5520. OTHER NON- CURRENT LIABILITIES 5521. TRADE ACCOUNTS PAYABLE AND OTHER CURRENT LIABILITIES 5622. FINANCIAL INSTRUMENTS AND MARKET RISK MANAGEMENT 5723. SEGMENT INFORMATION 6024. EXPENSES BY NATURE 6325. OTHER OPERATING INCOME AND EXPENSES 6326. NET FINANCIAL INCOME/(EXPENSE) 6427. INCOME TAXES 6428. EARNINGS PER SHARE 6529. PROVISIONS FOR PENSIONS, CONTRIBUTION TO MEDICAL COSTS
AND OTHER EMPLOYEE BENEFIT COMMITMENTS 6630. OFF- BALANCE SHEET COMMITMENTS 6631. EXCEPTIONAL EVENTS AND LITIGATION 6832. SUBSEQUENT EVENTS 68
Financial Documents - December 31, 2018 27
2_VA_V3 28/01/2019 13:20 Page27
Standards, amendments and interpretations for which application became mandatory in 2018
IFRS 15 on revenue recognition was applied prospectively as ofJanuary 1, 2018. Its application did not have any significant impacton the Group’s financial statements, due to the nature of theGroup’s business activities. Pursuant to IFRS 15, the provisionfor product returns, which was previously deducted from tradereceivables (see Note 1.25), is now presented within “Othercurrent liabilities” (see Note 21.2).
IFRS 9 on financial instruments was applied retrospectively witheffect from January 1, 2016. The Group’s financial statements forthe comparative periods, including the Notes to these financialstatements, were restated. The impact of the application ofIFRS 9 within the Group is mainly related to the change in themethod used to recognize the cost of hedging (option premiumsand forward points associated with forward contracts) and in therevaluation at market value of available for sale financial assets.
The cost of hedging is now recognized as follows:
- for foreign exchange hedges that are commercial in nature,the changes in the value of forward points associated withforward contracts and in the time value component of optionsare included in gains and losses recognized directly in equity.The cost of the forward contracts (forward points) and of theoptions (premiums) is transferred to “Other financial incomeand expenses” upon realization of the hedged transaction;
- for hedges that are financial in nature or tied to the Group’sinvestment portfolio, expenses and income arising fromdiscounts or premiums are recognized in “Borrowing costs”on a pro rata basis over the term of the hedging instruments.The cash flow impact of expenses and income arising fromforward points is presented under “Cost of net financial debt:interest paid”. The difference between the amounts recognizedin “Net financial income/(expense)” and the change in themarket value of forward points is included in gains and lossesrecognized in equity. The market value of hedges that arefinancial in nature or tied to the Group’s investment portfolioare now presented under “Net financial debt” (see Note 18).
The Group has opted to present the change in market value ofavailable for sale financial assets under “Net financial income/(expense)” (within “Other financial income and expenses”) forall shares held in the portfolio during the reported periods.
1.2 Changes in the accounting framework applicable to LVMH
The consolidated financial statements for the fiscal year endedDecember 31, 2018 were established in accordance with theinternational accounting standards and interpretations (IAS/IFRS)adopted by the European Union and applicable on December31, 2018. These standards and interpretations have been appliedconsistently to the fiscal years presented. The consolidatedfinancial statements for fiscal year 2018 were approved by theBoard of Directors on January 29, 2019.
The consolidated financial statements presented are“condensed”, which means that they only include notes that aresignificant or facilitate understanding of changes in the Group’sbusiness activity and financial position during the year. Theyare extracted from the consolidated financial statementsapproved by the Board of Directors, which include all of thenotes to the financial statements required under IFRS, asadopted in the European Union.
Selected notes to the consolidated financial statements
1. ACCOUNTING POLICIES
1.1 General framework and environment
Financial Documents - December 31, 201828
CONDENSED CONSOLIDATED FINANCIAL STATEMENTS
2_VA_V3 28/01/2019 13:20 Page28
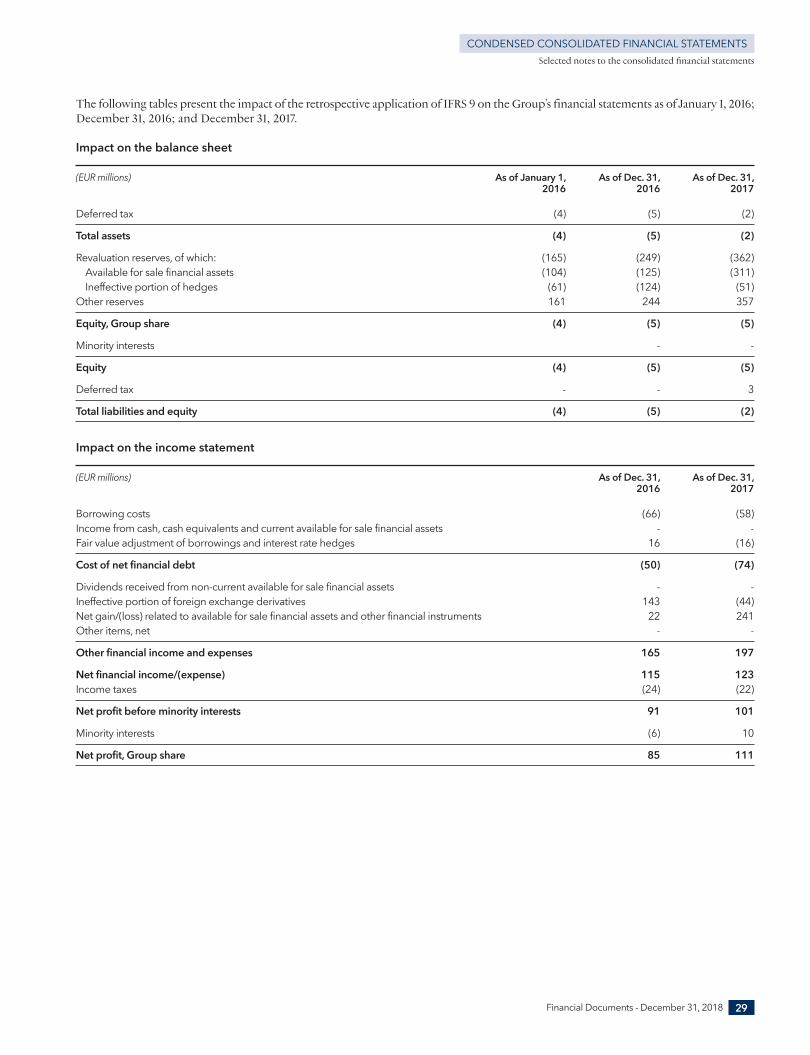
The following tables present the impact of the retrospective application of IFRS 9 on the Group’s financial statements as of January 1, 2016;December 31, 2016; and December 31, 2017.
Impact on the balance sheet
(EUR millions) As of January 1, As of Dec. 31, As of Dec. 31, 2016 2016 2017
Deferred tax (4) (5) (2)
Total assets (4) (5) (2)
Revaluation reserves, of which: (165) (249) (362)Available for sale financial assets (104) (125) (311)Ineffective portion of hedges (61) (124) (51)
Other reserves 161 244 357
Equity, Group share (4) (5) (5)
Minority interests - -
Equity (4) (5) (5)
Deferred tax - - 3
Total liabilities and equity (4) (5) (2)
Impact on the income statement
(EUR millions) As of Dec. 31, As of Dec. 31, 2016 2017
Borrowing costs (66) (58)Income from cash, cash equivalents and current available for sale financial assets - - Fair value adjustment of borrowings and interest rate hedges 16 (16)
Cost of net financial debt (50) (74)
Dividends received from non- current available for sale financial assets - - Ineffective portion of foreign exchange derivatives 143 (44)Net gain/(loss) related to available for sale financial assets and other financial instruments 22 241Other items, net - -
Other financial income and expenses 165 197
Net financial income/(expense) 115 123Income taxes (24) (22)
Net profit before minority interests 91 101
Minority interests (6) 10
Net profit, Group share 85 111
Selected notes to the consolidated financial statements
Financial Documents - December 31, 2018 29
CONDENSED CONSOLIDATED FINANCIAL STATEMENTS
2_VA_V3 28/01/2019 13:20 Page29
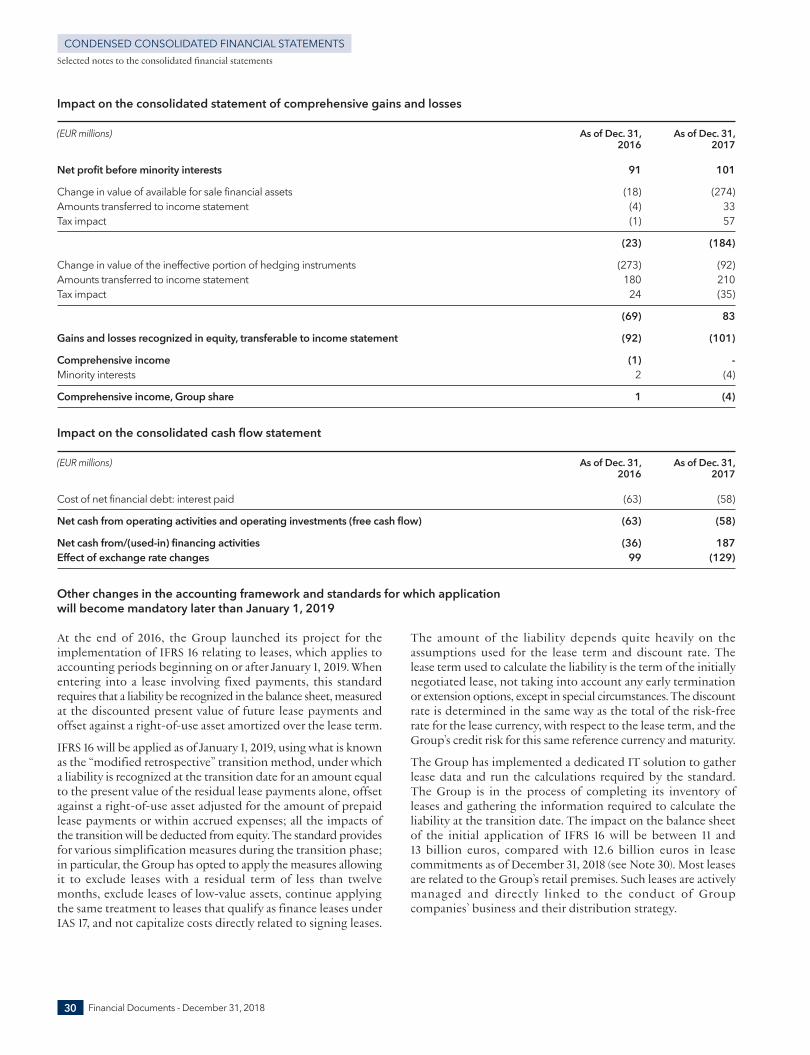
At the end of 2016, the Group launched its project for theimplementation of IFRS 16 relating to leases, which applies toaccounting periods beginning on or after January 1, 2019. Whenentering into a lease involving fixed payments, this standardrequires that a liability be recognized in the balance sheet, measuredat the discounted present value of future lease payments andoffset against a right- of- use asset amortized over the lease term.
IFRS 16 will be applied as of January 1, 2019, using what is knownas the “modified retrospective” transition method, under whicha liability is recognized at the transition date for an amount equalto the present value of the residual lease payments alone, offsetagainst a right- of- use asset adjusted for the amount of prepaidlease payments or within accrued expenses; all the impacts ofthe transition will be deducted from equity. The standard providesfor various simplification measures during the transition phase;in particular, the Group has opted to apply the measures allowingit to exclude leases with a residual term of less than twelvemonths, exclude leases of low- value assets, continue applyingthe same treatment to leases that qualify as finance leases underIAS 17, and not capitalize costs directly related to signing leases.
The amount of the liability depends quite heavily on theassumptions used for the lease term and discount rate. Thelease term used to calculate the liability is the term of the initiallynegotiated lease, not taking into account any early terminationor extension options, except in special circumstances. The discountrate is determined in the same way as the total of the risk- freerate for the lease currency, with respect to the lease term, and theGroup’s credit risk for this same reference currency and maturity.
The Group has implemented a dedicated IT solution to gatherlease data and run the calculations required by the standard.The Group is in the process of completing its inventory ofleases and gathering the information required to calculate theliability at the transition date. The impact on the balance sheetof the initial application of IFRS 16 will be between 11 and13 billion euros, compared with 12.6 billion euros in leasecommitments as of December 31, 2018 (see Note 30). Most leasesare related to the Group’s retail premises. Such leases are activelymanaged and directly linked to the conduct of Groupcompanies’ business and their distribution strategy.
Impact on the consolidated statement of comprehensive gains and losses
(EUR millions) As of Dec. 31, As of Dec. 31, 2016 2017
Net profit before minority interests 91 101
Change in value of available for sale financial assets (18) (274)Amounts transferred to income statement (4) 33Tax impact (1) 57
(23) (184)
Change in value of the ineffective portion of hedging instruments (273) (92)Amounts transferred to income statement 180 210Tax impact 24 (35)
(69) 83
Gains and losses recognized in equity, transferable to income statement (92) (101)
Comprehensive income (1) - Minority interests 2 (4)
Comprehensive income, Group share 1 (4)
Impact on the consolidated cash flow statement
(EUR millions) As of Dec. 31, As of Dec. 31, 2016 2017
Cost of net financial debt: interest paid (63) (58)
Net cash from operating activities and operating investments (free cash flow) (63) (58)
Net cash from/(used- in) financing activities (36) 187Effect of exchange rate changes 99 (129)
Other changes in the accounting framework and standards for which application will become mandatory later than January 1, 2019
Selected notes to the consolidated financial statements
Financial Documents - December 31, 201830
CONDENSED CONSOLIDATED FINANCIAL STATEMENTS
2_VA_V3 28/01/2019 13:20 Page30
Definitions of “Profit from recurring operations” and “Other operating income and expenses”The Group’s main business is the management and developmentof its brands and trade names. “Profit from recurring operations”is derived from these activities, whether they are recurring ornon- recurring, core or incidental transactions.
“Other operating income and expenses” comprises incomestatement items, which – due to their nature, amount orfrequency – may not be considered inherent to the Group’srecurring operations or its profit from recurring operations. Thiscaption reflects in particular the impact of changes in the scopeof consolidation, the impairment of goodwill and the impairmentand amortization of brands and trade names, as well as anysignificant amount relating to the impact of certain unusualtransactions, such as gains or losses arising on the disposal of fixedassets, restructuring costs, costs in respect of disputes, or anyother non- recurring income or expense which may otherwisedistort the comparability of profit from recurring operationsfrom one period to the next.
Cash flow statementNet cash from operating activities is determined on the basis ofoperating profit, adjusted for non- cash transactions. In addition:
- dividends received are presented according to the nature of theunderlying investments; thus, dividends from joint venturesand associates are presented in “Net cash from operatingactivities”, while dividends from other unconsolidated entitiesare presented in “Net cash from financial investments”;
- tax paid is presented according to the nature of the transactionfrom which it arises: in “Net cash from operating activities”for the portion attributable to operating transactions; in “Netcash from financial investments” for the portion attributableto transactions in available for sale financial assets, notablytax paid on gains from their sale; in “Net cash from transactionsrelating to equity” for the portion attributable to transactionsin equity, notably distribution taxes arising on the paymentof dividends.
1.4 Presentation of the financial statements
The first accounts prepared by the Group in accordance withIFRS were the financial statements for the year ended December31, 2005, with a transition date of January 1, 2004. IFRS 1 allowedfor exceptions to the retrospective application of IFRS at thetransition date. The procedures implemented by the Groupwith respect to these exceptions include the following:
- business combinations: the exemption from retrospectiveapplication was not applied. The recognition of the merger ofMoët Hennessy and Louis Vuitton in 1987 and all subsequent
acquisitions were restated in accordance with IFRS 3; IAS 36Impairment of Assets and IAS 38 Intangible Assets were appliedretrospectively as of that date;
- foreign currency translation of the financial statements ofsubsidiaries outside the eurozone: translation reserves relatingto the consolidation of subsidiaries that prepare their accountsin foreign currency were reset to zero as of January 1, 2004 andoffset against “Other reserves”.
1.3 First- time adoption of IFRS
If the modified retrospective transition method is applied, thestandard prohibits the restatement of comparative fiscal years.Nevertheless, the Group plans to prepare restated data for 2018for its financial communication requirements. Moreover, giventhe importance of leases to the Group’s activities, and in order topresent consistent performance indicators, independently ofthe fixed or variable nature of lease payments, specific indicatorswill be used for internal performance monitoring requirementsand financial communication purposes; in particular, capitalizedfixed lease payments will be deducted in their entirety fromcash flow in order to calculate the aggregate entitled “Operatingfree cash flow”. In correlation, the liability for capitalized leaseswill be excluded from the definition of net financial debt.
The impact of applying IFRS 16 on profit from recurring operationsand net profit will not be significant.
The impact of the application of IFRIC 23 – Uncertainty overIncome Tax Treatments – with effect from January 1, 2019 is beingassessed.
The Group is following the ongoing discussions held at IFRICand IASB related to the recognition of purchase commitmentsfor minority interests’ shares and changes in their amount. SeeNote 1.12 for a description of the recognition method appliedby LVMH to these commitments.
Selected notes to the consolidated financial statements
Financial Documents - December 31, 2018 31
CONDENSED CONSOLIDATED FINANCIAL STATEMENTS
Transactions of consolidated companies denominated in a currencyother than their functional currencies are translated to theirfunctional currencies at the exchange rates prevailing at thetransaction dates.
Accounts receivable, accounts payable and debts denominatedin currencies other than the entities’ functional currencies aretranslated at the applicable exchange rates at the fiscal year- end.Gains and losses resulting from this translation are recognized:
- within cost of sales in the case of commercial transactions;
- within net financial income/expense in the case of financialtransactions.
Foreign exchange gains and losses arising from the translationor elimination of intra- Group transactions or receivables andpayables denominated in currencies other than the entity’sfunctional currency are recorded in the income statement unlessthey relate to long- term intra- Group financing transactions,which can be considered as transactions relating to equity. In thelatter case, translation adjustments are recorded in equity under“Cumulative translation adjustment”.
Derivatives used to hedge commercial, financial or investmenttransactions are recognized in the balance sheet at their marketvalue (see Note 1.9) at the balance sheet date. Changes in thevalue of the effective portions of these derivatives are recognizedas follows:
- for hedges that are commercial in nature:
- within cost of sales for hedges of receivables and payablesrecognized in the balance sheet at the end of the period,
- within equity under “Revaluation reserves” for hedges offuture cash flows; this amount is transferred to cost of salesupon recognition of the hedged assets and liabilities;
- for hedges that are tied to the Group’s investment portfolio(hedging the net worth of subsidiaries whose functionalcurrency is not the euro), within equity under “Cumulativetranslation adjustment”; this amount is transferred to theincome statement upon the sale or liquidation (whether partialor total) of the subsidiary whose net worth is hedged;
- for hedges that are financial in nature, within “Net financialincome/(expense)”, under “Other financial income and expenses”.
1.8 Foreign currency transactions and hedging of exchange rate risks
The consolidated financial statements are presented in euros;the financial statements of entities presented in a differentfunctional currency are translated into euros:
- at the period- end exchange rates for balance sheet items;
- at the average rates for the period for income statement items.
Translation adjustments arising from the application of theserates are recorded in equity under “Cumulative translationadjustment”.
1.7 Foreign currency translation of the financial statements of entities outside the eurozone
The subsidiaries in which the Group holds a direct or indirectde facto or de jure controlling interest are fully consolidated.
Jointly controlled companies and companies where the Grouphas significant influence but no controlling interest are accountedfor using the equity method. Although jointly controlled, thoseentities are fully integrated within the Group’s operating activities.LVMH discloses their net profit, as well as that of entities usingthe equity method (see Note 7), on a separate line, which formspart of profit from recurring operations.
The assets, liabilities, income and expenses of the Wines andSpirits distribution subsidiaries held jointly with the Diageogroup are consolidated only in proportion to the LVMH group’sshare of operations (see Note 1.25).
The consolidation on an individual or collective basis of companiesthat are not consolidated (see “Companies not included in thescope of consolidation”) would not have a significant impacton the Group’s main aggregates.
1.6 Methods of consolidation
For the purpose of preparing the consolidated financial statements,the measurement of certain balance sheet and income statementitems requires the use of hypotheses, estimates or other formsof judgment. This is particularly true of the valuation of intangibleassets (see Note 5), the measurement of purchase commitmentsfor minority interests’ shares (see Notes 1.12 and 20), and thedetermination of the amount of provisions for contingencies
and losses (see Note 19) or for impairment of inventories (seeNotes 1.16 and 10) and, if applicable, deferred tax assets (see Note 27).Such hypotheses, estimates or other forms of judgment madeon the basis of the information available or the situation prevailingat the date at which the financial statements are prepared maysubsequently prove different from actual events.
1.5 Use of estimates
Selected notes to the consolidated financial statements
Financial Documents - December 31, 201832
CONDENSED CONSOLIDATED FINANCIAL STATEMENTS
2_VA_V3 28/01/2019 13:20 Page32
Only acquired brands and trade names that are well known andindividually identifiable are recorded as assets based on theirmarket values at their dates of acquisition.
Brands and trade names are chiefly valued using the forecastdiscounted cash flow method, or based on comparable transactions(i.e. using the revenue and net profit coefficients employed forrecent transactions involving similar brands) or stock marketmultiples observed for related businesses. Other complementarymethods may also be employed: the relief from royalty method,involving equating a brand’s value with the present value of the
royalties required to be paid for its use; the margin differentialmethod, applicable when a measurable difference can be identifiedin the amount of revenue generated by a branded product incomparison with a similar unbranded product; and finally theequivalent brand reconstitution method involving, in particular,estimation of the amount of advertising and promotion expensesrequired to generate a similar brand.
Costs incurred in creating a new brand or developing an existingbrand are expensed.
1.9 Fair value measurement
Fair value (or market value) is the price that would be obtained from the sale of an asset or paid to transfer a liability in an orderlytransaction between market participants.
The assets and liabilities measured at fair value in the balance sheet are as follows:
Approaches to determining fair value Amounts recorded at balance sheet date
Changes in the value of these derivatives related to forwardpoints associated with forward contracts, as well as in the timevalue component of options, are recognized as follows:
- for hedges that are commercial in nature, within equity under“Revaluation reserves”. The cost of the forward contracts(forward points) and of the options (premiums) is transferredto “Other financial income and expenses” upon realization ofthe hedged transaction;
- for hedges that are tied to the Group’s investment portfolio or financial in nature, expenses and income arising fromdiscounts or premiums are recognized in “Borrowing costs”
on a pro rata basis over the term of the hedging instruments.The difference between the amounts recognized in “Net financialincome/(expense)” and the change in the value of forwardpoints is recognized in equity under “Revaluation reserves”.
Market value changes of derivatives not designated as hedgesare recorded within net financial income/(expense).
See also Note 1.21 for the definition of the concepts of effectiveand ineffective portions, and Note 1.2 on the impact of the initialretrospective application as of January 1, 2016 of IFRS 9 FinancialInstruments.
Selected notes to the consolidated financial statements
Financial Documents - December 31, 2018 33
CONDENSED CONSOLIDATED FINANCIAL STATEMENTS
No other assets or liabilities have been remeasured at market value at the balance sheet date.
1.10 Brands and other intangible assets
Vineyard land Based on recent transactions in similar assets. See Note 1.13. Note 6
Grape harvests Based on purchase prices for equivalent grapes. See Note 1.16. Note 10
Derivatives Based on market data and according to commonly used valuation models. See Note 1.21.
Note 22
Borrowings hedged against changesin value due to interest rate fluctuations
Based on market data and according to commonly used valuation models. See Note 1.20.
Note 18
Liabilities in respect of purchasecommitments for minority interests’ shares priced according to fair value
Generally based on the market multiples of comparable companies. See Note 1.12.
Note 20
Available for sale financial assets Quoted investments: price quotations at the close of trading on the balance sheet date. Unquoted investments: estimated net realizable value, either according to formulas based on market data or based on private quotations. See Note 1.15.
Note 8, Note 13
Cash and cash equivalents (SICAV and FCP funds)
Based on the liquidation value at the balance sheet date. See Note 1.18. Note 14
2_VA_V3 28/01/2019 13:20 Page33
With the exception of vineyard land, the gross value of property,plant and equipment is stated at acquisition cost. Any borrowingcosts incurred prior to the placed- in- service date or during theconstruction period of assets are capitalized.
Vineyard land is recognized at the market value at the balancesheet date. This valuation is based on official published data forrecent transactions in the same region. Any difference comparedto historical cost is recognized within equity in “Revaluationreserves”. If the market value falls below the acquisition cost,the resulting impairment is charged to the income statement.
1.13 Property, plant and equipment
The Group has granted put options to minority shareholdersof certain fully consolidated subsidiaries.
Pending specific guidance from IFRSs regarding this issue, the Group recognizes these commitments as follows:
- the value of the commitment at the balance sheet date appearsin “Other non- current liabilities”, or in “Other current liabilities”if the minority shareholder has provided notice of exercisingits put option before the fiscal year- end;
- the corresponding minority interests are cancelled;
- for commitments granted prior to January 1, 2010, the differencebetween the amount of the commitments and cancelledminority interests is maintained as an asset on the balance sheetunder goodwill, as are subsequent changes in this difference.For commitments granted as from January 1, 2010, the differencebetween the amount of the commitments and minority interestsis recorded in equity, under “Other reserves”.
This recognition method has no effect on the presentation ofminority interests within the income statement.
1.12 Purchase commitments for minority interests’ shares
When the Group takes de jure or de facto control of a business, itsassets, liabilities and contingent liabilities are estimated at theirmarket value as of the date when control is obtained; the differencebetween the cost of taking control and the Group’s share of themarket value of those assets, liabilities and contingent liabilitiesis recognized as goodwill.
The cost of taking control is the price paid by the Group in thecontext of an acquisition, or an estimate of this price if thetransaction is carried out without any payment of cash, excludingacquisition costs, which are disclosed under “Other operatingincome and expenses”.
The difference between the carrying amount of minority interestspurchased after control is obtained and the price paid for theiracquisition is deducted from equity.
Goodwill is accounted for in the functional currency of theacquired entity.
Goodwill is not amortized but is subject to annual impairmenttesting using the methodology described in Note 1.14. Anyimpairment expense recognized is included within “Otheroperating income and expenses”.
1.11 Changes in ownership interests in consolidated entities
Brands, trade names and other intangible assets with finiteuseful lives are amortized over their estimated useful lives. Theclassification of a brand or trade name as an asset of definite orindefinite useful life is generally based on the following criteria:
- the brand or trade name’s overall positioning in its marketexpressed in terms of volume of activity, international presenceand reputation;
- its expected long- term profitability;
- its degree of exposure to changes in the economic environment;
- any major event within its business segment liable to compromiseits future development;
- its age.
Amortizable lives of brands and trade names with definite usefullives range from 5 to 20 years, depending on their estimatedperiod of use.
Impairment tests are carried out for brands, trade names andother intangible assets using the methodology described inNote 1.14.
Research expenditure is not capitalized. New product developmentexpenditure is not capitalized unless the final decision has beenmade to launch the product.
Intangible assets other than brands and trade names are amortizedover the following periods:
- leasehold rights, key money: based on market conditions,generally over the lease period;
- rights attached to sponsorship agreements and media partnerships:over the life of the agreements, depending on how the rightsare used;
- development expenditure: three years at most;
- software, websites: one to five years.
Selected notes to the consolidated financial statements
Financial Documents - December 31, 201834
CONDENSED CONSOLIDATED FINANCIAL STATEMENTS
2_VA_V3 28/01/2019 13:20 Page34
Available for sale financial assets are classified as current ornon- current based on their nature.
Non- current available for sale financial assets comprise strategicand non- strategic investments whose estimated period andform of ownership justify such classification.
Current available for sale financial assets (presented in “Othercurrent assets”; see Note 12) include temporary investments inshares, shares of SICAVs, FCPs and other mutual funds, excludinginvestments made as part of the daily cash management, whichare accounted for as “Cash and cash equivalents” (see Note 1.18).
Available for sale financial assets are measured at their listed valueat the fiscal year- end date in the case of quoted investments,and in the case of unquoted investments at their estimated net realizable value, assessed either according to formulas basedon market data or based on private quotations at the fiscalyear- end date.
Positive or negative changes in value are recognized under “Netfinancial income/(expense)” (within “Other financial income andexpenses”) for all shares held in the portfolio during the reportedperiods. See Note 1.2 on the impact of the initial retrospectiveapplication as of January 1, 2016 of IFRS 9 Financial Instruments.
1.15 Available for sale financial assets
Intangible and tangible fixed assets are subject to impairmenttesting whenever there is any indication that an asset may beimpaired (particularly following major changes in the asset’soperating conditions), and in any event at least annually in thecase of intangible assets with indefinite useful lives (mainly brands,trade names and goodwill). When the carrying amount of assetswith indefinite useful lives is greater than the higher of theirvalue in use or market value, the resulting impairment loss isrecognized within “Other operating income and expenses”,allocated on a priority basis to any existing goodwill.
Value in use is based on the present value of the cash flows expectedto be generated by these assets. Market value is estimated bycomparison with recent similar transactions or on the basis ofvaluations performed by independent experts for the purposesof a disposal transaction.
Cash flows are forecast for each business segment, defined asone or several brands or trade names under the responsibilityof a dedicated management team. Smaller- scale cash- generating
units, such as a group of stores, may be distinguished within aparticular business segment.
The forecast data required for the cash flow method is basedon annual budgets and multi- year business plans prepared bythe management of the business segments concerned. Detailedforecasts cover a five- year period, which may be extended forbrands undergoing strategic repositioning or whose productioncycle exceeds five years. An estimated terminal value is addedto the value resulting from discounted forecast cash flows, whichcorresponds to the capitalization in perpetuity of cash flows mostoften arising from the last year of the plan. Discount rates areset for each business group with reference to companies engagedin comparable businesses. Forecast cash flows are discountedon the basis of the rate of return to be expected by an investorin the applicable business and an assessment of the risk premiumassociated with that business. When several forecast scenariosare developed, the probability of occurrence of each scenario is assessed.
1.14 Impairment testing of fixed assets
Buildings mostly occupied by third parties are reported asinvestment property, at acquisition cost. Investment propertyis thus not remeasured at market value.
Assets acquired under finance leases are capitalized on the basisof the lower of their market value and the present value offuture lease payments.
The depreciable amount of property, plant and equipmentcomprises the acquisition cost of their components less residualvalue, which corresponds to the estimated disposal price of theasset at the end of its useful life.
Property, plant and equipment are depreciated on a straight- linebasis over their estimated useful lives; the following useful livesare applied:
- buildings including investment property 20 to 50 years;- machinery and equipment 3 to 25 years;- leasehold improvements 3 to 10 years;- producing vineyards 18 to 25 years.
Expenses for maintenance and repairs are charged to the incomestatement as incurred.
Selected notes to the consolidated financial statements
Financial Documents - December 31, 2018 35
CONDENSED CONSOLIDATED FINANCIAL STATEMENTS
2_VA_V3 28/01/2019 13:20 Page35
Borrowings are measured at amortized cost, i.e. nominal value netof premium and issue expenses, which are charged progressivelyto net financial income/(expense) using the effective interestmethod.
In the case of hedging against fluctuations in the value ofborrowings resulting from changes in interest rates, both thehedged amount of borrowings and the related hedging instrumentsare measured at their market value at the balance sheet date,with any changes in those values recognized within net financialincome/(expense), under “Fair value adjustment of borrowingsand interest rate hedges”. See Note 1.9 regarding the measurement
of hedged borrowings at market value. Interest income andexpenses related to hedging instruments are recognized withinnet financial income/(expense), under “Borrowing costs”.
In the case of hedging against fluctuations in future interestpayments, the related borrowings remain measured at theiramortized cost while any changes in value of the effective hedgeportions are taken to equity as part of “Revaluation reserves”.
Changes in value of non- hedging derivatives, and of theineffective portions of hedges, are recognized within net financialincome/(expense).
1.20 Borrowings
A provision is recognized whenever an obligation exists towardsa third party resulting in a probable disbursement for the Group,the amount of which may be reliably estimated. See also Notes 1.23and 19.
When execution of its obligation is expected to occur in morethan one year, the provision amount is discounted, the effectsof which are recognized in net financial income/(expense) usingthe effective interest rate method.
1.19 Provisions
Cash and cash equivalents comprise cash and highly liquidmoney- market investments subject to an insignificant risk ofchanges in value over time.
Money- market investments are measured at their market value,based on price quotations at the close of trading and on theexchange rate prevailing at the fiscal year- end date, with any changesin value recognized as part of net financial income/(expense).
1.18 Cash and cash equivalents
Trade accounts receivable, loans and other receivables are recordedat amortized cost, which corresponds to their face value.Impairment is recognized for the portion of loans and receivablesnot covered by credit insurance when such receivables arerecorded, in the amount of the losses expected upon maturity.This reflects the probability of counterparty default and theexpected loss rate, measured using historical statistical data,
information provided by credit bureaus, or ratings by creditrating agencies, depending on the specific case.
The amount of long- term loans and receivables (i.e. those fallingdue in more than one year) is subject to discounting, the effectsof which are recognized under net financial income/(expense),using the effective interest rate method.
1.17 Trade accounts receivable, loans and other receivables
Inventories other than wine produced by the Group are recordedat the lower of cost (excluding interest expense) and net realizablevalue; cost comprises manufacturing cost (finished goods) orpurchase price, plus incidental costs (raw materials, merchandise).
Wine produced by the Group, including champagne, is measuredon the basis of the applicable harvest market value, which isdetermined by reference to the average purchase price of equivalentgrapes, as if the grapes harvested had been purchased fromthird parties. Until the date of the harvest, the value of grapes is calculated on a pro rata basis, in line with the estimated yieldand market value.
Inventories are valued using either the weighted average cost or the FIFO method, depending on the type of business.
Due to the length of the aging process required for champagneand spirits (cognac, whisky), the holding period for theseinventories generally exceeds one year. However, in accordancewith industry practices, these inventories are classified as currentassets.
Provisions for impairment of inventories are chiefly recognizedfor businesses other than Wines and Spirits. They are generallyrequired because of product obsolescence (end of season orcollection, expiration date approaching, etc.) or lack of salesprospects.
1.16 Inventories and work in progress
Selected notes to the consolidated financial statements
Financial Documents - December 31, 201836
CONDENSED CONSOLIDATED FINANCIAL STATEMENTS
2_VA_V3 28/01/2019 13:20 Page36
When plans related to retirement bonuses, pensions, contributionto medical costs and other commitments entail the paymentby the Group of contributions to third- party organizations thatassume sole responsibility for subsequently paying such retirementbenefits, pensions or contributions to medical costs, thesecontributions are expensed in the fiscal year in which they falldue, with no liability recorded on the balance sheet.
When the payment of retirement bonuses, pensions, contributionsto medical costs and other commitments is to be borne by the Group, a provision is recorded in the balance sheet in theamount of the corresponding actuarial commitment. Changesin this provision are recognized as follows:
- the portion related to the cost of services rendered by employeesand net interest for the fiscal year is recognized in profit fromrecurring operations for the fiscal year;
- the portion related to changes in actuarial assumptions andto differences between projected and actual data (experienceadjustments) is recognized in gains and losses taken to equity.
If this commitment is partially or fully funded by paymentsmade by the Group to external financial organizations, thesededicated funds are deducted from the actuarial commitmentrecorded in the balance sheet.
The actuarial commitment is calculated based on assessmentsthat are specifically designed for the country and the Groupcompany concerned. In particular, these assessments includeassumptions regarding discount rates, salary increases, inflation,life expectancy and staff turnover.
1.23 Pensions, contribution to medical costs and other employee benefit commitments
LVMH shares and options to purchase LVMH shares that areheld by the Group are measured at their acquisition cost andrecognized as a deduction from consolidated equity, irrespectiveof the purpose for which they are held.
In the event of disposal, the cost of the shares disposed of isdetermined by allocation category (see Note 15.2) using the FIFOmethod, with the exception of shares held under stock optionplans, for which the calculation is performed for each plan usingthe weighted average cost method. Gains and losses on disposal,net of income taxes, are taken directly to equity.
1.22 Treasury shares and LVMH share- settled derivatives
The Group enters into derivative transactions as part of its strategyfor hedging foreign exchange, interest rate and gold price risks.
To hedge against commercial, financial and investment foreignexchange risk, the Group uses options, forward contracts, foreignexchange swaps and cross- currency swaps. The time value ofoptions, the forward point component of forward contracts andforeign exchange swaps, as well as the foreign currency basisspread component of cross- currency swaps are systematicallyexcluded from the hedge relation. Consequently, only the intrinsicvalue of the instruments is considered a hedging instrument.Regarding hedged items (future foreign currency cash flows,commercial or financial liabilities and accounts receivable in foreign currencies, subsidiaries’ equity denominated in afunctional currency other than the euro), only their change in
value in respect of foreign exchange risk is considered a hedgeditem. As such, aligning the hedging instruments’ main features(nominal values, currencies, maturities) with those of the hedgeditems makes it possible to perfectly offset changes in value.
Derivatives are recognized in the balance sheet at their marketvalue at the balance sheet date. Changes in their value areaccounted for as described in Note 1.8 in the case of foreignexchange hedges, and as described in Note 1.20 in the case ofinterest rate hedges.
Market value is based on market data and commonly usedvaluation models.
Derivatives with maturities in excess of twelve months aredisclosed as non- current assets and liabilities.
1.21 Derivatives
Selected notes to the consolidated financial statements
Financial Documents - December 31, 2018 37
CONDENSED CONSOLIDATED FINANCIAL STATEMENTS
Net financial debt comprises short- and long- term borrowings,the market value at the balance sheet date of interest ratederivatives, less the amount at the balance sheet date of non- currentavailable for sale financial assets used to hedge financial debt,current available for sale financial assets, cash and cash equivalents,
in addition to the market value at that date of foreign exchangederivatives related to any of the aforementioned items.
See also Note 1.2 on the impact of the initial retrospectiveapplication as of January 1, 2016 of IFRS 9 Financial Instruments.
2_VA_V3 28/01/2019 13:20 Page37
Advertising and promotion expenses include the costs of producingadvertising media, purchasing media space, manufacturingsamples and publishing catalogs, and in general, the cost of allactivities designed to promote the Group’s brands and products.
Advertising and promotion expenses are recorded withinmarketing and selling expenses upon receipt or production ofgoods or upon completion of services rendered.
1.26 Advertising and promotion expenses
Definition of revenue
Revenue mainly comprises retail sale within the Group’s storenetwork (including e- commerce websites) and sales throughagents and distributors. Sales made in stores owned by thirdparties are treated as retail transactions if the risks and rewardsof ownership of the inventories are retained by the Group.
Direct sales to customers are made through retail stores in Fashionand Leather Goods and Selective Retailing, as well as certainWatches and Jewelry and Perfumes and Cosmetics brands. Thesesales are recognized at the time of purchase by retail customers.
Wholesale sales mainly concern the Wines and Spirits businesses,as well as certain Perfumes and Cosmetics and Watches and Jewelrybrands. The Group recognizes revenue when title transfers tothird- party customers.
Revenue includes shipment and transportation costs re- billedto customers only when these costs are included in products’selling prices as a lump sum.
Revenue is presented net of all forms of discount. In particular,payments made in order to have products referenced or, inaccordance with agreements, to participate in advertising campaignswith the distributors, are deducted from related revenue.
Provisions for product returns
Perfumes and Cosmetics and, to a lesser extent, Fashion andLeather Goods and Watches and Jewelry companies may acceptthe return of unsold or outdated products from their customersand distributors.
Where this practice is applied, revenue is reduced by theestimated amount of such returns, and a provision is recognizedwithin “Other current liabilities” (see Notes 1.2 and 21.2), alongwith a corresponding entry made to inventories. The estimatedrate of returns is based on historical statistical data.
Businesses undertaken in partnership with Diageo
A significant proportion of revenue for the Group’s Wines andSpirits businesses is generated within the framework of distributionagreements with Diageo, generally taking the form of sharedentities which sell and deliver both groups’ products to customers;the income statement and balance sheet of these entities isapportioned between LVMH and Diageo based on distributionagreements. According to those agreements, the assets, liabilities,income, and expenses of such entities are consolidated only inproportion to the Group’s share of operations.
1.25 Revenue recognition
The tax expense comprises current tax payable by consolidatedcompanies and deferred tax resulting from temporary differences.
Deferred tax is recognized in respect of temporary differencesarising between the value of assets and liabilities for purposesof consolidation and the value resulting from the applicationof tax regulations.
Deferred tax is measured on the basis of the income tax ratesenacted at the balance sheet date; the effect of changes in ratesis recognized during the periods in which changes are enacted.
Future tax savings from tax losses carried forward are recordedas deferred tax assets on the balance sheet, which are impairedif they are deemed not recoverable; only amounts for whichfuture use is deemed probable are recognized.
Deferred tax assets and liabilities are not discounted.
Taxes payable in respect of the distribution of retained earningsof subsidiaries give rise to provisions if distribution is deemedprobable.
1.24 Current and deferred tax
Selected notes to the consolidated financial statements
Financial Documents - December 31, 201838
CONDENSED CONSOLIDATED FINANCIAL STATEMENTS
2_VA_V3 28/01/2019 13:20 Page38
Christian Dior Couture
On July 3, 2017, as part of the project aimed at simplifying thestructures of the Christian Dior – LVMH group and in accordancewith the terms of the memorandum of understanding concludedwith Christian Dior on April 24, 2017, LVMH acquired 100% ofChristian Dior Couture from Christian Dior for 6.0 billion euros.As of that date, Christian Dior directly and indirectly held 41.0%of the share capital and 56.8% of the voting rights of LVMH.
The scope acquired includes Grandville (wholly owned byChristian Dior) and its subsidiary, Christian Dior Couture. Theprice paid was determined on the basis of an enterprise value
of 6.5 billion euros, representing 15.6 times the adjusted EBITDAfor the 12- month period ended March 2017.
The acquisition of Christian Dior Couture allowed one of theworld’s most iconic brands to join LVMH, alongside ParfumsChristian Dior, which was already part of the LVMH group. Onthe strength of its history and its favorable prospects, ChristianDior Couture is a source of growth for LVMH. Christian DiorCouture’s expansion in the coming years will be supported inparticular by its creative momentum and by the significantinvestments already made, especially in the Americas, China andJapan.
2. CHANGES IN OWNERSHIP INTERESTS IN CONSOLIDATED ENTITIES
2.1 Fiscal year 2018
In the second half of 2018, LVMH acquired the 20% stake in the share capital of Fresh that it did not own; the price paid generated therecognition of a final goodwill, previously recorded under Goodwill arising on purchase commitments for minority interests’ shares.
2.2 Fiscal year 2017
Earnings per share are calculated based on the weighted averagenumber of shares outstanding during the fiscal year, excludingtreasury shares.
Diluted earnings per share are calculated based on the weightedaverage number of shares before dilution and adding the weightedaverage number of shares that would result from the exercise of
existing subscription options during the period or any other dilutinginstrument. It is assumed for the purposes of this calculation thatthe funds received from the exercise of options, plus the amountnot yet expensed for stock option and similar plans (see Note 1.27),would be employed to repurchase LVMH shares at a pricecorresponding to their average trading price over the fiscal year.
1.28 Earnings per share
Share purchase and subscription option plans give rise to therecognition of an expense based on the amortization of theexpected gain for the recipients calculated according to the Black& Scholes method on the basis of the closing share price on theday before the board meeting at which the plan is instituted.
For bonus share plans, the expected gain is calculated on thebasis of the closing share price on the day before the board meetingat which the plan is instituted, less the amount of dividendsexpected to accrue during the vesting period. A discount may beapplied to the value of the bonus shares thus calculated toaccount for a period of non- transferability, where applicable.
For all plans, the amortization expense is apportioned on astraight- line basis in the income statement over the vesting period,with a corresponding impact on reserves in the balance sheet.
For cash- settled compensation plans index- linked to the changein the LVMH share price, the gain over the vesting period isestimated at each balance sheet date based on the LVMH shareprice at that date, and is charged to the income statement on apro rata basis over the vesting period, with a correspondingbalance sheet impact on provisions. Between that date and thesettlement date, the change in the expected gain resulting fromthe change in the LVMH share price is recorded in the incomestatement.
Selected notes to the consolidated financial statements
Financial Documents - December 31, 2018 39
CONDENSED CONSOLIDATED FINANCIAL STATEMENTS
1.27 Stock option and similar plans
2_VA_V3 28/01/2019 13:20 Page39
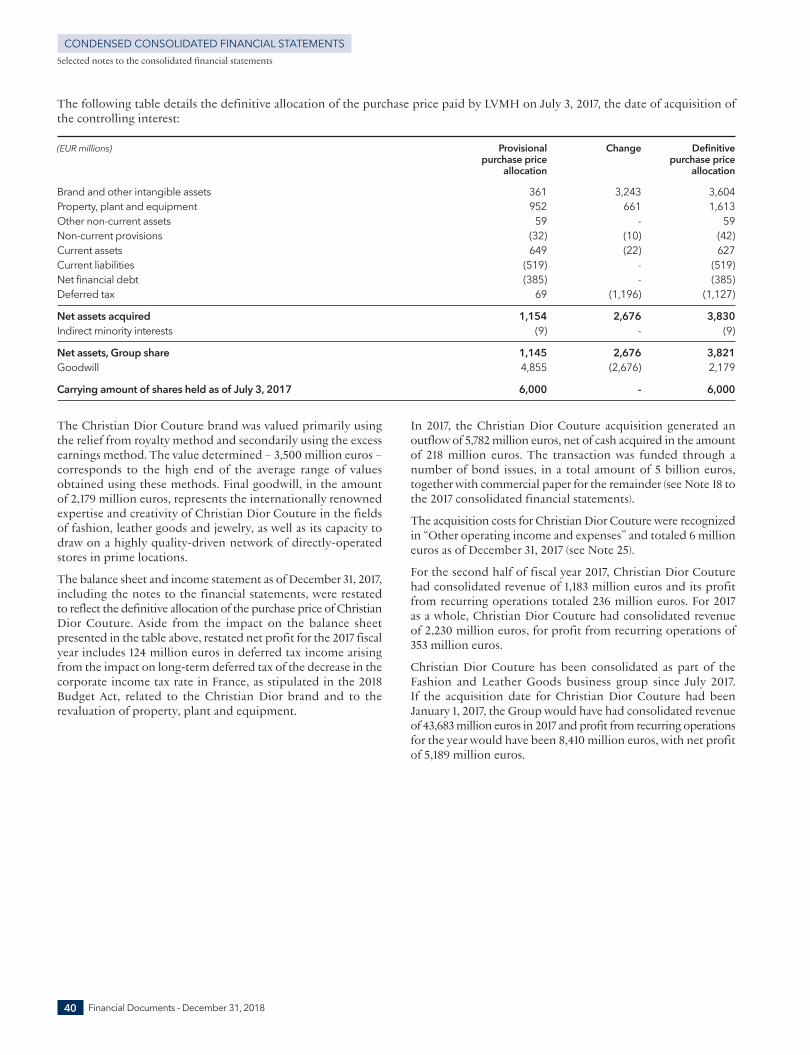
The Christian Dior Couture brand was valued primarily usingthe relief from royalty method and secondarily using the excessearnings method. The value determined – 3,500 million euros –corresponds to the high end of the average range of valuesobtained using these methods. Final goodwill, in the amountof 2,179 million euros, represents the internationally renownedexpertise and creativity of Christian Dior Couture in the fieldsof fashion, leather goods and jewelry, as well as its capacity todraw on a highly quality- driven network of directly- operatedstores in prime locations.
The balance sheet and income statement as of December 31, 2017,including the notes to the financial statements, were restatedto reflect the definitive allocation of the purchase price of ChristianDior Couture. Aside from the impact on the balance sheetpresented in the table above, restated net profit for the 2017 fiscalyear includes 124 million euros in deferred tax income arisingfrom the impact on long- term deferred tax of the decrease in thecorporate income tax rate in France, as stipulated in the 2018Budget Act, related to the Christian Dior brand and to therevaluation of property, plant and equipment.
In 2017, the Christian Dior Couture acquisition generated anoutflow of 5,782 million euros, net of cash acquired in the amountof 218 million euros. The transaction was funded through anumber of bond issues, in a total amount of 5 billion euros,together with commercial paper for the remainder (see Note 18 tothe 2017 consolidated financial statements).
The acquisition costs for Christian Dior Couture were recognizedin “Other operating income and expenses” and totaled 6 millioneuros as of December 31, 2017 (see Note 25).
For the second half of fiscal year 2017, Christian Dior Couturehad consolidated revenue of 1,183 million euros and its profitfrom recurring operations totaled 236 million euros. For 2017as a whole, Christian Dior Couture had consolidated revenueof 2,230 million euros, for profit from recurring operations of353 million euros.
Christian Dior Couture has been consolidated as part of theFashion and Leather Goods business group since July 2017. If the acquisition date for Christian Dior Couture had beenJanuary 1, 2017, the Group would have had consolidated revenueof 43,683 million euros in 2017 and profit from recurring operationsfor the year would have been 8,410 million euros, with net profitof 5,189 million euros.
Selected notes to the consolidated financial statements
Financial Documents - December 31, 201840
CONDENSED CONSOLIDATED FINANCIAL STATEMENTS
The following table details the definitive allocation of the purchase price paid by LVMH on July 3, 2017, the date of acquisition ofthe controlling interest:
(EUR millions) Provisional Change Definitive purchase price purchase price allocation allocation
Brand and other intangible assets 361 3,243 3,604Property, plant and equipment 952 661 1,613Other non- current assets 59 - 59Non- current provisions (32) (10) (42)Current assets 649 (22) 627Current liabilities (519) - (519)Net financial debt (385) - (385)Deferred tax 69 (1,196) (1,127)
Net assets acquired 1,154 2,676 3,830Indirect minority interests (9) - (9)
Net assets, Group share 1,145 2,676 3,821Goodwill 4,855 (2,676) 2,179
Carrying amount of shares held as of July 3, 2017 6,000 - 6,000
2_VA_V3 28/01/2019 13:20 Page40
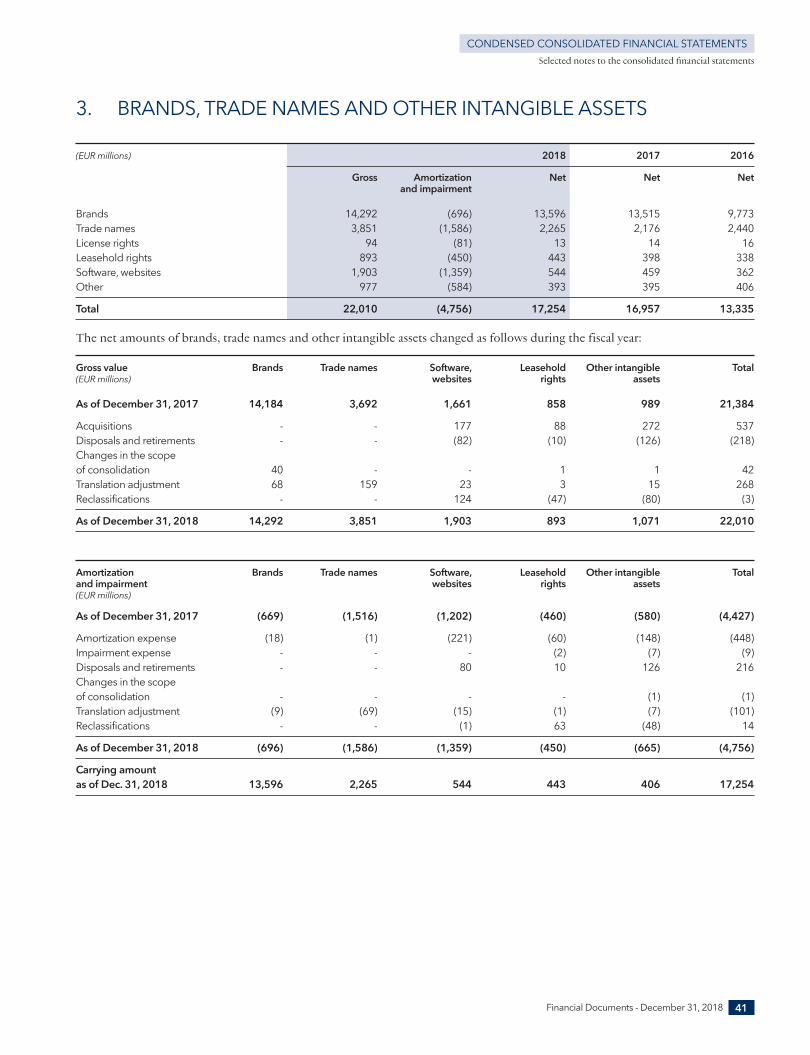
Selected notes to the consolidated financial statements
Financial Documents - December 31, 2018 41
CONDENSED CONSOLIDATED FINANCIAL STATEMENTS
3. BRANDS, TRADE NAMES AND OTHER INTANGIBLE ASSETS
(EUR millions) 2018 2017 2016
Gross Amortization Net Net Net and impairment
Brands 14,292 (696) 13,596 13,515 9,773Trade names 3,851 (1,586) 2,265 2,176 2,440License rights 94 (81) 13 14 16Leasehold rights 893 (450) 443 398 338Software, websites 1,903 (1,359) 544 459 362Other 977 (584) 393 395 406
Total 22,010 (4,756) 17,254 16,957 13,335
The net amounts of brands, trade names and other intangible assets changed as follows during the fiscal year:
Gross value Brands Trade names Software, Leasehold Other intangible Total(EUR millions) websites rights assets
As of December 31, 2017 14,184 3,692 1,661 858 989 21,384
Acquisitions - - 177 88 272 537Disposals and retirements - - (82) (10) (126) (218)Changes in the scope of consolidation 40 - - 1 1 42Translation adjustment 68 159 23 3 15 268Reclassifications - - 124 (47) (80) (3)
As of December 31, 2018 14,292 3,851 1,903 893 1,071 22,010
Amortization Brands Trade names Software, Leasehold Other intangible Totaland impairment websites rights assets (EUR millions)
As of December 31, 2017 (669) (1,516) (1,202) (460) (580) (4,427)
Amortization expense (18) (1) (221) (60) (148) (448)Impairment expense - - - (2) (7) (9)Disposals and retirements - - 80 10 126 216Changes in the scope of consolidation - - - - (1) (1)Translation adjustment (9) (69) (15) (1) (7) (101)Reclassifications - - (1) 63 (48) 14
As of December 31, 2018 (696) (1,586) (1,359) (450) (665) (4,756)
Carrying amount as of Dec. 31, 2018 13,596 2,265 544 443 406 17,254
2_VA_V3 28/01/2019 13:20 Page41
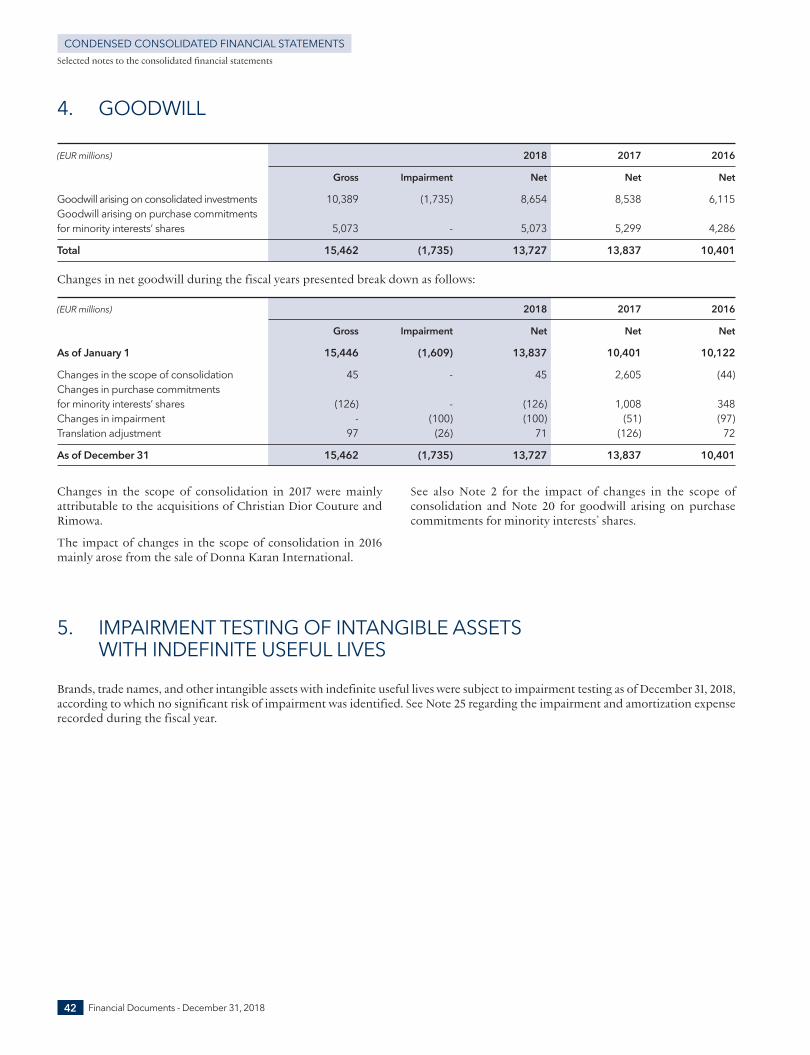
5. IMPAIRMENT TESTING OF INTANGIBLE ASSETS WITH INDEFINITE USEFUL LIVES
Brands, trade names, and other intangible assets with indefinite useful lives were subject to impairment testing as of December 31, 2018,according to which no significant risk of impairment was identified. See Note 25 regarding the impairment and amortization expenserecorded during the fiscal year.
Changes in the scope of consolidation in 2017 were mainlyattributable to the acquisitions of Christian Dior Couture andRimowa.
The impact of changes in the scope of consolidation in 2016mainly arose from the sale of Donna Karan International.
See also Note 2 for the impact of changes in the scope ofconsolidation and Note 20 for goodwill arising on purchasecommitments for minority interests’ shares.
4. GOODWILL
(EUR millions) 2018 2017 2016
Gross Impairment Net Net Net
Goodwill arising on consolidated investments 10,389 (1,735) 8,654 8,538 6,115Goodwill arising on purchase commitments for minority interests’ shares 5,073 - 5,073 5,299 4,286
Total 15,462 (1,735) 13,727 13,837 10,401
Changes in net goodwill during the fiscal years presented break down as follows:
(EUR millions) 2018 2017 2016
Gross Impairment Net Net Net
As of January 1 15,446 (1,609) 13,837 10,401 10,122
Changes in the scope of consolidation 45 - 45 2,605 (44)Changes in purchase commitments for minority interests’ shares (126) - (126) 1,008 348Changes in impairment - (100) (100) (51) (97)Translation adjustment 97 (26) 71 (126) 72
As of December 31 15,462 (1,735) 13,727 13,837 10,401
Selected notes to the consolidated financial statements
Financial Documents - December 31, 201842
CONDENSED CONSOLIDATED FINANCIAL STATEMENTS
2_VA_V3 28/01/2019 13:20 Page42
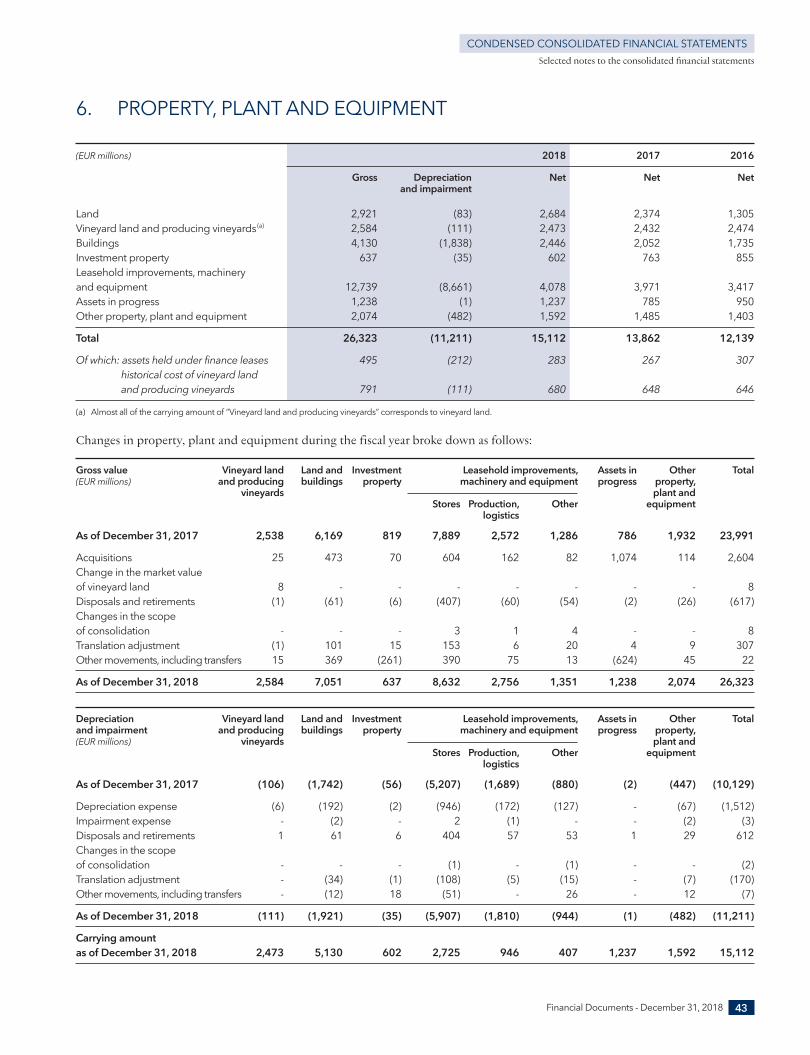
6. PROPERTY, PLANT AND EQUIPMENT
(EUR millions) 2018 2017 2016
Gross Depreciation Net Net Net and impairment
Land 2,921 (83) 2,684 2,374 1,305Vineyard land and producing vineyards(a) 2,584 (111) 2,473 2,432 2,474Buildings 4,130 (1,838) 2,446 2,052 1,735Investment property 637 (35) 602 763 855Leasehold improvements, machinery and equipment 12,739 (8,661) 4,078 3,971 3,417Assets in progress 1,238 (1) 1,237 785 950Other property, plant and equipment 2,074 (482) 1,592 1,485 1,403
Total 26,323 (11,211) 15,112 13,862 12,139
Of which: assets held under finance leases 495 (212) 283 267 307historical cost of vineyard land and producing vineyards 791 (111) 680 648 646
(a) Almost all of the carrying amount of “Vineyard land and producing vineyards” corresponds to vineyard land.
Changes in property, plant and equipment during the fiscal year broke down as follows:
Gross value Vineyard land Land and Investment Leasehold improvements, Assets in Other Total(EUR millions) and producing buildings property machinery and equipment progress property, vineyards plant and Stores Production, Other equipment logistics
As of December 31, 2017 2,538 6,169 819 7,889 2,572 1,286 786 1,932 23,991
Acquisitions 25 473 70 604 162 82 1,074 114 2,604Change in the market value of vineyard land 8 - - - - - - - 8Disposals and retirements (1) (61) (6) (407) (60) (54) (2) (26) (617)Changes in the scope of consolidation - - - 3 1 4 - - 8Translation adjustment (1) 101 15 153 6 20 4 9 307Other movements, including transfers 15 369 (261) 390 75 13 (624) 45 22
As of December 31, 2018 2,584 7,051 637 8,632 2,756 1,351 1,238 2,074 26,323
Depreciation Vineyard land Land and Investment Leasehold improvements, Assets in Other Totaland impairment and producing buildings property machinery and equipment progress property, (EUR millions) vineyards plant and Stores Production, Other equipment logistics
As of December 31, 2017 (106) (1,742) (56) (5,207) (1,689) (880) (2) (447) (10,129)
Depreciation expense (6) (192) (2) (946) (172) (127) - (67) (1,512)Impairment expense - (2) - 2 (1) - - (2) (3)Disposals and retirements 1 61 6 404 57 53 1 29 612Changes in the scope of consolidation - - - (1) - (1) - - (2)Translation adjustment - (34) (1) (108) (5) (15) - (7) (170)Other movements, including transfers - (12) 18 (51) - 26 - 12 (7)
As of December 31, 2018 (111) (1,921) (35) (5,907) (1,810) (944) (1) (482) (11,211)
Carrying amount as of December 31, 2018 2,473 5,130 602 2,725 946 407 1,237 1,592 15,112
Selected notes to the consolidated financial statements
Financial Documents - December 31, 2018 43
CONDENSED CONSOLIDATED FINANCIAL STATEMENTS
2_VA_V3 28/01/2019 13:20 Page43
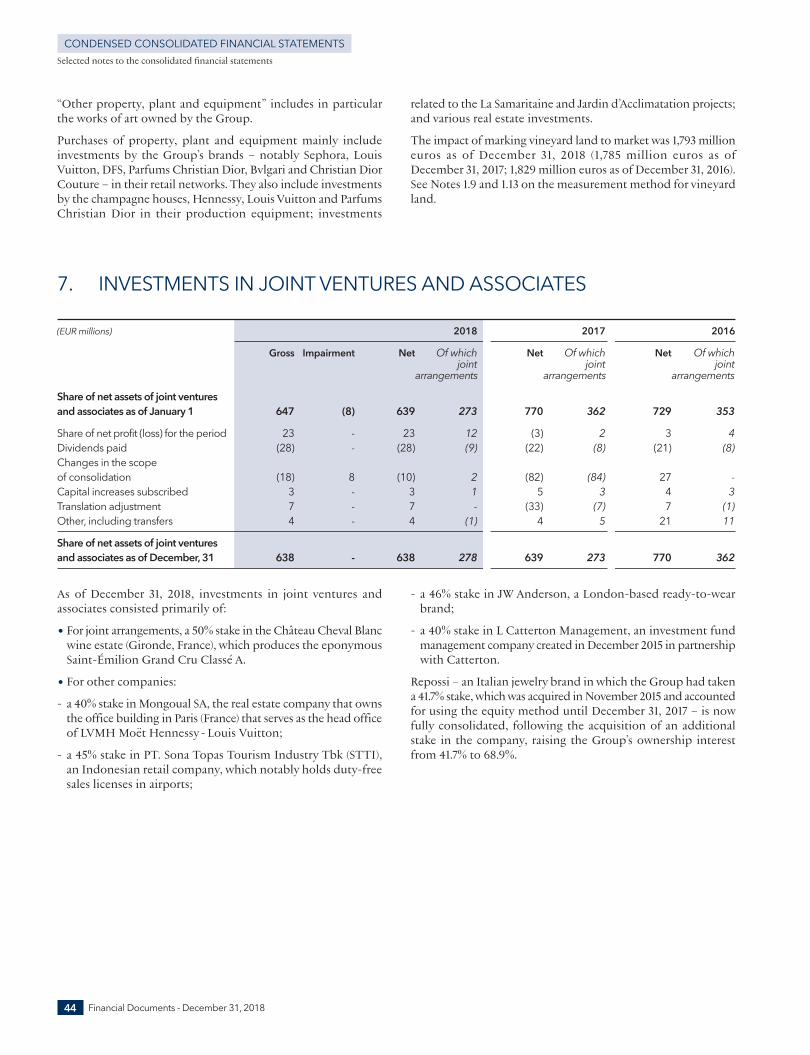
As of December 31, 2018, investments in joint ventures andassociates consisted primarily of:
• For joint arrangements, a 50% stake in the Château Cheval Blancwine estate (Gironde, France), which produces the eponymousSaint- Émilion Grand Cru Classé A.
• For other companies:
- a 40% stake in Mongoual SA, the real estate company that ownsthe office building in Paris (France) that serves as the head officeof LVMH Moët Hennessy - Louis Vuitton;
- a 45% stake in PT. Sona Topas Tourism Industry Tbk (STTI),an Indonesian retail company, which notably holds duty- freesales licenses in airports;
- a 46% stake in JW Anderson, a London- based ready- to- wearbrand;
- a 40% stake in L Catterton Management, an investment fundmanagement company created in December 2015 in partnershipwith Catterton.
Repossi – an Italian jewelry brand in which the Group had takena 41.7% stake, which was acquired in November 2015 and accountedfor using the equity method until December 31, 2017 – is nowfully consolidated, following the acquisition of an additionalstake in the company, raising the Group’s ownership interestfrom 41.7% to 68.9%.
7. INVESTMENTS IN JOINT VENTURES AND ASSOCIATES
(EUR millions) 2018 2017 2016
Gross Impairment Net Of which Net Of which Net Of which joint joint joint arrangements arrangements arrangementsShare of net assets of joint ventures and associates as of January 1 647 (8) 639 273 770 362 729 353Share of net profit (loss) for the period 23 - 23 12 (3) 2 3 4Dividends paid (28) - (28) (9) (22) (8) (21) (8)Changes in the scope of consolidation (18) 8 (10) 2 (82) (84) 27 - Capital increases subscribed 3 - 3 1 5 3 4 3Translation adjustment 7 - 7 - (33) (7) 7 (1)Other, including transfers 4 - 4 (1) 4 5 21 11
Share of net assets of joint ventures and associates as of December, 31 638 - 638 278 639 273 770 362
Selected notes to the consolidated financial statements
Financial Documents - December 31, 201844
CONDENSED CONSOLIDATED FINANCIAL STATEMENTS
“Other property, plant and equipment” includes in particularthe works of art owned by the Group.
Purchases of property, plant and equipment mainly includeinvestments by the Group’s brands – notably Sephora, LouisVuitton, DFS, Parfums Christian Dior, Bvlgari and Christian DiorCouture – in their retail networks. They also include investmentsby the champagne houses, Hennessy, Louis Vuitton and ParfumsChristian Dior in their production equipment; investments
related to the La Samaritaine and Jardin d’Acclimatation projects;and various real estate investments.
The impact of marking vineyard land to market was 1,793 millioneuros as of December 31, 2018 (1,785 million euros as ofDecember 31, 2017; 1,829 million euros as of December 31, 2016).See Notes 1.9 and 1.13 on the measurement method for vineyardland.
2_VA_V3 28/01/2019 13:20 Page44
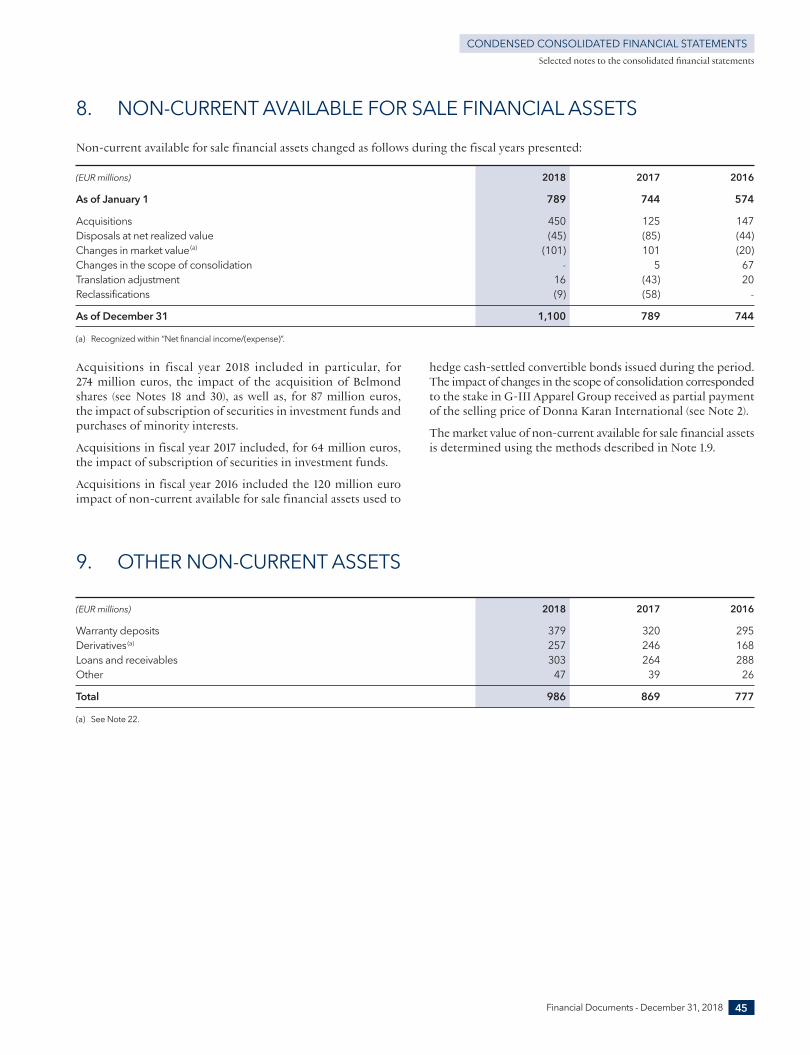
9. OTHER NON- CURRENT ASSETS
(EUR millions) 2018 2017 2016
Warranty deposits 379 320 295Derivatives(a) 257 246 168Loans and receivables 303 264 288Other 47 39 26
Total 986 869 777
(a) See Note 22.
Acquisitions in fiscal year 2018 included in particular, for274 million euros, the impact of the acquisition of Belmondshares (see Notes 18 and 30), as well as, for 87 million euros, the impact of subscription of securities in investment funds andpurchases of minority interests.
Acquisitions in fiscal year 2017 included, for 64 million euros,the impact of subscription of securities in investment funds.
Acquisitions in fiscal year 2016 included the 120 million euroimpact of non- current available for sale financial assets used to
hedge cash- settled convertible bonds issued during the period.The impact of changes in the scope of consolidation correspondedto the stake in G- III Apparel Group received as partial paymentof the selling price of Donna Karan International (see Note 2).
The market value of non- current available for sale financial assetsis determined using the methods described in Note 1.9.
8. NON- CURRENT AVAILABLE FOR SALE FINANCIAL ASSETS
Non- current available for sale financial assets changed as follows during the fiscal years presented:
(EUR millions) 2018 2017 2016
As of January 1 789 744 574
Acquisitions 450 125 147Disposals at net realized value (45) (85) (44)Changes in market value(a) (101) 101 (20)Changes in the scope of consolidation - 5 67Translation adjustment 16 (43) 20Reclassifications (9) (58) -
As of December 31 1,100 789 744
(a) Recognized within “Net financial income/(expense)”.
Selected notes to the consolidated financial statements
Financial Documents - December 31, 2018 45
CONDENSED CONSOLIDATED FINANCIAL STATEMENTS
2_VA_V3 28/01/2019 13:20 Page45
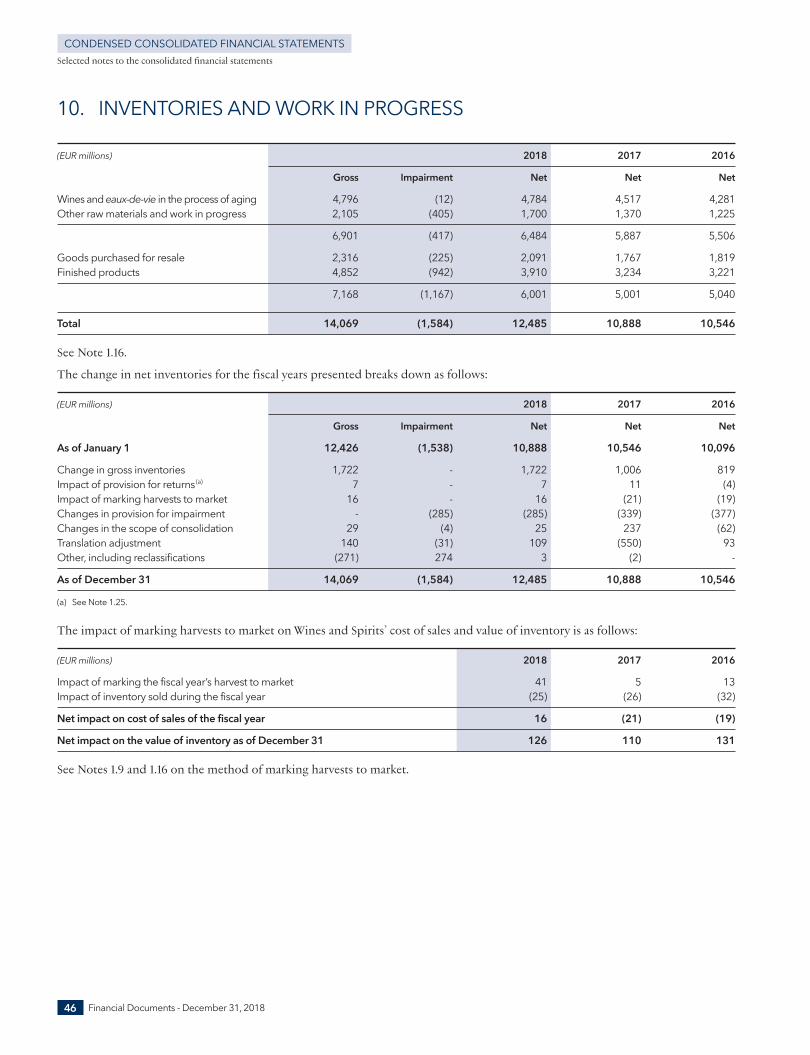
Selected notes to the consolidated financial statements
Financial Documents - December 31, 201846
CONDENSED CONSOLIDATED FINANCIAL STATEMENTS
10. INVENTORIES AND WORK IN PROGRESS
(EUR millions) 2018 2017 2016
Gross Impairment Net Net Net
Wines and eaux- de- vie in the process of aging 4,796 (12) 4,784 4,517 4,281Other raw materials and work in progress 2,105 (405) 1,700 1,370 1,225
6,901 (417) 6,484 5,887 5,506
Goods purchased for resale 2,316 (225) 2,091 1,767 1,819Finished products 4,852 (942) 3,910 3,234 3,221
7,168 (1,167) 6,001 5,001 5,040
Total 14,069 (1,584) 12,485 10,888 10,546
See Note 1.16.
The change in net inventories for the fiscal years presented breaks down as follows:
(EUR millions) 2018 2017 2016
Gross Impairment Net Net Net
As of January 1 12,426 (1,538) 10,888 10,546 10,096
Change in gross inventories 1,722 - 1,722 1,006 819Impact of provision for returns(a) 7 - 7 11 (4)Impact of marking harvests to market 16 - 16 (21) (19)Changes in provision for impairment - (285) (285) (339) (377)Changes in the scope of consolidation 29 (4) 25 237 (62)Translation adjustment 140 (31) 109 (550) 93Other, including reclassifications (271) 274 3 (2) -
As of December 31 14,069 (1,584) 12,485 10,888 10,546
(a) See Note 1.25.
The impact of marking harvests to market on Wines and Spirits’ cost of sales and value of inventory is as follows:
(EUR millions) 2018 2017 2016
Impact of marking the fiscal year’s harvest to market 41 5 13Impact of inventory sold during the fiscal year (25) (26) (32)
Net impact on cost of sales of the fiscal year 16 (21) (19)
Net impact on the value of inventory as of December 31 126 110 131
See Notes 1.9 and 1.16 on the method of marking harvests to market.
2_VA_V3 28/01/2019 13:20 Page46
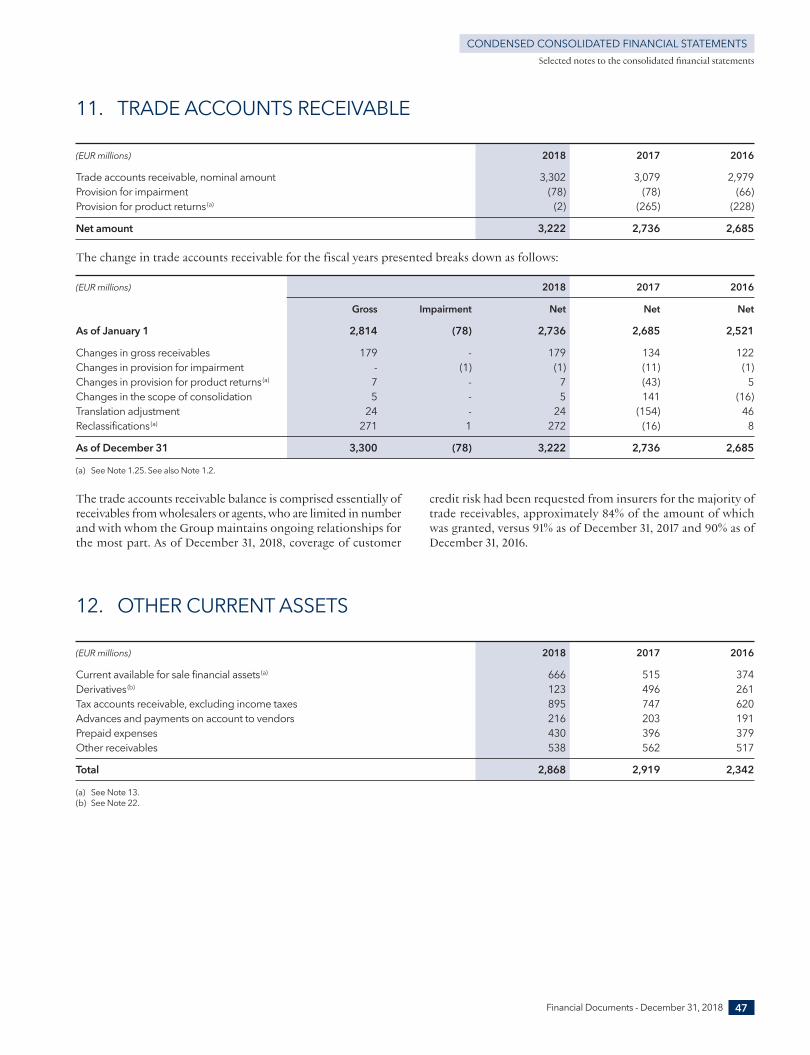
12. OTHER CURRENT ASSETS
(EUR millions) 2018 2017 2016
Current available for sale financial assets(a) 666 515 374Derivatives(b) 123 496 261Tax accounts receivable, excluding income taxes 895 747 620Advances and payments on account to vendors 216 203 191Prepaid expenses 430 396 379Other receivables 538 562 517
Total 2,868 2,919 2,342
(a) See Note 13.(b) See Note 22.
The trade accounts receivable balance is comprised essentially ofreceivables from wholesalers or agents, who are limited in numberand with whom the Group maintains ongoing relationships forthe most part. As of December 31, 2018, coverage of customer
credit risk had been requested from insurers for the majority oftrade receivables, approximately 84% of the amount of whichwas granted, versus 91% as of December 31, 2017 and 90% as ofDecember 31, 2016.
Selected notes to the consolidated financial statements
Financial Documents - December 31, 2018 47
CONDENSED CONSOLIDATED FINANCIAL STATEMENTS
11. TRADE ACCOUNTS RECEIVABLE
(EUR millions) 2018 2017 2016
Trade accounts receivable, nominal amount 3,302 3,079 2,979Provision for impairment (78) (78) (66)Provision for product returns(a) (2) (265) (228)
Net amount 3,222 2,736 2,685
The change in trade accounts receivable for the fiscal years presented breaks down as follows:
(EUR millions) 2018 2017 2016
Gross Impairment Net Net Net
As of January 1 2,814 (78) 2,736 2,685 2,521
Changes in gross receivables 179 - 179 134 122Changes in provision for impairment - (1) (1) (11) (1)Changes in provision for product returns(a) 7 - 7 (43) 5Changes in the scope of consolidation 5 - 5 141 (16)Translation adjustment 24 - 24 (154) 46Reclassifications(a) 271 1 272 (16) 8
As of December 31 3,300 (78) 3,222 2,736 2,685
(a) See Note 1.25. See also Note 1.2.
2_VA_V3 28/01/2019 13:20 Page47
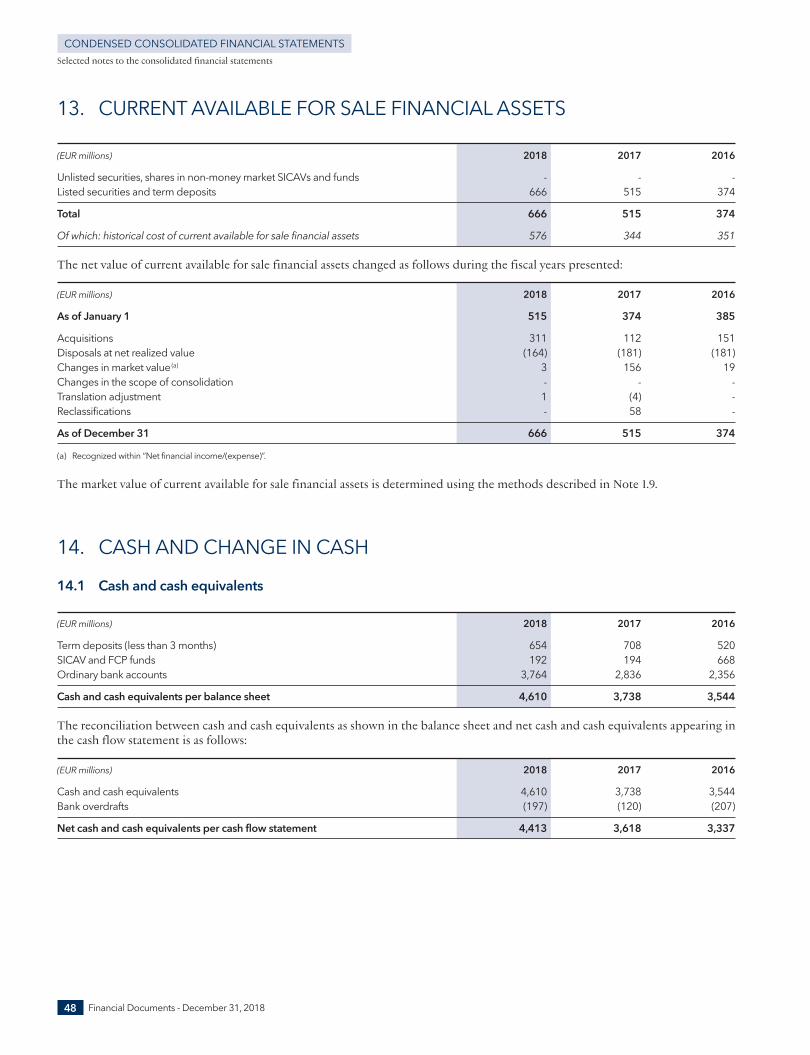
Selected notes to the consolidated financial statements
Financial Documents - December 31, 2018
13. CURRENT AVAILABLE FOR SALE FINANCIAL ASSETS
(EUR millions) 2018 2017 2016
Unlisted securities, shares in non- money market SICAVs and funds - - - Listed securities and term deposits 666 515 374
Total 666 515 374
Of which: historical cost of current available for sale financial assets 576 344 351
The net value of current available for sale financial assets changed as follows during the fiscal years presented:
(EUR millions) 2018 2017 2016
As of January 1 515 374 385
Acquisitions 311 112 151Disposals at net realized value (164) (181) (181)Changes in market value(a) 3 156 19Changes in the scope of consolidation - - - Translation adjustment 1 (4) - Reclassifications - 58 -
As of December 31 666 515 374
(a) Recognized within “Net financial income/(expense)”.
The market value of current available for sale financial assets is determined using the methods described in Note 1.9.
14. CASH AND CHANGE IN CASH
14.1 Cash and cash equivalents
(EUR millions) 2018 2017 2016
Term deposits (less than 3 months) 654 708 520SICAV and FCP funds 192 194 668Ordinary bank accounts 3,764 2,836 2,356
Cash and cash equivalents per balance sheet 4,610 3,738 3,544
The reconciliation between cash and cash equivalents as shown in the balance sheet and net cash and cash equivalents appearing inthe cash flow statement is as follows:
(EUR millions) 2018 2017 2016
Cash and cash equivalents 4,610 3,738 3,544Bank overdrafts (197) (120) (207)
Net cash and cash equivalents per cash flow statement 4,413 3,618 3,337
48
CONDENSED CONSOLIDATED FINANCIAL STATEMENTS
2_VA_V3 28/01/2019 13:20 Page48
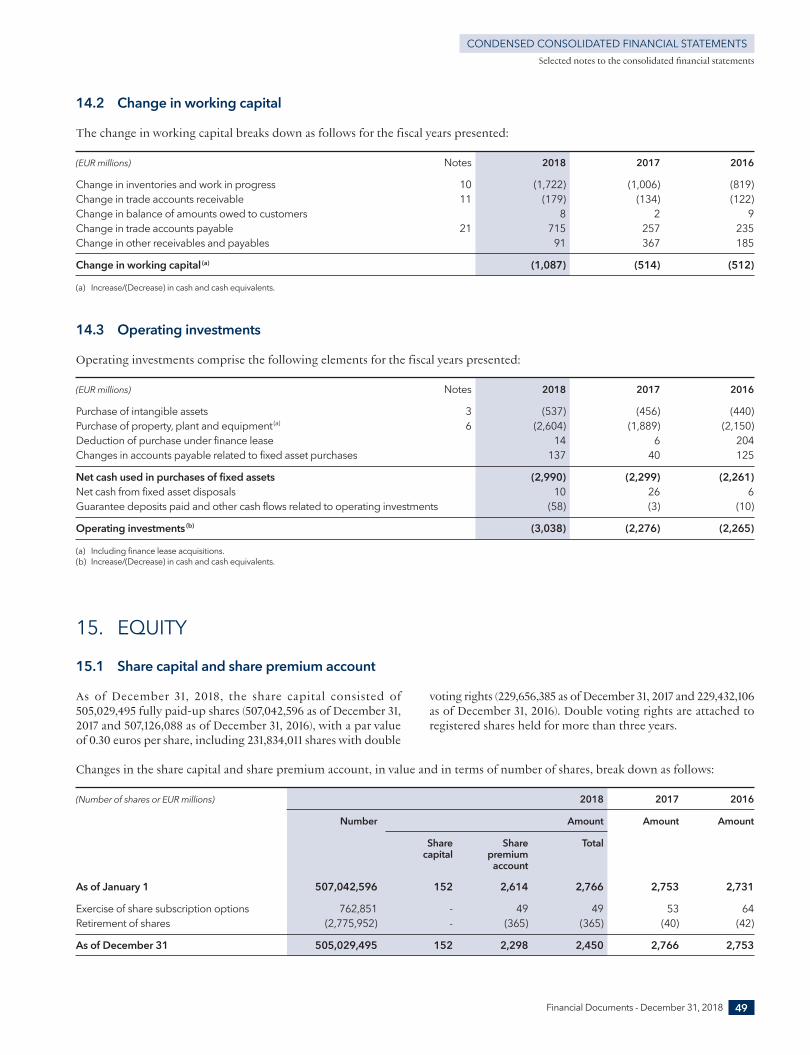
Changes in the share capital and share premium account, in value and in terms of number of shares, break down as follows:
(Number of shares or EUR millions) 2018 2017 2016
Number Amount Amount Amount
Share Share Total capital premium account
As of January 1 507,042,596 152 2,614 2,766 2,753 2,731
Exercise of share subscription options 762,851 - 49 49 53 64Retirement of shares (2,775,952) - (365) (365) (40) (42)
As of December 31 505,029,495 152 2,298 2,450 2,766 2,753
As of December 31, 2018, the share capital consisted of505,029,495 fully paid- up shares (507,042,596 as of December 31,2017 and 507,126,088 as of December 31, 2016), with a par valueof 0.30 euros per share, including 231,834,011 shares with double
voting rights (229,656,385 as of December 31, 2017 and 229,432,106as of December 31, 2016). Double voting rights are attached toregistered shares held for more than three years.
14.2 Change in working capital
The change in working capital breaks down as follows for the fiscal years presented:
(EUR millions) Notes 2018 2017 2016
Change in inventories and work in progress 10 (1,722) (1,006) (819)Change in trade accounts receivable 11 (179) (134) (122)Change in balance of amounts owed to customers 8 2 9Change in trade accounts payable 21 715 257 235Change in other receivables and payables 91 367 185
Change in working capital (a) (1,087) (514) (512)
(a) Increase/(Decrease) in cash and cash equivalents.
14.3 Operating investments
Operating investments comprise the following elements for the fiscal years presented:
(EUR millions) Notes 2018 2017 2016
Purchase of intangible assets 3 (537) (456) (440)Purchase of property, plant and equipment(a) 6 (2,604) (1,889) (2,150)Deduction of purchase under finance lease 14 6 204Changes in accounts payable related to fixed asset purchases 137 40 125
Net cash used in purchases of fixed assets (2,990) (2,299) (2,261)Net cash from fixed asset disposals 10 26 6Guarantee deposits paid and other cash flows related to operating investments (58) (3) (10)
Operating investments(b) (3,038) (2,276) (2,265)
(a) Including finance lease acquisitions.(b) Increase/(Decrease) in cash and cash equivalents.
15. EQUITY
15.1 Share capital and share premium account
Selected notes to the consolidated financial statements
Financial Documents - December 31, 2018 49
CONDENSED CONSOLIDATED FINANCIAL STATEMENTS
2_VA_V3 28/01/2019 13:20 Page49
(EUR millions, except for data per share in EUR) 2018 2017 2016
Interim dividend for the current fiscal year(2018: 2.00 euros; 2017: 1.60 euros; 2016: 1.40 euros) 1,010 811 710Impact of treasury shares (4) (7) (6)
Gross amount disbursed for the fiscal year 1,006 804 704
Final dividend for the previous fiscal year (2017: 3.40 euros; 2016: 2.60 euros) 1,717 1,319 1,115Impact of treasury shares (8) (13) (9)
Gross amount disbursed for the previous fiscal year 1,709 1,306 1,106
Total gross amount disbursed during the period(a) 2,715 2,110 1,810
(a) Excluding the impact of tax regulations applicable to the recipient.
The final dividend for fiscal year 2018, as proposed at the Shareholders’ Meeting of April 18, 2019, is 4.00 euros per share, representinga total of 2,020 million euros before deduction of the amount attributable to treasury shares held at the ex- dividend date.
In accordance with French regulations, dividends are taken fromthe profit for the fiscal year and the distributable reserves ofthe parent company, after deducting applicable withholding taxand the value attributable to treasury shares.
As of December 31, 2018, the distributable amount was15,287 million euros; after taking into account the proposeddividend distribution in respect of the 2018 fiscal year, it was13,267 million euros.
Selected notes to the consolidated financial statements
Financial Documents - December 31, 201850
CONDENSED CONSOLIDATED FINANCIAL STATEMENTS
15.2 LVMH treasury shares
The portfolio of LVMH treasury shares is allocated as follows:
(Number of shares or EUR millions) 2018 2017 2016
Number Amount Amount Amount
Share subscription option plans 413,606 20 57 98Bonus share plans 1,354,798 302 122 90
Shares held for stock option and similar plans(a) 1,768,404 322 179 188
Liquidity contract 97,000 25 23 15Shares pending retirement 270,000 74 328 317
LVMH treasury shares 2,135,404 421 530 520
(a) See Note 16 regarding stock option and similar plans.
The market value of LVMH shares held under the liquidity contract as of December 31, 2018 amounted to 25 million euros.
The portfolio movements of LVMH treasury shares during the fiscal year were as follows:
(Number of shares or EUR millions) Number Amount Impact on cash
As of December 31, 2017 4,281,097 530
Share purchases(a) 2,017,130 544 (544)Vested bonus shares (459,741) (39) - Retirement of shares (2,775,952) (365) - Disposals at net realized value(a) (927,130) (249) 249Gain/(loss) on disposal - -
As of December 31, 2018 2,135,404 421 (295)
(a) Purchases and sales of LVMH shares mainly related to the management of the liquidity contract.
15.3 Dividends paid by the parent company, LVMH SE
2_VA_V3 28/01/2019 13:20 Page50
Selected notes to the consolidated financial statements
15.4 Cumulative translation adjustment
The change in the translation adjustment recognized under the Group share of equity, net of hedging effects of net assets denominatedin foreign currency, breaks down as follows by currency:
(EUR millions) 2018 Change 2017 2016
US dollar 293 154 139 508Swiss franc 632 104 528 762Japanese yen 109 40 69 96Hong Kong dollar 354 38 316 493Pound sterling (115) (8) (107) (85)Other currencies (250) (80) (170) (94)Foreign currency net investment hedges(a) (450) (29) (421) (515)
Total, Group share 573 219 354 1,165
(a) Including - 141 million euros with respect to the US dollar (- 130 million euros as of December 31, 2017 and - 169 million euros as of December 31, 2016), - 117 million euros withrespect to the Hong Kong dollar (- 117 million euros as of December 31, 2017 and - 135 million euros as of December 31, 2016), and - 193 million euros with respect to the Swissfranc (- 180 million euros as of December 31, 2017 and - 214 million euros as of December 31, 2016). These amounts include the tax impact.
16. STOCK OPTION AND SIMILAR PLANS
16.1 Share subscription option plans
The number of unexercised share subscription options and the weighted average exercise price changed as follows during the fiscalyears presented:
2018 2017 2016
Number Weighted average Number Weighted average Number Weighted average exercise price exercise price exercise price (EUR) (EUR) (EUR)
Share subscription options outstanding as of January 1 1,180,692 59.56 1,903,010 65.17 2,821,150 66.79
Options expired (6,753) 63.98 (13,833) 74.67 (10,211) 68.07Options exercised (762,851) 64.21 (708,485) 74.33 (907,929) 70.19
Share subscription options outstanding as of December 31 411,088 50.86 1,180,692 59.56 1,903,010 65.17
16.2 Bonus share plans
The number of non- vested shares awarded changed as follows during the fiscal years presented:
(number of shares) 2018 2017 2016
Non- vested shares as of January 1 1,395,351 1,312,587 1,456,068
Provisional allocations for the period 462,281 455,252 360,519Shares vested during the period (459,741) (335,567) (465,660)Shares expired during the period (45,913) (36,921) (38,340)
Non- vested shares as of December 31 1,351,978 1,395,351 1,312,587
Vested share allocations were settled in existing shares held.
Financial Documents - December 31, 2018 51
CONDENSED CONSOLIDATED FINANCIAL STATEMENTS
2_VA_V3 28/01/2019 13:20 Page51
Minority interests are composed primarily of Diageo’s 34% stakein Moët Hennessy SAS and Moët Hennessy International SAS(“Moët Hennessy”), and the 39% stake held by Robert Miller inDFS. Since the 34% stake held by Diageo in Moët Hennessy is
subject to a purchase commitment, it is reclassified at year- endunder “Other non- current liabilities” and is therefore excludedfrom the total amount of minority interests at the fiscal year- enddate. See Notes 1.12 and 20.
16.3 Expense for the fiscal year
(EUR millions) 2018 2017 2016
Expense for the period for share subscription option and bonus share plans 82 62 41
See Note 1.27 regarding the method used to determine the accounting expense.
The LVMH closing share price the day before the grant date of the plans was 241.20 euros for the plan dated January 25, 2018;278.25 euros for the plan dated April 12, 2018; and 259.65 euros for the plan dated October 25, 2018.
The average unit value of non- vested bonus shares awarded under this plan during the 2018 fiscal year was 246.33 euros.
17. MINORITY INTERESTS
(EUR millions) 2018 2017 2016
As of January 1 1,408 1,510 1,460
Minority interests’ share of net profit 636 475 387Dividends paid to minority interests (345) (261) (272)Impact of changes in control of consolidated entities 41 114 22Of which: Rimowa - 89 -
Other 41 25 22Impact of acquisition and disposal of minority interests’ shares (19) (56) (34)Of which: Loro Piana - (58) -
Other (19) 2 (34)
Total impact of changes in the ownership interests in consolidated entities 22 58 (12)
Capital increases subscribed by minority interests 50 44 41Minority interests’ share in gains and losses recognized in equity 45 (134) 46Minority interests’ share in stock option plan expenses 4 7 2Impact of changes in minority interests with purchase commitments (156) (291) (142)
As of December 31 1,664 1,408 1,510
The change in minority interests’ share in gains and losses recognized in equity breaks down as follows:
(EUR millions) Cumulative Hedges of future Vineyard land Revaluation Total share of translation foreign currency adjustments minority interests adjustment cash flows and of employee cost of hedges benefits
As of December 31, 2015 183 (9) 221 (24) 371Changes during the fiscal year 41 (5) 25 (15) 46
As of December 31, 2016 224 (14) 246 (39) 417Changes during the fiscal year (178) 30 11 3 (134)
As of December 31, 2017 46 16 257 (36) 283Changes during the fiscal year 69 (30) 3 3 45
As of December 31, 2018 115 (14) 260 (33) 328
Selected notes to the consolidated financial statements
Financial Documents - December 31, 201852
CONDENSED CONSOLIDATED FINANCIAL STATEMENTS
2_VA_V3 28/01/2019 13:20 Page52
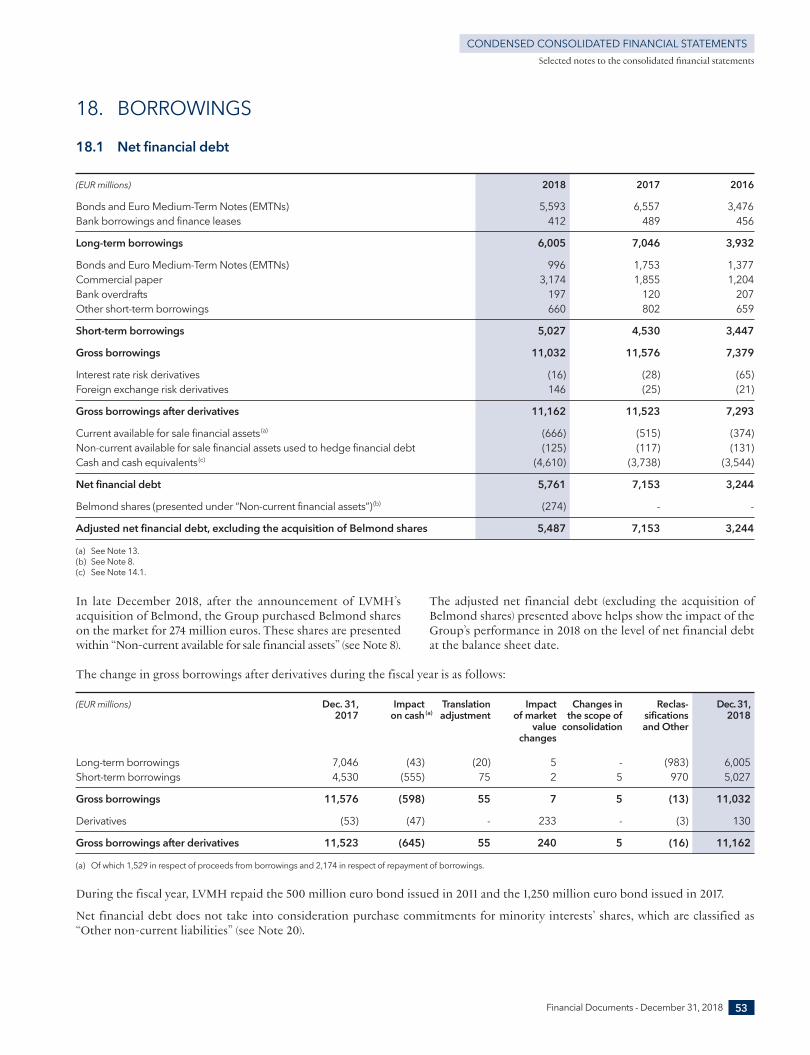
The change in gross borrowings after derivatives during the fiscal year is as follows:
(EUR millions) Dec. 31, Impact Translation Impact Changes in Reclas- Dec. 31, 2017 on cash(a) adjustment of market the scope of sifications 2018 value consolidation and Other changes
Long- term borrowings 7,046 (43) (20) 5 - (983) 6,005Short- term borrowings 4,530 (555) 75 2 5 970 5,027
Gross borrowings 11,576 (598) 55 7 5 (13) 11,032
Derivatives (53) (47) - 233 - (3) 130
Gross borrowings after derivatives 11,523 (645) 55 240 5 (16) 11,162
(a) Of which 1,529 in respect of proceeds from borrowings and 2,174 in respect of repayment of borrowings.
During the fiscal year, LVMH repaid the 500 million euro bond issued in 2011 and the 1,250 million euro bond issued in 2017.
Net financial debt does not take into consideration purchase commitments for minority interests’ shares, which are classified as“Other non- current liabilities” (see Note 20).
In late December 2018, after the announcement of LVMH’sacquisition of Belmond, the Group purchased Belmond shareson the market for 274 million euros. These shares are presentedwithin “Non- current available for sale financial assets” (see Note 8).
The adjusted net financial debt (excluding the acquisition ofBelmond shares) presented above helps show the impact of theGroup’s performance in 2018 on the level of net financial debtat the balance sheet date.
Selected notes to the consolidated financial statements
18. BORROWINGS
18.1 Net financial debt
(EUR millions) 2018 2017 2016
Bonds and Euro Medium- Term Notes (EMTNs) 5,593 6,557 3,476Bank borrowings and finance leases 412 489 456
Long- term borrowings 6,005 7,046 3,932
Bonds and Euro Medium- Term Notes (EMTNs) 996 1,753 1,377Commercial paper 3,174 1,855 1,204Bank overdrafts 197 120 207Other short- term borrowings 660 802 659
Short- term borrowings 5,027 4,530 3,447
Gross borrowings 11,032 11,576 7,379
Interest rate risk derivatives (16) (28) (65)Foreign exchange risk derivatives 146 (25) (21)
Gross borrowings after derivatives 11,162 11,523 7,293
Current available for sale financial assets(a) (666) (515) (374)Non- current available for sale financial assets used to hedge financial debt (125) (117) (131)Cash and cash equivalents(c) (4,610) (3,738) (3,544)
Net financial debt 5,761 7,153 3,244
Belmond shares (presented under “Non- current financial assets”)(b) (274) - -
Adjusted net financial debt, excluding the acquisition of Belmond shares 5,487 7,153 3,244
(a) See Note 13.(b) See Note 8.(c) See Note 14.1.
Financial Documents - December 31, 2018 53
CONDENSED CONSOLIDATED FINANCIAL STATEMENTS
2_VA_V3 28/01/2019 13:20 Page53
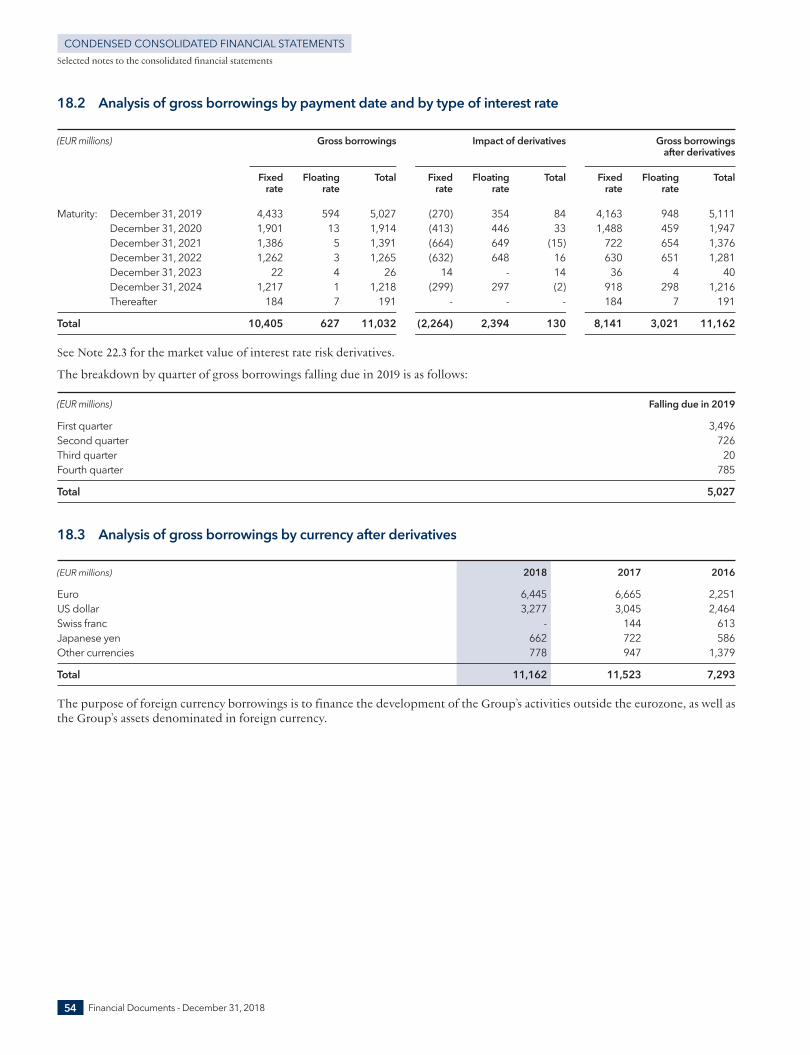
18.2 Analysis of gross borrowings by payment date and by type of interest rate
(EUR millions) Gross borrowings Impact of derivatives Gross borrowings after derivatives
Fixed Floating Total Fixed Floating Total Fixed Floating Total rate rate rate rate rate rate
Maturity: December 31, 2019 4,433 594 5,027 (270) 354 84 4,163 948 5,111December 31, 2020 1,901 13 1,914 (413) 446 33 1,488 459 1,947December 31, 2021 1,386 5 1,391 (664) 649 (15) 722 654 1,376December 31, 2022 1,262 3 1,265 (632) 648 16 630 651 1,281December 31, 2023 22 4 26 14 - 14 36 4 40December 31, 2024 1,217 1 1,218 (299) 297 (2) 918 298 1,216
Thereafter 184 7 191 - - - 184 7 191
Total 10,405 627 11,032 (2,264) 2,394 130 8,141 3,021 11,162
See Note 22.3 for the market value of interest rate risk derivatives.
The breakdown by quarter of gross borrowings falling due in 2019 is as follows:
(EUR millions) Falling due in 2019
First quarter 3,496Second quarter 726Third quarter 20Fourth quarter 785
Total 5,027
18.3 Analysis of gross borrowings by currency after derivatives
(EUR millions) 2018 2017 2016
Euro 6,445 6,665 2,251US dollar 3,277 3,045 2,464Swiss franc - 144 613Japanese yen 662 722 586Other currencies 778 947 1,379
Total 11,162 11,523 7,293
The purpose of foreign currency borrowings is to finance the development of the Group’s activities outside the eurozone, as well asthe Group’s assets denominated in foreign currency.
Selected notes to the consolidated financial statements
Financial Documents - December 31, 201854
CONDENSED CONSOLIDATED FINANCIAL STATEMENTS
2_VA_V3 28/01/2019 13:20 Page54
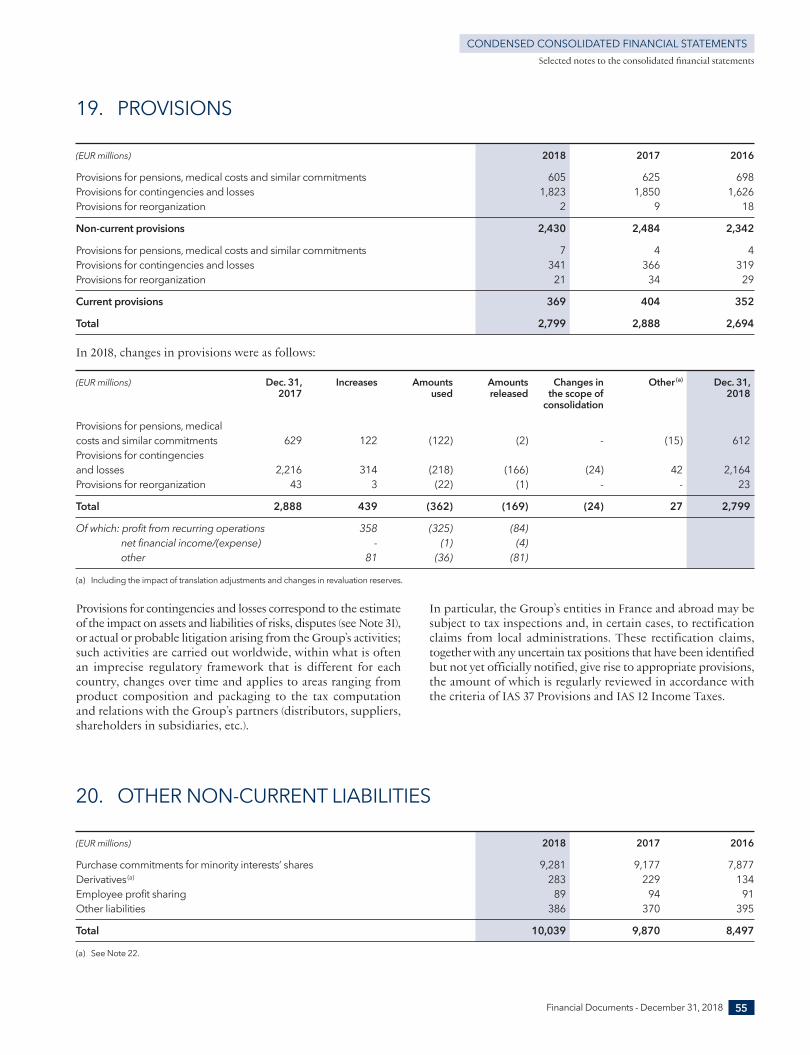
20. OTHER NON- CURRENT LIABILITIES
(EUR millions) 2018 2017 2016
Purchase commitments for minority interests’ shares 9,281 9,177 7,877Derivatives(a) 283 229 134Employee profit sharing 89 94 91Other liabilities 386 370 395
Total 10,039 9,870 8,497
(a) See Note 22.
Provisions for contingencies and losses correspond to the estimateof the impact on assets and liabilities of risks, disputes (see Note 31),or actual or probable litigation arising from the Group’s activities;such activities are carried out worldwide, within what is oftenan imprecise regulatory framework that is different for eachcountry, changes over time and applies to areas ranging fromproduct composition and packaging to the tax computationand relations with the Group’s partners (distributors, suppliers,shareholders in subsidiaries, etc.).
In particular, the Group’s entities in France and abroad may besubject to tax inspections and, in certain cases, to rectificationclaims from local administrations. These rectification claims,together with any uncertain tax positions that have been identifiedbut not yet officially notified, give rise to appropriate provisions,the amount of which is regularly reviewed in accordance withthe criteria of IAS 37 Provisions and IAS 12 Income Taxes.
Selected notes to the consolidated financial statements
19. PROVISIONS
(EUR millions) 2018 2017 2016
Provisions for pensions, medical costs and similar commitments 605 625 698Provisions for contingencies and losses 1,823 1,850 1,626Provisions for reorganization 2 9 18
Non- current provisions 2,430 2,484 2,342
Provisions for pensions, medical costs and similar commitments 7 4 4Provisions for contingencies and losses 341 366 319Provisions for reorganization 21 34 29
Current provisions 369 404 352
Total 2,799 2,888 2,694
In 2018, changes in provisions were as follows:
(EUR millions) Dec. 31, Increases Amounts Amounts Changes in Other(a) Dec. 31, 2017 used released the scope of 2018 consolidation
Provisions for pensions, medical costs and similar commitments 629 122 (122) (2) - (15) 612Provisions for contingencies and losses 2,216 314 (218) (166) (24) 42 2,164Provisions for reorganization 43 3 (22) (1) - - 23
Total 2,888 439 (362) (169) (24) 27 2,799
Of which: profit from recurring operations 358 (325) (84) net financial income/(expense) - (1) (4) other 81 (36) (81)
(a) Including the impact of translation adjustments and changes in revaluation reserves.
Financial Documents - December 31, 2018 55
CONDENSED CONSOLIDATED FINANCIAL STATEMENTS
2_VA_V3 28/01/2019 13:21 Page55
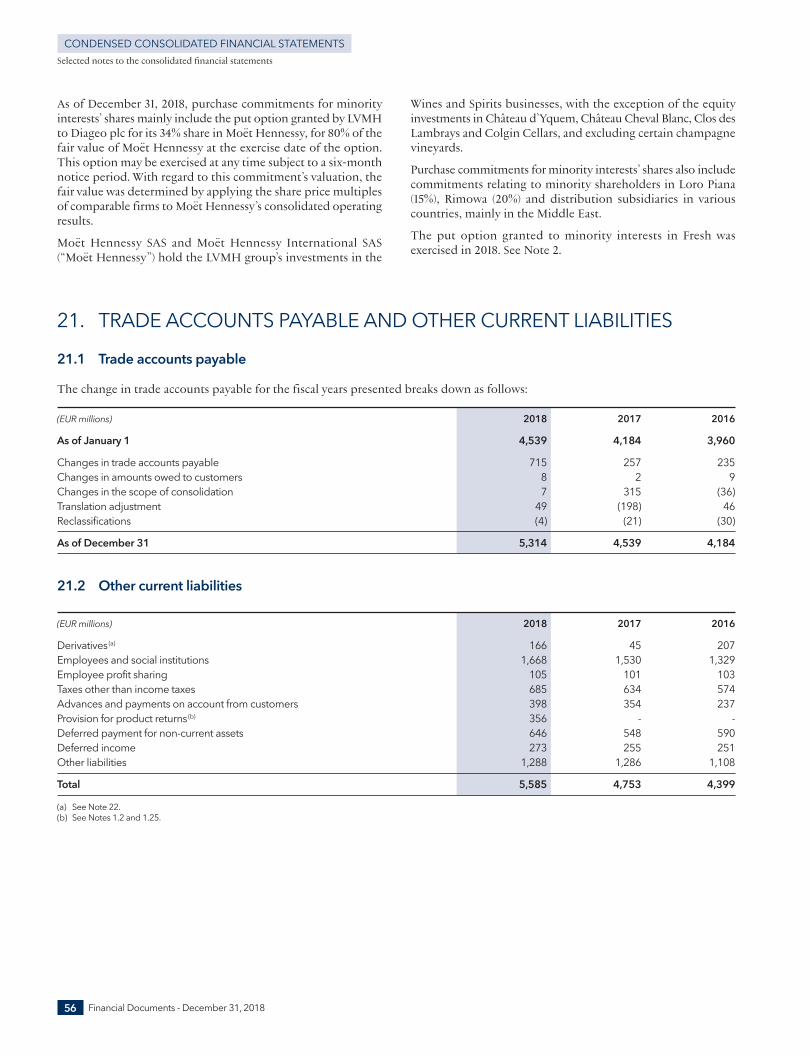
21. TRADE ACCOUNTS PAYABLE AND OTHER CURRENT LIABILITIES
21.1 Trade accounts payable
The change in trade accounts payable for the fiscal years presented breaks down as follows:
(EUR millions) 2018 2017 2016
As of January 1 4,539 4,184 3,960
Changes in trade accounts payable 715 257 235Changes in amounts owed to customers 8 2 9Changes in the scope of consolidation 7 315 (36)Translation adjustment 49 (198) 46Reclassifications (4) (21) (30)
As of December 31 5,314 4,539 4,184
21.2 Other current liabilities
(EUR millions) 2018 2017 2016
Derivatives(a) 166 45 207Employees and social institutions 1,668 1,530 1,329Employee profit sharing 105 101 103Taxes other than income taxes 685 634 574Advances and payments on account from customers 398 354 237Provision for product returns(b) 356 - - Deferred payment for non- current assets 646 548 590Deferred income 273 255 251Other liabilities 1,288 1,286 1,108
Total 5,585 4,753 4,399
(a) See Note 22.(b) See Notes 1.2 and 1.25.
As of December 31, 2018, purchase commitments for minorityinterests’ shares mainly include the put option granted by LVMHto Diageo plc for its 34% share in Moët Hennessy, for 80% of thefair value of Moët Hennessy at the exercise date of the option.This option may be exercised at any time subject to a six- monthnotice period. With regard to this commitment’s valuation, thefair value was determined by applying the share price multiplesof comparable firms to Moët Hennessy’s consolidated operatingresults.
Moët Hennessy SAS and Moët Hennessy International SAS(“Moët Hennessy”) hold the LVMH group’s investments in the
Wines and Spirits businesses, with the exception of the equityinvestments in Château d’Yquem, Château Cheval Blanc, Clos desLambrays and Colgin Cellars, and excluding certain champagnevineyards.
Purchase commitments for minority interests’ shares also includecommitments relating to minority shareholders in Loro Piana(15%), Rimowa (20%) and distribution subsidiaries in variouscountries, mainly in the Middle East.
The put option granted to minority interests in Fresh wasexercised in 2018. See Note 2.
Selected notes to the consolidated financial statements
Financial Documents - December 31, 201856
CONDENSED CONSOLIDATED FINANCIAL STATEMENTS
2_VA_V3 28/01/2019 13:21 Page56
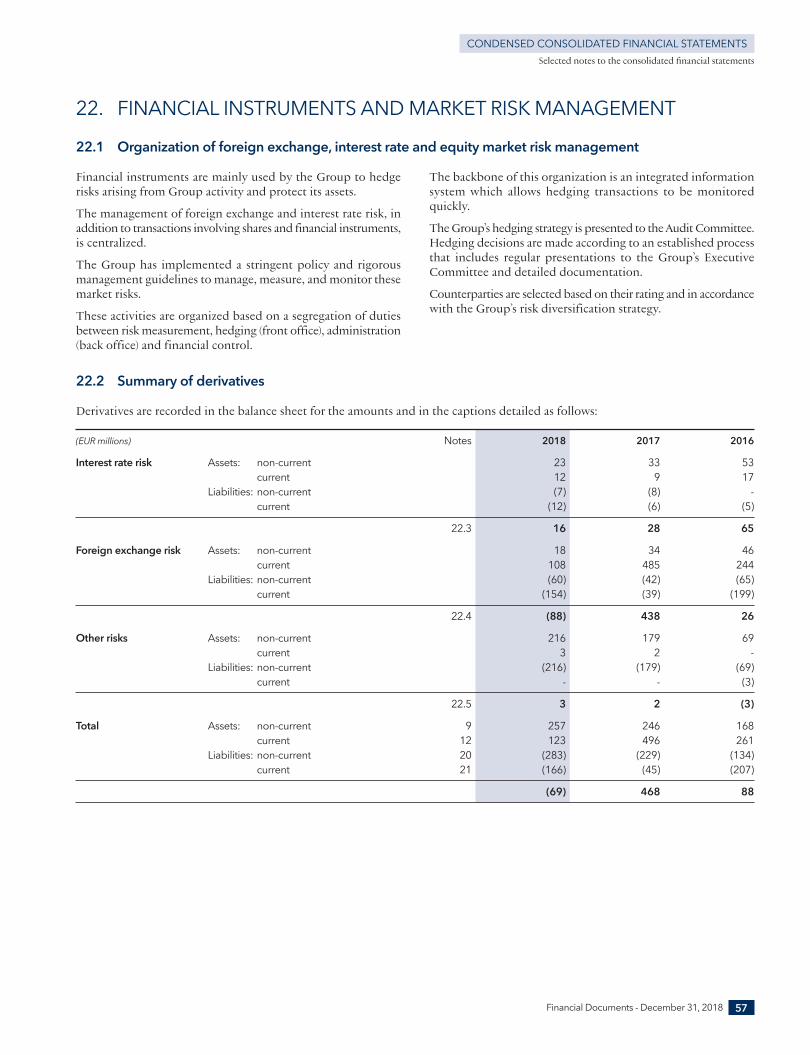
22.2 Summary of derivatives
Derivatives are recorded in the balance sheet for the amounts and in the captions detailed as follows:
(EUR millions) Notes 2018 2017 2016
Interest rate risk Assets: non- current 23 33 53 current 12 9 17 Liabilities: non- current (7) (8) - current (12) (6) (5)
22.3 16 28 65
Foreign exchange risk Assets: non- current 18 34 46 current 108 485 244 Liabilities: non- current (60) (42) (65) current (154) (39) (199)
22.4 (88) 438 26
Other risks Assets: non- current 216 179 69 current 3 2 - Liabilities: non- current (216) (179) (69) current - - (3)
22.5 3 2 (3)
Total Assets: non- current 9 257 246 168 current 12 123 496 261 Liabilities: non- current 20 (283) (229) (134) current 21 (166) (45) (207)
(69) 468 88
Financial instruments are mainly used by the Group to hedgerisks arising from Group activity and protect its assets.
The management of foreign exchange and interest rate risk, inaddition to transactions involving shares and financial instruments,is centralized.
The Group has implemented a stringent policy and rigorousmanagement guidelines to manage, measure, and monitor thesemarket risks.
These activities are organized based on a segregation of dutiesbetween risk measurement, hedging (front office), administration(back office) and financial control.
The backbone of this organization is an integrated informationsystem which allows hedging transactions to be monitoredquickly.
The Group’s hedging strategy is presented to the Audit Committee.Hedging decisions are made according to an established processthat includes regular presentations to the Group’s ExecutiveCommittee and detailed documentation.
Counterparties are selected based on their rating and in accordancewith the Group’s risk diversification strategy.
Selected notes to the consolidated financial statements
22. FINANCIAL INSTRUMENTS AND MARKET RISK MANAGEMENT
22.1 Organization of foreign exchange, interest rate and equity market risk management
Financial Documents - December 31, 2018 57
CONDENSED CONSOLIDATED FINANCIAL STATEMENTS
2_VA_V3 28/01/2019 13:21 Page57
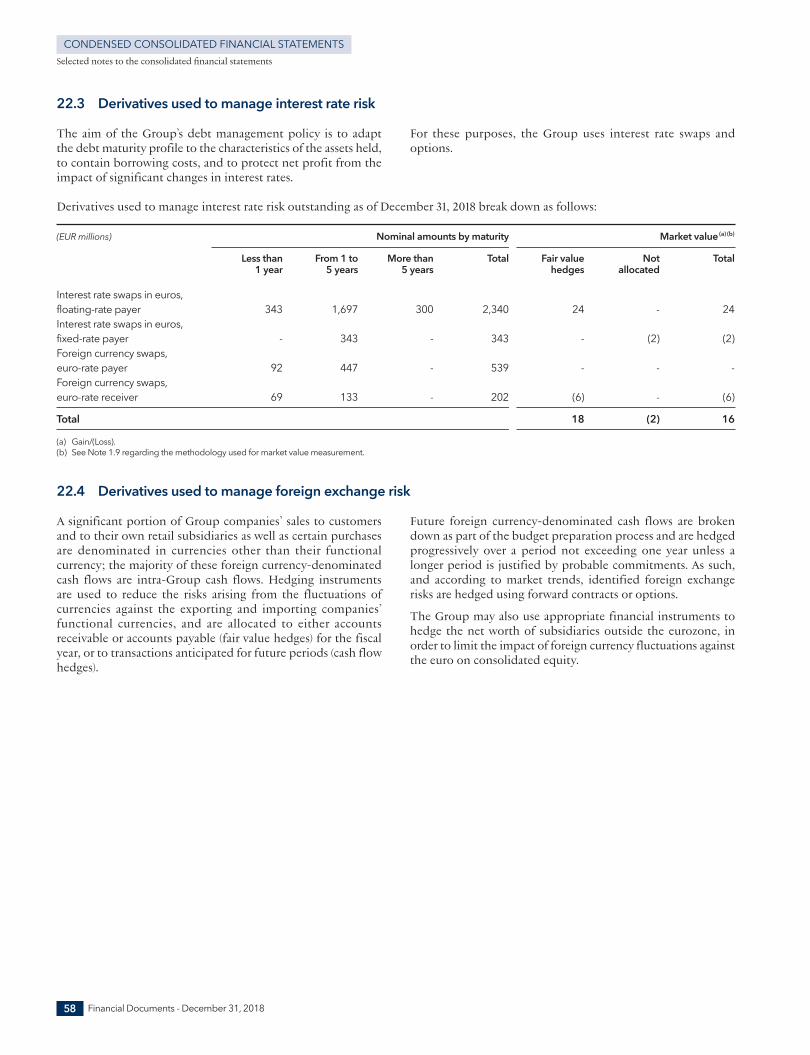
A significant portion of Group companies’ sales to customersand to their own retail subsidiaries as well as certain purchasesare denominated in currencies other than their functionalcurrency; the majority of these foreign currency- denominatedcash flows are intra- Group cash flows. Hedging instruments are used to reduce the risks arising from the fluctuations ofcurrencies against the exporting and importing companies’functional currencies, and are allocated to either accountsreceivable or accounts payable (fair value hedges) for the fiscalyear, or to transactions anticipated for future periods (cash flowhedges).
Future foreign currency- denominated cash flows are brokendown as part of the budget preparation process and are hedgedprogressively over a period not exceeding one year unless alonger period is justified by probable commitments. As such,and according to market trends, identified foreign exchangerisks are hedged using forward contracts or options.
The Group may also use appropriate financial instruments tohedge the net worth of subsidiaries outside the eurozone, inorder to limit the impact of foreign currency fluctuations againstthe euro on consolidated equity.
Derivatives used to manage interest rate risk outstanding as of December 31, 2018 break down as follows:
(EUR millions) Nominal amounts by maturity Market value(a) (b)
Less than From 1 to More than Total Fair value Not Total 1 year 5 years 5 years hedges allocated
Interest rate swaps in euros, floating-rate payer 343 1,697 300 2,340 24 - 24Interest rate swaps in euros,fixed-rate payer - 343 - 343 - (2) (2)Foreign currency swaps, euro-rate payer 92 447 - 539 - - -Foreign currency swaps, euro-rate receiver 69 133 - 202 (6) - (6)
Total 18 (2) 16
(a) Gain/(Loss).(b) See Note 1.9 regarding the methodology used for market value measurement.
22.4 Derivatives used to manage foreign exchange risk
The aim of the Group’s debt management policy is to adaptthe debt maturity profile to the characteristics of the assets held,to contain borrowing costs, and to protect net profit from theimpact of significant changes in interest rates.
For these purposes, the Group uses interest rate swaps andoptions.
Selected notes to the consolidated financial statements
22.3 Derivatives used to manage interest rate risk
Financial Documents - December 31, 201858
CONDENSED CONSOLIDATED FINANCIAL STATEMENTS
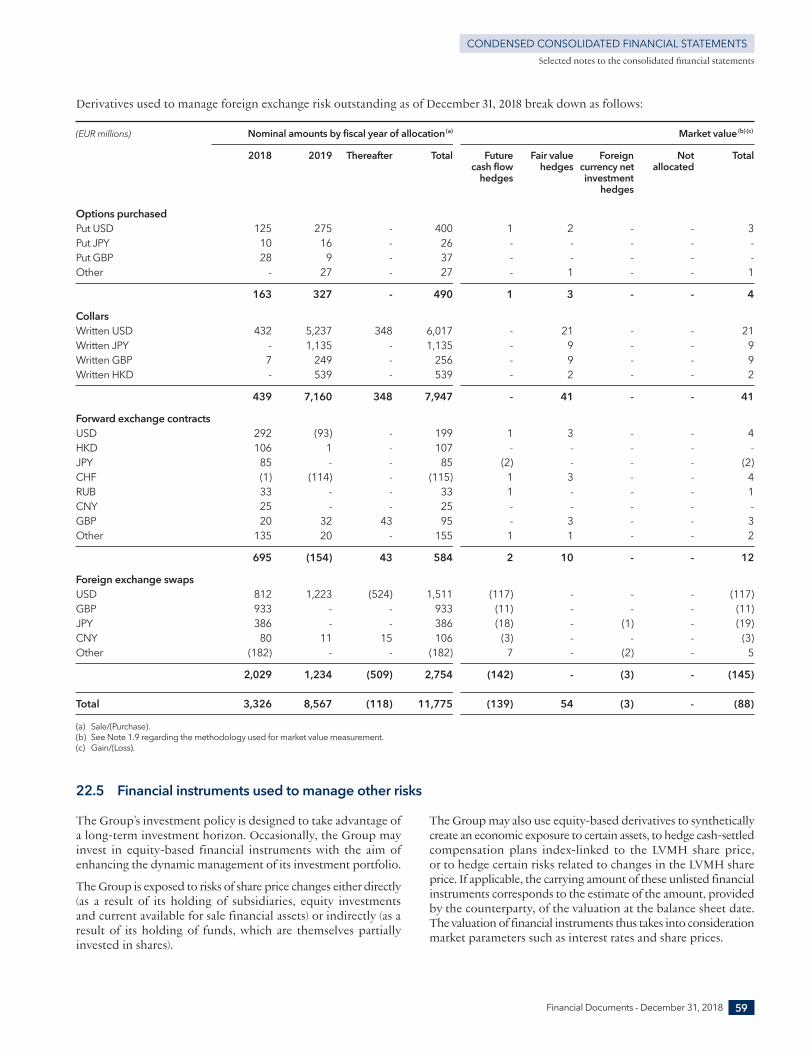
The Group’s investment policy is designed to take advantage ofa long- term investment horizon. Occasionally, the Group mayinvest in equity- based financial instruments with the aim ofenhancing the dynamic management of its investment portfolio.
The Group is exposed to risks of share price changes either directly(as a result of its holding of subsidiaries, equity investmentsand current available for sale financial assets) or indirectly (as aresult of its holding of funds, which are themselves partiallyinvested in shares).
The Group may also use equity- based derivatives to syntheticallycreate an economic exposure to certain assets, to hedge cash- settledcompensation plans index- linked to the LVMH share price, or to hedge certain risks related to changes in the LVMH shareprice. If applicable, the carrying amount of these unlisted financialinstruments corresponds to the estimate of the amount, providedby the counterparty, of the valuation at the balance sheet date.The valuation of financial instruments thus takes into considerationmarket parameters such as interest rates and share prices.
Selected notes to the consolidated financial statements
Derivatives used to manage foreign exchange risk outstanding as of December 31, 2018 break down as follows:
(EUR millions) Nominal amounts by fiscal year of allocation(a) Market value(b) (c)
2018 2019 Thereafter Total Future Fair value Foreign Not Total cash flow hedges currency net allocated hedges investment hedges
Options purchased Put USD 125 275 - 400 1 2 - - 3Put JPY 10 16 - 26 - - - - - Put GBP 28 9 - 37 - - - - - Other - 27 - 27 - 1 - - 1
163 327 - 490 1 3 - - 4
Collars Written USD 432 5,237 348 6,017 - 21 - - 21Written JPY - 1,135 - 1,135 - 9 - - 9Written GBP 7 249 - 256 - 9 - - 9Written HKD - 539 - 539 - 2 - - 2
439 7,160 348 7,947 - 41 - - 41
Forward exchange contracts USD 292 (93) - 199 1 3 - - 4HKD 106 1 - 107 - - - - - JPY 85 - - 85 (2) - - - (2)CHF (1) (114) - (115) 1 3 - - 4RUB 33 - - 33 1 - - - 1CNY 25 - - 25 - - - - - GBP 20 32 43 95 - 3 - - 3Other 135 20 - 155 1 1 - - 2
695 (154) 43 584 2 10 - - 12
Foreign exchange swaps USD 812 1,223 (524) 1,511 (117) - - - (117)GBP 933 - - 933 (11) - - - (11)JPY 386 - - 386 (18) - (1) - (19)CNY 80 11 15 106 (3) - - - (3)Other (182) - - (182) 7 - (2) - 5
2,029 1,234 (509) 2,754 (142) - (3) - (145)
Total 3,326 8,567 (118) 11,775 (139) 54 (3) - (88)
(a) Sale/(Purchase).(b) See Note 1.9 regarding the methodology used for market value measurement.(c) Gain/(Loss).
22.5 Financial instruments used to manage other risks
Financial Documents - December 31, 2018 59
CONDENSED CONSOLIDATED FINANCIAL STATEMENTS
2_VA_V3 28/01/2019 13:21 Page59
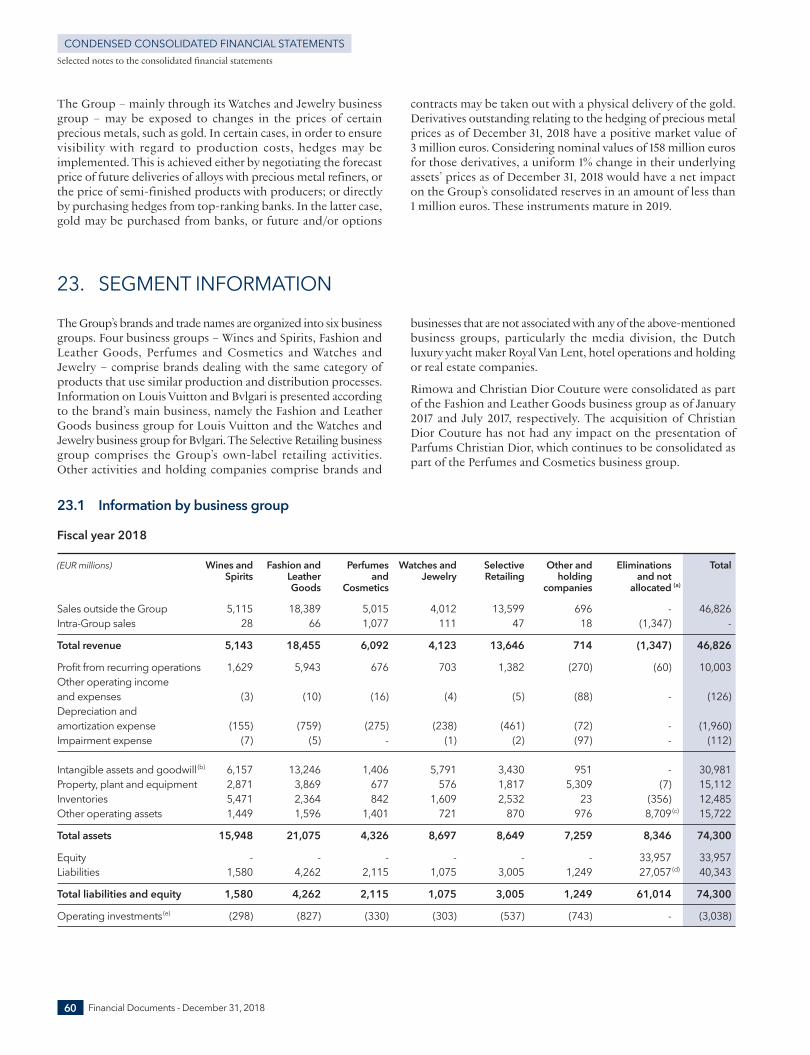
23.1 Information by business group
Fiscal year 2018
(EUR millions) Wines and Fashion and Perfumes Watches and Selective Other and Eliminations Total Spirits Leather and Jewelry Retailing holding and not Goods Cosmetics companies allocated (a)
Sales outside the Group 5,115 18,389 5,015 4,012 13,599 696 - 46,826Intra- Group sales 28 66 1,077 111 47 18 (1,347) -
Total revenue 5,143 18,455 6,092 4,123 13,646 714 (1,347) 46,826
Profit from recurring operations 1,629 5,943 676 703 1,382 (270) (60) 10,003Other operating income and expenses (3) (10) (16) (4) (5) (88) - (126)Depreciation and amortization expense (155) (759) (275) (238) (461) (72) - (1,960)Impairment expense (7) (5) - (1) (2) (97) - (112)
Intangible assets and goodwill (b) 6,157 13,246 1,406 5,791 3,430 951 - 30,981Property, plant and equipment 2,871 3,869 677 576 1,817 5,309 (7) 15,112Inventories 5,471 2,364 842 1,609 2,532 23 (356) 12,485Other operating assets 1,449 1,596 1,401 721 870 976 8,709(c) 15,722
Total assets 15,948 21,075 4,326 8,697 8,649 7,259 8,346 74,300
Equity - - - - - - 33,957 33,957Liabilities 1,580 4,262 2,115 1,075 3,005 1,249 27,057(d) 40,343
Total liabilities and equity 1,580 4,262 2,115 1,075 3,005 1,249 61,014 74,300
Operating investments(e) (298) (827) (330) (303) (537) (743) - (3,038)
The Group’s brands and trade names are organized into six businessgroups. Four business groups – Wines and Spirits, Fashion andLeather Goods, Perfumes and Cosmetics and Watches andJewelry – comprise brands dealing with the same category ofproducts that use similar production and distribution processes.Information on Louis Vuitton and Bvlgari is presented accordingto the brand’s main business, namely the Fashion and LeatherGoods business group for Louis Vuitton and the Watches andJewelry business group for Bvlgari. The Selective Retailing businessgroup comprises the Group’s own- label retailing activities.Other activities and holding companies comprise brands and
businesses that are not associated with any of the above- mentionedbusiness groups, particularly the media division, the Dutchluxury yacht maker Royal Van Lent, hotel operations and holdingor real estate companies.
Rimowa and Christian Dior Couture were consolidated as partof the Fashion and Leather Goods business group as of January2017 and July 2017, respectively. The acquisition of ChristianDior Couture has not had any impact on the presentation ofParfums Christian Dior, which continues to be consolidated aspart of the Perfumes and Cosmetics business group.
23. SEGMENT INFORMATION
Selected notes to the consolidated financial statements
Financial Documents - December 31, 201860
CONDENSED CONSOLIDATED FINANCIAL STATEMENTS
The Group – mainly through its Watches and Jewelry businessgroup – may be exposed to changes in the prices of certainprecious metals, such as gold. In certain cases, in order to ensurevisibility with regard to production costs, hedges may beimplemented. This is achieved either by negotiating the forecastprice of future deliveries of alloys with precious metal refiners, orthe price of semi- finished products with producers; or directlyby purchasing hedges from top- ranking banks. In the latter case,gold may be purchased from banks, or future and/or options
contracts may be taken out with a physical delivery of the gold.Derivatives outstanding relating to the hedging of precious metalprices as of December 31, 2018 have a positive market value of3 million euros. Considering nominal values of 158 million eurosfor those derivatives, a uniform 1% change in their underlyingassets’ prices as of December 31, 2018 would have a net impacton the Group’s consolidated reserves in an amount of less than1 million euros. These instruments mature in 2019.
2_VA_V3 28/01/2019 13:21 Page60
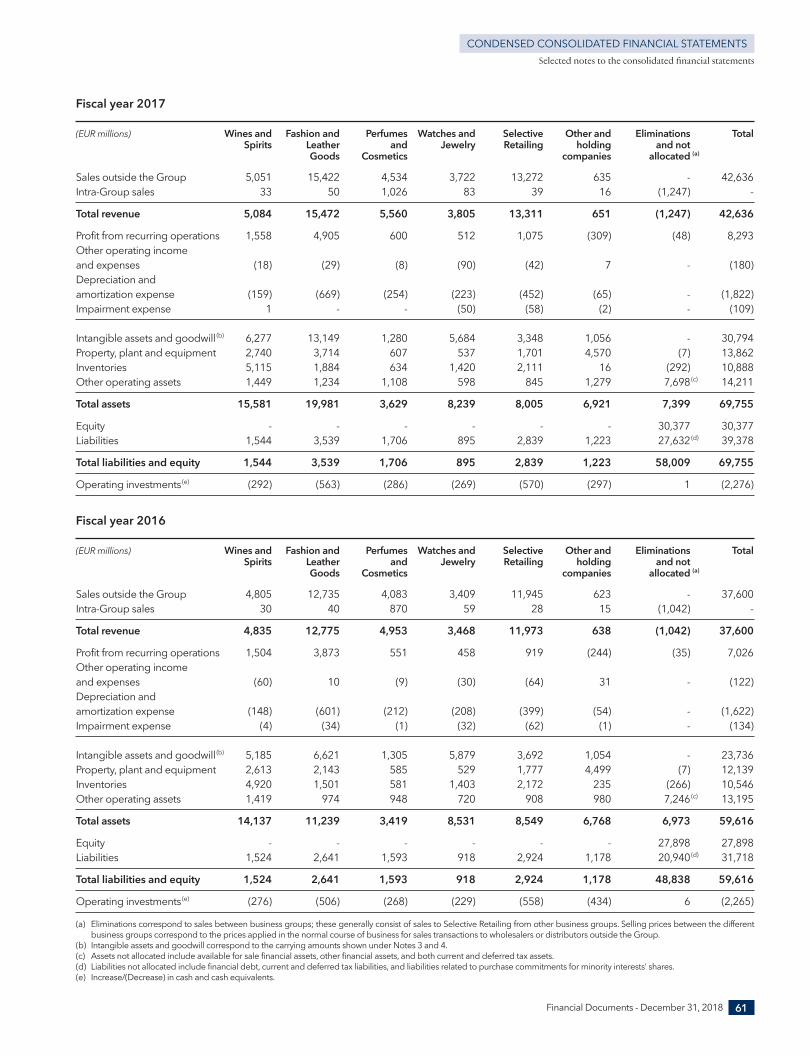
Selected notes to the consolidated financial statements
Fiscal year 2017
(EUR millions) Wines and Fashion and Perfumes Watches and Selective Other and Eliminations Total Spirits Leather and Jewelry Retailing holding and not Goods Cosmetics companies allocated (a)
Sales outside the Group 5,051 15,422 4,534 3,722 13,272 635 - 42,636Intra- Group sales 33 50 1,026 83 39 16 (1,247) -
Total revenue 5,084 15,472 5,560 3,805 13,311 651 (1,247) 42,636
Profit from recurring operations 1,558 4,905 600 512 1,075 (309) (48) 8,293Other operating income and expenses (18) (29) (8) (90) (42) 7 - (180)Depreciation and amortization expense (159) (669) (254) (223) (452) (65) - (1,822)Impairment expense 1 - - (50) (58) (2) - (109)
Intangible assets and goodwill (b) 6,277 13,149 1,280 5,684 3,348 1,056 - 30,794Property, plant and equipment 2,740 3,714 607 537 1,701 4,570 (7) 13,862Inventories 5,115 1,884 634 1,420 2,111 16 (292) 10,888Other operating assets 1,449 1,234 1,108 598 845 1,279 7,698(c) 14,211
Total assets 15,581 19,981 3,629 8,239 8,005 6,921 7,399 69,755
Equity - - - - - - 30,377 30,377Liabilities 1,544 3,539 1,706 895 2,839 1,223 27,632(d) 39,378
Total liabilities and equity 1,544 3,539 1,706 895 2,839 1,223 58,009 69,755
Operating investments(e) (292) (563) (286) (269) (570) (297) 1 (2,276)
Fiscal year 2016
(EUR millions) Wines and Fashion and Perfumes Watches and Selective Other and Eliminations Total Spirits Leather and Jewelry Retailing holding and not Goods Cosmetics companies allocated (a)
Sales outside the Group 4,805 12,735 4,083 3,409 11,945 623 - 37,600Intra- Group sales 30 40 870 59 28 15 (1,042) -
Total revenue 4,835 12,775 4,953 3,468 11,973 638 (1,042) 37,600
Profit from recurring operations 1,504 3,873 551 458 919 (244) (35) 7,026Other operating income and expenses (60) 10 (9) (30) (64) 31 - (122)Depreciation and amortization expense (148) (601) (212) (208) (399) (54) - (1,622)Impairment expense (4) (34) (1) (32) (62) (1) - (134)
Intangible assets and goodwill (b) 5,185 6,621 1,305 5,879 3,692 1,054 - 23,736Property, plant and equipment 2,613 2,143 585 529 1,777 4,499 (7) 12,139Inventories 4,920 1,501 581 1,403 2,172 235 (266) 10,546Other operating assets 1,419 974 948 720 908 980 7,246(c) 13,195
Total assets 14,137 11,239 3,419 8,531 8,549 6,768 6,973 59,616
Equity - - - - - - 27,898 27,898Liabilities 1,524 2,641 1,593 918 2,924 1,178 20,940(d) 31,718
Total liabilities and equity 1,524 2,641 1,593 918 2,924 1,178 48,838 59,616
Operating investments(e) (276) (506) (268) (229) (558) (434) 6 (2,265)
(a) Eliminations correspond to sales between business groups; these generally consist of sales to Selective Retailing from other business groups. Selling prices between the differentbusiness groups correspond to the prices applied in the normal course of business for sales transactions to wholesalers or distributors outside the Group.
(b) Intangible assets and goodwill correspond to the carrying amounts shown under Notes 3 and 4.(c) Assets not allocated include available for sale financial assets, other financial assets, and both current and deferred tax assets.(d) Liabilities not allocated include financial debt, current and deferred tax liabilities, and liabilities related to purchase commitments for minority interests’ shares.(e) Increase/(Decrease) in cash and cash equivalents.
Financial Documents - December 31, 2018 61
CONDENSED CONSOLIDATED FINANCIAL STATEMENTS
2_VA_V3 28/01/2019 13:21 Page61
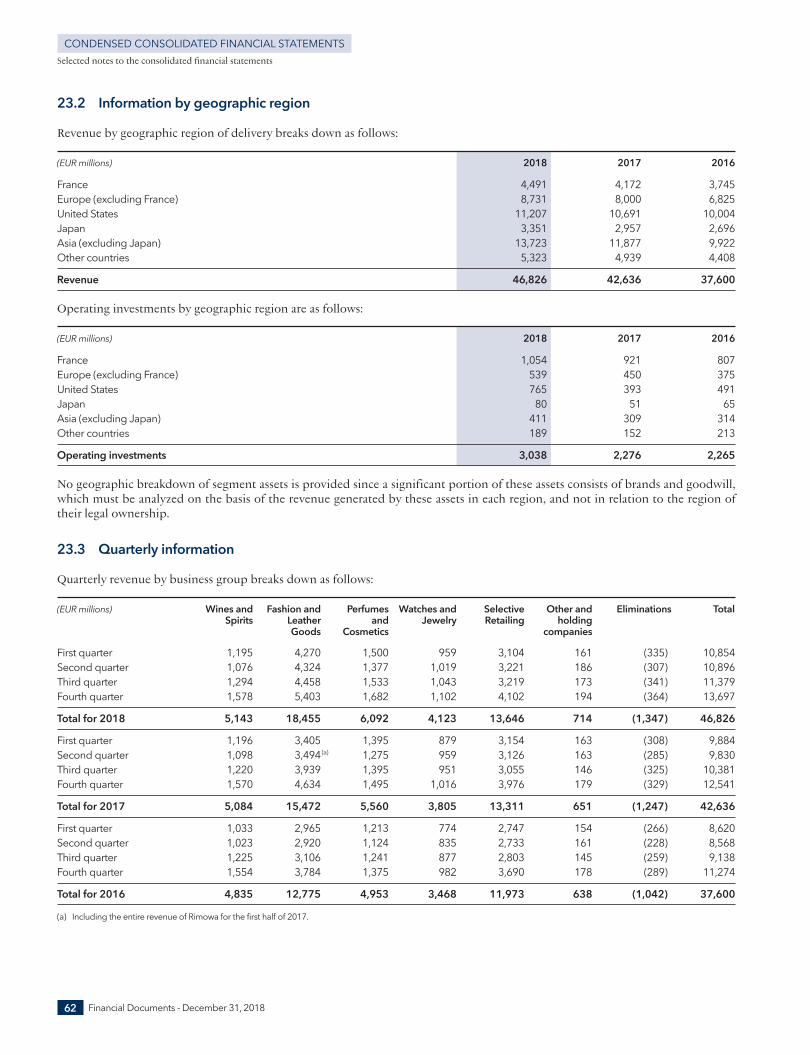
23.2 Information by geographic region
Revenue by geographic region of delivery breaks down as follows:
(EUR millions) 2018 2017 2016
France 4,491 4,172 3,745Europe (excluding France) 8,731 8,000 6,825United States 11,207 10,691 10,004Japan 3,351 2,957 2,696Asia (excluding Japan) 13,723 11,877 9,922Other countries 5,323 4,939 4,408
Revenue 46,826 42,636 37,600
Operating investments by geographic region are as follows:
(EUR millions) 2018 2017 2016
France 1,054 921 807Europe (excluding France) 539 450 375United States 765 393 491Japan 80 51 65Asia (excluding Japan) 411 309 314Other countries 189 152 213
Operating investments 3,038 2,276 2,265
No geographic breakdown of segment assets is provided since a significant portion of these assets consists of brands and goodwill,which must be analyzed on the basis of the revenue generated by these assets in each region, and not in relation to the region oftheir legal ownership.
23.3 Quarterly information
Quarterly revenue by business group breaks down as follows:
(EUR millions) Wines and Fashion and Perfumes Watches and Selective Other and Eliminations Total Spirits Leather and Jewelry Retailing holding Goods Cosmetics companies
First quarter 1,195 4,270 1,500 959 3,104 161 (335) 10,854Second quarter 1,076 4,324 1,377 1,019 3,221 186 (307) 10,896Third quarter 1,294 4,458 1,533 1,043 3,219 173 (341) 11,379Fourth quarter 1,578 5,403 1,682 1,102 4,102 194 (364) 13,697
Total for 2018 5,143 18,455 6,092 4,123 13,646 714 (1,347) 46,826
First quarter 1,196 3,405 1,395 879 3,154 163 (308) 9,884Second quarter 1,098 3,494(a) 1,275 959 3,126 163 (285) 9,830Third quarter 1,220 3,939 1,395 951 3,055 146 (325) 10,381Fourth quarter 1,570 4,634 1,495 1,016 3,976 179 (329) 12,541
Total for 2017 5,084 15,472 5,560 3,805 13,311 651 (1,247) 42,636
First quarter 1,033 2,965 1,213 774 2,747 154 (266) 8,620Second quarter 1,023 2,920 1,124 835 2,733 161 (228) 8,568Third quarter 1,225 3,106 1,241 877 2,803 145 (259) 9,138Fourth quarter 1,554 3,784 1,375 982 3,690 178 (289) 11,274
Total for 2016 4,835 12,775 4,953 3,468 11,973 638 (1,042) 37,600
(a) Including the entire revenue of Rimowa for the first half of 2017.
Selected notes to the consolidated financial statements
Financial Documents - December 31, 201862
CONDENSED CONSOLIDATED FINANCIAL STATEMENTS
2_VA_V3 28/01/2019 13:21 Page62
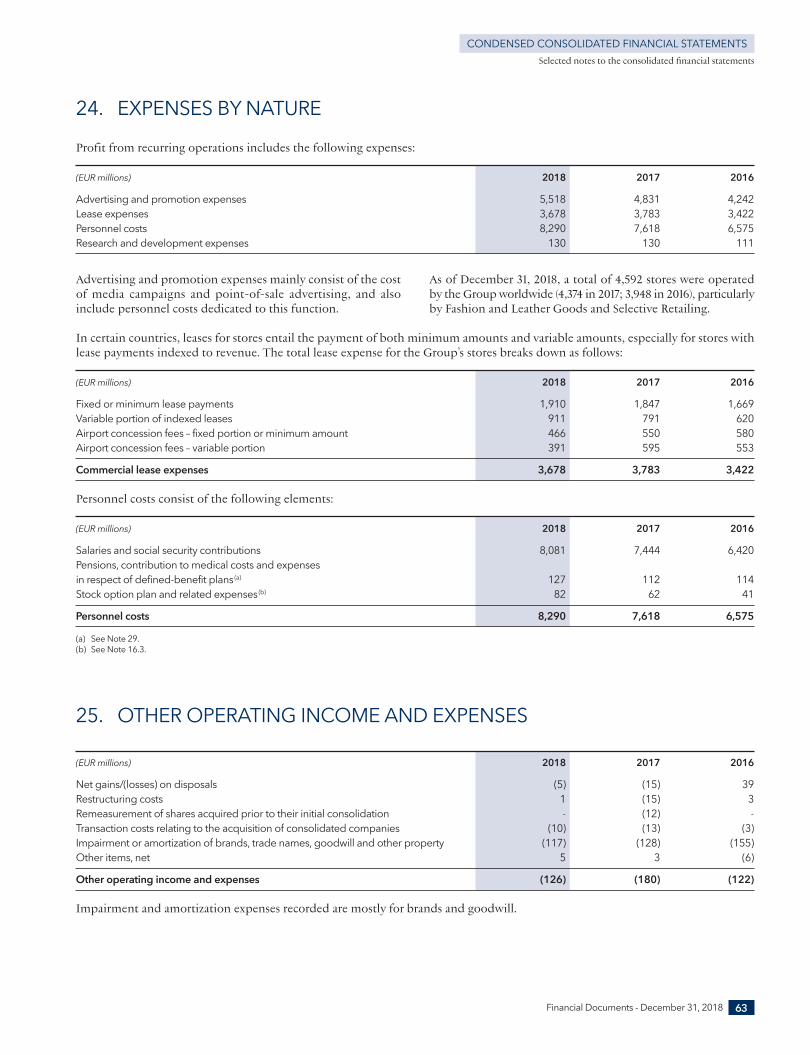
In certain countries, leases for stores entail the payment of both minimum amounts and variable amounts, especially for stores withlease payments indexed to revenue. The total lease expense for the Group’s stores breaks down as follows:
(EUR millions) 2018 2017 2016
Fixed or minimum lease payments 1,910 1,847 1,669Variable portion of indexed leases 911 791 620Airport concession fees – fixed portion or minimum amount 466 550 580Airport concession fees – variable portion 391 595 553
Commercial lease expenses 3,678 3,783 3,422
Personnel costs consist of the following elements:
(EUR millions) 2018 2017 2016
Salaries and social security contributions 8,081 7,444 6,420Pensions, contribution to medical costs and expenses in respect of defined- benefit plans(a) 127 112 114Stock option plan and related expenses(b) 82 62 41
Personnel costs 8,290 7,618 6,575
(a) See Note 29.(b) See Note 16.3.
25. OTHER OPERATING INCOME AND EXPENSES
(EUR millions) 2018 2017 2016
Net gains/(losses) on disposals (5) (15) 39Restructuring costs 1 (15) 3Remeasurement of shares acquired prior to their initial consolidation - (12) - Transaction costs relating to the acquisition of consolidated companies (10) (13) (3)Impairment or amortization of brands, trade names, goodwill and other property (117) (128) (155)Other items, net 5 3 (6)
Other operating income and expenses (126) (180) (122)
Impairment and amortization expenses recorded are mostly for brands and goodwill.
Advertising and promotion expenses mainly consist of the costof media campaigns and point- of- sale advertising, and alsoinclude personnel costs dedicated to this function.
As of December 31, 2018, a total of 4,592 stores were operatedby the Group worldwide (4,374 in 2017; 3,948 in 2016), particularlyby Fashion and Leather Goods and Selective Retailing.
24. EXPENSES BY NATURE
Profit from recurring operations includes the following expenses:
(EUR millions) 2018 2017 2016
Advertising and promotion expenses 5,518 4,831 4,242Lease expenses 3,678 3,783 3,422Personnel costs 8,290 7,618 6,575Research and development expenses 130 130 111
Selected notes to the consolidated financial statements
Financial Documents - December 31, 2018 63
CONDENSED CONSOLIDATED FINANCIAL STATEMENTS
2_VA_V3 28/01/2019 13:21 Page63
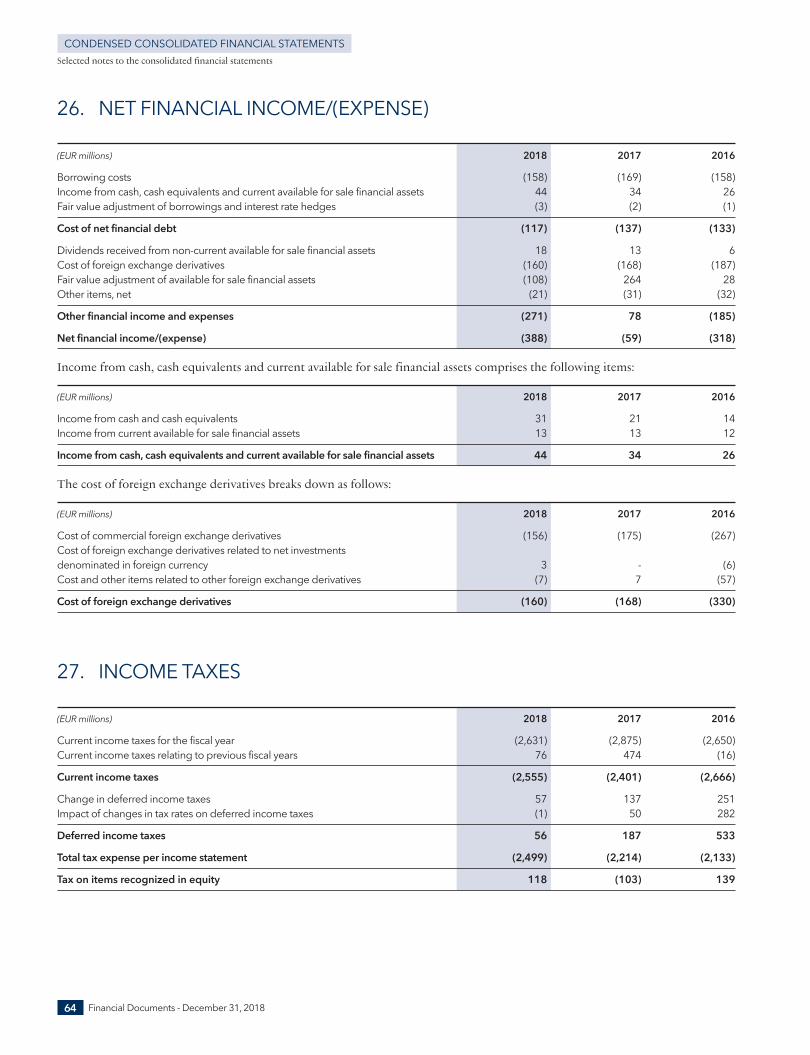
Financial Documents - December 31, 2018
Selected notes to the consolidated financial statements
26. NET FINANCIAL INCOME/(EXPENSE)
(EUR millions) 2018 2017 2016
Borrowing costs (158) (169) (158)Income from cash, cash equivalents and current available for sale financial assets 44 34 26Fair value adjustment of borrowings and interest rate hedges (3) (2) (1)
Cost of net financial debt (117) (137) (133)
Dividends received from non- current available for sale financial assets 18 13 6Cost of foreign exchange derivatives (160) (168) (187)Fair value adjustment of available for sale financial assets (108) 264 28Other items, net (21) (31) (32)
Other financial income and expenses (271) 78 (185)
Net financial income/(expense) (388) (59) (318)
Income from cash, cash equivalents and current available for sale financial assets comprises the following items:
(EUR millions) 2018 2017 2016
Income from cash and cash equivalents 31 21 14Income from current available for sale financial assets 13 13 12
Income from cash, cash equivalents and current available for sale financial assets 44 34 26
The cost of foreign exchange derivatives breaks down as follows:
(EUR millions) 2018 2017 2016
Cost of commercial foreign exchange derivatives (156) (175) (267)Cost of foreign exchange derivatives related to net investments denominated in foreign currency 3 - (6)Cost and other items related to other foreign exchange derivatives (7) 7 (57)
Cost of foreign exchange derivatives (160) (168) (330)
27. INCOME TAXES
(EUR millions) 2018 2017 2016
Current income taxes for the fiscal year (2,631) (2,875) (2,650)Current income taxes relating to previous fiscal years 76 474 (16)
Current income taxes (2,555) (2,401) (2,666)
Change in deferred income taxes 57 137 251Impact of changes in tax rates on deferred income taxes (1) 50 282
Deferred income taxes 56 187 533
Total tax expense per income statement (2,499) (2,214) (2,133)
Tax on items recognized in equity 118 (103) 139
64
CONDENSED CONSOLIDATED FINANCIAL STATEMENTS
2_VA_V3 28/01/2019 13:21 Page64
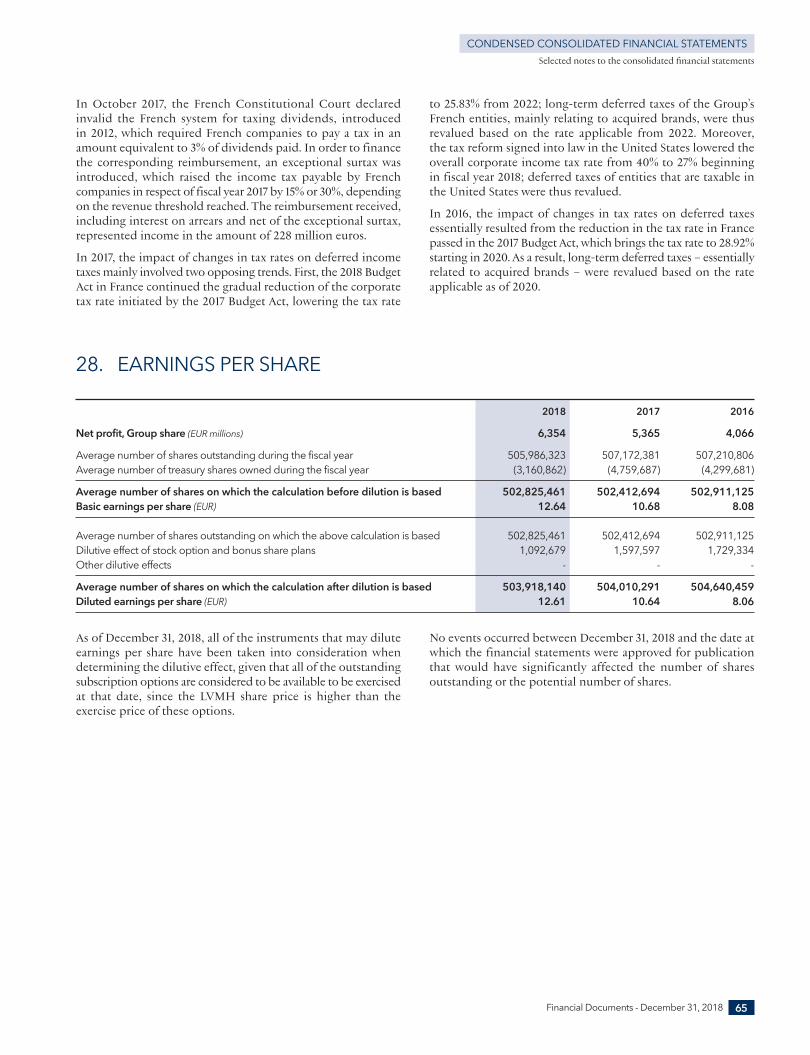
As of December 31, 2018, all of the instruments that may diluteearnings per share have been taken into consideration whendetermining the dilutive effect, given that all of the outstandingsubscription options are considered to be available to be exercisedat that date, since the LVMH share price is higher than theexercise price of these options.
No events occurred between December 31, 2018 and the date atwhich the financial statements were approved for publicationthat would have significantly affected the number of sharesoutstanding or the potential number of shares.
28. EARNINGS PER SHARE
2018 2017 2016
Net profit, Group share (EUR millions) 6,354 5,365 4,066
Average number of shares outstanding during the fiscal year 505,986,323 507,172,381 507,210,806Average number of treasury shares owned during the fiscal year (3,160,862) (4,759,687) (4,299,681)
Average number of shares on which the calculation before dilution is based 502,825,461 502,412,694 502,911,125Basic earnings per share (EUR) 12.64 10.68 8.08
Average number of shares outstanding on which the above calculation is based 502,825,461 502,412,694 502,911,125Dilutive effect of stock option and bonus share plans 1,092,679 1,597,597 1,729,334Other dilutive effects - - -
Average number of shares on which the calculation after dilution is based 503,918,140 504,010,291 504,640,459Diluted earnings per share (EUR) 12.61 10.64 8.06
In October 2017, the French Constitutional Court declaredinvalid the French system for taxing dividends, introduced in 2012, which required French companies to pay a tax in anamount equivalent to 3% of dividends paid. In order to financethe corresponding reimbursement, an exceptional surtax wasintroduced, which raised the income tax payable by Frenchcompanies in respect of fiscal year 2017 by 15% or 30%, dependingon the revenue threshold reached. The reimbursement received,including interest on arrears and net of the exceptional surtax,represented income in the amount of 228 million euros.
In 2017, the impact of changes in tax rates on deferred incometaxes mainly involved two opposing trends. First, the 2018 BudgetAct in France continued the gradual reduction of the corporatetax rate initiated by the 2017 Budget Act, lowering the tax rate
to 25.83% from 2022; long- term deferred taxes of the Group’sFrench entities, mainly relating to acquired brands, were thusrevalued based on the rate applicable from 2022. Moreover, the tax reform signed into law in the United States lowered theoverall corporate income tax rate from 40% to 27% beginningin fiscal year 2018; deferred taxes of entities that are taxable inthe United States were thus revalued.
In 2016, the impact of changes in tax rates on deferred taxesessentially resulted from the reduction in the tax rate in Francepassed in the 2017 Budget Act, which brings the tax rate to 28.92%starting in 2020. As a result, long- term deferred taxes – essentiallyrelated to acquired brands – were revalued based on the rateapplicable as of 2020.
Selected notes to the consolidated financial statements
Financial Documents - December 31, 2018 65
CONDENSED CONSOLIDATED FINANCIAL STATEMENTS
2_VA_V3 28/01/2019 13:21 Page65
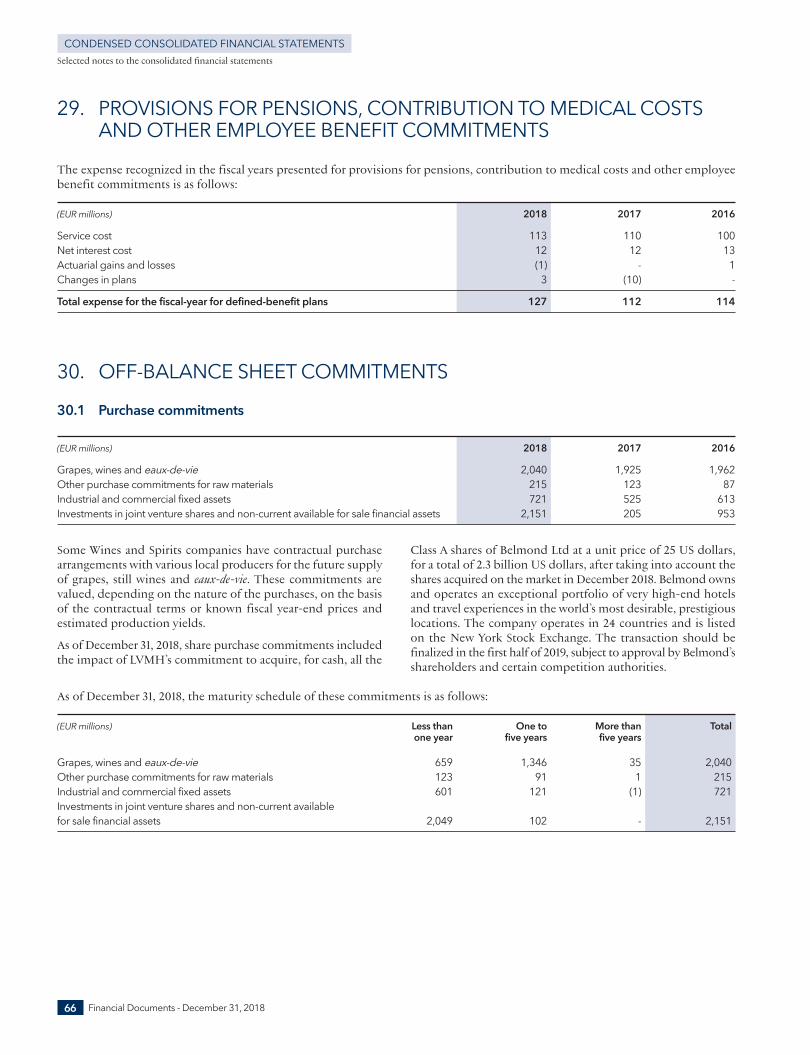
As of December 31, 2018, the maturity schedule of these commitments is as follows:
(EUR millions) Less than One to More than Total one year five years five years
Grapes, wines and eaux- de- vie 659 1,346 35 2,040Other purchase commitments for raw materials 123 91 1 215Industrial and commercial fixed assets 601 121 (1) 721Investments in joint venture shares and non- current available for sale financial assets 2,049 102 - 2,151
Some Wines and Spirits companies have contractual purchasearrangements with various local producers for the future supplyof grapes, still wines and eaux- de- vie. These commitments arevalued, depending on the nature of the purchases, on the basisof the contractual terms or known fiscal year- end prices andestimated production yields.
As of December 31, 2018, share purchase commitments includedthe impact of LVMH’s commitment to acquire, for cash, all the
Class A shares of Belmond Ltd at a unit price of 25 US dollars,for a total of 2.3 billion US dollars, after taking into account theshares acquired on the market in December 2018. Belmond ownsand operates an exceptional portfolio of very high- end hotelsand travel experiences in the world’s most desirable, prestigiouslocations. The company operates in 24 countries and is listedon the New York Stock Exchange. The transaction should befinalized in the first half of 2019, subject to approval by Belmond’sshareholders and certain competition authorities.
Selected notes to the consolidated financial statements
Financial Documents - December 31, 2018
29. PROVISIONS FOR PENSIONS, CONTRIBUTION TO MEDICAL COSTSAND OTHER EMPLOYEE BENEFIT COMMITMENTS
The expense recognized in the fiscal years presented for provisions for pensions, contribution to medical costs and other employeebenefit commitments is as follows:
(EUR millions) 2018 2017 2016
Service cost 113 110 100Net interest cost 12 12 13Actuarial gains and losses (1) - 1Changes in plans 3 (10) -
Total expense for the fiscal- year for defined- benefit plans 127 112 114
30. OFF- BALANCE SHEET COMMITMENTS
30.1 Purchase commitments
(EUR millions) 2018 2017 2016
Grapes, wines and eaux- de- vie 2,040 1,925 1,962Other purchase commitments for raw materials 215 123 87Industrial and commercial fixed assets 721 525 613Investments in joint venture shares and non- current available for sale financial assets 2,151 205 953
66
CONDENSED CONSOLIDATED FINANCIAL STATEMENTS
2_VA_V3 28/01/2019 13:21 Page66
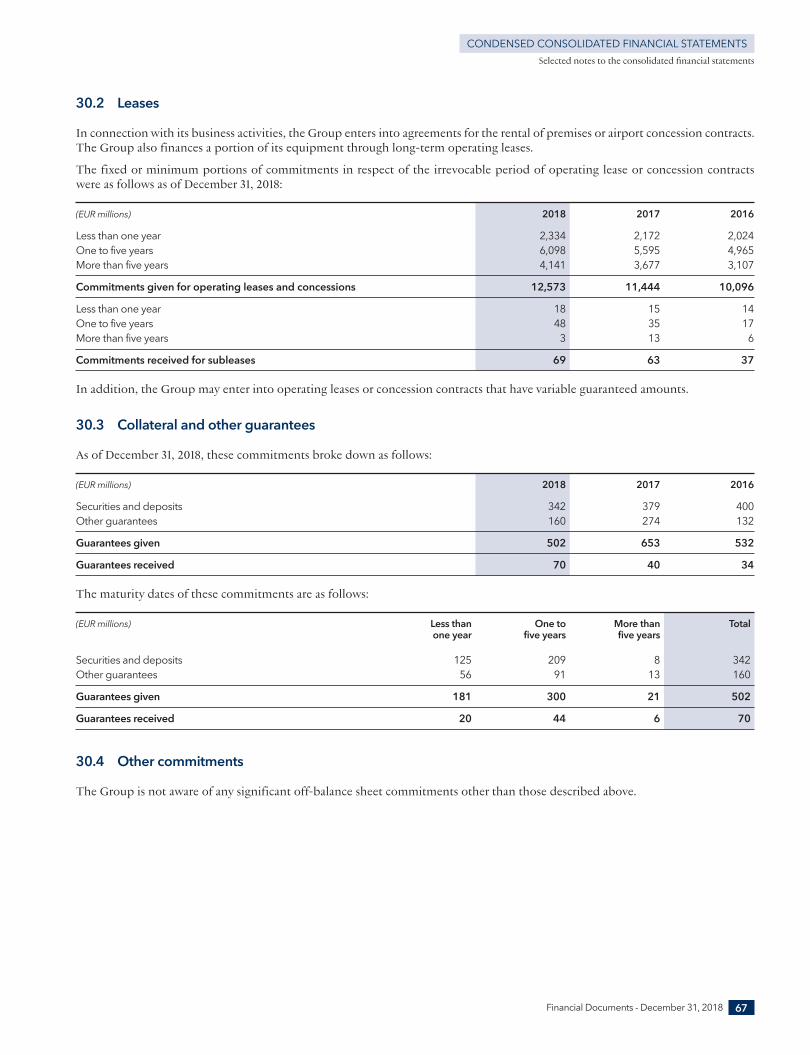
Selected notes to the consolidated financial statements
Financial Documents - December 31, 2018 67
CONDENSED CONSOLIDATED FINANCIAL STATEMENTS
30.2 Leases
In connection with its business activities, the Group enters into agreements for the rental of premises or airport concession contracts.The Group also finances a portion of its equipment through long- term operating leases.
The fixed or minimum portions of commitments in respect of the irrevocable period of operating lease or concession contractswere as follows as of December 31, 2018:
(EUR millions) 2018 2017 2016
Less than one year 2,334 2,172 2,024One to five years 6,098 5,595 4,965More than five years 4,141 3,677 3,107
Commitments given for operating leases and concessions 12,573 11,444 10,096
Less than one year 18 15 14One to five years 48 35 17More than five years 3 13 6
Commitments received for subleases 69 63 37
In addition, the Group may enter into operating leases or concession contracts that have variable guaranteed amounts.
30.3 Collateral and other guarantees
As of December 31, 2018, these commitments broke down as follows:
(EUR millions) 2018 2017 2016
Securities and deposits 342 379 400Other guarantees 160 274 132
Guarantees given 502 653 532
Guarantees received 70 40 34
The maturity dates of these commitments are as follows:
(EUR millions) Less than One to More than Total one year five years five years
Securities and deposits 125 209 8 342Other guarantees 56 91 13 160
Guarantees given 181 300 21 502
Guarantees received 20 44 6 70
30.4 Other commitments
The Group is not aware of any significant off- balance sheet commitments other than those described above.
2_VA_V3 28/01/2019 13:21 Page67
32. SUBSEQUENT EVENTS
No significant subsequent events occurred between December 31, 2018 and January 29, 2019, the date at which the financial statementswere approved for publication by the Board of Directors.
As part of its day- to- day management, the Group may be partyto various legal proceedings concerning trademark rights, theprotection of intellectual property rights, the protection ofselective Retailing networks, licensing agreements, employeerelations, tax audits, and any other matters inherent to itsbusiness. The Group believes that the provisions recorded inthe balance sheet in respect of these risks, litigation proceedingsand disputes that are in progress and any others of which it isaware at the year- end, are sufficient to avoid its consolidatedfinancial position being materially impacted in the event of anunfavorable outcome.
No significant exceptional events or litigation occurred duringthe fiscal year 2018.
To the best of the Company’s knowledge, there are no pendingor impending administrative, judicial or arbitration proceduresthat are likely to have, or have had over the twelve- month periodunder review, any significant impact on the financial positionor profitability of the Group.
Selected notes to the consolidated financial statements
31. EXCEPTIONAL EVENTS AND LITIGATION
Financial Documents - December 31, 201868
CONDENSED CONSOLIDATED FINANCIAL STATEMENTS
2_VA_V3 28/01/2019 13:21 Page68

Design and production: Agence Marc Praquin
2_VA_V3 28/01/2019 13:21 PageIII
For any information:LVMH, 22 avenue Montaigne - 75008 ParisTel. +33 1 44 13 22 22 - Fax +33 1 44 13 21 19
www.lvmh.com
2_VA_V3 28/01/2019 13:21 PageIV