Embed Size (px)
Citation preview
8/3/2019 Translation Exposure Power Point
http://slidepdf.com/reader/full/translation-exposure-power-point 1/29
Translation Methods
Current/Noncurrent Method
Monetary/Nonmonetary Method Temporal Method
Current Rate Method

8/3/2019 Translation Exposure Power Point
http://slidepdf.com/reader/full/translation-exposure-power-point 2/29
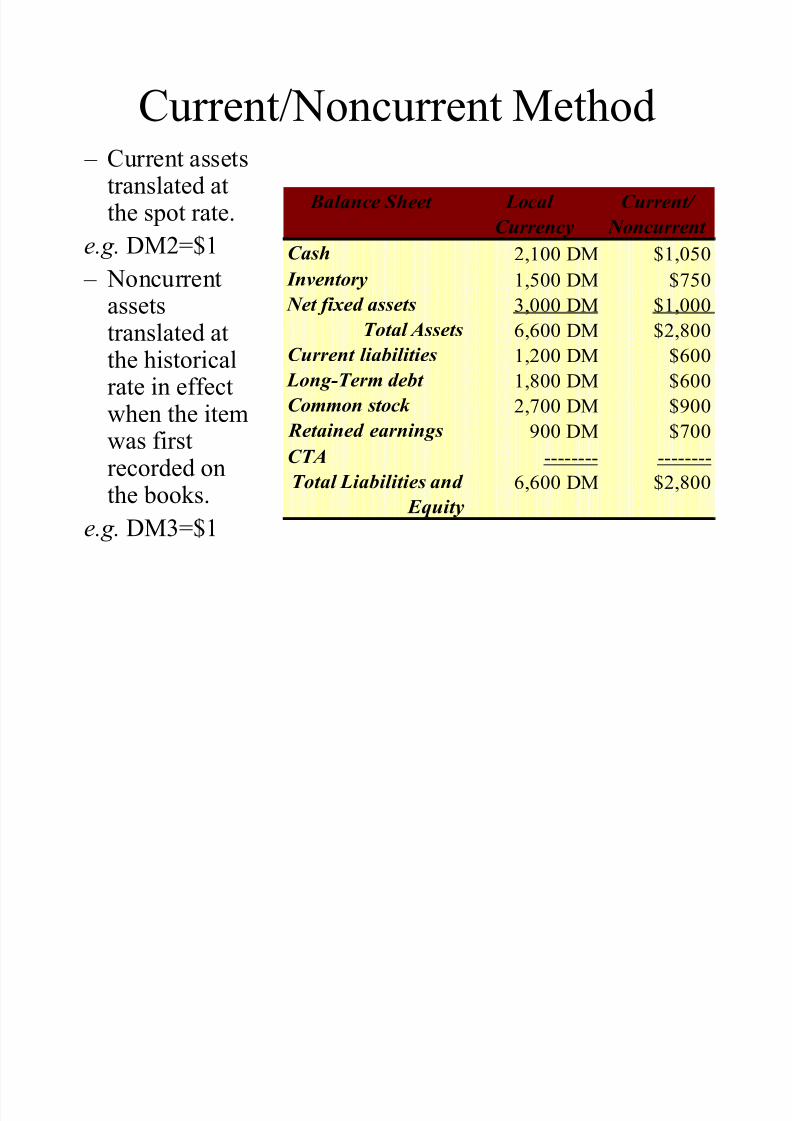
Current/Noncurrent Method
The underlying principal is that assets andliabilities should be translated based on
their maturity. ± Current assets translated at the spot rate.
± Noncurrent assets translated at the historicalrate in effect when the item was first recorded
on the books.
This method of foreign currency translationwas generally accepted in the United States
from the 1930s until 1975, at which timeFASB 8 became effective.
8/3/2019 Translation Exposure Power Point
http://slidepdf.com/reader/full/translation-exposure-power-point 3/29
Current/Noncurrent Method ± Current assets
translated atthe spot rate.
e.g. DM2=$1
± Noncurrentassetstranslated atthe historicalrate in effect
when the itemwas firstrecorded onthe books.
e.g. DM3=$1
Balance Sheet Local
Currency
Current/
Noncurrent
Cash 2,100 DM $1,050
Inventory 1,500 DM $750 Net fixed assets 3,000 DM $1,000
Total Assets 6,600 DM $2,800
Current liabilities 1,200 DM $600
Long-Term debt 1,800 DM $600
Common stock 2,700 DM $900 Retained earnings 900 DM $700
CTA -------- --------
Total Liabilities and
Equity
6,600 DM $2,800
8/3/2019 Translation Exposure Power Point
http://slidepdf.com/reader/full/translation-exposure-power-point 4/29
Monetary/Nonmonetary Method The underlying principal is that monetary
accounts have a similarity because their value
represents a sum of money whose value changes
as the exchange rate changes. All monetary balance sheet accounts (cash,
marketable securities, accounts receivable, etc.) of
a foreign subsidiary are translated at the current
exchange rate. All other (nonmonetary) balance sheet accounts
(owners¶ equity, land) are translated at the
historical exchange rate in effect when the account
was first recorded.

8/3/2019 Translation Exposure Power Point
http://slidepdf.com/reader/full/translation-exposure-power-point 5/29
Monetary/Nonmonetary Method All monetary
balance sheetaccounts aretranslated at the
current exchangerate. e.g.DM2=$1
All other balancesheet accounts
are translated atthe historicalexchange rate ineffect when theaccount was first
recorded.e.g.DM3=$1
Balance Sheet Local
Currency
Monetary/
Nonmonetary
Cash 2,100 DM $1,050
Inventory 1,500 DM $500 Net fixed assets 3,000 DM $1,000
Total Assets 6,600 DM $2,550
Current liabilities 1,200 DM $600
Long-Term debt 1,800 DM $900
Common stock 2,700 DM $900
Retained earnings 900 DM $0
CTA -------- --------
Total Liabilities and
Equity
6,600 DM $2,400

8/3/2019 Translation Exposure Power Point
http://slidepdf.com/reader/full/translation-exposure-power-point 6/29
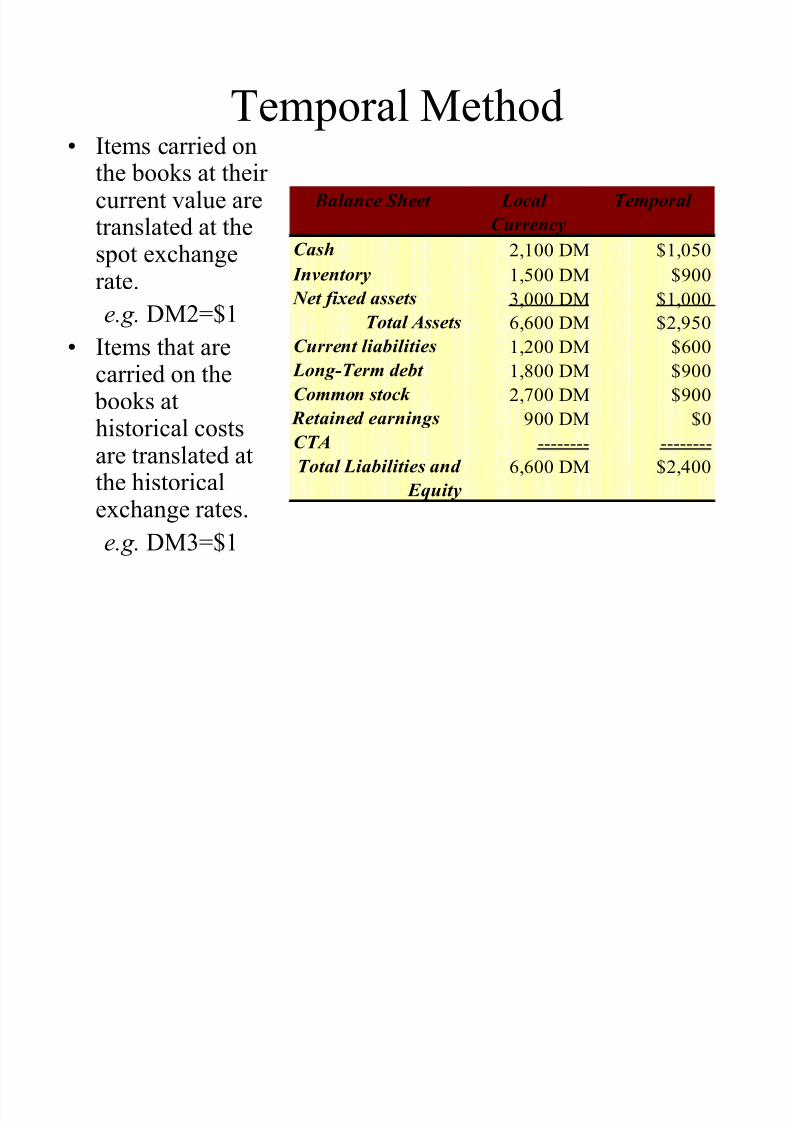
Temporal Method
The underlying principal is that assets andliabilities should be translated based on how
they are carried on the firm¶s books. Balance sheet account are translated at the
current spot exchange rate if they arecarried on the books at their current value.
Items that are carried on the books athistorical costs are translated at thehistorical exchange rates in effect at the
time the firm placed the item on the books.
8/3/2019 Translation Exposure Power Point
http://slidepdf.com/reader/full/translation-exposure-power-point 7/29
Temporal Method Items carried on
the books at their current value aretranslated at thespot exchange
rate.e.g. DM2=$1
Items that arecarried on the
books athistorical costsare translated atthe historicalexchange rates.
e.g. DM3=$1
Balance Sheet Local
Currency
Temporal
Cash 2,100 DM $1,050
Inventory 1,500 DM $900 Net fixed assets 3,000 DM $1,000
Total Assets 6,600 DM $2,950
Current liabilities 1,200 DM $600
Long-Term debt 1,800 DM $900
Common stock 2,700 DM $900
Retained earnings 900 DM $0CTA -------- --------
Total Liabilities and
Equity
6,600 DM $2,400
8/3/2019 Translation Exposure Power Point
http://slidepdf.com/reader/full/translation-exposure-power-point 8/29
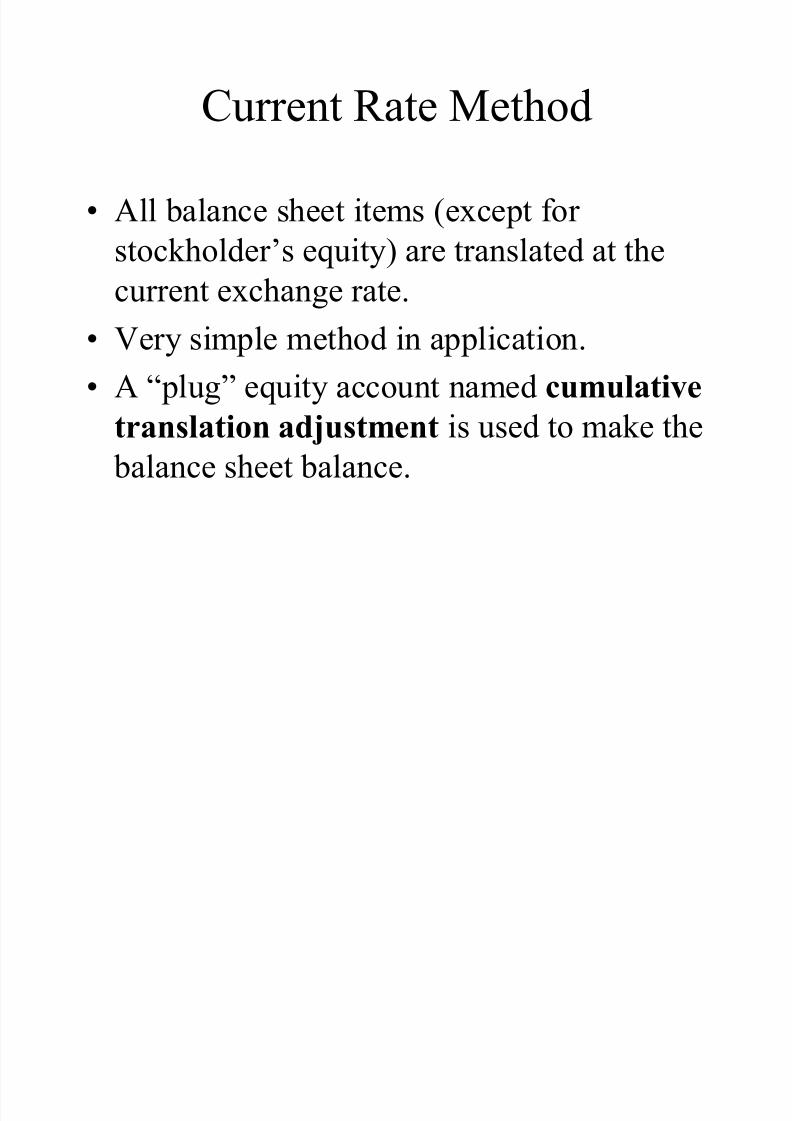
Current Rate Method
All balance sheet items (except for
stockholder¶s equity) are translated at the
current exchange rate.
Very simple method in application.
A ³plug´ equity account named cumulative
translation adjustment is used to make the balance sheet balance.
8/3/2019 Translation Exposure Power Point
http://slidepdf.com/reader/full/translation-exposure-power-point 9/29
Current Rate Method
All balance sheetitems (except for stockholder¶sequity) are
translated at thecurrent exchangerate.
A ³plug´ equityaccount named
cumulativetranslationadjustment isused to make the
balance sheet
balance
Balance Sheet Local
Currency
Current
Rate
Cash DM2,100 $1,050
Inventory DM1,500 $750 Net fixed assets DM3,000 $1,500
Total Assets DM6,600 $3,300
Current liabilities DM1,200 $600
Long-Term debt DM1,800 $900
Common stock DM2,700 $900
Retained earnings DM900 $360
CTA -------- $540
Total Liabilities
and Equity
DM6,600 $3,300

8/3/2019 Translation Exposure Power Point
http://slidepdf.com/reader/full/translation-exposure-power-point 10/29
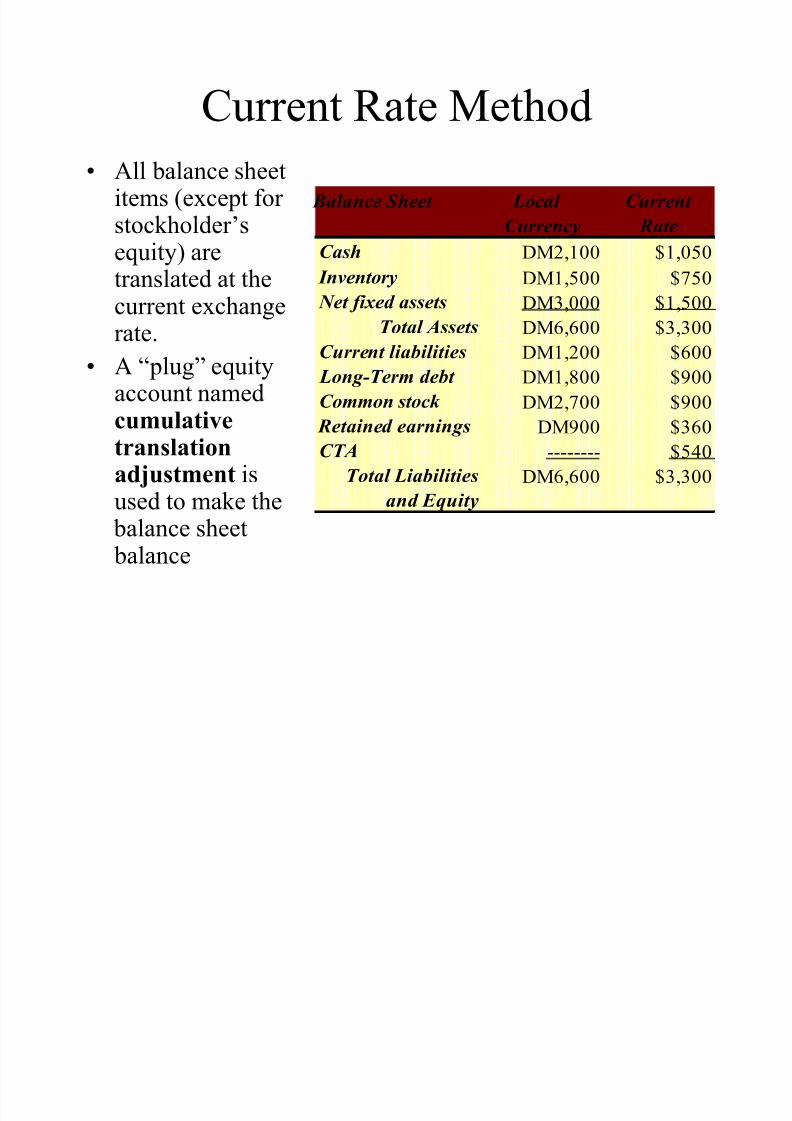
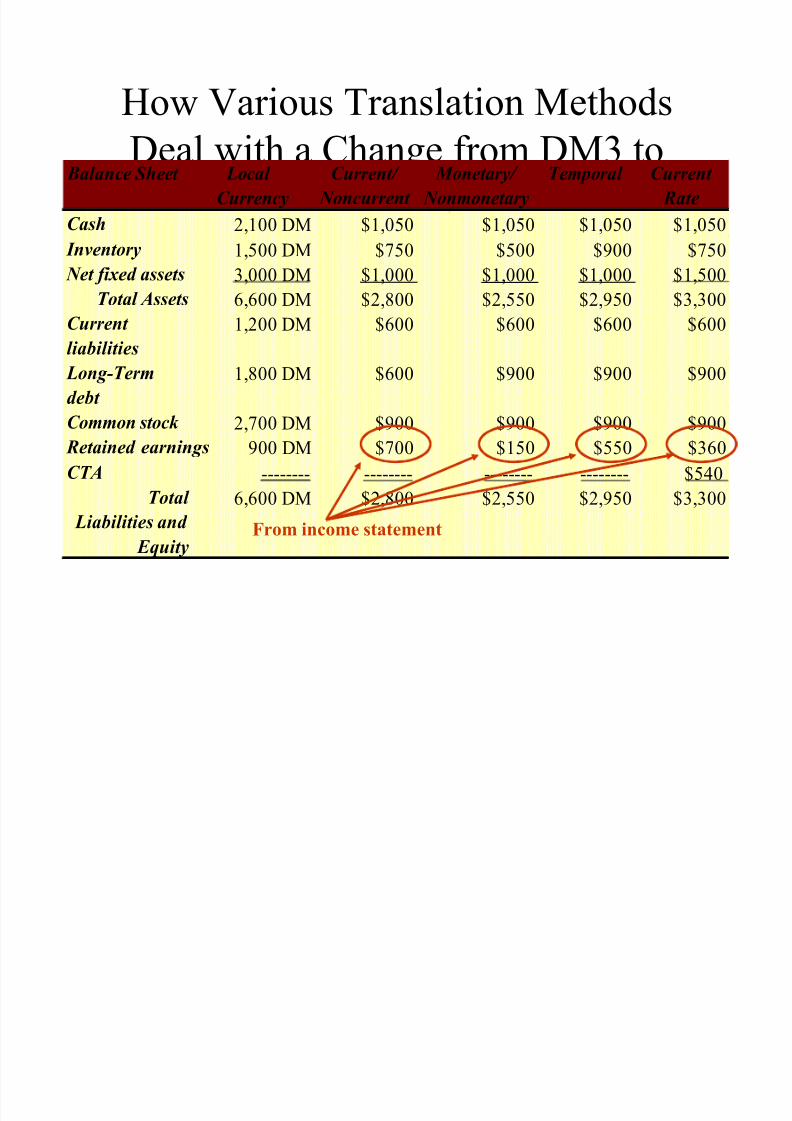
How Various Translation Methods Deal with
a Change from DM3 to DM2 = $1 Balance Sheet Local
Currency
Current/
Noncurrent
Monetary/
Nonmonetary
Temporal Current
Rate
Cash 2,100 DM $1,050 $1,050 $1,050 $1,050
Inventory 1,500 DM $750 $500 $900 $750
Net fixed assets 3,000 DM $1,000 $1,000 $1,000 $1,500Total Assets 6,600 DM $2,800 $2,550 $2,950 $3,300
Current
liabilities
1,200 DM $600 $600 $600 $600
Long-Term
debt
1,800 DM $600 $900 $900 $900
Common stock 2,700 DM $900 $900 $900 $900
Retained 900 DM $700 $150 $550 $360
CTA -------- -------- -------- -------- $540
Total
Liabilities and
Equity
6,600 DM $2,800 $2,550 $2,950 $3,300
Spot exchange rate
earnings
8/3/2019 Translation Exposure Power Point
http://slidepdf.com/reader/full/translation-exposure-power-point 11/29
How Various Translation Methods Deal with
a Change from DM3 to DM2 = $1 Balance Sheet Local
Currency
Current/
Noncurrent
Monetary/
Nonmonetary
Temporal Current
Rate
Cash 2,100 DM $1,050 $1,050 $1,050 $1,050
Inventory 1,500 DM $750 $500 $900 $750
Net fixed assets 3,000 DM $1,000 $1,000 $1,000 $1,500Total Assets 6,600 DM $2,800 $2,550 $2,950 $3,300
Current
liabilities
1,200 DM $600 $600 $600 $600
Long-Term
debt
1,800 DM $600 $900 $900 $900
Common stock 2,700 DM $900 $900 $900 $900
Retained 900 DM $700 $150 $550 $360
CTA -------- -------- -------- -------- $540
Total
Liabilities and
Equity
6,600 DM $2,800 $2,550 $2,950 $3,300
Book value of inventory
at spot exchange rate
Book
value of
inventory
historic
rate
Current value of inventory
at spot exchange rate.
earnings
8/3/2019 Translation Exposure Power Point
http://slidepdf.com/reader/full/translation-exposure-power-point 12/29
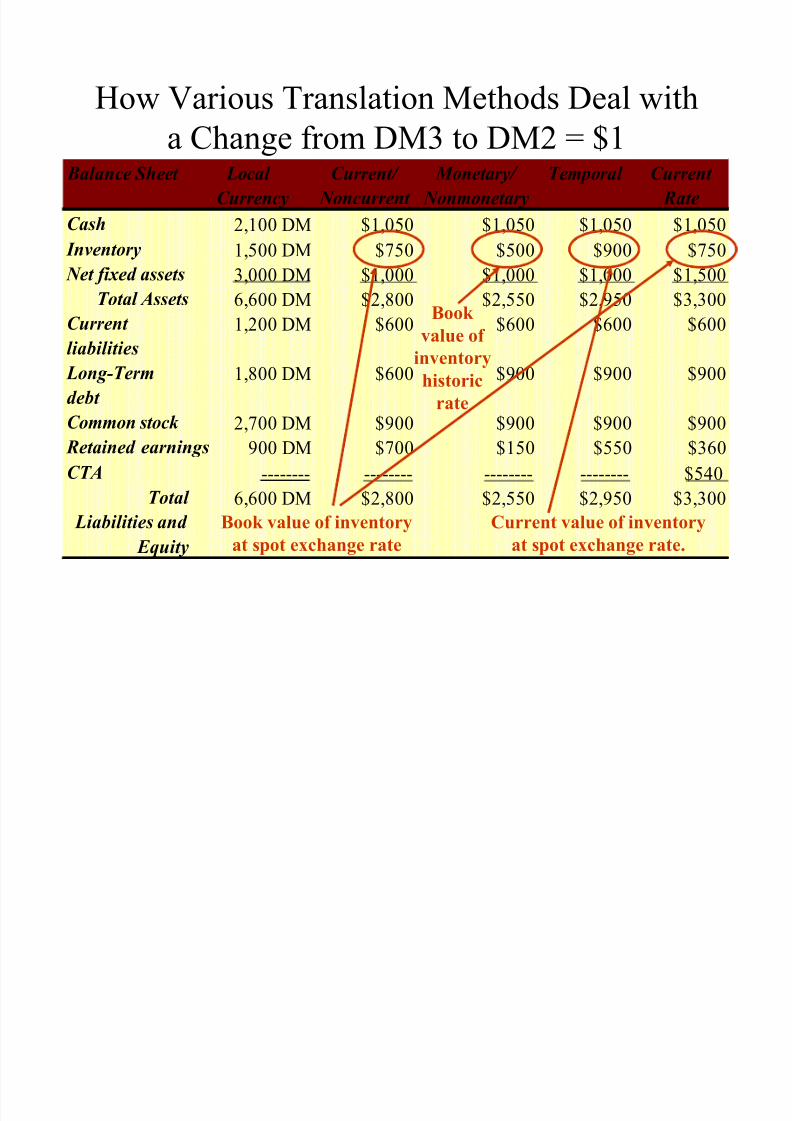
How Various Translation Methods Deal with
a Change from DM3 to DM2 = $1 Balance Sheet Local
Currency
Current/
Noncurrent
Monetary/
Nonmonetary
Temporal Current
Rate
Cash 2,100 DM $1,050 $1,050 $1,050 $1,050
Inventory 1,500 DM $750 $500 $900 $750
Net fixed assets 3,000 DM $1,000 $1,000 $1,000 $1,500Total Assets 6,600 DM $2,800 $2,550 $2,950 $3,300
Current
liabilities
1,200 DM $600 $600 $600 $600
Long-Term
debt
1,800 DM $600 $900 $900 $900
Common stock 2,700 DM $900 $900 $900 $900
Retained 900 DM $700 $150 $550 $360
CTA -------- -------- -------- -------- $540
Total
Liabilities and
Equity
6,600 DM $2,800 $2,550 $2,950 $3,300
historic
rate
spot exchange rate.
earnings

8/3/2019 Translation Exposure Power Point
http://slidepdf.com/reader/full/translation-exposure-power-point 13/29
How Various Translation Methods Deal with
a Change from DM3 to DM2 = $1 Balance Sheet Local
Currency
Current/
Noncurrent
Monetary/
Nonmonetary
Temporal Current
Rate
Cash 2,100 DM $1,050 $1,050 $1,050 $1,050
Inventory 1,500 DM $750 $500 $900 $750
Net fixed assets 3,000 DM $1,000 $1,000 $1,000 $1,500Total Assets 6,600 DM $2,800 $2,550 $2,950 $3,300
Current
liabilities
1,200 DM $600 $600 $600 $600
Long-Term
debt
1,800 DM $600 $900 $900 $900
Common stock 2,700 DM $900 $900 $900 $900
Retained 900 DM $700 $150 $550 $360
CTA -------- -------- -------- -------- $540
Total
Liabilities and
Equity
6,600 DM $2,800 $2,550 $2,950 $3,300
spot rate
earnings

8/3/2019 Translation Exposure Power Point
http://slidepdf.com/reader/full/translation-exposure-power-point 14/29
How Various Translation Methods Deal with
a Change from DM3 to DM2 = $1 Balance Sheet Local
Currency
Current/
Noncurrent
Monetary/
Nonmonetary
Temporal Current
Rate
Cash 2,100 DM $1,050 $1,050 $1,050 $1,050
Inventory 1,500 DM $750 $500 $900 $750
Net fixed assets 3,000 DM $1,000 $1,000 $1,000 $1,500Total Assets 6,600 DM $2,800 $2,550 $2,950 $3,300
Current
liabilities
1,200 DM $600 $600 $600 $600
Long-Term
debt
1,800 DM $600 $900 $900 $900
Common stock 2,700 DM $900 $900 $900 $900
Retained 900 DM $700 $150 $550 $360
CTA -------- -------- -------- -------- $540
Total
Liabilities and
Equity
6,600 DM $2,800 $2,550 $2,950 $3,300
spot ratehistorical rate
earnings

8/3/2019 Translation Exposure Power Point
http://slidepdf.com/reader/full/translation-exposure-power-point 15/29
How Various Translation Methods Deal with
a Change from DM3 to DM2 = $1 Balance Sheet Local
Currency
Current/
Noncurrent
Monetary/
Nonmonetary
Temporal Current
Rate
Cash 2,100 DM $1,050 $1,050 $1,050 $1,050
Inventory 1,500 DM $750 $500 $900 $750
Net fixed assets 3,000 DM $1,000 $1,000 $1,000 $1,500Total Assets 6,600 DM $2,800 $2,550 $2,950 $3,300
Current
liabilities
1,200 DM $600 $600 $600 $600
Long-Term
debt
1,800 DM $600 $900 $900 $900
Common stock 2,700 DM $900 $900 $900 $900
Retained 900 DM $700 $150 $550 $360
CTA -------- -------- -------- -------- $540
Total
Liabilities and
Equity
6,600 DM $2,800 $2,550 $2,950 $3,300
historical rate
earnings
8/3/2019 Translation Exposure Power Point
http://slidepdf.com/reader/full/translation-exposure-power-point 16/29
How Various Translation Methods
Deal with a Change from DM3 toDM2 = $1
Balance Sheet Local
Currency
Current/
Noncurrent
Monetary/
Nonmonetary
Temporal Current
Rate
Cash 2,100 DM $1,050 $1,050 $1,050 $1,050
Inventory 1,500 DM $750 $500 $900 $750
Net fixed assets 3,000 DM $1,000 $1,000 $1,000 $1,500Total Assets 6,600 DM $2,800 $2,550 $2,950 $3,300
Current
liabilities
1,200 DM $600 $600 $600 $600
Long-Term
debt
1,800 DM $600 $900 $900 $900
Common stock 2,700 DM $900 $900 $900 $900
Retained 900 DM $700 $150 $550 $360
CTA -------- -------- -------- -------- $540
Total
Liabilities and
Equity
6,600 DM $2,800 $2,550 $2,950 $3,300
From income statement
earnings
8/3/2019 Translation Exposure Power Point
http://slidepdf.com/reader/full/translation-exposure-power-point 17/29
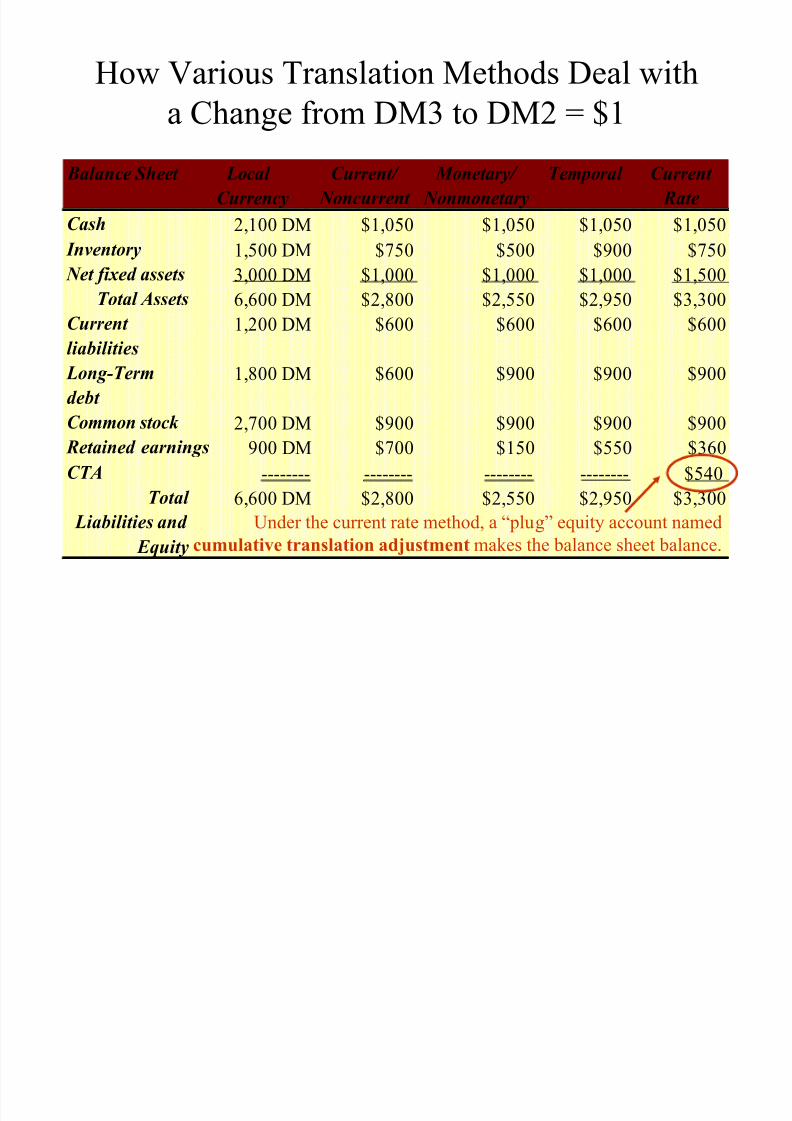
How Various Translation Methods Deal with
a Change from DM3 to DM2 = $1
Balance Sheet Local
Currency
Current/
Noncurrent
Monetary/
Nonmonetary
Temporal Current
Rate
Cash 2,100 DM $1,050 $1,050 $1,050 $1,050
Inventory 1,500 DM $750 $500 $900 $750
Net fixed assets 3,000 DM $1,000 $1,000 $1,000 $1,500Total Assets 6,600 DM $2,800 $2,550 $2,950 $3,300
Current
liabilities
1,200 DM $600 $600 $600 $600
Long-Term
debt
1,800 DM $600 $900 $900 $900
Common stock 2,700 DM $900 $900 $900 $900
Retained 900 DM $700 $150 $550 $360
CTA -------- -------- -------- -------- $540
Total
Liabilities and
Equity
6,600 DM $2,800 $2,550 $2,950 $3,300
Under the current rate method, a ³plug´ equity account named
cumulative translation adjustment makes the balance sheet balance.
earnings
8/3/2019 Translation Exposure Power Point
http://slidepdf.com/reader/full/translation-exposure-power-point 18/29
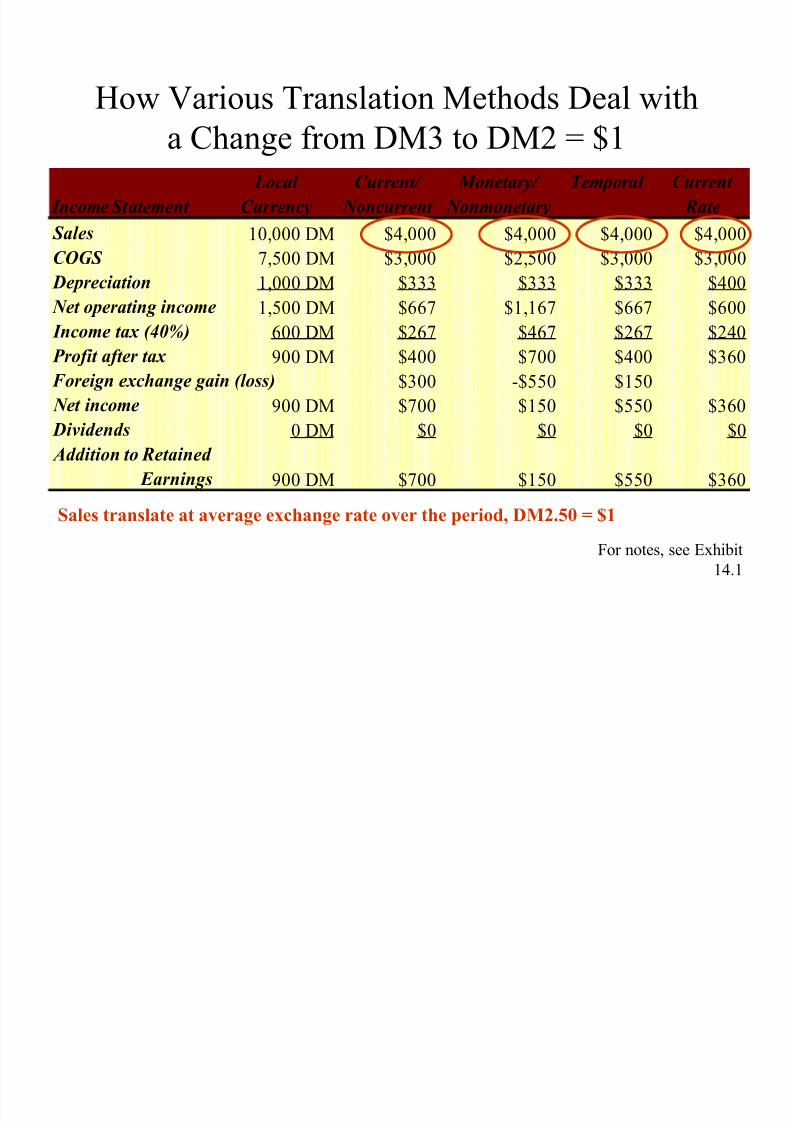
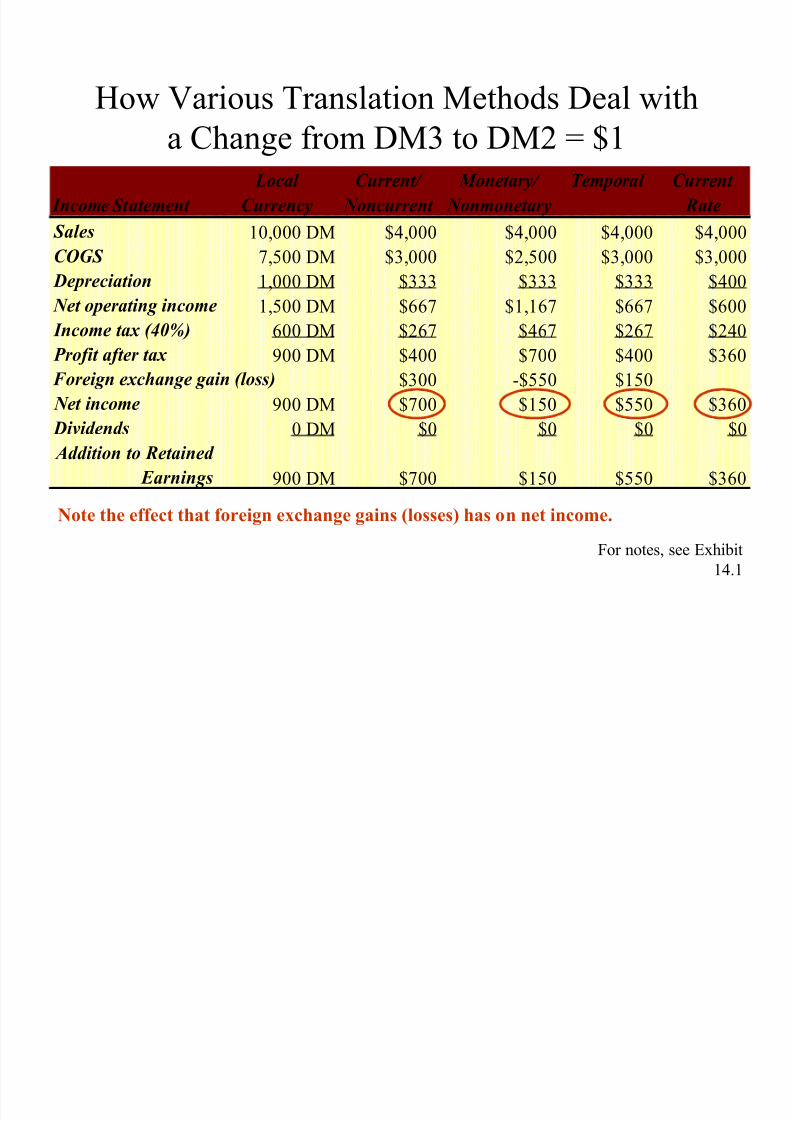
How Various Translation Methods Deal with
a Change from DM3 to DM2 = $1
For notes, see Exhibit14.1
Income Statement
Local
Currency
Current/
Noncurrent
Monetary/
Nonmonetary
Temporal Current
Rate
Sales 10,000 DM $4,000 $4,000 $4,000 $4,000
COGS 7,500 DM $3,000 $2,500 $3,000 $3,000
Depreciation 1,000 DM $333 $333 $333 $400 Net operating income 1,500 DM $667 $1,167 $667 $600
Income tax (40%) 600 DM $267 $467 $267 $240
Profit after tax 900 DM $400 $700 $400 $360
$300 -$550 $150
Net income 900 DM $700 $150 $550 $360
Dividends 0 DM $0 $0 $0 $0
Addition to Retained
Earnings 900 DM $700 $150 $550 $360
Foreign exchange gain (loss)
Sales translate at average exchange rate over the period, DM2.50 = $1
8/3/2019 Translation Exposure Power Point
http://slidepdf.com/reader/full/translation-exposure-power-point 19/29
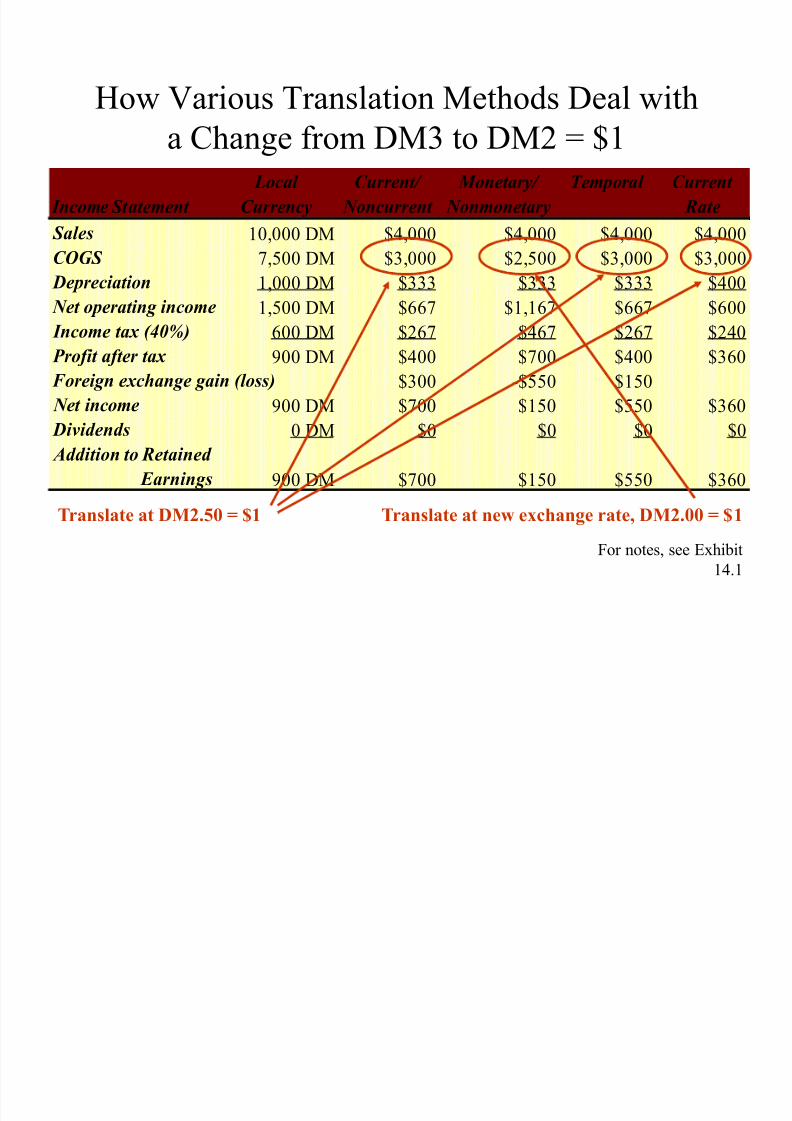
How Various Translation Methods Deal with
a Change from DM3 to DM2 = $1
For notes, see Exhibit14.1
Income Statement
Local
Currency
Current/
Noncurrent
Monetary/
Nonmonetary
Temporal Current
Rate
Sales 10,000 DM $4,000 $4,000 $4,000 $4,000
COGS 7,500 DM $3,000 $2,500 $3,000 $3,000
Depreciation 1,000 DM $333 $333 $333 $400 Net operating income 1,500 DM $667 $1,167 $667 $600
Income tax (40%) 600 DM $267 $467 $267 $240
Profit after tax 900 DM $400 $700 $400 $360
$300 -$550 $150
Net income 900 DM $700 $150 $550 $360
Dividends 0 DM $0 $0 $0 $0
Addition to Retained
Earnings 900 DM $700 $150 $550 $360
Foreign exchange gain (loss)
Translate at DM2.50 = $1 Translate at new exchange rate, DM2.00 = $1

8/3/2019 Translation Exposure Power Point
http://slidepdf.com/reader/full/translation-exposure-power-point 20/29
How Various Translation Methods Deal with
a Change from DM3 to DM2 = $1
For notes, see Exhibit14.1
Income Statement
Local
Currency
Current/
Noncurrent
Monetary/
Nonmonetary
Temporal Current
Rate
Sales 10,000 DM $4,000 $4,000 $4,000 $4,000
COGS 7,500 DM $3,000 $2,500 $3,000 $3,000
Depreciation 1,000 DM $333 $333 $333 $400 Net operating income 1,500 DM $667 $1,167 $667 $600
Income tax (40%) 600 DM $267 $467 $267 $240
Profit after tax 900 DM $400 $700 $400 $360
$300 -$550 $150
Net income 900 DM $700 $150 $550 $360
Dividends 0 DM $0 $0 $0 $0
Addition to Retained
Earnings 900 DM $700 $150 $550 $360
Foreign exchange gain (loss)
Translate at DM3 = $1 Translate at average exchange rate, DM2.5 = $1

8/3/2019 Translation Exposure Power Point
http://slidepdf.com/reader/full/translation-exposure-power-point 21/29
How Various Translation Methods Deal with
a Change from DM3 to DM2 = $1
For notes, see Exhibit14.1
Income Statement
Local
Currency
Current/
Noncurrent
Monetary/
Nonmonetary
Temporal Current
Rate
Sales 10,000 DM $4,000 $4,000 $4,000 $4,000
COGS 7,500 DM $3,000 $2,500 $3,000 $3,000
Depreciation 1,000 DM $333 $333 $333 $400 Net operating income 1,500 DM $667 $1,167 $667 $600
Income tax (40%) 600 DM $267 $467 $267 $240
Profit after tax 900 DM $400 $700 $400 $360
$300 -$550 $150
Net income 900 DM $700 $150 $550 $360
Dividends 0 DM $0 $0 $0 $0
Addition to Retained
Earnings 900 DM $700 $150 $550 $360
Foreign exchange gain (loss)
Note the effect on after-tax profit.
8/3/2019 Translation Exposure Power Point
http://slidepdf.com/reader/full/translation-exposure-power-point 22/29
How Various Translation Methods Deal with
a Change from DM3 to DM2 = $1
For notes, see Exhibit14.1
Income Statement
Local
Currency
Current/
Noncurrent
Monetary/
Nonmonetary
Temporal Current
Rate
Sales 10,000 DM $4,000 $4,000 $4,000 $4,000
COGS 7,500 DM $3,000 $2,500 $3,000 $3,000
Depreciation 1,000 DM $333 $333 $333 $400 Net operating income 1,500 DM $667 $1,167 $667 $600
Income tax (40%) 600 DM $267 $467 $267 $240
Profit after tax 900 DM $400 $700 $400 $360
$300 -$550 $150
Net income 900 DM $700 $150 $550 $360
Dividends 0 DM $0 $0 $0 $0
Addition to Retained
Earnings 900 DM $700 $150 $550 $360
Foreign exchange gain (loss)
Note the effect that foreign exchange gains (losses) has on net income.

8/3/2019 Translation Exposure Power Point
http://slidepdf.com/reader/full/translation-exposure-power-point 23/29
8/3/2019 Translation Exposure Power Point
http://slidepdf.com/reader/full/translation-exposure-power-point 24/29
FASB Statement 52
The Mechanics of the FASB 52 Translation
Process
± Functional Currency
± Reporting Currency

8/3/2019 Translation Exposure Power Point
http://slidepdf.com/reader/full/translation-exposure-power-point 25/29
The Mechanics of FASB
Statement 52 Functional Currency
± The currency that the business is conducted in.
Reporting Currency
± The currency in which the MNC prepares its
consolidated financial statements.

8/3/2019 Translation Exposure Power Point
http://slidepdf.com/reader/full/translation-exposure-power-point 26/29
The Mechanics of FASB
Statement 52 Two-Stage Process
± First, determine in which currency the foreign entity
keeps its books. ± If the local currency in which the foreign entity keeps
its books is not the functional currency, remeasurement
into the functional currency is required.
± Second, when the foreign entity¶s functional currencyis not the same as the parent¶s currency, the foreign
entity¶s books are translated using the current rate
method.

8/3/2019 Translation Exposure Power Point
http://slidepdf.com/reader/full/translation-exposure-power-point 27/29
Should Firms Hedge Translation Exposure?
No
The value of the firm is
the PV of cash flows Translation exposure
doesn¶t effect cash flows,
so ignore it
Yes
Investors don¶t have
enough information toestimate cash flows and
instead must rely on
reported earnings.
If reported earnings are
distorted by translationissues, investors will
misvalue the firm.

8/3/2019 Translation Exposure Power Point
http://slidepdf.com/reader/full/translation-exposure-power-point 28/29
H
edging Translation Exposure We will talk about hedging instruments in some detail in
the next two sections (dealing with operating andtransactions exposure). Much of what will be learned there
can be applied here. But the really essential question is whether managers
should worry about translation exposure. Remember, bydefinition, translation exposure doesn¶t describe what ishappening to cash flows, just how the firm is perceived.
Thus, one should ask whether managers ought to devotetime and money to hedging what amounts to cosmetics
8/3/2019 Translation Exposure Power Point
http://slidepdf.com/reader/full/translation-exposure-power-point 29/29
Final Word: Does Translation
Exposure Matter? Some research has been done investigating whether the
change from FASB 8 to FASB 52 made any difference tofirm value.
GFF (cited in your book) ³Despite the impact of thechange (from 8 to 52) on reported earnings, the actual cash flows of the multinationals would not be affected if managers were not making suboptimal decisions based onaccounting rather than economic considerations«In such
cases, the mandated switch «should not change the valueof the firm.´
Which is what was found.