Embed Size (px)
Citation preview

Translate information to and from a line graph While at this station you will get some more practice with all the parts involved with making a good graph. In order to help you better understand making graphs there are 5 different activities listed below. Please be sure to do all five activities. When you finish an activity, be sure to check it against the answer key provided. 1. Put the steps in order Read the steps listed on the notecards and place them in the proper order for making a graph. Be sure to include all the notecards, check your work, and record the proper order in the space below. 1. 2. 3. 4. 5. 6. 7. 8. 2. Identify a good scale Look at the three graphs provided and determine which uses the best scale to show the trends in the data. Be sure to explain both why you picked the best one and what is wrong with both of the others. Graph A- Graph B- Graph C- 3. Determine a good scale Based on the data in the table provided determine what a good scale for a 25 by 25 square piece of graph paper would be. In the space below, be sure to explain which data would go on which axis as well as to show how you figured your scale. 4. Write a title Use the information on the data table from #3 provided to write a good title in the space below explaining what the data table shows.

5. Make a graph Use the data in the table provided in # 3 to make a graph on the graph area provided below. Be sure to follow the steps you laid out above to include all the appropriate parts of your graph.

2. Identify a good scale A.
B.
0
1
2
3
4
5
0 10 20 30 40 50 60 70
Th
ick
ne
ss o
f ri
ng
s (c
m)
Tree Age (yrs)
Tree ring thickness based on age of tree
0
2
4
6
8
10
0 10 20 30 40 50 60 70
Th
ick
ne
ss o
f ri
ng
s (c
m)
Tree Age (yrs)
Tree ring thickness based on age of tree

C.
1.5
2
2.5
3
3.5
4
4.5
0 10 20 30 40 50 60 70
Th
ick
ne
ss o
f ri
ng
s (c
m)
Tree Age (yrs)
Tree ring thickness based on age of tree

3. Determine a good scale, Write a title, and Make a graph
Temperature of gas ( ºC )
Volume of gas( ml )
100 317
80 297
60 288
40 278
30 252
20 243
10 236
0 233

2. Identify a good scale A.
B.
0
0.5
1
1.5
2
2.5
3
3.5
4
0
2
4
6
8
10
12
14
16
0 10 20 30 40
Dia
me
ter
(in
)
Da
ys
to m
atu
rity
Amount of ethylene (ml/m2)
Maturity rate and size of apples based on ethylene exposure
Days to maturity
Diameter (in)
0
2
4
6
8
10
7
8
9
10
11
12
13
14
15
0 10 20 30 40
Dia
me
ter
(in
)
Da
ys
to m
atu
rity
Amount of ethylene (ml/m2)
Maturity rate and size of apples based on ethylene exposure
Days to maturity
Diameter (in)
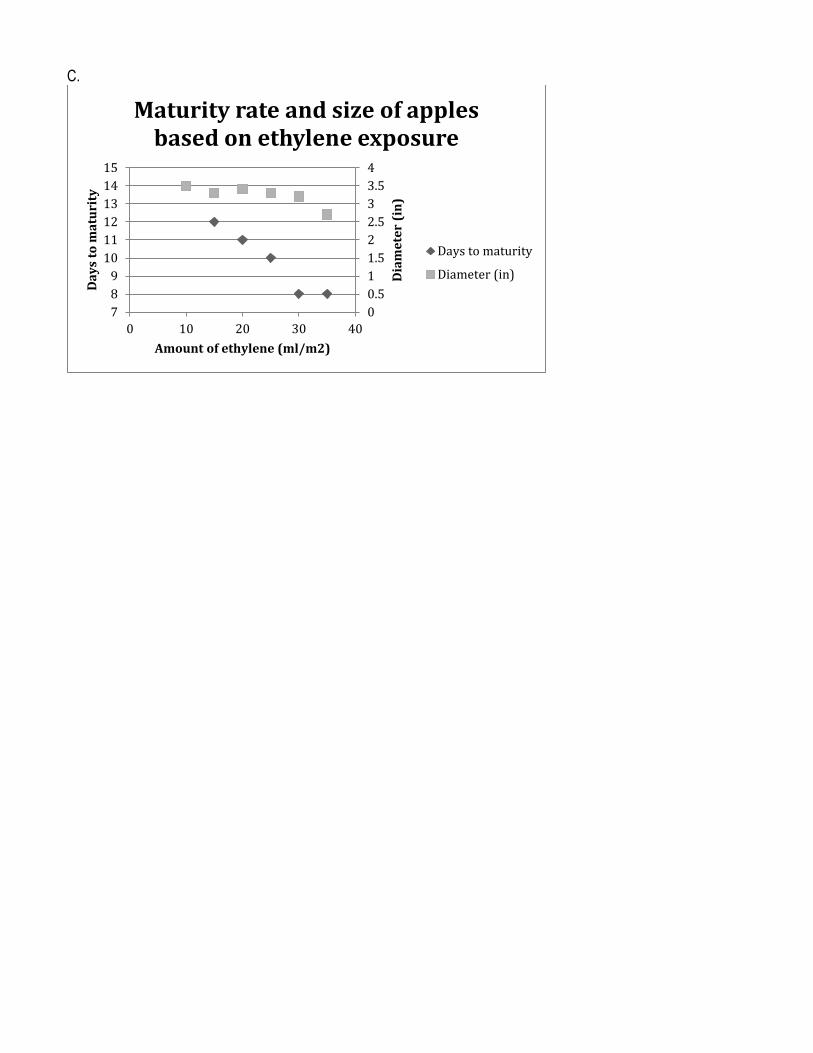
C.
0
0.5
1
1.5
2
2.5
3
3.5
4
7
8
9
10
11
12
13
14
15
0 10 20 30 40
Dia
me
ter
(in
)
Da
ys
to m
atu
rity
Amount of ethylene (ml/m2)
Maturity rate and size of apples based on ethylene exposure
Days to maturity
Diameter (in)

3. Determine a good scale, Write a title, and Make a graph
Test Tube # Amount of MnO2 (g)
1 min (ml O2 produced)
2 min (ml O2
produced) 3 min (ml O2
produced) 4 min (ml O2
produced) 5 min (ml O2
produced)
1 0.1 1.4 2.6 3.5 4.2 5.1
2 0.2 2.8 4.6 5.8 7.1 7.6
3 0.3 4.9 7.2 8.8 10.2 11.3
4 0.5 5.9 8.5 10.4 11.8 13.3
5 1.0 8.5 12.4 14.4 16.1 17.1
6 1.5 11.0 14.8 17.5 19.8 21.8
7 2.0 12.0 17.0 20.2 22.7 24.8
8 2.5 13.6 19.0 22.1 24.7 27.3
9 3.0 16.2 21.8 25.1 28.2 30.4

Identify IV and DVs in in a variety of experiments
While at this station you will get some more practice with dependent and independent variables. In order to help you better understand variables there are 5 different activities listed below. Please be sure to do all five activities. When you finish an activity, be sure to check it against the answer key provided. 1. Compare and Contrast DV and IV Use the Venn diagram below to compare and contrast dependent and independent variables.
2. Choosing DV and IV – Write Ups Look at the scenarios provided to determine the dependent and independent variables in each situation. Record your answers as well as why you choose each answer in the space below.
A. IV = DV=
B. IV= DV=
C. IV= DV=

3. Choosing DV and IV – Graphs Look at the graphs provided to determine the dependent and independent variables in each situation. Record your answers as well as why you choose each answer in the space below.
A. IV = DV=
B. IV= DV=
C. IV= DV=
4. Choosing DV and IV – Data Tables Look at the scenarios provided to determine the dependent and independent variables in each situation. Record your answers as well as why you choose each answer in the space below.
A. IV = DV=
B. IV= DV=
C. IV= DV=
5. Given DV and IV determine experiment Look at the scenarios provided to determine what a scientist is studying in each situation. Record your answers in the space below.
A. B. C.

2. Choosing DV and IV – Write Ups
A. Scenario #1 Dr. Imanut wants to examine whether a new drug increases the maze running performance of older rats. Just like aging humans, older rats show signs of poorer memory for new things. Dr. Imanut teaches two groups of older rats to find a piece of tasty rat chow in the maze. One group of rats is given the new drug while they are learning the maze. The second group is not given the drug. One week after having learned the maze he retests the rats and records how long it takes them to find the rat chow.
B. Scenario #2 A researcher wanted to study the effects of sleep deprivation on physical coordination. The researcher selected 25 year-old male college students and deprived some of the subjects to either 24, 36, or 45 hours of sleep.
C. Scenario #3 An investigator had 60 subjects watch a videotaped re-enactment of a bank robbery. Half of the subjects were asked by a police investigator to recall the event, while the remaining subjects were interviewed by a police investigator while they were hypnotized.
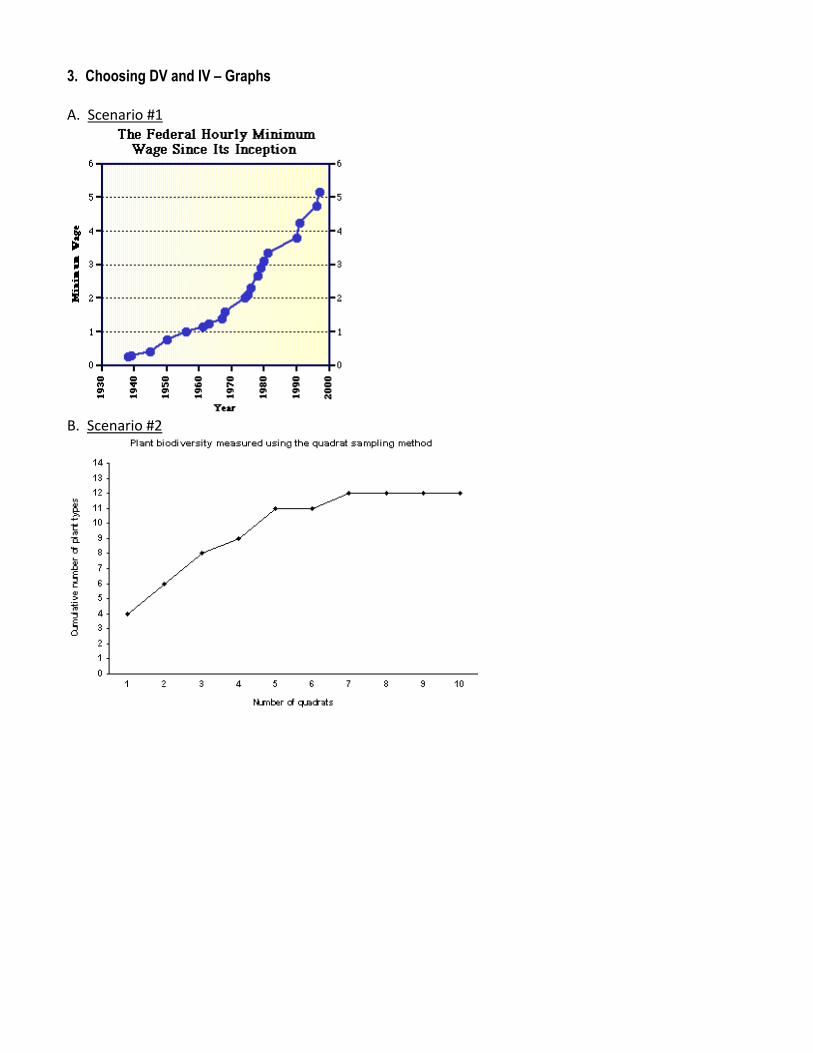
3. Choosing DV and IV – Graphs
A. Scenario #1
B. Scenario #2

C. Scenario #3

4. Choosing DV and IV – Data Tables
A. Scenario #1
Atomic Number
1st Ionization Energy (volts)
1 13.53
2 24.46
3 5.64
4 9.28
5 8.26
6 11.22
7 14.48
8 13.55
9 17.34
10 21.47
11 5.12
12 7.61
13 5.96
14 8.12
B. Senario #2
Temperature of gas ( ºC )
Volume of gas( ml )
100 317
80 297
60 288
40 278
30 252
20 243
10 236
0 233
-10 227
-30 202
C. Scenario #3
Age of the tree (years)
Average thickness of the annual rings (cm)
Forest A Forest B
10 2.0 2.2
20 2.2 2.5
30 3.5 3.6
35 3.0 3.8
50 4.5 4.0
60 4.3 4.5

5. Given DV and IV determine experiment A. Scenario #1 IV = bird seed type DV = squirrel sightings B. Scenario #2 IV = game score DV = mood Saturday morning C. Scenario #3 IV = jolly ranchers DV = assignment completion

2. Choosing DV and IV – Write Ups
A. Scenario #1 Dr. Imanut wants to examine whether a new drug increases the maze running performance of older rats. Just like aging humans, older rats show signs of poorer memory for new things. Dr. Imanut teaches two groups of older rats to find a piece of tasty rat chow in the maze. One group of rats is given the new drug while they are learning the maze. The second group is not given the drug. One week after having learned the maze he retests the rats and records how long it takes them to find the rat chow.
B. Scenario #2 A researcher wanted to study the effects of sleep deprivation on physical coordination. The researcher selected 25 year-old male college students and deprived some of the subjects to either 24, 36, or 45 hours of sleep.
C. Scenario #3 A researcher wanted to know whether the number of people present would influence subjects' judgments on a simple perceptual task. In each case the other members of the group gave an incorrect answer. The researcher then noted whether the subject conformed to the group decision.

3. Choosing DV and IV – Graphs
A. Scenario #1
B. Scenario #2

C. Scenario #3

4. Choosing DV and IV – Data Tables
A. Scenario #1
Age of the tree (years)
Average thickness of the annual rings (cm)
Forest A Forest B
10 2.0 2.2
20 2.2 2.5
30 3.5 3.6
35 3.0 3.8
50 4.5 4.0
60 4.3 4.5
B. Senario #2
Amount of ethylene (ml/m2)
Days to Maturity
Wine sap Apples: Golden Apples: Gala Apples:
10 14 14 15
15 12 12 13
20 11 9 10
25 10 7 9
30 8 7 8
35 8 7 7
C. Scenario #3
Test Tube # Amount of MnO2 (g)
1 min (ml O2 produced)
2 min (ml O2
produced) 3 min (ml O2
produced) 4 min (ml O2
produced) 5 min (ml O2
produced)
1 0.1 1.4 2.6 3.5 4.2 5.1
2 0.2 2.8 4.6 5.8 7.1 7.6
3 0.3 4.9 7.2 8.8 10.2 11.3
4 0.5 5.9 8.5 10.4 11.8 13.3
5 1.0 8.5 12.4 14.4 16.1 17.1
6 1.5 11.0 14.8 17.5 19.8 21.8
7 2.0 12.0 17.0 20.2 22.7 24.8
8 2.5 13.6 19.0 22.1 24.7 27.3
9 3.0 16.2 21.8 25.1 28.2 30.4

5. Given DV and IV determine experiment A. Scenario #1 IV = bird seed type DV = squirrel sightings B. Scenario #2 IV = game score DV = mood Saturday morning C. Scenario #3 IV = candy type DV = assignment completion